Patterns of Arctic Tundra Greenness Based on Spatially Downscaled Solar-Induced Fluorescence


1
State Key Laboratory of Resources and Environmental Information System, Institute of Geographic Sciences and Natural Resources Research, Chinese Academy of Sciences, Beijing 100101, China
2
Urban Science Department, College of Applied Arts and Science of Beijing Union University, Beijing 100191, China
*
Author to whom correspondence should be addressed.
Remote Sens. 2019, 11(12), 1460; https://0-doi-org.brum.beds.ac.uk/10.3390/rs11121460
Submission received: 6 May 2019
/
Revised: 14 June 2019
/
Accepted: 18 June 2019
/
Published: 20 June 2019
(This article belongs to the Section Remote Sensing in Agriculture and Vegetation)
Abstract
:A general greening trend in the Arctic tundra biome has been indicated by satellite remote sensing data over recent decades. However, since 2011, there have been signs of browning trends in many parts of the region. Previous research on tundra greenness across the Arctic region has relied on the satellite-derived normalized difference vegetation index (NDVI). In this research, we initially used spatially downscaled solar-induced fluorescence (SIF) data to analyze the spatiotemporal variation of Arctic tundra greenness (2007–2013). The results derived from the SIF data were also compared with those from two NDVIs (the Global Inventory Modeling and Mapping Studies NDVI3g and MOD13Q1 NDVI), and the eddy-covariance (EC) observed gross primary production (GPP). It was found that most parts of the Arctic tundra below 75° N were browning (–0.0098 mW/m2/sr/nm/year, where sr is steradian and nm is nanometer) using SIF, whereas spatially and temporally heterogeneous trends (greening or browning) were obtained based on the two NDVI products. This research has further demonstrated that SIF data can provide an alternative direct proxy for Arctic tundra greenness.
1. Introduction
Since the early 1980s, increased vegetation productivity or greening of Arctic tundra has been deduced from the trend of using the satellite-derived normalized difference vegetation index (NDVI) [1,2,3,4]. For example, Myneni, et al. [3] found the seasonal amplitude of the NDVI increased by 8% from 1982–1990 at 65° N and higher latitudes. Arctic tundra greening was also observed or simulated at the circumpolar Arctic region [5,6,7,8], Eurasian Arctic [9,10,11], Alaska [2,12,13], and Canada [14]. It is speculated that a positive NDVI trend may be in response to climate warming or reduced snow cover, which would lead to the expansion of vegetation in the tundra [15,16,17,18,19], changing phenological periods [20,21], increased biomass [22,23], and surface water variation associated with thermokarst [24]. Since 2011, regional surface browning trends have been observed that have reversed the direction of the Arctic greening trend after nearly 33 years [4,5,25,26]. If such a change in the greenness trend corresponds to the decline in carbon uptake capacity or vegetation productivity via photosynthesis, then most ecosystem models have not considered this shift [26]. Therefore, it is important to understand which parts of the Arctic region are most sensitive and show the greatest browning [4].
Until now, the circumpolar pattern of greening is derived from satellite-based NDVIs, such as the Advanced Very High Resolution Radiometer (AVHRR), Moderate Resolution Imaging Spectroradiometer (MODIS), Satellite Pour l’Observation de la Terre VEGETATION (SPOT-VGT), Sea-viewing Wide Field-of-view Sensor (SeaWiFS) and Landsat [2,3,5,26,27]. However, the data products generated by these platforms are limited to a coarser spectral resolution that may affect a better understanding of greening and browning trends. To date, no published studies have examined the spatiotemporal pattern of the circumpolar Arctic tundra greenness trend using satellite data with a finer spectral resolution (such as passive solar-induced chlorophyll fluorescence (SIF)).
Compared to the NDVI, which is related to the fraction of photosynthetically active radiation (fAPAR), SIF is a more direct proxy for photosynthesis and can be obtained from satellite-based observations [28,29]. Although the NDVI has been shown to be related to photosynthesis [30], there are intrinsic limitations in the effectiveness of the NDVI due to the difference between potential and actual photosynthesis [31]. SIF is emitted with light absorption from the chlorophyll complex during photosynthesis under natural sunlight [32,33], shares the same origin with non-photochemical quenching (NPQ) and photochemical quenching (PQ) [34], is intimately related to carbon assimilation, and has been considered as a direct indicator of photosynthesis [35,36]. The NDVI is related to potential photosynthesis and SIF is related to actual photosynthesis [31]. To improve the spatial resolution of SIF data, Duveiller and Cescatti [37] developed a method to spatially disaggregate the information of each coarse SIF pixel, and spatially downscaled SIF data were obtained with a higher spatial resolution (0.05 degree, approximately 5 km). Spatially downscaled SIF data can be considered as a proxy for gross primary production (GPP) [37]. The NDVI has a robust relationship with the vegetation productivity of the circumpolar Arctic tundra [26,38]. Here, we suppose that greenness can be indicated by the NDVI and SIF data, respectively.
This research aims to investigate and analyze the spatiotemporal patterns of Arctic tundra greenness (2007–2013) using spatially downscaled SIF data in conjunction with two NDVI products. The eddy-covariance (EC) flux measurements (GPP) were used for the greenness trend comparison.
2. Data and Methods
2.1. Study Area
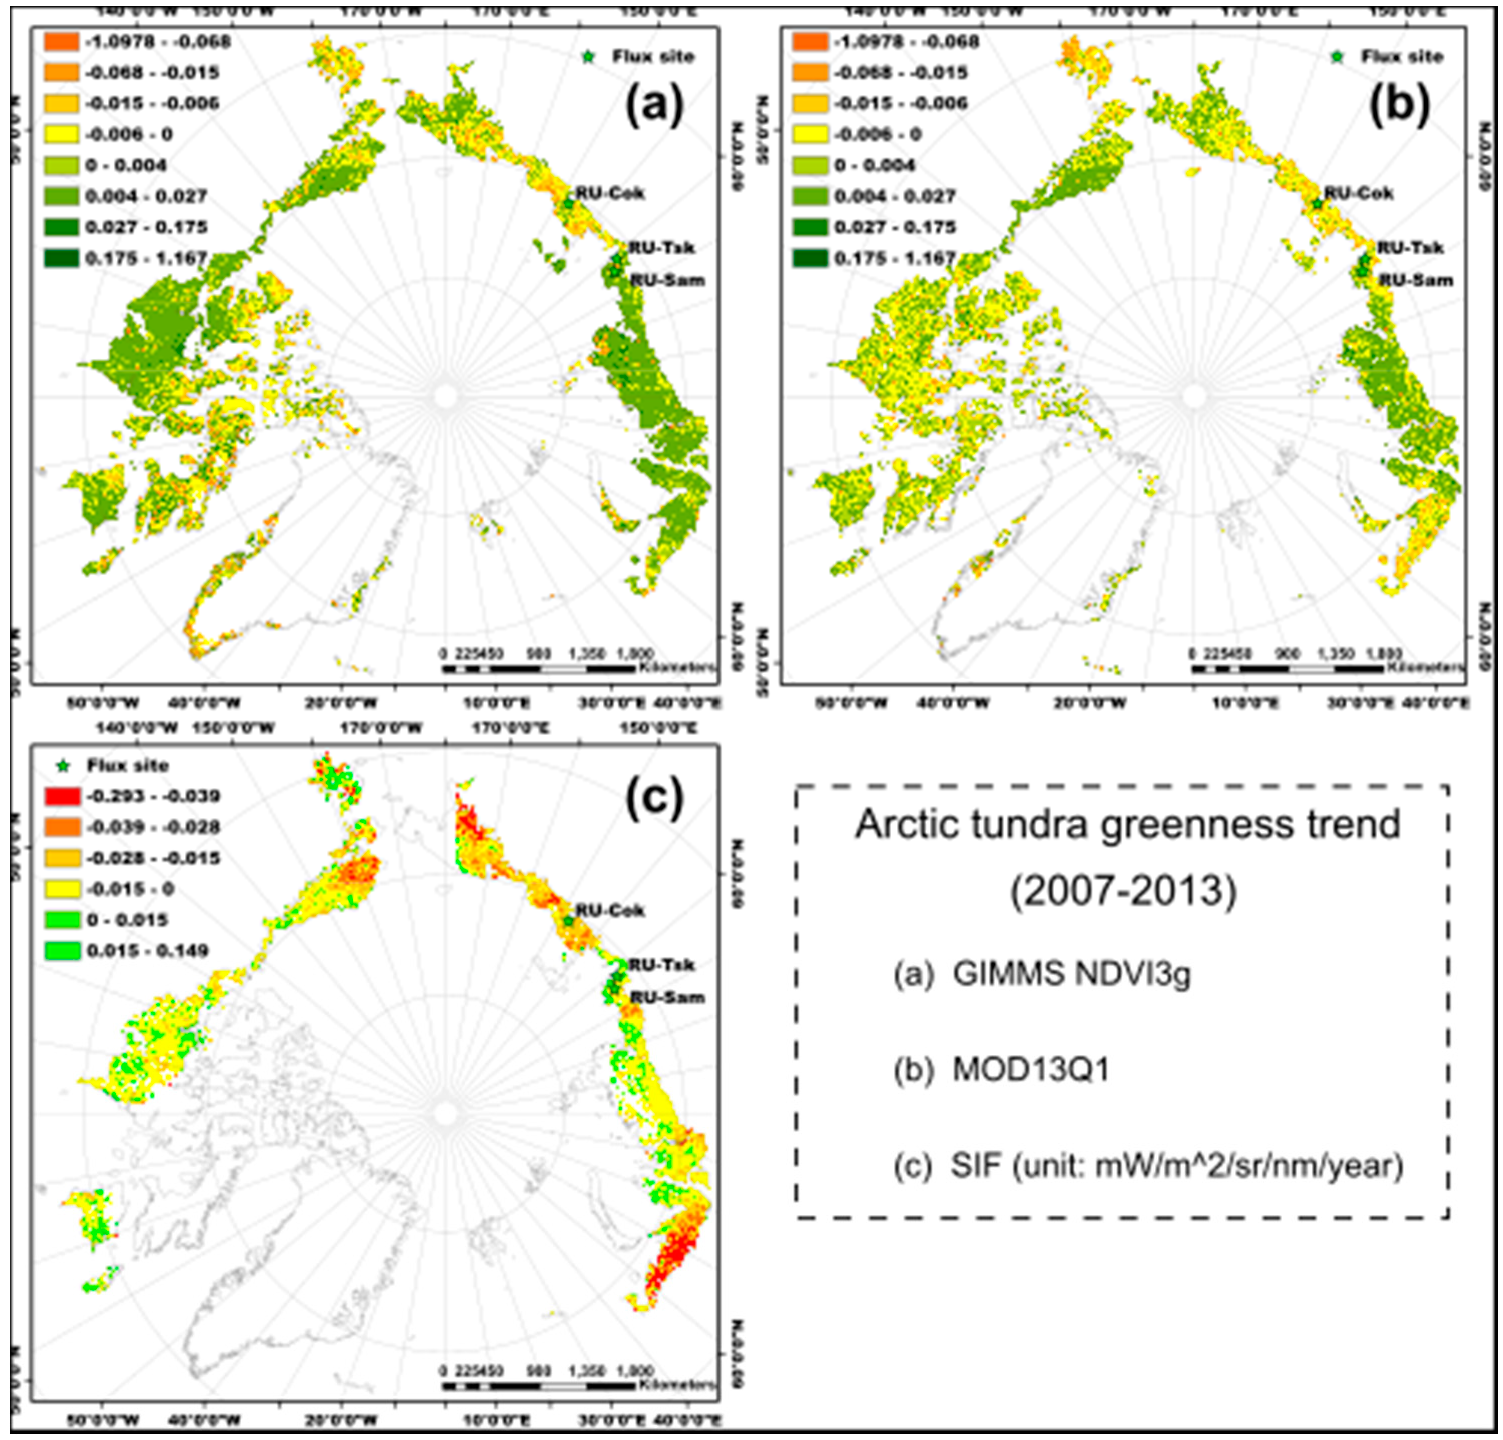
The study area (Figure 1) covers the tundra region as defined by the Circumpolar Arctic Vegetation Map (CAVM) [39]. Within the spatial extent of the CAVM, the vegetated area (86%) contains erect shrublands (26%), graminoid tundras (18%), mineral graminoid tundras (11%), prostrate-shrub tundras (11%), mountain complexes (13%), and wetlands (7%). The Low Arctic, predominantly low-shrub tundra, is mainly located in Russia, whereas abundant barren types and prostrate dwarf-shrub tundra are located in the High Arctic, Canada [39].
2.2. Data
Three satellite-based datasets (2007–2013) were used in this research, including satellite-derived NDVIs (Global Inventory Modeling and Mapping Studies (GIMMS) NDVI3g and MODIS NDVI) and SIF data (Table 1). In addition, the eddy-covariance (EC) flux measurements (GPP) during 2007–2013 were used for the greenness trend comparison. The NDVI was calculated as (NIR − R)/(NIR + R), where NIR is the surface reflectance in the near-infrared band (GIMMS NDVI3g: 730–1000 nm, MODIS NDVI: 841–876 nm) and R is the surface reflectance in the red band (GIMMS NDVI3g: 550–700 nm, MODIS NDVI: 620–670 nm) [40].
2.2.1. NDVI Data
As for the NDVI data, the GIMMS NDVI3g (8 km, bi-weekly, 3rd Generation) was used with preprocessing for the specific requirements of the Arctic region affected by snow and cloud cover. Pixels flagged as snow or cloud cover were excluded from the analysis. The annual maximum NDVI values were obtained from the bi-weekly data [41]. The MODIS NDVI values for the study area were obtained from the MOD13Q1 (250 m, 16-day, Collection 6) NDVI layer. Only the pixels flagged as “good data” in the Summary Quality Assurance (QA) layer were used for the study. The annual maximum NDVI values of MOD13Q1 were derived from the 16-day NDVI layer.
2.2.2. SIF Data
As for the SIF data, the spatially downscaled GOME-2 SIF (denoted as SIF for the study) at 740 nm (spatial resolution: 0.05 degree, approximately 5 km; temporal resolution: monthly; unit: mW/m2/sr/nm, where sr is steradian, and nm is nanometer) [37], was derived from an original SIF product (version 25), as provided by Joiner et al. [42]. The original SIF product can be obtained from the Aura Validation Data Center (AVDC), Goddard Space Flight Center (GSFC), and can be downloaded at http://avdc.gsfc.nasa.gov/pub/data/satellite/MetOp/GOME_F/. The spatially downscaled SIF can be obtained from Duveiller and Cescatti [37]. The highest latitude of the spatially downscaled SIF just reaches to 75° N, so no vegetation information higher than 75° N is included in the study. The spatially downscaled SIF was calculated via a non-linear model based on the concept of light-use efficiency (LUE). The information contained in the original coarse GOME-2 SIF pixels (spatial resolution: 0.5 degree) is spatially disaggregated. At each time step, the remote sensing biophysical variables (MODIS NDVI, land surface temperature, and evapotranspiration) were aggregated to calibrate the downscaling model both independently and locally. Then, the downscaling model was applied to create a new layer with non-aggregated data (spatial resolution: 0.05 degree, approximately 5 km). More details related to spatially downscaled SIF can be found in Duveiller and Cescatti [37].
We used the annual maximum values of the NDVIs and SIF as the proxies of tundra greenness for the study. In this research, the annual maximum values of the GIMMS NDVI3g, MOD13Q1, and SIF were denoted as NDVImax_g, NDVImax_m, and SIFmax, respectively.
2.2.3. Flux Data
The EC flux measurements within the study area were obtained from the FLUXNET2015 Dataset (http://fluxnet.fluxdata.org/data/fluxnet2015-dataset/) (Table 2). There are 11 flux sites within the study area, and the available flux data (duration > 3 years) were very limited during 2007–2013, only three sites (RU-Sam, RU-Tks, RU-Cok) covering this period had intersected with the SIF data. The monthly flux parameter GPP_NT_VUT_MEAN was chosen for the study, where NT means nighttime, VUT means variable ustar (friction velocity) threshold, and MEAN means the average GPP value. The maximum value of monthly EC-observed GPP was used for the comparison.
All data were gathered for the same period of 2007–2013 with an annual temporal resolution. Any missing data were not taken into account.
2.3. Trend Analysis
For the spatial pattern of Arctic tundra greenness, the annual trends (2007–2013) of the NDVIs and SIF were calculated by least square regression using the Google Earth Engine platform [46]. The trends were checked using the annual maximum values of the NDVIs and SIF, not just within the growing season. This not only avoided a lack of temporal information, but also made more biological sense for the relationship between greenness and vegetation growth [47]. The slope coefficient obtained from the regression line was used to describe the greenness trend.
For the temporal pattern of Arctic tundra greenness, the study area (CAVM) was divided into two sub-regions including North America and Eurasia. The annual greenness of each region (Arctic, North America, and Eurasia) was calculated as the averaged values of the NDVIs and SIF using whole year data.
We supposed that the tundra was greening if the trend of the annual maximum values of the NDVIs or SIF was positive, and tundra was browning with a negative trend from 2007 to 2013. The trend was validated using EC flux measurements (maximum monthly GPP for each year) within the study area. A two-sided t-test was used to determine the statistical significance of the GPP, NDVIs, and SIF. A p-value < 0.05 was assumed to be significant. Compared to NDVI data, no data existed higher than 75° N for SIF.
3. Results
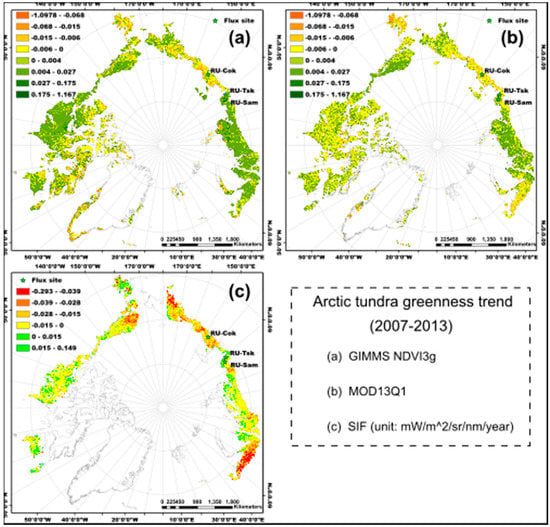
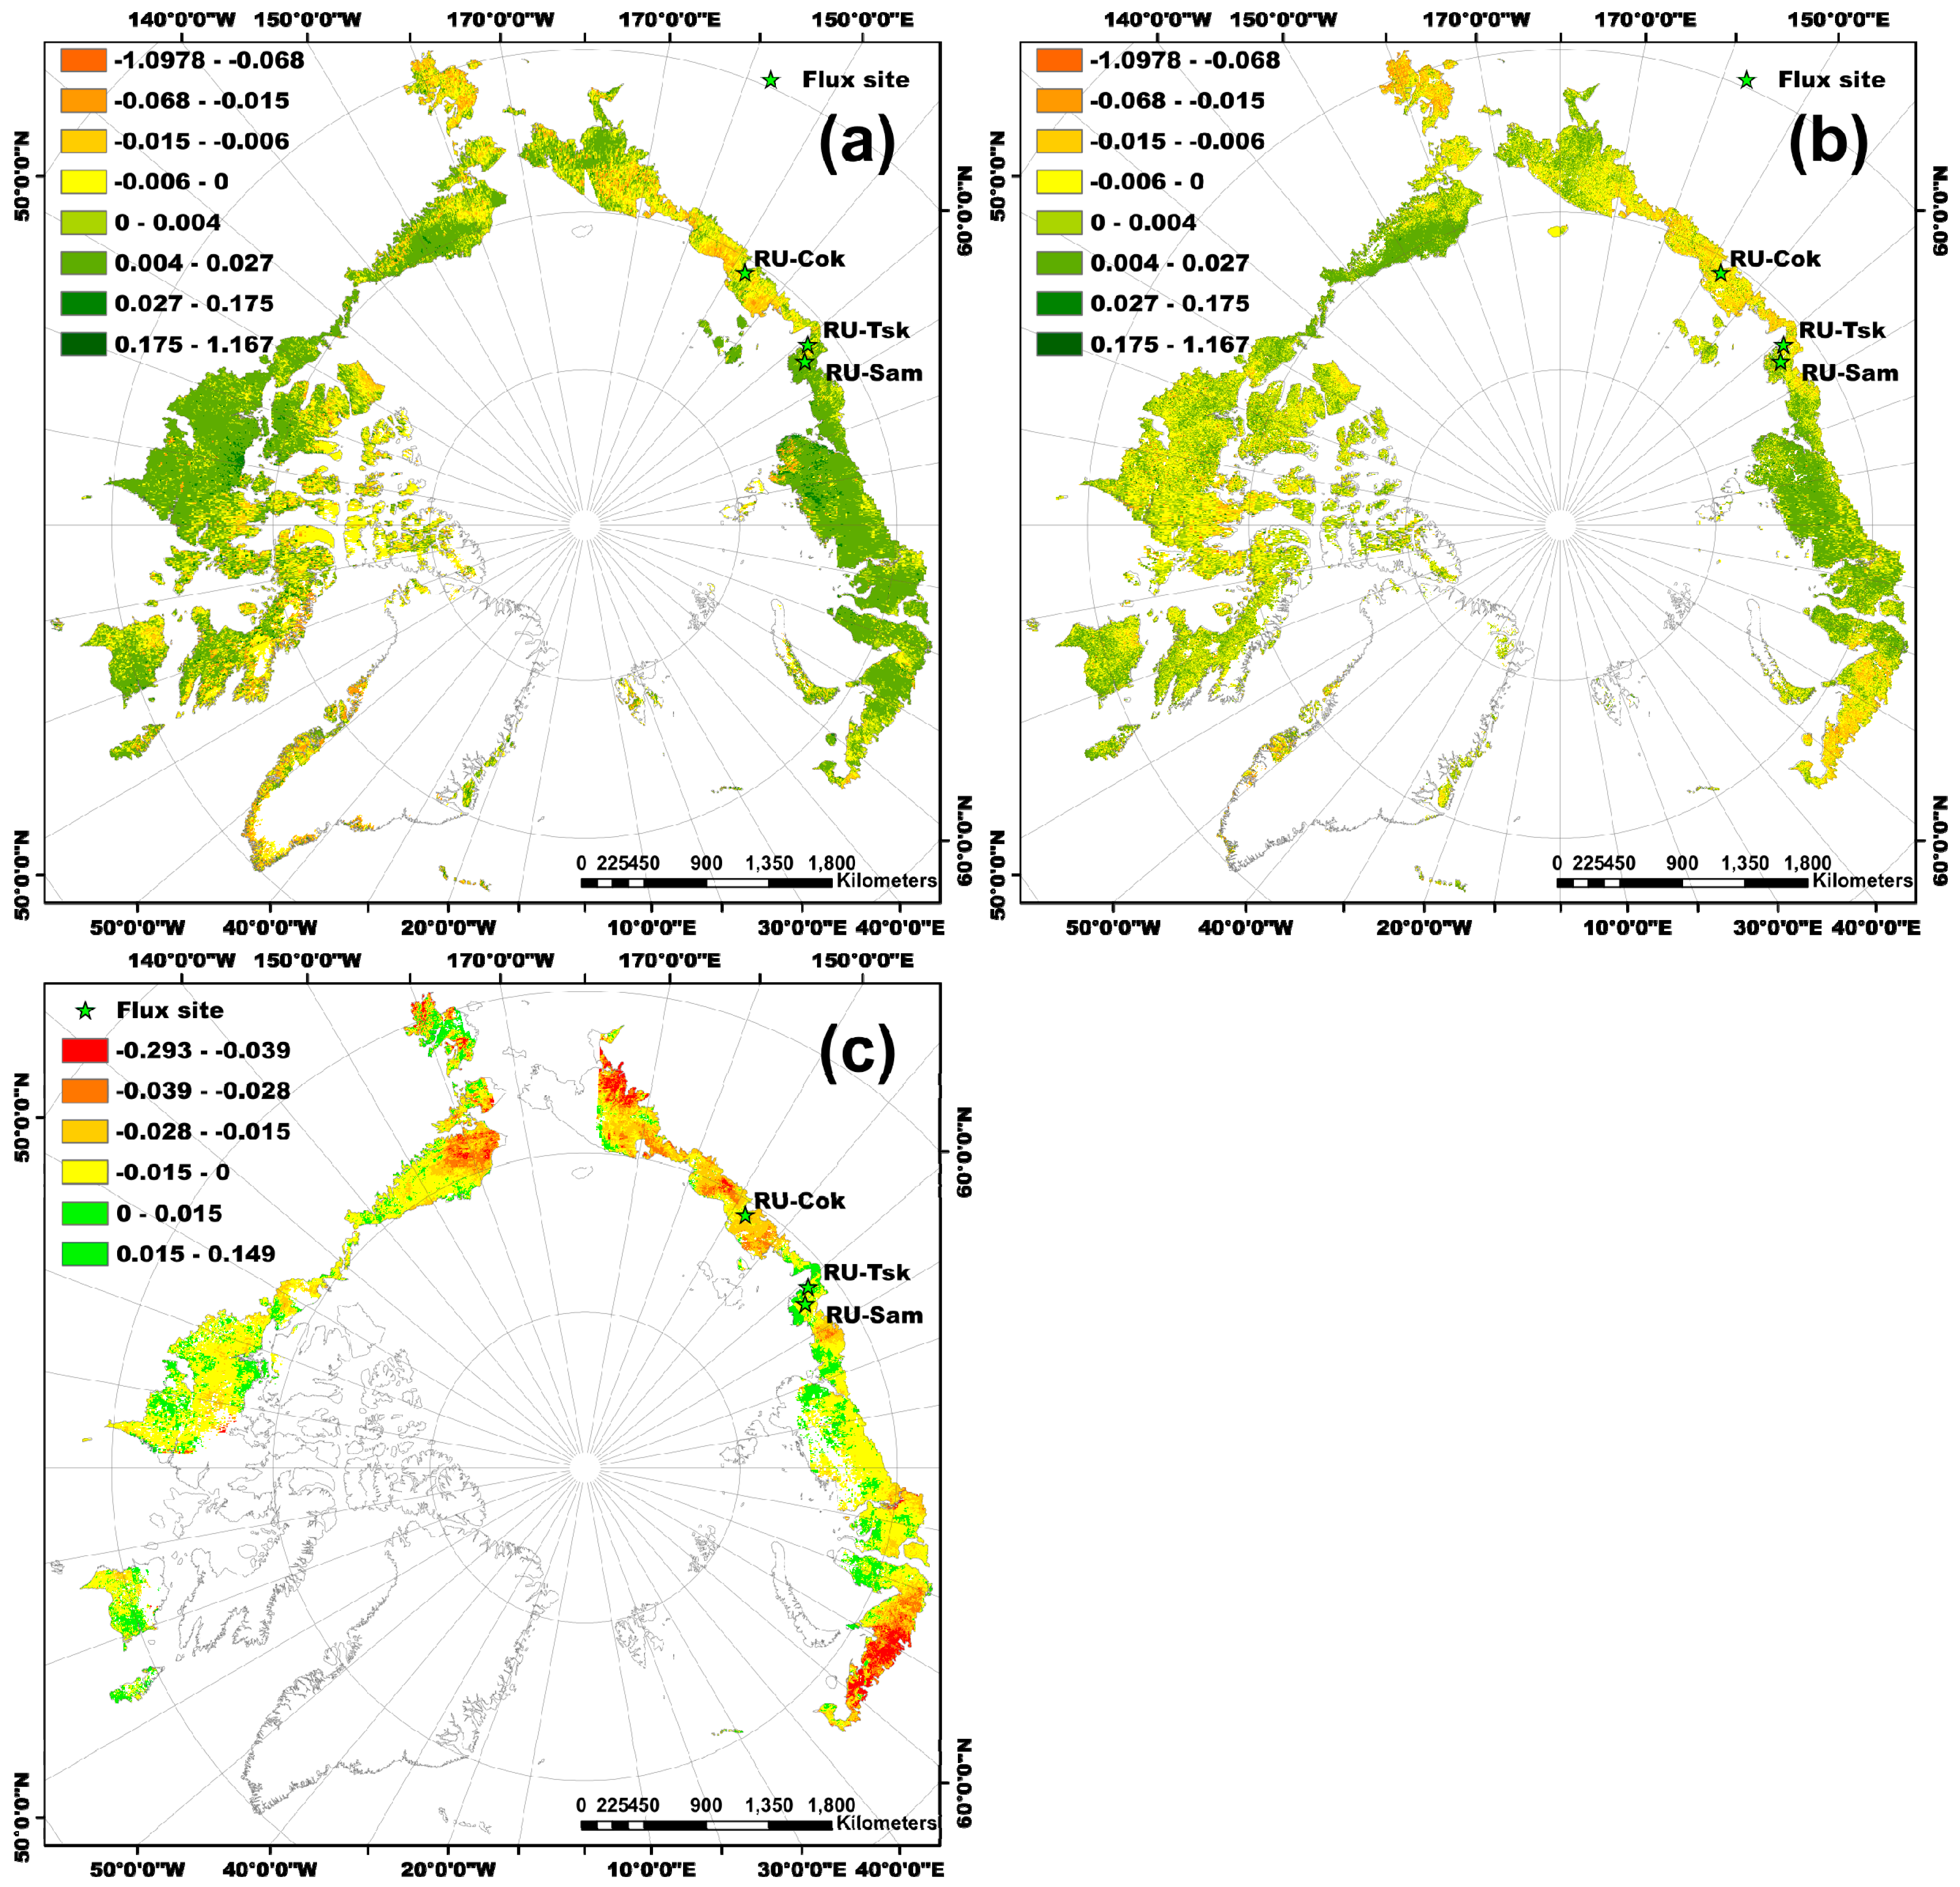
For the overall trend in Arctic tundra greenness from 2007 to 2013, the spatial patterns of the annual maximum NDVI trend for the GIMMS NDVI3g and MOD13Q1 were similar for almost all parts of the study area (Figure 2a,b). The tundra was greening in the North Slope of Alaska and most parts of central Siberia, and browning in the High-Arctic Canadian Archipelago, western Alaska (Yukon-Kuskokwim Delta), and eastern Siberia (high latitude area of Kolyma Lowland and Yana-Indigirka Lowland) according to the trends of NDVImax_g and NDVImax_m (Figure 2a,b). The spatial pattern of the SIFmax trend was very different from NDVImax_g and NDVImax_m. Most parts of the Arctic tundra region below 75° N showed browning trends (Figure 2c) according to the trend of SIFmax from 2007 to 2013. The magnitude of browning was higher in northwest Alaska, western Russia, and eastern and central Siberia than in other study regions. However, the vegetation showed greening for some regions, such as western Alaska, south of the High-Arctic Canadian Archipelago, and the Yamal peninsula of Russia.
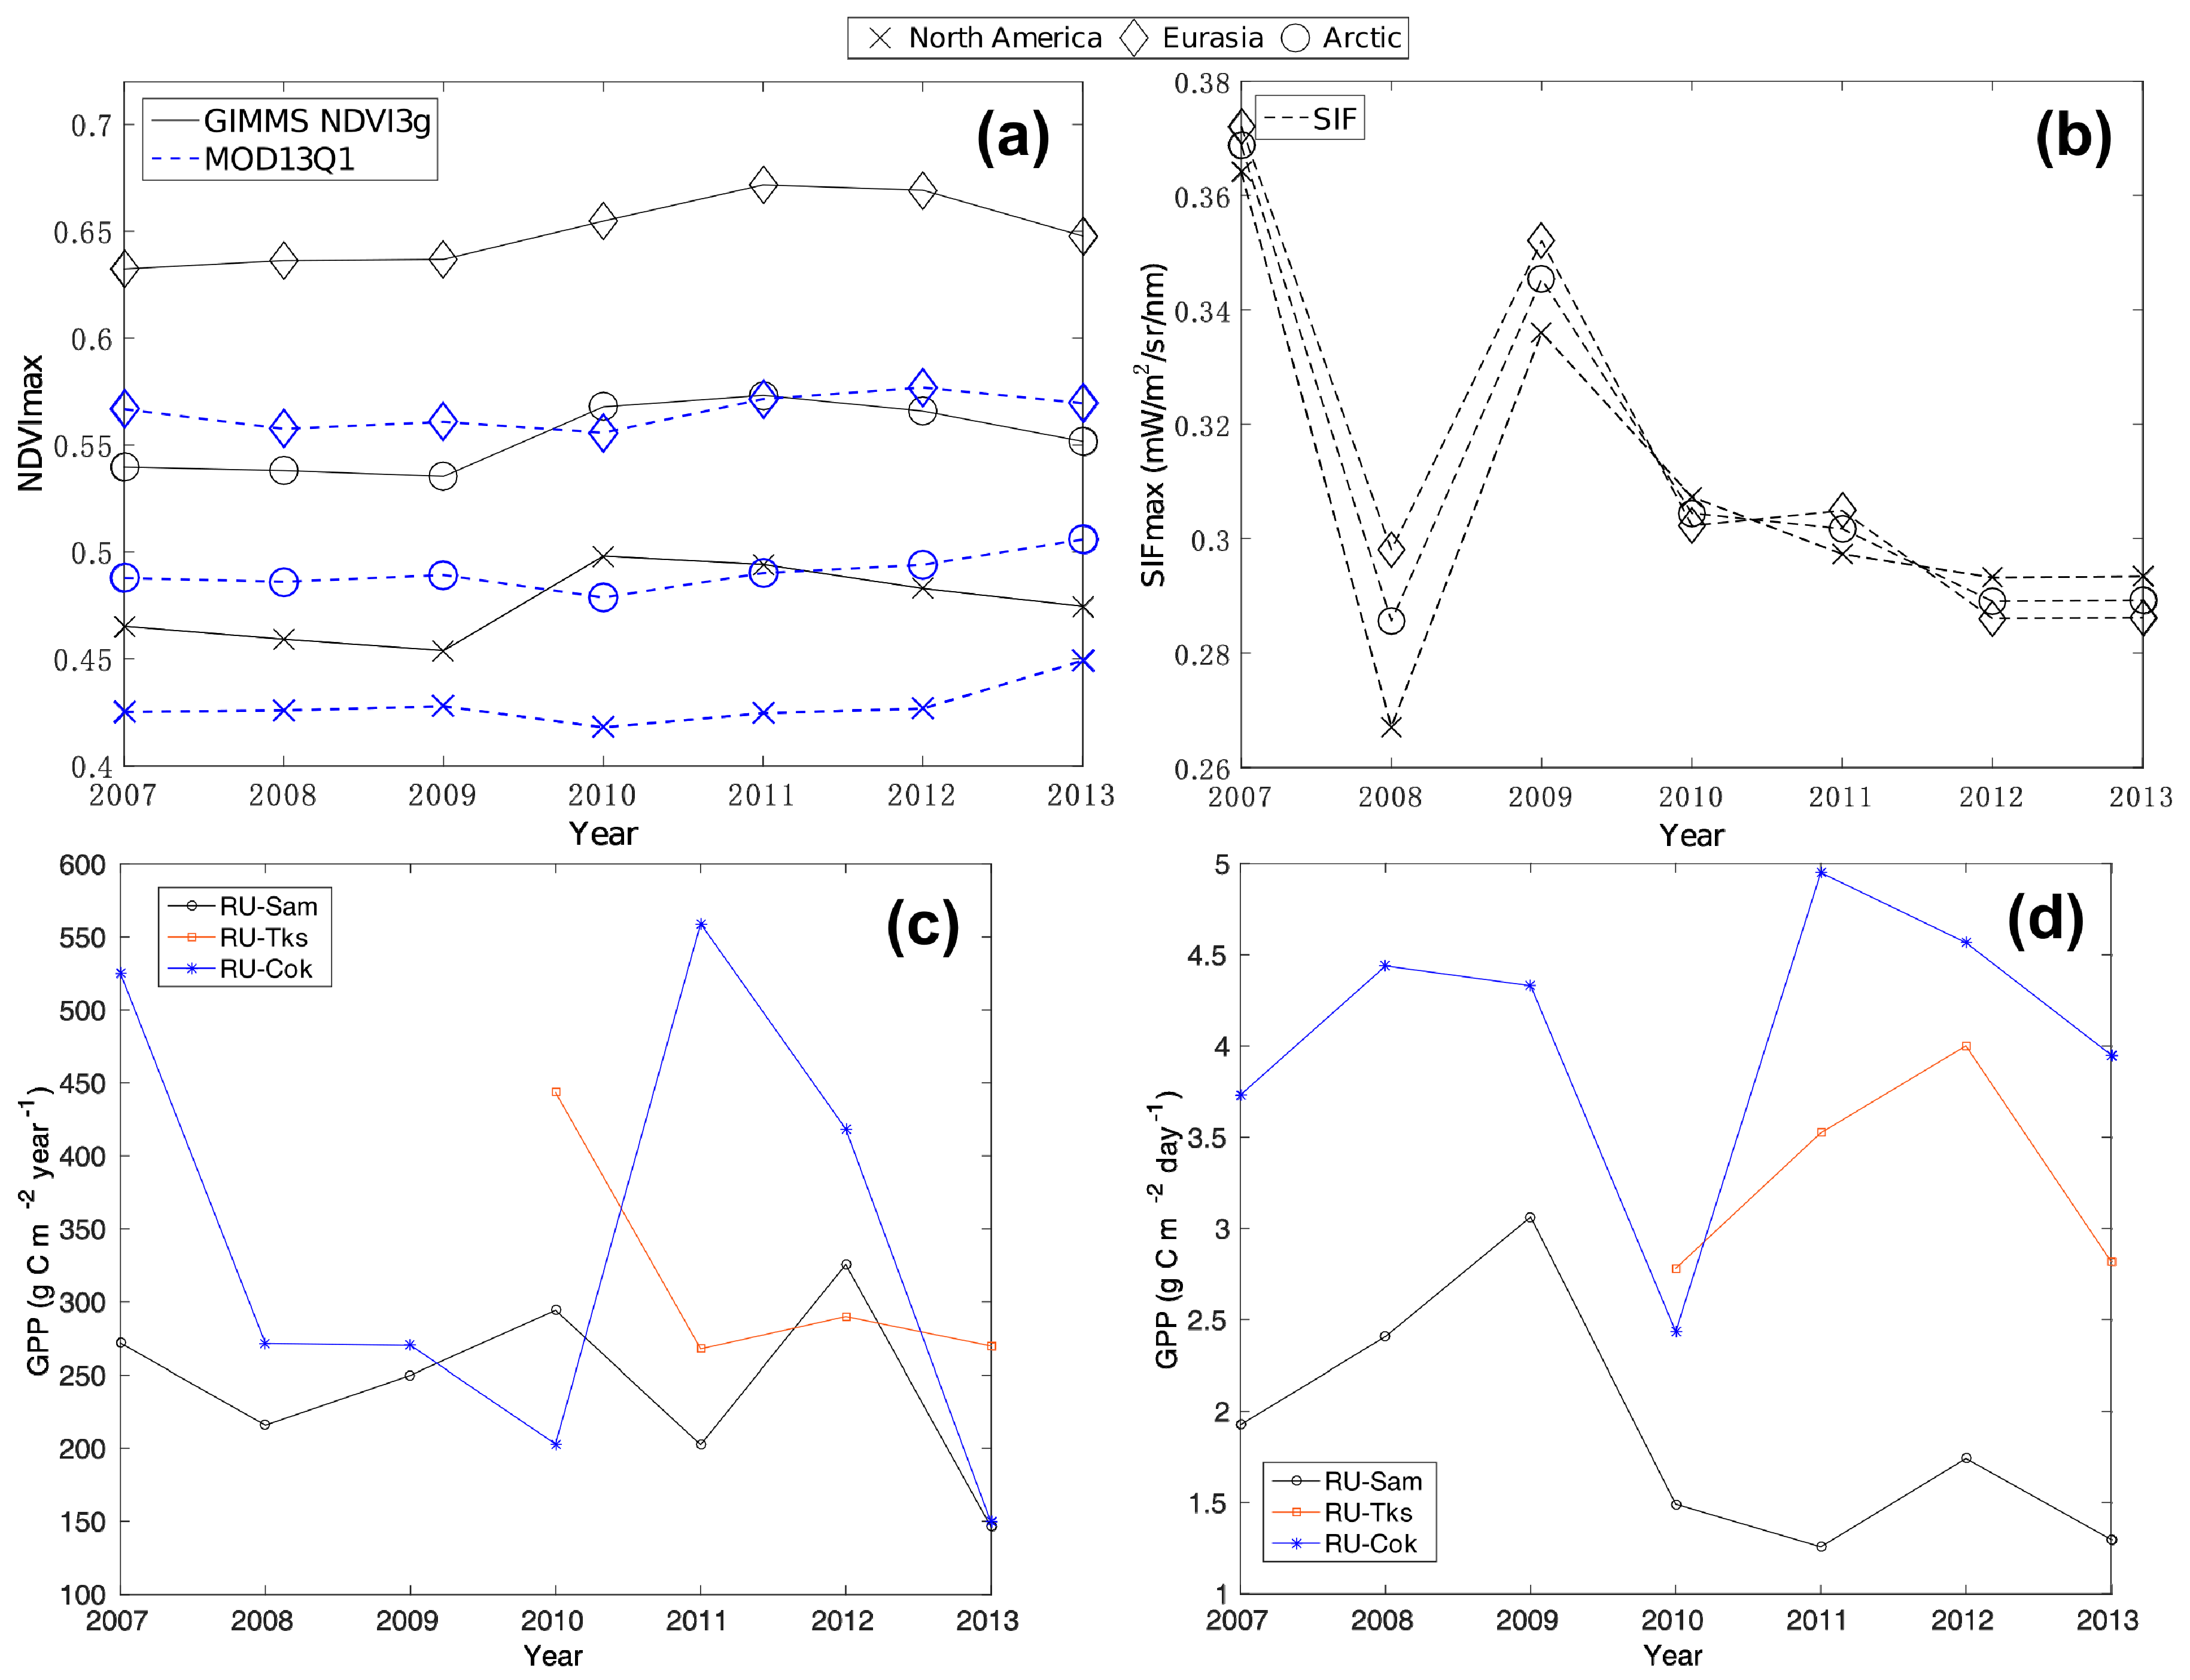
Additionally, the NDVImax_g of the Arctic tundra showed successive declines from 2010 for the North American Arctic tundra and the entire Arctic tundra region (Figure 3a). While the trend for NDVImax_m of Arctic tundra showed the opposite direction with increases (slope: 0.0085) from 2010 (Figure 3a). For the third greenness index, the negative SIF trend of Arctic tundra was obvious (–0.0098 mW/m2/sr/nm/year) from 2007 (Figure 3b). The average of the SIFmax for the entire Arctic tundra area changed from 0.3696 mW/m2/sr/nm (2007) to 0.2899 mW/m2/sr/nm (2013). The SIF of two separate continents (North America and Eurasia Arctic) had a similar time-series pattern to the Arctic tundra area. The annual GPP of three flux sites showed overall declines (Figure 3c), and the temporal pattern (2007–2009) between the SIF and the annual GPP was similar. The maximum value of the monthly GPP showed a decline for the RU-Sam site (Figure 3d).
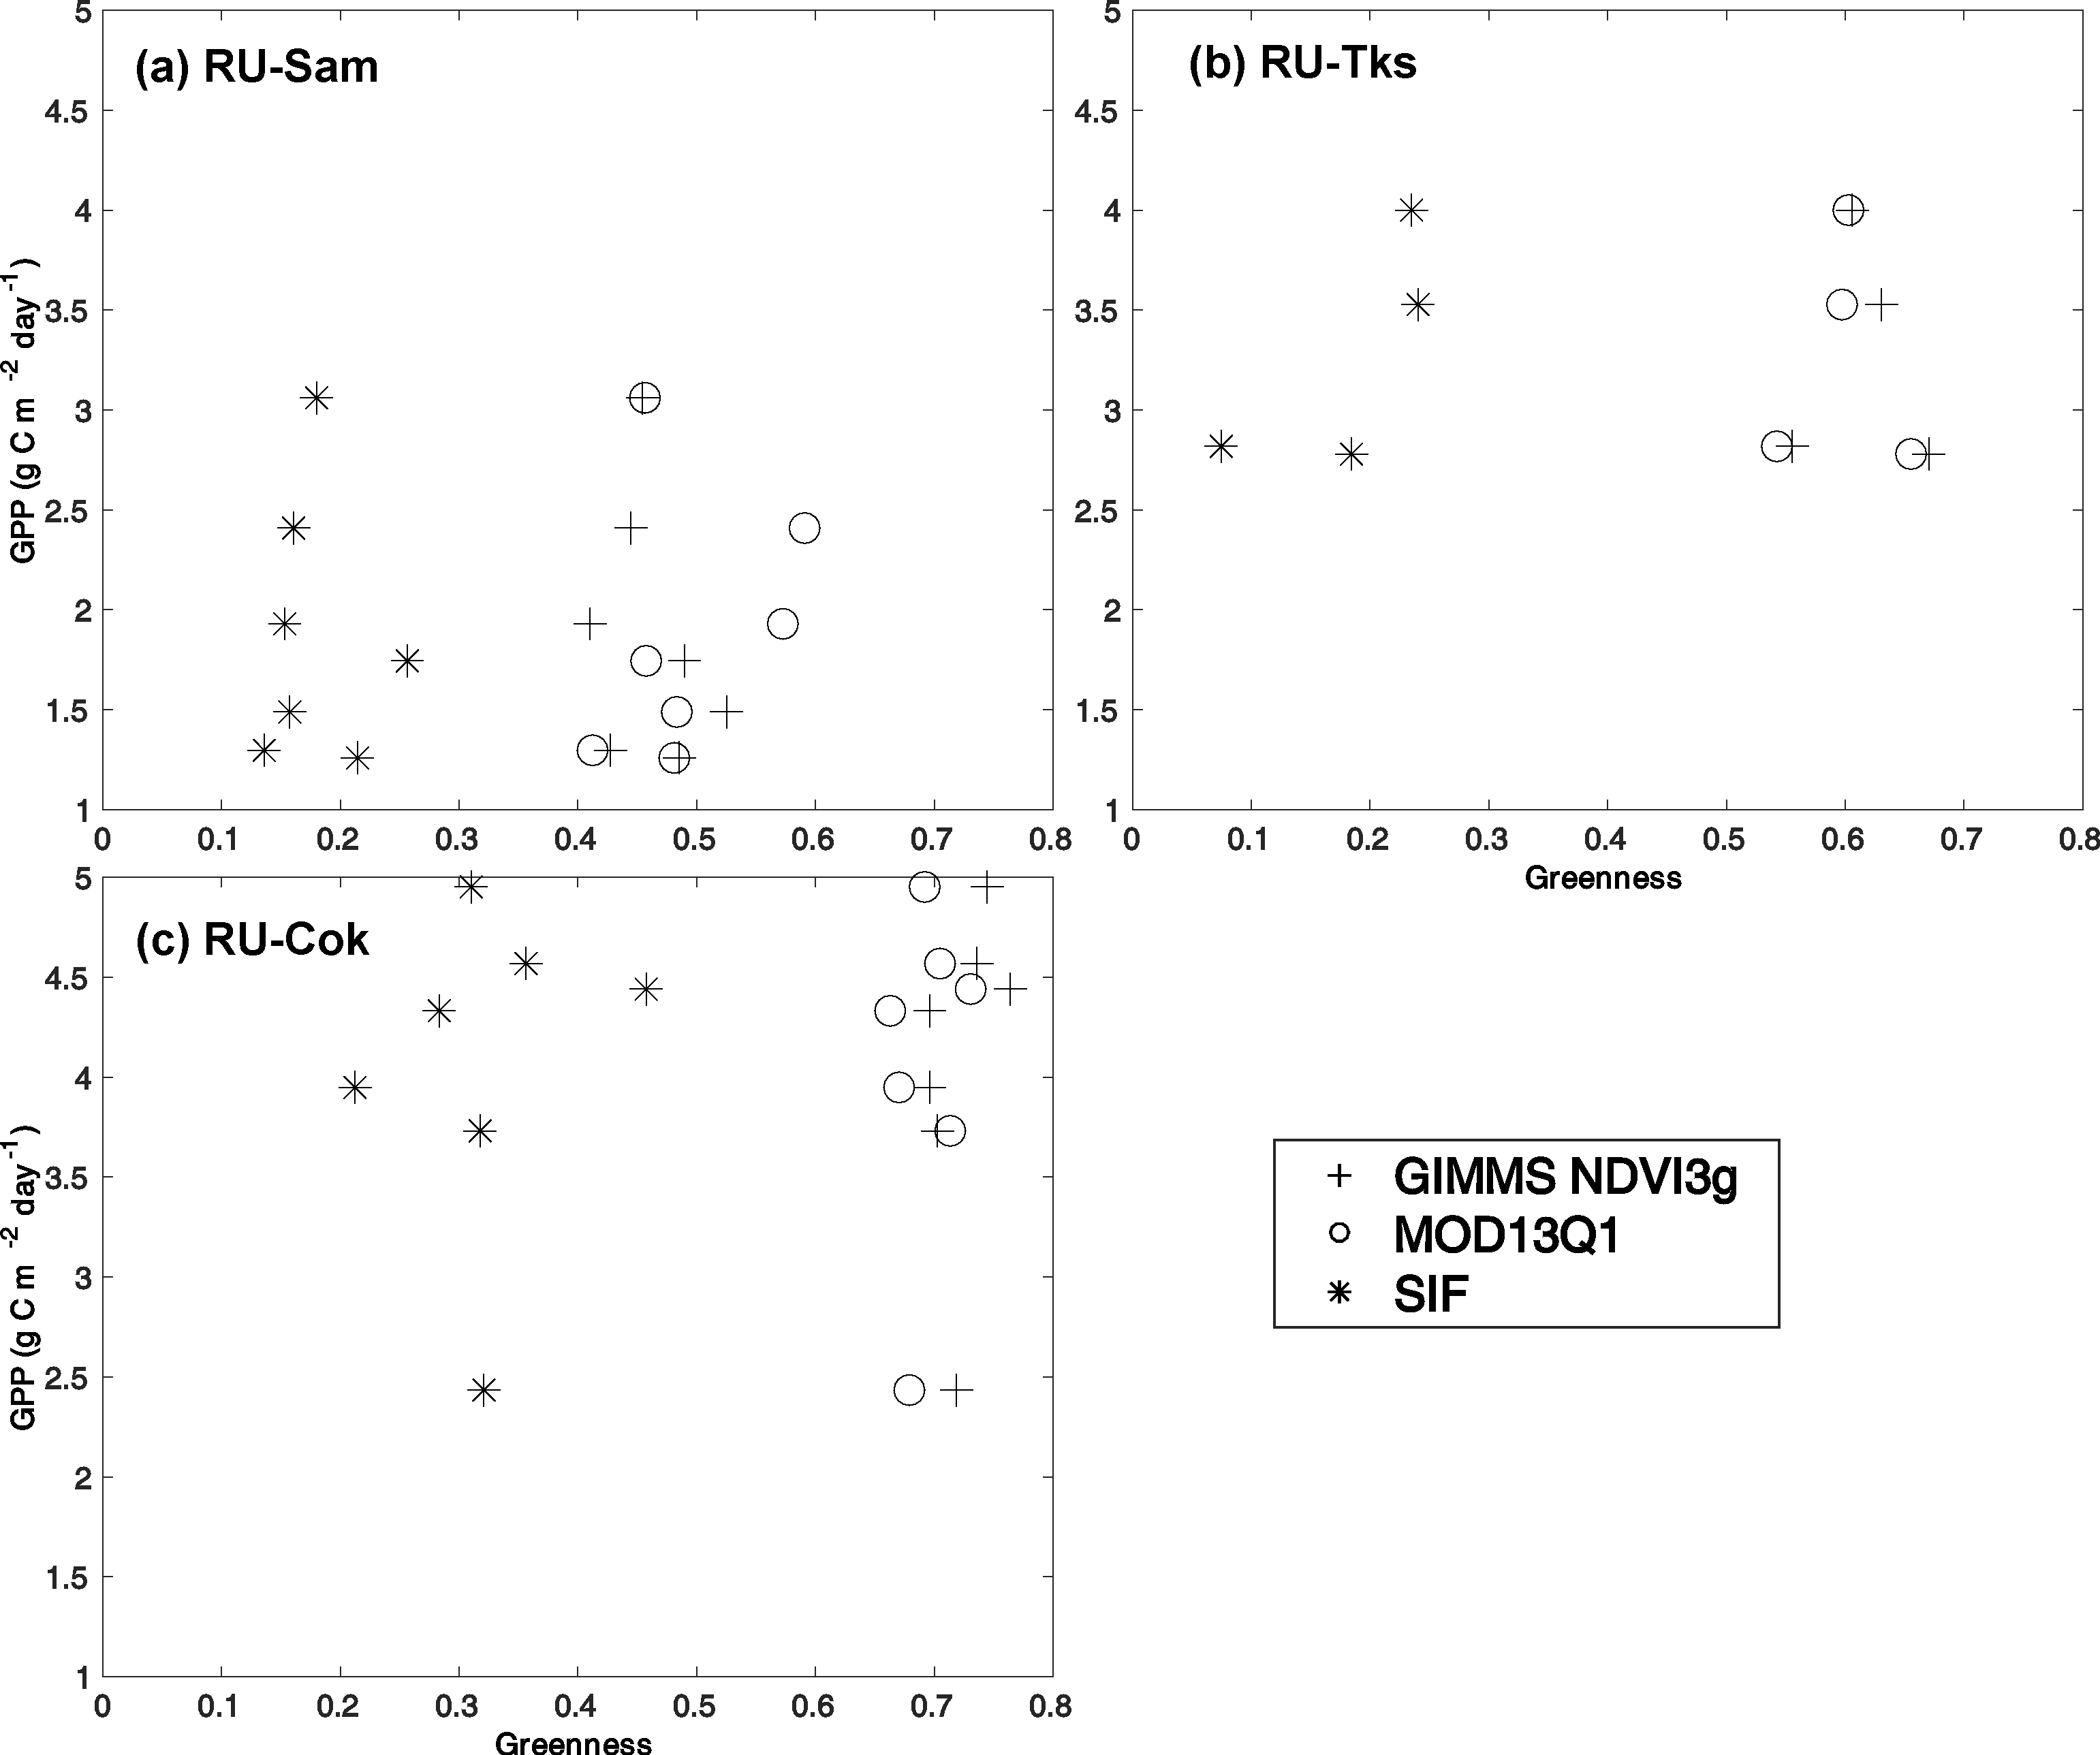
In terms of Arctic tundra greenness in the area of the EC tower flux measurements, the two NDVI remote sensing indices showed similar trends. The SIFmax data only included three of the EC flux sites, and showed overall negative trends. Two sites, Samoylov and Tiksi of Russia, had a similar temporal pattern with the ground data. When comparing the EC-observed GPP with the NDVI and SIF, the p-value was lower than 0.05 for three flux sites (Figure 4). The coefficient of determination (R2) between SIF/NDVI and GPP was calculated for each flux site. Only the coefficient of determination (R2) between EC observed GPP and SIF for RU-Tks was 0.5525 (p-value < 0.0001), and the R2 for the other flux sites was lower than 0.2 between EC-observed GPP, and NDVI, SIF (Table 3).
4. Discussion
Unlike previous studies that have shown Arctic tundra greening as the overall trend with browning at some small regions [4,13,25,26], our study found that most parts of the Arctic tundra below 75° N were browning based on SIF data. The browning trend of Arctic tundra at the Arctic Coastal Plain of northern Alaska were similar to the pattern found by Lara et al. [27]. Meanwhile, Box et al. [48] also indicated the negative trend of tundra greenness from 2008. The Arctic tundra browning may be event-driven, as postulated by Phoenix and Bjerke [4], such as the shrub expansion in the Arctic tundra ecosystem [18,49], extreme winter warming [20], fire [50,51], outbreaks of defoliating insects and rust fungi, and frost drought [52]. The increase of herbivore populations is another potential cause of tundra browning [25,53,54]. Additionally, landforms may be the most important predictor of browning followed by recent climate change [26].
For the greenness indicator, the NDVI is used to indicate radiation absorption rather than carbon assimilation. SIF is used to indicate actual photosynthesis rather than potential photosynthesis [31,55]. In addition, the downscaled SIF data used for the study can be considered as a proxy for GPP [37]. Taking flux site “RU-Tks” as an example, the R2 between the SIF and GPP was higher than for the two NDVI data, and the trends of the SIF and GPP both indicated that the tundra nearby was “browning” from 2007 to 2013 (Figure 2 and Figure 4, Table 3). The low R2 values may be due to these reasons: (i) Only three flux sites were available for the comparison, and the only seven years were used for the analysis. Limited ground observed data can be used for comparison and validation. (ii) The footprint of the EC-observed GPP was typically less than 1–3 km2 [56], while the spatial resolution of the SIF was much coarser.
The different greenness trends may have been caused by the different sensors (spatial resolution- GIMMS NDVI3g: 8 km; MOD13Q1: 250 m; SIF: 0.05 degree, approximately 5 km), spatial coverage and the sun-target-sensor geometry. Compared to the GIMMS NDVI3g, the MOD13Q1 and SIF have a finer spatial resolution with more detailed information, which may also bring more information for calculation, especially for the Arctic region. Meanwhile, the NDVIs were derived from different sensors, and not cross validated [27,57,58]. The spatial coverage of the NDVI was larger than SIF. No data existed higher than 75° N for SIF; however, the statistics region of the NDVI is whole study area. When the spatial region of the NDVI was the same as the SIF, (i) the temporal patterns (2007–2013) of GIMMS NDVI3g and MOD13Q1 were similar with the NDVI result covering the whole Arctic region, and (ii) the NDVI values of GIMMS NDVI3g and MOD13Q1 were a little larger. Sun-target-sensor geometry that includes the overpass time of the sensor, the view zenith angle, is probably another reason for different Arctic tundra greenness trends in high latitude areas with a high solar zenith angle [59,60]. For example, the MODIS Terra sensor is about 10:30 h (https://nsidc.org/data/modis/terra_aqua_differences), and the AVHRR sensor has drifted from the nominal 13:30 h overpass time by as much as 4.5 h toward evening [41]. The overpass time of the original coarse SIF is 9:30 h (local time).
There were three limitations in this study. First, the Arctic tundra greenness trend was examined only with a short span of recorded data between 2007 and 2013. Long time-series remote sensing and field observation data need to be applied to check the Arctic tundra greenness trend. Second, the NDVI derived from two sensors were not cross calibrated. Lastly, the spatial resolution was different for the three indices used for the study, which may have contributed to the differences in the results. Further research may need to focus on the following issues: (i) the observation of Orbiting Carbon Observatory 2 (OCO-2) can be taken into account, which uses measurements in three different spectral bands over four to eight different footprints of approximately 1.29 × 2.25 km, and launched on 2 July 2014; (ii) more shared ground reference data can be used for comparison and validation.
5. Conclusions
In this research, the spatiotemporal patterns of Arctic tundra greenness (2007–2013) were assessed based on SIF data along with two types of NDVI data. In contrast to previously published literature, spatially downscaled SIF was employed first as an indicator of Arctic tundra greenness. It was found that SIF had the potential to exhibit more effectiveness as an indicator of Arctic tundra greenness.
Specifically, the spatial distribution pattern of Arctic tundra greening and browning was mapped and analyzed. Using the GIMMS NDVI3g and MOD13Q1 indices, the tundra was found to be greening on the North Slope of Alaska and in most parts of western Siberia, and browning in the higher-Arctic Canadian Archipelago, western Alaska (Yukon-Kuskokwim Delta), and eastern Siberia (high latitude area of the Kolyma Lowland and Yana-Indigirka Lowland). However, the Arctic tundra was browning for most parts of the study area below 75° N based on the SIF data, except for the small regions at the northern edge of the SIF data. Meanwhile, the temporal pattern of tundra in Northern America, Eurasia, and the whole of the Arctic was also interpreted from 2007 to 2013. The greenness value of the Eurasian Arctic tundra was higher than that of Northern America and the entire Arctic tundra for the three greenness indices. From 2010, the Arctic tundra was greening based on MOD13Q1, whereas was browning using the GIMMS NDVI3g. Based on the SIF data, there was a general decreasing trend of Arctic tundra greenness between 2007 and 2013.
Author Contributions
Conceptualization, D.F. and F.S.; methodology, D.F.; software, D.F.; validation, D.F., F.S. and Y.S.; formal analysis, D.F.; investigation, J.W.; resources, D.F.; data curation, D.F.; writing—original draft preparation, D.F. and Y.S.; writing—review and editing, D.F., F.S. and J.W.; visualization, D.F.; supervision, F.S. and J.W.; project administration, D.F.; funding acquisition, D.F.
Funding
This study was supported by National Key R&D Program (No. 2016YFC1402701). Research grants (41501473) were funded by the National Natural Science Foundation of China, the Youth Science Funds of State Key Laboratory of Resources and Environmental Information System (O8R8A080YA), and the Chinese Academy of Sciences. Research grants (Y6V60206YZ) were funded by the Institute of Geographic Sciences and Natural Resources Research, Chinese Academy of Sciences.
Acknowledgments
We would like to thank Gregory Duveiller for providing SIF data (2007–2013).
Conflicts of Interest
The authors declare no conflict of interest.
References
- Bhatt, U.S.; Walker, D.A.; Raynolds, M.K.; Comiso, J.C.; Epstein, H.E.; Jia, G.; Gens, R.; Pinzon, J.E.; Tucker, C.J.; Tweedie, C.E. Circumpolar arctic tundra vegetation change is linked to sea ice decline. Earth Interact. 2010, 14, 1–20. [Google Scholar] [CrossRef]
- Jia, G.J.; Epstein, H.E.; Walker, D.A. Greening of arctic Alaska, 1981–2001. Geophys Res. Lett. 2003, 30, 2067. [Google Scholar] [CrossRef]
- Myneni, R.B.; Keeling, C.D.; Tucker, C.J.; Asrar, G.; Nemani, R.R. Increased plant growth in the northern high latitudes from 1981 to 1991. Nature 1997, 386, 698–702. [Google Scholar] [CrossRef]
- Phoenix, G.K.; Bjerke, J.W. Arctic browning: Extreme events and trends reversing arctic greening. Glob. Chang. Biol. 2016, 22, 2960–2962. [Google Scholar] [CrossRef] [PubMed]
- Bhatt, U.; Walker, D.; Raynolds, M.; Bieniek, P.; Epstein, H.; Comiso, J.; Pinzon, J.; Tucker, C.; Polyakov, I. Recent declines in warming and vegetation greening trends over pan-arctic tundra. Remote Sens. 2013, 5, 4229. [Google Scholar] [CrossRef]
- Chae, Y.; Kang, S.M.; Jeong, S.-J.; Kim, B.; Frierson, D.M.W. Arctic greening can cause earlier seasonality of arctic amplification. Geophys Res. Lett. 2015, 42, 536–541. [Google Scholar] [CrossRef]
- Lucht, W.; Prentice, I.C.; Myneni, R.B.; Sitch, S.; Friedlingstein, P.; Cramer, W.; Bousquet, P.; Buermann, W.; Smith, B. Climatic control of the high-latitude vegetation greening trend and pinatubo effect. Science 2002, 296, 1687–1689. [Google Scholar] [CrossRef]
- Zhu, Z.; Piao, S.; Myneni, R.B.; Huang, M.; Zeng, Z.; Canadell, J.G.; Ciais, P.; Sitch, S.; Friedlingstein, P.; Arneth, A.; et al. Greening of the earth and its drivers. Nat. Clim. Chang. 2016, 6, 791–795. [Google Scholar] [CrossRef]
- Forbes, B.C.; Fauria, M.M.; Zetterberg, P. Russian arctic warming and ‘greening’ are closely tracked by tundra shrub willows. Glob. Chang. Biol. 2010, 16, 1542–1554. [Google Scholar] [CrossRef]
- Macias-Fauria, M.; Forbes, B.C.; Zetterberg, P.; Kumpula, T. Eurasian arctic greening reveals teleconnections and the potential for structurally novel ecosystems. Nat. Clim. Chang. 2012, 2, 613–618. [Google Scholar] [CrossRef]
- Victoria, V.M.; Igor, E. Spatial heterogeneity of greening and browning between and within bioclimatic zones in northern west siberia. Environ. Res. Lett. 2016, 11, 115002. [Google Scholar] [CrossRef]
- Swanson, D. Trends in greenness and snow cover in alaska’s arctic national parks, 2000–2016. Remote Sens. 2017, 9, 514. [Google Scholar] [CrossRef]
- Verbyla, D. The greening and browning of alaska based on 1982–2003 satellite data. Glob. Ecol. Biogeogr. 2008, 17, 547–555. [Google Scholar] [CrossRef]
- Edwards, R.; Treitz, P. Vegetation greening trends at two sites in the canadian arctic: 1984–2015. Arct. Antarct. Alp. Res. 2017, 49, 601–619. [Google Scholar] [CrossRef]
- Juszak, I.; Iturrate-Garcia, M.; Gastellu-Etchegorry, J.-P.; Schaepman, M.E.; Maximov, T.C.; Schaepman-Strub, G. Drivers of shortwave radiation fluxes in arctic tundra across scales. Remote Sens. Environ. 2017, 193, 86–102. [Google Scholar] [CrossRef]
- Montesano, P.M.; Sun, G.; Dubayah, R.O.; Ranson, K.J. Spaceborne potential for examining taiga–tundra ecotone form and vulnerability. Biogeosciences 2016, 13, 3847–3861. [Google Scholar] [CrossRef]
- Myers-Smith, I.H.; Elmendorf, S.C.; Beck, P.S.A.; Wilmking, M.; Hallinger, M.; Blok, D.; Tape, K.D.; Rayback, S.A.; Macias-Fauria, M.; Forbes, B.C.; et al. Climate sensitivity of shrub growth across the tundra biome. Nat. Clim. Chang. 2015, 5, 887–891. [Google Scholar] [CrossRef]
- Myers-Smith, I.H.; Forbes, B.C.; Wilmking, M.; Hallinger, M.; Lantz, T.; Blok, D.; Tape, K.D.; Macias-Fauria, M.; Sass-Klaassen, U.; Lévesque, E. Shrub expansion in tundra ecosystems: Dynamics, impacts and research priorities. Environ. Res. Lett. 2011, 6, 045509. [Google Scholar] [CrossRef]
- van der Kolk, H.J.; Heijmans, M.M.P.D.; van Huissteden, J.; Pullens, J.W.M.; Berendse, F. Potential arctic tundra vegetation shifts in response to changing temperature, precipitation and permafrost thaw. Biogeosciences 2016, 13, 6229–6245. [Google Scholar] [CrossRef]
- Bokhorst, S.; Bjerke, J.; Street, L.; Callaghan, T.; Phoenix, G. Impacts of multiple extreme winter warming events on sub-arctic heathland: Phenology, reproduction, growth, and CO2 flux responses. Glob. Chang. Biol. 2011, 17, 2817–2830. [Google Scholar] [CrossRef]
- Gonsamo, A.; Chen, J.M. Circumpolar vegetation dynamics product for global change study. Remote Sens. Environ. 2016, 182, 13–26. [Google Scholar] [CrossRef] [Green Version]
- Greaves, H.E.; Vierling, L.A.; Eitel, J.U.H.; Boelman, N.T.; Magney, T.S.; Prager, C.M.; Griffin, K.L. High-resolution mapping of aboveground shrub biomass in arctic tundra using airborne lidar and imagery. Remote Sens. Environ. 2016, 184, 361–373. [Google Scholar] [CrossRef]
- Yu, Q.; Epstein, H.; Engstrom, R.; Walker, D. Circumpolar arctic tundra biomass and productivity dynamics in response to projected climate change and herbivory. Glob. Chang. Biol. 2017, 23, 3895–3907. [Google Scholar] [CrossRef] [PubMed]
- Liljedahl, A.K.; Boike, J.; Daanen, R.P.; Fedorov, A.N.; Frost, G.V.; Grosse, G.; Hinzman, L.D.; Iijma, Y.; Jorgenson, J.C.; Matveyeva, N.; et al. Pan-arctic ice-wedge degradation in warming permafrost and its influence on tundra hydrology. Nat. Geosci. 2016, 9, 312–318. [Google Scholar] [CrossRef]
- Epstein, H.; Bhatt, U.; Raynolds, M.; Walker, D.; Forbes, B.C.; Macias-Fauria, M.; Loranty, M.M.; Phoenix, G.K.; Bjerke, J.W. Tundra Greenness. Arctic report card: Update for 2016. Available online: www.arctic.noaa.gov/reportcard (accessed on 22 March 2017).
- Lara, M.J.; Nitze, I.; Grosse, G.; Martin, P.; McGuire, A.D. Reduced arctic tundra productivity linked with landform and climate change interactions. Sci. Rep. 2018, 8, 2345. [Google Scholar] [CrossRef] [PubMed]
- Guay, K.C.; Beck, P.S.A.; Berner, L.T.; Goetz, S.J.; Baccini, A.; Buermann, W. Vegetation productivity patterns at high northern latitudes: A multi-sensor satellite data assessment. Glob. Chang. Biol. 2014, 20, 3147–3158. [Google Scholar] [CrossRef] [PubMed]
- Frankenberg, C.; O’Dell, C.; Berry, J.; Guanter, L.; Joiner, J.; Köhler, P.; Pollock, R.; Taylor, T.E. Prospects for chlorophyll fluorescence remote sensing from the orbiting carbon observatory-2. Remote Sens. Environ. 2014, 147, 1–12. [Google Scholar] [CrossRef]
- Yang, X.; Tang, J.; Mustard, J.F.; Lee, J.E.; Rossini, M.; Joiner, J.; Munger, J.W.; Kornfeld, A.; Richardson, A.D. Solar-induced chlorophyll fluorescence that correlates with canopy photosynthesis on diurnal and seasonal scales in a temperate deciduous forest. Geophys. Res. Lett. 2015, 42, 2977–2987. [Google Scholar] [CrossRef]
- Badgley, G.; Field, C.B.; Berry, J.A. Canopy near-infrared reflectance and terrestrial photosynthesis. Sci. Adv. 2017, 3, e1602244. [Google Scholar] [CrossRef]
- Zhang, Y.; Guanter, L.; Berry, J.A.; Joiner, J.; van der Tol, C.; Huete, A.; Gitelson, A.; Voigt, M.; Köhler, P. Estimation of vegetation photosynthetic capacity from space-based measurements of chlorophyll fluorescence for terrestrial biosphere models. Glob. Chang. Biol. 2014, 20, 3727–3742. [Google Scholar] [CrossRef] [Green Version]
- Guanter, L.; Zhang, Y.; Jung, M.; Joiner, J.; Voigt, M.; Berry, J.A.; Frankenberg, C.; Huete, A.R.; Zarco-Tejada, P.; Lee, J.-E.; et al. Global and time-resolved monitoring of crop photosynthesis with chlorophyll fluorescence. Proc. Natl. Acad. Sci. 2014, 111, E1327–E1333. [Google Scholar] [CrossRef] [PubMed] [Green Version]
- Jeong, S.-J.; Schimel, D.; Frankenberg, C.; Drewry, D.T.; Fisher, J.B.; Verma, M.; Berry, J.A.; Lee, J.-E.; Joiner, J. Application of satellite solar-induced chlorophyll fluorescence to understanding large-scale variations in vegetation phenology and function over northern high latitude forests. Remote Sens. Environ. 2017, 190, 178–187. [Google Scholar] [CrossRef]
- Porcar-Castell, A.; Tyystjärvi, E.; Atherton, J.; van der Tol, C.; Flexas, J.; Pfündel, E.E.; Moreno, J.; Frankenberg, C.; Berry, J.A. Linking chlorophyll a fluorescence to photosynthesis for remote sensing applications: Mechanisms and challenges. J. Exp. Bot. 2014, 65, 4065–4095. [Google Scholar] [CrossRef] [PubMed]
- Rascher, U.; Alonso, L.; Burkart, A.; Cilia, C.; Cogliati, S.; Colombo, R.; Damm, A.; Drusch, M.; Guanter, L.; Hanus, J.; et al. Sun-induced fluorescence—A new probe of photosynthesis: First maps from the imaging spectrometer hyplant. Glob. Chang. Biol. 2015, 21, 4673–4684. [Google Scholar] [CrossRef] [PubMed]
- Zarco-Tejada, P.J.; Catalina, A.; González, M.R.; Martín, P. Relationships between net photosynthesis and steady-state chlorophyll fluorescence retrieved from airborne hyperspectral imagery. Remote Sens. Environ. 2013, 136, 247–258. [Google Scholar] [CrossRef] [Green Version]
- Duveiller, G.; Cescatti, A. Spatially downscaling sun-induced chlorophyll fluorescence leads to an improved temporal correlation with gross primary productivity. Remote Sens. Environ. 2016, 182, 72–89. [Google Scholar] [CrossRef]
- Epstein, H.E.; Raynolds, M.K.; Walker, D.A.; Bhatt, U.S.; Tucker, C.J.; Pinzon, J.E. Dynamics of aboveground phytomass of the circumpolar arctic tundra during the past three decades. Environ. Res. Lett. 2012, 7, 015506. [Google Scholar] [CrossRef]
- Walker, D.A.; Raynolds, M.K.; Daniëls, F.J.; Einarsson, E.; Elvebakk, A.; Gould, W.A.; Katenin, A.E.; Kholod, S.S.; Markon, C.J.; Melnikov, E.S. The circumpolar arctic vegetation map. J. Veg. Sci. 2005, 16, 267–282. [Google Scholar] [CrossRef]
- Asrar, G.; Fuchs, M.; Kanemasu, E.T.; Hatfield, J.L. Estimating absorbed photosynthetic radiation and leaf area index from spectral reflectance in wheat1. Agron. J. 1984, 76, 300–306. [Google Scholar] [CrossRef]
- Pinzon, J.E.; Tucker, C.J. A non-stationary 1981–2012 avhrr ndvi3g time series. Remote Sens. 2014, 6, 6929–6960. [Google Scholar] [CrossRef]
- Joiner, J.; Guanter, L.; Lindstrot, R.; Voigt, M.; Vasilkov, A.; Middleton, E.; Huemmrich, K.; Yoshida, Y.; Frankenberg, C. Global monitoring of terrestrial chlorophyll fluorescence from moderate spectral resolution near-infrared satellite measurements: Methodology, simulations, and application to gome-2. Atmos. Meas. Tech. 2013, 6, 2803–2823. [Google Scholar] [CrossRef]
- Boike, J.; Kattenstroth, B.; Abramova, K.; Bornemann, N.; Chetverova, A.; Fedorova, I.; Fröb, K.; Grigoriev, M.; Grüber, M.; Kutzbach, L.; et al. Baseline characteristics of climate, permafrost and land cover from a new permafrost observatory in the lena river delta, siberia (1998–2011). Biogeosciences 2013, 10, 2105–2128. [Google Scholar] [CrossRef]
- Uttal, T.; Starkweather, S.; Drummond, J.R.; Vihma, T.; Makshtas, A.P.; Darby, L.S.; Burkhart, J.F.; Cox, C.J.; Schmeisser, L.N.; Haiden, T. International arctic systems for observing the atmosphere: An international polar year legacy consortium. Bull. Am. Meteorol. Soc. 2016, 97, 1033–1056. [Google Scholar] [CrossRef]
- Zheng, C.; Jia, L.; Hu, G.; Menenti, M.; Lu, J.; Zhou, J.; Wang, K.; Li, Z. Assessment of water use in pan-eurasian and african continents by etmonitor with multi-source satellite data. IOP Conf. Ser. Earth Environ. Sci. 2017, 57, 012050. [Google Scholar] [CrossRef]
- Gorelick, N.; Hancher, M.; Dixon, M.; Ilyushchenko, S.; Thau, D.; Moore, R. Google earth engine: Planetary-scale geospatial analysis for everyone. Remote Sens. Environ. 2017, 202, 18–27. [Google Scholar] [CrossRef]
- Alcaraz-Segura, D.; Chuvieco, E.; Epstein, H.E.; Kasischke, E.S.; Trishchenko, A. Debating the greening vs. Browning of the north american boreal forest: Differences between satellite datasets. Glob. Chang. Biol. 2010, 16, 760–770. [Google Scholar] [CrossRef]
- Box, J.E.; Colgan, W.T.; Christensen, T.R.; Schmidt, N.M.; Lund, M.; Parmentier, F.-J.W.; Brown, R.; Bhatt, U.S.; Euskirchen, E.S.; Romanovsky, V.E.; et al. Key indicators of arctic climate change: 1971–2017. Environ. Res. Lett. 2019, 14, 045010. [Google Scholar] [CrossRef]
- Tape, K.E.N.; Sturm, M.; Racine, C. The evidence for shrub expansion in northern alaska and the pan-arctic. Glob. Chang. Biol. 2006, 12, 686–702. [Google Scholar] [CrossRef]
- Bret-Harte, M.S.; Mack, M.C.; Shaver, G.R.; Huebner, D.C.; Johnston, M.; Mojica, C.A.; Pizano, C.; Reiskind, J.A. The response of arctic vegetation and soils following an unusually severe tundra fire. Phil. Trans. R. Soc. B 2013, 368. [Google Scholar] [CrossRef]
- Mack, M.C.; Bret-Harte, M.S.; Hollingsworth, T.N.; Jandt, R.R.; Schuur, E.A.; Shaver, G.R.; Verbyla, D.L. Carbon loss from an unprecedented arctic tundra wildfire. Nature 2011, 475, 489–492. [Google Scholar] [CrossRef]
- Bjerke, J.W.; Karlsen, S.R.; Høgda, K.A.; Malnes, E.; Jepsen, J.U.; Lovibond, S.; Vikhamar-Schuler, D.; Tømmervik, H. Record-low primary productivity and high plant damage in the nordic arctic region in 2012 caused by multiple weather events and pest outbreaks. Environ. Res. Lett. 2014, 9, 084006. [Google Scholar] [CrossRef]
- Barrio, I.C.; Bueno, C.; Gartzia, M.; Soininen, E.; Christie, K.; Speed, J.; Ravolainen, V.; Forbes, B.; Gauthier, G.; Horstkotte, T. Biotic interactions mediate patterns of herbivore diversity in the arctic. Glob. Ecol. Biogeogr. 2016, 25, 1108–1118. [Google Scholar] [CrossRef]
- Lara, M.J.; Johnson, D.R.; Andresen, C.; Hollister, R.D.; Tweedie, C.E. Peak season carbon exchange shifts from a sink to a source following 50+ years of herbivore exclusion in an arctic tundra ecosystem. J. Ecol. 2017, 105, 122–131. [Google Scholar] [CrossRef]
- Li, X.; Xiao, J.; He, B.; Altaf Arain, M.; Beringer, J.; Desai, A.R.; Emmel, C.; Hollinger, D.Y.; Krasnova, A.; Mammarella, I.; et al. Solar-induced chlorophyll fluorescence is strongly correlated with terrestrial photosynthesis for a wide variety of biomes: First global analysis based on oco-2 and flux tower observations. Glob. Chang. Biol. 2018, 24, 3990–4008. [Google Scholar] [CrossRef]
- Fu, D.; Chen, B.; Zhang, H.; Wang, J.; Black, T.A.; Amiro, B.D.; Bohrer, G.; Bolstad, P.; Coulter, R.; Rahman, A.F.; et al. Estimating landscape net ecosystem exchange at high spatial–temporal resolution based on landsat data, an improved upscaling model framework, and eddy covariance flux measurements. Remote Sens. Environ. 2014, 141, 90–104. [Google Scholar]
- Chai, J.; de Beurs, K. The relationship of gimms avhrr ndvi, modis ndvi, spot ndvi and seawifs ndvi for phenological analysis. In Proceedings of the AGU Fall Meeting, San Francisco, CA, USA, 13–17 December 2010. [Google Scholar]
- Fensholt, R.; Rasmussen, K.; Nielsen, T.T.; Mbow, C. Evaluation of earth observation based long term vegetation trends—intercomparing ndvi time series trend analysis consistency of sahel from avhrr gimms, terra modis and spot vgt data. Remote Sens. Environ. 2009, 113, 1886–1898. [Google Scholar] [CrossRef]
- Roujean, J.L.; Leroy, M.; Deschamps, P.Y. A bidirectional reflectance model of the earths surface for the correction of remote-sensing data. J. Geophys Res. Atmos. 1992, 97, 20455–20468. [Google Scholar] [CrossRef]
- Schaaf, C.B.; Gao, F.; Strahler, A.H.; Lucht, W.; Li, X.W.; Tsang, T.; Strugnell, N.C.; Zhang, X.Y.; Jin, Y.F.; Muller, J.P.; et al. First operational brdf, albedo nadir reflectance products from modis. Remote Sens. Environ. 2002, 83, 135–148. [Google Scholar] [CrossRef]
Figure 1.
Spatial extent of the tundra region of the study. The green pentagrams denote the eddy-covariance (EC) flux sites within the study area.
Figure 1.
Spatial extent of the tundra region of the study. The green pentagrams denote the eddy-covariance (EC) flux sites within the study area.

Figure 2.
Spatial patterns of the Arctic tundra greenness (annual maximum value) trend from 2007 to 2013. (a) GIMMS NDVI3g, (b) MOD13Q1, and (c) SIF (unit: mW/m2/sr/nm/year). The green colors represent the tundra greening, while the yellow, brown, and red colors represent the tundra browning.
Figure 2.
Spatial patterns of the Arctic tundra greenness (annual maximum value) trend from 2007 to 2013. (a) GIMMS NDVI3g, (b) MOD13Q1, and (c) SIF (unit: mW/m2/sr/nm/year). The green colors represent the tundra greening, while the yellow, brown, and red colors represent the tundra browning.

Figure 3.
Arctic tundra greenness (average of the annual maximum value) and EC-observed gross primary production (GPP) from 2007 to 2013. (a) GIMMS NDVI3g, MOD13Q1, (b) SIF, (c) annual GPP, and (d) maximum value of monthly GPP.
Figure 3.
Arctic tundra greenness (average of the annual maximum value) and EC-observed gross primary production (GPP) from 2007 to 2013. (a) GIMMS NDVI3g, MOD13Q1, (b) SIF, (c) annual GPP, and (d) maximum value of monthly GPP.

Figure 4.
Comparison between the tundra greenness (GIMMS NDVI3g, MOD13Q1 and SIF) and the maximum value of monthly GPP derived from (a) RU-Sam, (b) RU-Tks, and (c) RU-Cok. The greenness was calculated as the 3 pixel × 3 pixel average value around the EC flux tower for each year. For more details about EC flux sites, see Table 2.


Table 1.
Three satellite-based greenness datasets (2007–2013) for the study.
| Product Name * | Greenness Indicator ** | Spatial Resolution | Temporal Resolution | Bandwith (nm) |
|---|---|---|---|---|
| GIMMS NDVI3g | NDVI | 8 km | bi-weekly | NIR: 730–1000 R: 550–700 |
| MOD13Q1 | NDVI | 250 m | 16-day | NIR: 841–876 R: 620–670 |
| Spatially downscaled GOME-2 SIF | SIF | 0.05 degree, approximately 5 km | monthly | 720–758 (spectral resolution: 0.5 nm) |
* Product name: GIMMS (Global Inventory Modeling and Mapping Studies), GOME (Global Ozone Monitoring Experiment), ** Greenness indicator: NDVI (Normalized Difference Vegetation Index), SIF (Solar-Induced Fluorescence).
Table 2.
List of eddy-covariance tower information for the research.
| Site ID * | Site Name | IGBP ** Classification | Vegetation Type | Latitude | Longitude | Data Period | References |
|---|---|---|---|---|---|---|---|
| RU-Sam | Samoylov | Grasslands | Erect dwarf-shrub tundra | 72.37 | 126.50 | 2007–2013 | Boike, et al. [43] |
| RU-Tks | Tiksi | Grasslands | Nontussock sedge, dwarf-shrub, moss tundra | 71.59 | 128.89 | 2010–2013 | Uttal, et al. [44] |
| RU-Cok | Chokurdakh | Open shurblands | Low-shrub tundra | 70.83 | 147.49 | 2007–2013 | Zheng, et al. [45] |
* ID: Identifier, ** IGBP: International Geosphere–Biosphere Programme.
Table 3.
Statistical comparison of greenness (GIMMS NDVI3g, MOD13Q1, and SIF) with the three EC tower measurements (maximum value of monthly GPP, unit: g C m−2 day−1).
Table 3.
Statistical comparison of greenness (GIMMS NDVI3g, MOD13Q1, and SIF) with the three EC tower measurements (maximum value of monthly GPP, unit: g C m−2 day−1).
| Site Name | Data | R2 | p-Value |
|---|---|---|---|
| RU-Sam | GIMMS | 0.0536 | 0.0006 |
| MODIS | 0.0195 | 0.0008 | |
| SIF | 0.0753 | 0.0001 | |
| RU-Tks | GIMMS | <0.0001 | <0.0001 |
| MODIS | <0.0001 | <0.0001 | |
| SIF | 0.5525 | <0.0001 | |
| RU-Cok | GIMMS | 0.1498 | <0.0001 |
| MODIS | 0.0625 | <0.0001 | |
| SIF | 0.1785 | <0.0001 |
© 2019 by the authors. Licensee MDPI, Basel, Switzerland. This article is an open access article distributed under the terms and conditions of the Creative Commons Attribution (CC BY) license (http://creativecommons.org/licenses/by/4.0/).
Share and Cite
MDPI and ACS Style
Fu, D.; Su, F.; Wang, J.; Sui, Y. Patterns of Arctic Tundra Greenness Based on Spatially Downscaled Solar-Induced Fluorescence. Remote Sens. 2019, 11, 1460. https://0-doi-org.brum.beds.ac.uk/10.3390/rs11121460
AMA Style
Fu D, Su F, Wang J, Sui Y. Patterns of Arctic Tundra Greenness Based on Spatially Downscaled Solar-Induced Fluorescence. Remote Sensing. 2019; 11(12):1460. https://0-doi-org.brum.beds.ac.uk/10.3390/rs11121460
Chicago/Turabian StyleFu, Dongjie, Fenzhen Su, Juan Wang, and Yijie Sui. 2019. "Patterns of Arctic Tundra Greenness Based on Spatially Downscaled Solar-Induced Fluorescence" Remote Sensing 11, no. 12: 1460. https://0-doi-org.brum.beds.ac.uk/10.3390/rs11121460
Note that from the first issue of 2016, this journal uses article numbers instead of page numbers. See further details here.