Next Issue
Volume 11, July-2
Previous Issue
Volume 11, June-2
 
 
remotesensing-logo

Journal Browser

Journal Browser

Remote Sens., Volume 11, Issue 13 (July-1 2019) – 123 articles

Cover Story (view full-size image): 
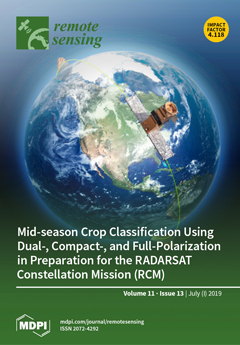
Despite recent research on the potential of dual polarimetry (DP) and full polarimetry (FP) synthetic aperture radar (SAR) data for crop mapping, the capability of compact polarimetry (CP) SAR data has not yet been thoroughly investigated. The inclusion of these beam modes on the Canadian RADARSAT Constellation Mission (RCM), launched in June 2019, makes such a study important and timely from both a research and operational perspective. While previous studies have illustrated the potential for accurate crop mapping using DP and FP SAR features, the contributions of each feature to model accuracy are not well understood. This study examines the potential of early- to mid-season RADARSAT-2 images for crop mapping in an agricultural region in Manitoba, Canada. View this paper.
  • Issues are regarded as officially published after their release is announced to the table of contents alert mailing list.
  • You may sign up for e-mail alerts to receive table of contents of newly released issues.
  • PDF is the official format for papers published in both, html and pdf forms. To view the papers in pdf format, click on the "PDF Full-text" link, and use the free Adobe Reader to open them.
Order results
Result details
Section
Select all
Export citation of selected articles as:
22 pages, 5880 KiB  
Article
Influence of Topographic Resolution and Accuracy on Hydraulic Channel Flow Simulations: Case Study of the Versilia River (Italy)
by Marco Luppichini, Massimiliano Favalli, Ilaria Isola, Luca Nannipieri, Roberto Giannecchini and Monica Bini
Remote Sens. 2019, 11(13), 1630; https://0-doi-org.brum.beds.ac.uk/10.3390/rs11131630 - 09 Jul 2019
Cited by 10 | Viewed by 3928
Abstract
The Versilia plain, a well-known and populated tourist area in northwestern Tuscany, is historically subject to floods. The last hydrogeological disaster of 1996 resulted in 13 deaths and in loss worth hundreds of millions of euros. A valid management of the hydraulic and [...] Read more.
The Versilia plain, a well-known and populated tourist area in northwestern Tuscany, is historically subject to floods. The last hydrogeological disaster of 1996 resulted in 13 deaths and in loss worth hundreds of millions of euros. A valid management of the hydraulic and flooding risks of this territory is therefore mandatory. A 7.5 km-long stretch of the Versilia River was simulated in one-dimension using river cross-sections with the FLO-2D Basic model. Simulations of the channel flow and of its maximum flow rate under different input conditions highlight the key role of topography: uncertainties in the topography introduce much larger errors than the uncertainties in roughness. The best digital elevation model (DEM) available for the area, a 1-m light detection and ranging (LiDAR) DEM dating back to 2008–2010, does not reveal all the hydraulic structures (e.g., the 40 cm thick embankment walls), lowering the maximum flow rate to only 150 m3/s, much lower than the expected value of 400 m3/s. In order to improve the already existing input topography, three different possibilities were considered: (1) to add the embankment walls to the LiDAR data with a targeted Differential GPS (DGPS) survey, (2) to acquire the cross section profiles necessary for simulation with a targeted DGPS survey, and (3) to achieve a very high resolution topography using structure from motion techniques (SfM) from images acquired using an unmanned aerial vehicle (UAV). The simulations based on all these options deliver maximum flow rates in agreement with estimated values. Resampling of the 10 cm cell size SfM-DSM allowed us to investigate the influence of topographic resolution on hydraulic channel flow, demonstrating that a change in the resolution from 30 to 50 cm alone introduced a 10% loss in the maximum flow rate. UAV-SfM-derived DEMs are low cost, relatively fast, very accurate, and they allow for the monitoring of the channel morphology variations in real time and to keep the hydraulic models updated, thus providing an excellent tool for managing hydraulic and flooding risks. Full article
(This article belongs to the Special Issue Unmanned Aerial Systems and Digital Terrain Modeling)
Show Figures

Graphical abstract

24 pages, 6024 KiB  
Article
Improving the Transferability of Suspended Solid Estimation in Wetland and Deltaic Waters with an Empirical Hyperspectral Approach
by Daniel Jensen, Marc Simard, Kyle Cavanaugh, Yongwei Sheng, Cédric G. Fichot, Tamlin Pavelsky and Robert Twilley
Remote Sens. 2019, 11(13), 1629; https://0-doi-org.brum.beds.ac.uk/10.3390/rs11131629 - 09 Jul 2019
Cited by 30 | Viewed by 5067
Abstract
The deposition of suspended sediment is an important process that helps wetlands accrete surface material and maintain elevation in the face of sea level rise. Optical remote sensing is often employed to map total suspended solids (TSS), though algorithms typically have limited transferability [...] Read more.
The deposition of suspended sediment is an important process that helps wetlands accrete surface material and maintain elevation in the face of sea level rise. Optical remote sensing is often employed to map total suspended solids (TSS), though algorithms typically have limited transferability in space and time due to variability in water constituent compositions, mixtures, and inherent optical properties. This study used in situ spectral reflectances and their first derivatives to compare empirical algorithms for estimating TSS using hyperspectral and multispectral data. These algorithms were applied to imagery collected by NASA’s Airborne Visible/Infrared Imaging Spectrometer-Next Generation (AVIRIS-NG) over coastal Louisiana, USA, and validated with a multiyear in situ dataset. The best performing models were then applied to independent spectroscopic data collected in the Peace–Athabasca Delta, Canada, and the San Francisco Bay–Delta Estuary, USA, to assess their robustness and transferability. A derivative-based partial least squares regression (PLSR) model applied to simulated AVIRIS-NG data showed the most accurate TSS retrievals (R2 = 0.83) in these contrasting deltaic environments. These results highlight the potential for a more broadly applicable generalized algorithm employing imaging spectroscopy for estimating suspended solids. Full article
(This article belongs to the Special Issue State-of-the-Art Remote Sensing in North America 2019)
Show Figures

Graphical abstract

18 pages, 2776 KiB  
Article
Copula-Based Abrupt Variations Detection in the Relationship of Seasonal Vegetation-Climate in the Jing River Basin, China
by Jing Zhao, Shengzhi Huang, Qiang Huang, Hao Wang, Guoyong Leng, Jian Peng and Haixia Dong
Remote Sens. 2019, 11(13), 1628; https://0-doi-org.brum.beds.ac.uk/10.3390/rs11131628 - 09 Jul 2019
Cited by 40 | Viewed by 3969
Abstract
Understanding the changing relationships between vegetation coverage and precipitation/temperature (P/T) and then exploring their potential drivers are highly necessary for ecosystem management under the backdrop of a changing environment. The Jing River Basin (JRB), a typical eco-environmentally vulnerable region of the Loess Plateau, [...] Read more.
Understanding the changing relationships between vegetation coverage and precipitation/temperature (P/T) and then exploring their potential drivers are highly necessary for ecosystem management under the backdrop of a changing environment. The Jing River Basin (JRB), a typical eco-environmentally vulnerable region of the Loess Plateau, was chosen to identify abrupt variations of the relationships between seasonal Normalized Difference Vegetation Index (NDVI) and P/T through a copula-based method. By considering the climatic/large-scale atmospheric circulation patterns and human activities, the potential causes of the non-stationarity of the relationship between NDVI and P/T were revealed. Results indicated that (1) the copula-based framework introduced in this study is more reasonable and reliable than the traditional double-mass curves method in detecting change points of vegetation and climate relationships; (2) generally, no significant change points were identified during 1982–2010 at the 95% confidence level, implying the overall stationary relationship still exists, while the relationships between spring NDVI and P/T, autumn NDVI and P have slightly changed; (3) teleconnection factors (including Arctic Oscillation (AO), Pacific Decadal Oscillation (PDO), Niño 3.4, and sunspots) have a more significant influence on the relationship between seasonal NDVI and P/T than local climatic factors (including potential evapotranspiration and soil moisture); (4) negative human activities (expansion of farmland and urban areas) and positive human activities (“Grain For Green” program) were also potential factors affecting the relationship between NDVI and P/T. This study provides a new and reliable insight into detecting the non-stationarity of the relationship between NDVI and P/T, which will be beneficial for further revealing the connection between the atmosphere and ecosystems. Full article
(This article belongs to the Special Issue Observations, Modeling, and Impacts of Climate Extremes)
Show Figures

Graphical abstract

15 pages, 8794 KiB  
Article
Assessment of the Ice Wedge Polygon Current State by Means of UAV Imagery Analysis (Samoylov Island, the Lena Delta)
by Andrei Kartoziia
Remote Sens. 2019, 11(13), 1627; https://0-doi-org.brum.beds.ac.uk/10.3390/rs11131627 - 09 Jul 2019
Cited by 19 | Viewed by 5185
Abstract
Modern degradation of Arctic permafrost promotes changes in tundra landscapes and leads to degradation of ice wedge polygons, which are the most widespread landforms of Arctic wetlands. Status assessment of polygon degradation is important for various environmental studies. We have applied the geographic [...] Read more.
Modern degradation of Arctic permafrost promotes changes in tundra landscapes and leads to degradation of ice wedge polygons, which are the most widespread landforms of Arctic wetlands. Status assessment of polygon degradation is important for various environmental studies. We have applied the geographic information systems’ (GIS) analysis of data from unmanned aerial vehicles (UAV) to accurately assess the status of ice wedge polygon degradation on Samoylov Island. We used several modern models of polygon degradation for revealing polygon types, which obviously correspond to different stages of degradation. Manual methods of mapping and a high spatial resolution of used UAV data allowed for a high degree of accuracy in the identification of all land units. The study revealed the following: 41.79% of the first terrace surface was composed of non-degraded polygonal tundra; 18.37% was composed of polygons, which had signs of thermokarst activity and corresponded to various stages of degradation in the models; and 39.84% was composed of collapsed polygons, slopes, valleys, and water bodies, excluding ponds of individual polygons. This study characterizes the current status of polygonal tundra degradation of the first terrace surface on Samoylov Island. Our assessment reflects the landscape condition of the first terrace surface of Samoylov Island, which is the typical island of the southern part of the Lena Delta. Moreover, the study illustrates the potential of UAV data GIS analysis for highly accurate investigations of Arctic landscape changes. Full article
(This article belongs to the Section Remote Sensing in Geology, Geomorphology and Hydrology)
Show Figures

Graphical abstract

15 pages, 3310 KiB  
Article
Improving the Positioning Accuracy of Satellite-Borne GNSS-R Specular Reflection Point on Sea Surface Based on the Ocean Tidal Correction Positioning Method
by Fan Wu, Wei Zheng, Zhaowei Li and Zongqiang Liu
Remote Sens. 2019, 11(13), 1626; https://0-doi-org.brum.beds.ac.uk/10.3390/rs11131626 - 09 Jul 2019
Cited by 8 | Viewed by 3662
Abstract
The positioning error of the specular reflection point is the main error source of Global Navigation Satellite System Reflectometry (GNSS-R) satellite sea surface altimetry. The existing specular reflection point geometric positioning methods do not consider the static-state elevation difference of tens of meters [...] Read more.
The positioning error of the specular reflection point is the main error source of Global Navigation Satellite System Reflectometry (GNSS-R) satellite sea surface altimetry. The existing specular reflection point geometric positioning methods do not consider the static-state elevation difference of tens of meters and the decimeter-level time-varying elevation difference between the reflection reference surface and the instantaneous sea surface. The resulting positioning error restricts the GNSS-R satellite sea surface altimetry from reaching cm-level high accuracy on the reference datum. Under the premise of the basic static-state elevation positioning error correction, reducing the time-varying elevation positioning error is the key to improving positioning accuracy. In this study, based on the principle of elevation correction of GNSS-R reflection reference surface, the main parameter that determines the real-time variation of sea surface height, ocean tide, is used to correct the specular reflection point from geoid to ocean tidal surface. The positioning error caused by the time-varying elevation error of the reflection reference surface is reduced, the positioning accuracy is improved, and the improvement is quantified. According to the research results, the ocean tidal correction positioning (OTCP) method improves the positioning accuracy by 0.31 m. The positioning accuracy improvement has a good correlation with the corresponding tidal height modulo, and the improvement is 1.07 times of the tidal height modulo. In the offshore, the tidal height gradient modulo is greater than the deep sea, the gradient of the tidal positioning correction has a good response to the tidal height gradient modulo, while the sensitivity of this response decreases in the deep sea. Full article
(This article belongs to the Special Issue Global Navigation Satellite Systems for Earth Observing System)
Show Figures

Graphical abstract

20 pages, 2363 KiB  
Article
Validation of Satellite, Reanalysis and RCM Data of Monthly Rainfall in Calabria (Southern Italy)
by Giulio Nils Caroletti, Roberto Coscarelli and Tommaso Caloiero
Remote Sens. 2019, 11(13), 1625; https://0-doi-org.brum.beds.ac.uk/10.3390/rs11131625 - 09 Jul 2019
Cited by 26 | Viewed by 3978
Abstract
Skills in reproducing monthly rainfall over Calabria (southern Italy) have been validated for the Climate Hazards group InfraRed Precipitation with Station data (CHIRPS) satellite data, the E-OBS dataset and 13 Global Climate Model-Regional Climate Model (GCM-RCM) combinations, belonging to the ENSEMBLES project output [...] Read more.
Skills in reproducing monthly rainfall over Calabria (southern Italy) have been validated for the Climate Hazards group InfraRed Precipitation with Station data (CHIRPS) satellite data, the E-OBS dataset and 13 Global Climate Model-Regional Climate Model (GCM-RCM) combinations, belonging to the ENSEMBLES project output set. To this aim, 73 rainfall series for the period 1951–1980 and 79 series for the period 1981–2010 have been selected from the database managed by Multi-Risk Functional Centre of the Regional Agency for Environmental Protection (Regione Calabria). The relative mean and standard deviation errors, and the Pearson correlation coefficient have been used as validation metrics. Results showed that CHIRPS satellite data (available only for the 1981–2010 validation period) and RCMs based on the ECHAM5 Global Climate performed better both in mean error and standard deviation error compared to other datasets. Moreover, a slight appreciable improvement in performance for all ECHAM5-based models and for the E-OBS dataset has been observed in the 1981–2010 time-period. The whole validation-and-assessment procedure applied in this work is general and easily applicable where ground data and gridded data are available. This procedure might help scientists and policy makers to select among available datasets those best suited for further applications, even in regions with complex orography and an inadequate amount of representative stations. Full article
Show Figures

Graphical abstract

24 pages, 7935 KiB  
Article
A New Method for Characterizing NOAA-20/S-NPP VIIRS Thermal Emissive Bands Response Versus Scan Using On-Orbit Pitch Maneuver Data
by Wenhui Wang, Changyong Cao and Slawomir Blonski
Remote Sens. 2019, 11(13), 1624; https://0-doi-org.brum.beds.ac.uk/10.3390/rs11131624 - 09 Jul 2019
Cited by 6 | Viewed by 3271
Abstract
The on-orbit calibration of Visible Infrared Imaging Radiometer Suite (VIIRS) Thermal Emissive Bands (TEB), onboard the National Oceanic and Atmospheric Administration-20 (NOAA-20) and the Suomi National Polar-orbiting Partnership (S-NPP) satellites, have been stable during nominal operations. However, larger than expected scan angle/scene temperature [...] Read more.
The on-orbit calibration of Visible Infrared Imaging Radiometer Suite (VIIRS) Thermal Emissive Bands (TEB), onboard the National Oceanic and Atmospheric Administration-20 (NOAA-20) and the Suomi National Polar-orbiting Partnership (S-NPP) satellites, have been stable during nominal operations. However, larger than expected scan angle/scene temperature dependent biases, relative to the co-located Cross-track Infrared Sounder (CrIS) observations, were observed in the NOAA-20 longwave infrared (LWIR) bands. The Response Versus Scan (RVS) effect—the variation of instrument reflectance of source radiance with scan angle, is a significant contributor to VIIRS calibration. TEB RVS is characterized using prelaunch test data and verified on-orbit using pitch maneuver data. This study presents a new method that characterizes VIIRS on-orbit TEB RVS at both Earth View (EV) and Space View (SV) scan angles simultaneously. This method was compared with an existing on-orbit RVS method (the Wu et al. method), which derives RVS at EV scan angles using pitch maneuver data and extrapolates SV RVS from EV. The new method derived on-orbit RVS differ from prelaunch values up to 1.0% at the beginning of scan in the NOAA-20 LWIR bands, and ~0.5% in S-NPP M15. VIIRS–CrIS inter-comparison results indicates that the new method derived on-orbit RVS can effectively minimize LWIR scan angle/scene temperature dependent biases, with scan averaged biases reduced from 0.40K to 0.15K for NOAA-20 LWIR bands, and from 0.24K to 0.08K for S-NPP M15. The Wu et al. method can also reduce the scan angle dependent biases, but at the expense of increasing the scene temperature dependent biases. Full article
(This article belongs to the Collection Visible Infrared Imaging Radiometers and Applications)
Show Figures

Graphical abstract

20 pages, 5343 KiB  
Article
Automatic Identification of Shrub-Encroached Grassland in the Mongolian Plateau Based on UAS Remote Sensing
by Yu Dong, Huimin Yan, Na Wang, Mei Huang and Yunfeng Hu
Remote Sens. 2019, 11(13), 1623; https://0-doi-org.brum.beds.ac.uk/10.3390/rs11131623 - 09 Jul 2019
Cited by 13 | Viewed by 3257
Abstract
Recently, the increasing shrub-encroached grassland in the Mongolian Plateau partly indicates grassland quality decline and degradation. Accurate shrub identification and regional difference analysis in shrub-encroached grassland are significant for ecological degradation research. Object-oriented filter (OOF) and digital surface model (DSM)-digital terrain model (DTM) [...] Read more.
Recently, the increasing shrub-encroached grassland in the Mongolian Plateau partly indicates grassland quality decline and degradation. Accurate shrub identification and regional difference analysis in shrub-encroached grassland are significant for ecological degradation research. Object-oriented filter (OOF) and digital surface model (DSM)-digital terrain model (DTM) analyses were combined to establish a high-accuracy automatic shrub identification algorithm (CODA), which made full use of remote sensing products by unmanned aircraft systems (UASs). The results show that: (1) The overall accuracy of CODA in the Grain for Green test area is 89.96%, which is higher than that of OOF (84.52%) and DSM-DTM (78.44%), mainly due to the effective elimination of interference factors (such as shrub-like highland, well-grown grassland in terrain-depression area, etc.) by CODA. (2) The accuracy (87.5%) of CODA in the typical steppe test area is lower than that (92.5%) in the desert steppe test area, which may be related to the higher community structure complexity of typical steppe. Besides, the shrub density is smaller, and the regional difference is more massive in the typical steppe test area. (3) The ground sampling distance for best CODA accuracy in the Grain for Green test area is about 15 cm, while it is below 3 cm in the typical and desert steppe test area. Full article
Show Figures

Graphical abstract

27 pages, 15535 KiB  
Article
A Lightweight Hyperspectral Image Anomaly Detector for Real-Time Mission
by Ning Ma, Ximing Yu, Yu Peng and Shaojun Wang
Remote Sens. 2019, 11(13), 1622; https://0-doi-org.brum.beds.ac.uk/10.3390/rs11131622 - 08 Jul 2019
Cited by 11 | Viewed by 3155
Abstract
In real-time onboard hyperspectral-image(HSI) anomalous targets detection, processing speed and accuracy are equivalently desirable which is hard to satisfy at the same time. To improve detection accuracy, deep learning based HSI anomaly detectors (ADs) are widely studied. However, their large scale network results [...] Read more.
In real-time onboard hyperspectral-image(HSI) anomalous targets detection, processing speed and accuracy are equivalently desirable which is hard to satisfy at the same time. To improve detection accuracy, deep learning based HSI anomaly detectors (ADs) are widely studied. However, their large scale network results in a massive computational burden. In this paper, to improve the detection throughput without sacrificing the accuracy, a pruning–quantization–anomaly–detector (P-Q-AD) is proposed by building an underlying constraint formulation to make a trade-off between accuracy and throughput. To solve this formulation, multi-objective optimization with nondominated sorting genetic algorithm II (NSGA-II) is employed to shrink the network. As a result, the redundant neurons are removed. A mixed precision network is implemented with a delicate customized fixed-point data expression to further improve the efficiency. In the experiments, the proposed P-Q-AD is implemented on two real HSI data sets and compared with three types of detectors. The results show that the performance of the proposed approach is no worse than those comparison detectors in terms of the receiver operating characteristic curve (ROC) and area under curve (AUC) value. For the onboard mission, the proposed P-Q-AD reaches over 4.5 × speedup with less than 0.5 % AUC loss compared with the floating-based detector. The pruning and the quantization approach in this paper can be referenced for designing the anomalous targets detectors for high efficiency. Full article
(This article belongs to the Section Remote Sensing Image Processing)
Show Figures

Graphical abstract

19 pages, 2871 KiB  
Article
An Effectiveness Evaluation Model for Satellite Observation and Data-Downlink Scheduling Considering Weather Uncertainties
by Siyue Zhang, Yiyong Xiao, Pei Yang, Yinglai Liu, Wenbing Chang and Shenghan Zhou
Remote Sens. 2019, 11(13), 1621; https://0-doi-org.brum.beds.ac.uk/10.3390/rs11131621 - 08 Jul 2019
Cited by 10 | Viewed by 4090
Abstract
Low Earth orbit (LEO) satellites play an important role in human space activities, and market demands for commercial uses of LEO satellites have been increasing rapidly in recent years. LEO satellites mainly consist of Earth observation satellites (EOSs), the major commercial applications of [...] Read more.
Low Earth orbit (LEO) satellites play an important role in human space activities, and market demands for commercial uses of LEO satellites have been increasing rapidly in recent years. LEO satellites mainly consist of Earth observation satellites (EOSs), the major commercial applications of which are various sorts of Earth observations, such as map making, crop growth assessment, and disaster surveillance. However, the success rates of observation tasks are influenced considerably by uncertainties in local weather conditions, inadequate sunlight, observation dip angle, and other practical factors. The available time windows (ATWs) suitable for observing given types of targets and for transmitting data back to ground receiver stations are relatively narrow. In order to utilize limited satellite resources efficiently and maximize their commercial benefits, it is necessary to evaluate the overall effectiveness of satellites and planned tasks considering various factors. In this paper, we propose a method for determining the ATWs considering the influence of sunlight angle, elevation angle, and the type of sensor equipped on the satellite. After that, we develop a satellite effectiveness evaluation (SEE) model for satellite observation and data-downlink scheduling (SODS) based on the Availability–Capacity–Profitability (ACP) framework, which is designed to evaluate the overall performance of satellites from the perspective of time resource utilization, the success rate of tasks, and profit return. The effects of weather uncertainties on the tasks’ success are considered in the SEE model, and the model can be applied to support the decision-makers on optimizing and improving task arrangements for EOSs. Finally, a case study is presented to demonstrate the effectiveness of the proposed method and verify the ACP-based SEE model. The obtained ATWs by the proposed method are compared with those by the Systems Tool Kit (STK), and the correctness of the method is thus validated. Full article
Show Figures

Figure 1

23 pages, 486 KiB  
Article
Analytical Relationship between Two-Band Spectral Vegetation Indices Measured at Multiple Sensors on a Parametric Representation of Soil Isoline Equations
by Kenta Taniguchi, Kenta Obata and Hiroki Yoshioka
Remote Sens. 2019, 11(13), 1620; https://0-doi-org.brum.beds.ac.uk/10.3390/rs11131620 - 08 Jul 2019
Cited by 2 | Viewed by 3310
Abstract
Differences between the wavelength band specifications of distinct sensors introduce systematic differences into the values of a spectral vegetation index (VI). Such relative errors must be minimized algorithmically after data acquisition, based on a relationship between the measurements. This study introduces a technique [...] Read more.
Differences between the wavelength band specifications of distinct sensors introduce systematic differences into the values of a spectral vegetation index (VI). Such relative errors must be minimized algorithmically after data acquisition, based on a relationship between the measurements. This study introduces a technique for deriving the analytical relationship between the VIs from two sensors. The derivation proceeds using a parametric form of the soil isoline equations, which relate the reflectances of two different wavelengths. First, the derivation steps are explained conceptually. Next, the conceptual steps are cast in a practical derivation by assuming a general form of the two-band VI. Finally, the derived expressions are demonstrated numerically using a coupled leaf and canopy radiative transfer model. The results confirm that the derived expression reduced the original differences between the VI values obtained from the two sensors, indicating the validity of the derived expressions. The derived expressions and numerical results suggested that the relationship between the VIs measured at different wavelengths varied with the soil reflectance spectrum beneath the vegetation canopy. These results indicate that caution is required when retrieving intersensor VI relationships over regions consisting of soil surfaces having distinctive spectra. Full article
(This article belongs to the Section Biogeosciences Remote Sensing)
Show Figures

Figure 1

19 pages, 4755 KiB  
Article
DCN-Based Spatial Features for Improving Parcel-Based Crop Classification Using High-Resolution Optical Images and Multi-Temporal SAR Data
by Ya’nan Zhou, Jiancheng Luo, Li Feng and Xiaocheng Zhou
Remote Sens. 2019, 11(13), 1619; https://0-doi-org.brum.beds.ac.uk/10.3390/rs11131619 - 08 Jul 2019
Cited by 27 | Viewed by 4326
Abstract
Spatial features retrieved from satellite data play an important role for improving crop classification. In this study, we proposed a deep-learning-based time-series analysis method to extract and organize spatial features to improve parcel-based crop classification using high-resolution optical images and multi-temporal synthetic aperture [...] Read more.
Spatial features retrieved from satellite data play an important role for improving crop classification. In this study, we proposed a deep-learning-based time-series analysis method to extract and organize spatial features to improve parcel-based crop classification using high-resolution optical images and multi-temporal synthetic aperture radar (SAR) data. Central to this method is the use of multiple deep convolutional networks (DCNs) to extract spatial features and to use the long short-term memory (LSTM) network to organize spatial features. First, a precise farmland parcel map was delineated from optical images. Second, hundreds of spatial features were retrieved using multiple DCNs from preprocessed SAR images and overlaid onto the parcel map to construct multivariate time-series of crop growth for parcels. Third, LSTM-based network structures for organizing these time-series features were constructed to produce a final parcel-based classification map. The method was applied to a dataset of high-resolution ZY-3 optical images and multi-temporal Sentinel-1A SAR data to classify crop types in the Hunan Province of China. The classification results, showing an improvement of greater than 5.0% in overall accuracy relative to methods without spatial features, demonstrated the effectiveness of the proposed method in extracting and organizing spatial features for improving parcel-based crop classification. Full article
(This article belongs to the Special Issue Remote Sensing for Crop Mapping)
Show Figures

Figure 1

17 pages, 8376 KiB  
Article
Assimilating Soil Moisture Retrieved from Sentinel-1 and Sentinel-2 Data into WOFOST Model to Improve Winter Wheat Yield Estimation
by Wen Zhuo, Jianxi Huang, Li Li, Xiaodong Zhang, Hongyuan Ma, Xinran Gao, Hai Huang, Baodong Xu and Xiangming Xiao
Remote Sens. 2019, 11(13), 1618; https://0-doi-org.brum.beds.ac.uk/10.3390/rs11131618 - 08 Jul 2019
Cited by 74 | Viewed by 7439
Abstract
Crop yield estimation at a regional scale over a long period of time is of great significance to food security. In past decades, the integration of remote sensing observations and crop growth models has been recognized as a promising approach for crop growth [...] Read more.
Crop yield estimation at a regional scale over a long period of time is of great significance to food security. In past decades, the integration of remote sensing observations and crop growth models has been recognized as a promising approach for crop growth monitoring and yield estimation. Optical remote sensing data are susceptible to cloud and rain, while synthetic aperture radar (SAR) can penetrate through clouds and has all-weather capabilities. This allows for more reliable and consistent crop monitoring and yield estimation in terms of radar sensor data. The aim of this study is to improve the accuracy for winter wheat yield estimation by assimilating time series soil moisture images, which are retrieved by a water cloud model using SAR and optical data as input, into the crop model. In this study, SAR images were acquired by C-band SAR sensors boarded on Sentinel-1 satellites and optical images were obtained from a Sentinel-2 multi-spectral instrument (MSI) for Hengshui city of Hebei province in China. Remote sensing data and ground data were all collected during the main growing season of winter wheat. Both the normalized difference vegetation index (NDVI), derived from Sentinel-2, and backscattering coefficients and polarimetric indicators, computed from Sentinel-1, were used in the water cloud model to derive time series soil moisture (SM) images. To improve the prediction of crop yields at the field scale, we incorporated remotely sensed soil moisture into the World Food Studies (WOFOST) model using the Ensemble Kalman Filter (EnKF) algorithm. In general, the trend of soil moisture inversion was consistent with the ground measurements, with the coefficient of determination (R2) equal to 0.45, 0.53, and 0.49, respectively, and RMSE was 9.16%, 7.43%, and 8.53%, respectively, for three observation dates. The winter wheat yield estimation results showed that the assimilation of remotely sensed soil moisture improved the correlation of observed and simulated yields (R2 = 0.35; RMSE =934 kg/ha) compared to the situation without data assimilation (R2 = 0.21; RMSE = 1330 kg/ha). Consequently, the results of this study demonstrated the potential and usefulness of assimilating SM retrieved from both Sentinel-1 C-band SAR and Sentinel-2 MSI optical remote sensing data into WOFOST model for winter wheat yield estimation and could also provide a reference for crop yield estimation with data assimilation for other crop types. Full article
Show Figures

Graphical abstract

22 pages, 7072 KiB  
Article
Deep Feature Fusion with Integration of Residual Connection and Attention Model for Classification of VHR Remote Sensing Images
by Jicheng Wang, Li Shen, Wenfan Qiao, Yanshuai Dai and Zhilin Li
Remote Sens. 2019, 11(13), 1617; https://0-doi-org.brum.beds.ac.uk/10.3390/rs11131617 - 08 Jul 2019
Cited by 28 | Viewed by 5440
Abstract
The classification of very-high-resolution (VHR) remote sensing images is essential in many applications. However, high intraclass and low interclass variations in these kinds of images pose serious challenges. Fully convolutional network (FCN) models, which benefit from a powerful feature learning ability, have shown [...] Read more.
The classification of very-high-resolution (VHR) remote sensing images is essential in many applications. However, high intraclass and low interclass variations in these kinds of images pose serious challenges. Fully convolutional network (FCN) models, which benefit from a powerful feature learning ability, have shown impressive performance and great potential. Nevertheless, only classification results with coarse resolution can be obtained from the original FCN method. Deep feature fusion is often employed to improve the resolution of outputs. Existing strategies for such fusion are not capable of properly utilizing the low-level features and considering the importance of features at different scales. This paper proposes a novel, end-to-end, fully convolutional network to integrate a multiconnection ResNet model and a class-specific attention model into a unified framework to overcome these problems. The former fuses multilevel deep features without introducing any redundant information from low-level features. The latter can learn the contributions from different features of each geo-object at each scale. Extensive experiments on two open datasets indicate that the proposed method can achieve class-specific scale-adaptive classification results and it outperforms other state-of-the-art methods. The results were submitted to the International Society for Photogrammetry and Remote Sensing (ISPRS) online contest for comparison with more than 50 other methods. The results indicate that the proposed method (ID: SWJ_2) ranks #1 in terms of overall accuracy, even though no additional digital surface model (DSM) data that were offered by ISPRS were used and no postprocessing was applied. Full article
(This article belongs to the Special Issue Convolutional Neural Networks Applications in Remote Sensing)
Show Figures

Graphical abstract

16 pages, 8899 KiB  
Article
Validation of 7 Years in-Flight HY-2A Calibration Microwave Radiometer Products Using Numerical Weather Model and Radiosondes
by Zhilu Wu, Jungang Wang, Yanxiong Liu, Xiufeng He, Yang Liu and Wenxue Xu
Remote Sens. 2019, 11(13), 1616; https://0-doi-org.brum.beds.ac.uk/10.3390/rs11131616 - 08 Jul 2019
Cited by 5 | Viewed by 4678
Abstract
Haiyang-2A (HY-2A) has been working in-flight for over seven years, and the accuracy of HY-2A calibration microwave radiometer (CMR) data is extremely important for the wet troposphere delay correction (WTC) in sea surface height (SSH) determination. We present a comprehensive evaluation of the [...] Read more.
Haiyang-2A (HY-2A) has been working in-flight for over seven years, and the accuracy of HY-2A calibration microwave radiometer (CMR) data is extremely important for the wet troposphere delay correction (WTC) in sea surface height (SSH) determination. We present a comprehensive evaluation of the HY-2A CMR observation using the numerical weather model (NWM) for all the data available period from October 2011 to February 2018, including the WTC and the precipitable water vapor (PWV). The ERA(ECMWF Re-Analysis)-Interim products from European Centre for Medium-Range Weather Forecasts (ECMWF) are used for the validation of HY-2A WTC and PWV products. In general, a global agreement of root-mean-square (RMS) of 2.3 cm in WTC and 3.6 mm in PWV are demonstrated between HY-2A observation and ERA-Interim products. Systematic biases are revealed where before 2014 there was a positive WTC/PWV bias and after that, a negative one. Spatially, HY-2A CMR products show a larger bias in polar regions compared with mid-latitude regions and tropical regions and agree better in the Antarctic than in the Arctic with NWM. Moreover, HY-2A CMR products have larger biases in the coastal area, which are all caused by the brightness temperature (TB) contamination from land or sea ice. Temporally, the WTC/PWV biases increase from October 2011 to March 2014 with a systematic bias over 1 cm in WTC and 2 mm in PWV, and the maximum RMS values of 4.62 cm in WTC and 7.61 mm in PWV occur in August 2013, which is because of the unsuitable retrieval coefficients and systematic TB measurements biases from 37 GHz band. After April 2014, the TB bias is corrected, HY-2A CMR products agree very well with NWM from April 2014 to May 2017 with the average RMS of 1.68 cm in WTC and 2.65 mm in PWV. However, since June 2017, TB measurements from the 18.7 GHz band become unstable, which led to the huge differences between HY-2A CMR products and the NWM with an average RMS of 2.62 cm in WTC and 4.33 mm in PWV. HY-2A CMR shows high accuracy when three bands work normally and further calibration for HY-2A CMR is in urgent need. Furtherly, 137 global coastal radiosonde stations were used to validate HY-2A CMR. The validation based on radiosonde data shows the same variation trend in time of HY-2A CMR compared to the results from ECMWF, which verifies the results from ECMWF. Full article
(This article belongs to the Special Issue Global Navigation Satellite Systems for Earth Observing System)
Show Figures

Figure 1

27 pages, 8701 KiB  
Article
Urban Landscape Change Analysis Using Local Climate Zones and Object-Based Classification in the Salt Lake Metro Region, Utah, USA
by Jed Collins and Iryna Dronova
Remote Sens. 2019, 11(13), 1615; https://0-doi-org.brum.beds.ac.uk/10.3390/rs11131615 - 08 Jul 2019
Cited by 24 | Viewed by 6860
Abstract
Urban areas globally are vulnerable to warming climate trends exacerbated by their growing populations and heat island effects. The Local Climate Zone (LCZ) typology has become a popular framework for characterizing urban microclimates in different regions using various classification methods, including a widely [...] Read more.
Urban areas globally are vulnerable to warming climate trends exacerbated by their growing populations and heat island effects. The Local Climate Zone (LCZ) typology has become a popular framework for characterizing urban microclimates in different regions using various classification methods, including a widely adopted pixel-based protocol by the World Urban Database and Access Portal Tools (WUDAPT) Project. However, few studies to date have explored the potential of object-based image analysis (OBIA) to facilitate classification of LCZs given their inherent complexity, and few studies have further used the LCZ framework to analyze land cover changes in urban areas over time. This study classified LCZs in the Salt Lake Metro Region, Utah, USA for 1993 and 2017 using a supervised object-based analysis of Landsat satellite imagery and assessed their change during this time frame. The overall accuracy, measured for the most recent classification period (2017), was equal to 64% across 12 LCZs, with most of the error resulting from similarities among highly developed LCZs and non-developed classes with sparse or low-stature vegetation. The observed 1993–2017 changes in LCZs indicated a regional tendency towards primarily suburban, open low-rise development, and large low-rise and paved classes. However, despite the potential for local cooling with landscape transitions likely to increase vegetation cover and irrigation compared to pre-development conditions, summer averages of Landsat-derived top-of-atmosphere brightness temperatures showed a pronounced warming between 1992–1994 and 2016–2018 across the study region, with a 0.1–2.9 °C increase among individual LCZs. Our results indicate that future applications of LCZs towards urban change analyses should develop a stronger understanding of LCZ microclimate sensitivity to changes in size and configuration of urban neighborhoods and regions. Furthermore, while OBIA is promising for capturing the heterogeneous and multi-scale nature of LCZs, its applications could be strengthened by adopting more generalizable approaches for LCZ-relevant segmentation and validation, and by incorporating active remote sensing data to account for the 3D complexity of urban areas. Full article
(This article belongs to the Section Urban Remote Sensing)
Show Figures

Graphical abstract

23 pages, 1195 KiB  
Article
Gaussian Processes for Vegetation Parameter Estimation from Hyperspectral Data with Limited Ground Truth
by Utsav B. Gewali, Sildomar T. Monteiro and Eli Saber
Remote Sens. 2019, 11(13), 1614; https://0-doi-org.brum.beds.ac.uk/10.3390/rs11131614 - 08 Jul 2019
Cited by 19 | Viewed by 4225
Abstract
An important application of airborne- and satellite-based hyperspectral imaging is the mapping of the spatial distribution of vegetation biophysical and biochemical parameters in an environment. Statistical models, such as Gaussian processes, have been very successful for modeling vegetation parameters from captured spectra, however [...] Read more.
An important application of airborne- and satellite-based hyperspectral imaging is the mapping of the spatial distribution of vegetation biophysical and biochemical parameters in an environment. Statistical models, such as Gaussian processes, have been very successful for modeling vegetation parameters from captured spectra, however their performance is highly dependent on the amount of available ground truth. This is a problem because it is generally expensive to obtain ground truth information due to difficulties and costs associated with sample collection and analysis. In this paper, we present two Gaussian processes based approaches for improving the accuracy of vegetation parameter retrieval when ground truth is limited. The first is the adoption of covariance functions based on well-established metrics, such as, spectral angle and spectral correlation, which are known to be better measures of similarity for spectral data owing to their resilience to spectral variabilities. The second is the joint modeling of related vegetation parameters by multitask Gaussian processes so that the prediction accuracy of the vegetation parameter of interest can be improved with the aid of related vegetation parameters for which a larger set of ground truth is available. We experimentally demonstrate the efficacy of the proposed methods against existing approaches on three real-world hyperspectral datasets and one synthetic dataset. Full article
Show Figures

Graphical abstract

50 pages, 7469 KiB  
Article
Optimal Cyanobacterial Pigment Retrieval from Ocean Colour Sensors in a Highly Turbid, Optically Complex Lake
by Caitlin A.L. Riddick, Peter D. Hunter, José Antonio Domínguez Gómez, Victor Martinez-Vicente, Mátyás Présing, Hajnalka Horváth, Attila W. Kovács, Lajos Vörös, Eszter Zsigmond and Andrew N. Tyler
Remote Sens. 2019, 11(13), 1613; https://0-doi-org.brum.beds.ac.uk/10.3390/rs11131613 - 07 Jul 2019
Cited by 17 | Viewed by 5176
Abstract
To date, several algorithms for the retrieval of cyanobacterial phycocyanin (PC) from ocean colour sensors have been presented for inland waters, all of which claim to be robust models. To address this, we conducted a comprehensive comparison to identify the optimal algorithm for [...] Read more.
To date, several algorithms for the retrieval of cyanobacterial phycocyanin (PC) from ocean colour sensors have been presented for inland waters, all of which claim to be robust models. To address this, we conducted a comprehensive comparison to identify the optimal algorithm for retrieval of PC concentrations in the highly optically complex waters of Lake Balaton (Hungary). MEdium Resolution Imaging Spectrometer (MERIS) top-of-atmosphere radiances were first atmospherically corrected using the Self-Contained Atmospheric Parameters Estimation for MERIS data v.B2 (SCAPE-M_B2). Overall, the Simis05 semi-analytical algorithm outperformed more complex inversion algorithms, providing accurate estimates of PC up to ±7 days from the time of satellite overpass during summer cyanobacteria blooms (RMSElog < 0.33). Same-day retrieval of PC also showed good agreement with cyanobacteria biomass (R2 > 0.66, p < 0.001). In-depth analysis of the Simis05 algorithm using in situ measurements of inherent optical properties (IOPs) revealed that the Simis05 model overestimated the phytoplankton absorption coefficient [aph(λ)] by a factor of ~2. However, these errors were compensated for by underestimation of the mass-specific chlorophyll absorption coefficient [a*chla(λ)]. This study reinforces the need for further validation of algorithms over a range of optical water types in the context of the recently launched Ocean Land Colour Instrument (OLCI) onboard Sentinel-3. Full article
Show Figures

Graphical abstract

29 pages, 14562 KiB  
Article
Evaluation of Earth Observation Solutions for Namibia’s SDG Monitoring System
by Vincent Mariathasan, Enrico Bezuidenhoudt and K. Raymond Olympio
Remote Sens. 2019, 11(13), 1612; https://0-doi-org.brum.beds.ac.uk/10.3390/rs11131612 - 07 Jul 2019
Cited by 16 | Viewed by 6155
Abstract
In recent years, with more open data platforms and tools available to store and process satellite imagery, Earth Observation data have become widely accessible and usable especially for countries previously not in the possession of tasking rights to satellites and the needed processing [...] Read more.
In recent years, with more open data platforms and tools available to store and process satellite imagery, Earth Observation data have become widely accessible and usable especially for countries previously not in the possession of tasking rights to satellites and the needed processing capacity. Due to its ideal scanning and acquisition conditions for low cloud coverage imagery, Namibia aims to make use of this new development and integrate Earth Observation data into its national monitoring system of sustainable development goals (SDG). The purpose of this study is to assess the potential of open source tools and global datasets to estimate the national SDG indicators on Change of water-related ecosystems (6.6.1), Rural population with access to roads (9.1.1), Forest coverage (15.1.1) and Land degradation (15.3.1). The results are set into perspective of existing information in each particular sector. The study shows that, in the absence of in-situ measurements or data collected through surveys, the Earth Observation-based results represent a high potential to supplement the national statistics for Namibia or to serve as primary data sources once validated through ground-truthing. Furthermore, examples are given for the limitations of the assessed Earth Observation solutions in the context of Namibia. Hence, the study also serves as valuable input for discussions on a consensus on national definitions and standards by all stakeholders responsible for releasing official statistics. Full article
(This article belongs to the Special Issue EO Solutions to Support Countries Implementing the SDGs)
Show Figures

Graphical abstract

22 pages, 3682 KiB  
Article
Evaluation of the Snow Albedo Retrieved from the Snow Kernel Improved the Ross-Roujean BRDF Model
by Anxin Ding, Ziti Jiao, Yadong Dong, Xiaoning Zhang, Jouni I. Peltoniemi, Linlu Mei, Jing Guo, Siyang Yin, Lei Cui, Yaxuan Chang and Rui Xie
Remote Sens. 2019, 11(13), 1611; https://0-doi-org.brum.beds.ac.uk/10.3390/rs11131611 - 06 Jul 2019
Cited by 13 | Viewed by 4486
Abstract
The original kernel-driven bidirectional reflectance distribution function (BRDF) models were developed based on soil-vegetation systems. To further improve the ability of the models to characterize the snow surface scattering properties, a snow kernel was derived from the asymptotic radiative transfer (ART) model and [...] Read more.
The original kernel-driven bidirectional reflectance distribution function (BRDF) models were developed based on soil-vegetation systems. To further improve the ability of the models to characterize the snow surface scattering properties, a snow kernel was derived from the asymptotic radiative transfer (ART) model and used in the kernel-driven BRDF model framework. However, there is a need to further evaluate the influence of using this snow kernel to improve the original kernel-driven models in snow albedo retrieval applications. The aim of this study is to perform such an evaluation using a variety of snow BRDF data. The RossThick-Roujean (RTR) model is used as a framework for taking in the new snow kernel (hereafter named the RTS model) since the Roujean geometric-optical (GO) kernel captures a neglectable hotspot effect and represents a more prominent dome-shaped BRDF, especially at a small solar zenith angle (SZA). We obtained the following results: (1) The RTR model has difficulties in reconstructing the snow BRDF shape, especially at large SZAs, which tends to underestimate the reflectance in the forward direction and overestimate reflectance in the backward direction for various data sources. In comparison, the RTS model performs very well in fitting snow BRDF data and shows high accuracy for all data. (2) The RTR model retrieved snow albedos at SZAs = 30°–70° are underestimated by 0.71% and 0.69% in the red and near-infrared (NIR) bands, respectively, compared with the simulation results of the bicontinuous photon tracking (bic-PT) model, which serve as “real” values. However, the albedo retrieved by the RTS model is significantly improved and generally agrees well with the simulation results of the bic-PT model, although the improved model still somewhat underestimates the albedo by 0.01% in the red band and overestimates the albedo by 0.05% in the NIR band, respectively, at SZAs = 30°–70°, which may be negligible. (3) The albedo derived by these two models shows a high correlation (R2 > 0.9) between the field-measured and Polarization and Directionality of the Earth’s Reflectances (POLDER) data, especially for the black-sky albedo. However, the albedo derived using the RTR model is significantly underestimated compared with the RTS model. The RTR model underestimates the black-sky albedo (white-sky albedo) retrievals by 0.62% (1.51%) and 0.93% (2.08%) in the red and NIR bands, respectively, for the field-measured data. The shortwave black-sky and white-sky albedos derived using the RTR model for the POLDER data are underestimated by 1.43% and 1.54%, respectively, compared with the RTS model. These results indicate that the snow kernel in the kernel-driven BRDF model frame is more accurate in snow albedo retrievals and has the potential for application in the field of the regional and global energy budget. Full article
Show Figures

Figure 1

21 pages, 8688 KiB  
Article
The Reduction Method of Bathymetric Datasets that Preserves True Geodata
by Marta Wlodarczyk-Sielicka, Andrzej Stateczny and Jacek Lubczonek
Remote Sens. 2019, 11(13), 1610; https://0-doi-org.brum.beds.ac.uk/10.3390/rs11131610 - 06 Jul 2019
Cited by 9 | Viewed by 3775
Abstract
Water areas occupy over 70 percent of the Earth’s surface and are constantly subject to research and analysis. Often, hydrographic remote sensors are used for such research, which allow for the collection of information on the shape of the water area bottom and [...] Read more.
Water areas occupy over 70 percent of the Earth’s surface and are constantly subject to research and analysis. Often, hydrographic remote sensors are used for such research, which allow for the collection of information on the shape of the water area bottom and the objects located on it. Information about the quality and reliability of the depth data is important, especially during coastal modelling. In-shore areas are liable to continuous transformations and they must be monitored and analyzed. Presently, bathymetric geodata are usually collected via modern hydrographic systems and comprise very large data point sequences that must then be connected using long and laborious processing sequences including reduction. As existing bathymetric data reduction methods utilize interpolated values, there is a clear requirement to search for new solutions. Considering the accuracy of bathymetric maps, a new method is presented here that allows real geodata to be maintained, specifically position and depth. This study presents a description of a developed method for reducing geodata while maintaining true survey values. Full article
(This article belongs to the Special Issue Remote Sensing Applications in Coastal Environment)
Show Figures

Figure 1

16 pages, 2735 KiB  
Article
The Inter-Calibration of the DSCOVR EPIC Imager with Aqua-MODIS and NPP-VIIRS
by David Doelling, Conor Haney, Rajendra Bhatt, Benjamin Scarino and Arun Gopalan
Remote Sens. 2019, 11(13), 1609; https://0-doi-org.brum.beds.ac.uk/10.3390/rs11131609 - 06 Jul 2019
Cited by 9 | Viewed by 3066
Abstract
The Deep Space Climate Observatory (DSCOVR) through the earth polychromatic imaging camera (EPIC) continuously observes the illuminated disk from the Lagrange-1 point. The EPIC sensor was designed to monitor the diurnal variation of ozone, clouds, aerosols, and vegetation, especially those features that benefit [...] Read more.
The Deep Space Climate Observatory (DSCOVR) through the earth polychromatic imaging camera (EPIC) continuously observes the illuminated disk from the Lagrange-1 point. The EPIC sensor was designed to monitor the diurnal variation of ozone, clouds, aerosols, and vegetation, especially those features that benefit from observation near-backscatter conditions. The EPIC sensor does not contain any onboard calibration systems. This study describes the inter-calibration of EPIC channels 5 (0.44 µm), 6 (0.55 µm), 7 (0.68 µm), and 10 (0.78 µm) with respect to Aqua-MODIS and NPP-VIIRS. The calibration is transferred using coincident ray-matched reflectance pairs over all-sky tropical ocean (ATO) and deep convective cloud (DCC) targets. A robust and automated image-alignment technique based on feature matching was formulated to improve the navigation quality of the EPIC images. The EPIC V02 dataset exhibits improved navigation over V01. As the visible channels display similar spatial features, a single visible channel can be used to co-register the remaining visible bands. The VIIRS-referenced EPIC ATO and DCC ray-matched calibration coefficients are within 0.3%. The EPIC four-year calibration trends based on VIIRS are within 0.15%/year. The MODIS-based EPIC calibration coefficients were compared against the Geogdzhayev and Marshak 2018 published calibration coefficients and were found to be within 1.6%. Full article
(This article belongs to the Special Issue Remote Sensing: 10th Anniversary)
Show Figures

Figure 1

21 pages, 1543 KiB  
Article
Pixel Size and Revisit Rate Requirements for Monitoring Power Plant CO2 Emissions from Space
by Tim Hill and Ray Nassar
Remote Sens. 2019, 11(13), 1608; https://0-doi-org.brum.beds.ac.uk/10.3390/rs11131608 - 06 Jul 2019
Cited by 23 | Viewed by 4804
Abstract
The observational requirements for space-based quantification of anthropogenic CO 2 emissions are of interest to space agencies and related organizations that may contribute to a possible satellite constellation to support emission monitoring in the future. We assess two key observing characteristics for space-based [...] Read more.
The observational requirements for space-based quantification of anthropogenic CO 2 emissions are of interest to space agencies and related organizations that may contribute to a possible satellite constellation to support emission monitoring in the future. We assess two key observing characteristics for space-based monitoring of CO2 emissions: pixel size and revisit rate, and we introduce a new method utilizing multiple images simultaneously to significantly improve emission estimates. The impact of pixel size ranging from 2–10 km for space-based imaging spectrometers is investigated using plume model simulations, accounting for biases in the observations. Performance of rectangular pixels is compared to square pixels of equal area. The findings confirm the advantage of the smallest pixels in this range and the advantage of square pixels over rectangular pixels. A method of averaging multiple images is introduced and demonstrated to be able to estimate emissions from small sources when the individual images are unable to distinguish the plume. Due to variability in power plant emissions, results from a single overpass cannot be directly extrapolated to annual emissions, the most desired timescale for regulatory purposes. We investigate the number of overpasses required to quantify annual emissions with a given accuracy, based on the mean variability from the 50 highest emitting US power plants. Although the results of this work alone are not sufficient to define the full architecture of a future CO 2 monitoring constellation, when considered along with other studies, they may assist in informing the design of a space-based system to support anthropogenic CO 2 emission monitoring. Full article
(This article belongs to the Special Issue Remote Sensing of Carbon Dioxide and Methane in Earth’s Atmosphere)
Show Figures

Figure 1

19 pages, 6924 KiB  
Article
Experimental Investigation of Ocean Wave Measurement Using Short-Range K-Band Radar: Dock-Based and Boat-Based Wind Wave Measurements
by Jian Cui, Ralf Bachmayer, Brad de Young and Weimin Huang
Remote Sens. 2019, 11(13), 1607; https://0-doi-org.brum.beds.ac.uk/10.3390/rs11131607 - 06 Jul 2019
Cited by 5 | Viewed by 4037
Abstract
In this paper, an ocean wave measurement technique and a newly developed short-range K-band radar are tested. In previous work, the technique and its feasibility were studied based on numerical simulations and wave tank experiments, while its performance at sea was still unknown. [...] Read more.
In this paper, an ocean wave measurement technique and a newly developed short-range K-band radar are tested. In previous work, the technique and its feasibility were studied based on numerical simulations and wave tank experiments, while its performance at sea was still unknown. Surface current, Stokes drift, and wave breaking can greatly complicate interpreting radar backscatters. The feasibility of the technique needed to be further investigated with sea experiments. Experiments were carried out at a stationary site and from a moving platform. The short-range K-band radar transmitted continuous wave and received backscatters at low-grazing angles. The Bragg-scattering from the radar’s effective footprint dominated the backscatters. The Doppler shift frequency of the Bragg-scattering was attributed to the phase velocity of Bragg waves and modulated by the surface motions induced by current, Stokes drift, platform, and gravity waves. These sources of the Doppler shift frequency were analyzed, and the components induced by wind waves were successfully retrieved and converted into wave spectra that were consistent with the measurements of wave rider buoy. The experimental investigation further validated the feasibility of using short-range K-band radar to measure ocean waves. Full article
(This article belongs to the Section Environmental Remote Sensing)
Show Figures

Graphical abstract

12 pages, 2407 KiB  
Technical Note
Adjustment of Transceiver Lever Arm Offset and Sound Speed Bias for GNSS-Acoustic Positioning
by Guanxu Chen, Yang Liu, Yanxiong Liu, Ziwen Tian and Menghao Li
Remote Sens. 2019, 11(13), 1606; https://0-doi-org.brum.beds.ac.uk/10.3390/rs11131606 - 05 Jul 2019
Cited by 26 | Viewed by 5806
Abstract
Global Navigation Satellite System—Acoustic (GNSS-A) positioning is the main technique for seafloor geodetic positioning. A transceiver lever arm offset and sound velocity bias in seawater are the main systematic errors of the GNSS-A positioning technique. Based on data from a sea trial in [...] Read more.
Global Navigation Satellite System—Acoustic (GNSS-A) positioning is the main technique for seafloor geodetic positioning. A transceiver lever arm offset and sound velocity bias in seawater are the main systematic errors of the GNSS-A positioning technique. Based on data from a sea trial in shallow water, this paper studies the functional model of GNSS-A positioning. The impact of the two systematic errors on seafloor positioning is analysed and corresponding processing methods are proposed. The results show that the offset in the lever arm measurement should be parameterised in the observation equation. Given the high correlation between the vertical lever arm offset and the vertical coordinate of the seafloor station, a sample search method was introduced to fix the vertical offset correction. If the calibration of the sound velocity profiler cannot be ensured, the correction parameter of the sound velocity bias should be solved. According to the refined functional model and corrections, the position of a seafloor station in shallow water can be determined with a precision of better than 1 cm. Full article
(This article belongs to the Special Issue Global Navigation Satellite Systems for Earth Observing System)
Show Figures

Figure 1

17 pages, 4157 KiB  
Article
A Priori Solar Radiation Pressure Model for BeiDou-3 MEO Satellites
by Xingyuan Yan, Chenchen Liu, Guanwen Huang, Qin Zhang, Le Wang, Zhiwei Qin and Shichao Xie
Remote Sens. 2019, 11(13), 1605; https://0-doi-org.brum.beds.ac.uk/10.3390/rs11131605 - 05 Jul 2019
Cited by 25 | Viewed by 4026
Abstract
Due to the cuboid satellite body of BeiDou-3 satellites, the accuracy of their orbit showed a trend of systematic variation with the sun-satellite-earth angle (ε) using the Extend CODE Orbit Model (ECOM1). Therefore, an a priori cuboid box-wing model (named the cuboid model) [...] Read more.
Due to the cuboid satellite body of BeiDou-3 satellites, the accuracy of their orbit showed a trend of systematic variation with the sun-satellite-earth angle (ε) using the Extend CODE Orbit Model (ECOM1). Therefore, an a priori cuboid box-wing model (named the cuboid model) is necessary to compensate ECOM1. Considering that the body-dimensions and optical properties of the BeiDou-3 satellites used to construct the box-wing model have not yet been fully released, the adjustable box-wing model (ABW) was used for precise orbit determination (POD). The a priori cuboid box-wing model was directly estimated by the precision radiation accelerations, obtained from ABW POD. When using ECOM1 model, for 14 < β < 40°, a linear systematic variation of D0 related to the elevation of the sun above the orbital plane (β-angle) with a slope of 0.048 nm/s2/°, was found for C30. After adding the cuboid model to assist ECOM1 (named Cuboid + ECOM1), the slope was reduced to 0.005 nm/s2/°, and for C20 satellite, the standard deviation (STD) of D0 was improved, from 1.28 to 0.85 nm/s2 (34%). For satellite laser ranging (SLR) validation, when using the ECOM1 model, the systematic variation with the ε angle was about 14 cm for C20 and C30. After using the Cuboid + ECOM1 model, the variation was significantly reduced to about 5 cm. For C20 and C21, compared with the ECOM1 model, the root mean square (RMS) of the ECOM2 and Cuboid + ECOM1 model was improved by about 0.54 (10.3%) and 0.43 cm (8.7%). For C29 and C30, the RMS of ECOM2 and Cuboid + ECOM1 model was improved for about 0.7 (10.9%) and 1.6 cm (25.6%). Finally, the RMS of the SLR residuals of 4.37 to 4.88 cm was achieved for BeiDou-3 POD. Full article
(This article belongs to the Special Issue Global Navigation Satellite Systems for Earth Observing System)
Show Figures

Graphical abstract

22 pages, 27173 KiB  
Article
An End-to-End Conditional Random Fields and Skip-Connected Generative Adversarial Segmentation Network for Remote Sensing Images
by Chu He, Peizhang Fang, Zhi Zhang, Dehui Xiong and Mingsheng Liao
Remote Sens. 2019, 11(13), 1604; https://0-doi-org.brum.beds.ac.uk/10.3390/rs11131604 - 05 Jul 2019
Cited by 17 | Viewed by 3852
Abstract
Semantic segmentation is an important process of scene recognition with deep learning frameworks achieving state of the art results, thus gaining much attention from the remote sensing community. In this paper, an end-to-end conditional random fields generative adversarial segmentation network is proposed. Three [...] Read more.
Semantic segmentation is an important process of scene recognition with deep learning frameworks achieving state of the art results, thus gaining much attention from the remote sensing community. In this paper, an end-to-end conditional random fields generative adversarial segmentation network is proposed. Three key factors of this algorithm are as follows. First, the network combines generative adversarial network and Bayesian framework to realize the estimation from the prior probability to the posterior probability. Second, the skip connected encoder-decoder network is combined with CRF layer to implement end-to-end network training. Finally, the adversarial loss and the cross-entropy loss guide the training of the segmentation network through back propagation. The experimental results show that our proposed method outperformed FCN in terms of mIoU for 0.0342 and 0.11 on two data sets, respectively. Full article
(This article belongs to the Section Remote Sensing Image Processing)
Show Figures

Graphical abstract

2 pages, 416 KiB  
Correction
Correction: Z. Liu and Y. Liu. Does Anthropogenic Land Use Change Play a Role in Changes of Precipitation Frequency and Intensity over the Loess Plateau of China? Remote Sens. 2018, 10, 1818
by Zhengjia Liu and Yansui Liu
Remote Sens. 2019, 11(13), 1603; https://0-doi-org.brum.beds.ac.uk/10.3390/rs11131603 - 05 Jul 2019
Cited by 2 | Viewed by 2436
Abstract
The original version of the paper [...] Full article
Show Figures

Figure 1

30 pages, 8557 KiB  
Article
Influence of Scanner Position and Plot Size on the Accuracy of Tree Detection and Diameter Estimation Using Terrestrial Laser Scanning on Forest Inventory Plots
by Christoph Gollob, Tim Ritter, Clemens Wassermann and Arne Nothdurft
Remote Sens. 2019, 11(13), 1602; https://0-doi-org.brum.beds.ac.uk/10.3390/rs11131602 - 05 Jul 2019
Cited by 47 | Viewed by 5248
Abstract
This research tested how different scanner positions and sample plot sizes affect the tree detection and diameter measurement in forest inventories. For this, a multistage density-based clustering approach was further developed for the automatic mapping of tree positions and simultaneously applied with automatic [...] Read more.
This research tested how different scanner positions and sample plot sizes affect the tree detection and diameter measurement in forest inventories. For this, a multistage density-based clustering approach was further developed for the automatic mapping of tree positions and simultaneously applied with automatic measurements of tree diameters. This further development of the algorithm reduced the proportion of falsely detected tree locations by about 64%. The algorithms were tested in different settings with respect to the number and spatial alignment of scanner positions and under manifold forest conditions, covering different age classes and a mixture of scenarios, and representing a broad gradient of structural complexity. For circular sample plots with a maximum radius of 20 m, the tree mapping algorithm showed a detection rate of 82.4% with seven scanner positions at the vertices of a hexagon plus the center coordinates, and 68.3% with four scanner positions aligned in a triangle plus the center. Detection rates were significantly increased with smaller maximum radii. Thus, with a maximum radius of 10 m, the hexagon setting yielded a detection rate of 90.5% and the triangle 92%. Other alignments of scanner positions were also tested, but proved to be either unfavorable or too labor-intensive. The commission rates were on average less than 3%. The root mean square error (RMSE) of the dbh (diameter at breast height) measurement was between 2.66 cm and 4.18 cm for the hexagon and between 3.0 cm and 4.7 cm for the triangle design. The robustness of the algorithm was also demonstrated via tests by means of an international benchmark dataset. It has been shown that the number of stems per hectare had a significant impact on the detection rate. Full article
(This article belongs to the Special Issue 3D Point Clouds in Forests)
Show Figures

Figure 1

20 pages, 11517 KiB  
Article
High-Resolution Lightning Detection and Possible Relationship with Rainfall Events over the Central Mediterranean Area
by Guido Paliaga, Carlo Donadio, Marina Bernardi and Francesco Faccini
Remote Sens. 2019, 11(13), 1601; https://0-doi-org.brum.beds.ac.uk/10.3390/rs11131601 - 05 Jul 2019
Cited by 22 | Viewed by 3607
Abstract
Lightning activity is usually associated with precipitations events and represents a possible indicator of climate change, even contributing to its increase with the production of NOx gases. The study of lightning activity on long temporal periods is crucial for fields related to atmospheric [...] Read more.
Lightning activity is usually associated with precipitations events and represents a possible indicator of climate change, even contributing to its increase with the production of NOx gases. The study of lightning activity on long temporal periods is crucial for fields related to atmospheric phenomena from intense rain-related hazard processes to long-term climate changes. This study focuses on 19 years of lightning-activity data, recorded from Italian Lightning Detection Network SIRF, part of the European network EUCLID (European Cooperation for Lightning Detection). Preliminary analysis was dedicated to the spatial and temporal assessment of lightning through detection in the Central Mediterranean area, focusing on yearly and monthly data. Temporal and spatial features have been analyzed, measuring clustering through the application of global Moran’s I statistics and spatial local autocorrelation; a Mann–Kendall trend test was performed on monthly series aggregating the original data on a 5 × 5 km cell. A local statistically significant trend emerged from the analysis, suggesting possible linkage between surface warming and lightning activity. Full article
(This article belongs to the Section Atmospheric Remote Sensing)
Show Figures

Graphical abstract

Previous Issue
Next Issue
Back to TopTop