Technical Note

Remote Sensing to Detect Nests of the Leaf-Cutting Ant Atta sexdens (Hymenoptera: Formicidae) in Teak Plantations

by
Isabel Carolina de Lima Santos
1,
Alexandre dos Santos
1,*,
Zakariyyaa Oumar
2,
Marcus Alvarenga Soares
3,
Július César Cerqueira Silva
4,
Ronald Zanetti
4 and
José Cola Zanuncio
5
1
Laboratório de Fitossanidade (FitLab), Instituto Federal de Mato Grosso—IFMT, Caixa Postal 244, 78200-000 Cáceres, Mato Grosso, Brazil
2
University of Witwatersrand, School of Geography, Archaeology and Environmental Studies, Private Bag 3, Witwatersrand 2050, South Africa
3
Programa de Pós-Graduação em Produção Vegetal, Universidade Federal dos Vales Jequitinhonha e Mucuri (UFVJM), 39100-000 Diamantina, Minas Gerais, Brazil
4
Departamento de Entomologia, Universidade Federal de Lavras, Caixa Postal 3037, 37200-000 Lavras, Minas Gerais, Brazil
5
Departamento de Entomologia BIOAGRO, Universidade Federal de Viçosa, 36570-900 Viçosa, Minas Gerais, Brazil
*
Author to whom correspondence should be addressed.
Remote Sens. 2019, 11(14), 1641; https://0-doi-org.brum.beds.ac.uk/10.3390/rs11141641
Submission received: 23 May 2019 / Revised: 16 June 2019 / Accepted: 23 June 2019 / Published: 10 July 2019
(This article belongs to the Section Forest Remote Sensing)

Abstract

:
Leaf-cutting ants of the genus Atta are an important insect pest in forest plantations in many countries of South America. The objective of this work was to evaluate the potential for using Landsat-8 images, with medium spatial resolution and distributed free of charge, to detect leaf-cutting ant nests in Tectona grandis plantations in Brazil, using partial least squares discriminant analysis (PLS-DA). The regression model adjusted by PLS-DA selected three principal components with a cross-validation error of 0.275 to map and predict the presence of leaf-cutting ant nests in these plantations. The most important bands and vegetation indices were selected using the main variables in the projection (VIP) and predicted pixels with the presence or absence of leaf-cutting ant nests with an accuracy of 72.3% on an independent validation data set. The study indicates that Landsat-8 OLI images have the potential to detect and map leaf-cutting ant nests in T. grandis plantations.

Graphical Abstract

1. Introduction

Tectona grandis L.f. (Lamiaceae), known as teak, is a deciduous tropical tree species, native to southern and southwestern Asia [1]. The wood of this plant has high commercial value for sawmill purposes [2,3]. The area planted with T. grandis in Mato Grosso state, Brazil, is over 74 thousand hectares [4]. Insect pests such as leaf-cutting ants limit the productivity of T. grandis plantations in monocultures [5,6]. Ants of the genus Atta are generalist herbivores with widespread distribution in the Americas, from the southern United States to northern Argentina [7]. These ants are considered pests throughout the Neotropical region because they cut and transport plant fragments to cultivate their symbiotic fungus Leucoagaricus gongylophorus, from which their individuals feed [8,9]. A single nest of Atta laevigata (Smith, 1858) (Hymenoptera: Formicidae) can cut about 5 kg of plant material per day [10], and 89 nests of the genus Atta can collectively forage 825 kg of plant biomass per hectare [11]. This damage can reduce growth [5,6], increase susceptibility to other insects and pathogens, and cause tree death [12].
The detection and monitoring of leaf-cutting ants in planted forests in Brazil is carried out at least once a year [13], with field workers visually locating and quantifying the nests of these insects in random plots [14], transects in planting lines, or with the technique of the worst focus, which is the detection of areas with high defoliation by ants [15]. The cost of monitoring leaf-cutting ant nests cannot be higher than 10% of that of leaf-cutting ant control, averaging US$12.33/ha [16], that is, US$1.23/ha.
Satellite imagery analyses can detect differences in canopy spectral patterns of healthy or pest-damaged plants [17,18,19] and can generate infestation maps to monitor insect problems [20]. The presence of the aphid Cinara cupressi (Buckton, 1881) (Hemiptera: Aphididae) in the forests of Austrocedrus chilensis (D. Don) [21], time series of defoliation by Lymantria dispar Linnaeus, 1758 (Lepidoptera: Lymantridae) in the Appalachian Mountains of the United States [22], Thaumetopoea pityocampa Schiffermüller, 1776 (Lepidoptera: Notodontidae) in Pinus spp. forests [23], Dichelia cedricola Diakonoff, 1974 (Lepidoptera: Tortricidae) in Cedrus libani A. Rich. [24], and Thaumastocoris peregrinus (Hemiptera: Thaumastocoridae) in Eucalyptus urophylla x Eucalyptus grandis stands [19] have been mapped using remote sensing techniques.
The monitoring and quantification of damage in forest areas attacked by insect pests using satellite images helps in decision-making processes, making it possible to reduce wood losses [19], environmental impacts, and the use of chemicals for pest control. This meets the requirements of forest certification agencies, such as the Forest Stewardship Council (FSC) [25,26,27,28] and the Brazilian Forest Certification Program (CERFLOR) [26].
The objective of this study was to infer based on canopy defoliation the presence of leaf-cutting ant nests in Tectona grandis L.f. plantations in Mato Grosso state, Brazil, using medium-resolution Landsat-8 satellite images.

2. Materials and Methods
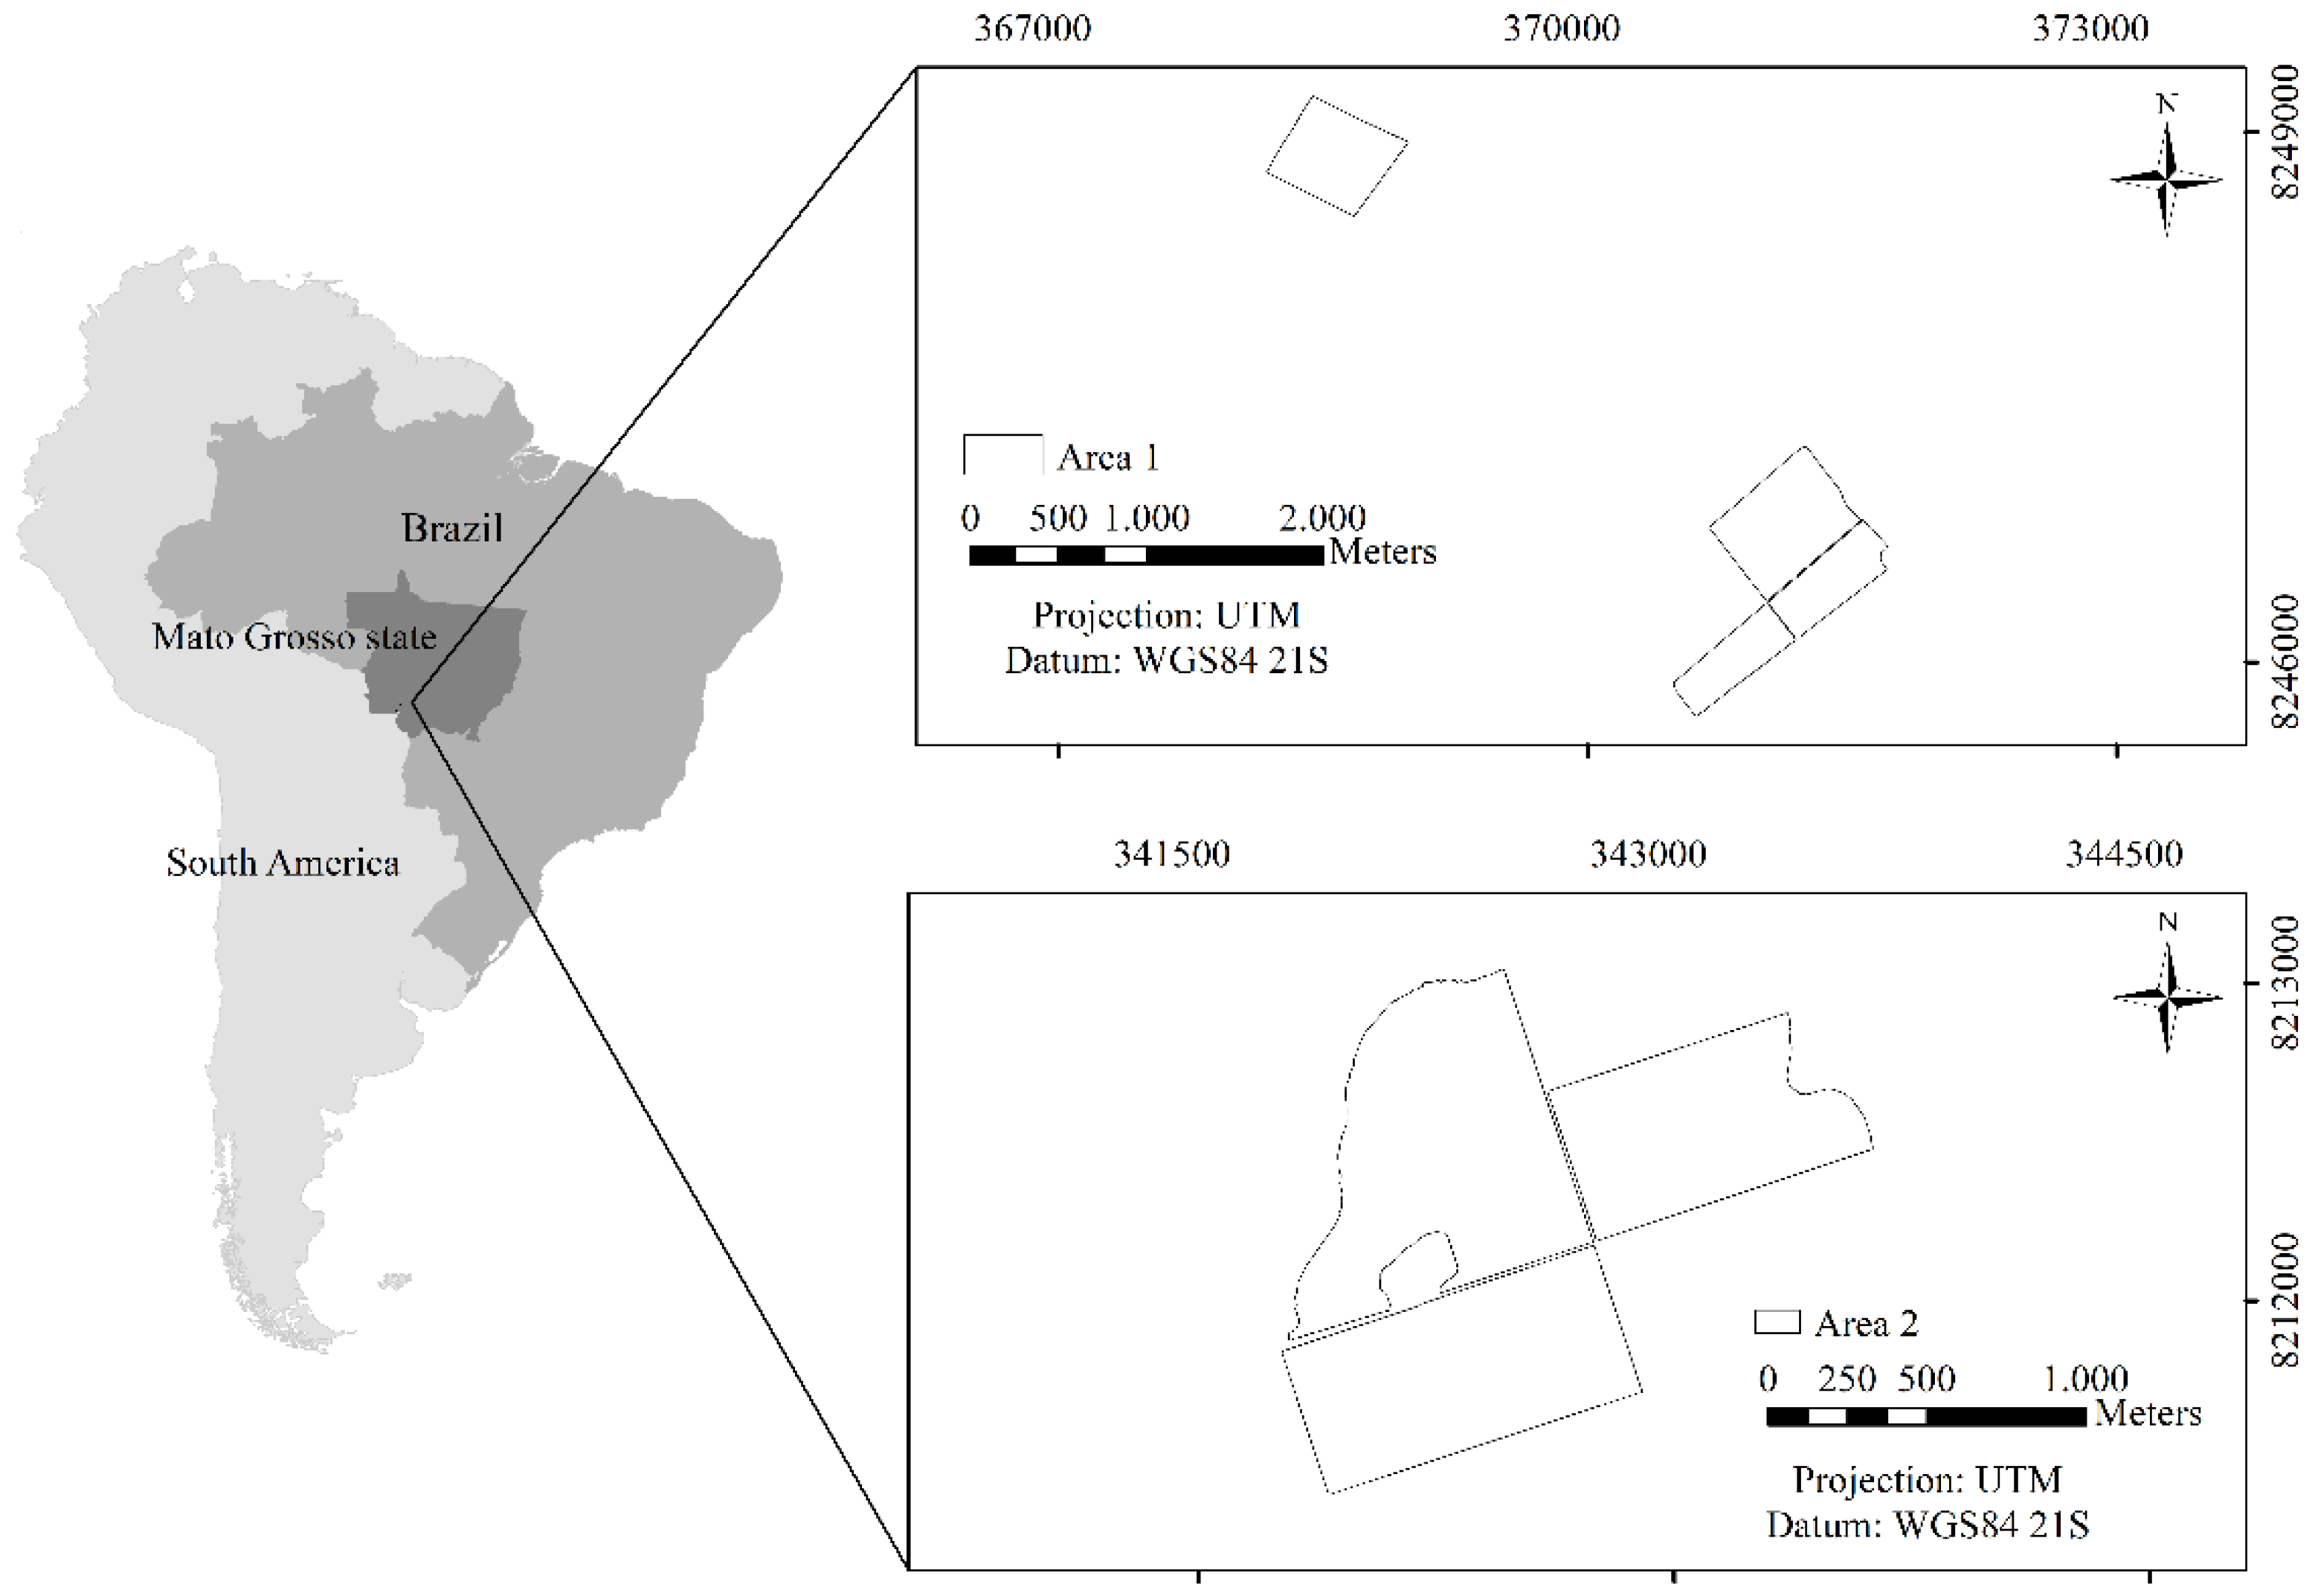
2.1. Study Area

The study areas were located in the municipalities of Porto Esperidião (15°51′10″ S, 58°27′37″ W and 160 m mean altitude, approximately) (area 1) and Cáceres (16°04′14″ S, 57°40′44″ W and 118 m mean altitude, approximately) (area 2), with four and three T. grandis stands of seminal origin, respectively, both 4.5 years old, planted in 4 × 4 m spacing, totaling 104.73 and 152.05 hectares, respectively, in the western region of Mato Grosso state, Brazil (Figure 1). These areas were part of the Amazonia and Pantanal biomes transition, with a tropical climate with a dry winter, type Aw according to the Köppen classification [29]. The mean annual temperature and precipitation of the region are 24.9–25.3 °C and 1360–1565 mm, respectively [29].
All leaf-cutting ant nests in the study area were located (census), photographed, and measured with a tape measure (at the largest width and length of the area containing loose soil) and the center of each one georeferenced with GPS navigation using the Garmim Etrex 20 (accuracy of 3.6 meters). All leaf-cutting ant nests in the study area were of the genus Atta and there was no other defoliator species present which could mask the results.
Ten individuals of the soldier caste were collected per leaf-cutting ant nest and placed in 70% alcohol containers, photographed, identified at the species level [30], and kept in the reference collection of the Laboratório de Fitossanidade (FitLab) of the Instituto Federal de Educação, Ciência e Tecnologia de Mato Grosso (IFMT), Campus Cáceres, Mato Grosso state, Brazil.
A 90 meter buffer was generated from the geographic coordinates around each leaf-cutting ant nest in T. grandis stands using the QGIS software [31]. This distance guaranteed the generation of points or pixels without interference from other leaf-cutting ant nests mapped in the T. grandis stands [32]. Random points, in locations not covered by the buffers generated, were allocated and considered to be sites without the presence of leaf-cutting ant nests in order to allow balanced statistical analyses of the data.

2.2. Acquisition and Pre-processing of Satellite Images

The multispectral images of the Landsat-8 Operational Land Imager (OLI) satellite (30 meter resolution), one week after or before the leaf-cutting ants nests census, free from clouds and shadows, were obtained free of charge from the United States Geological Survey (USGS) (Table 1) [33].
The digital numbers of the images were initially converted to radiance in order to radiometrically correct the images. The radiance was converted to reflectance with the following equation:
ϱ λ = ( M p × Q c a l + A p / s i n ( θ ) ) ,
where ρλ is the solar radiance at the top of the atmosphere; Mp the multiplicative scale factor of reflectance for the band; Qcal the digital pixel value; Ap the reflectance additive scaling factor for the band; and θ the solar elevation angle [34].
The radiometric correction of the topographic effects induced in the Landsat-8 OLI images was performed using the Cosine correction method, using a 30 m digital elevation model of the terrain acquired from the National Institute for Space Research (INPE) of the Brazilian geomorphometric database project, Topodata. The radiometric correction of the induced topographic effects was calculated using the following equation:
ϱ H = ϱ T ( c o s θ z / I L ) ,
where ρH is the horizontal surface reflectance; ρT the sloping surface reflectance; θz the solar zenith angle; and IL the sun angle on a sloped surface [34].
Eight vegetation indexes (VI) were calculated from the reflectance data of the Landsat-8 OLI satellite bands: atmospherically resistant vegetation index (ARVI), land surface water index (LSWI), modified normalized difference water index (MNDWI), normalized burn ratio (NBR), normalized difference vegetation index (NDVI), photochemical reflectance index (PRI), red green ratio index (RGI), and simple ratio (SR) (Table 2). These indexes were used to assess the phytosanitary status of the forest areas [35,36].
The forest stands in geometric location format were clipped at the end of the preprocessing step, resulting in reflectance images of the teak tree canopy target per spectral band. Corrections and processing were performed with the R program [37] and raster [38], rgdal [39], splancs [40], landsat [41], landsat8 [42], and shapefile [43] packages.

2.3. Spectral Characterization of Leaf-cutting Ant Nests

The canopy reflectance values of areas with or without damage by leaf-cutting ant nests, for each of the six spectral bands, and the values of the different vegetation indexes were subjected to the permutational multivariate analysis of variance (PERMANOVA) [44] with Mahalanobis distance [45] to reduce the bias of the analysis. The p-value was calculated by:
p = ( F p c o u n t p s e u d o F ) + 1 / ( F p t o t a l ) + 1 ,
where pseudoF is obtained from the original data and Fp is a permutation pseudoF [44], with a significance level of p < 0.05 and 9999 replicates.
This allowed the evaluation, with Landsat-8 OLI satellite bands, of the differences between the pixels with a presence or absence of leaf-cutting ant nests. The analyses were performed with the R program [37] and vegan [46] package.

2.4. Prediction and Mapping of the Leaf-cutting Ant Nests

The presence of leaf-cutting ant nests was predicted by partial least squares discriminant analysis (PLS-DA), used to predict categorical data [47]. The six multispectral bands (2, 3, 4, 5, 6, and 7) and the eight vegetation indexes (ARVI, LSWI, MNDWI, NBR, NDVI, PRI, RGI, and SR) were introduced in a PLS-DA regression algorithm to predict the presence or absence of leaf-cutting ants nest in the study areas. This algorithm reduced the collinearity effect between the input variables and maximized the correlation between the predictors of the independent variables and the dependent one [48]. Partial least squares regression was performed by the following equations:
X = T P ' + E ,
Y = U Q ' + F ,
where X is the matrix of the predictors; Y is the matrix response; T = X-scores; U = Y-scores; P = X-loadings; Q = Y-loadings; E = X-residues; and F = Y-residues [49].
The number of principal components was defined according to the classification error rate calculated by the leave-one-out cross-validation approach for an accurate estimation of the PLS-DA regression model [50]. The predictive variables, chosen and included in the PLS-DA regression model, were evaluated by calculating the important one in the projection (VIP) [50], which determined the contribution of each one to the data set and identified the most important independent variables to predict the presence of leaf-cutting ant nests. The adjustment and calibration of the PLS-DA regression were conducted with a subset of 75% of the database and the prediction with the remaining 25% of the unused pixels in the last step and used as cross-validation data, and the procedure was replicated 999 times.
The leaf-cutting ant nests were mapped by adjusting the PLS-DA regression model to the 25% subset of the dataset in the seven T. grandis stands, for pixel-to-pixel prediction. The general accuracy (%) of the maps was obtained by the simple proportion of the number of correctly classified pixels divided by the total ones of the stands. The analyses were performed with the R program [37] and mixOmics [51] and raster [38] packages.

3. Results

3.1. Spectral Caracterization of the Leaf-cutting Ant Nests

A total of 299 nests of the leaf-cutting ant Atta sexdens (Linnaeus, 1758) (Hymenoptera: Formicidae) was found in the seven T. grandis planted stands and, therefore, 299 geographic coordinates without them were generated, allowing a balanced analysis of the data. The average area of loose soil from A. sexdens nests was 79.8 ± 4.73 m2. The permutational multivariate variance analysis (PERMANOVA) of the six Landsat-8 OLI sensor spectral bands and the eight vegetation indexes used in this study differed by the Mahalanobis distance for pixels with presence or absence of leaf-cutting ant nests (pseudo-F = 16.701, p = 0.001, DF = 1).

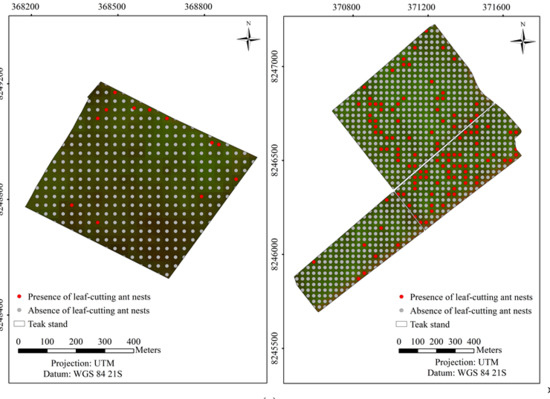
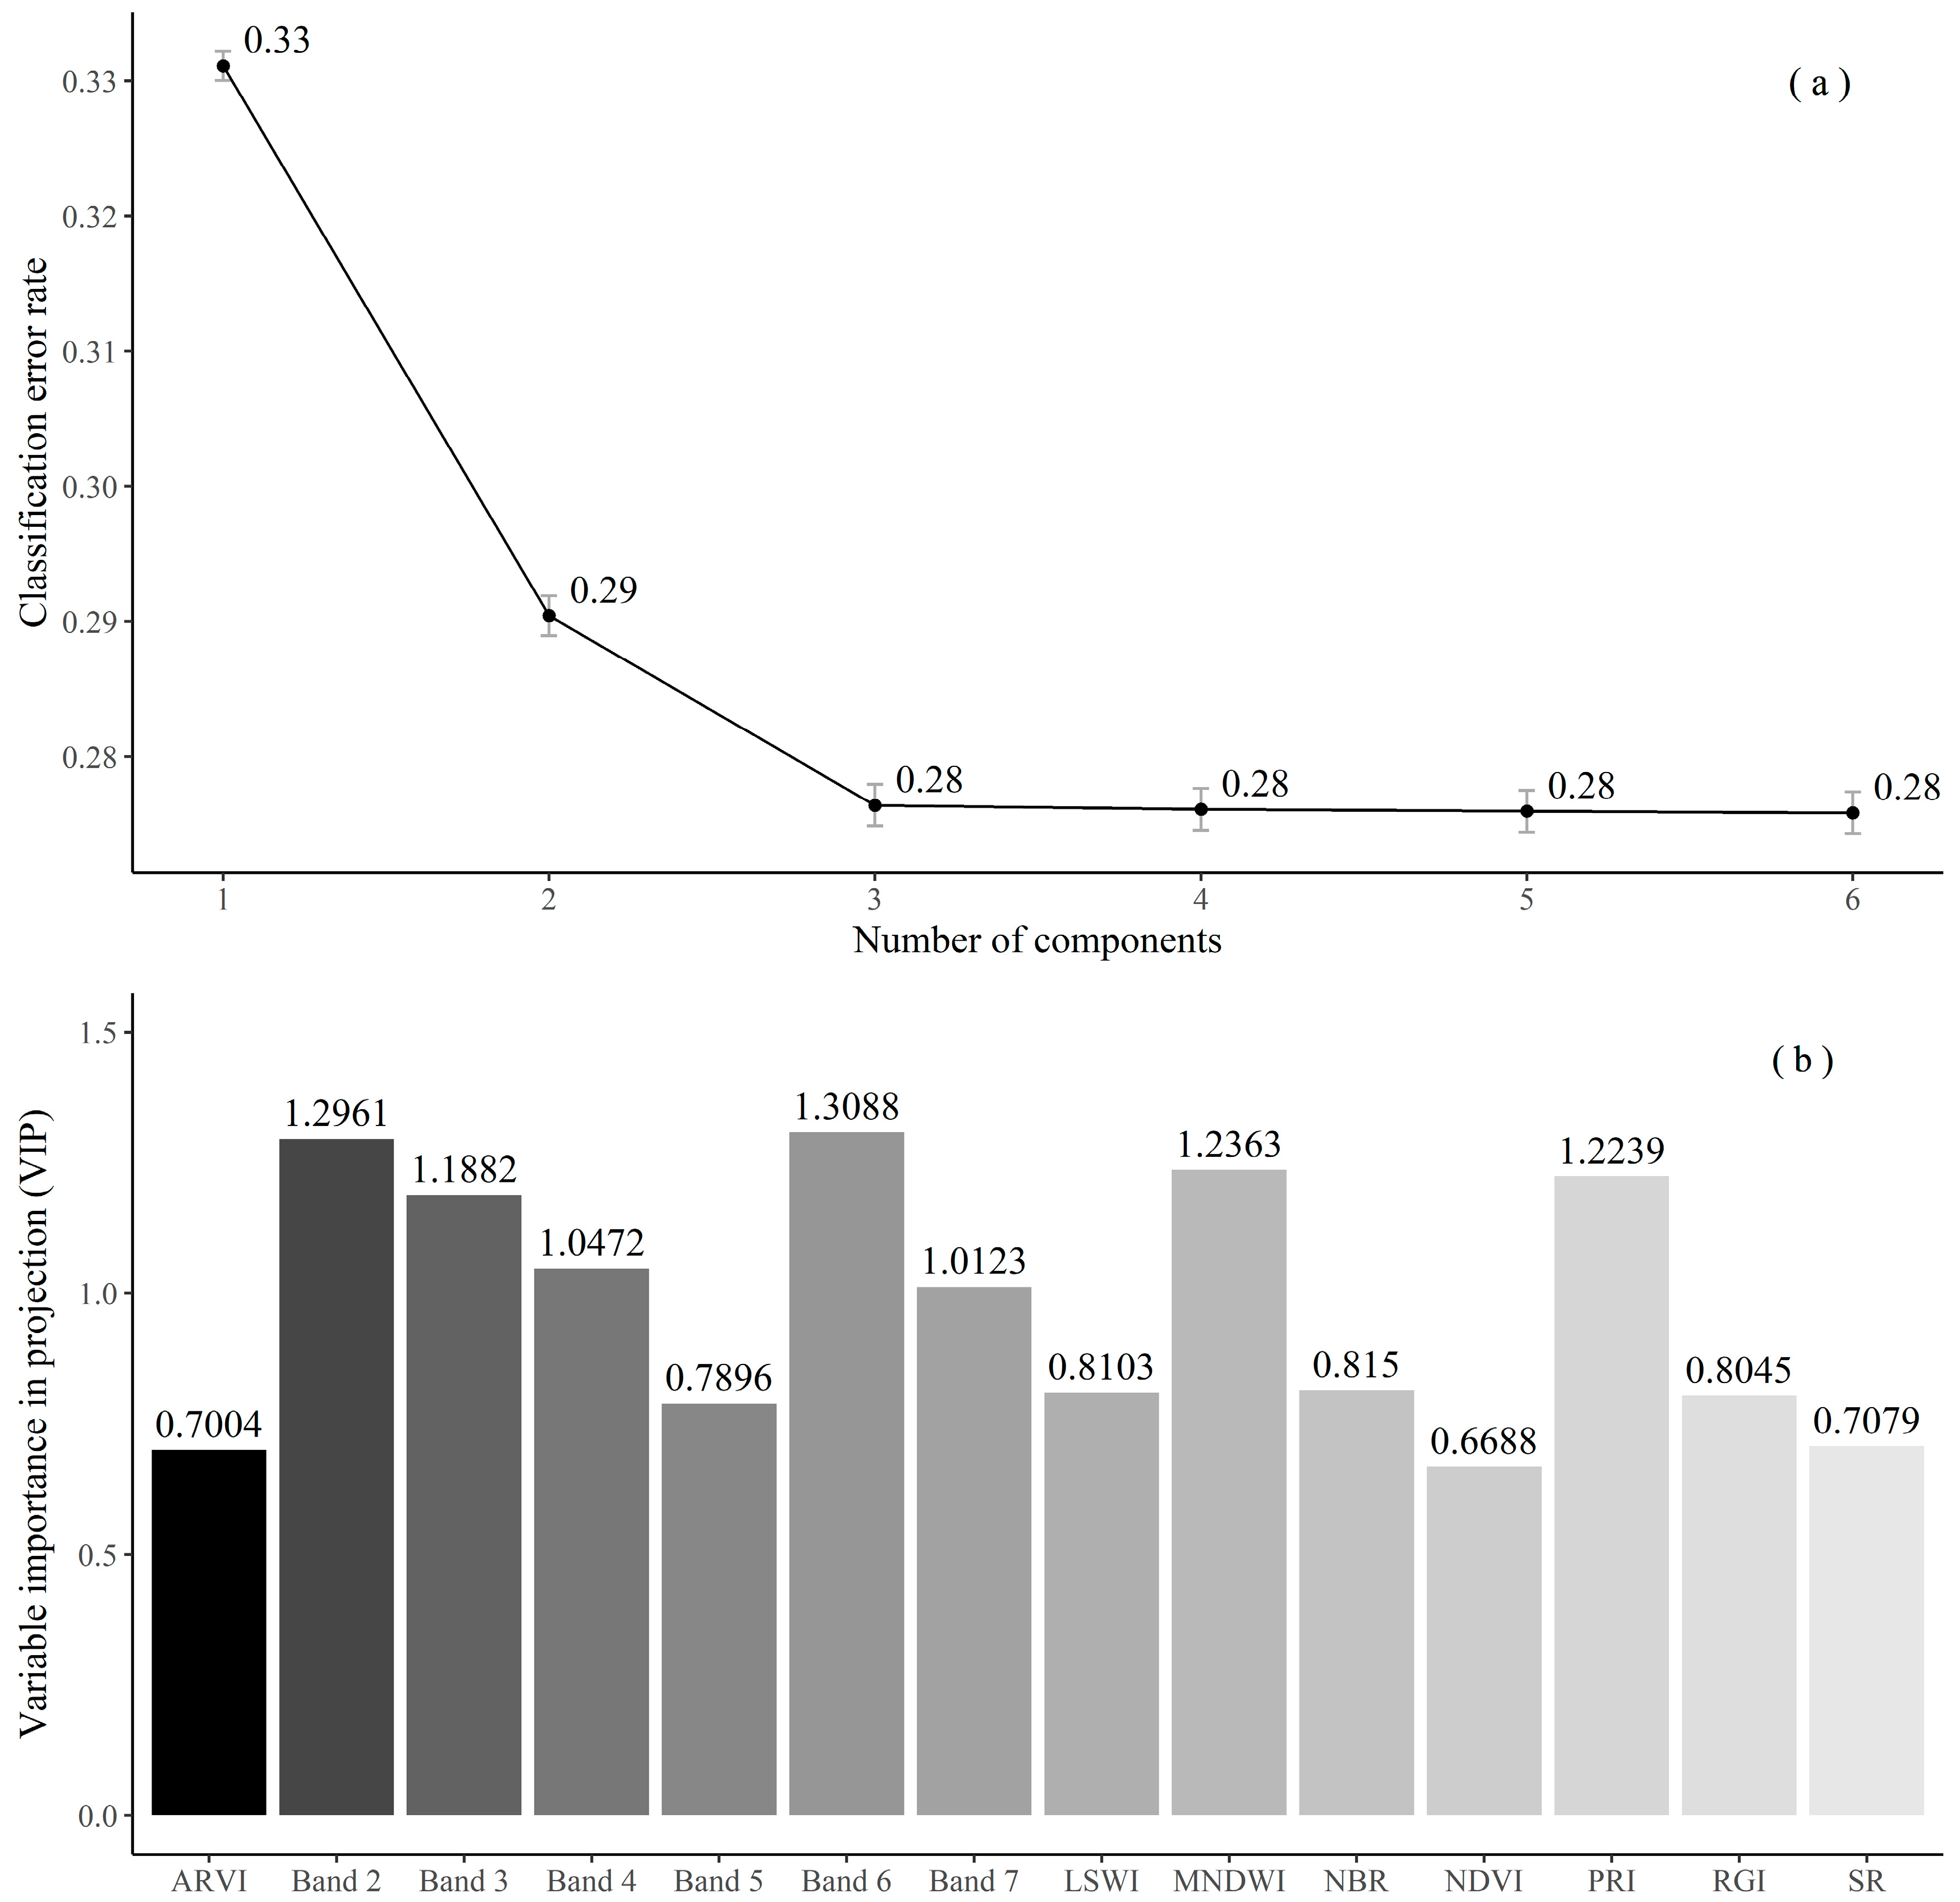
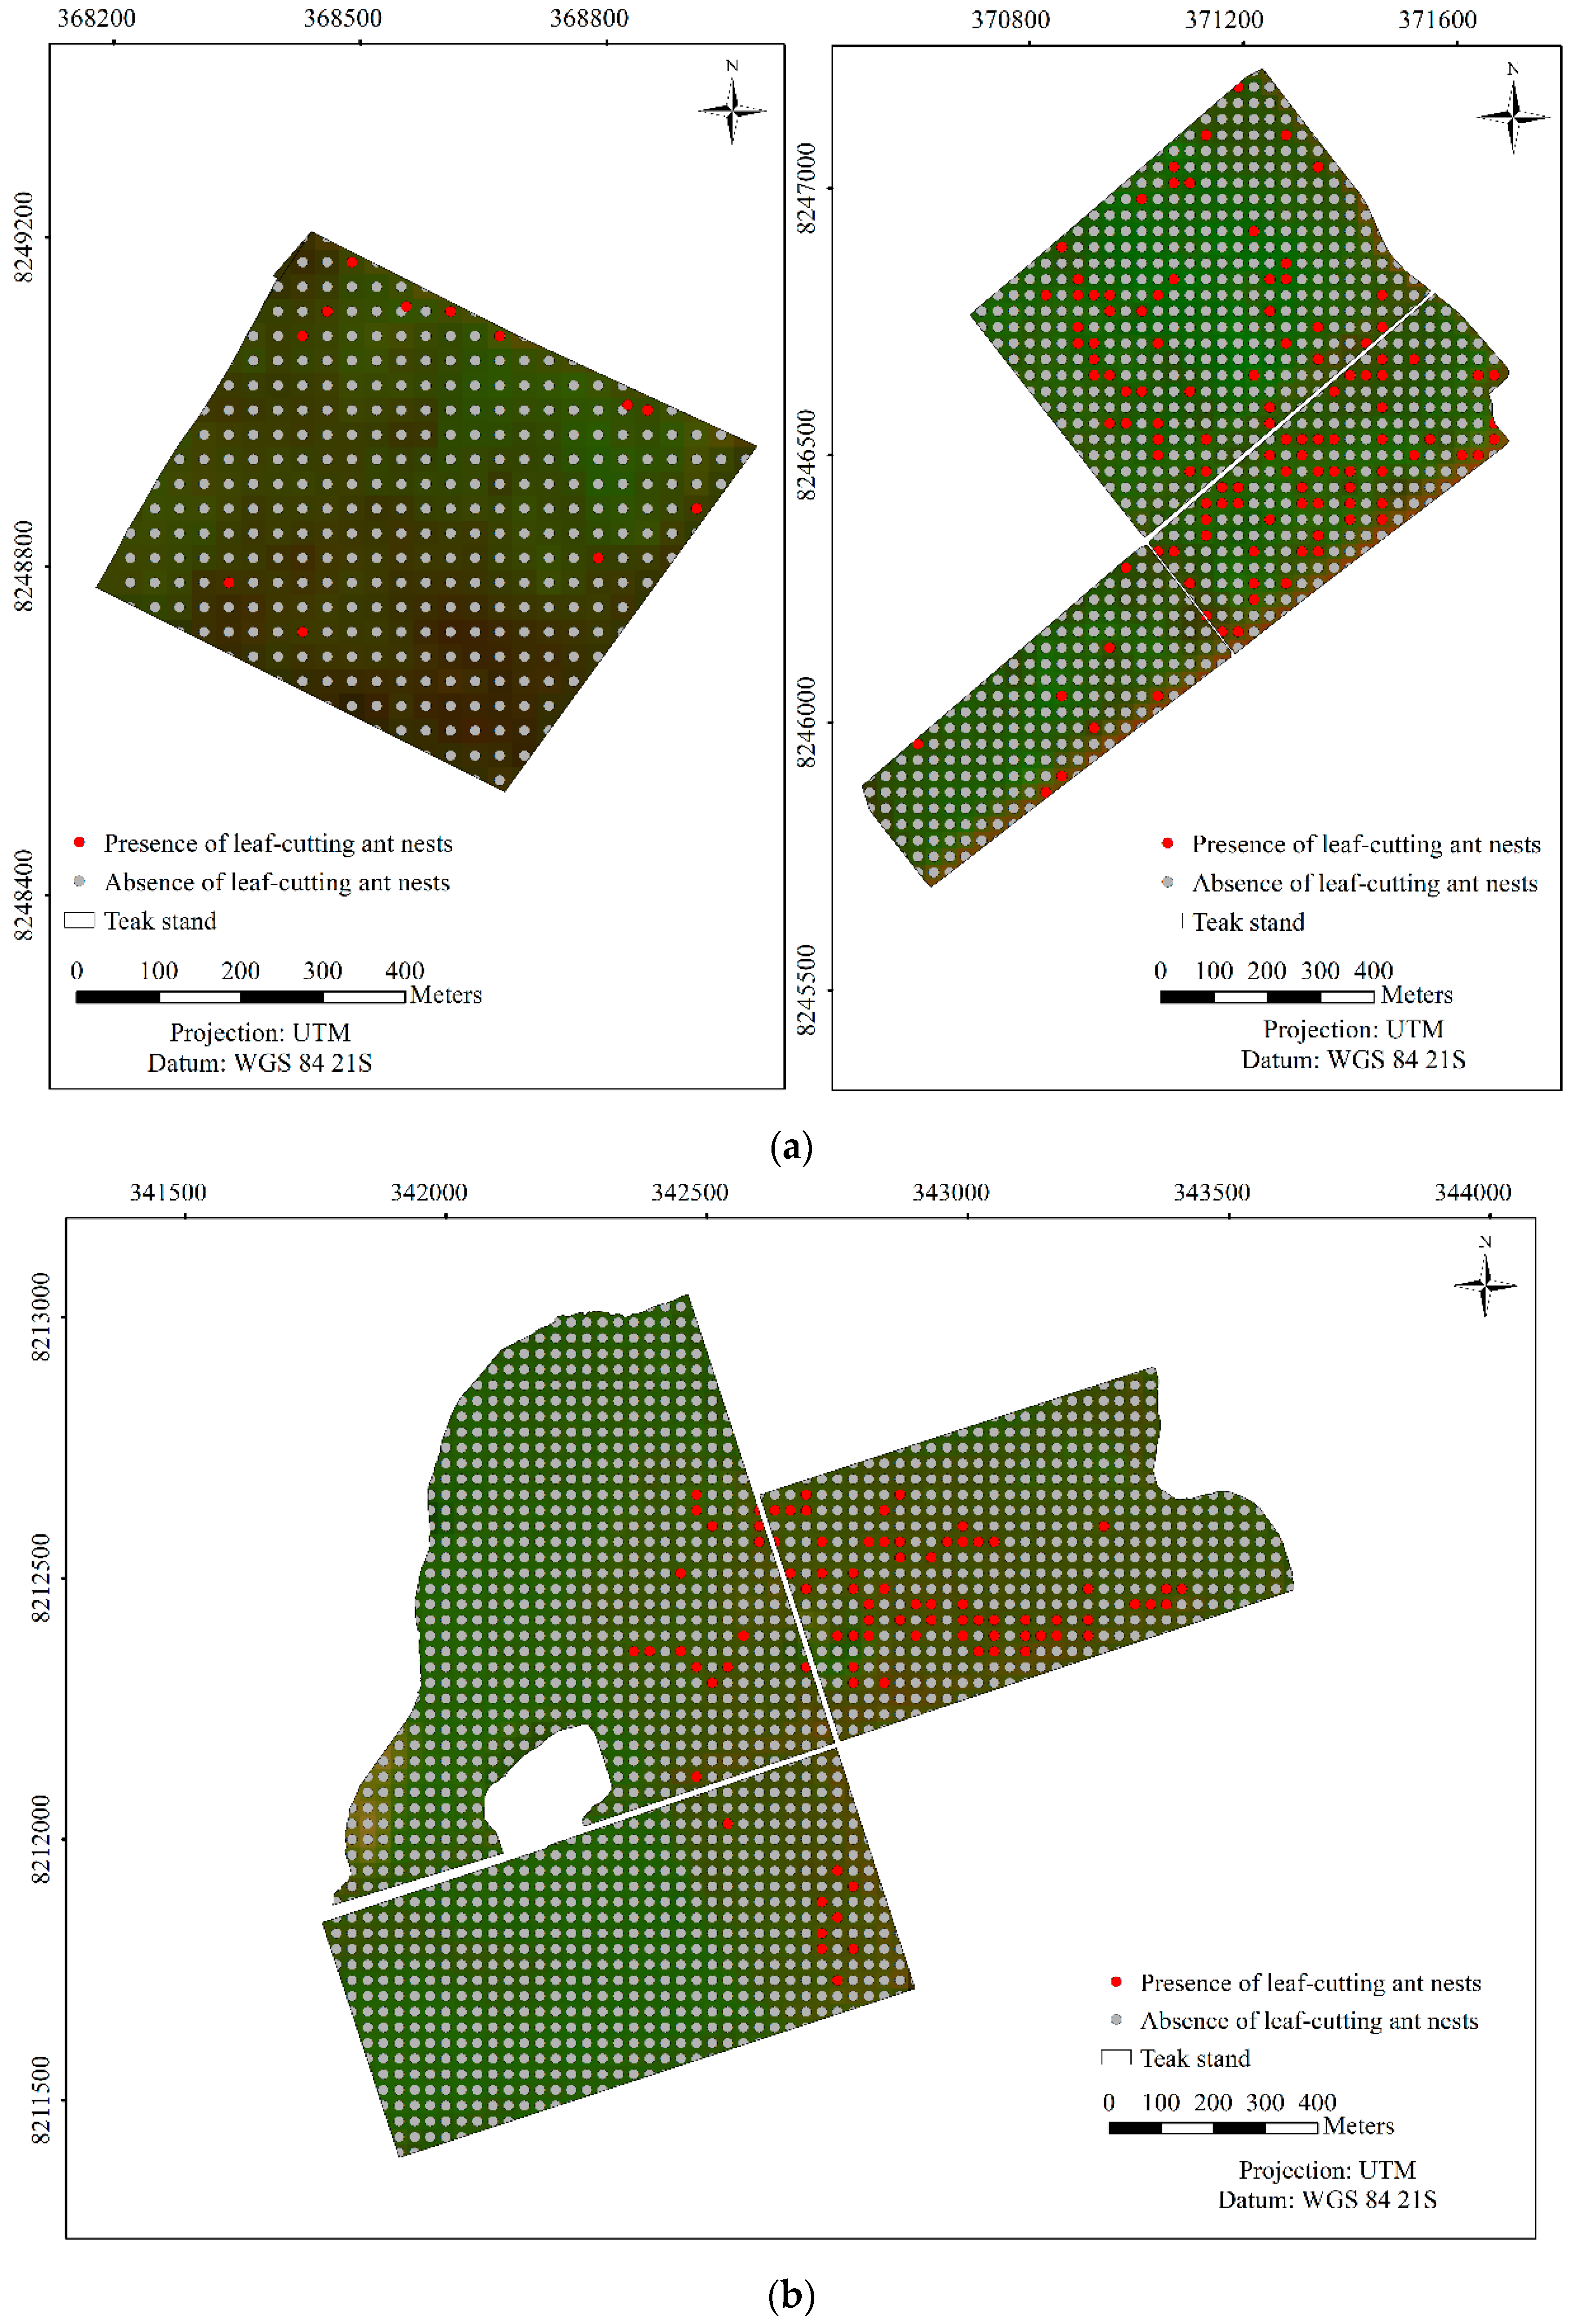
3.2. Predicting and Mapping Leaf-cutting Ant Nests

The PLS-DA model allowed for the separation of the spectra according to the presence or absence of leaf-cutting ant nests. The classification error rates according to the number of the principal components (PC), characterized by the components of the PLS-DA model with Mahalanobis distance, were 0.338 (PC1), 0.289 (PC2), 0.275 (PC3), and 0.270 (PC4) (Figure 2a). The variation of the errors in the PLS-DA model was lower after three components, with a classification error of 0.338.
The highest VIP values were 1.3088, 1.2961, 1.2363, and 1.2239 for bands 6 and 2, with the vegetation indexes MNDWI and PRI, respectively (Figure 2b).
The overall accuracy of the cross-validation model for predicting the presence of leaf-cutting ant nests in T. grandis stands was 72.3% with three principal components, using the validation data set (Figure 3).
The estimated average cost of conventional monitoring of leaf-cutting ants (plots or transects) is US$1.23/ha, while that of estimated remote monitoring was US$0.08/ha—about 15 times lower.

4. Discussion

The differences, identified by PERMANOVA, between the bands and vegetation indexes of the Landsat-8 OLI satellite for areas with or without the presence of the nests of the leaf-cutting A. sexdens indicate that there are specific spectral signatures to explain the phenomena studied. Similar results were obtained for the monitoring and detection of areas attacked by T. peregrinus in eucalyptus plantations in Brazil with the use of Landsat-8 OLI satellite bands [19], and in eucalyptus, pinus, and acacia plantations in South Africa using bands and vegetation indexes of the WorldView-2 satellite [35].
The pixel spectral characterization, using bands and vegetation indexes of the Landsat-8 OLI satellite and PLS-DA model to detect the presence or absence of leaf-cutting ant nests in T. grandis plantations, was efficient for initially evaluating their existence in the area. Similar results were obtained with the PLS-DA model for discriminating samples of Swietenia macrophylla King., Carapa guianensis Aubl., Cedrela odorata L., and Micropholis melinoniana Pierre, with predictive errors of 0.14, 0.09, 0.12, and 0.6, respectively [52], and to detect areas attacked by T. peregrinus, using the spectral bands and vegetation indexes of WorldView-2 satellite, with RMSE of 4.27% [35]. The choice of the best PLS-DA model with three components and a classification error of 0.275 showed that the increase in the number of components in the model does not increase precision [53]. Similar results were obtained in the mapping of eucalyptus plantations damaged by the bronze bug, T. peregrinus, with the best PLS-DA model having three components and a prediction error of 0.248 [19]. The error variation of the PLS-DA regression model for predicting the presence of Uromycladium acacia (Cooke) P. Syd. & Syd. (rust) in Acacia mearnsii trees was lower, with six components, with a prediction error of 4.09% using Landsat-8 OLI bands and vegetation indexes [54]. This reinforces the robustness of the PLS-DA regression model in discriminating categorical data in forest plantations.
The highest VIP values for predicting leaf-cutting ant nests in T. grandis plantations were from band 6 (shortwave infrared1), band 2 (blue), and the MNDWI and PRI vegetation indexes, corroborating other studies [19,35,54,55,56]. Band 6 was the best for explaining the reflectance of the T. grandis canopy cover [55], and the reflectance of this band was higher in eucalyptus areas attacked by T. peregrinus than in the healthy ones, evidencing a change in the physiological behavior of the plant due to the presence of the insect [19]. Band 2 (blue) was the most efficient for explaining soil reflectance [56] and, therefore, it is linked to the loose soil surface composition of A. sexdens nests. The MNDWI index was developed for the identification of water bodies [36], and it was used in the present work because the vegetation reflects a little more of shortwave infrared1 (band 6) than of green (band 3) [57]. This would allow the detection of defoliation, even light defoliation, by leaf-cutting ants. The PRI index is highly correlated with the canopy and the plant physiological activity [58], and can also detect changes in the structure of the younger leaves [59], which are usually preferred by leaf-cutting ants.
The accuracy of detection of A. sexdens nests in T. grandis plantations corroborates values of 76.7% in the mapping of areas attacked by T. peregrinus in eucalypt plantations in Brazil using Landsat-8 OLI [19]. However, this accuracy was lower than the 96.2% for the mapping of areas attacked by T. peregrinus in South Africa using WorldView-2 [35], a satellite with a spatial resolution of 50 cm, 60 times greater than that of Landsat-8 OLI, and without free images. Another freely available option compared to Landsat-8 OLI is the Sentinel 2 MSI satellite for monitoring insects’ pests, with a 2–10 days revisiting period, similar spectral bands, and better spatial resolution (10~20 meters) [60], but calibration and validation studies are yet to be tested. The detection of leaf-cutting ant nests by conventional monitoring, with field workers visually locating and quantifying the nests in Pinus sp. plantations, with sampling intensity of 10.5% and plot of 700 m2, showed an expected error of 24% [61]. The estimation error of the number of leaf-cutting ant nests by the Prodan sampling method with a sampling intensity of 10.47% was 13.05% [62]. This reinforces the potential for the use of freely distributed spatial resolution images such as those of the Landsat-8 OLI satellite, with a 16 day revisiting period, to detect and map Atta sexdens leaf-cutting ant nests in forest plantations, as a solution for monitoring these plantations [54].

5. Conclusions

Medium spatial resolution images of the Landsat-8 OLI satellite using six bands and eight vegetation indices allow for the detection and mapping of the presence of leaf-cutting ant nests in Tectona grandis plantations, with 72.3% accuracy and a low cost (US$0.08/ha), making possible its operational use for monitoring this insect pest in teak forest plantations.

Author Contributions

I.C.d.L.S., A.d.S., and Z.O. conceived and designed the research study, I.C.d.L.S., A.d.S., R.Z., J.C.C.S., M.A.S. and J.C.Z. collected, processed, and analyzed the data, and all authors contributed to the writing of the manuscript.

Funding

This research was funded by “Conselho Nacional de Desenvolvimento Científico e Tecnológico (CNPq, Brazil)”, grant number 315585/2018-8.

Acknowledgments

We thank the Brazilian agencies “Conselho Nacional de Desenvolvimento Científico e Tecnológico (CNPq, Brazil)”, “Coordenação de Aperfeiçoamento de Pessoal de Nível Superior (CAPES)”, “Programa Cooperativo sobre Proteção Florestal/PROTEF do Instituto de Pesquisas e Estudos Florestais/IPEF” and “Pró-Reitoria de Pesquisa, Pós-graduação e Inovação (PROPES) do Instituto Federal de Educação, Ciência e Tecnologia de Mato Grosso (IFMT, Brazil)” for supporting our research. David Michael Miller, a professional editor and proofreader and native English speaking, has reviewed and edited this article for structure, grammar, punctuation, spelling, word choice, and readability.

Conflicts of Interest

The authors declare no conflict of interest. The funders had no role in the design of the study; in the collection, analyses, or interpretation of data; in the writing of the manuscript, or in the decision to publish the results.

References

  1. Deb, J.C.; Phinn, S.; Butt, N.; McAlpine, C.A. Climatic-induced shifts in the distribution of teak (Tectona grandis) in Tropical Asia: Implications for forest management and planning. Environ. Manag. 2017, 60, 422–435. [Google Scholar] [CrossRef]
  2. Brocco, V.F.; Paes, J.B.; da Costa, L.G.; Brazolin, S.; Arantes, M.D.C. Potential of teak heartwood extracts as a natural wood preservative. J. Clean. Prod. 2017, 142, 2093–2099. [Google Scholar] [CrossRef]
  3. Hansen, O.K.; Changtragoon, S.; Ponoy, B.; Kjær, E.D.; Minn, Y.; Finkeldey, R.; Nielsen, K.B.; Graudal, L. Genetic resources of teak (Tectona grandis Linn. f.)—Strong genetic structure among natural populations. Tree Genet. Genomes 2015, 11, 802–818. [Google Scholar] [CrossRef]
  4. Produce Conserve Include. Available online: http://www.pcimonitor.org/ (accessed on 19 April 2018).
  5. Zanetti, R.; Zanuncio, J.C.; Vilela, E.F.; Leite, H.G.; Jaffé, K.; Oliveira, A.C. Level of economic damage for leaf-cutting ants (Hymenoptera: Formicidae) in Eucalyptus plantations in Brazil. Sociobiology 2003, 42, 433–442. [Google Scholar]
  6. Souza, A.; Zanetti, R.; Calegario, N. Nível de dano econômico para formigas-cortadeiras em função do índice de produtividade florestal de eucaliptais em uma região de Mata Atlântica. Neotrop. Entomol. 2011, 40, 483–488. [Google Scholar]
  7. Hölldobler, B.; Wilson, E.O. The Leafcutter Ants: Civilization by Instinct; W.W. Norton & Company: New York, NY, USA, 2011. [Google Scholar]
  8. Arenas, A.; Roces, F. Avoidance of plants unsuitable for the symbiotic fungus in leaf-cutting ants: Learning can take place entirely at the colony dump. PLoS ONE 2017, 12, e0171388. [Google Scholar] [CrossRef]
  9. Alma, A.M.; Farji-Brener, A.G.; Elizalde, L. Gone with the wind: Short and long-term responses of leaf-cutting ants to the negative effect of wind on their foraging activity. Behav. Ecol. 2016, 27, 1017–1024. [Google Scholar] [CrossRef]
  10. Jaffé, K. El Mundo De Las Hormigas; Equinocio: Caracas, Venezuela, 2004. [Google Scholar]
  11. Costa, N.A.; Vasconcelos, L.H.; Vieira-Neto, H.M.E.; Bruna, M.E. Do herbivores exert top-down effects in Neotropical savannas? Estimates of biomass consumption by leaf-cutter ants. J. Veg. Sci. 2008, 19, 849–854. [Google Scholar] [CrossRef]
  12. Zanuncio, J.C.; Torres, J.B.; Gasperazzo, W.L.; Zanuncio, T.V. Aferição de dosagens de iscas granuladas para controle de Atta laevigata (F. Smith) pelo número de olheiros ativos. Rev. Árvore 1996, 20, 241–246. [Google Scholar]
  13. Zanetti, R.; Zanuncio, J.C.; Santos, J.C.; Da Silva, W.L.P.; Ribeiro, G.T.; Lemes, P.G. An overview of integrated management of leaf-cutting ants (Hymenoptera: Formicidae) in Brazilian forest plantations. Forests 2014, 5, 439–454. [Google Scholar] [CrossRef]
  14. Reis, M.A.; Zanetti, R.; Scolforo, J.R.S.; Ferreira, M.Z. Sampling plans for leaf-cutting ant nests (Hymenoptera: Formicidae) by the methods of strip transects and line transects on eucalyptus plantations. Rev. Árvore 2010, 34, 1101–1108. [Google Scholar] [CrossRef]
  15. Zanetti, R.; Zanuncio, J.C.; Vilela, E.F.; Leite, H.G.; Della Lucia, T.M.C.; Couto, L. Efeito da espécie de eucalipto e da vegetação nativa circundante sobre o custo de combate a sauveiros em eucaliptais. Rev. Árvore 1999, 23, 321–325. [Google Scholar]
  16. Zanetti, R.; Reis, M.A.; Mendonça, L.A. Métodos de amostragem de formigas-cortadeiras em florestas cultivadas. In Insetos Sociais: Da Biologia à Aplicação, 1st ed.; Della Lucia, T.M.C., Ed.; Editora UFV: Viçosa, Brazil, 2008; pp. 397–412. [Google Scholar]
  17. Moshou, D.; Bravo, C.; Oberti, R.; West, J.; Bodria, L.; McCartney, A.; Ramon, H. Plant disease detection based on data fusion of hyper-spectral and multi-spectral fluorescence imaging using Kohonen maps. Real-Time Imaging 2005, 11, 75–83. [Google Scholar] [CrossRef]
  18. Townsend, P.A.; Singh, A.; Foster, J.R.; Rehberg, N.J.; Kingdon, C.C.; Eshleman, K.N.; Seagle, S.W. A general Landsat model to predict canopy defoliation in broadleaf deciduous forests. Remote Sens. Environ. 2012, 119, 255–265. [Google Scholar] [CrossRef]
  19. Santos, A.; Oumar, Z.; Arnhold, A.; Silva, N.; Silva, C.O.; Zanetti, R. Multispectral characterization, prediction and mapping of Thaumastocoris peregrinus (Hemiptera: Thaumascoridae) attack in Eucalyptus plantations using remote sensing. J. Spat. Sci. 2016, 8596, 1–11. [Google Scholar] [CrossRef]
  20. Zarco-Tejada, P.J.; Hornero, A.; Hernández-Clemente, R.; Beck, P.S.A. Understanding the temporal dimension of the red-edge spectral region for forest decline detection using high-resolution hyperspectral and Sentinel-2A imagery. ISPRS J. Photogramm. Remote Sens. 2018, 137, 134–148. [Google Scholar] [CrossRef] [PubMed]
  21. Peña, M.A.; Altmann, S.H. Use of satellite-derived hyperspectral indices to identify stress symptoms in an Austrocedrus chilensis forest infested by the aphid Cinara cupressi. Int. J. Pest. Manag. 2009, 55, 197–206. [Google Scholar] [CrossRef]
  22. Spruce, J.P.; Sader, S.; Ryan, R.E.; Smoot, J.; Kuper, P.; Ross, K.; Prados, D.; Russell, J.; Gasser, G.; McKellip, R.; et al. Assessment of MODIS NDVI time series data products for detecting forest defoliation by gypsy moth outbreaks. Remote Sens. Environ. 2011, 115, 427–437. [Google Scholar] [CrossRef]
  23. Sangüesa-Barreda, G.; Camarero, J.J.; García-Martín, A.; Hernández, R.; De la Riva, J. Remote-sensing and tree-ring based characterization of forest defoliation and growth loss due to the Mediterranean pine processionary moth. For. Ecol. Manag. 2014, 320, 171–181. [Google Scholar] [CrossRef] [Green Version]
  24. Çoban, H.O.; Özçelik, R.; Avci, M. Monitoring of damage from cedar shoot moth Dichelia cedricola Diakonoff (Lep: Tortricidae) by multi-temporal Landsat imagery. IForest 2014, 7, 126–131. [Google Scholar] [CrossRef]
  25. Isering, R.; Neumeister, L. Insecticides for Control of Pest Insects in FSC Certified Forests in Brazil: Recommendations by Technical Advisors; FSC Pesticides Committee: Bonn, Germany, 2010; Available online: http://www.ipef.br/pccf/arquivos/TA_Rec_alpha-Cypermethrin-Deltamethrin-Fenitrothion-Fipronil-Sulfluramid_BR_2010.pdf (accessed on 10 April 2018).
  26. Zanuncio, J.C.; Lemes, P.G.; Antunes, L.R.; Maia, J.L.S.; Mendes, J.E.P.; Tanganelli, K.M.; Salvador, J.F.; Serrão, J.E. The impact of the Forest Stewardship Council (FSC) pesticide policy on the management of leaf-cutting ants and termites in certified forests in Brazil. Ann. For. Sci. 2016, 73, 205–214. [Google Scholar] [CrossRef] [Green Version]
  27. FSC. Pesticides Policy Guidance Addendum: List of Approved Derogations for Use of ‘Highly Hazardous’ Pesticides; Forest Stewardship Council: Bonn, Germany, 2018; Available online: https://ic.fsc.org/file-download. list-of-approved-derogations-for-use-of-highly-hazardous-pesticides.a-2651.pdf (accessed on 10 April 2018).
  28. Lemes, P.G.; Zanuncio, J.C.; Serrão, J.E.; Lawson, S.A. Forest stewardship council (FSC) pesticide policy and integrated pest management in certified tropical plantations. Environ. Sci. Pollut. R. 2017, 24, 1283–1295. [Google Scholar] [CrossRef] [PubMed]
  29. Alvares, C.A.; Stape, J.L.; Sentelhas, P.C.; Gonçalves, J.L.M.; Sparovek, G. Köppen’s climate classification map for Brazil. Meteorol. Z. 2013, 22, 711–728. [Google Scholar] [CrossRef]
  30. Bolton, B. A New General Catalogue of the Ants of the World; Harvard University Press: Cambridge, MA, USA; London, UK, 1995; p. 504. [Google Scholar]
  31. QGIS Development Team. QGIS Geographic Information System. Open Source Geospatial Foundation Project. 2018. Available online: http://www.qgis.org/ (accessed on 5 February 2018).
  32. Lopes, J.F.S.; Brugger, M.S.; Menezes, R.B.; Camargo, R.S.; Forti, L.C.; Fourcassié, V. Spatio-temporal dynamics of foraging networks in the grass-cutting ant Atta bisphaerica Forel, 1908 (Formicidae, Attini). PLoS ONE 2016, 11, e0146613. [Google Scholar] [CrossRef] [PubMed]
  33. USGS. Landsat 8 (L8) Data Users Handbook, Sioux Falls: Department of the Interior: U.S. Geological Survey. 2016. Available online: https://www.usgs.gov/media/files/landsat-8-data-users-handbook (accessed on 3 April 2018).
  34. Teillet, P.M.; Guidon, B.; Goodenough, D.G. On the slope-aspect correction of multi-spectral scanner data. Can. J. Remote Sens. 1982, 8, 84–106. [Google Scholar] [CrossRef]
  35. Oumar, Z.; Mutanga, O. Using WorldView-2 bands and indices to predict bronze bug (Thaumastocoris peregrinus) damage in plantation forests. Int. J. Remote Sens. 2013, 34, 2236–2249. [Google Scholar] [CrossRef]
  36. Li, P.; Jiang, L.; Feng, Z. Cross-comparison of vegetation indices derived from Landsat-7 Enhanced Thematic Mapper Plus (ETM+) and Landsat-8 Operational Land Imager (OLI) sensors. Remote Sens. 2014, 6, 310–329. [Google Scholar] [CrossRef]
  37. R Core Team. R: A Language and Environment for Statistical Computing; R Foundation for Statistical Computing: Vienna, Austria, 2017; Available online: https://www.r-project.org/ (accessed on 5 March 2018).
  38. Hijmans, R.J. Raster: Geographic Data Analysis and Modeling, R Package Version 2.8-19. 2019. Available online: https://CRAN.R-project.org/package=raster (accessed on 2 April 2019).
  39. Bivand, R.; Keitt, T.; Rowlingson, B. Rgdal: Bindings for the ‘Geospatial’ Data Abstraction Library, R Package Version 1.3-6. 2018. Available online: https://CRAN.R-project.org/package=rgdal (accessed on 2 April 2019).
  40. Rowlingson, B.; Diggle, P. Splancs: Spatial and Space-Time Point Pattern Analysis, R Package Version 2.01-40. 2017. Available online: https://CRAN.R-project.org/package=splancs (accessed on 2 April 2019).
  41. Goslee, S.C. Analyzing remote sensing data in R: The Landsat package. J. Stat. Softw. 2011, 43, 1–17. [Google Scholar] [CrossRef]
  42. Santos, A. Landsat8: Landsat 8 Imagery Rescaled to Reflectance, Radiance and/or Temperature, R Package Version 0.1-10. 2017. Available online: https://CRAN.R-project.org/package=landsat8 (accessed on 2 April 2019).
  43. Stabler, B. Shapefiles: Read and Write ESRI Shapefiles, R Package Version 0.7. 2013. Available online: https://CRAN.R-project.org/package=shapefiles (accessed on 2 April 2019).
  44. Anderson, M.J. A new method for non-parametric multivariate analysis of variance. Austral. Ecol. 2001, 26, 32–46. [Google Scholar] [CrossRef]
  45. Perumal, K.; Bhaskaran, R. Supervised classification performance of multispectral images. J. Comput. 2010, 2, 124–129. [Google Scholar]
  46. Oksanen, J.; Blanchet, F.G.; Friendly, M.; Kindt, R.; Legendre, P.; McGlinn, D.; Peter, R.; Minchin, P.R.; O’Hara, R.B.; Simpson, G.L.; et al. Vegan Community Ecology R Package Version 2.5-3. 2018. Available online: https://CRAN.R-project.org/package=vegan (accessed on 16 July 2018).
  47. Pérez-Enciso, M.; Tenenhaus, M. Prediction of clinical outcome with microarray data: A partial least squares discriminant analysis (PLS-DA) approach. Hum. Genet. 2003, 112, 581–592. [Google Scholar] [CrossRef] [PubMed]
  48. Mevik, B.H.; Wehrens, R.; Liland, K.L. Pls: Partial Least Squares and Principal Component Regression, R Package Version 2.7-0. 2018. Available online: https://CRAN.R-project.org/package=pls (accessed on 2 April 2019).
  49. Geladi, P.; Kowalski, B.R. Partial least-squares regression: A tutorial. Anal. Chim. Acta 1986, 185, 1–17. [Google Scholar] [CrossRef]
  50. Tenenhaus, M. La régression PLS: Théorie et pratique; Editions Thecnip: Paris, France, 1998. [Google Scholar]
  51. Rohart, F.; Gautier, B.; Singh, A.; Le Cao, K.A. Mixomics: An R package for ‘omics feature selection and multiple data integration. PLoS Comput. Biol. 2017, 13, e1005752. [Google Scholar] [CrossRef] [PubMed]
  52. Pastore, T.C.M.; Braga, J.W.B.; Coradin, V.T.R.; Magalhães, W.L.E.; Okino, E.Y.A.; Camargos, J.A.A.; Muñiz, G.I.B.; Bressan, O.A.; Davrieux, F. Near infrared spectroscopy (NIRS) as a potential tool for monitoring trade of similar woods: Discrimination of true mahogany, cedar, andiroba, and curupixá. Holzforschung 2011, 65, 73–80. [Google Scholar] [CrossRef]
  53. Seasholtz, M.B.; Kowalski, B. The parsimony principle applied to multivariate calibration. Anal. Chim. Acta 1993, 277, 165–177. [Google Scholar] [CrossRef]
  54. Oumar, M.S.; Peerbhay, K.; Germishuizen, I.; Mutanga, O.; Oumar, Z. Detecting canopy damage caused by Uromycladium acaciae on South African Black Wattle forest compartments using moderate resolution satellite imagery. S. Afr. J. Geomat. 2019, 8, 69–83. [Google Scholar] [CrossRef]
  55. Christian, B.; Krishnayya, N.S.R. Spectral signatures of teak (Tectona grandis L.) using hyperspectral (EO-1) data. Curr. Sci. 2007, 93, 1291–1296. [Google Scholar]
  56. Lobell, D.B.; Asner, G.P. Moisture effects on soil reflectance. Soil Sci. Soc. Am. J. 2002, 66, 722–727. [Google Scholar] [CrossRef]
  57. Xu, H. Modification of normalized difference water index (NDWI) to enhance open water features in remotely sensed imagery. Int. J. Remote Sens. 2006, 27, 3025–3033. [Google Scholar] [CrossRef]
  58. Stylinski, C.D.; Gamon, J.; Oechel, W.C. Seasonal patterns of reflectance indices, carotenoid pigments and photosynthesis of evergreen chaparral species. Oecologia 2002, 131, 366–374. [Google Scholar] [CrossRef]
  59. Gamon, J.A.; Surfus, J.S. Assessing leaf pigment content with a reflectometer. New Phytol. 1999, 143, 105–117. [Google Scholar] [CrossRef]
  60. Hao, P.; Chen, Z.; Tang, H.; Li, D.; Li, H. New workflow of plastic-mulched farmland mapping using multi-temporal Sentinel-2 data. Remote Sens. 2019, 11, 1353. [Google Scholar] [CrossRef]
  61. Cantarelli, E.B.; Costa, E.C.; Zanetti, R.; Pezzutti, R. Acromyrmex spp. (Hymenoptera: Formicidae) sampling plan in Pinus spp. pre-planting áreas. Cienc. Rural 2006, 36, 385–390. [Google Scholar] [CrossRef]
  62. Reis, M.A.; Zanetti, R.; Scolforo, J.R.S.; Ferreira, M.Z.; Zanuncio, J.C. Sampling of leaf-cutting ant nests (Hymenoptera: Formicidae) in Eucalyptus plantations using quadrant and Prodan methods. Sociobiology 2008, 51, 21–29. [Google Scholar]
Figure 1. Study areas with Tectona grandis stands, in the western region of Mato Grosso state, Brazil.
Remotesensing 11 01641 g001
Figure 2. Cross-validation error rate and number of principal components for the calibration model (a) and Variable importance in projection (VIP) of bands and vegetation indexes calculated from Landsat-8 OLI satellite band reflectance (b) to characterize the model components.
Remotesensing 11 01641 g002
Figure 3. Prediction maps of the presence and absence of leaf-cutting ant nests in Tectona grandis stands in areas 1 (a) and 2 (b) (false color composition).
Remotesensing 11 01641 g003
Table 1. Spectral resolution of the Landsat-8 OLI satellite bands used in the detection and monitoring of leaf-cutting ant nests in Tectona grandis plantations.
Landsat OLI Bands Spectral Resolution (Micrometers)
Band 2—Blue0.452–0.512
Band 3—Green0.533–0.590
Band 4—Red0.636–0.673
Band 5—Near Infrared (NIR)0.851–0.879
Band 6—Shortwave Infrared SWIR 11.566–1.651
Band 7—Shortwave Infrared SWIR 22.107–2.294
Table 2. Vegetation indexes (VI) calculated from the reflectance data of the Landsat-8 Operational Land Imager (OLI) satellite bands for the detection and monitoring of leaf-cutting ant nests in Tectona grandis plantations.
Vegetation Indexes (VI) Reflectance
Atmospherically resistant vegetation index (ARVI)(Near infrared − 2Red − Blue)/(Near infrared + 2Red − Blue)
Land surface water index (LSWI)(Near infrared − Shortwave infrared 1)/(Near infrared + Shortwave infrared 1)
Modified normalized difference water index (MNDWI)(Green − Shortwave infrared 1)/(Green + Shortwave infrared 1)
Normalized burn ratio (NBR)(Near infrared − Shortwave infrared 2)/(Near infrared + Shortwave infrared 2)
Normalized difference vegetation index (NDVI)(Near infrared − Red)/(Near infrared + Red)
Photochemical reflectance index (PRI)(Blue − Green)/(Blue + Green)
Red green ratio index (RGI)Red/Green
Simple ratio (SR)Near infrared/Red

