Sensitivity of Seven MODIS Vegetation Indices to BRDF Effects during the Amazonian Dry Season


Instituto Nacional de Pesquisas Espaciais (INPE), Divisão de Sensoriamento Remoto, Caixa Postal 515, São José dos Campos 12245–970, SP, Brazil
*
Author to whom correspondence should be addressed.
Remote Sens. 2019, 11(14), 1650; https://0-doi-org.brum.beds.ac.uk/10.3390/rs11141650
Submission received: 29 May 2019
/
Revised: 28 June 2019
/
Accepted: 8 July 2019
/
Published: 11 July 2019
(This article belongs to the Special Issue Remote Sensing: 10th Anniversary)
Abstract
:We used Moderate Resolution Imaging Spectroradiometer (MODIS) data, processed by the multi–angle implementation of atmospheric correction (MAIAC) algorithm, to investigate the sensitivity of seven vegetation indices (VIs) to bidirectional reflectance distribution function (BRDF) effects in the dry season (June–September) of the Brazilian Amazon. The analysis was first performed over three sites, located from north to south of the Amazon, and then extended into the entire region. We inspected for differences in viewing–illumination parameters and pixel quality retrievals during MODIS data acquisition over the region. By comparing and correlating corrected and non–corrected data for bidirectional effects, we evaluated monthly changes in reflectance and VIs (2000–2014). Finally, we computed the effect size of the BRDF correction using non–parametric Mann–Whitney tests and Cohen’s r metrics. The results showed that the most anisotropic VIs were the enhanced vegetation index (EVI), photochemical reflectance index (PRI), and shortwave infrared normalized difference (SWND). These VIs presented the largest relative changes and the lowest correlation coefficients, between corrected and non–corrected data, because of the large effect size of the BRDF. The least anisotropic VI was the normalized difference water index (NDWI). The anisotropy of these VIs was stronger in the northern Amazon. It increased from the beginning to the end of the dry season, following changes in the relative azimuth angle (RAA) toward the BRDF hotspot in September. The modifications in the relative proportions of backscattering observations used in composite products caused a reflectance increase in all MODIS bands at the end of the dry season, especially in the near infrared (NIR). The reflectance decreased after BRDF correction. Because of the atmospheric effects, the view zenith angle (VZA) of the pixels selected in composite products decreased toward the south of the Amazon. In the southern Amazon, the seasonal amplitude in the solar zenith angle (SZA) reached values close to 18°. For the most anisotropic index, the BRDF correction removed, on average, 30% of the EVI signal in June, and 60% of the EVI signal in September, reducing dry season variations over time. The results reinforce the need for bidirectional correction of MODIS data before the seasonal and inter–annual analyses of the most anisotropic VIs.
Keywords:
BRDF; vegetation indices; Amazon; dry season; greening; viewing–illumination effects; MODIS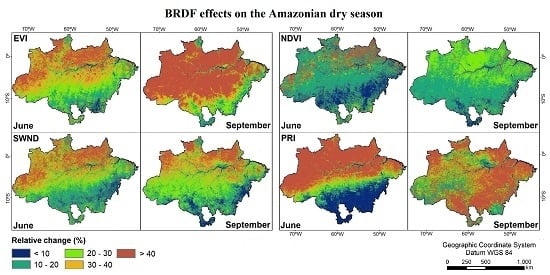
1. Introduction
Phenological studies on tropical forests of the Amazon are very important to understand the vegetation response to climatic variations over time, carbon cycling, eco–physiological and hydrologic processes, and land–atmosphere interactions [1,2,3,4]. Most remote sensing studies on vegetation phenology are based on vegetation indices (VIs) calculated from large field–of–view (FOV) instruments, such as the Moderate Resolution Imaging Spectroradiometer (MODIS) [5]. While large FOV instruments have the advantage of increasing the revisit time of the scene (almost daily observations), they also have the disadvantage of acquiring data that are much more sensitive to bidirectional effects than the data obtained by nadir viewing sensors [6].
Therefore, seasonal and inter–annual variations in land surface reflectance and VIs are generally observed from variable viewing–illumination geometry during MODIS data acquisition in the Amazon. Because of the non–Lambertian behavior of vegetation, its reflectance is affected by several factors, such as the view zenith angle (VZA), solar zenith angle (SZA), and relative azimuth angle (RAA), including the MODIS viewing direction (backscattering and forward scattering observations) [7]. Thus, depending on the VI used in the analysis, the effects of the bidirectional reflectance distribution function (BRDF) can add a significant non–biophysical signal into the time series [8]. In Amazonian tropical forests, BRDF effects are still present even in MODIS VI composite products because of the adverse conditions of the atmosphere to allow retrievals of nadir observations [9].
Despite the importance of the MODIS BRDF effects in the Amazon, a better comprehension of the non–biophysical factors (e.g., VZA, SZA, and RAA) causing surface reflectance anisotropy during the data acquisition is still missing. In addition, studies quantifying the magnitude of such effects over different VIs are also necessary. In fact, most of the vegetation phenological studies have focused on two structural VIs: The enhanced vegetation index (EVI) and the normalized difference vegetation index (NDVI). As shown in previous works, the EVI is much more sensitive to bidirectional effects than the NDVI, which saturates with increasing leaf area index (LAI) [10,11,12]. Furthermore, although the EVI has been associated with vegetation greening in the Amazon, it is, in fact, a structural VI because it is strongly dependent on the near infrared (NIR) reflectance. Thus, in principle, the EVI is more related to biophysical attributes (e.g., biomass, LAI) rather than greening [10].
In the Amazon, the study of the sensitivity of MODIS VIs to BRDF effects is also important for another reason. For instance, contradictory findings on the inter–annual behavior of the EVI has started a very important debate on the resilience of tropical forests to severe droughts [12,13,14,15]. Even its seasonal behavior, represented by an EVI increase from the beginning to the end of the Amazonian dry season with increasing water deficit and solar radiation, is not completely understood [10,16,17]. Thus, because all MODIS VIs are affected, to some extent, by both biophysical and non–biophysical factors, there is a need to evaluate quantitatively the magnitude of the BRDF effects over the VI determination.
Part of the observational uncertainties in the Amazon on the VIs’ behavior has been associated with the quality of the data, affected by high atmospheric aerosol loadings and by deficiencies in cloud detection and screening [15,18]. Another part comes from the directional effects on the surface reflectance, which can be compensated by the use of different methods of BRDF correction [19,20]. The BRDF correction is important even for the combination of narrow FOV observations from the Landsat–8 and Sentinel–2 satellites. It has been used for the generation of the Harmonized Landsat/Sentinel–2 (HLS) product [21].
Therefore, to reduce these uncertainties and improve atmospheric correction of MODIS data, new approaches have been proposed. An example is the multi–angle implementation of atmospheric correction (MAIAC) algorithm, which applies rigorous cloud screening and atmospheric correction to obtain surface reflectance without typical empirical assumptions [22]. Additionally, MAIAC provides the necessary information for optionally correcting MODIS data for BRDF effects, through reflectance normalization to nadir viewing and to a fixed SZA (45°). Therefore, the BRDF correction can reduce the error and bias associated with viewing–illumination geometry that will affect the MODIS VIs differently [23].
In this study, we evaluated the sensitivity of seven MODIS (MAIAC) VIs to BRDF effects during the dry season of the Amazon. The VIs, operating in different spectral regions, were selected to represent vegetation structure, biochemistry, and plant physiology. The analysis was first performed over three sites, located along a latitudinal gradient from north (site 1) to south (site 3) of the Amazon, and then extended into the entire region. We inspected for differences in the factors that potentially affect the BRDF (e.g., VZA, SZA, and RAA) and in the quality of MODIS pixel retrievals. By comparing and correlating corrected and non–corrected MODIS (MAIAC) data for BRDF effects, we evaluated the magnitude of the bidirectional effects over the reflectance and VIs in the 2000 to 2014 period.
2. Methodology
2.1. Site Selection in the Study Area
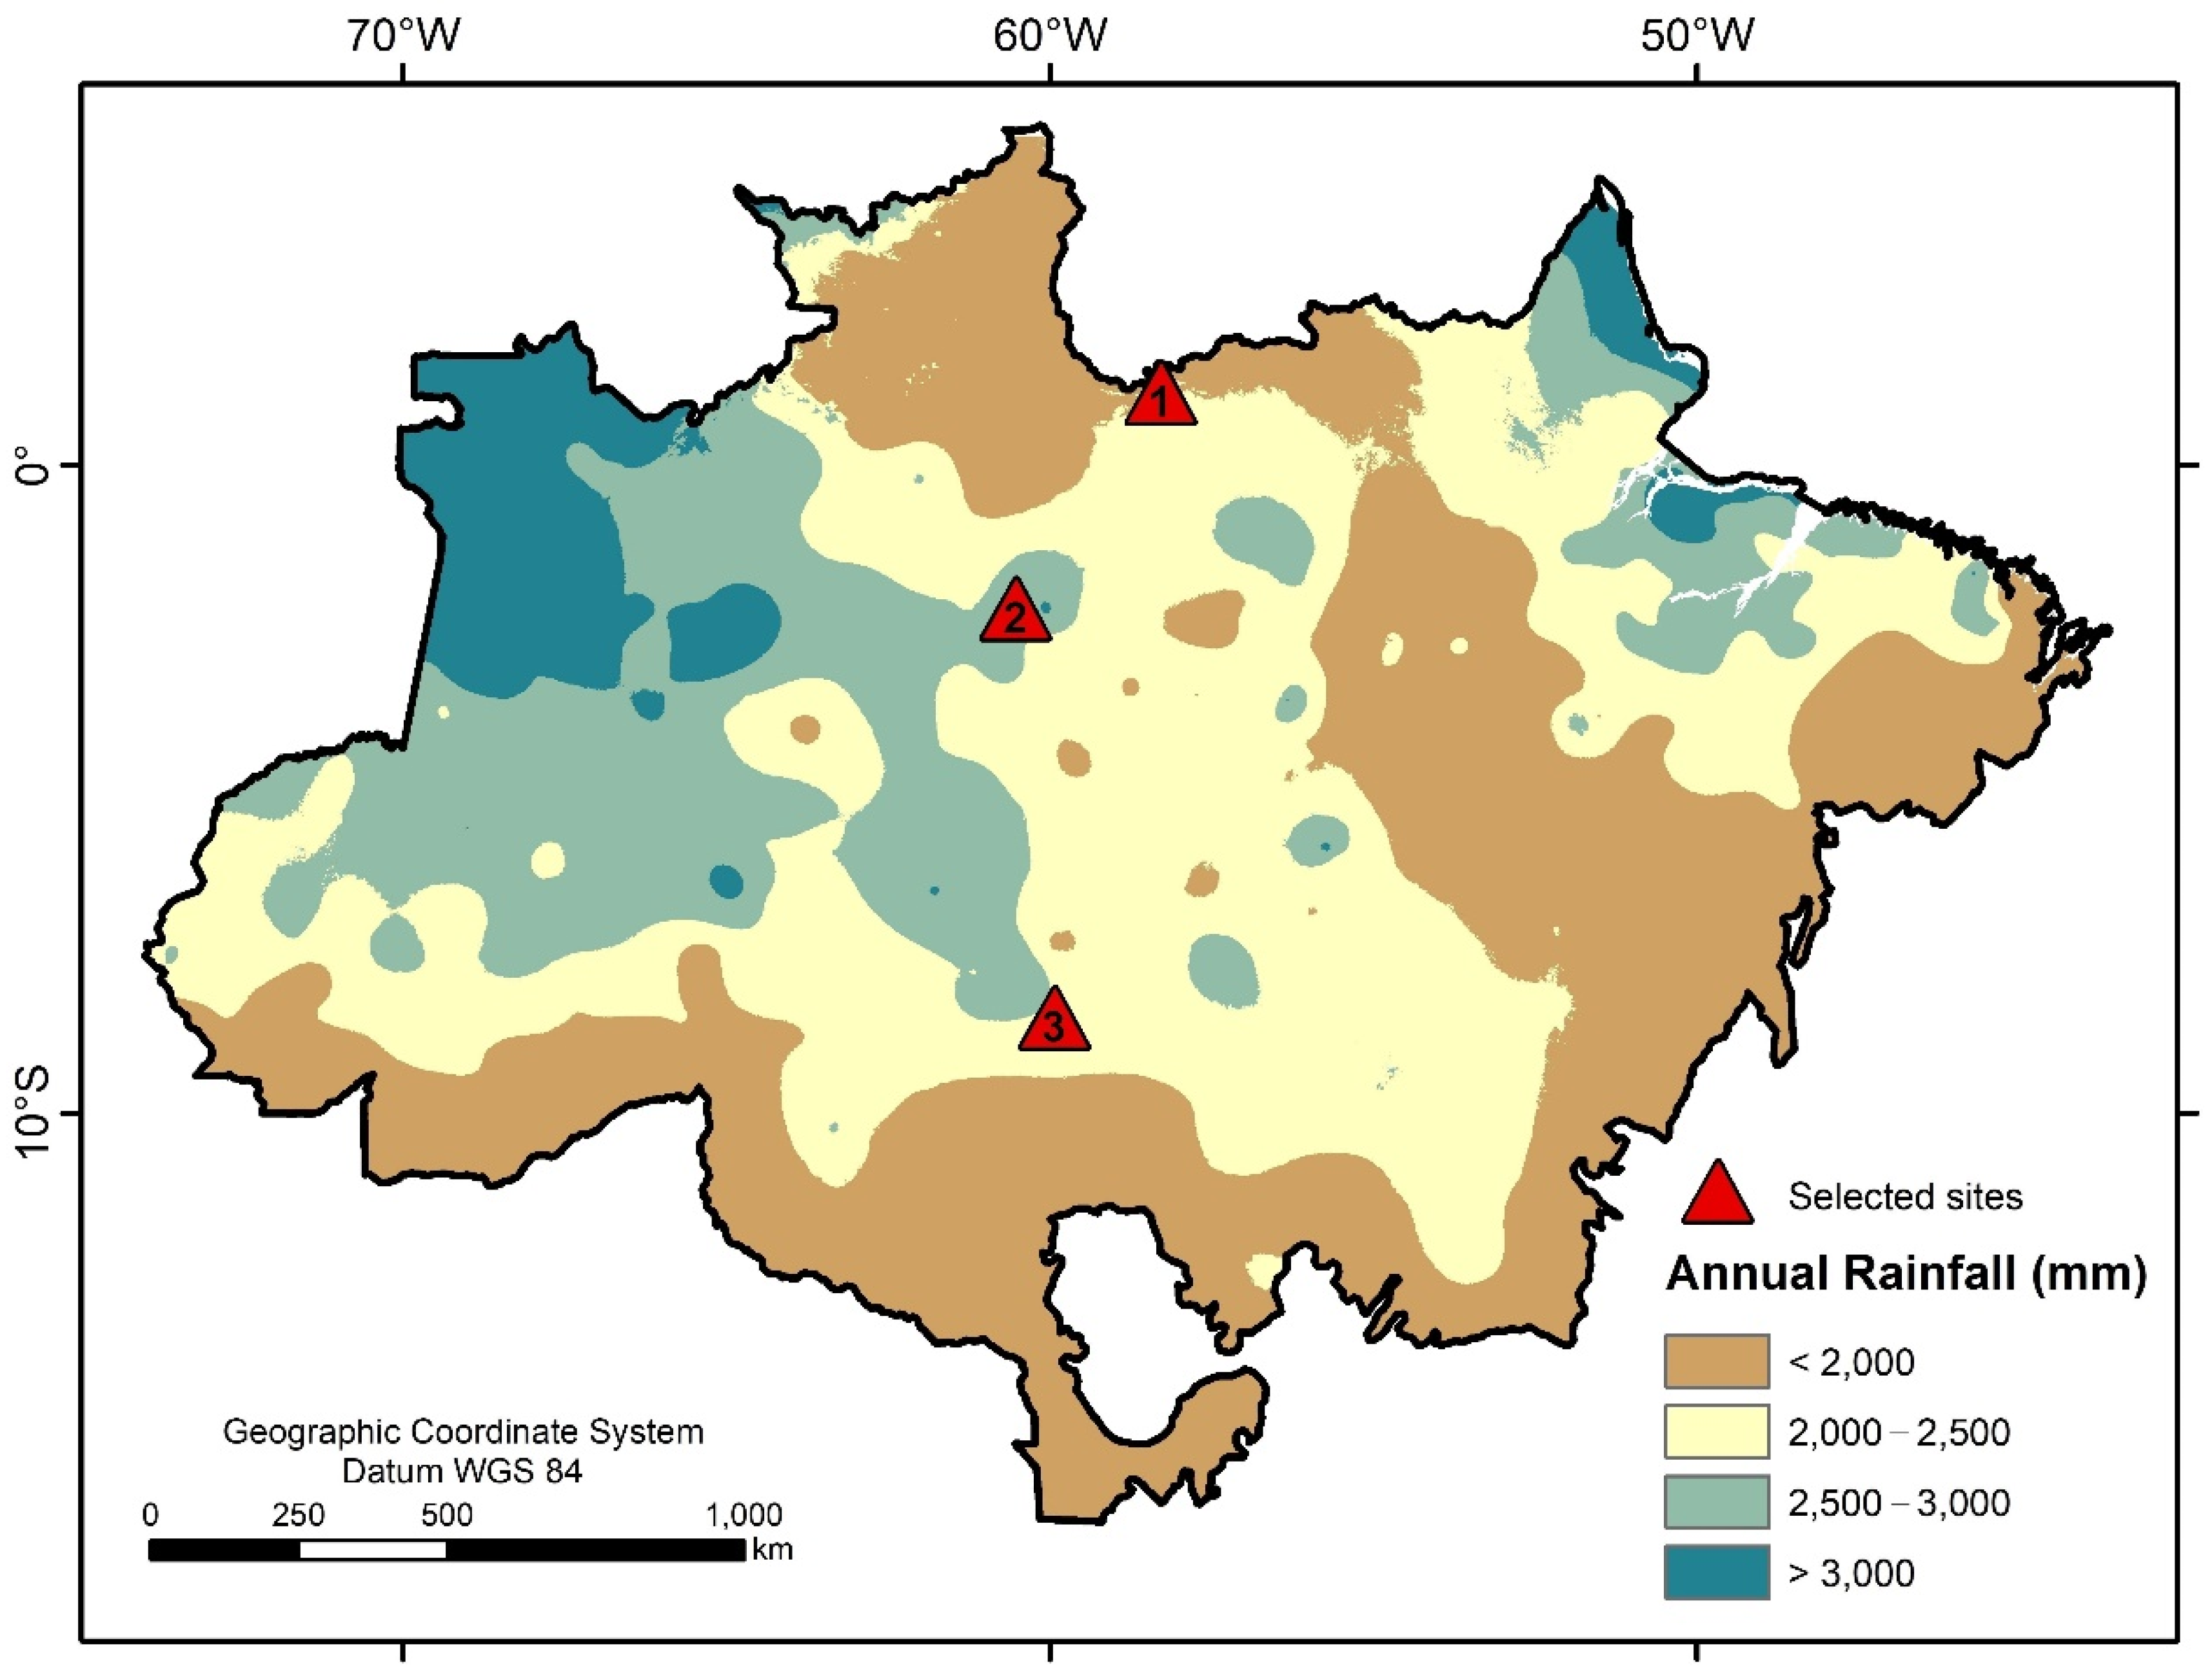
The study area comprises the entire Amazon region in Brazil. For detailed inspection of the results, we selected three sites located at variable latitudes and at approximately the same longitude (60°W in Figure 1). Table 1 presents the main characteristics of the studied sites. Site 1 includes the western part of the Grão–Pará Ecological Station located in northern Amazon, while site 3 is the Aripuanã National Forest located in southern Amazon. Finally, site 2 comprises multiple contiguous conservation units in Manaus. As shown in Table 1, the predominant vegetation type in all sites is dense ombrophilous forest and the length of the dry season ranges from one to three months. As discussed by Moura et al. [23], the beginning and length of the dry season vary in the Amazon, but the period between June and September is generally representative of this season. Hereafter, we will refer to the dry season, in the Amazon, as the period between June and September.
In our analysis, the selection of these sites represents differences in the SZA amplitude during the dry season. The amplitude increases from north (site 1) to south (site 3) of the Amazon toward middle latitudes. The selection of these sites also indicates changes in the average annual precipitation and cloud cover conditions, which are more adverse toward the equator. These factors can potentially affect the quality of MODIS observations and the magnitude of the BRDF effects. Monthly estimates from the tropical rainfall measurement mission (TRMM) also showed increasing water deficits from north to south in the June to September period [23,24].
2.2. MODIS (MAIAC) Datasets and Selected Vegetation Indices (VIs)
We used two MODIS atmospherically processed datasets by the MAIAC: One non–corrected for BRDF effects and the other corrected for them. Both datasets were processed at a 1 km spatial resolution and aggregated into 16–day composite intervals during the 2000–2014 period. MAIAC is an advanced algorithm that uses adaptive time series analysis and a combination of pixel– and image–based processing to derive atmospheric aerosol concentration and surface reflectance [22]. It uses a radiative transfer model that does not make a Lambertian assumption. Details on this algorithm are provided in several references [25,26].
In this study, we used the Ross–Thick Li–Sparse (RTLS) volumetric and geometric–optics kernel function values provided by MAIAC for normalizing the surface reflectance of the MODIS bands to a fixed viewing geometry (nadir; VZA = 0° and to a fixed illumination configuration (SZA = 45°). The procedures for BRDF normalization were described in detail by Lyapustin et al. [22,25]. The following MODIS bands were corrected for BRDF effects: 1 (620–670 nm); 2 (841–876 nm); 3 (459–479 nm); 4 (545–565 nm); 5 (1230–1250 nm); 6 (1628–1652 nm); 7 (2105–2155 nm); 11 (526–536 nm); and 12 (546–556 nm). Using this set of bands, we calculated seven VIs from data corrected and non–corrected for BRDF effects. Equations and references for these VIs are listed in Table 2.
First, to evaluate the BRDF sensitivity of canopy structural VIs, we selected the NDVI [27] and EVI [28], which are used to map biophysical attributes, such as aboveground biomass and LAI. These two VIs are part of the conventional MODIS vegetation index products. Second, to represent biochemistry, especially canopy water or vegetation moisture, we calculated the normalized difference water index (NDWI) [29], normalized difference infrared index (NDII) [30], and the shortwave infrared normalized difference (SWND). The last index was proposed in this study to evaluate the sensitivity of the SWIR–2 spectral interval to bidirectional effects. Finally, we included in the analysis the photochemical reflectance index (PRI) [31] and the green–red normalized difference (GRND) [17], which are VIs associated with plant physiology. While the PRI is related to the light use efficiency for photosynthesis [31], the GRND is potentially sensitive to leaf flushing [17].
2.3. Data Analysis
We divided the data analysis into three parts. In the first part, the ancillary information provided by the MAIAC and the Collection 6 MOD13A2 16–day 1 km product was analyzed. We obtained parameters on the viewing–illumination geometry and pixel quality retrievals (atmospheric conditions) during MODIS data acquisition (2000–2014). Over each site, to ensure confidence in the data analysis, we randomly selected 100 pixels. The objective was to evaluate seasonal changes in the relative frequency of high–quality pixel retrievals in composite products as well as modifications in the VZA and SZA. Based on the RAA, we determined the predominant viewing direction during data acquisition. RAA values close to zero represent the forward scattering direction with a predominance of shaded canopy components for the sensor (maximum shadows), while values close to 180° indicate the backscattering direction (hot spot observations) with a predominance of sunlit canopy components for MODIS.
In the second part of the data analysis, we inspected the modifications in the reflectance of the MODIS bands used to calculate the VIs due to BRDF effects. We focused our analysis on the dry season (June to September), a more favorable period of satellite observations in the Amazon, when important changes in vegetation phenology have been reported in the literature (e.g., greening, leaf flushing, modifications in LAI). In addition to the 100 pixels randomly selected over each site, we added into the analysis 4500 pixels randomly distributed over the entire Amazon region in Brazil. We plotted the MODIS reflectance spectra of the Amazonian forests, before and after the BRDF correction. In addition, we compared the monthly average surface reflectance (2000–2014) from the MODIS bands corrected and non–corrected for bidirectional effects.
The last part of the data analysis focused on the sensitivity of the MODIS VIs to BRDF effects using different strategies. First, we compared the average response of the VIs over the sites using corrected and non–corrected data. Then, we calculated, on a per pixel basis, the average monthly relative changes (2000–2014) for each VI, during the dry season, derived from the BRDF correction. Furthermore, to evaluate the anisotropy of each VI, we selected window sizes of 16 pixels (4 × 4 pixels) and moved them through the images of each month in the 2000–2014 period. The objective was to determine Pearson’s correlation coefficients between BRDF–corrected and non–corrected VIs. Because the scale differences between the VIs could affect the relative change results, we also computed for each VI the effect size of the BRDF correction over each site. Using the non–parametric Mann–Whitney test (α = 0.05) and new pixels selected randomly (n = 100 per site), we tested whether the median values differed for each site between corrected and non–corrected BRDF data from June to September of 2002. This non–drought year was selected because of the contradictory findings on the forest response to the 2005 and 2010 severe droughts [12,13,14,15]. To describe the magnitude of BRDF effects over each VI, we calculated the Cohen’s r metric of effect size [32] from the Mann–Whitney U values and plotted the results as a function of the dry season.
3. Results
3.1. Seasonal Variations in Pixel Quality Retrieval and Viewing–Illumination Parameters
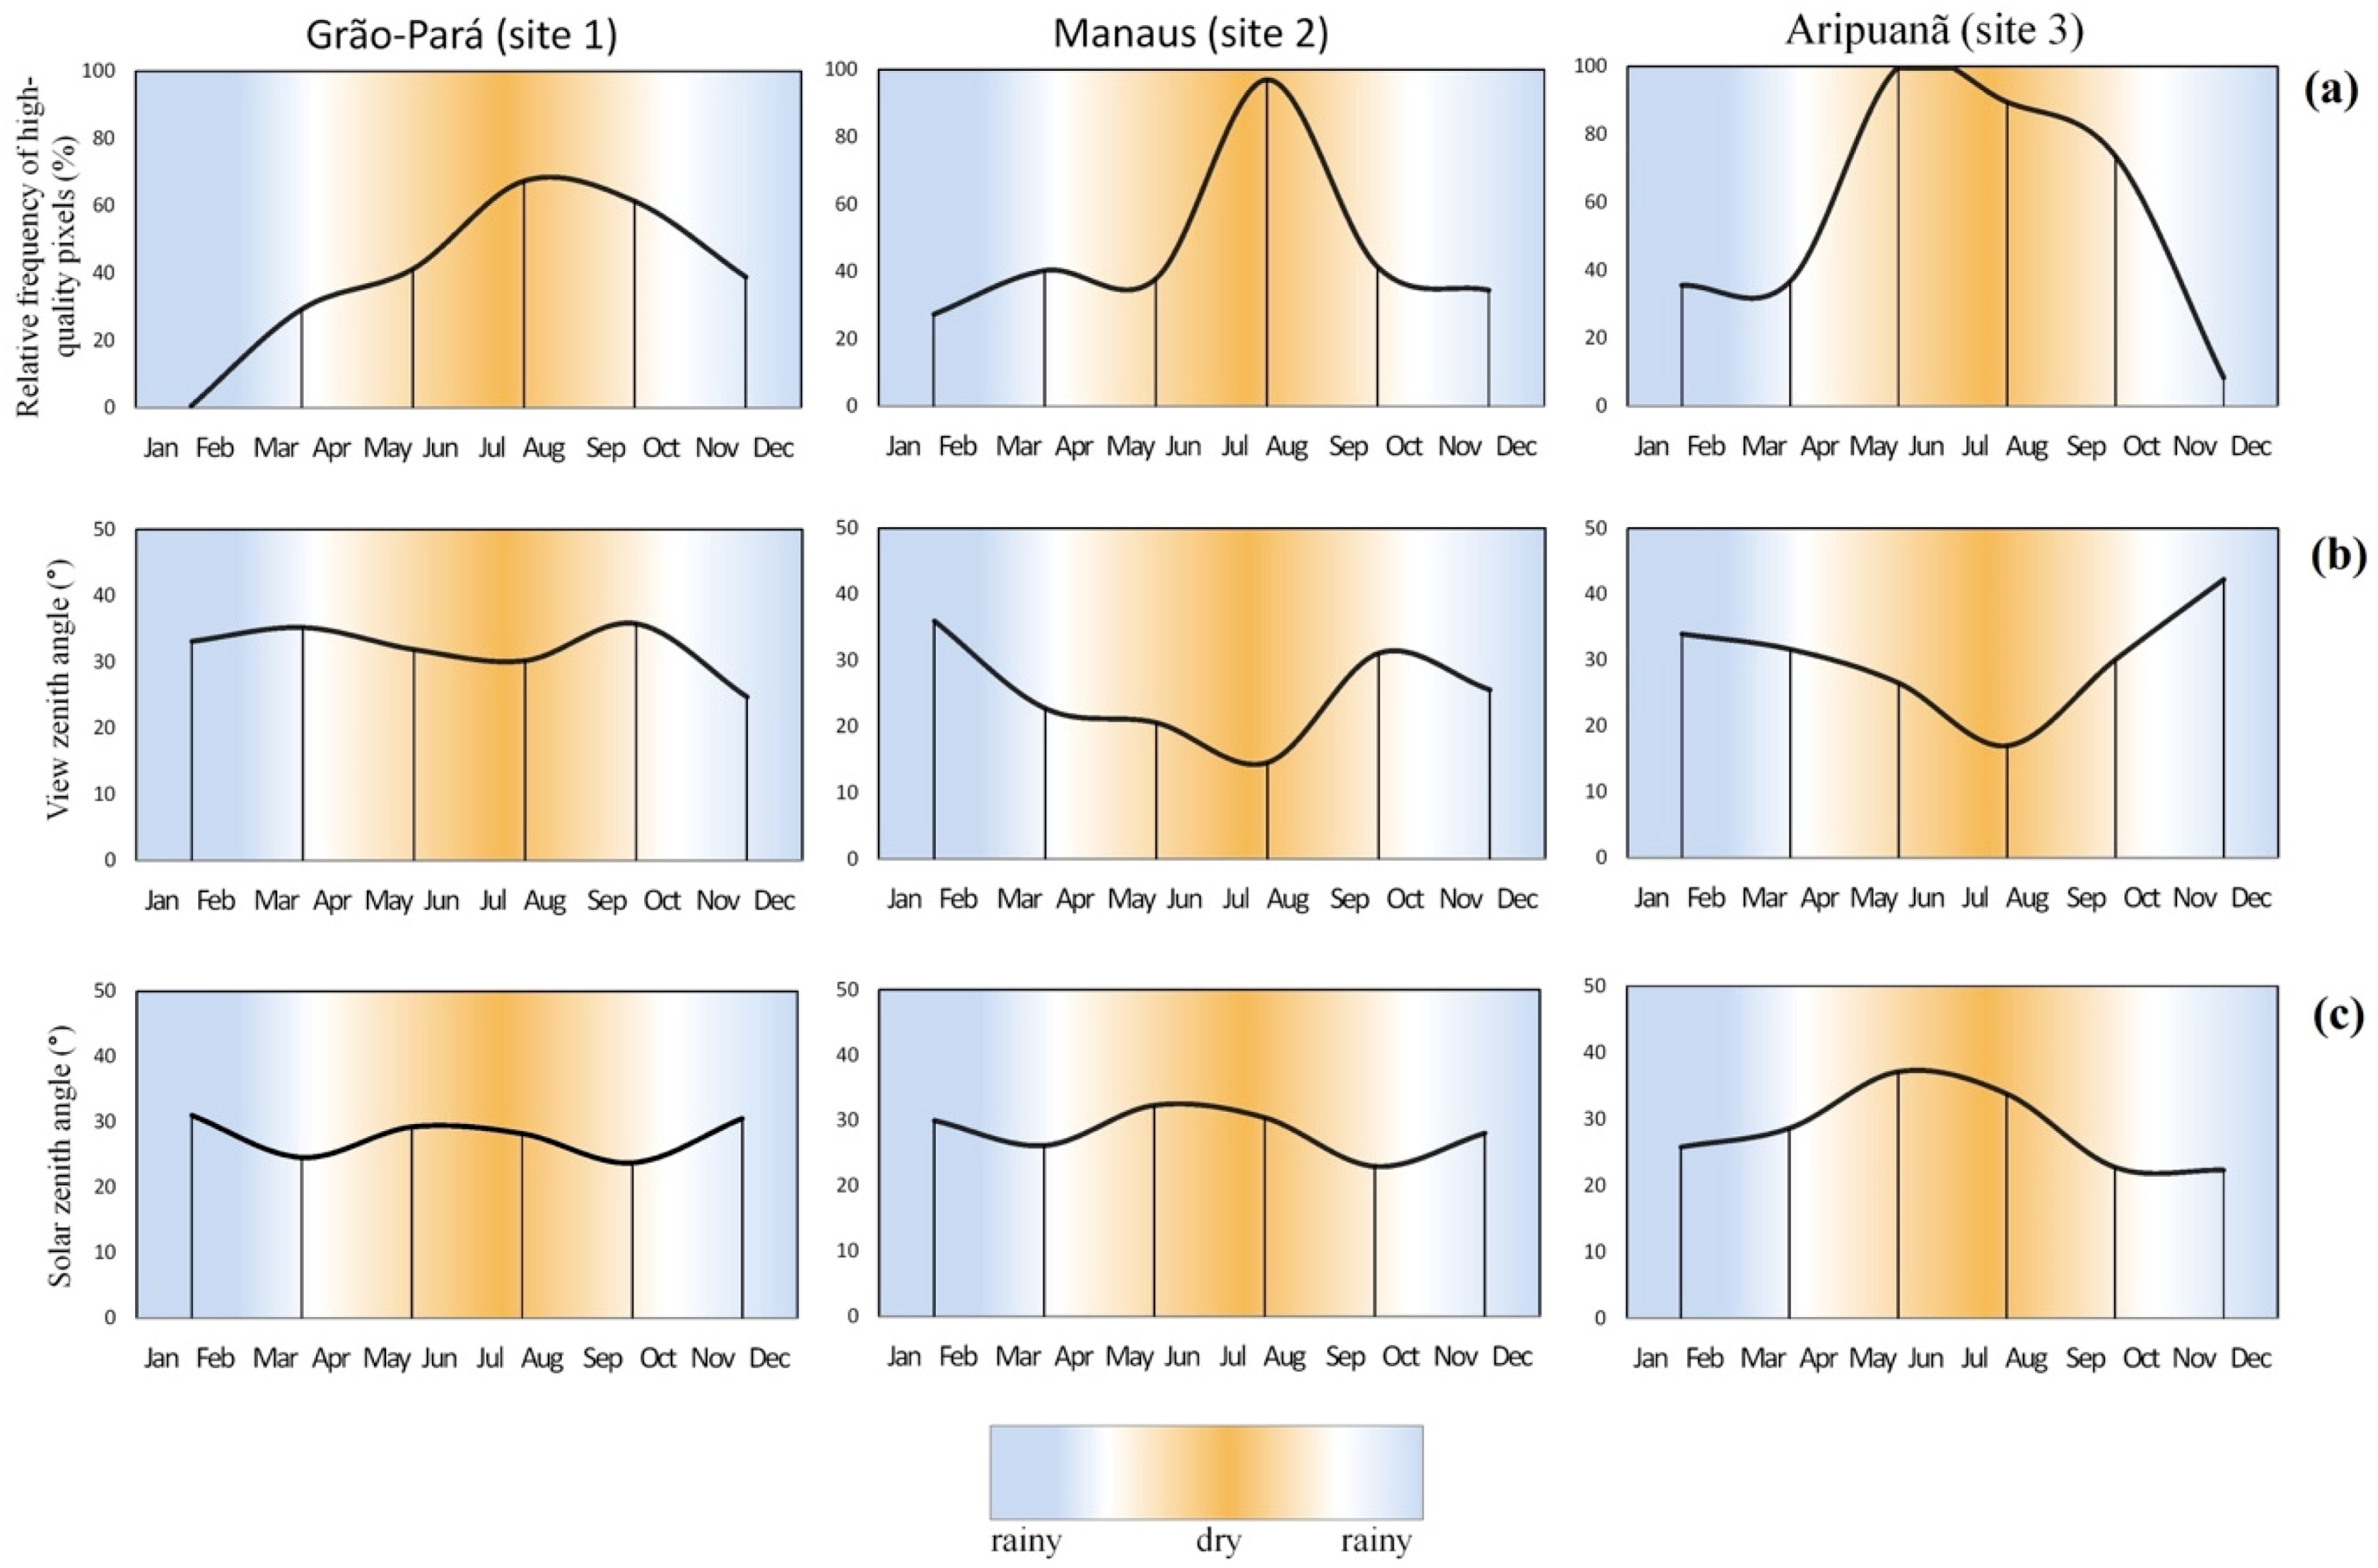
From north (site 1) to south (site 3) of the Amazon, we observed differences in the frequency of high–quality pixel retrievals and in viewing–illumination parameters, which could potentially affect the BRDF (Figure 2). For all sites, the quality of the pixels retrieved by the MAIAC decreased from the rainy to the dry season (Figure 2a). During the dry season (June to September), because of the persistent cloud cover in the northern Amazon, lower frequencies of high–quality pixels were verified for site 1 (20% to 60%) than for the other two sites (60% to 100%). Because of the more unfavorable atmospheric conditions in the northern Amazon, the VZA of the pixels selected in the 16 day composite products decreased from site 1 (close to 30°) to site 3 (close to 20°) during the dry season (Figure 2b). VZA values higher than 25° produce BRDF effects, but this viewing parameter is generally constrained in composite products during pixel selection. The SZA amplitude between the rainy and dry seasons increased with latitude toward the south of the Amazon, from site 1 (6°) to site 3 (18°), as expected (Figure 2c). Therefore, the results of Figure 2 indicated potentially a greater influence of the viewing effects on the reflectance measured by MODIS in the northern Amazon, when compared to the more localized influence of solar illumination effects in the southern Amazon.
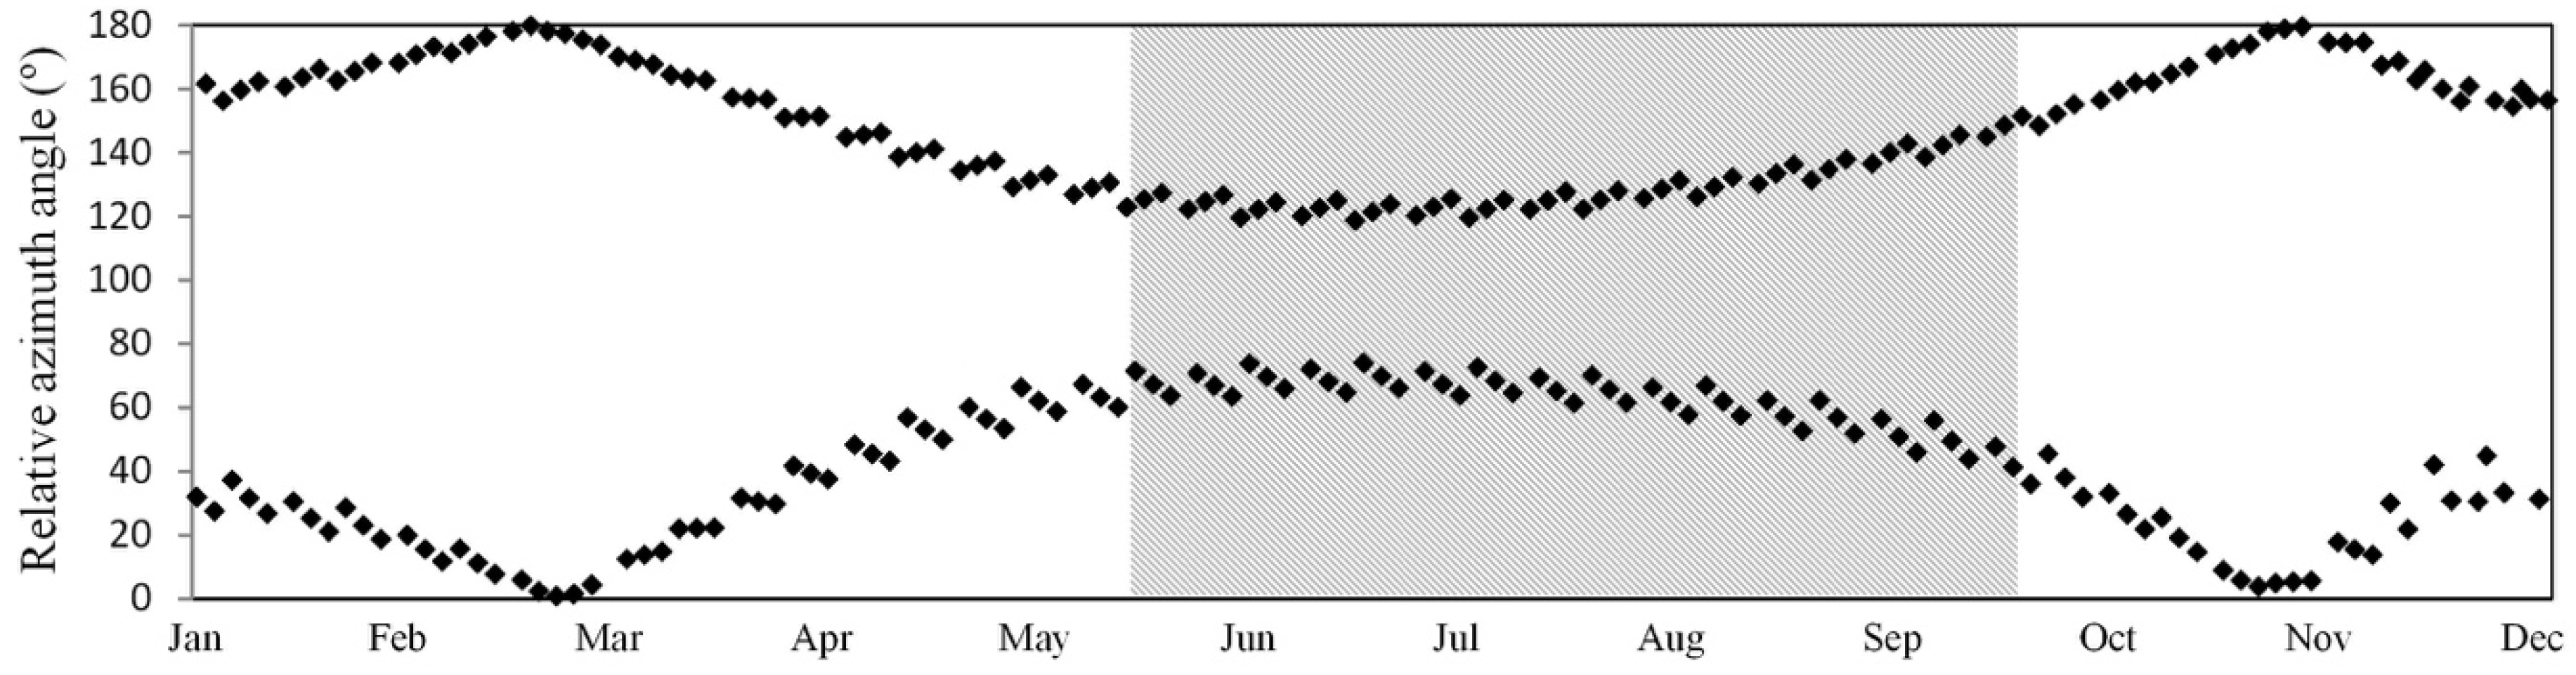
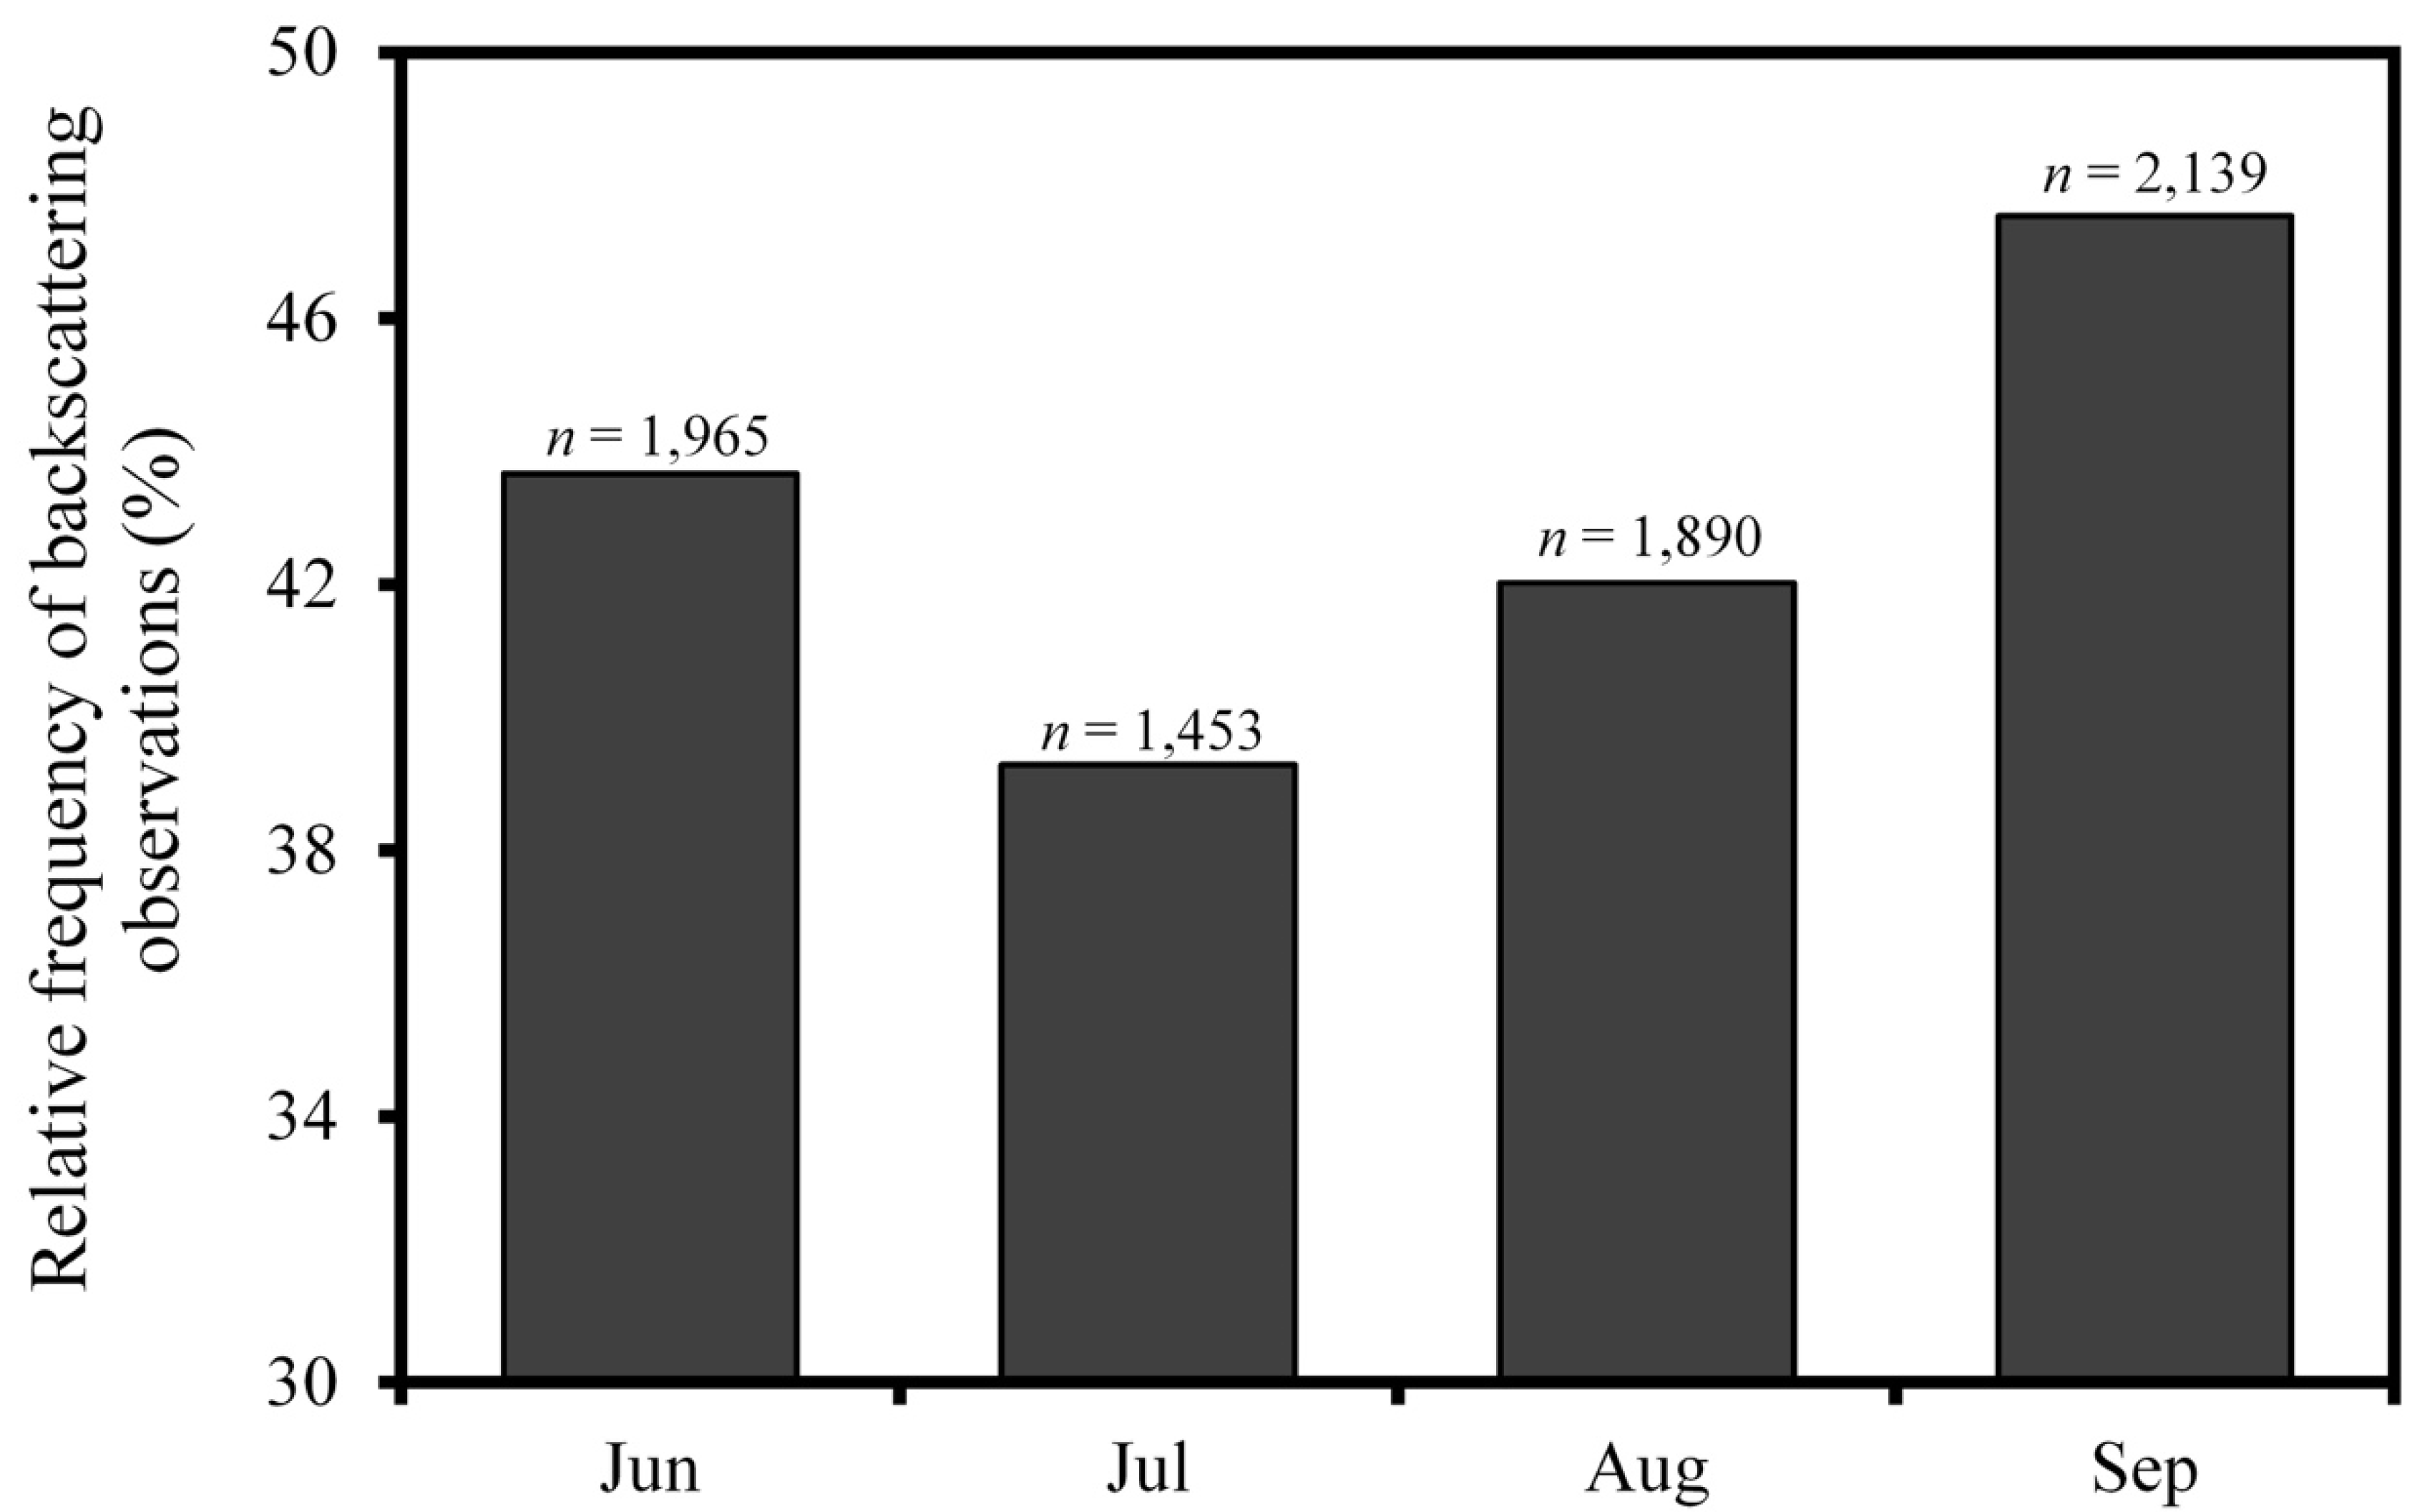
Another very important factor contributing to bidirectional effects is the RAA, which changes from the beginning to the end of the dry season into the principal plane (0°–180° azimuth direction) for the entire Amazon region. For instance, opposite RAA values in Figure 3 (top and bottom data) represent changes in the viewing direction during consecutive MODIS overpasses. During MODIS overpasses in Manaus (site 2), the scanning plane ranges from 60° to 135° in the RAA in June to July (Figure 3). Towards the end of the dry season in September, there are many observations from the RAA near 180°, which represents the BRDF hotspot (Figure 3). In practice, because of the relative modifications in the RAA during the dry season, the reflectance tends to increase in all MODIS bands toward September due to greater amounts of energy detected by the sensor. In composite VI products, there was a relative increase in the amount of backscattering pixels toward the end of the dry season (RAA close to 180°) (Figure 4). It produces a seasonal influence of a non–biophysical signal on the time series resultant from RAA variations. This factor increases the reflectance, especially at the end of the dry season, and in the NIR interval. Because of the increase in NIR reflectance, the EVI from the backscattering direction will be greater than the EVI from the forward scattering direction.
3.2. Variations in the Reflectance of Tropical Forests from Corrected and Non–Corrected BRDF Data
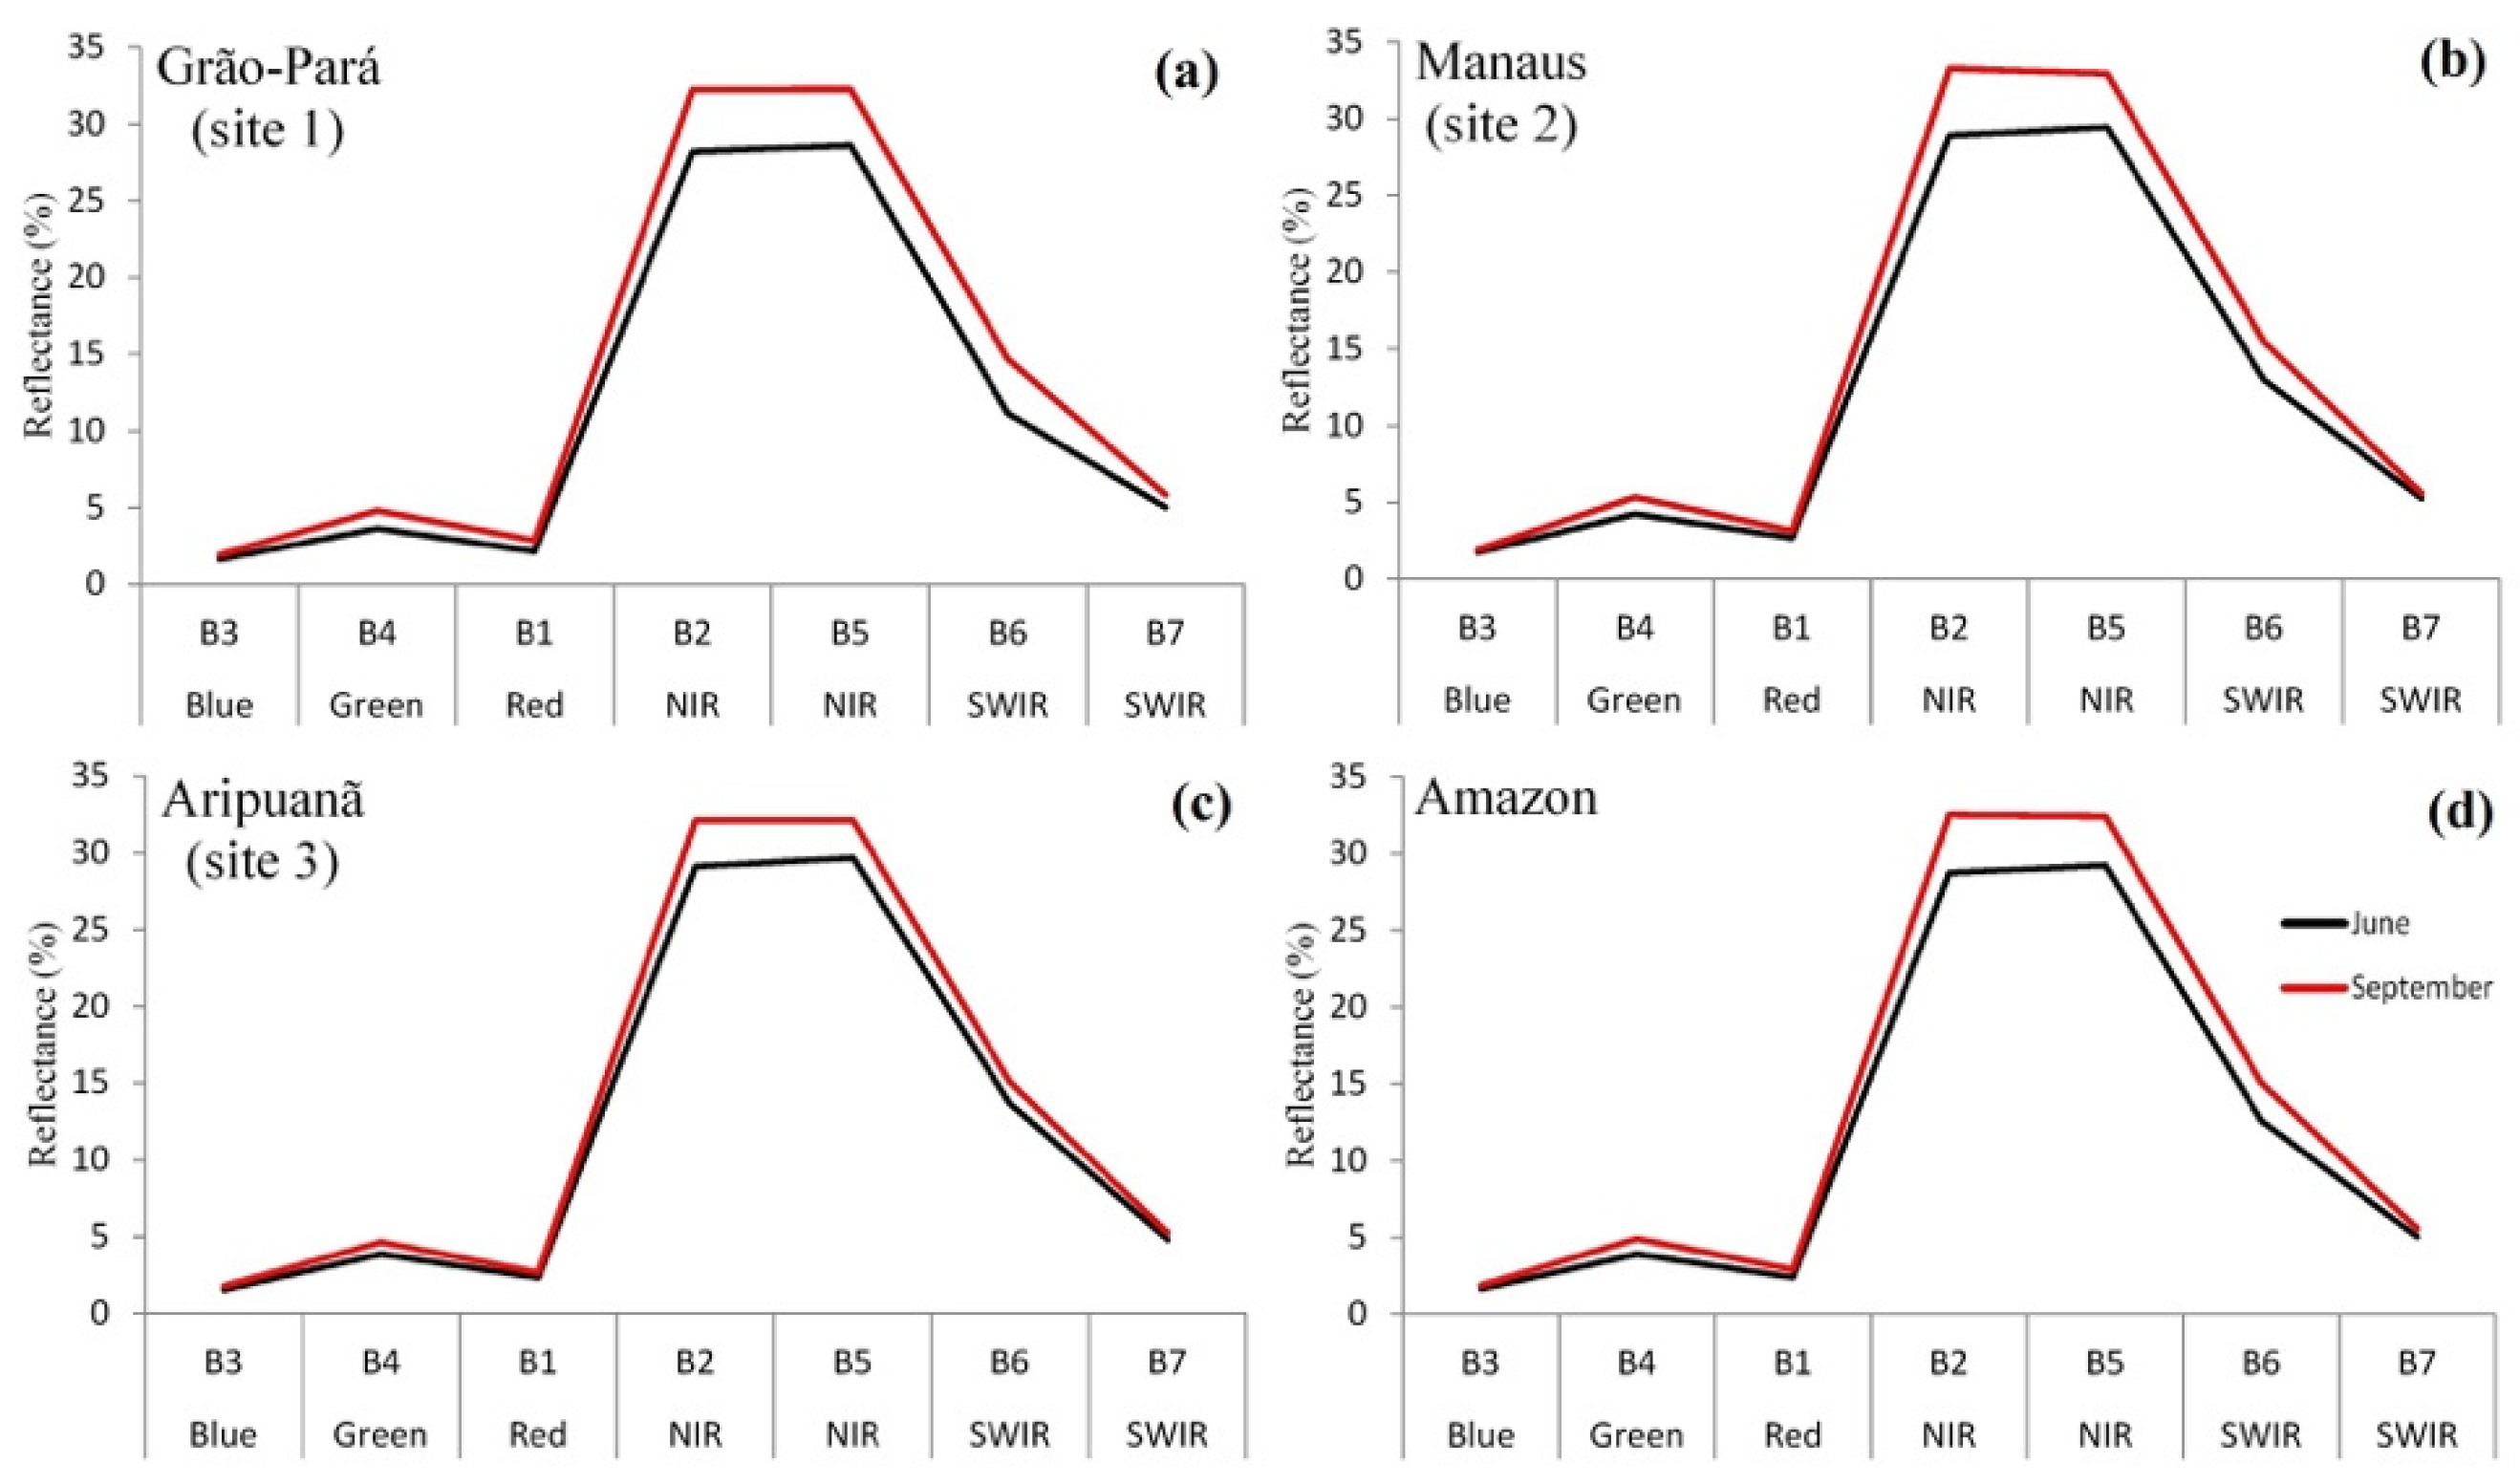
For data non–corrected for BRDF effects, the surface reflectance of dense ombrophilous forests showed increasing values in the first seven MODIS bands from the beginning (June) to the end (September) of the Amazonian dry season (Figure 5). This pattern was observed over the three sites for this type of forest as well as over the entire Amazon region. The greatest differences in absolute reflectance values (up to 7%) were noted in the NIR (MODIS bands 2 and 5).
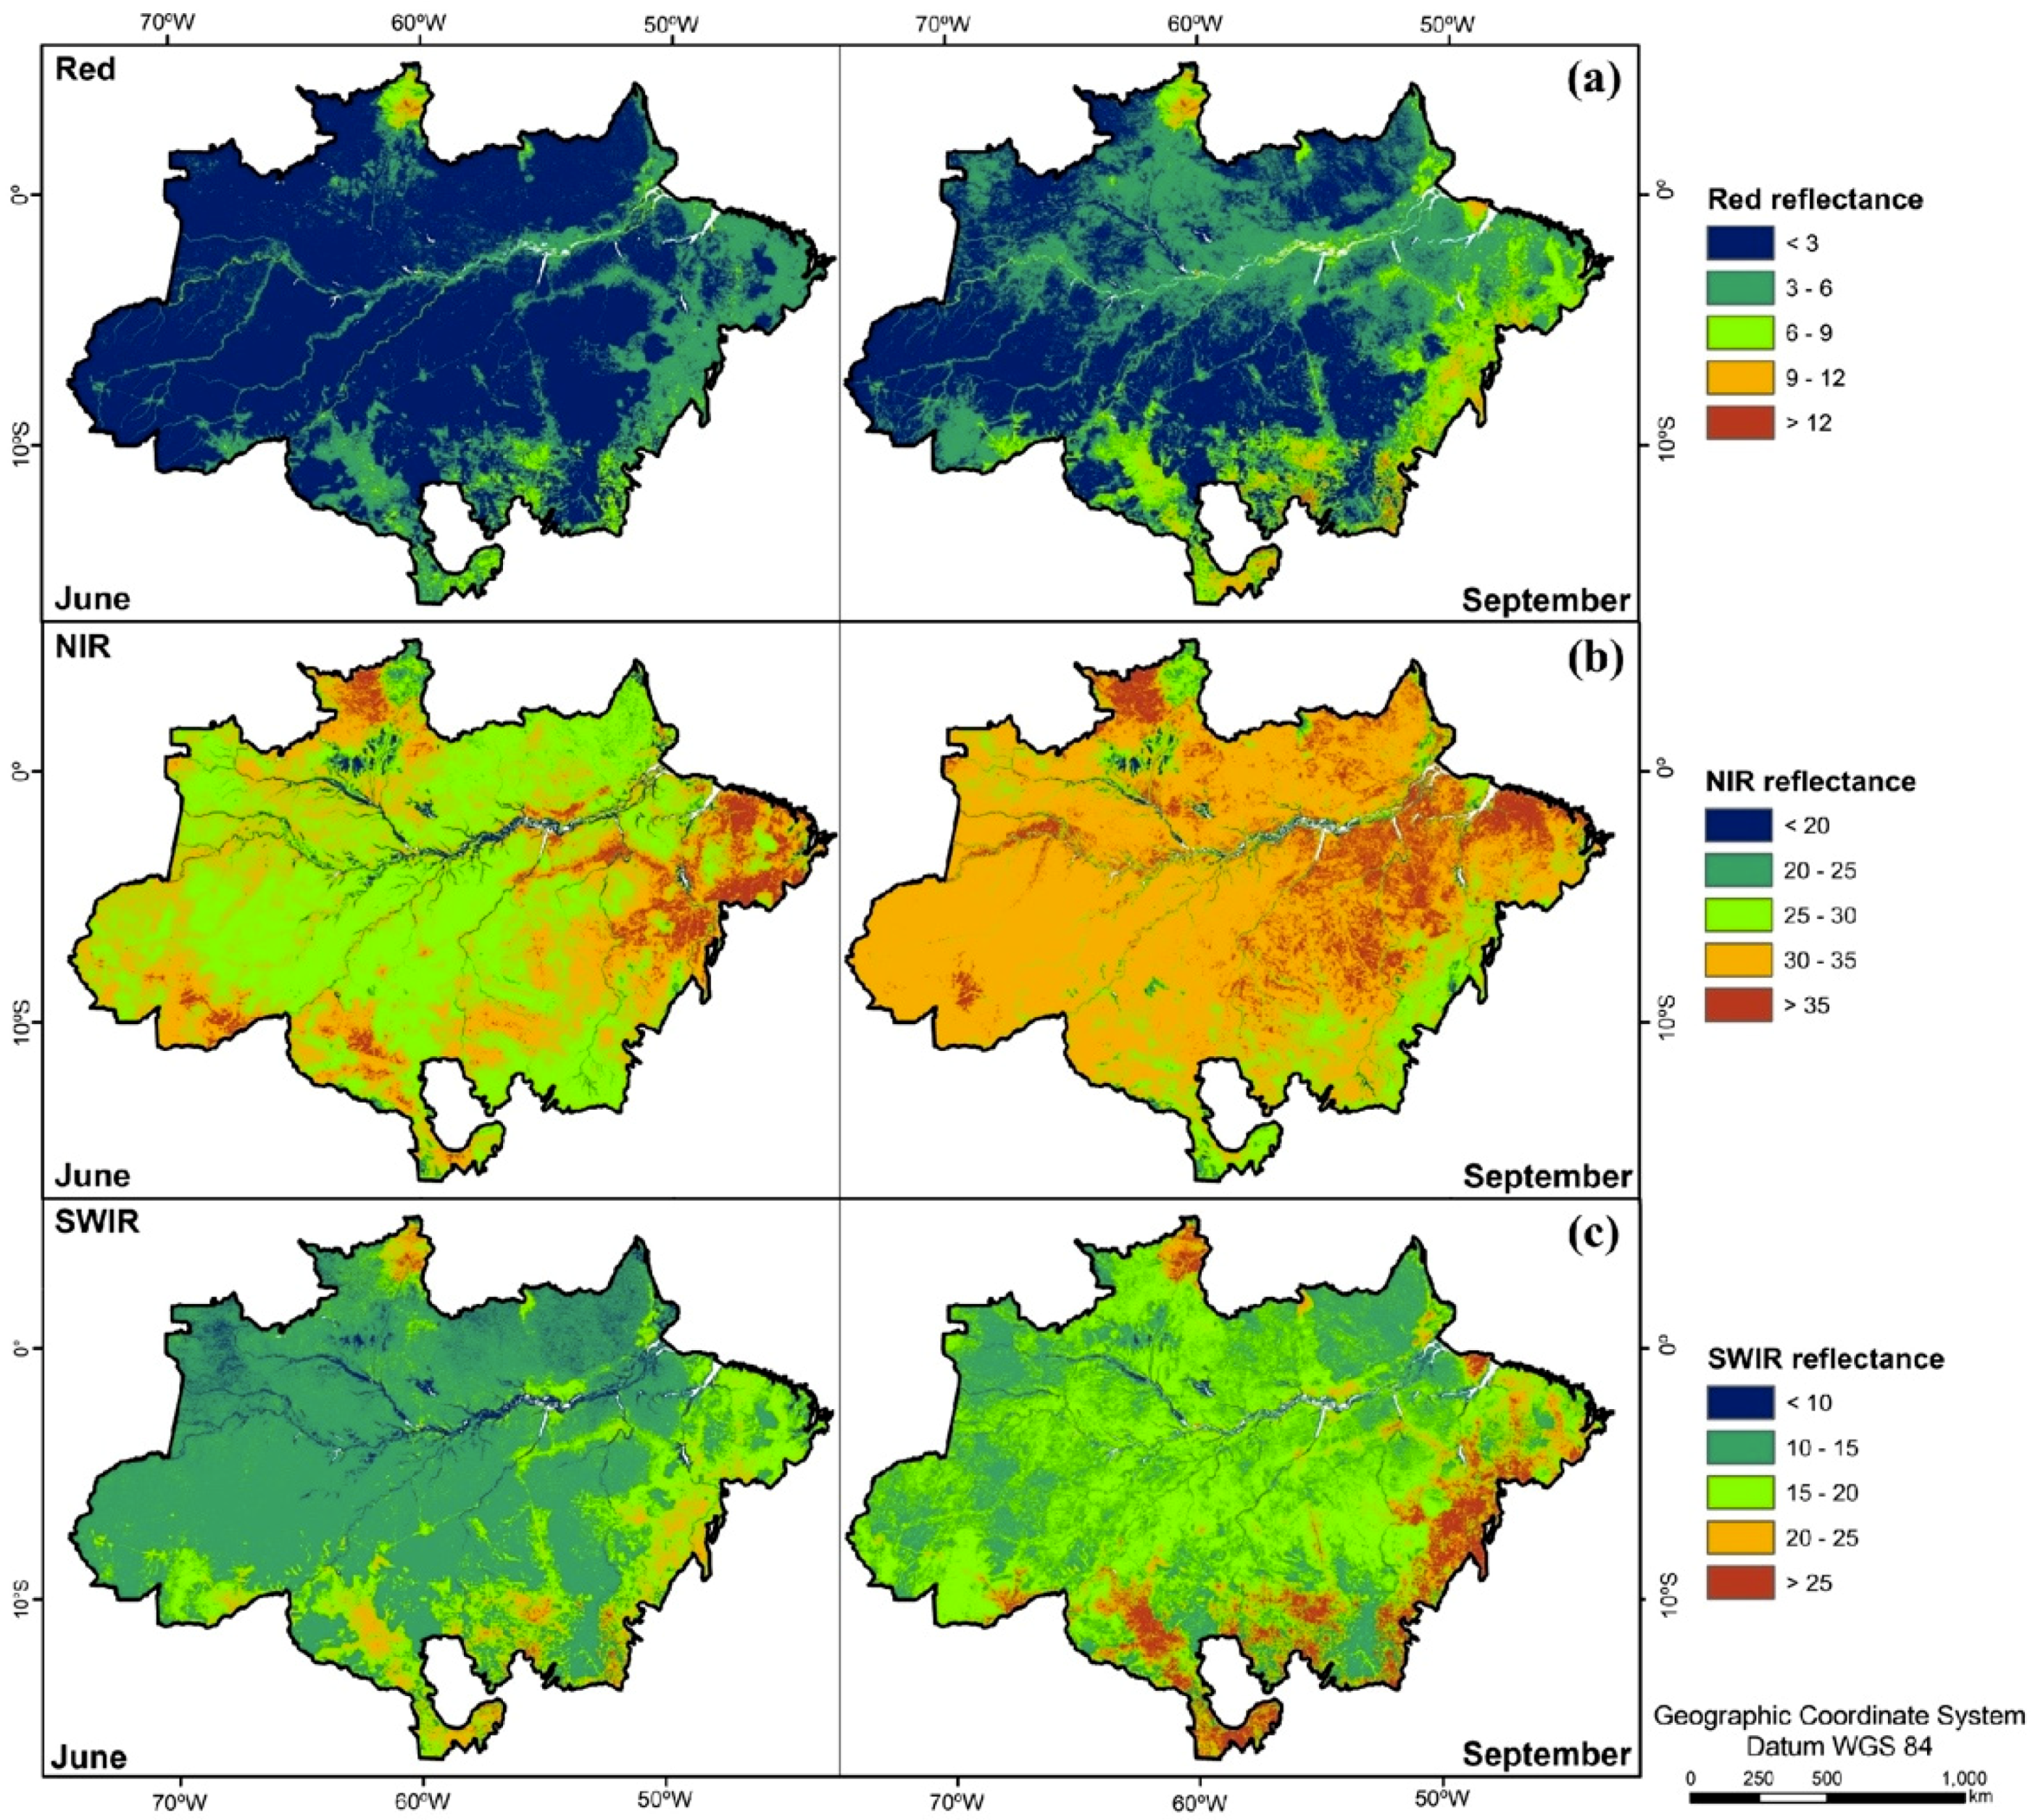
A detailed inspection of the MODIS surface reflectance images in the red (band 1), NIR (band 2), and SWIR (band 6) confirmed the consistency of the results of Figure 5. As shown in Figure 6, the reflectance of the red, NIR, and SWIR bands increased from June to September, or toward the end of the dry season. The overall reflectance increase observed in these bands (2000–2014 period) is mostly produced by BRDF effects, as deduced from a simple comparison between non–corrected (Figure 6) and BRDF–corrected (Figure 7) surface reflectance. In Figure 7, the reflectance differences between June and September were greatly reduced after the correction of the bidirectional effects, as indicated by the approximately similar colors between the images from June and September.
3.3. BRDF Effects on Vegetation Indices (VIs)
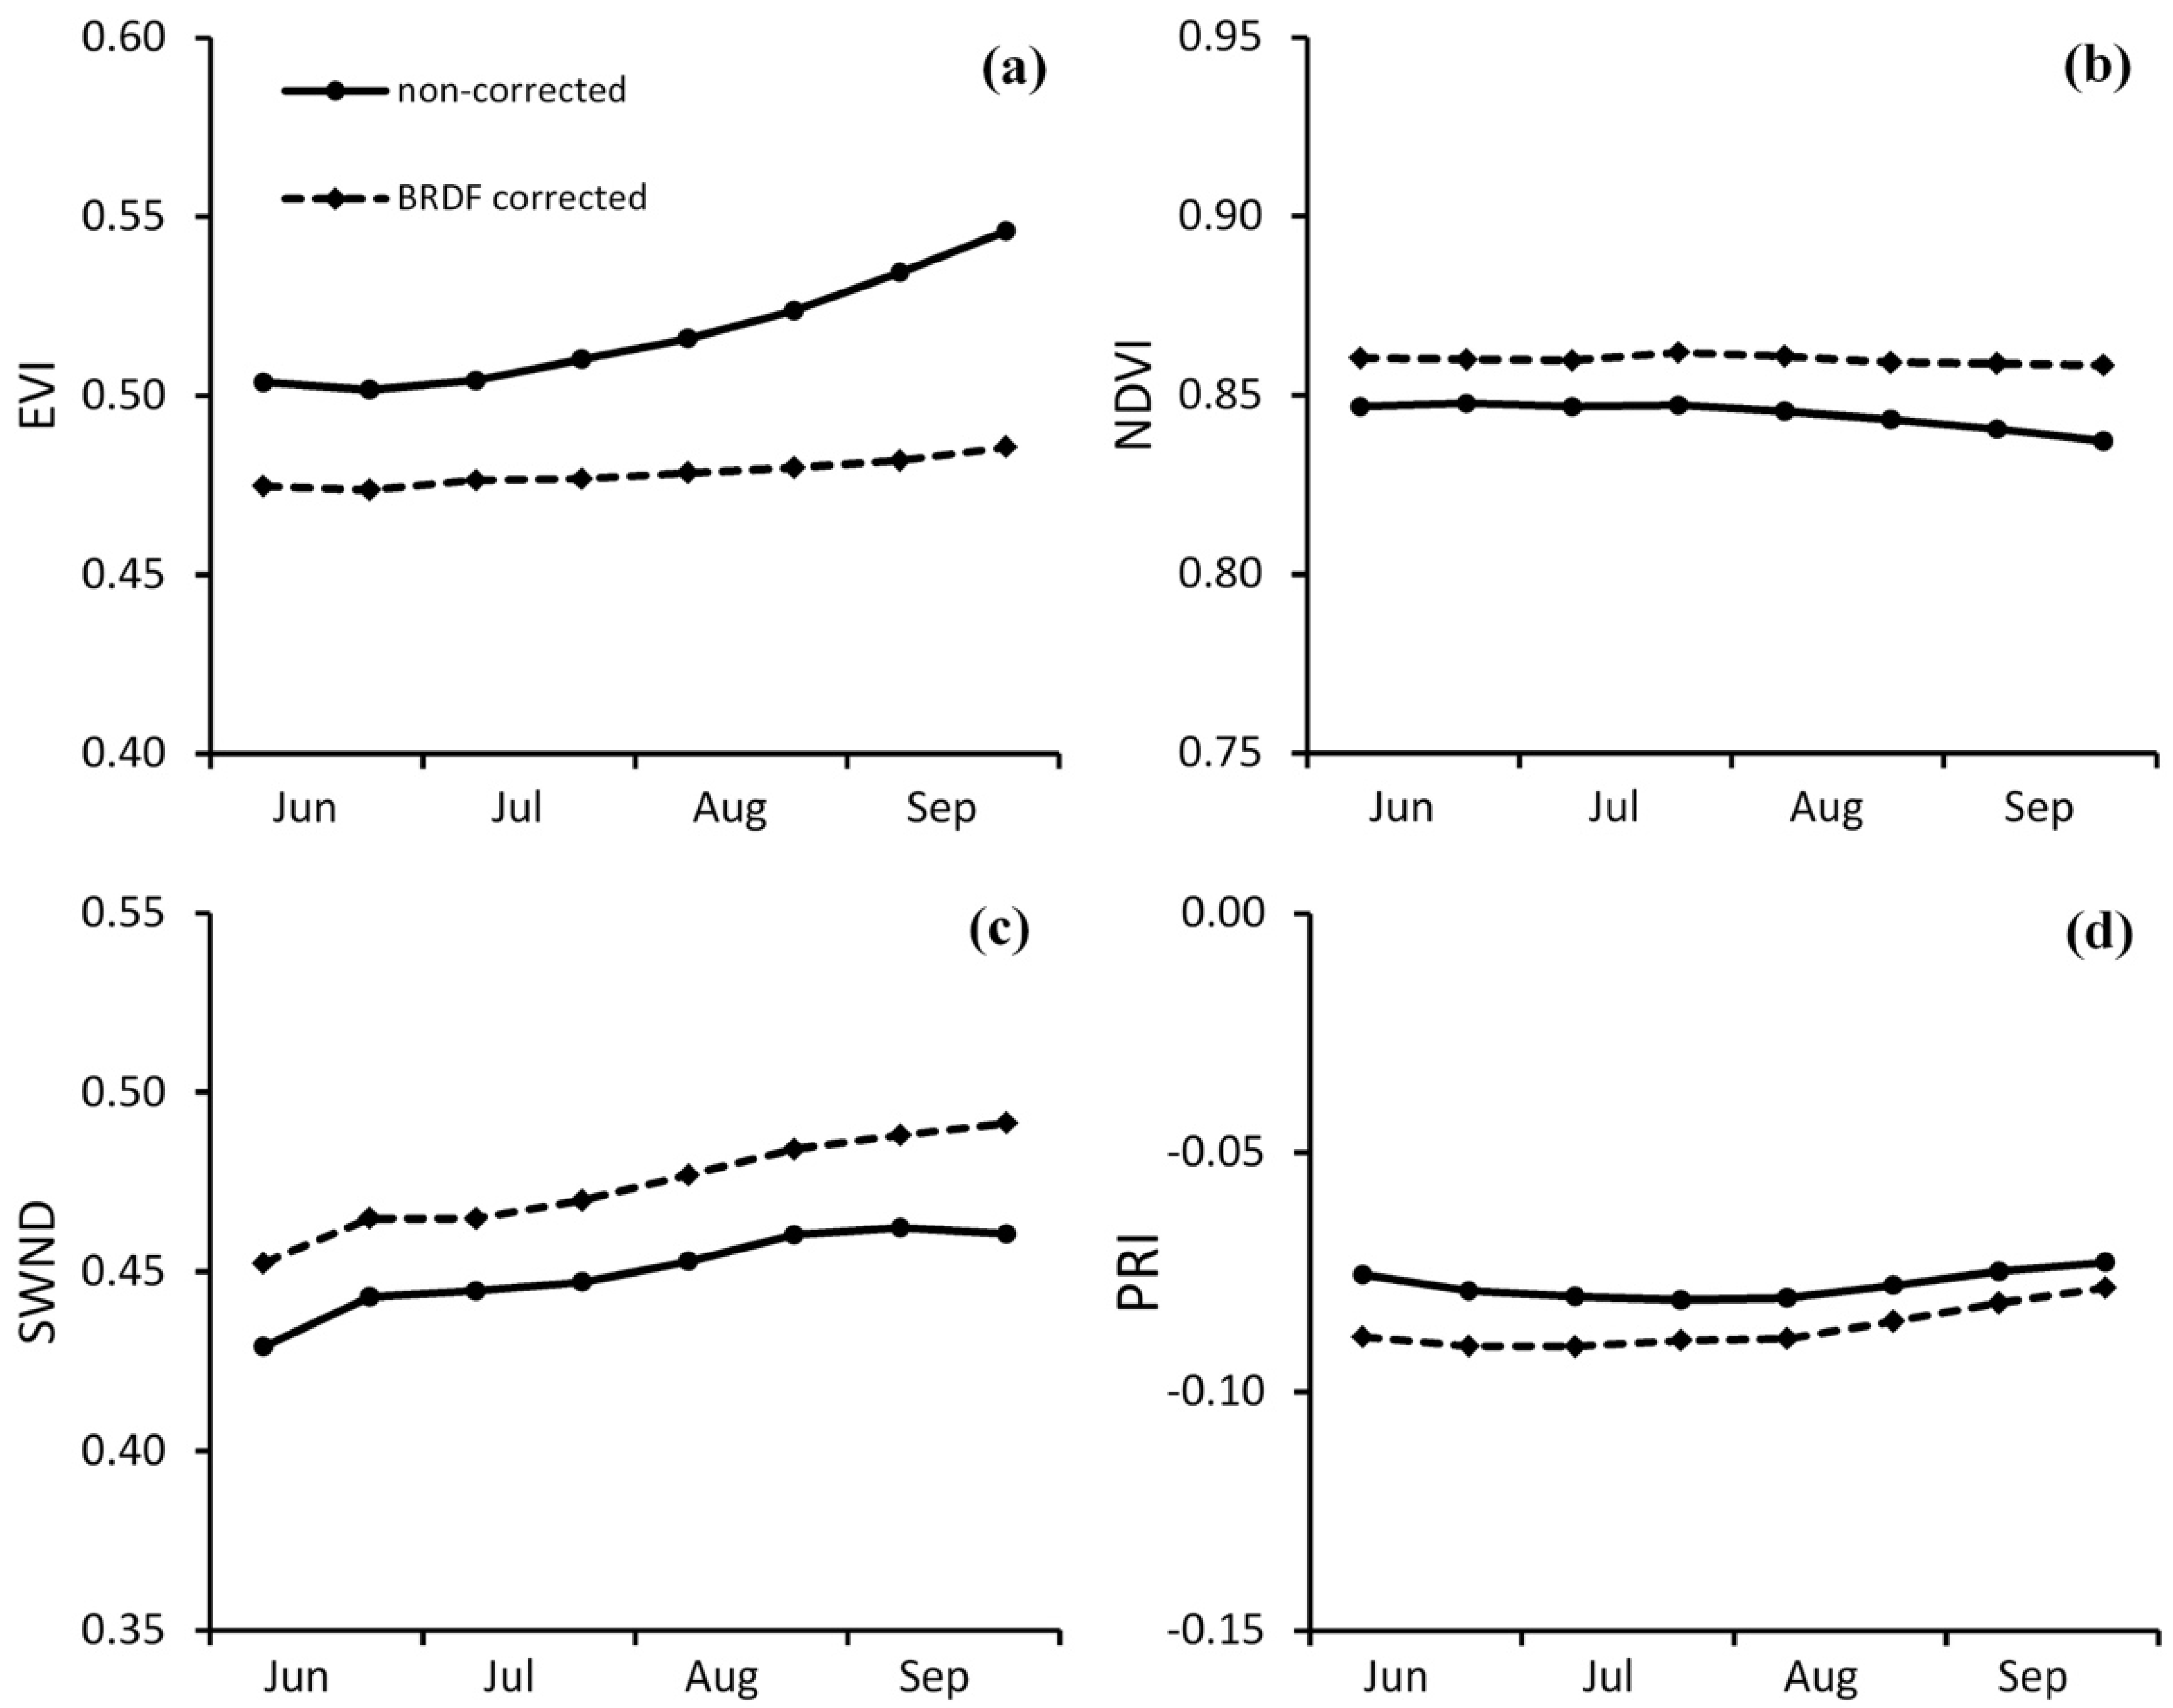
Comparison of monthly average profiles (2000–2014), before and after the BRDF correction, showed distinct patterns of VI anisotropy during the dry season (Figure 8). For instance, the EVI (Figure 8a) and PRI (Figure 8d) decreased with BRDF correction, while the NDVI (Figure 8b) and SWND (Figure 8c) increased after this viewing–illumination normalization. The EVI increase observed from June to September was greatly reduced after the correction of bidirectional effects. From the inspection of the profiles, the most anisotropic VIs with BRDF effects were the EVI, PRI, and SWND. The least anisotropic VI was the NDWI (results not shown). Compared to the non–corrected data for bidirectional effects, the most significant changes in the shape of the curves after correction was observed for the EVI (Figure 8a), especially at the end of the dry season due to increasing MODIS hotspot observations (RAA close to 180°). For BRDF–corrected VIs, the small differences observed between June and September for the EVI (approximately 0.02) were followed by small increases in other VIs toward the end of the dry season. This is the case of the PRI (photosynthetic activity) (Figure 8d) and SWND (vegetation moisture) (Figure 8c), and the GRND (leaf flushing) and NDWI (canopy/leaf water) (results not shown).
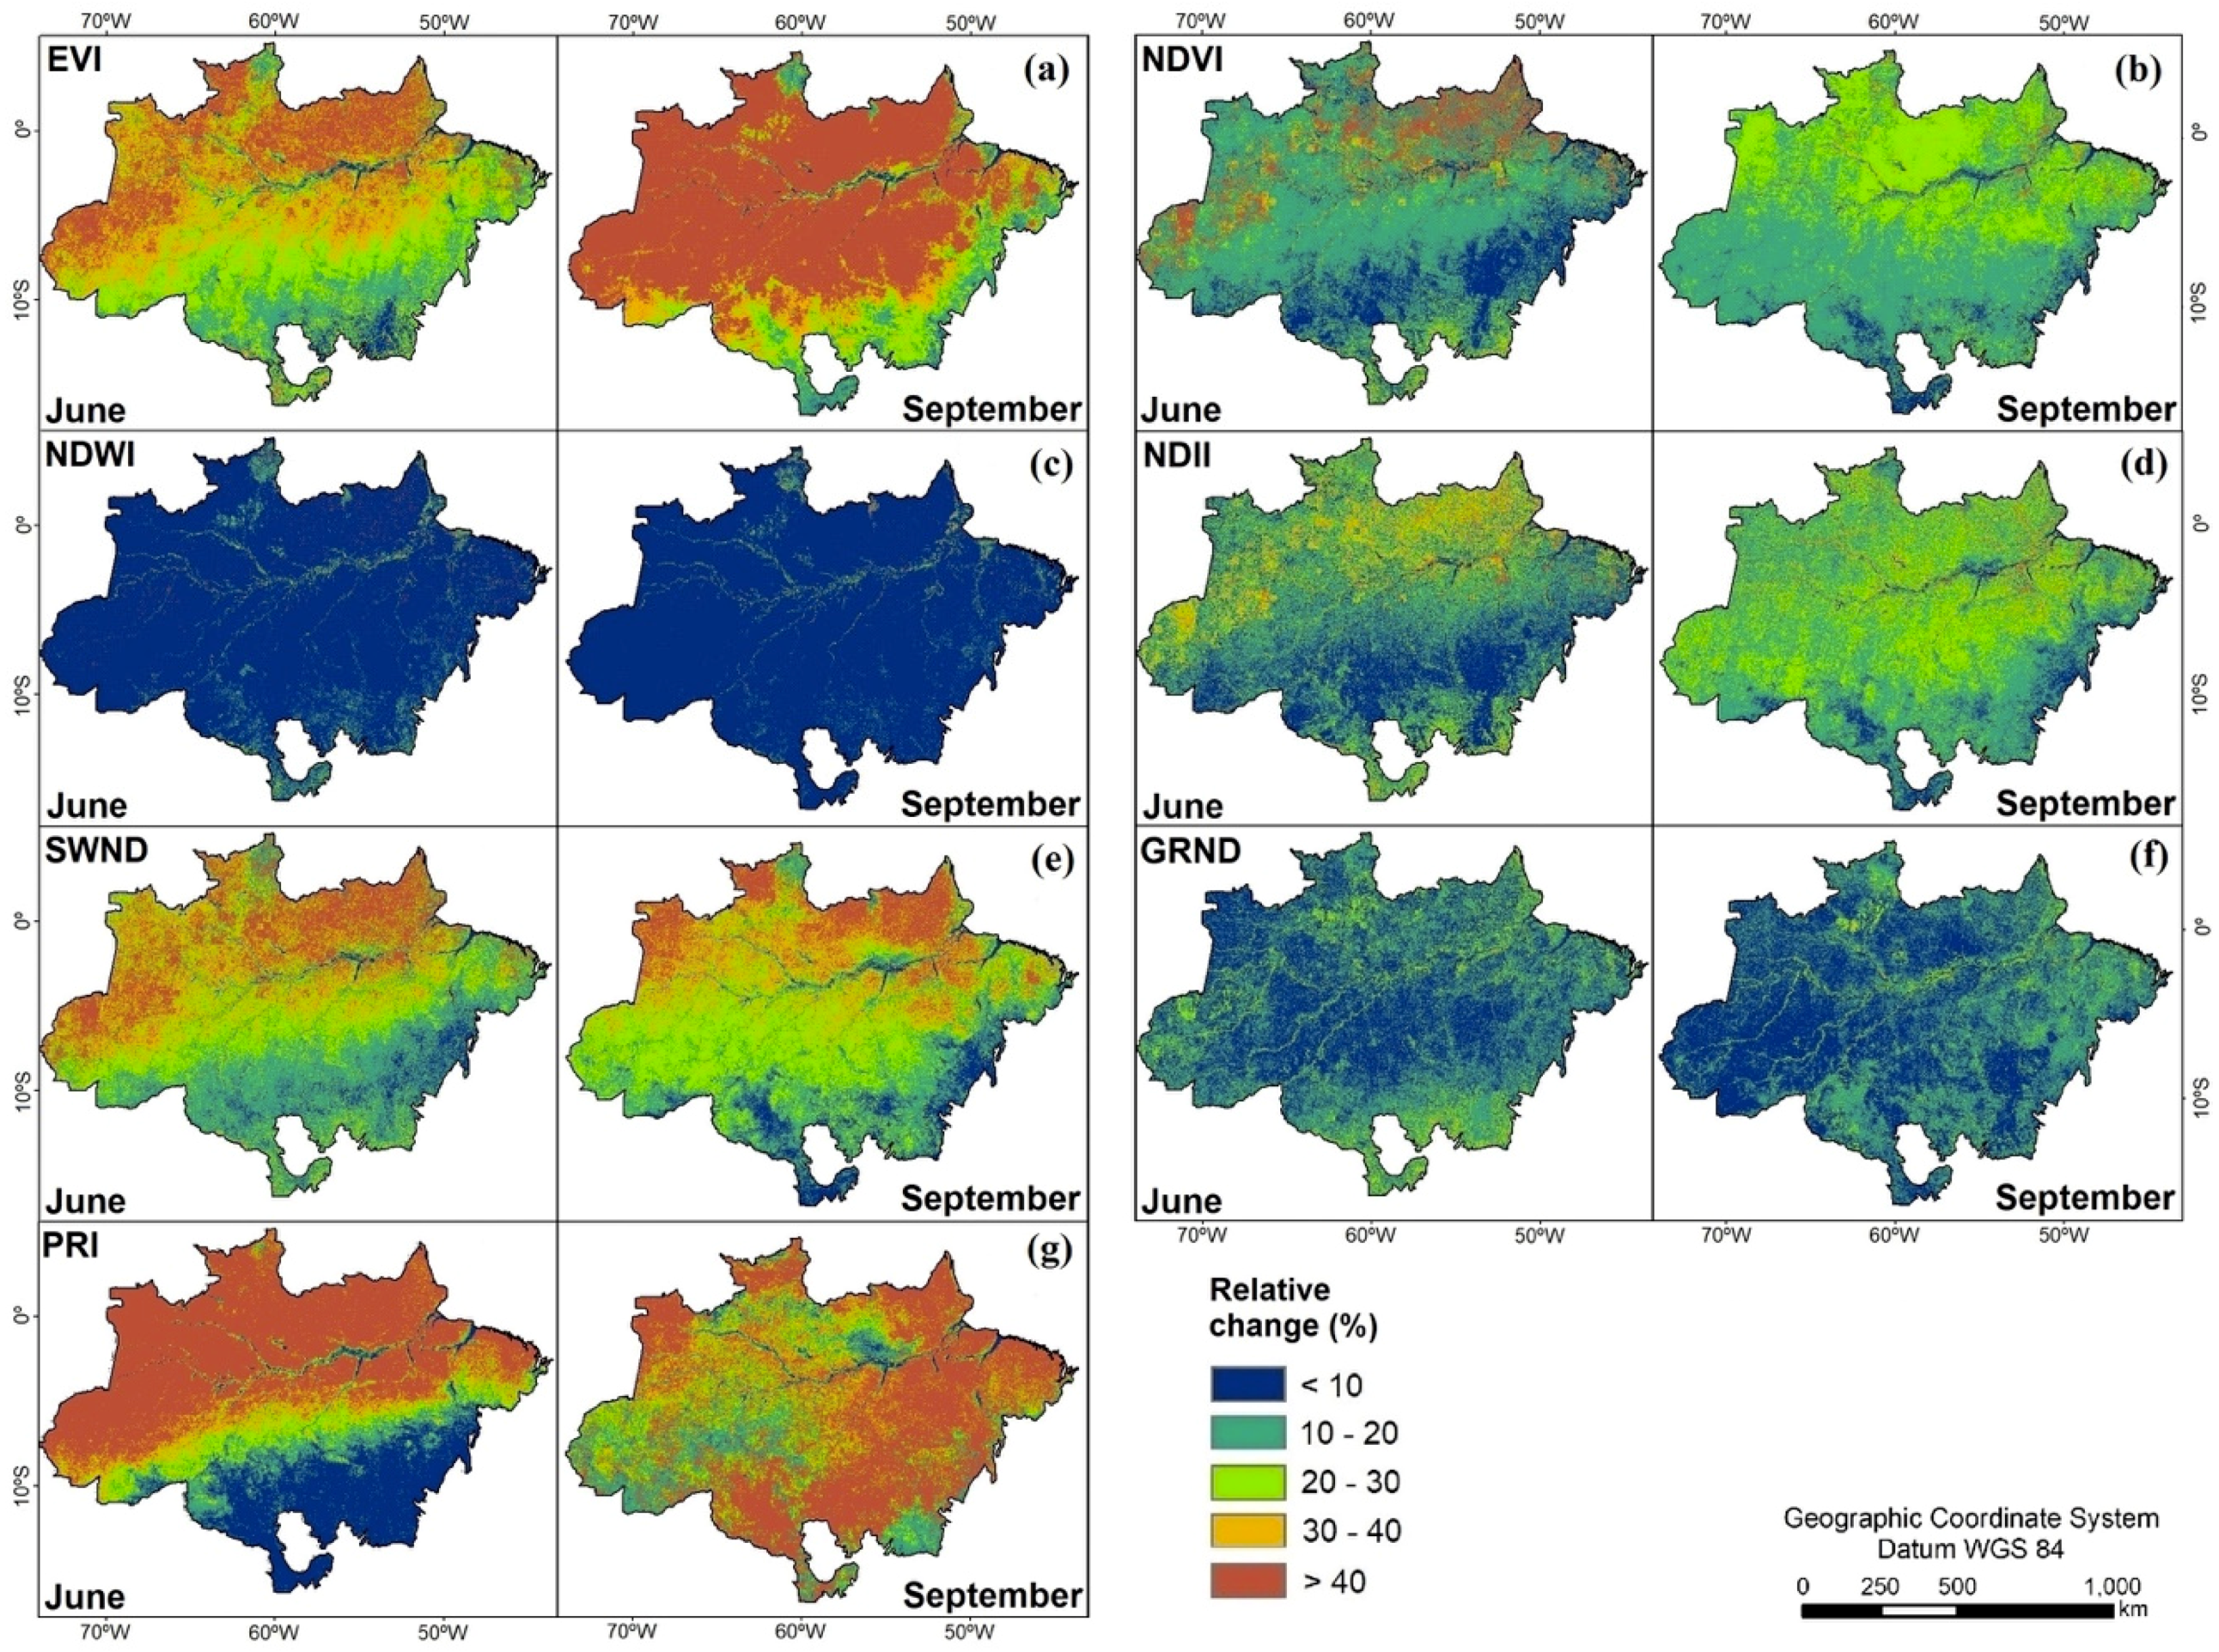
We quantified such BRDF variation by calculating monthly average relative changes for each VI between data corrected and non–corrected for bidirectional effects (Figure 9). Except for the NDWI, all VIs showed some degree of anisotropy during the dry season. In agreement with previous results, the largest relative changes due to BRDF correction were observed for the EVI, PRI, and SWND, while the lowest relative changes between the two datasets were verified for the NDWI.
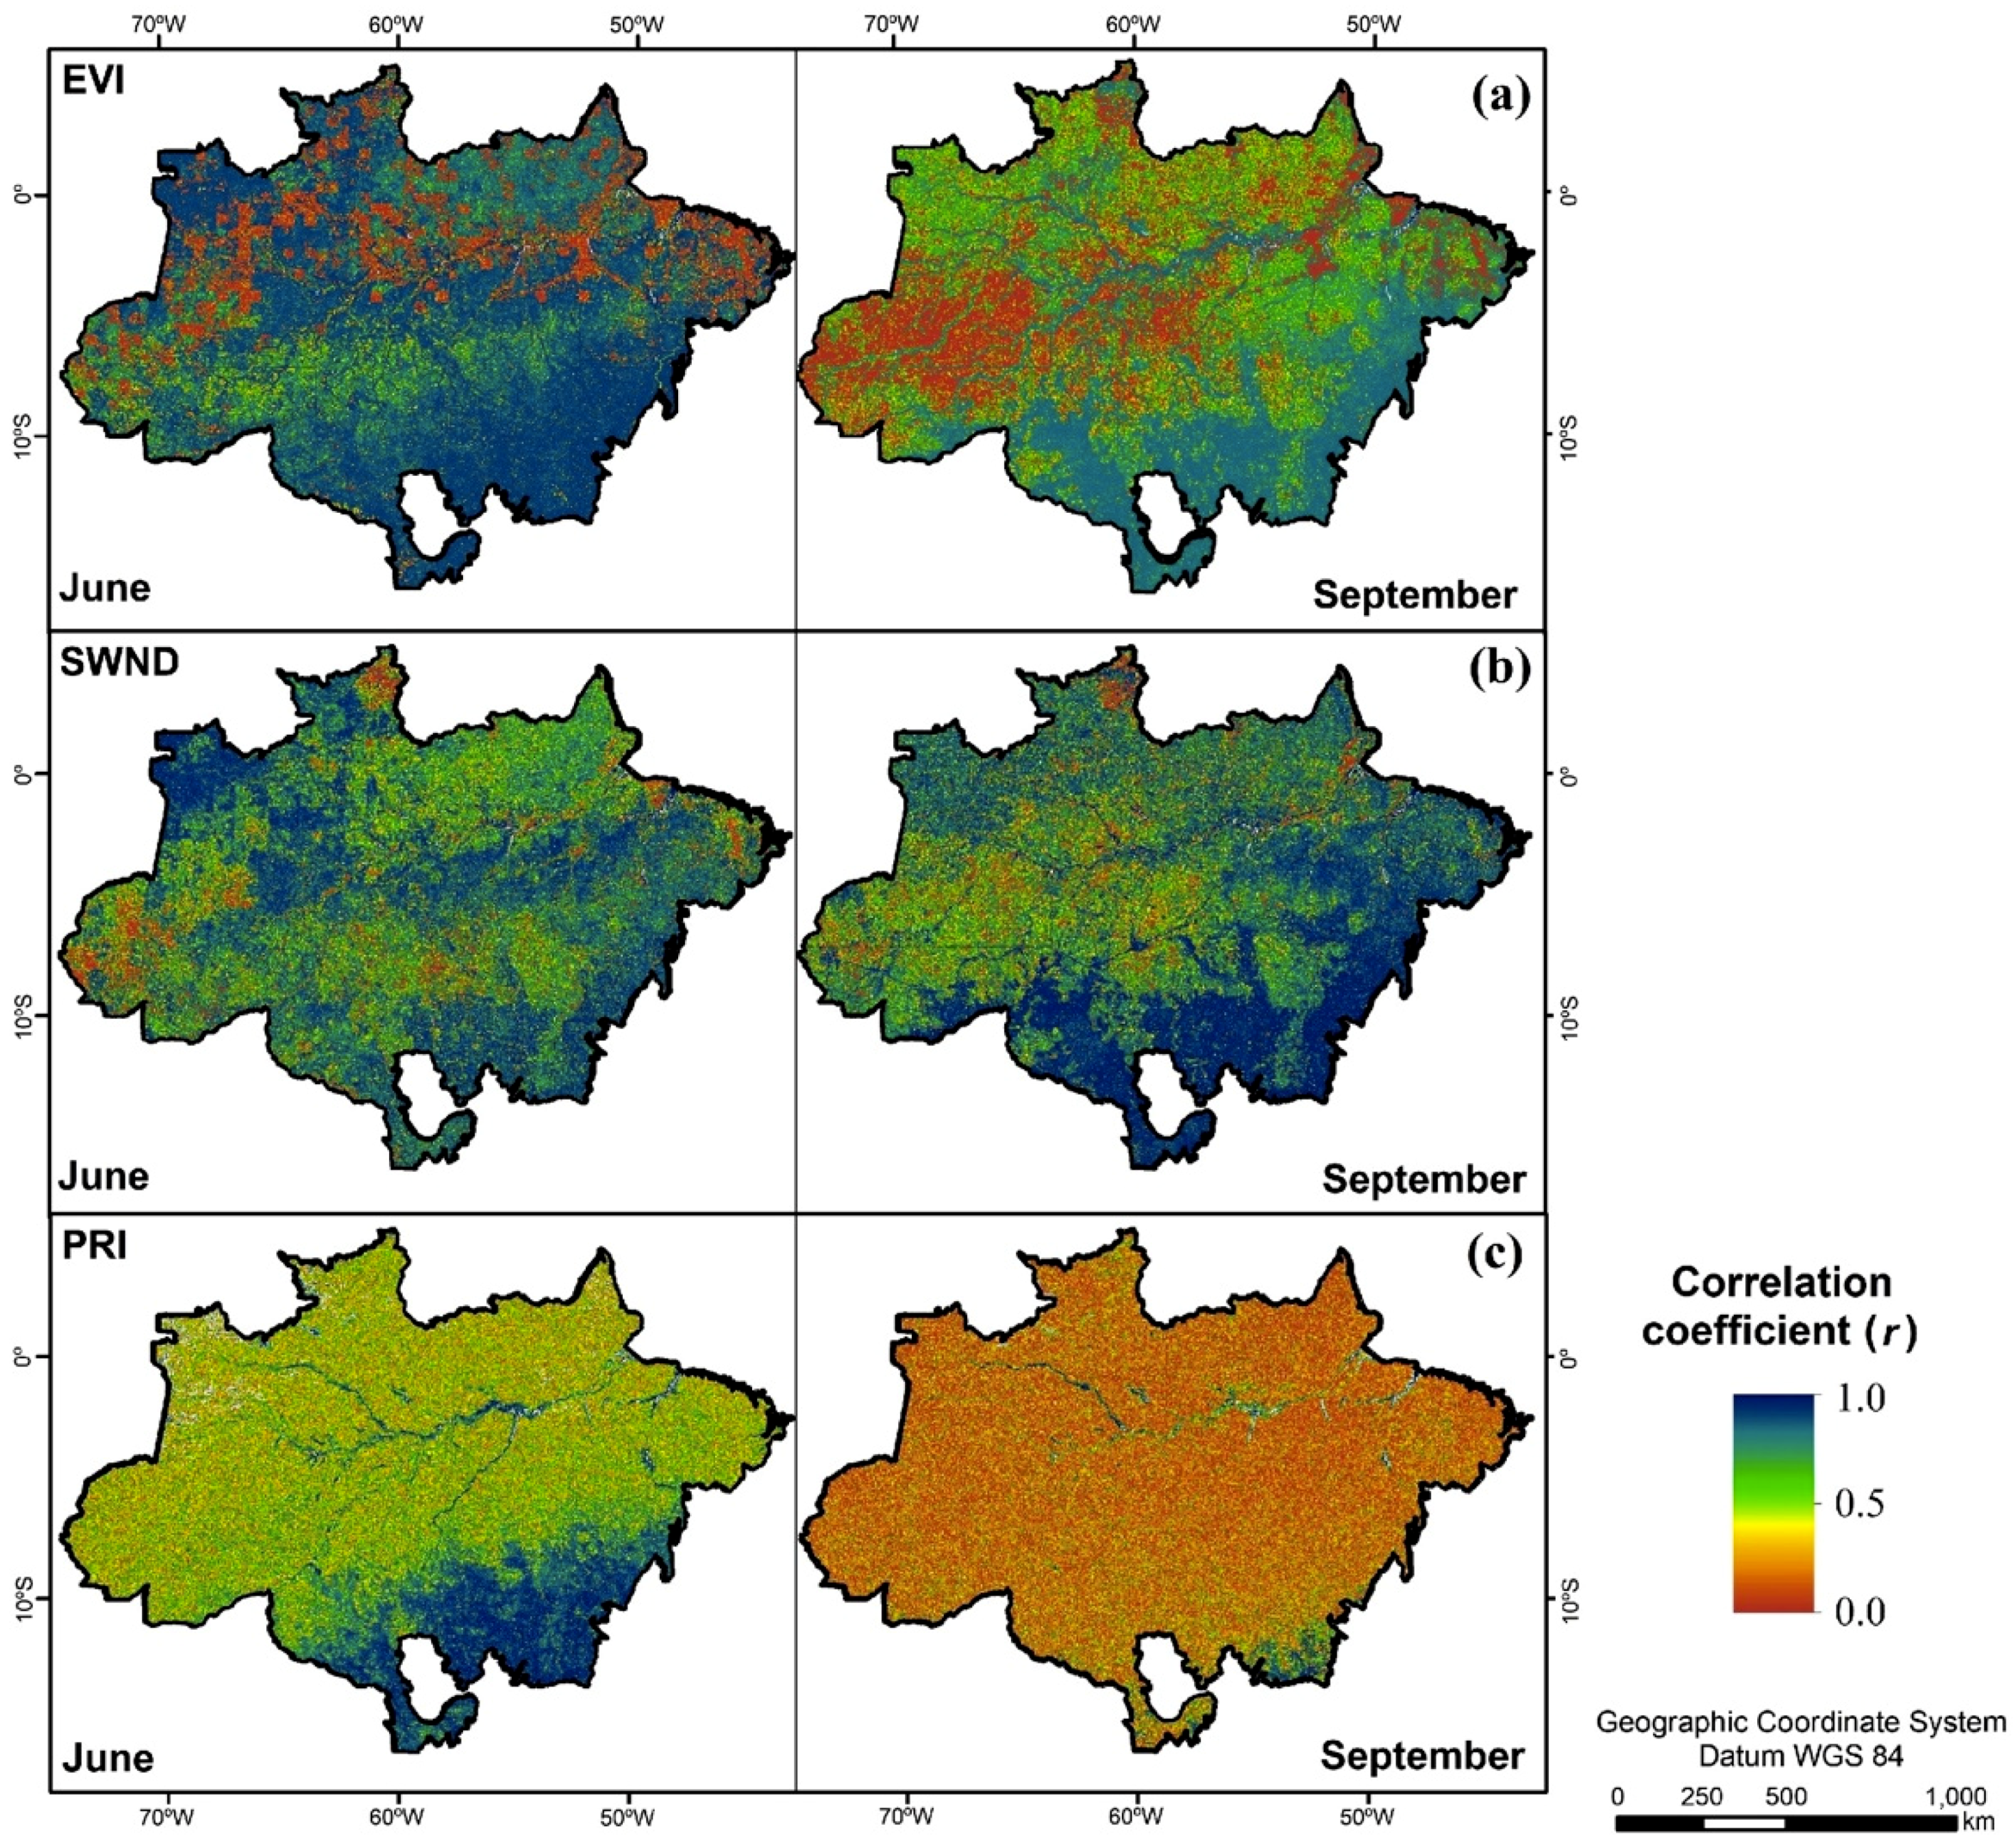
In June, the anisotropy of the EVI, PRI, and SWND was stronger in the north than in the south of the Amazon, as indicated by larger relative changes (pixels in red) between BRDF–corrected and non–corrected data (Figure 9). Because of the more adverse cloud cover conditions in the northern Amazon, pixels selected in MODIS composite products had a higher VZA (Figure 2). In September (end of the dry season), the relative changes increased over the entire Amazon region, especially for the EVI (predominance of red color in Figure 9). From June to September, there was an increase in the number of MODIS observations toward the BRDF hotspot, as discussed before (Figure 3 and Figure 4). For most of the Amazon, 60% of the EVI signal in September was, on average, a non–biophysical response derived from BRDF. In June, this average value was 30%. Confirming the VI differences of Figure 8 from the viewing–illumination effects, the correlation coefficients (r) between corrected and non–corrected data decreased for the EVI, PRI, and SWND as well as from June to September, as illustrated in Figure 10. However, the observed patterns for the PRI were spatially distinct from the other two VIs. This may also reflect the strong variability of this VI, calculated from two close bands in the green spectral interval (MODIS bands 11 and 12), with residual atmospheric scattering effects. These effects tend to reduce the r values.
Finally, when we applied the non–parametric Mann–Whitney statistical tests to the VI data from the sites, we confirmed differences in the non–corrected and corrected median values for the EVI, PRI, and SWND at the 0.05 significance level. After converting the Mann–Whitney U values into the Cohen’s r metrics, we determined the magnitude of the effect size produced by the nadir solar VI normalization. The classes of the effect size (no effect, small, medium, and large effects) in Figure 11 were delimited based on Cohen [32]. At site 2 (Manaus), the effect size of the BRDF correction over the EVI and PRI ranged from a medium to large magnitude, showing increasing r values from the beginning to the end of the dry season (Figure 11). On the other hand, the SWND did not show a well–defined pattern of effect size along the dry season, having large r values only in the beginning of this season and a medium effect size in the remaining period.
4. Discussion
We investigated the influence of MODIS BRDF effects on the determination of seven VIs associated with vegetation structure, biochemistry, and plant physiology. Our findings showed that the most anisotropic VIs to viewing–illumination effects were the EVI, PRI, and SWND, as indicated by large relative changes and decreasing correlation values between corrected and non–corrected data for BRDF effects. Because of the large effect size of the bidirectional effects, the VI anisotropy increased from the beginning (June) to the end (September) of the dry season, with the RAA increase in the backscattering direction. Compared to June, greater amounts of MODIS BRDF hotspot observations were included in VI composite products in September, which increased the reflectance of the MODIS bands, especially in the NIR. Except for NDWI, all the studied VIs showed some degree of anisotropy, also presenting different patterns of changes (low or high values) after BRDF correction.
Our results were generally consistent with previous findings in the literature using MODIS or other orbital sensors. For instance, in a study performed by Sims et al. [33] over three flux tower sites in the United States, the MODIS EVI was more significantly affected by the VZA and viewing direction (RAA) than the NDVI and PRI. In viewing–illumination studies over Amazonian tropical forests using hyperspectral data from the Hyperion/Earth Observing One (EO–1), the EVI and PRI were the two most sensitive VIs to VZA and SZA effects, when compared to 10 other narrowband VIs [8,10]. The great EVI sensitivity to the geometry of data acquisition was also demonstrated by Moura et al. [11], when using multi–angular data from the Multi–angle Imaging SpectroRadiometer (MISR/Terra). Therefore, the suitability of the MODIS VI products to accurately measure temporal changes due to vegetation phenology will depend on the adequate removal of variable solar and viewing geometry effects from the data [6]. This is especially true for the Amazon and for the most anisotropic VIs.
The BRDF effects are wavelength dependent, as reported in the literature. Because of this spectral dependence, the use of band ratioing, or normalized differences to compute VIs does not completely remove the surface anisotropy [34]. Our findings showed that the BRDF correction reduced the reflectance in all MODIS bands, especially in the NIR. As discussed by van Leeuwen et al. [35], the NIR reflectance is generally more anisotropic than the red reflectance. This explains the highly anisotropic behavior of the EVI to viewing–illumination geometry. The EVI is a non–normalized VI that is strongly dependent on the NIR reflectance [8,10]. In addition, the sensitivity of this index to shadows was also demonstrated in terrain illumination studies over mountains [36,37].
In reality, shadow is a key factor affecting the anisotropy of several VIs [38]. For instance, the PRI is increasingly being used as an index of photosynthetic performance or light use efficiency [39]. We showed that this index also presented significant anisotropy with BRDF. As demonstrated by Middleton et al. [40], shaded leaves have higher PRI values than sunlit leaves. In addition, the MODIS PRI was also sensitive to the viewing direction in a study by Drolet et al. [41]. These authors observed larger PRI values in the forward scattering direction than in the backscattering due to the predominance of less illuminated foliage for the sensor.
In the analysis of data acquired by near polar orbiting satellites, especially those having large FOV instruments, like MODIS, directional and VZA effects are more important than SZA effects. Differently from the VZA, the SZA exhibits a seasonal cycle, having an amplitude that increases with latitude [42]. Therefore, illumination effects tend to be stronger in the southern Amazon (site 3), where the SZA amplitude reaches 18° between the rainy and dry seasons. SZA decreases from June to September, reducing the amounts of shadows viewed by the sensors at the end of the dry season.
In relation to the VZA, the retrievals of high–quality pixels increase gradually from north to south of the Amazon and toward the beginning of the dry season. These retrievals reach a maximum in the middle of the dry season in the southern Amazon (July to August) [5,9]. In the northern Amazon (site 1), the persistent cloud cover decreases the frequency of high–quality pixels. It produces a comparatively higher VZA for pixels selected in composite products than that observed in the southern Amazon (site 3). However, in MODIS composite VI products, the influence of the VZA is partially compensated by the use of view–angle constraint approaches.
Results from our study confirmed the BRDF as an important issue in the time series interpretation of MODIS VIs in the Amazon, especially the EVI, PRI, and SWND. Therefore, vegetation phenological studies in the Amazon using these VIs require viewing–illumination normalization of MODIS data. This is especially true for the most anisotropic metric (EVI), which has generated controversial findings on the resilience of tropical forests to severe droughts [14,15]. In our study, we did not perform a robust statistical analysis on the possible relationships between BRDF–corrected EVI and droughts. This analysis is out of the scope of the current work. However, a simple inspection of the BRDF–corrected EVI curves across sites confirmed the absence of well–defined patterns of EVI for drought (e.g., 2005 and 2010) and non–drought (e.g., 2002 and 2008) years (Figure 12). In reality, this evaluation should consider other factors, such as the uncertainties in the data analysis and the spatial occurrence of each drought in the Amazon. For instance, the 2005 event had a single epicenter in southwestern Amazon, while the 2010 drought had three epicenters over the entire region. Standardized anomalies of dry season rainfall showed that 57% of the Amazon region had low rainfall in 2010 compared with 37% in 2005, as stated by Lewis et al. [43]. Field monitoring studies indicated an enormous carbon loss due to fire and tree mortality in response to the intense 2005 drought [44]. In Figure 12, the MODIS BRDF–corrected EVI differences of approximately 0.02, observed between June and September of each year, were consistent with the differences reported by Moura et al. [11] using the nadir camera from the MISR/Terra. They reported the absence of well–defined patterns between the nadir MISR EVI and the 2005 and 2010 droughts.
In the literature, there are also divergences on the dry season behavior of non–corrected BRDF EVI, which is potentially resultant from artefacts derived from sun–sensor positioning [12,13]. In our work, the BRDF correction removed, on average, 30% of the EVI signal in June and 60% of the EVI signal in September, considering the entire Amazon region (Figure 9). The correction reduced the ascending slope of the non–corrected EVI curve from June to September (Figure 8a). However, assuming a perfect removal of the viewing–illumination effects in the data analysis, there is a minor and persistent remaining signal (EVI differences of approximately 0.02) that could be associated with biophysical information. Although some studies have related the EVI to greening, this index is, in fact, a NIR–reflectance dependent canopy structural VI [10]. It could potentially show variations in canopy attributes, such as the LAI of mature leaves [17]. When we compared monthly average profiles of the BRDF–corrected VIs for the 2000–2014 period, we observed slight increases in other VIs (e.g., GRND, NDWI, PRI, and SWND) toward the end of the dry season. Their potential sensitivity to leaf flushing, canopy/leaf water, photosynthetic activity, and vegetation moisture requires careful evaluation in further studies, especially with better spatial resolution satellite data and nadir–viewing instruments. In this context, even for the time series interpretation of medium spatial resolution data, the importance of the BRDF effects has been recognized recently during the generation of the Harmonized Landsat/Sentinel–2 (HLS) product [21].
5. Conclusions
The EVI, PRI, and SWND were the most anisotropic VIs, presenting larger relative changes and lower correlation values than the other VIs, when BRDF–corrected data were compared with non–corrected data over the Amazon. The least anisotropic VI was the NDWI. The VI anisotropy increased toward the north of the Amazon (site 1), with more adverse cloud cover conditions and an increasing VZA. Solar illumination effects were important only in the southern Amazon, where the SZA amplitude reached values close to 18° between the rainy and dry seasons.
The anisotropy also increased from the beginning (June) to the end (September) of the Amazonian dry season, with greater amounts of MODIS (MAIAC) observations observed close to the BRDF hotspot (RAA close to 180°). This fact was also indicated by increasing Cohen’s r metrics in this period, calculated from Mann–Whitney tests. Because of the modifications in the RAA, the reflectance of all studied MODIS bands, especially in the NIR, increased from June to September due to the BRDF effects. In the Amazon, 60% of the EVI signal in September was, on average, controlled by BRDF. In June, this value was 30%. Because of these temporal differences in anisotropy, the ascending slope of the EVI curve toward the end of dry season was mostly reduced after BRDF correction. However, assuming a perfect removal of the bidirectional effects, there is a remaining EVI difference of approximately 0.02, between June and September, that requires attention. Following this small EVI difference, we also observed slight increases in the GRND, NDWI, PRI, and SWND toward the end of the dry season, which should be further investigated.
Our results highlight the importance of correcting data acquired by large FOV instruments, like the MODIS, for BRDF effects. This is an essential procedure for the correct interpretation of MODIS time series in vegetation phenological studies, especially when the most anisotropic VIs are used in seasonal and inter–annual data analyses in the Amazon.
Author Contributions
The first author developed the work under the supervision of the co–author.
Funding
This work was funded by the Conselho Nacional de Desenvolvimento Científico e Tecnológico (CNPq) (grant number 401025/2014–4) and, partially, by the Coordenação de Aperfeiçoamento de Pessoal de Nível Superior (CAPES) (Finance Code 001).
Acknowledgments
Part of the data used in this study was processed by Thomas Hilker (In Memorian). The authors are grateful to the Conselho Nacional de Desenvolvimento Científico e Tecnológico (CNPq) and the Coordenação de Aperfeiçoamento de Pessoal de Nível Superior (CAPES). Thanks also to Alexei Lyaspustin for helpful discussions on MAIAC issues. Comments by the anonymous reviewers were highly appreciated.
Conflicts of Interest
The authors declare no conflict of interest.
References
- Heimann, M.; Esser, G.; Haxeltine, A.; Kaduk, J.; Kicklighter, D.W.; Knorr, W.; Kohlmaier, G.H.; McGuire, A.D.; Melillo, J.; Moore III, B.; et al. Evaluation of terrestrial carbon cycle models through simulations of the seasonal cycle of atmospheric CO2: First results of a model intercomparison study. Glob. Biogeochem. Cycles 1998, 12, 1–24. [Google Scholar] [CrossRef] [Green Version]
- Malhi, Y.; Roberts, J.T.; Betts, R.A.; Killeen, T.J.; Li, W.; Nobre, C.A. Climate change, deforestation, and the fate of the Amazon. Science 2008, 319, 169–172. [Google Scholar] [CrossRef] [PubMed]
- Liang, L.; Schwartz, M.D.; Fei, S. Validating satellite phenology through intensive ground observation and landscape scaling in a mixed seasonal forest. Remote Sens. Environ. 2011, 115, 143–157. [Google Scholar] [CrossRef]
- Hmimina, G.; Dufrene, E.; Pontailler, J.Y.; Delpierre, N.; Aubinet, M.; Caquet, B.; Grandcourt, A.D.; Burban, B.; Flechard, C.; Granier, A.; et al. Evaluation of the potential of MODIS satellite data to predict vegetation phenology in different biomes: An investigation using ground–based NDVI measurement. Remote Sens. Environ. 2013, 132, 145–158. [Google Scholar] [CrossRef]
- Maeda, E.E.; Moura, Y.M.; Wagner, F.; Hilker, T.; Lyapustin, A.I.; Wang, Y.; Chave, J.; Mõtus, M.; Aragão, L.E.; Shimabukuro, Y. Consistency of vegetation index seasonality across the Amazon rainforest. Int. J. Appl. Earth Obs. Geoinf. 2016, 52, 42–53. [Google Scholar] [CrossRef]
- Bhandari, S.; Phinn, S.; Gill, G. Assessing viewing and illumination geometry effects on the MODIS vegetation index (MOD13Q1) time series: Implications for monitoring phenology and disturbances in forest communities in Queensland, Australia. Int. J. Remote Sens. 2011, 32, 7513–7538. [Google Scholar] [CrossRef]
- Breunig, F.M.; Galvão, L.S.; Formaggio, A.R.; Epiphanio, J.C.N. Directional effects on NDVI and LAI retrievals from MODIS: A case study in Brazil with soybean. Int. J. Appl. Earth Obs. Geoinf. 2011, 13, 34–42. [Google Scholar] [CrossRef]
- Galvão, L.S.; Breunig, F.M.; Santos, J.R.; Moura, Y.M. View–illumination effects on hyperspectral vegetation indices in the Amazonian tropical forest. Int. J. Appl. Earth Obs. Geoinf. 2013, 21, 291–300. [Google Scholar] [CrossRef]
- Petri, C.A.; Galvão, L.S.; Lyapustin, A.I. MODIS BRDF effects over Brazilian tropical forests and savannahs: A comparative analysis. Remote Sens. Lett. 2019, 10, 95–102. [Google Scholar] [CrossRef]
- Galvão, L.S.; Santos, J.R.; Roberts, D.A.; Breunig, F.M.; Toomey, M.; Moura, Y.M. On intra–annual EVI variability in the dry season of tropical forest: A case study with MODIS and hyperspectral data. Remote Sens. Environ. 2011, 115, 2350–2359. [Google Scholar] [CrossRef]
- Moura, Y.M.; Galvão, L.S.; Santos, J.R.; Roberts, D.A.; Breunig, F.M. Use of MISR/Terra data to study intra– and inter–annual EVI variations in the dry season of tropical forest. Remote Sens. Environ. 2012, 127, 260–270. [Google Scholar] [CrossRef]
- Morton, D.C.; Nagol, J.; Carabajal, C.C.; Rossette, J.; Palace, M.; Cook, B.D.; Vermote, E.F.; Harding, D.J.; North, P.R.J. Amazon forests maintain consistent canopy structure and greenness during the dry season. Nature 2014, 506, 221–224. [Google Scholar] [CrossRef] [PubMed]
- Bi, J.; Knyazikhin, Y.; Choi, S.; Park, T.; Barichivich, J.; Ciais, P.; Fu, R.; Ganguly, S.; Hall, F.; Hilker, T.; et al. Sunlight mediated seasonality in canopy structure and photosynthetic activity of Amazonian rainforests. Environ. Res. Lett. 2015, 10, 064014. [Google Scholar] [CrossRef] [Green Version]
- Saleska, S.R.; Didan, K.; Huete, A.R.; Da Rocha, H.R. Amazon forests green–up during 2005 drought. Science 2007, 318, 612. [Google Scholar] [CrossRef] [PubMed]
- Samanta, A.; Ganguly, S.; Hashimoto, H.; Devadiga, S.; Vermote, E.F.; Knyazikhin, Y.; Nemani, R.R.; Myneni, R.B. Amazon Forests Did Not Green–Up during the 2005 Drought. Geophys. Res. Lett. 2010, 37. [Google Scholar] [CrossRef]
- Huete, A.R.; Didan, K.; Shimabukuro, Y.E.; Ratana, P.; Saleska, S.R.; Hutyra, L.R.; Yang, W.; Nemani, R.R.; Myneni, R. Amazon rainforests green-up with sunlight in dry season. Geophys. Res. Lett. 2006, 33. [Google Scholar] [CrossRef] [Green Version]
- Moura, Y.M.; Galvão, L.S.; Hilker, T.; Wu, J.; Saleska, S.; Amaral, C.H.; Nelson, B.W.; Lopes, A.P.; Wiedeman, K.K.; Prohaska, N.; et al. Spectral analysis of amazon canopy phenology during the dry season using a tower hyperspectral camera and MODIS observations. ISPRS J. Photogramm. Remote. Sens. 2017, 131, 52–64. [Google Scholar] [CrossRef]
- Hilker, T.; Lyapustin, A.I.; Tucker, C.J.; Hall, F.G.; Myneni, R.B.; Wang, Y.; Bi, J.; De Moura, Y.M.; Sellers, P.J. Vegetation dynamics and rainfall sensitivity of the Amazon. Proc. Natl. Acad. Sci. USA 2014, 111, 16041–16046. [Google Scholar] [CrossRef] [Green Version]
- Vermote, E.; Justice, C.O.; Bréon, F. Towards a generalized approach for correction of the BRDF effect in MODIS directional reflectances. IEEE Trans. Geosci. Remote Sens. 2009, 47, 898–908. [Google Scholar] [CrossRef]
- Villaescusa–Nadal, J.L.; Franch, B.; Vermote, E.F.; Roger, J. Improving the AVHRR long term data record BRDF correction. Remote Sens. 2019, 11, 502. [Google Scholar] [CrossRef]
- Franch, B.; Vermote, E.; Skakun, S.; Roger, J.; Masek, J.; Ju, J.; Villaescusa–Nadal, J.L.; Santamaria–Artigas, A. A method for Landsat and Sentinel 2 (HLS) BRDF normalization. Remote Sens. 2019, 11, 632. [Google Scholar] [CrossRef]
- Lyapustin, A.I.; Martonchik, J.; Wang, Y.; Laszlo, I.; Korkin, S. Multiangle Implementation of Atmospheric Correction (MAIAC): 1. radiative transfer basis and look-up tables. J. Geophys. Res. Atmos. 2011, 116. [Google Scholar] [CrossRef]
- Moura, Y.M.; Hilker, T.; Lyapustin, A.I.; Galvão, L.S.; dos Santos, J.R.; Anderson, L.O.; de Sousa, C.H.R.; Arai, E. Seasonality and drought effects of Amazonian forests observed from multi–angle satellite data. Remote Sens. Environ. 2015, 171, 278–290. [Google Scholar] [CrossRef]
- Hijmans, R.J.; Cameron, S.E.; Parra, J.L.; Jones, P.G.; Jarvis, A. Very high resolution interpolated climate surfaces for global land areas. Int. J. Clim. 2005, 25, 1965–1978. [Google Scholar] [CrossRef]
- Lyapustin, A.I.; Wang, Y.; Laszlo, I.; Hilker, T.; Hall, F.G.; Sellers, P.J.; Tucker, C.J.; Korkin, S.V. Multi–Angle Implementation of Atmospheric Correction for MODIS (MAIAC): 3. atmospheric correction. Remote Sens. Environ. 2012, 127, 385–393. [Google Scholar] [CrossRef]
- Hilker, T.; Lyapustin, A.I.; Tucker, C.J.; Sellers, P.J.; Hall, F.G.; Wang, Y. Remote sensing of tropical ecosystems: Atmospheric correction and cloud masking matter. Remote Sens. Environ. 2012, 127, 370–384. [Google Scholar] [CrossRef] [Green Version]
- Rouse, J.W.; Haas, R.H.; Schell, J.A.; Deering, D.W. Monitoring vegetation systems in the great plains with ERTS. In Proceedings of the ERTS Symposium, Washington, DC, USA, 10–14 December 1973; Volume 3, pp. 309–317. [Google Scholar]
- Huete, A.R.; Liu, H.Q.; Batchily, K.; Van Leeuwen, W.A. Comparison of vegetation indices over a global set of TM images for EOS–MODIS. Remote Sens. Environ. 1997, 59, 440–451. [Google Scholar] [CrossRef]
- Gao, B. NDWI–A normalized difference water index for remote sensing of vegetation liquid water from space. Remote Sens. Environ. 1996, 58, 257–266. [Google Scholar] [CrossRef]
- Hunt, E.R.; Rock, B.N. Detection of changes in leaf water content using near–and middle–infrared reflectances. Remote Sens. Environ. 1989, 30, 43–54. [Google Scholar] [CrossRef]
- Gamon, J.A.; Serrano, L.; Surfus, J.S. The photochemical reflectance index: An optical indicator of photosynthetic radiation–use efficiency across species, functional types, and nutrient levels. Oecologia 1997, 112, 492–501. [Google Scholar] [CrossRef]
- Cohen, J. Statistical Power Analysis for the Behavioral Sciences, 2nd ed.; Erlbaum: Hillsdale, MI, USA, 1988. [Google Scholar]
- Sims, D.A.; Rahman, A.F.; Vermote, E.F.; Jiang, Z. Seasonal and inter–annual variation in view angle effect effects on MODIS vegetation indices at three forest sites. Remote Sens. Environ. 2011, 115, 3112–3120. [Google Scholar] [CrossRef]
- Walter–Shea, E.A.; Privette, J.L.; Cornell, D.; Mesarch, M.A.; Hays, C.J. Relations between spectral vegetation indices and leaf area and absorbed radiation in alfalfa. Remote Sens. Environ. 1997, 61, 162–177. [Google Scholar] [CrossRef]
- Van Leeuwen, W.J.D.; Huete, A.R.; Laing, T.W. MODIS vegetation index compositing approach: A prototype with AVHRR data. Remote Sens. Environ. 1999, 61, 264–280. [Google Scholar] [CrossRef]
- Matsushita, B.; Yang, W.; Chen, J.; Onda, Y.; Qiu, G. Sensitivity of the Enhanced Vegetation Index (EVI) and Normalized Difference Vegetation Index (NDVI) to topographic effects: A case study in high–density Cypress Forest. Sensors 2007, 7, 2636–2651. [Google Scholar] [CrossRef]
- Galvão, L.S.; Breunig, F.M.; Teles, T.S.; Gaida, W.; Balbinot, R. Investigation of terrain illumination effects on vegetation indices and VI–derived phenological metrics in subtropical deciduous forests. GISci. Remote Sens. 2016, 53, 360–381. [Google Scholar] [CrossRef]
- Verrelst, J.; Schaepman, M.E.; Koetz, B.; Kneubuehler, M. Angular sensitivity analysis of vegetation indices derived from CHRIS/PROBA data. Remote Sens. Environ. 2008, 112, 2341–2353. [Google Scholar] [CrossRef]
- Garbulsky, M.F.; Penuelas, J.; Gamon, J.; Inoue, Y.; Filella, I. The Photochemical Reflectance Index (PRI) and the remote sensing of leaf, canopy and ecosystem radiation use efficiencies: A review and meta–analysis. Remote Sens. Environ. 2011, 115, 281–297. [Google Scholar] [CrossRef]
- Middleton, E.M.; Huemmrich, K.F.; Cheng, Y.; Margolis, H.A. Spectral bioindicators of photosynthetic efficiency and vegetation stress. In Hyperspectral Remote Sensing of Vegetation; Thenkabail, P.S., Lyon, J.G., Huete, A., Eds.; CRC Press, Taylor and Francis Group: Boca Raton, FL, USA, 2012; Chapter 12; pp. 265–288. [Google Scholar]
- Drolet, G.G.; Middleton, E.M.; Huemmrich, K.F.; Hall, F.G.; Amiro, B.D.; Barr, A.G.; Black, T.A.; McCaughey, J.H.; Margolis, H.A. Regional mapping of gross light–use efficiency using MODIS spectral indices. Remote Sens. Environ. 2008, 112, 3064–3078. [Google Scholar] [CrossRef]
- Franks, S.; Neigh, C.S.R.; Campbell, P.K.; Sun, G.; Yao, T.; Zhang, Q.; Huemmrich, K.F.; Middleton, E.M.; Ungar, S.G.; Frye, S.W. EO–1 data quality and sensor stability with changing orbital precession at the end of a 16 year mission. Remote Sens. 2017, 9, 412. [Google Scholar] [CrossRef]
- Lewis, S.L.; Brando, P.M.; Phillips, O.L.; van der Heijden, G.M.; Nepstad, D. The 2010 Amazon drought. Science 2011, 331, 554. [Google Scholar] [CrossRef]
- Phillips, O.L.; Aragão, L.E.; Lewis, S.L.; Fisher, J.B.; Lloyd, J.; López–González, G.; Malhi, Y.; Monteagudo, A.; Peacock, J.; Quesada, C.A. Drought sensitivity of the Amazon rainforest. Science 2009, 323, 1344–1347. [Google Scholar] [CrossRef] [PubMed]
Figure 1.
Location of the three studied sites in the Brazilian Amazon (site 1 = Grão Pará; site 2 = Manaus; and site 3 = Aripuanã). Average annual rainfall data (1960–1990) were interpolated from available weather stations at a 1 km spatial resolution (WorldClim database), as described by Hijmans et al. [24].

Figure 2.
Seasonal variations in the (a) relative frequency of high–quality pixel retrievals, (b) view zenith angle (VZA), and (c) solar zenith angle (SZA) for the three sites selected from north to south of the Amazon. The location of the sites is indicated in Figure 1. Results refer to 2008, a non–drought year.

Figure 3.
Daily variations in relative azimuth angle (RAA) for MODIS overpasses in Manaus (site 2), showing shifts in satellite observations toward the principal plane from the beginning to the end of the 2008 dry season (shaded area). Observations close to 180° in September to October represent the bidirectional reflectance distribution function (BRDF) hotspot direction, which produces a reflectance increase in all MODIS bands, especially in the near infrared (NIR).

Figure 4.
Dry season monthly variations in the relative frequency of pixels selected to compose the MOD13A2 product at the backscattering direction (RAA > 90°). Comparatively, more BRDF hotspot observations (n) are registered from the beginning (June) to the end (September) of the dry season. Results refer to 2008 and 4500 pixels distributed over the entire Amazon region.

Figure 5.
Monthly average surface reflectance (2000–2014) of dense ombrophilous forest for MODIS (MAIAC) data non–corrected for bidirectional effects. Spectra are shown for the beginning (June) and end (September) of the dry season over (a) site 1, (b) site 2, (c) site 3, and (d) the entire Amazon region (n = 4500 sampled pixels). The number of pixels per site was 100. Precise MODIS band positioning is indicated in the text.

Figure 6.
Variations in monthly average surface reflectance (2000–2014) for MODIS (MAIAC) data non–corrected for BRDF effects in bands (a) 1 (red), (b) 2 (near infrared—NIR), and (c) 6 (shortwave infrared—SWIR). For all bands, a reflectance increase is observed from the beginning (June) to the end (September) of the Amazonian dry season.

Figure 7.
Variations in monthly average surface reflectance (2000–2014) for MODIS (MAIAC) data corrected for BRDF effects in bands (a) 1 (red), (b) 2 (near infrared—NIR), and (c) 6 (shortwave infrared—SWIR). Compared to Figure 6, the reflectance differences between June and September are greatly reduced after BRDF correction.

Figure 8.
Monthly average profiles for the (a) enhanced vegetation index (EVI), (b) normalized difference vegetation index (NDVI), (c) shortwave infrared normalized difference (SWND), and (d) photochemical reflectance index (PRI), showing spectral variations before and after BRDF correction from the beginning (June) to the end (September) of the Amazonian dry season. Results refer to the 2000–2014 period (n = 4500 pixels per date).

Figure 9.
Monthly average relative changes (2000–2014) between BRDF–corrected and non–corrected (a) enhanced vegetation index (EVI), (b) normalized difference vegetation index (NDVI), (c) normalized difference water index (NDWI), (d) normalized difference infrared index (NDII), (e) shortwave infrared normalized difference (SWND), (f) green–red normalized difference (GRND), and (g) photochemical reflectance index (PRI). For each vegetation index, MODIS results are shown in the beginning (June) and end (September) of the Amazonian dry season.

Figure 10.
Monthly average Pearson’s correlation coefficients (2000–2014) between BRDF–corrected and non–corrected MODIS (a) enhanced vegetation index (EVI), (b) shortwave infrared normalized difference (SWND), and (c) photochemical reflectance index (PRI) in the beginning (June) and end (September) of the Amazonian dry season.

Figure 11.
Variations in Cohen’s r metric of effect size (absolute values) at site 2 (Manaus), derived from the non–parametric Mann–Whitney U test. The magnitude of the BRDF effects is indicated for the enhanced vegetation index (EVI), photochemical reflectance index (PRI), and shortwave infrared normalized difference (SWND). The limits of the effect size are based on Cohen [32].

Figure 12.
Variations in average BRDF–corrected enhanced vegetation index (EVI) (n = 100 pixels per site), as a function of the drought (2005 and 2010) and non–drought (2002 and 2008) years, for the sites (a) Grão–Pará, (b) Manaus, and (c) Aripuanã.
Figure 12.
Variations in average BRDF–corrected enhanced vegetation index (EVI) (n = 100 pixels per site), as a function of the drought (2005 and 2010) and non–drought (2002 and 2008) years, for the sites (a) Grão–Pará, (b) Manaus, and (c) Aripuanã.


Table 1.
Description of the three sites selected for analysis.
| Site Number | Name | Location | Area (ha) | Predominant Vegetation | Dry Season Length (Months) |
|---|---|---|---|---|---|
| 1 | Grão-Pará Ecological Station | 58.3° W 1.1° N | 682,300 | Dense ombrophilous forest | 3 |
| 2 | Manaus Conservation Units | 60.5° W 2.2° S | 569,200 | Dense ombrophilous forest | 1–2 |
| 3 | AripuanãNational Forest | 59.9° W 8.5° S | 710,561 | Dense ombrophilous forest | 1–2 |
Table 2.
Selected vegetation indices (VIs) for the analysis of their sensitivity to bidirectional effects. The MODIS reflectance bands used in the calculations are indicated and their wavelength positions are shown in the text.
Table 2.
Selected vegetation indices (VIs) for the analysis of their sensitivity to bidirectional effects. The MODIS reflectance bands used in the calculations are indicated and their wavelength positions are shown in the text.
| VI | Equation | Application | Reference |
|---|---|---|---|
| NDVI | Canopy struture | [27] | |
| EVI | Canopy structure | [28] | |
| GRND | Plant physiology | [17] | |
| PRI | Plant physiology | [31] | |
| NDWI | Canopy water | [29] | |
| NDII | Canopy water | [30] | |
| SWND | Canopy water | This study |
© 2019 by the authors. Licensee MDPI, Basel, Switzerland. This article is an open access article distributed under the terms and conditions of the Creative Commons Attribution (CC BY) license (http://creativecommons.org/licenses/by/4.0/).
Share and Cite
MDPI and ACS Style
Petri, C.A.; Galvão, L.S. Sensitivity of Seven MODIS Vegetation Indices to BRDF Effects during the Amazonian Dry Season. Remote Sens. 2019, 11, 1650. https://0-doi-org.brum.beds.ac.uk/10.3390/rs11141650
AMA Style
Petri CA, Galvão LS. Sensitivity of Seven MODIS Vegetation Indices to BRDF Effects during the Amazonian Dry Season. Remote Sensing. 2019; 11(14):1650. https://0-doi-org.brum.beds.ac.uk/10.3390/rs11141650
Chicago/Turabian StylePetri, Caio Arlanche, and Lênio Soares Galvão. 2019. "Sensitivity of Seven MODIS Vegetation Indices to BRDF Effects during the Amazonian Dry Season" Remote Sensing 11, no. 14: 1650. https://0-doi-org.brum.beds.ac.uk/10.3390/rs11141650
Note that from the first issue of 2016, this journal uses article numbers instead of page numbers. See further details here.