Spatio-Temporal Patterns of Coastal Aquaculture Derived from Sentinel-1 Time Series Data and the Full Landsat Archive


Abstract
:
1. Introduction
2. Study Areas and Data
2.1. Study Areas
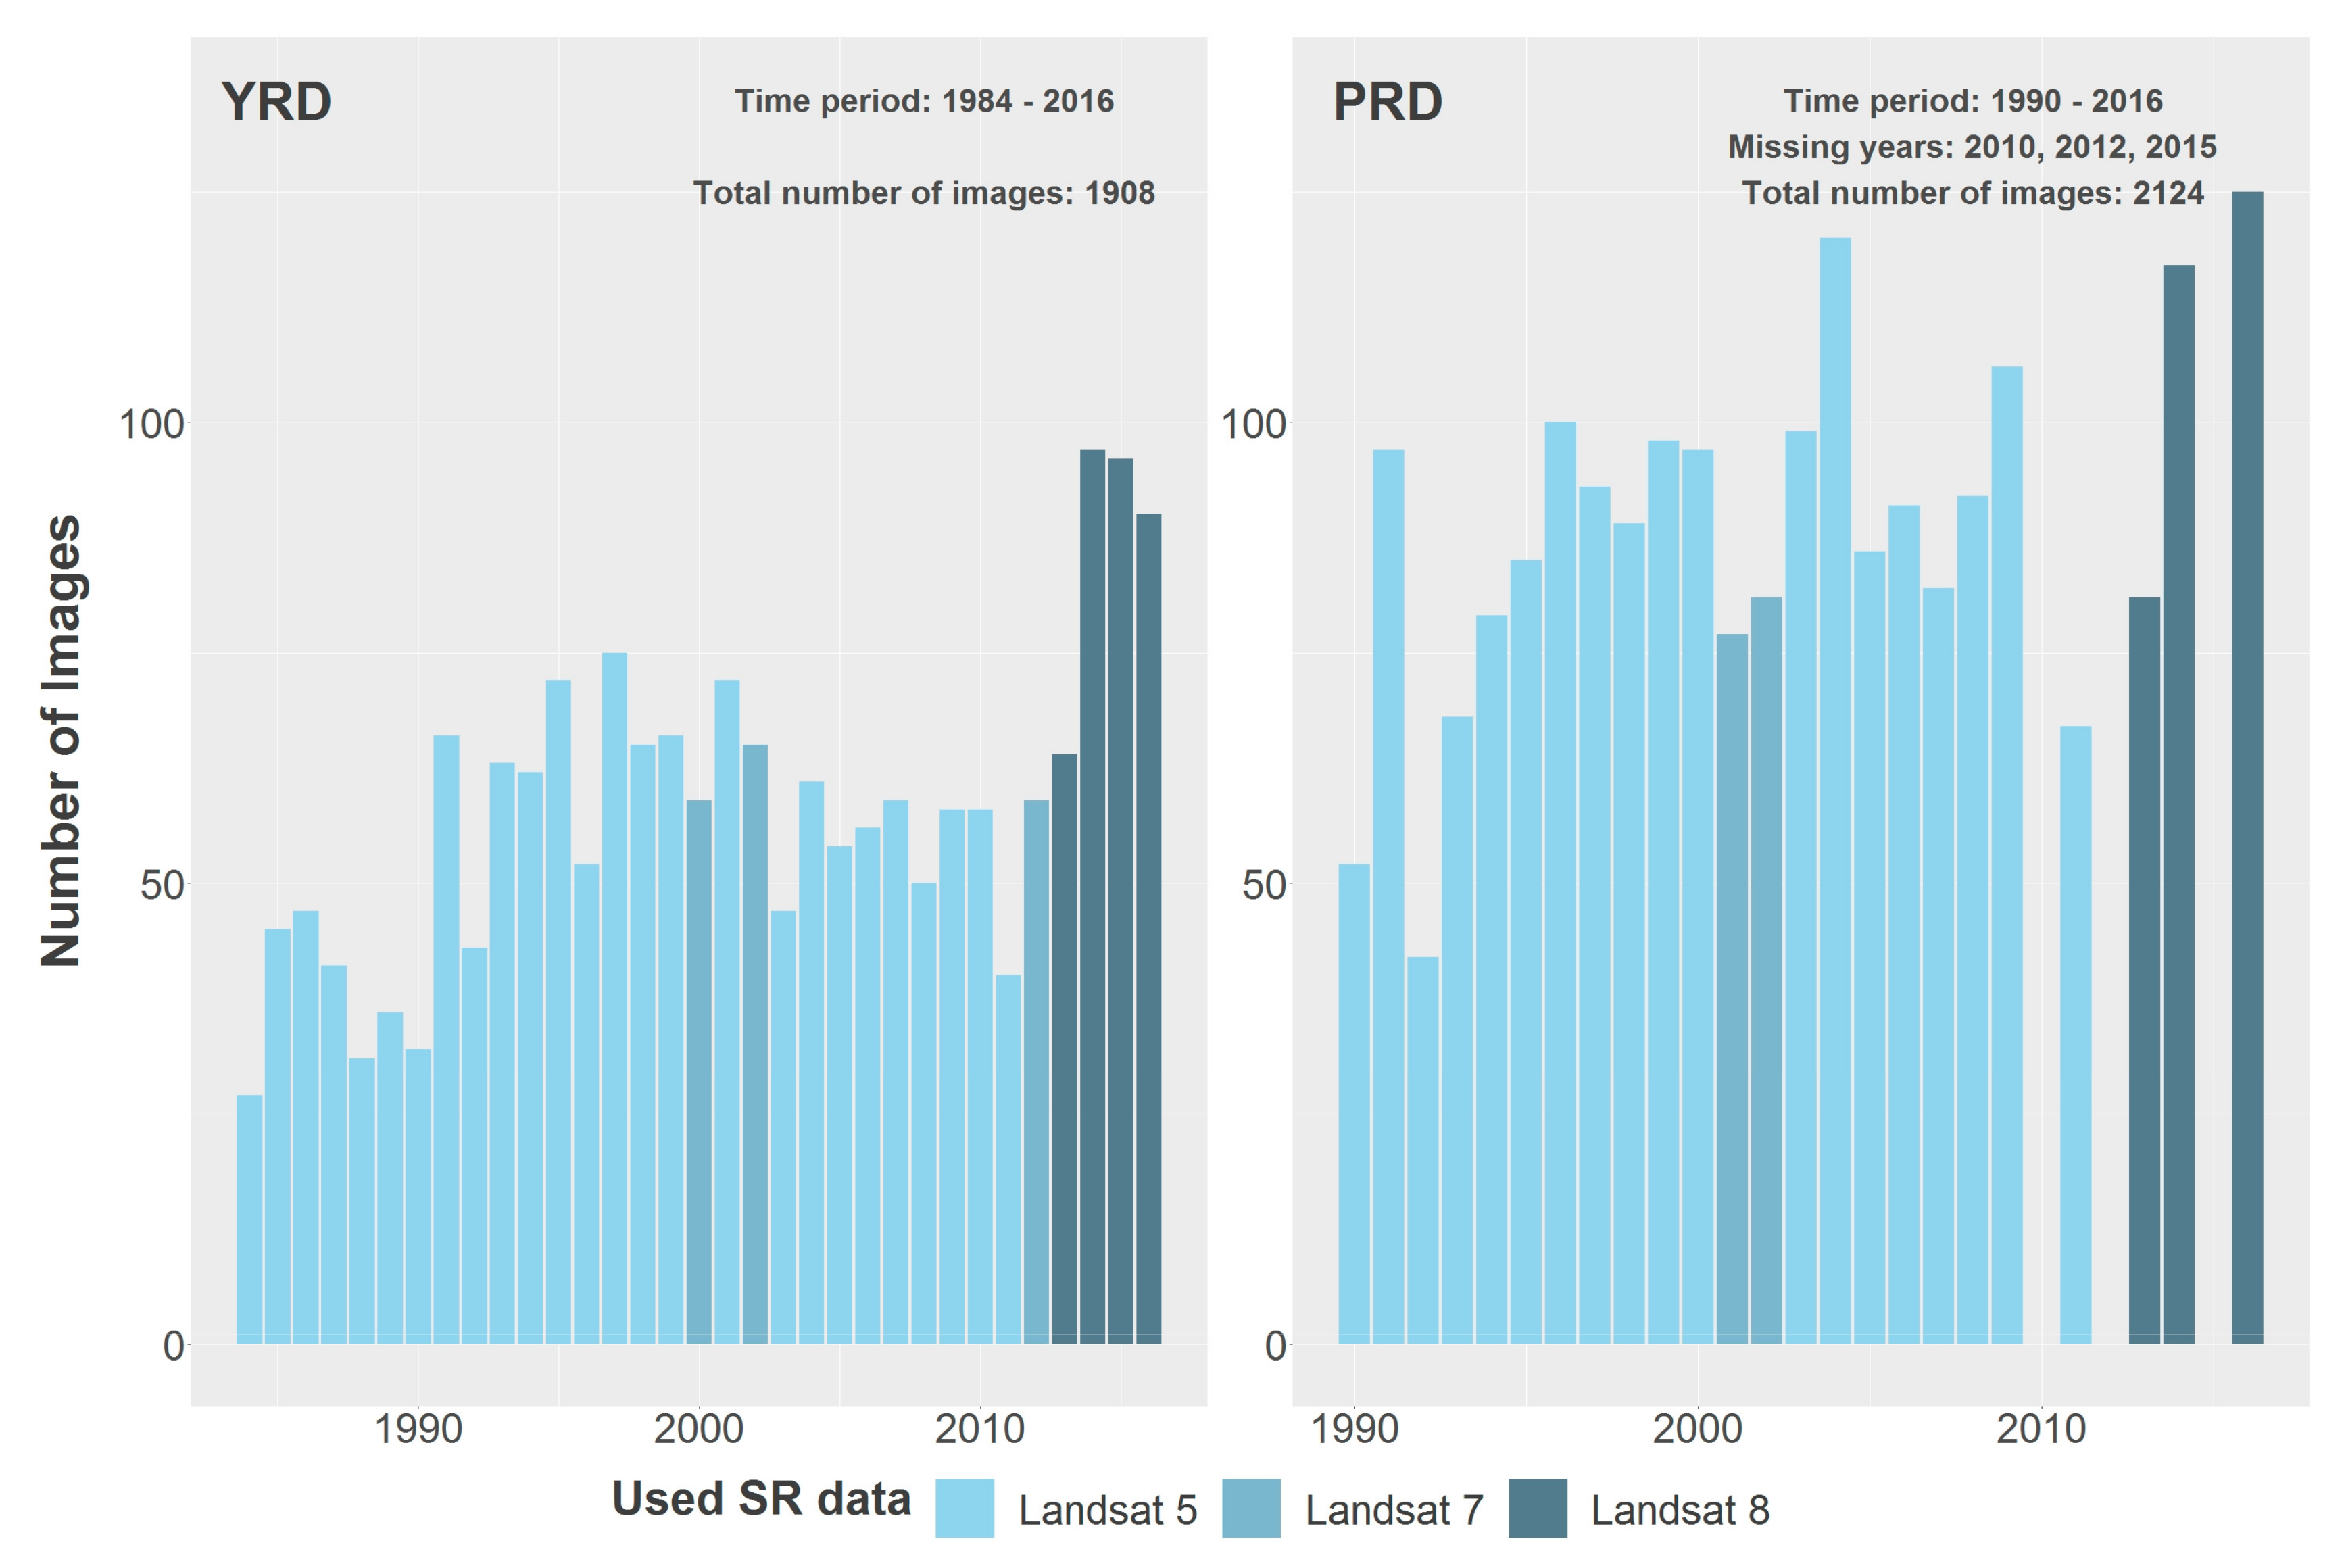
2.2. Data
3. Methodology
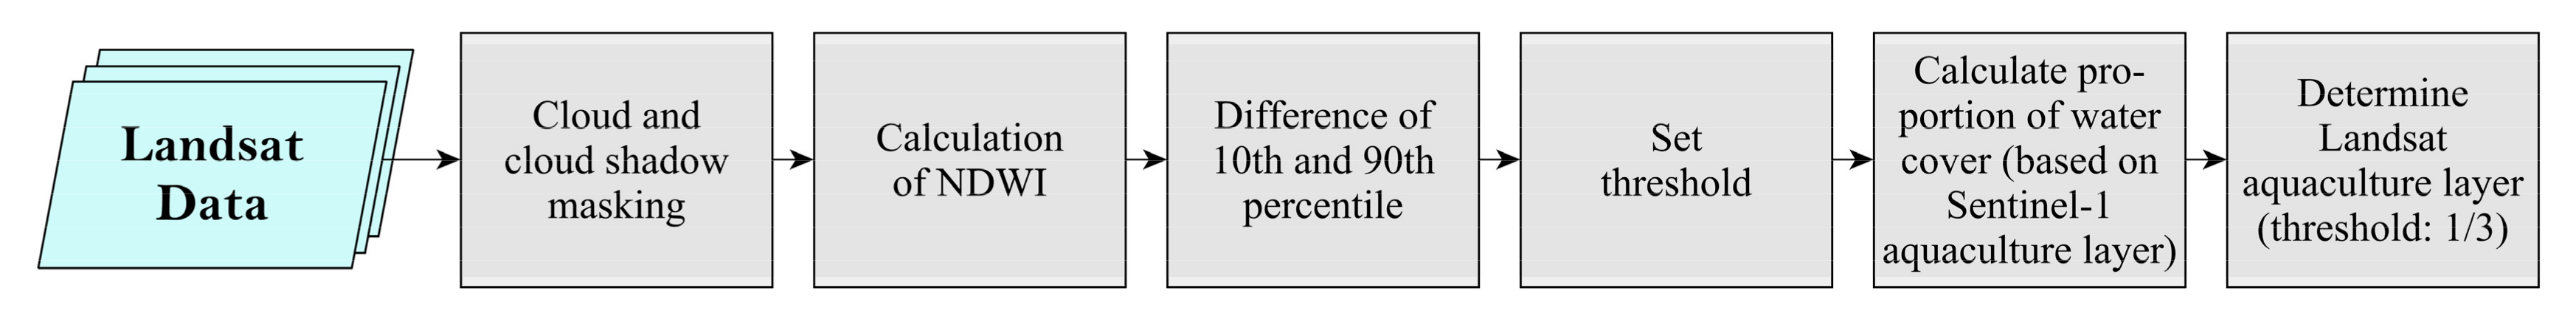
3.1. Aquaculture Area Classification
3.2. Spatial Analysis
3.3. Accuracy Assessment
4. Results
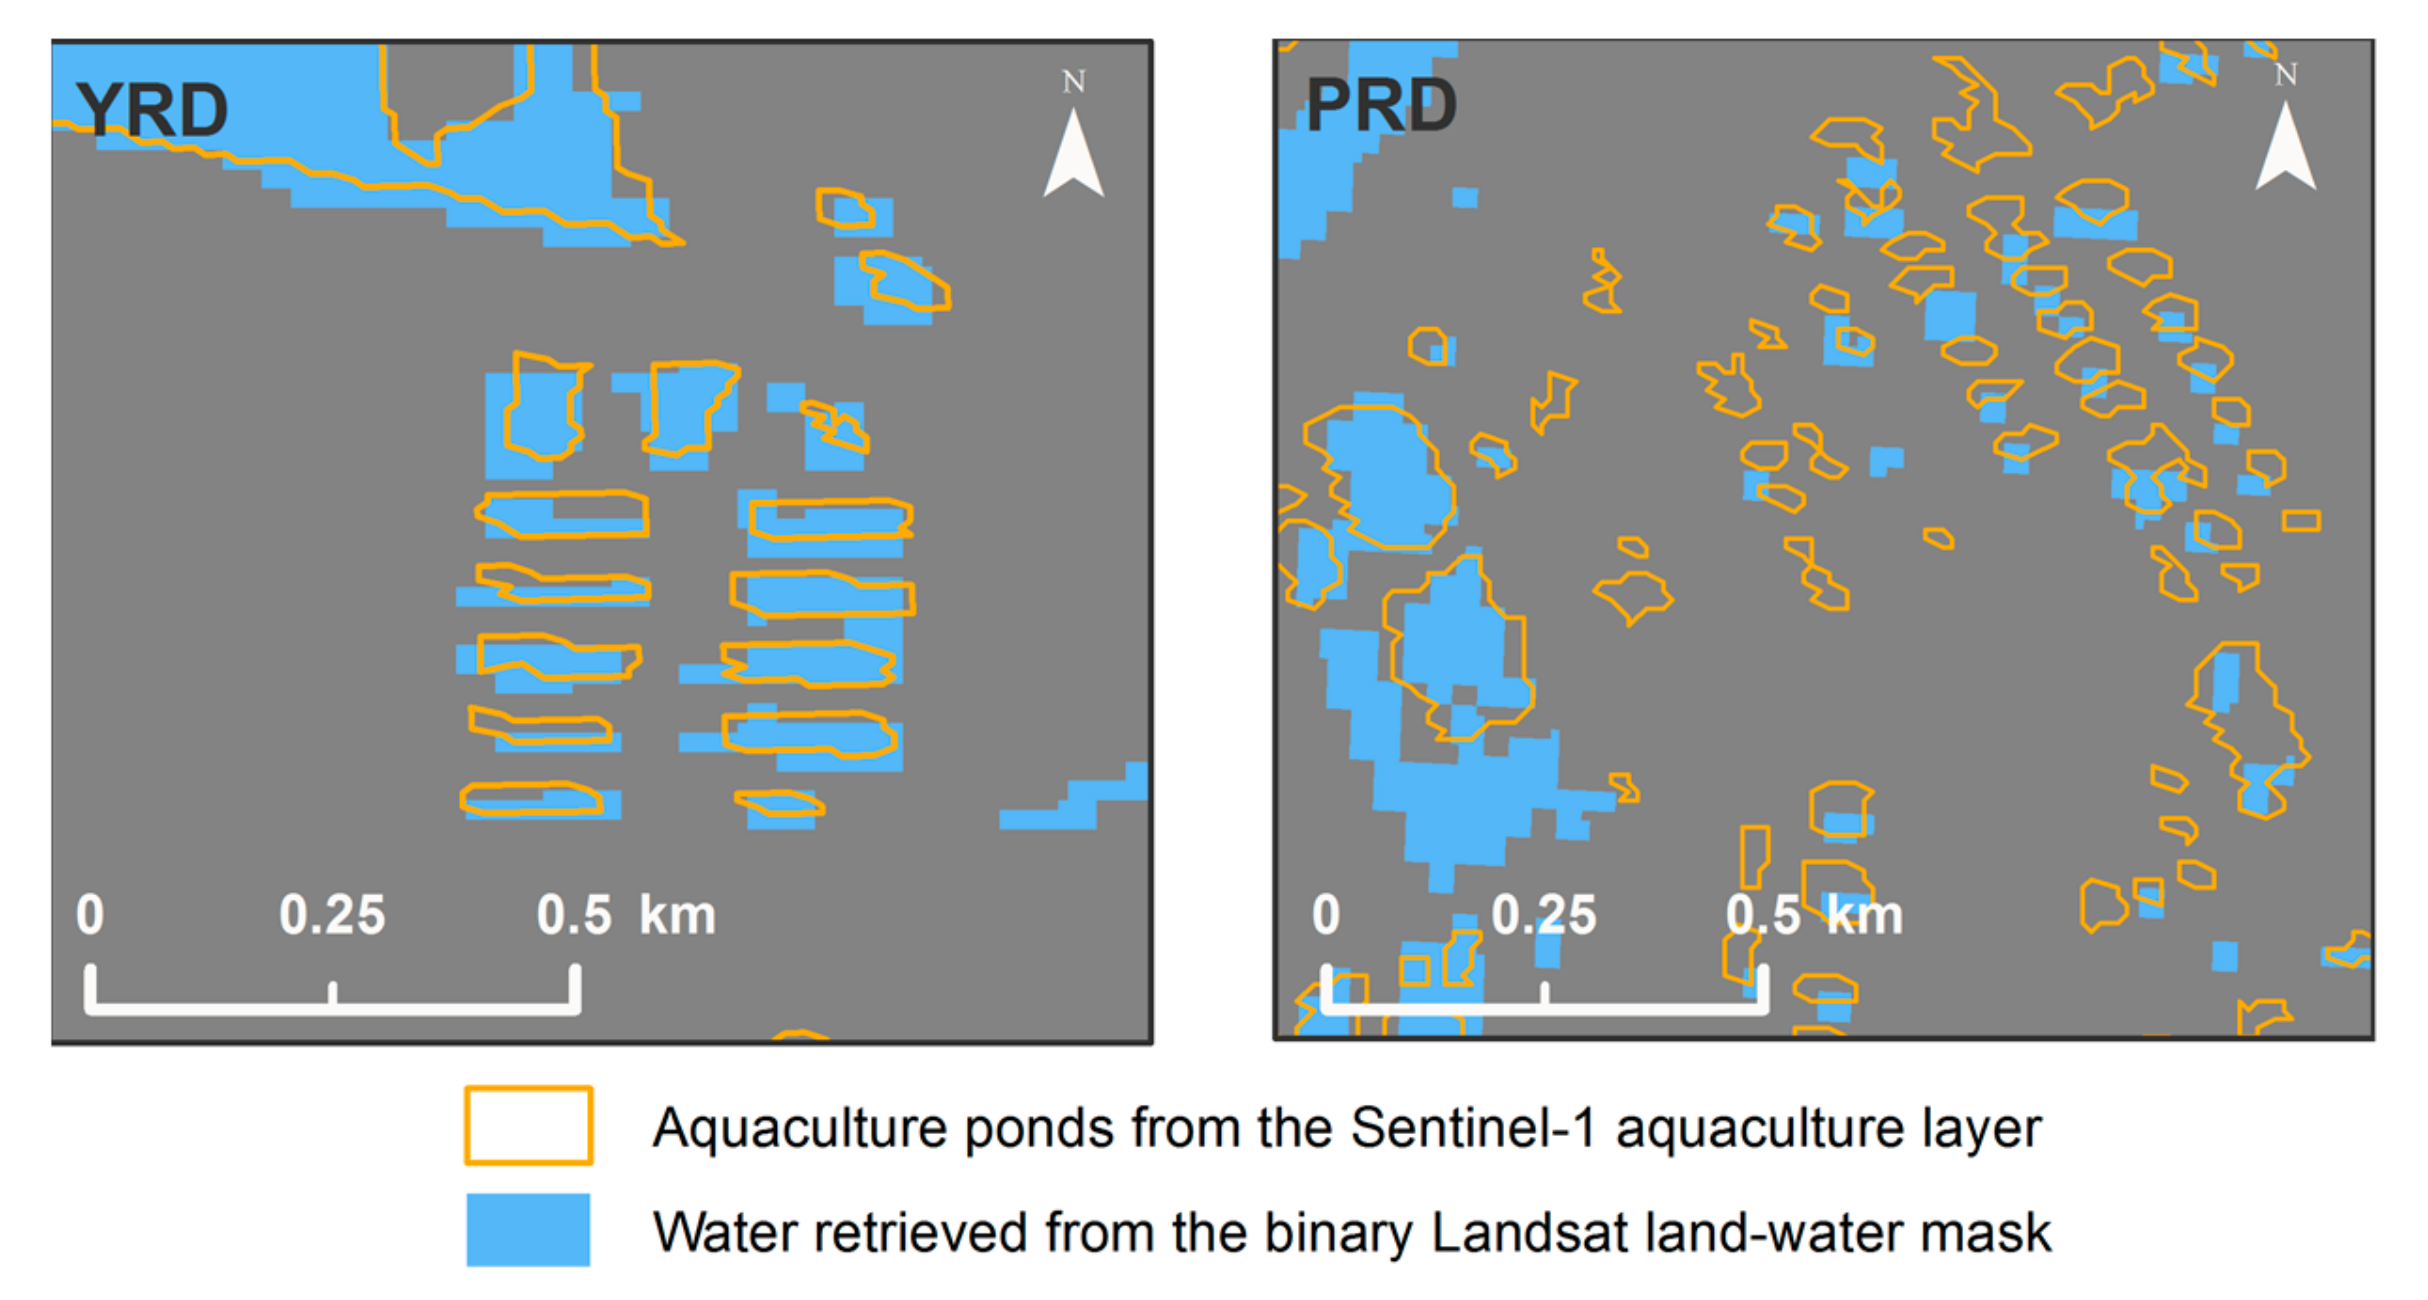
4.1. Accuracy Assessment of Aquaculture Area Classification
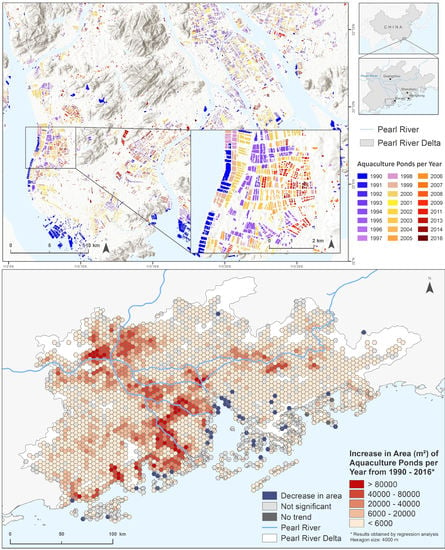
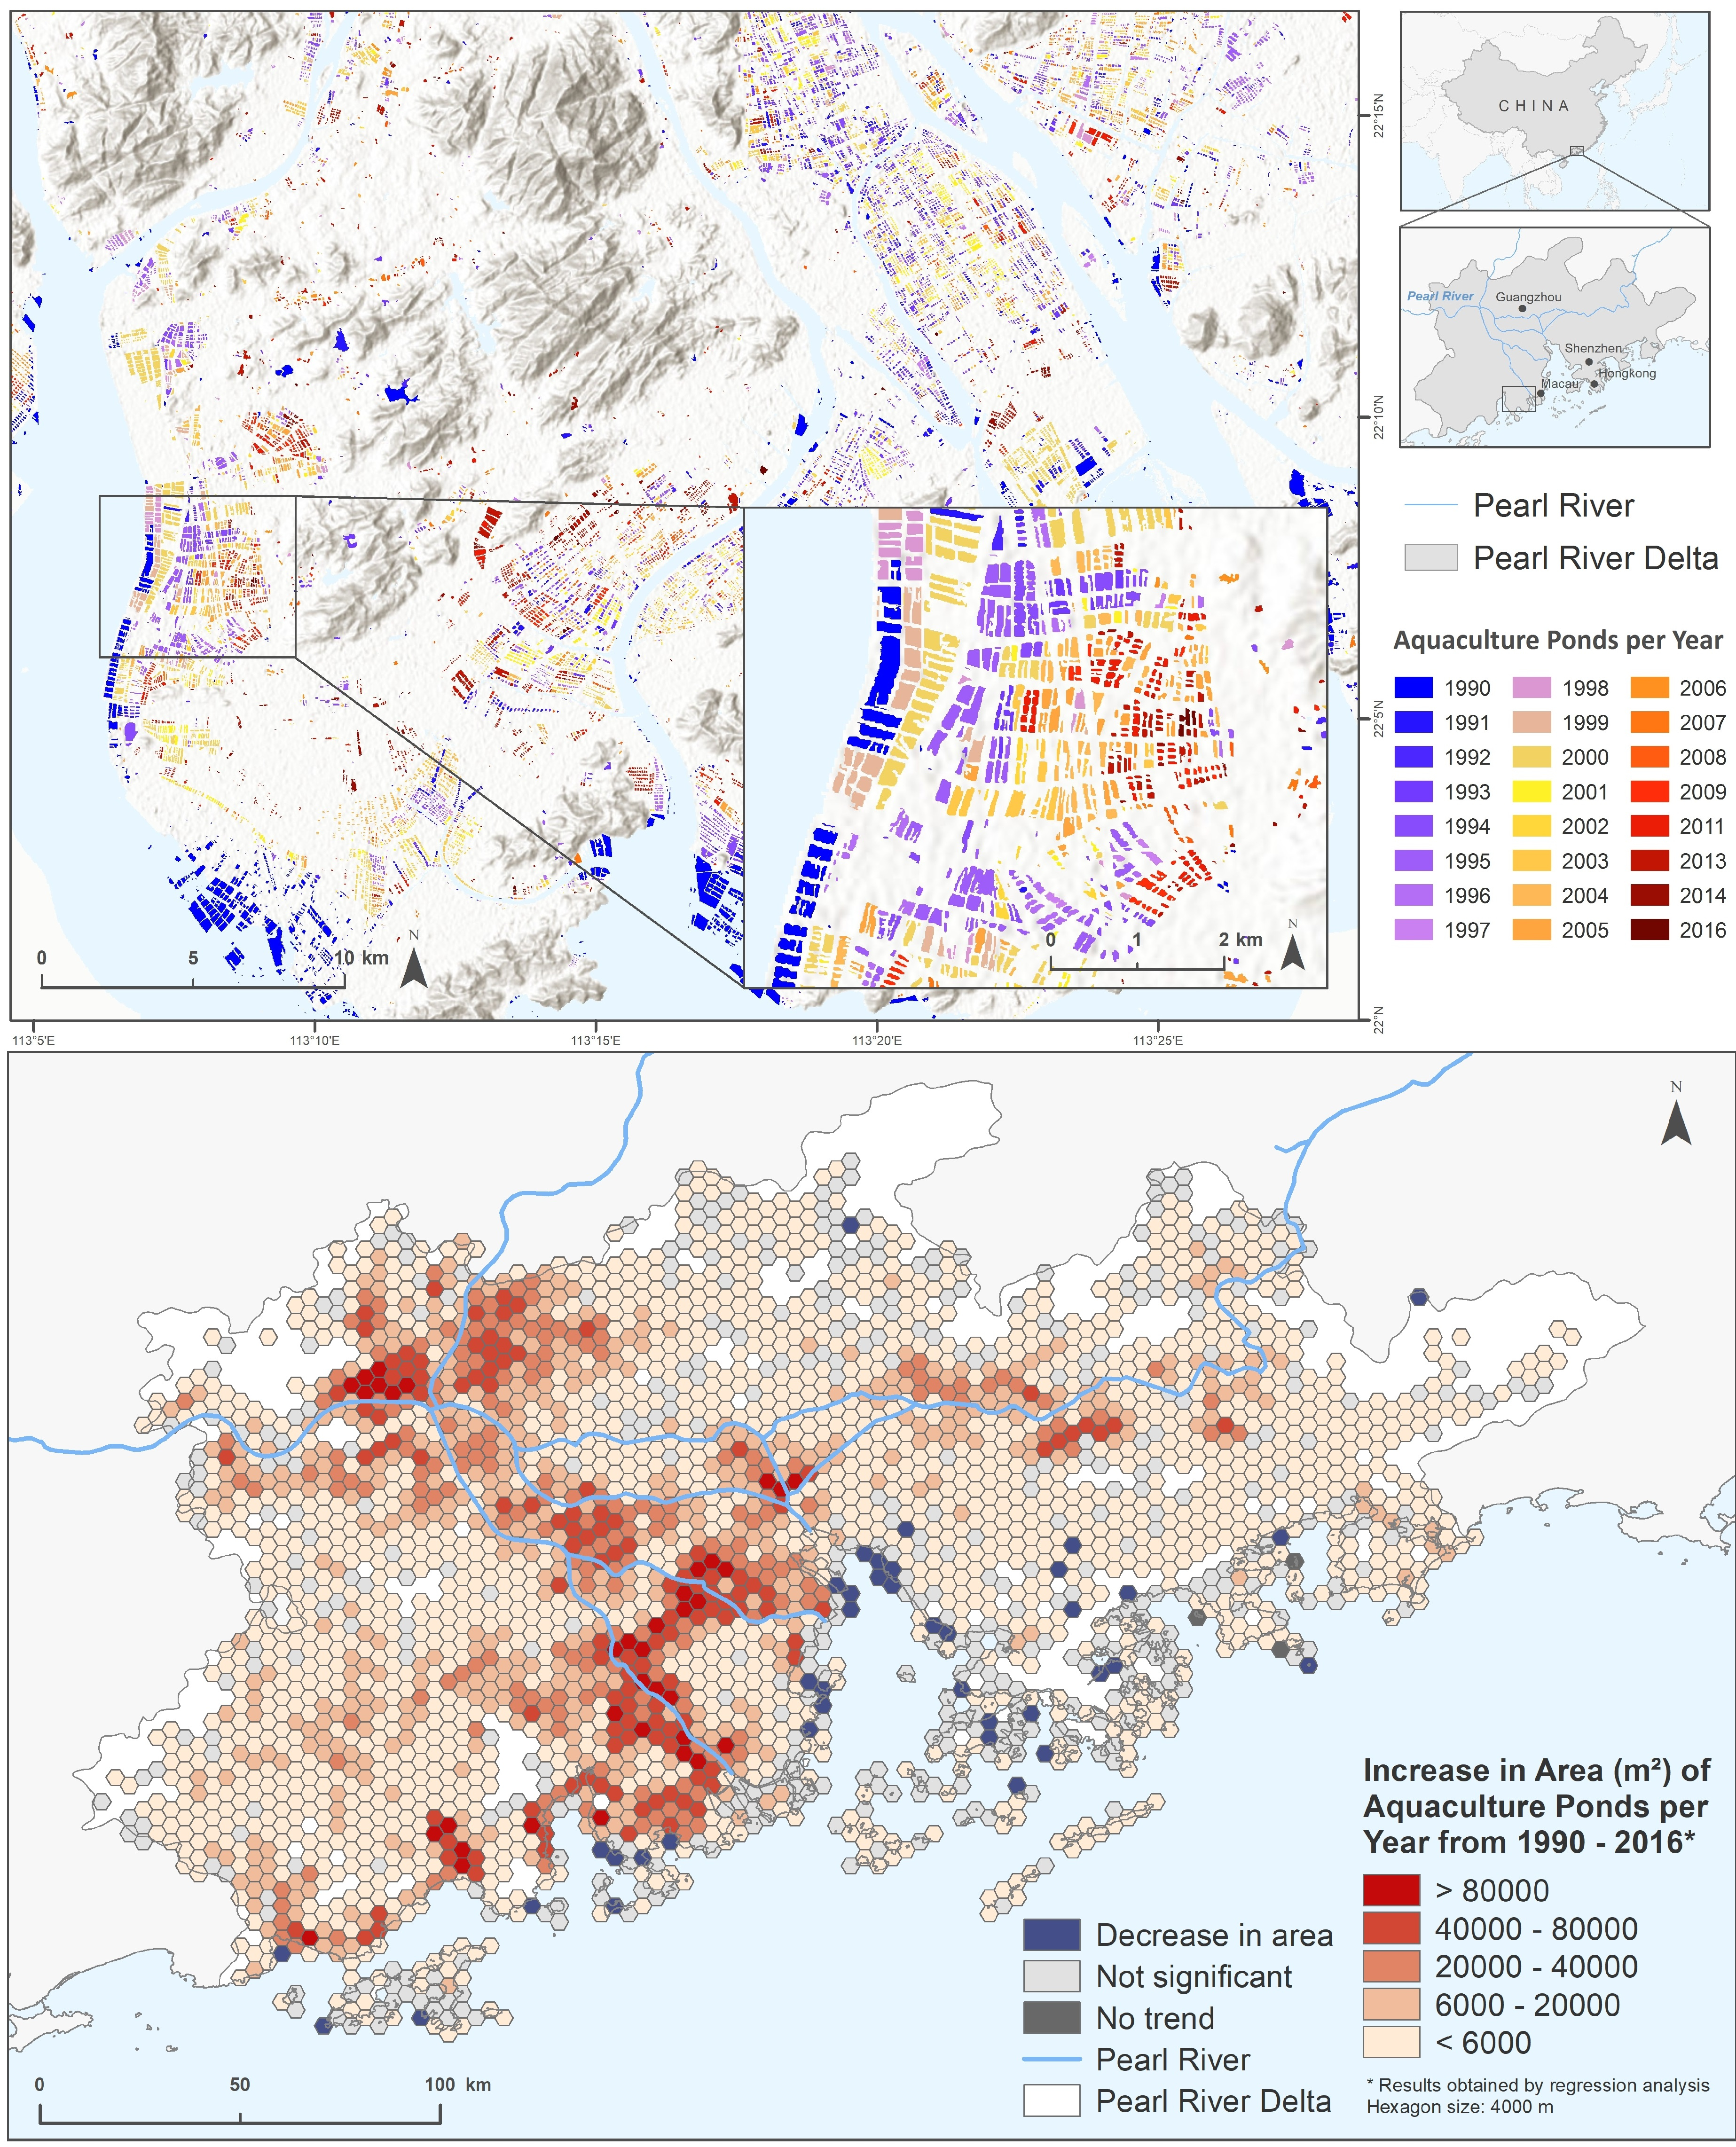
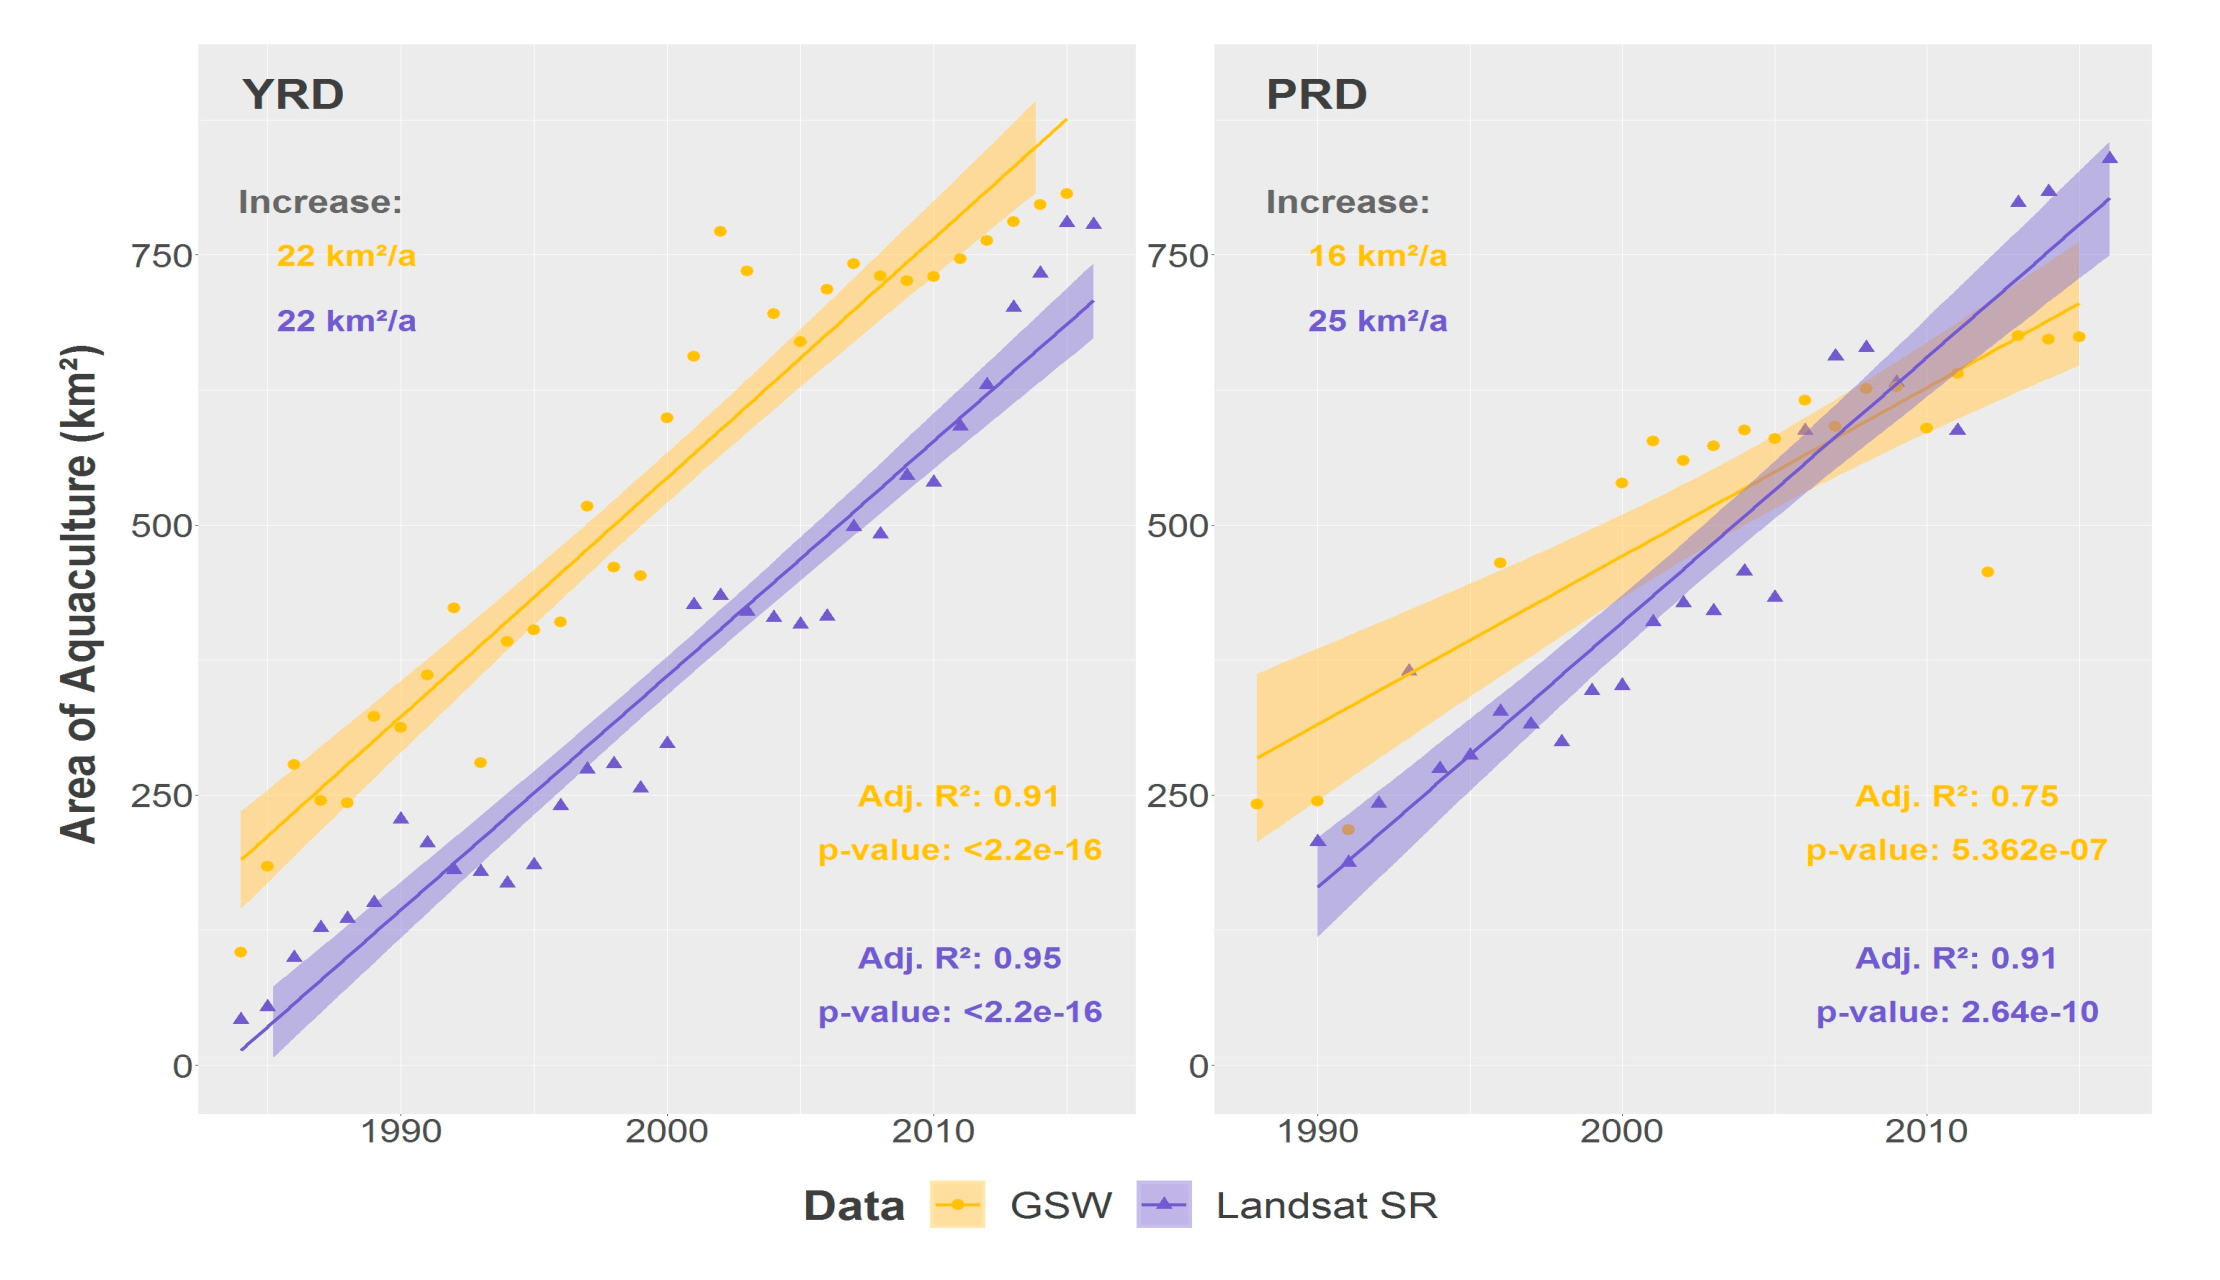
4.2. Spatial Variations in Aquaculture Area
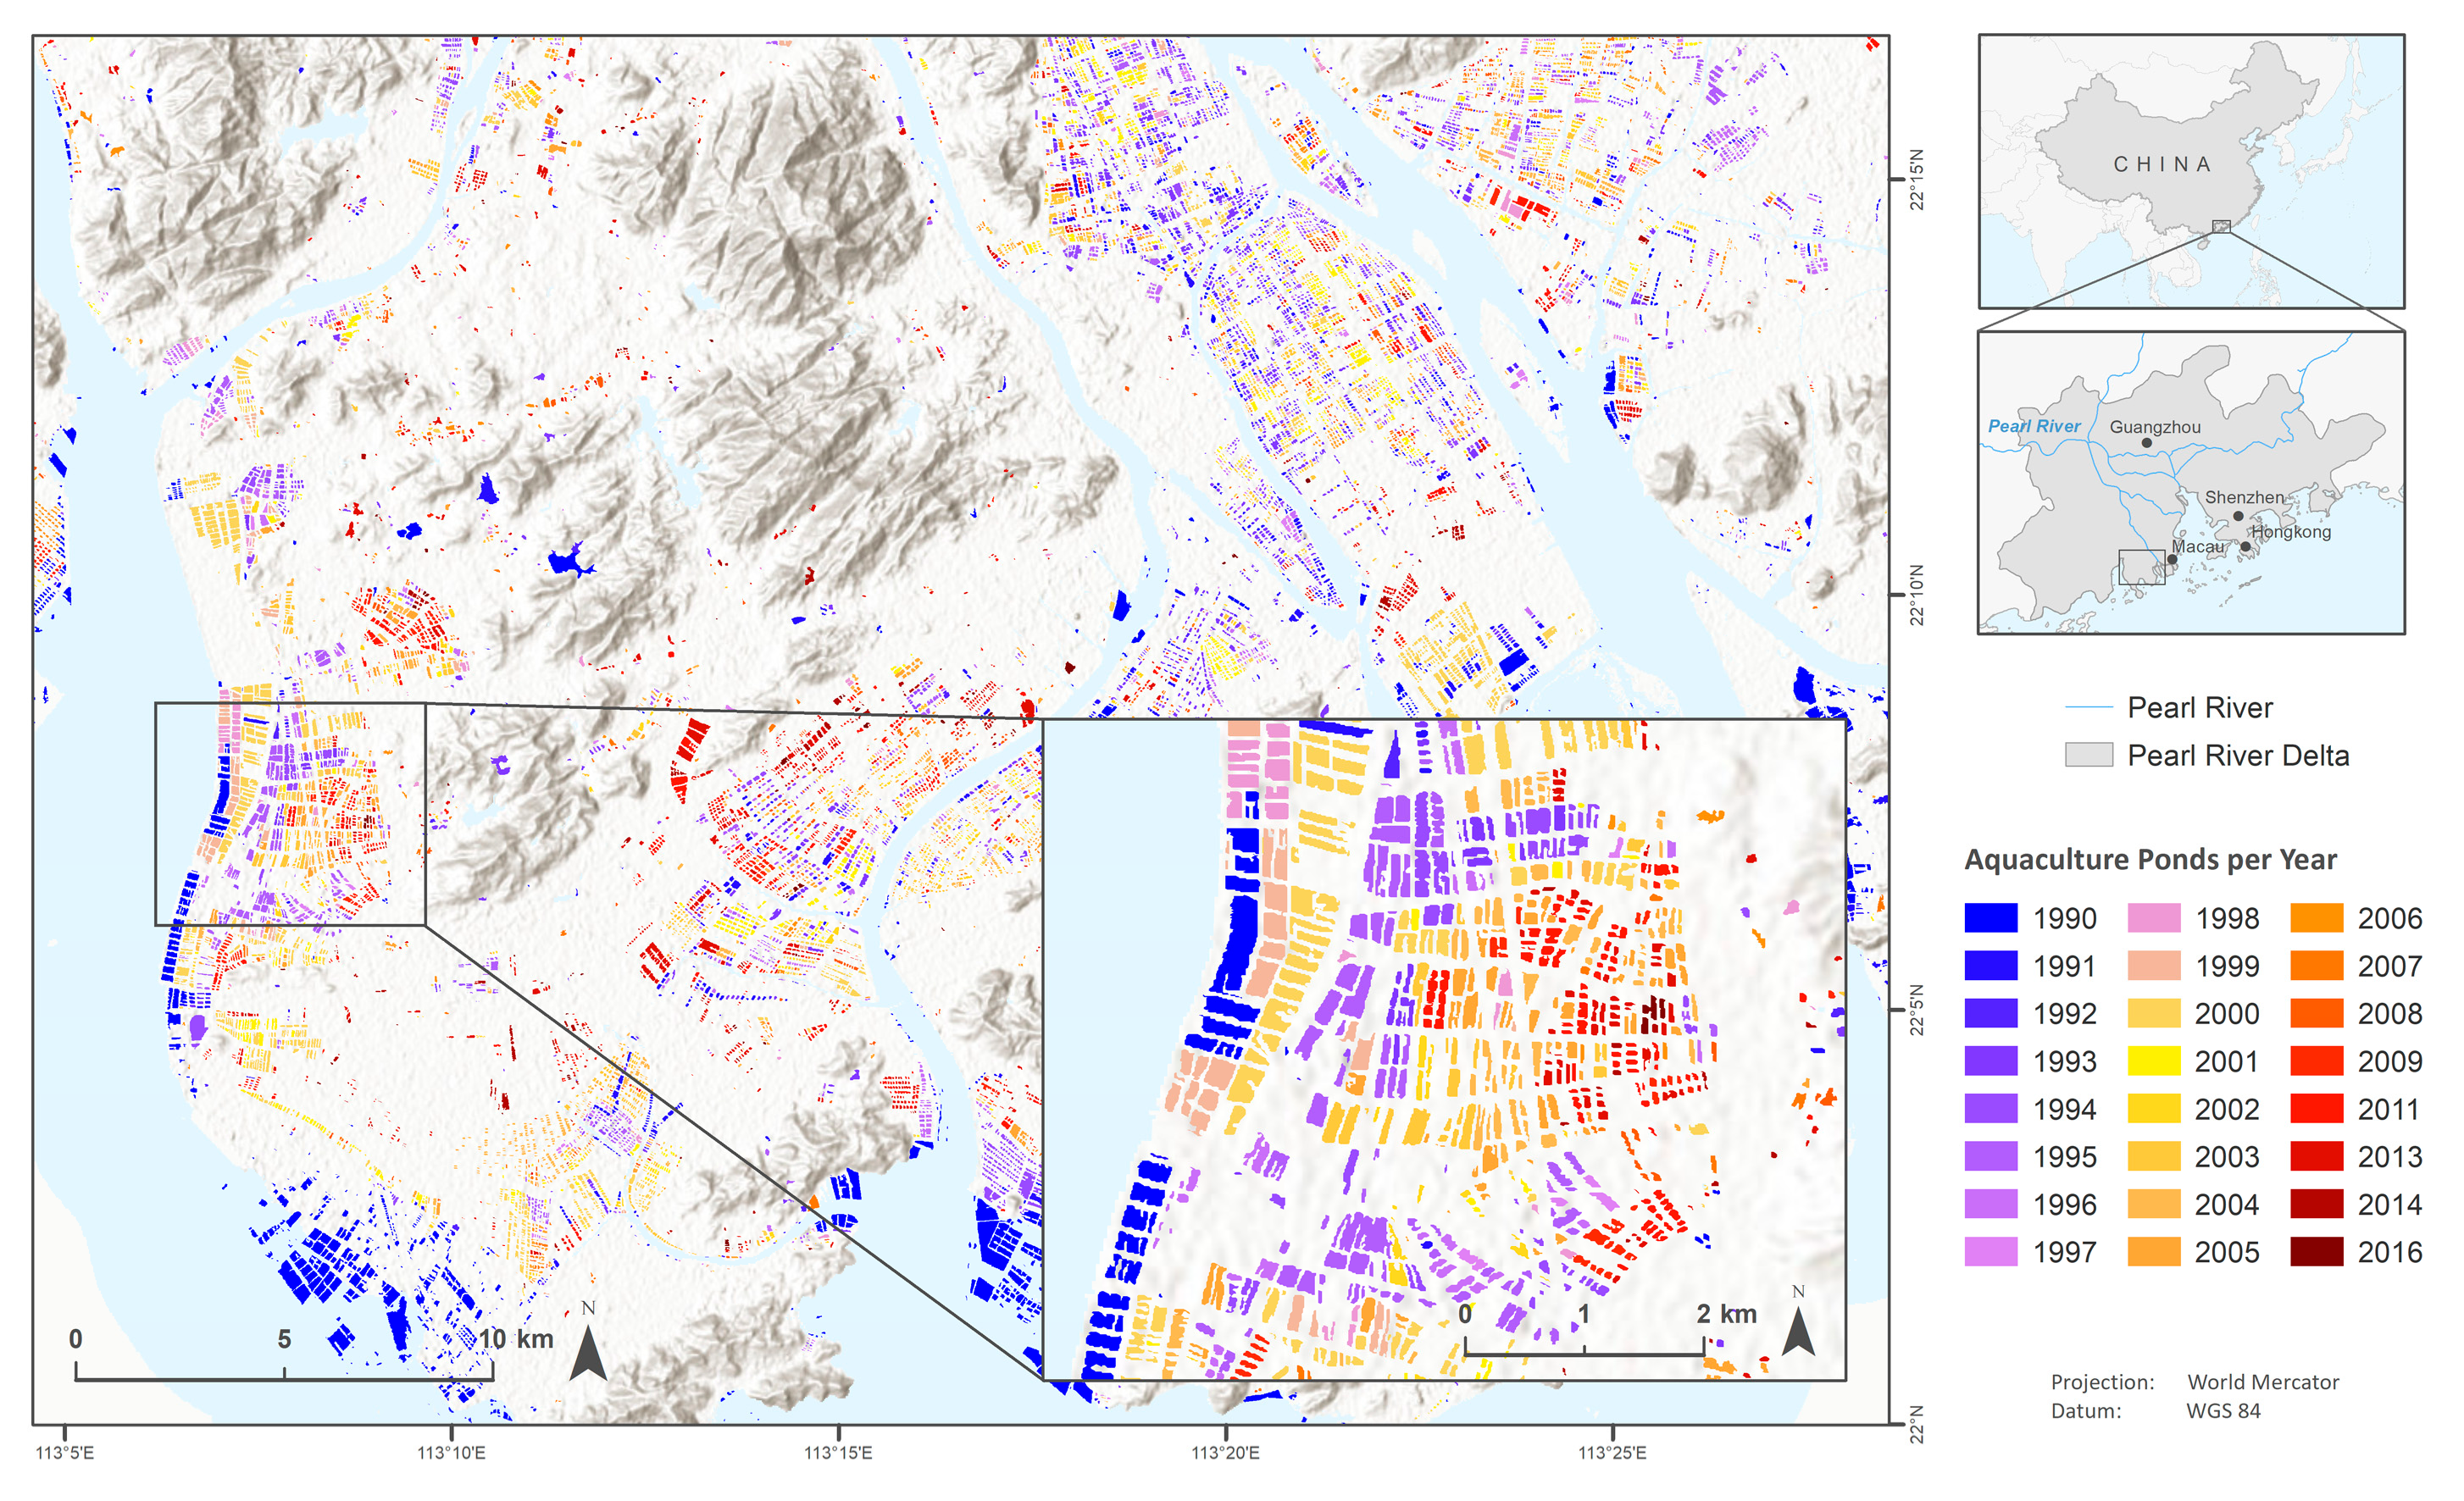
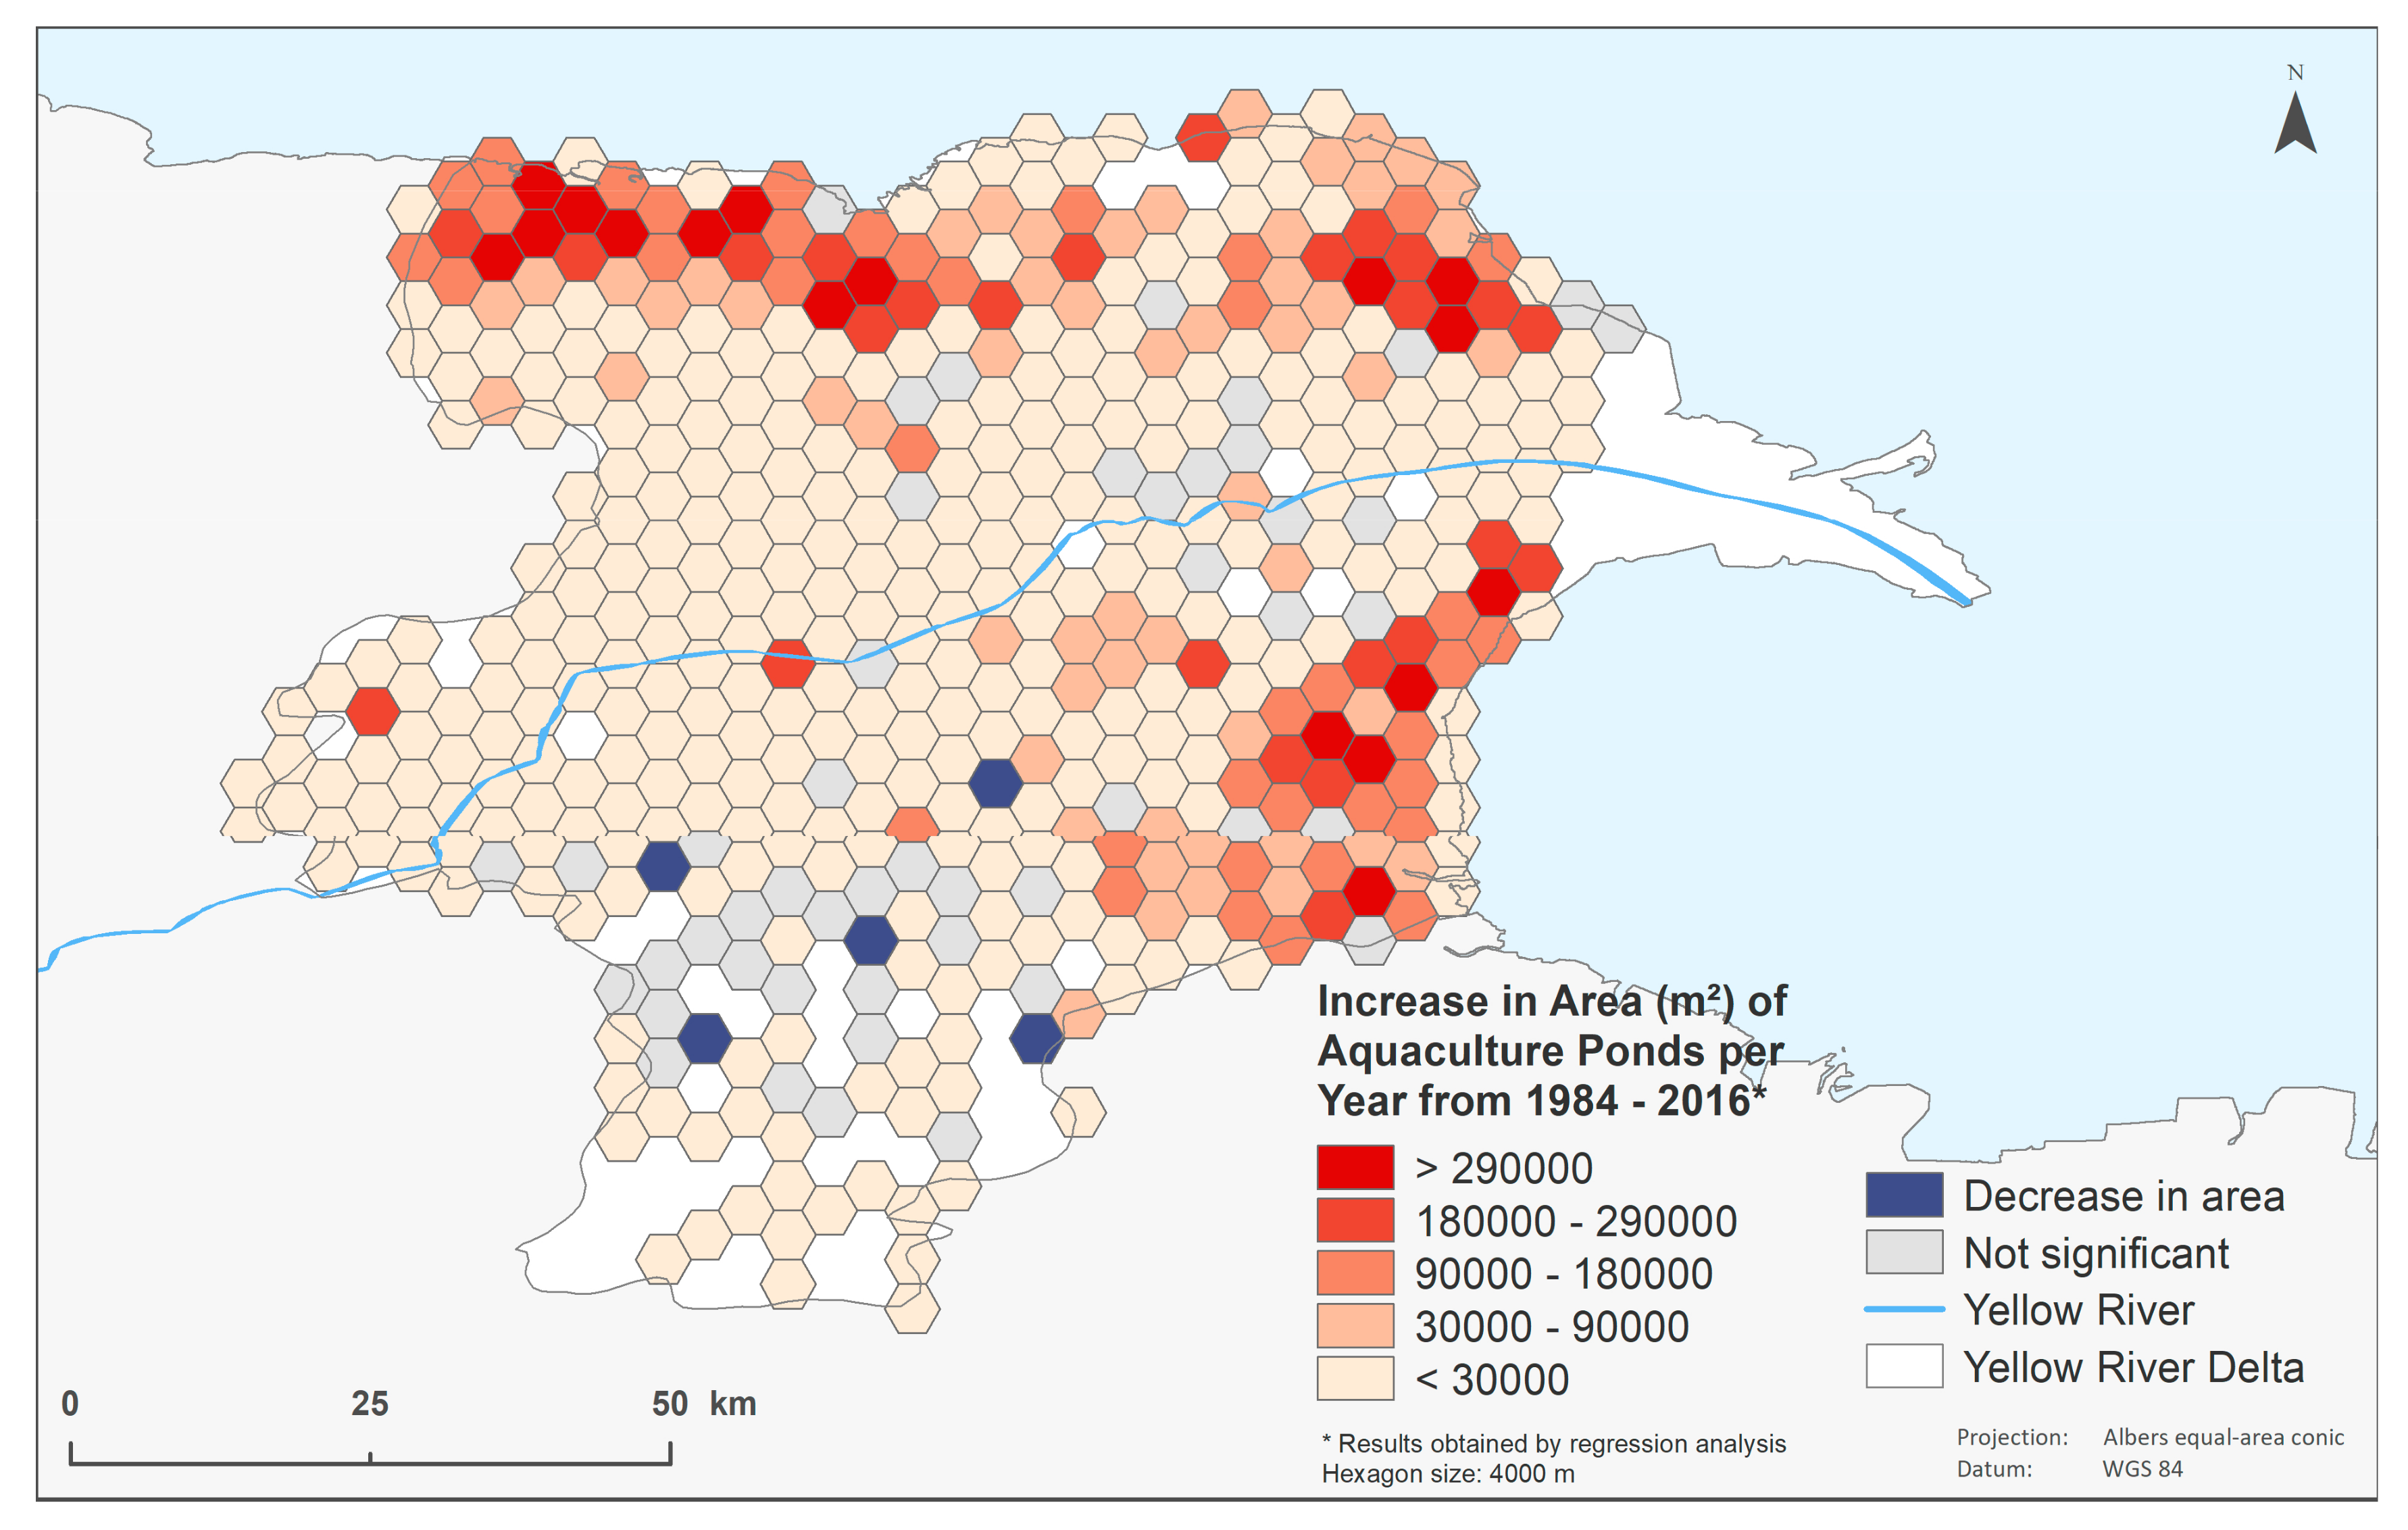
4.3. Temporal Patterns And Hotspots
5. Discussion
5.1. Increase in Aquaculture Area
5.2. Dynamics And Hotspots of Aquaculture
5.3. Potentials And Limitations of This Study
6. Conclusions
Author Contributions
Funding
Acknowledgments
Conflicts of Interest
Appendix A

| Year | 2016 | 2015 | 2014 | 2013 | 2012 | 2011 | 2010 | 2009 | 2008 | 2007 | 2006 | 2005 | 2004 | 2003 | 2002 | 2001 | 2000 |
|---|---|---|---|---|---|---|---|---|---|---|---|---|---|---|---|---|---|
| YRD | 0.15 | 0.13 | 0.12 | 0.15 | 0.15 | 0.05 | 0.15 | 0.10 | 0.15 | 0.10 | 0.10 | 0.08 | 0.10 | 0.15 | 0.10 | 0.11 | 0.10 |
| PRD | −0.10 | 0.00 | −0.10 | −0.10 | 0.00 | 0.00 | 0.00 | 0.00 | 0.00 | −0.05 | 0.00 | 0.00 | 0.02 | 0.03 | 0.02 | 0.02 | 0.04 |
| Year | 1999 | 1998 | 1997 | 1996 | 1995 | 1994 | 1993 | 1992 | 1991 | 1990 | 1989 | 1988 | 1987 | 1986 | 1985 | 1984 | |
| YRD | 0.10 | 0.07 | 0.05 | 0.07 | 0.08 | 0.10 | 0.07 | 0.08 | 0.06 | 0.05 | 0.10 | 0.10 | 0.08 | 0.10 | 0.06 | 0.07 | |
| PRD | 0.03 | 0.05 | 0.03 | 0.05 | 0.05 | 0.05 | 0.00 | 0.00 | 0.03 | 0.03 |
References
- FAO. The State of World Fisheries and Aquaculture; FAO: Rome, Italy, 2016. [Google Scholar]
- Irz, X.; Stevenson, J.R.; Tanoy, A.; Villarante, P.; Morissens, P. The equity and poverty impacts of aquaculture: Insights from the Philippines. Dev. Policy Rev. 2007, 25, 495–516. [Google Scholar] [CrossRef]
- Kaliba, A.R.; Ngugi, C.C.; Mackambo, J.M.; Osewe, K.O.; Senkondo, E.; Mnembuka, B.V.; Amisah, S. Potential effect of aquaculture promotion on poverty reduction in Sub-Saharan Africa. Aquac. Int. 2007, 15, 445–459. [Google Scholar] [CrossRef]
- Pant, J.; Barman, B.K.; Murshed-E-Jahan, K.; Belton, B.; Beveridge, M. Can aquaculture benefit the extreme poor? A case study of landless and socially marginalized Adivasi (ethnic) communities in Bangladesh. Aquaculture 2014, 418, 1–10. [Google Scholar] [CrossRef]
- Herbeck, L.S.; Unger, D.; Wu, Y.; Jennerjahn, T.C. Effluent, nutrient and organic matter export from shrimp and fish ponds causing eutrophication in coastal and back-reef waters of NE Hainan, tropical China. Cont. Shelf Res. 2013, 57, 92–104. [Google Scholar] [CrossRef]
- Ottinger, M.; Clauss, K.; Kuenzer, C. Opportunities and Challenges for the Estimation of Aquaculture Production Based on Earth Observation Data. Remote Sens. 2018, 10, 1076. [Google Scholar] [CrossRef]
- FAO. The State of World Fisheries and Aquaculture; FAO: Rome, Italy, 2018. [Google Scholar]
- Ottinger, M.; Clauss, K.; Kuenzer, C. Aquaculture: Relevance, distribution, impacts and spatial assessments—A review. Ocean Coast. Manag. 2016, 119, 244–266. [Google Scholar] [CrossRef]
- He, Z.; Cheng, X.; Kyzas, G.Z.; Fu, J. Pharmaceuticals pollution of aquaculture and its management in China. J. Mol. Liq. 2016, 223, 781–789. [Google Scholar] [CrossRef]
- Liang, P.; Wu, S.C.; Zhang, J.; Cao, Y.; Yu, S.; Wong, M.H. The effects of mariculture on heavy metal distribution in sediments and cultured fish around the Pearl River Delta region, south China. Chemosphere 2016, 148, 171–177. [Google Scholar] [CrossRef]
- Wang, S.; Tang, D.; He, F.; Fukuyo, Y.; Azanza, R.V. Occurrences of harmful algal blooms (HABs) associated with ocean environments in the South China Sea. Hydrobiologia 2007, 596, 79–93. [Google Scholar] [CrossRef]
- Keesing, J.K.; Liu, D.; Fearns, P.; Garcia, R. Inter- and intra-annual patterns of Ulva prolifera green tides in the Yellow Sea during 2007–2009, their origin and relationship to the expansion of coastal seaweed aquaculture in China. Mar. Pollut. Bull. 2011, 62, 1169–1182. [Google Scholar] [CrossRef]
- Lee, J.H.; Pang, I.C.; Moon, I.J.; Ryu, J.H. On physical factors that controlled the massive green tide occurrence along the southern coast of the Shandong Peninsula in 2008: A numerical study using a particle-tracking experiment. J. Geophys. Res. 2011, 116. [Google Scholar] [CrossRef]
- Son, N.T.; Chen, C.F.; Chang, N.B.; Chen, C.R.; Chang, L.Y.; Thanh, B.X. Mangrove mapping and change detection in Ca Mau Peninsula, Vietnam, using Landsat data and object-based image analysis. IEEE J. Sel. Top. Appl. Earth Obs. Remote Sens. 2015, 8, 503–510. [Google Scholar] [CrossRef]
- Van, T.N.; Ozaki, A.; Tho, H.N.; Duc, A.N.; Thi, Y.T.; Kurosawa, K. Arsenic and heavy metal contamination in soils under different land use in an estuary in Northern Vietnam. Int. J. Environ. Res. Public Health 2016, 13, 1091. [Google Scholar]
- Cheng, Z.; Man, Y.B.; Nie, X.P.; Wong, M.H. Trophic relationships and health risk assessments of trace metals in the aquaculture pond ecosystem of Pearl River Delta, China. Chemosphere 2013, 90, 2142–2148. [Google Scholar] [CrossRef] [PubMed]
- Ha, T.P.; Dieperink, C.; Tri, V.P.D.; Otter, H.S.; Hoekstra, P. Governance conditions for adaptive freshwater management in the Vietnamese Mekong Delta. J. Hydrol. 2018, 557, 116–127. [Google Scholar] [CrossRef]
- Higgins, S.; Overeem, I.; Tanaka, A.; Syvitski, J.P.M. Land subsidence at aquaculture facilities in the Yellow River delta, China. Geophys. Res. Lett. 2013, 40, 3898–3902. [Google Scholar] [CrossRef]
- Pauly, D.; Zeller, D. Comments on FAOs state of world fisheries and aquaculture (SOFIA 2016). Mar. Policy 2017, 77, 176–181. [Google Scholar] [CrossRef]
- Garibaldi, L. The FAO global capture production database: A six-decade effort to catch the trend. Mar. Policy 2012, 36, 760–768. [Google Scholar] [CrossRef]
- Alonso-Pérez, F.; Ruiz-Luna, A.; Turner, J.; Berlanga-Robles, C.A.; Mitchelson-Jacob, G. Land cover changes and impact of shrimp aquaculture on the landscape in the Ceuta coastal lagoon system, Sinaloa, Mexico. Ocean Coast. Manag. 2003, 46, 583–600. [Google Scholar] [CrossRef]
- Béland, M.; Goïta, K.; Bonn, F.; Pham, T.T.H. Assessment of land-cover changes related to shrimp aquaculture using remote sensing data: A case study in the Giao Thuy District, Vietnam. Int. J. Remote Sens. 2006, 27, 1491–1510. [Google Scholar] [CrossRef]
- Rajitha, K.; Mukherjee, C.K.; Chandran, R.V.; Mohan, M.M.P. Land-cover change dynamics and coastal aquaculture development: A case study in the East Godavari delta, Andhra Pradesh, India using multi-temporal satellite data. Int. J. Remote Sens. 2010, 31, 4423–4442. [Google Scholar] [CrossRef]
- Berlanga-Robles, C.A.; Ruiz-Luna, A.; Bocco, G.; Vekerdy, Z. Spatial analysis of the impact of shrimp culture on the coastal wetlands on the Northern coast of Sinaloa, Mexico. Ocean Coast. Manag. 2011, 54, 535–543. [Google Scholar] [CrossRef]
- Bui, T.D.; Maier, S.W.; Austin, C.M. Land cover and land use change related to shrimp farming in coastal areas of Quang Ninh, Vietnam using remotely sensed data. Environ. Earth Sci. 2013, 72, 441–455. [Google Scholar] [CrossRef]
- Peneva-Reed, E. Understanding land-cover change dynamics of a mangrove ecosystem at the village level in Krabi Province, Thailand, using Landsat data. Giscience Remote Sens. 2014, 51, 403–426. [Google Scholar] [CrossRef]
- Ottinger, M.; Clauss, K.; Kuenzer, C. Large-scale assessment of coastal aquaculture ponds with Sentinel-1 time series data. Remote Sens. 2017, 9, 440. [Google Scholar] [CrossRef]
- Phiri, D.; Morgenroth, J. Developments in Landsat land cover classification methods: A review. Remote Sens. 2017, 9, 967. [Google Scholar] [CrossRef]
- Ren, M. Sediment discharge of the Yellow River, China: Past, present and future—A synthesis. Acta Oceanol. Sin. 2015, 34, 1–8. [Google Scholar] [CrossRef]
- Li, X.; Mander, Ü.; Ma, Z.; Jia, Y. Water quality problems and potential for wetlands as treatment systems in the Yangtze River Delta, China. Wetlands 2009, 29, 1125–1132. [Google Scholar] [CrossRef]
- Ottinger, M.; Kuenzer, C.; Liu, G.; Wang, S.; Dech, S. Monitoring land cover dynamics in the Yellow River Delta from 1995 to 2010 based on Landsat 5 TM. Appl. Geogr. 2013, 44, 53–68. [Google Scholar] [CrossRef]
- Wohlfart, C.; Kuenzer, C.; Chen, C.; Liu, G. Social–ecological challenges in the Yellow River basin (China): A review. Environ. Earth Sci. 2016, 75, 1066. [Google Scholar] [CrossRef]
- Li, H.Y.; Man, W.D.; Li, X.Y.; Ren, C.Y.; Wang, Z.M.; Li, L.; Jia, M.M.; Mao, D.H. Remote sensing investigation of anthropogenic land cover expansion in the low-elevation coastal zone of Liaoning Province, China. Ocean Coast. Manag. 2017, 148, 245–259. [Google Scholar] [CrossRef]
- Zhao, M.; Derudder, B.; Huang, J. Polycentric development in China’s mega-city regions, 2001–2008: A comparison of the Yangtze and Pearl River Deltas. Die Erde-J. Geogr. Soc. Berlin 2017, 148, 1–13. [Google Scholar]
- Taubenböck, H.; Wiesner, M. The spatial network of megaregions—Types of connectivity between cities based on settlement patterns derived from EO-data. Comput. Environ. Urban Syst. 2015, 54, 165–180. [Google Scholar] [CrossRef]
- Liu, C.; Shi, R. Boundary Data of East Asia Summer Monsoon Geo-Eco-Region (EASMBND). Available online: http://www.geodoi.ac.cn/weben/doi.aspx?Id=165 (accessed on 1 May 2017).
- Liu, C.; Shi, R. Boundary Data of Asia Tropical Humid & Semi-Humid Eco-Region (ATHSBND). Available online: http://www.geodoi.ac.cn/weben/doi.aspx?Id=201 (accessed on 1 May 2017).
- Gorelick, N.; Hancher, M.; Dixon, M.; Ilyushchenko, S.; Thau, D.; Moore, R. Google Earth Engine: Planetary-scale geospatial analysis for everyone. Remote Sens. Environ. 2017, 202, 18–27. [Google Scholar] [CrossRef]
- Masek, J.G.; Vermote, E.F.; Saleous, N.E.; Wolfe, R.; Hall, F.G.; Huemmrich, K.F.; Gao, F.; Kutler, J.; Lim, T.K. A Landsat Surface Reflectance Dataset for North America, 1990–2000. IEEE Geosci. Remote Sens. Lett. 2006, 3, 68–72. [Google Scholar] [CrossRef]
- USGS. Landsat 8 Surface Reflectance Code (LaSRC) Product Guide: Version 2.0. 2019. Available online: https://www.usgs.gov/media/files/landsat-8-surface-reflectance-code-lasrc-product-guide (accessed on 15 May 2019).
- Zhu, Z.; Woodcock, C.E. Object-based cloud and cloud shadow detection in Landsat imagery. Remote Sens. Environ. 2012, 118, 83–94. [Google Scholar] [CrossRef]
- Pekel, J.F.; Cottam, A.; Gorelick, N.; Belward, A.S. High-resolution mapping of global surface water and its long-term changes. Nature 2016, 540, 418–422. [Google Scholar] [CrossRef]
- McFeeters, S.K. The use of the Normalized Difference Water Index (NDWI) in the delineation of open water features. Int. J. Remote Sens. 1996, 17, 1425–1432. [Google Scholar] [CrossRef]
- Khorram, S.; Nelson, S.A.C.; Koch, F.H.; van der Wiele, C.F. Remote Sensing; Springer US: Boston, MA, USA, 2012. [Google Scholar]
- Cohen, J. A coefficient of agreement for nominal scales. Educ. Psychol. Meas. 1960, 20, 37–46. [Google Scholar] [CrossRef]
- Landis, J.R.; Koch, G.G. The measurement of observer agreement for categorical data. Biometrics 1977, 33, 159–174. [Google Scholar] [CrossRef]
- Jenks, G.F.; Caspall, F.C. Error on choroplethic maps: Definition, meaurement, reduction. Ann. Assoc. Am. Geogr. 1971, 61, 217–244. [Google Scholar] [CrossRef]
- Woodcock, C.E.; Allen, R.; Anderson, M.; Belward, A.; Bindschadler, R.; Cohen, W.; Gao, F.; Goward, S.N.; Helder, D.; Helmer, E.; et al. Free access to Landsat imagery. Science 2008, 320, 1011. [Google Scholar] [CrossRef]
- Hamilton, S. Assessing the role of commercial aquaculture in displacing mangrove forest. Bull. Mar. Sci. 2013, 89, 585–601. [Google Scholar] [CrossRef]
- Li, X.; Yeh, A.G.O. Analyzing spatial restructuring of land use patterns in a fast-growing region using remote sensing and GIS. Landsc. Urban Plan. 2004, 69, 335–354. [Google Scholar] [CrossRef]
- Zhou, Q.; Sun, B. Analysis of spatio-temporal pattern and driving force of land cover change using multi-temporal remote sensing images. Sci. China Technol. Sci. 2010, 53, 111–119. [Google Scholar] [CrossRef]
- WorldBank. East Asia’s Changing Urban Landscape: Measuring a Decade of Spatial Growth; World Bank PUBN: Washington, DC, USA, 2015; ISBN 1464803633. [Google Scholar]
- Toufique, K.A.; Belton, B. Is aquaculture pro-poor? Empirical evidence of impacts on fish consumption in Bangladesh. World Dev. 2014, 64, 609–620. [Google Scholar] [CrossRef]
- Pine, H.J.; Boyd, C.E. Stream salinization by inland brackish-water aquaculture. North Am. J. Aquac. 2011, 73, 107–113. [Google Scholar] [CrossRef]
- Xu, C.; Sheng, S.; Zhou, W.; Cui, L.; Liu, M. Characterizing wetland change at landscape scale in Jiangsu Province, China. Environ. Monit. Assess. 2010, 179, 279–292. [Google Scholar] [CrossRef]
- Pham, T.D.; Yoshino, K. Impacts of mangrove management systems on mangrove changes in the Northern Coast of Vietnam. Tropics 2016, 24, 141–151. [Google Scholar] [CrossRef] [Green Version]
- Richards, D.R.; Friess, D.A. Rates and drivers of mangrove deforestation in Southeast Asia, 2000–2012. Proc. Natl. Acad. Sci. USA 2015, 113, 344–349. [Google Scholar] [CrossRef]
- Haas, J.; Ban, Y. Urban growth and environmental impacts in Jing-Jin-Ji, the Yangtze, River Delta and the Pearl River Delta. Int. J. Appl. Earth Obs. Geoinf. 2014, 30, 42–55. [Google Scholar] [CrossRef]
- Primavera, J.H. Overcoming the impacts of aquaculture on the coastal zone. Ocean Coast. Manag. 2006, 49, 531–545. [Google Scholar] [CrossRef]
- Kuenzer, C.; Ottinger, M.; Liu, G.; Sun, B.; Baumhauer, R.; Dech, S. Earth observation-based coastal zone monitoring of the Yellow River Delta: Dynamics in China’s second largest oil producing region over four decades. Appl. Geogr. 2014, 55, 92–107. [Google Scholar] [CrossRef]
- Wohlfart, C.; Liu, G.; Huang, C.; Kuenzer, C. A river basin over the course of time: Multi-temporal analyses of land surface dynamics in the Yellow River Basin (China) based on medium resolution remote sensing data. Remote Sens. 2016, 8, 186. [Google Scholar] [CrossRef]
- Leichtle, T.; Geiß, C.; Wurm, M.; Lakes, T.; Taubenböck, H. Unsupervised change detection in VHR remote sensing imagery—An object-based clustering approach in a dynamic urban environment. Int. J. Appl. Earth Obs. Geoinf. 2017, 54, 15–27. [Google Scholar] [CrossRef]
- Ruddle, K.; Zhong, G. Integrated Agriculture-Aquaculture in South China: The Dike-Pond System of the Zhujiang Delta; Cambridge University Press: Cambridge, UK, 1988; ISBN 9780521341936. [Google Scholar]
- Taubenböck, H.; Wiesner, M.; Felbier, A.; Marconcini, M.; Esch, T.; Dech, S. New dimensions of urban landscapes: The spatio-temporal evolution from a polynuclei area to a mega-region based on remote sensing data. Appl. Geogr. 2014, 47, 137–153. [Google Scholar] [CrossRef]
- Nghia, N.D.; Lunestad, B.T.; Trung, T.S.; Son, N.T.; Maage, A. Heavy metals in the farming environment and in some selected aquaculture species in the Van Phong bay and Nha Trang bay of the Khanh Hoa province in Vietnam. Bull. Environ. Contam. Toxicol. 2008, 82, 75–79. [Google Scholar] [CrossRef]
- Asner, G.P. Cloud cover in Landsat observations of the Brazilian Amazon. Int. J. Remote Sens. 2001, 22, 3855–3862. [Google Scholar] [CrossRef]
- Birnie, R.V. Pixel-mixing effects and their significance to identifying snow condition from Landsat MSS data. Int. J. Remote Sens. 1986, 7, 845–853. [Google Scholar] [CrossRef]
- Han, J.; Chi, K.; Yeon, Y. Aquaculture feature extraction from satellite image using independent component analysis. In Proceedings of the Machine Learning and Data Mining in Pattern Recognition, Leipzig, Germany, 9–11 July 2005; Perner, P., Imiya, A., Eds.; Springer: Berlin/Heidelberg, Germany, 2005; pp. 660–666. [Google Scholar]
- Bush, S.R.; van Zwieten, P.A.M.; Visser, L.; van Dijk, H.; Bosma, R.; de Boer, W.F.; Verdegem, M. Scenarios for Resilient Shrimp Aquaculture in Tropical Coastal Areas. Ecol. Soc. 2010, 15, 15. [Google Scholar] [CrossRef]


| YRD | PRD | |
|---|---|---|
| Sentinel-1 Aquaculture Layer | ||
| Number of ponds | 19,700 | 264,894 |
| Total aquaculture pond areas (km²) | 828.6 | 1050.7 |
| Landsat Aquaculture Layer | ||
| Number of detected ponds | 15,270 | 169,194 |
| Number of detected ponds (%) | 80.1 | 63.9 |
| Total pond area detected (km²) | 791.2 | 853.1 |
| Total pond area detected (%) | 95.5 | 81.2 |
| Producer’s Accuracy | User’s Accuracy | ||||
|---|---|---|---|---|---|
| stable aquaculture | aquaculture change | stable aquaculture | aquaculture change | Overall Accuracy | Kappa |
| 98.3 | 80.0 | 83.1 | 98.0 | 89.0 | 0.78 |
| YRD | PRD | |
|---|---|---|
| Number of Ponds (%) | 6.7 | 3.9 |
| Area of Ponds (%) | 3.8 | 7.9 |
© 2019 by the authors. Licensee MDPI, Basel, Switzerland. This article is an open access article distributed under the terms and conditions of the Creative Commons Attribution (CC BY) license (http://creativecommons.org/licenses/by/4.0/).
Share and Cite
Stiller, D.; Ottinger, M.; Leinenkugel, P. Spatio-Temporal Patterns of Coastal Aquaculture Derived from Sentinel-1 Time Series Data and the Full Landsat Archive. Remote Sens. 2019, 11, 1707. https://0-doi-org.brum.beds.ac.uk/10.3390/rs11141707
Stiller D, Ottinger M, Leinenkugel P. Spatio-Temporal Patterns of Coastal Aquaculture Derived from Sentinel-1 Time Series Data and the Full Landsat Archive. Remote Sensing. 2019; 11(14):1707. https://0-doi-org.brum.beds.ac.uk/10.3390/rs11141707
Chicago/Turabian StyleStiller, Dorothee, Marco Ottinger, and Patrick Leinenkugel. 2019. "Spatio-Temporal Patterns of Coastal Aquaculture Derived from Sentinel-1 Time Series Data and the Full Landsat Archive" Remote Sensing 11, no. 14: 1707. https://0-doi-org.brum.beds.ac.uk/10.3390/rs11141707