Rapid Assessment of a Typhoon Disaster Based on NPP-VIIRS DNB Daily Data: The Case of an Urban Agglomeration along Western Taiwan Straits, China

 , , and
Abstract
:
1. Introduction
2. Materials
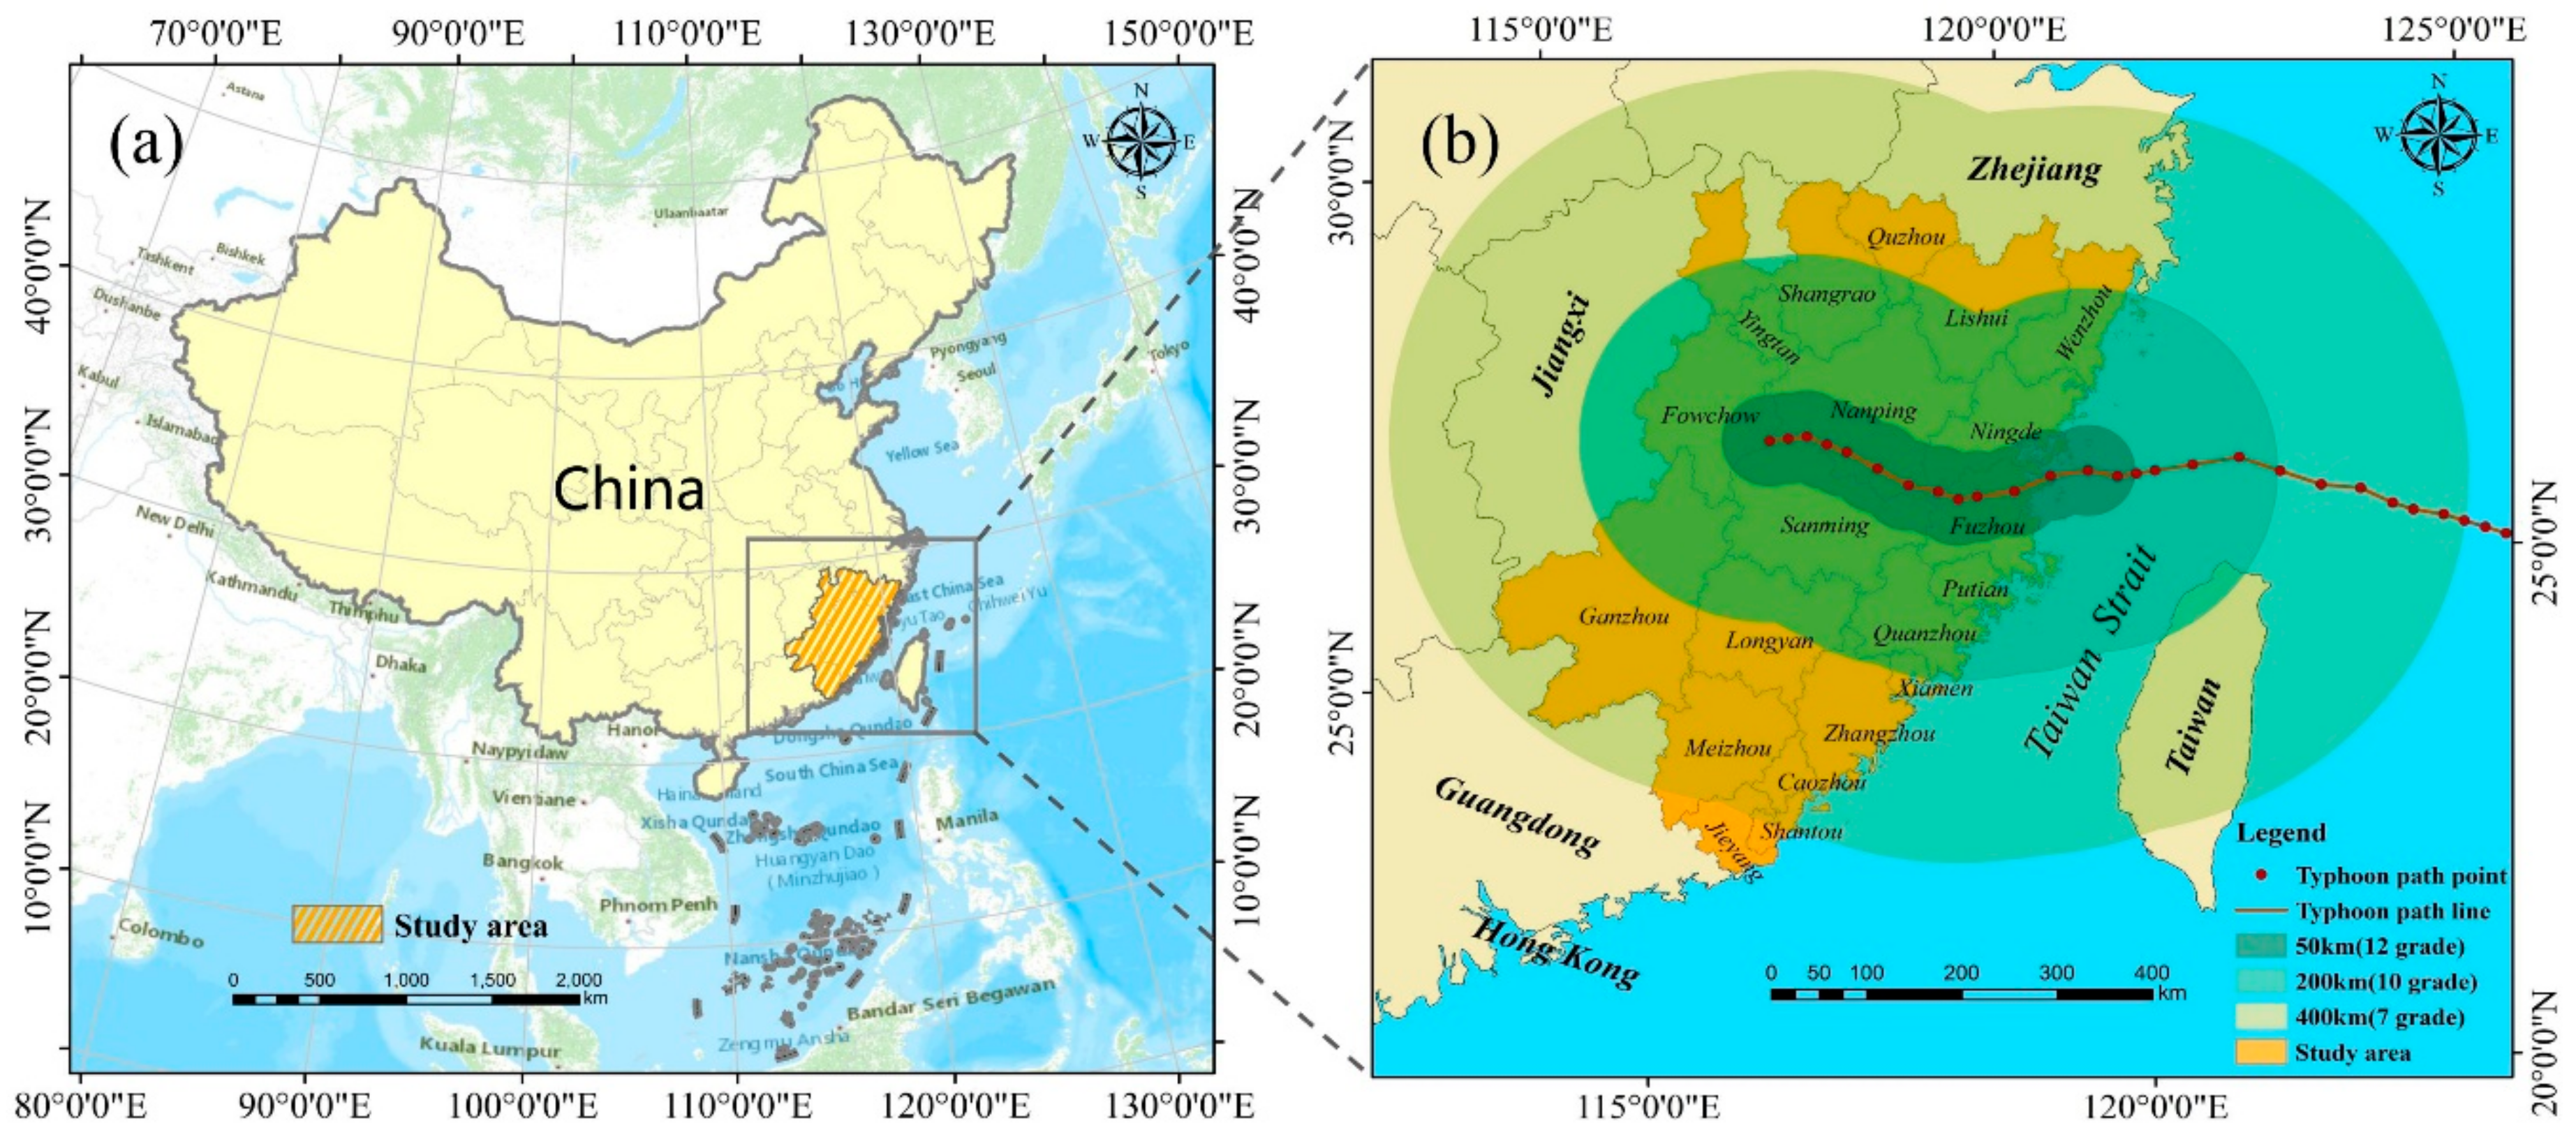
2.1. Study Area
2.2. Data Source
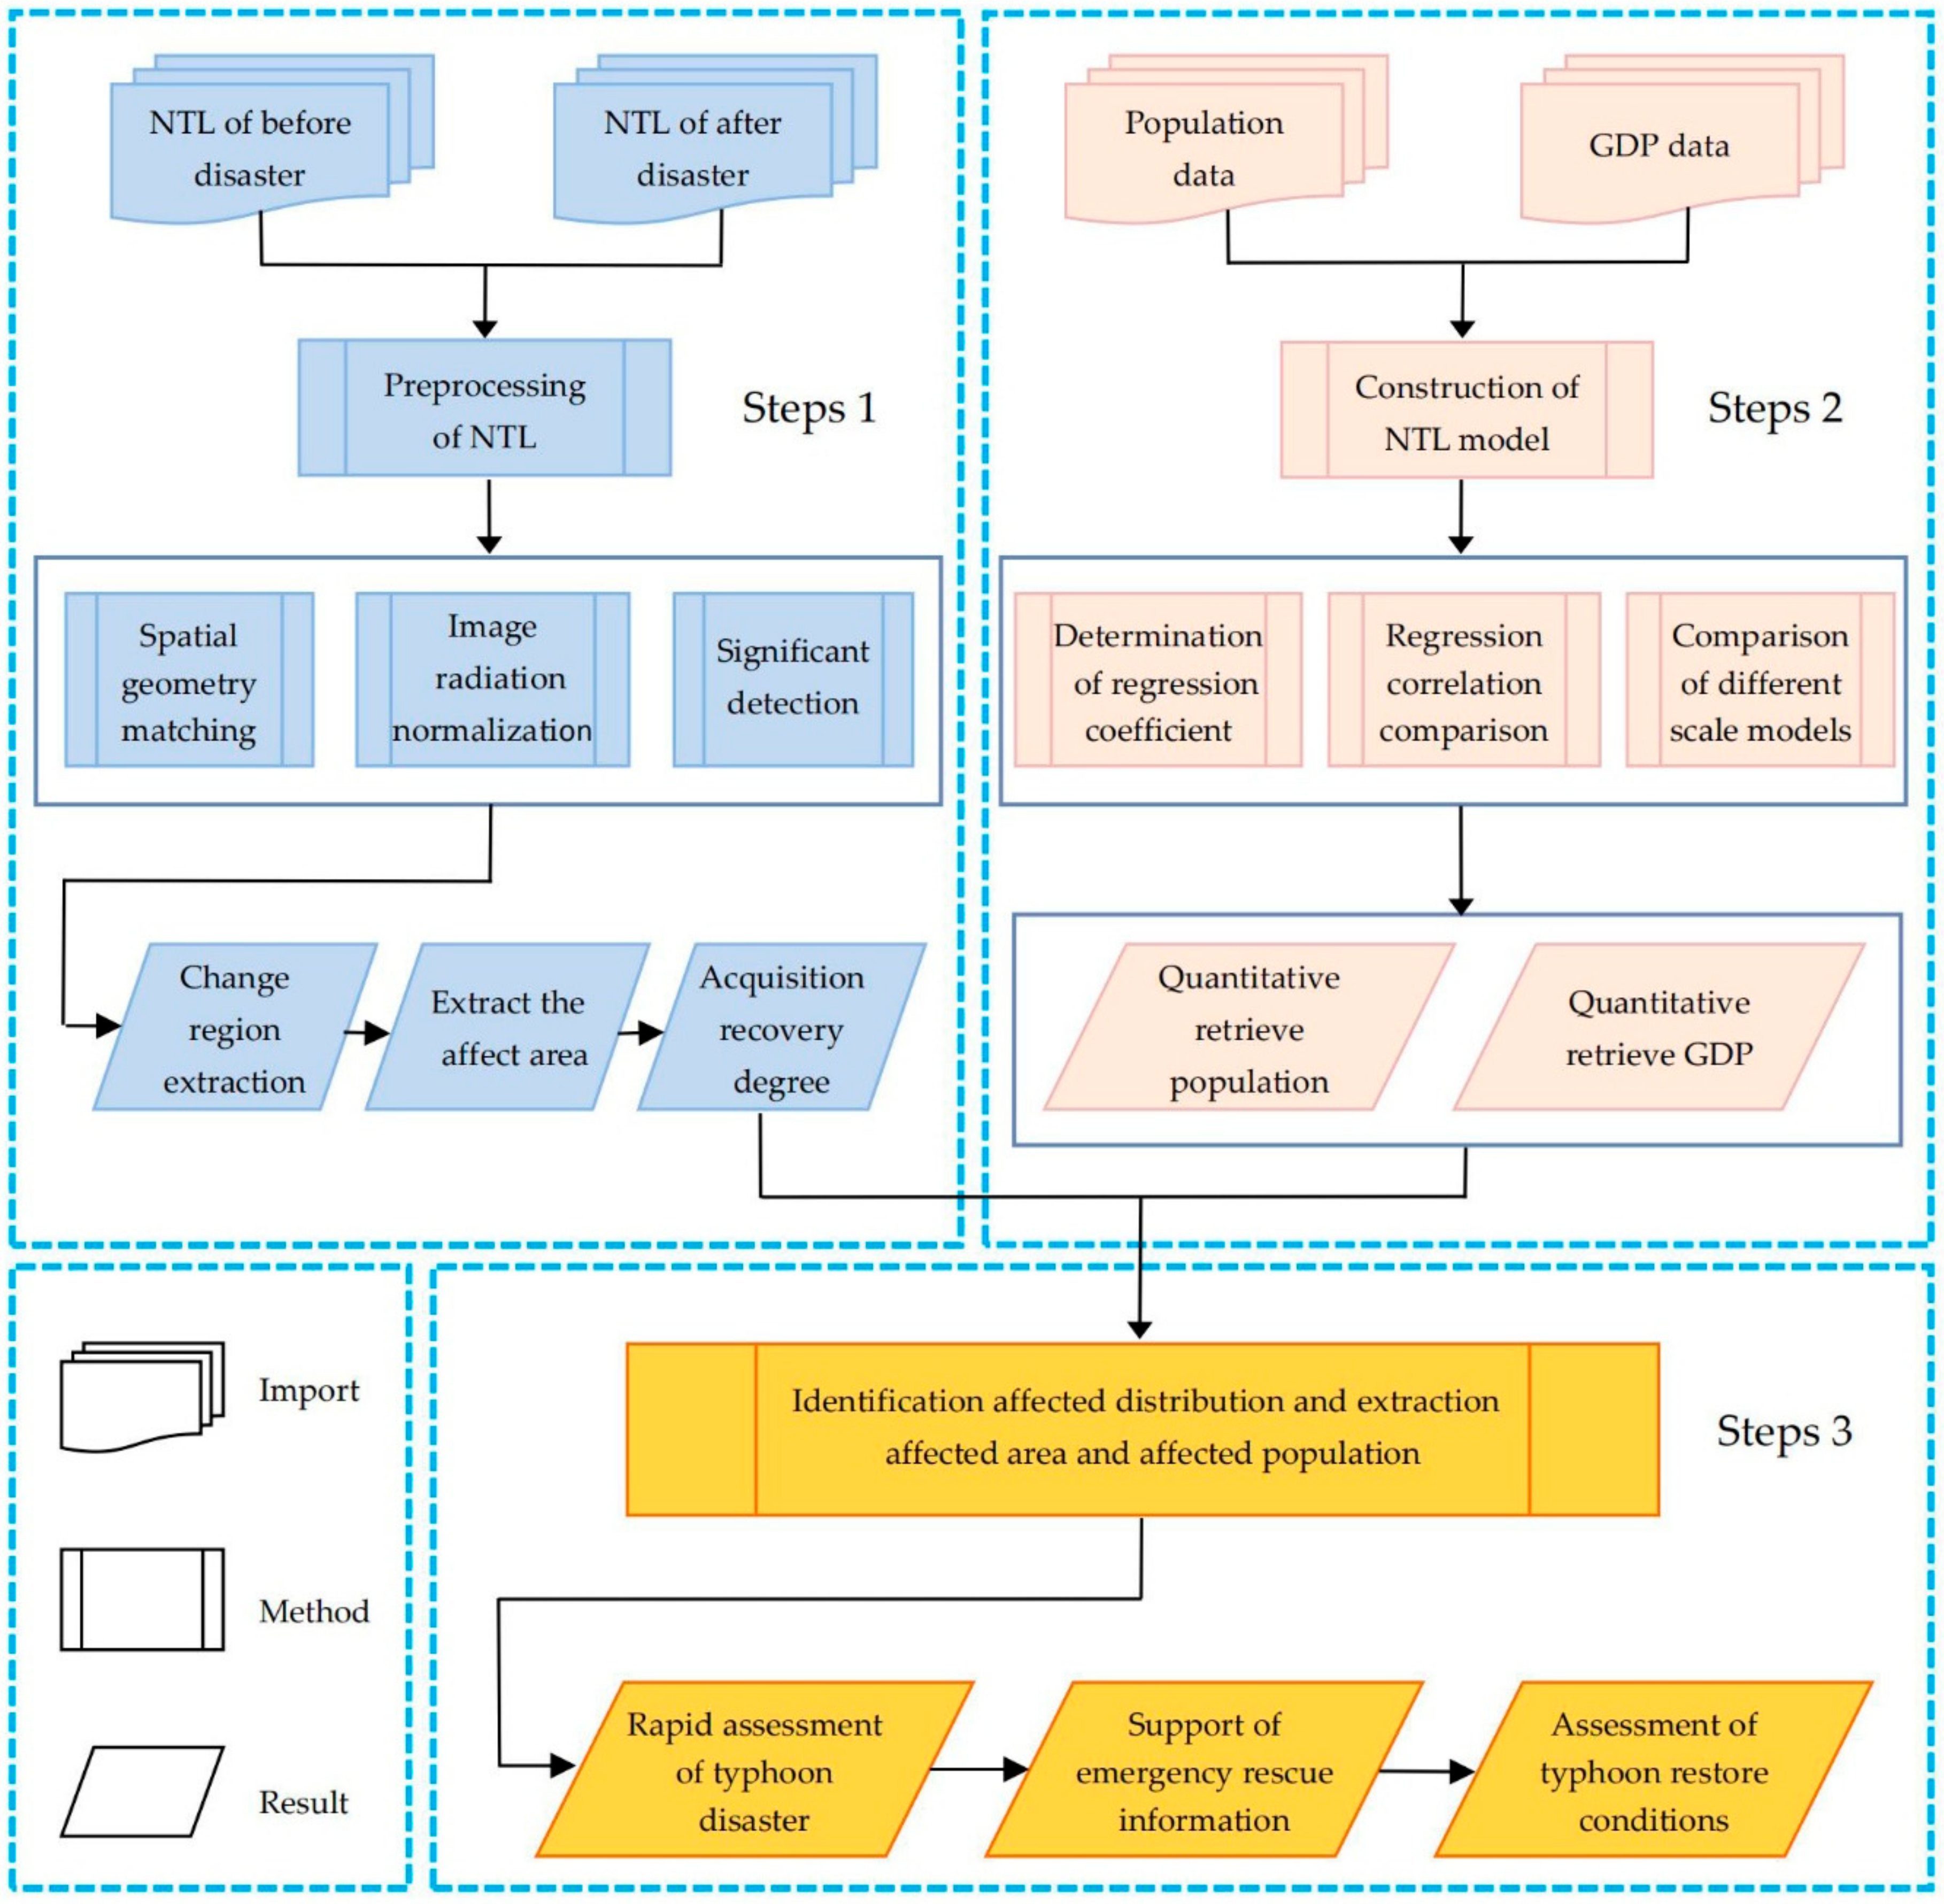
2.3. Research Route
3. Methods
3.1. Data Pretreatment
3.1.1. Extraction of Change Region
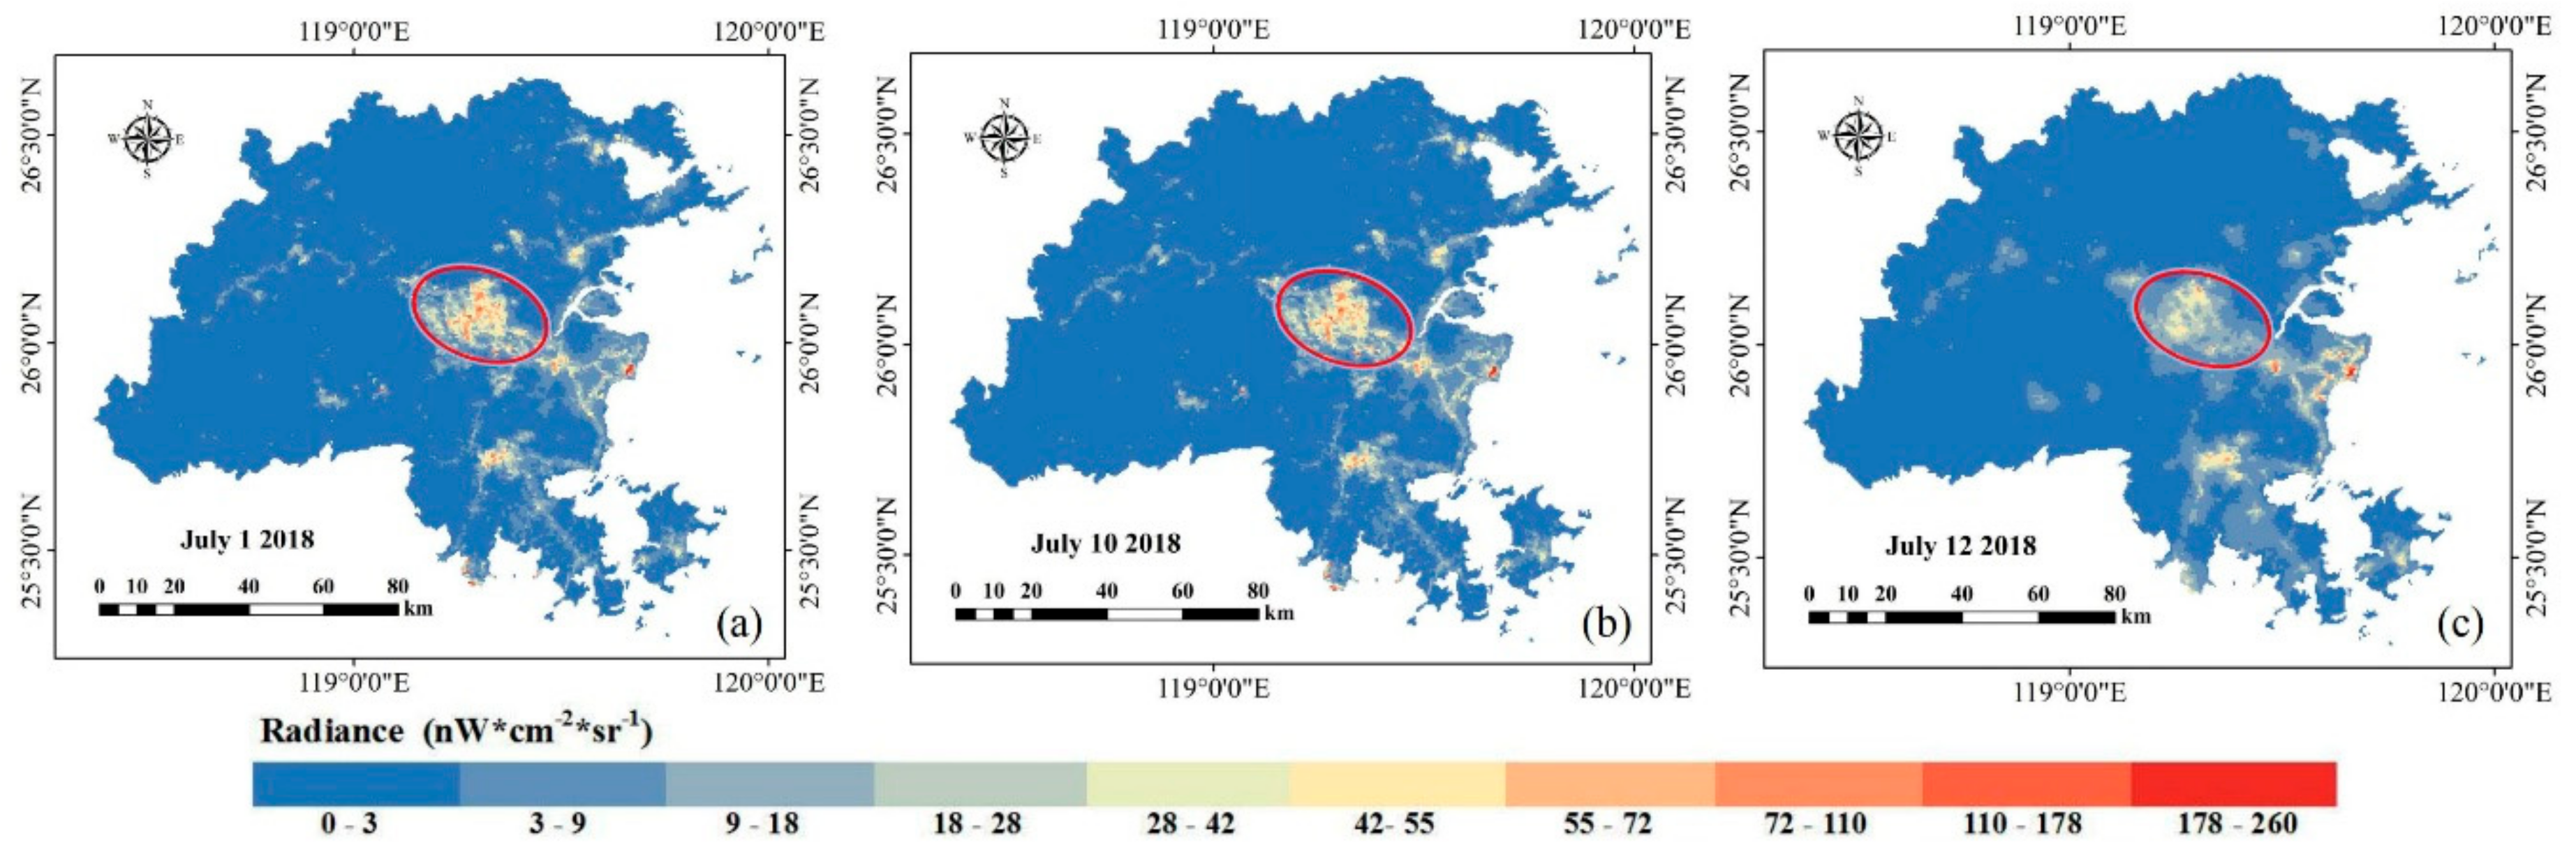
3.1.2. Significance Test
3.2. Model Development
3.2.1. NTL Image Derivatives and Socio-economic Indices
3.2.2. Linear Regression Models
3.2.3. Determination of the Affected Area and Affected Population
3.2.4. Precision Evaluation of Retrieve Results
3.2.5. Assessment Method for Affected Intensity
4. Results
4.1. Relationship between NTL Data and Population or GDP
4.1.1. Linear Regression
4.1.2. Accuracy of NTL Data for Retrieving Population and GDP
4.2. Estimates of Affected Area and Affected Population Retrieved from NTL Data
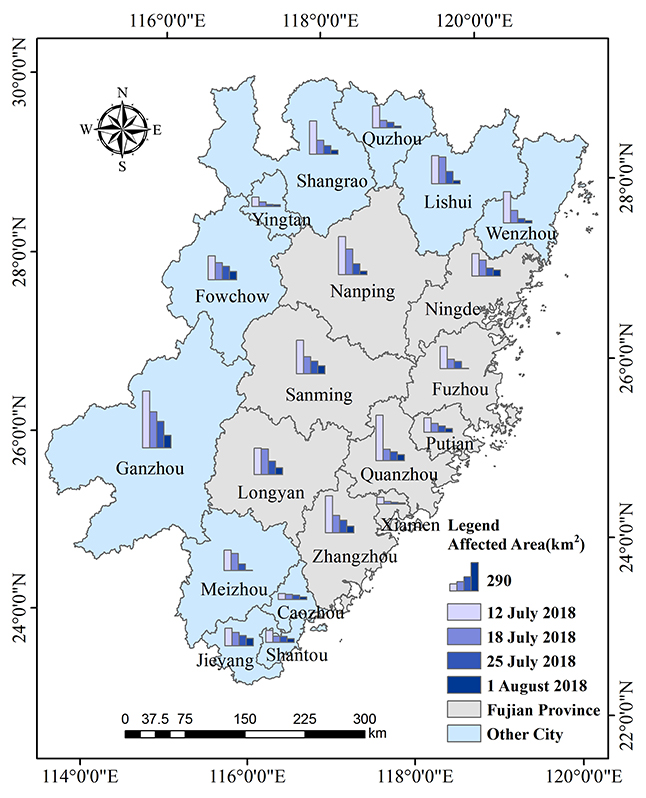
4.2.1. Distribution of Affected Areas in Study Area
4.2.2. Estimate Affected Area and Affected Population
4.2.3. Assessment based on Affected Intensity
4.3. Disaster Recovery Assessment based on NTL Data Retrieval
4.3.1. Assessment of Daily Affected Area Based on NTL Data Retrieval
4.3.2. Assessment Based on NTL Image Intensity
4.3.3. Restoration Status of Representative Cities
5. Discussion
5.1. Comparison of Different Models
5.2. Comparison of Accuracy of Retrieved Characteristics of Natural Disaster
5.3. Limitations Due to Potential Errors
6. Conclusions
Author Contributions
Funding
Acknowledgments
Conflicts of Interest
Appendix A

| Region and Fitting Parameters | Coefficient between Population Density with Nighttime Light Density | Coefficient between GDP with Total Nighttime Light | |||||
|---|---|---|---|---|---|---|---|
| Region | fitting function | Slope C1 | Constant C0 | R2 | Slope C1 | Constant C0 | R2 |
| Entirety | prefecture- level | 65.850 | 188.920 | 0.826 | 0.055 | 104.274 | 0.959 |
| Eastern region | Partition prefecture-level | 59.476 | 349.287 | 0.720 | 0.061 | −413.595 | 0.989 |
| Western region | Partition prefecture-level | 82.829 | 121.317 | 0.141 | 0.044 | 479.658 | 0.577 |
| Entirety | County- level | 112.862 | −145.171 | 0.788 | 0.046 | 53.293 | 0.706 |
| Research Area Sample | Parameter of Statistical Radiation Value Normalized | Gaussian Fitting Parameters and Segmentation Threshold | |||||
|---|---|---|---|---|---|---|---|
| Mean Pre-Disaster Sample | Variance Pre-Disaster Sample | Mean Post-Disaster Sample | Variance Post-Disaster Sample | Fitting Parameters | Fitting Parameters | Segmentation Threshold | |
| Caozhou | 0.399 | 0.085 | 0.297 | 0.043 | −1.118 | 3.674 | 6.0832 |
| Fowchow | 0.246 | 0.045 | 0.171 | 0.085 | 0.152 | 1.223 | 2.5499 |
| Fuzhou | 0.498 | 0.109 | 0.262 | 0.073 | 0.495 | 3.244 | 6.8531 |
| Ganzhou | 0.265 | 0.024 | 0.080 | 0.074 | 0.228 | 1.995 | 4.1384 |
| Jieyang | 0.280 | 0.016 | 0.390 | 0.015 | 1.761 | 5.753 | 13.0379 |
| Lishui | 0.217 | 0.047 | 0.212 | 0.088 | 0.308 | 1.839 | 3.9123 |
| Longyan | 0.263 | 0.040 | 0.167 | 0.109 | 0.351 | 1.754 | 5.5442 |
| Meizhou | 1.312 | 0.701 | 0.375 | 0.142 | −1.298 | 4.019 | 6.5796 |
| Nanping | 0.203 | 0.057 | 0.220 | 0.072 | 0.175 | 0.917 | 1.9723 |
| Ningde | 0.323 | 0.071 | 0.554 | 1.274 | 0.441 | 2.509 | 5.3585 |
| Putian | 0.569 | 0.416 | 0.352 | 0.084 | 1.420 | 4.957 | 11.1365 |
| Quanzhou | 0.270 | 0.045 | 0.275 | 0.065 | 2.007 | 5.809 | 13.3914 |
| Quzhou | 0.228 | 0.035 | 0.115 | 0.062 | 0.268 | 1.231 | 2.6801 |
| Sanming | 0.245 | 0.041 | 0.53 | 1.443 | 0.151 | 1.008 | 2.1266 |
| Shangrao | 0.226 | 0.039 | 0.181 | 0.103 | 0.219 | 1.039 | 2.2566 |
| Shantou | 0.465 | 0.031 | 0.289 | 0.099 | 6.877 | 10.191 | 26.8508 |
| Wenzhou | 0.407 | 0.100 | 0.278 | 0.068 | 0.338 | 3.579 | 7.3529 |
| Xiamen | 0.811 | 0.258 | 1.179 | 0.102 | 0.929 | 11.160 | 22.8030 |
| Yintang | 0.230 | 0.044 | 0.173 | 0.069 | 0.315 | 1.568 | 3.3886 |
| Zhangzhou | 0.293 | 0.044 | 0.271 | 0.052 | 0.898 | 3.966 | 8.6711 |
References
- Yu, D. Intuitionistic fuzzy theory based typhoon disaster evaluation in Zhejiang Province, China: A comparative perspective. Nat. Hazards 2015, 75, 2559–2576. [Google Scholar] [CrossRef]
- Fan, Y.; Wu, W.; Wang, W.; Liu, M.; Wen, Q. Research progress of disaster remote sensing in China. Int. J. Remote Sens. 2016, 20, 1170–1184. [Google Scholar]
- Liou, Y.-A.; Liu, J.-C.; Liu, C.P.; Liu, C.-C. Season-Dependent Distributions and Profiles of Seven Super-Typhoons (2014) in the Northwestern Pacific Ocean from Satellite Cloud Images. IEEE Trans. Geosci. Remote Sens. 2018, 56, 2949–2957. [Google Scholar] [CrossRef]
- Wang, J.R.; Meneghini, R.; Kumagai, H.; Wilheit, T.T.; Boncyk, W.C.; Racette, P.; Tesmer, J.R.; Maves, B. Airborne active and passive microwave observations of super typhoon Flo. IEEE Trans. Geosci. Remote Sens. 1994, 32, 231–242. [Google Scholar] [CrossRef]
- Lee, Y.-S.; Liou, Y.-A.; Liu, J.-C.; Chiang, C.-T.; Yeh, K.-D. Formation of winter supertyphoons Haiyan (2013) and Hagupit (2014) through interactions with cold fronts as observed by multifunctional transport satellite. IEEE Trans. Geosci. Remote Sens. 2017, 55, 3800–3809. [Google Scholar] [CrossRef]
- Aubrecht, C.; Fuchs, S.; Neuhold, C. Spatio-temporal aspects and dimensions in integrated disaster risk management. Nat. Hazards 2013, 68, 1205–1216. [Google Scholar] [CrossRef]
- Okamura, M.; Bhandary, N.P.; Mori, S.; Marasini, N.; Hazarika, H. Report on a reconnaissance survey of damage in Kathmandu caused by the 2015 Gorkha Nepal earthquake. Soils Found. 2015, 55, 1015–1029. [Google Scholar] [CrossRef] [Green Version]
- Li, S.; Sun, D.; Goldberg, M.D.; Sjoberg, B.; Santek, D.; Hoffman, J.P.; DeWeese, M.; Restrepo, P.; Lindsey, S.; Holloway, E. Automatic near real-time flood detection using Suomi-NPP/VIIRS data. Remote Sens. Environ. 2018, 204, 672–689. [Google Scholar] [CrossRef]
- Elvidge, C.D.; Baugh, K.E.; Kihn, E.A.; Kroehl, H.W.; Davis, E.R. Mapping city lights with nighttime data from the DMSP Operational Linescan System. Photogramm. Eng. Remote Sens. 1997, 63, 727–734. [Google Scholar]
- Miller, S.; Straka, W.; Mills, S.; Elvidge, C.; Lee, T.; Solbrig, J.; Walther, A.; Heidinger, A.; Weiss, S. Illuminating the capabilities of the suomi national polar-orbiting partnership (NPP) visible infrared imaging radiometer suite (VIIRS) day/night band. Remote Sens. 2013, 5, 6717–6766. [Google Scholar] [CrossRef]
- Bennett, M.M.; Smith, L.C. Advances in using multitemporal night-time lights satellite imagery to detect, estimate, and monitor socioeconomic dynamics. Remote Sens. Environ. 2017, 192, 176–197. [Google Scholar] [CrossRef]
- Elvidge, C.D.; Cinzano, P.; Pettit, D.; Arvesen, J.; Sutton, P.; Small, C.; Nemani, R.; Longcore, T.; Rich, C.; Safran, J. The Nightsat mission concept. Int. J. Remote Sens. 2007, 28, 2645–2670. [Google Scholar] [CrossRef]
- Elvidge, C.D.; Baugh, K.; Zhizhin, M.; Hsu, F.C.; Ghosh, T. VIIRS night-time lights. Int. J. Remote Sens. 2017, 38, 5860–5879. [Google Scholar] [CrossRef]
- Shi, K.; Yu, B.; Huang, Y.; Hu, Y.; Yin, B.; Chen, Z.; Chen, L.; Wu, J. Evaluating the ability of NPP-VIIRS nighttime light data to estimate the gross domestic product and the electric power consumption of China at multiple scales: A comparison with DMSP-OLS data. Remote Sens. 2014, 6, 1705–1724. [Google Scholar] [CrossRef]
- Zhao, N.; Liu, Y.; Cao, G.; Samson, E.L.; Zhang, J. Forecasting China’s GDP at the pixel level using nighttime lights time series and population images. GISci. Remote Sens. 2017, 54, 407–425. [Google Scholar] [CrossRef]
- Li, X.; Xu, H.; Chen, X.; Li, C. Potential of NPP-VIIRS nighttime light imagery for modeling the regional economy of China. Remote Sens. 2013, 5, 3057–3081. [Google Scholar] [CrossRef]
- Zeng, C.; Zhou, Y.; Wang, S.; Yan, F.; Zhao, Q. Population spatialization in China based on night-time imagery and land use data. Int. J. Remote Sens. 2011, 32, 9599–9620. [Google Scholar] [CrossRef]
- Yang, X.; Yue, W.; Gao, D. Spatial improvement of human population distribution based on multi-sensor remote-sensing data: An input for exposure assessment. Int. J. Remote Sens. 2013, 34, 5569–5583. [Google Scholar] [CrossRef]
- Min, B.; Gaba, K.M.; Sarr, O.F.; Agalassou, A. Detection of rural electrification in Africa using DMSP-OLS night lights imagery. Int. J. Remote Sens. 2013, 34, 8118–8141. [Google Scholar] [CrossRef]
- Shi, K.; Yu, B.; Huang, C.; Wu, J.; Sun, X. Exploring spatiotemporal patterns of electric power consumption in countries along the Belt and Road. Energy 2018, 150, 847–859. [Google Scholar] [CrossRef]
- Deng, C.; Lin, W.; Chen, S. Use of smart meter readings and nighttime light images to track pixel-level electricity consumption. Remote Sens. Lett. 2019, 10, 205–213. [Google Scholar] [CrossRef]
- Ghosh, T.; Elvidge, C.D.; Sutton, P.C.; Baugh, K.E.; Ziskin, D.; Tuttle, B.T. Creating a global grid of distributed fossil fuel CO2 emissions from nighttime satellite imagery. Energy 2010, 3, 1895–1913. [Google Scholar] [CrossRef]
- Shi, K.; Chen, Y.; Li, L.; Huang, C. Spatiotemporal variations of urban CO2 emissions in China: A multiscale perspective. Appl. Energy 2018, 211, 218–229. [Google Scholar] [CrossRef]
- Zhao, J.; Ji, G.; Yue, Y.; Lai, Z.; Chen, Y.; Yang, D.; Yang, X.; Wang, Z. Spatio-temporal dynamics of urban residential CO2 emissions and their driving forces in China using the integrated two nighttime light datasets. Appl. Energy 2019, 235, 612–624. [Google Scholar] [CrossRef]
- Li, X.; Chen, X.; Zhao, Y.; Xu, J.; Chen, F.; Li, H. Automatic intercalibration of night-time light imagery using robust regression. Remote Sens. Lett. 2013, 4, 45–54. [Google Scholar] [CrossRef]
- Zheng, Z.; Chen, Y.; Wu, Z.; Ye, X.; Guo, G.; Qian, Q. The desaturation method of DMSP/OLS nighttime light data based on vector data: Taking the rapidly urbanized China as an example. Int. J. Geogr. Inf. Sci. 2019, 33, 431–453. [Google Scholar] [CrossRef]
- Yu, B.; Tang, M.; Wu, Q.; Yang, C.; Deng, S.; Shi, K.; Peng, C.; Wu, J.; Chen, Z. Urban built-up area extraction from log-transformed npp-viirs nighttime light composite data. IEEE Geosci. Remote Sens. Lett. 2018, 15, 1279–1283. [Google Scholar] [CrossRef]
- Shi, K.; Huang, C.; Yu, B.; Yin, B.; Huang, Y.; Wu, J. Evaluation of NPP-VIIRS night-time light composite data for extracting built-up urban areas. Remote Sens. Lett. 2014, 5, 358–366. [Google Scholar] [CrossRef]
- Wei, Y.; Liu, H.; Song, W.; Yu, B.; Xiu, C. Normalization of time series DMSP-OLS nighttime light images for urban growth analysis with pseudo invariant features. Landsc. Urban Plan. 2014, 128, 1–13. [Google Scholar] [CrossRef]
- Zou, Y.; Peng, H.; Liu, G.; Yang, K.; Xie, Y.; Weng, Q. Monitoring urban clusters expansion in the middle reaches of the Yangtze River, China, using time-series nighttime light images. Remote Sens. 2017, 9, 1007. [Google Scholar] [CrossRef]
- Gao, B.; Huang, Q.; He, C.; Dou, Y. Similarities and differences of city-size distributions in three main urban agglomerations of China from 1992 to 2015: A comparative study based on nighttime light data. J. Geogr. Sci. 2017, 27, 533–545. [Google Scholar] [CrossRef]
- Kohiyama, M.; Hayashi, H.; Maki, N.; Higashida, M.; Kroehl, H.; Elvidge, C.; Hobson, V. Early damaged area estimation system using DMSP-OLS night-time imagery. Int. J. Remote Sens. 2004, 25, 2015–2036. [Google Scholar] [CrossRef]
- Cole, T.; Wanik, D.; Molthan, A.; Román, M.; Griffin, R. Synergistic use of nighttime satellite data, electric utility infrastructure, and ambient population to improve power outage detections in urban areas. Remote Sens. 2017, 9, 286. [Google Scholar] [CrossRef]
- Huang, Q.; Yang, X.; Gao, B.; Yang, Y.; Zhao, Y. Application of DMSP/OLS nighttime light images: A meta-analysis and a systematic literature review. Remote Sens. 2014, 6, 6844–6866. [Google Scholar] [CrossRef]
- Elvidge, C.; Baugh, K.; Hobson, V.; Kihn, E.; Kroehl, H. Detection of fires and power outages using DMSP-OLS data. In Remote Sensing Change Detection: Environmental Monitoring Methods and Applications; Ross, S., Lunetta, C.D.E., Eds.; Taylor & Francis: London, UK, 1998; pp. 123–135. [Google Scholar]
- Molthan, A.; Jedlovec, G. Satellite observations monitor outages from Superstorm Sandy. Eos Trans. Am. Geophys. Union 2013, 94, 53–54. [Google Scholar] [CrossRef]
- Cao, C.; Shao, X.; Uprety, S. Detecting light outages after severe storms using the S-NPP/VIIRS day/night band radiances. IEEE Geosci. Remote Sens. Lett. 2013, 10, 1582–1586. [Google Scholar] [CrossRef]
- Wang, Z.; Román, M.; Sun, Q.; Molthan, A.; Schultz, L.; Kalb, V. Monitoring disaster-related power outages using NASA black marble nighttime light product. ISPRS Int. Arch. Photogramm. Remote Sens. Spat. Inf. Sci. 2018, XLII-3, 1853–1856. [Google Scholar] [CrossRef]
- Zhao, X.; Yu, B.; Liu, Y.; Yao, S.; Lian, T.; Chen, L.; Yang, C.; Chen, Z.; Wu, J. NPP-VIIRS DNB Daily Data in Natural Disaster Assessment: Evidence from Selected Case Studies. Remote Sens. 2018, 10, 1526. [Google Scholar] [CrossRef]
- Briggs, D.J.; Gulliver, J.; Fecht, D.; Vienneau, D.M. Dasymetric modelling of small-area population distribution using land cover and light emissions data. Remote Sens. Environ. 2007, 108, 451–466. [Google Scholar] [CrossRef]
- Sutton, P.; Roberts, D.; Elvidge, C.; Meij, H. A comparison of nighttime satellite imagery and population density for the continental United States. Photogramm. Eng. Remote Sens. 1997, 63, 1303–1313. [Google Scholar]
- Amaral, S.; Câmara, G.; Monteiro, A.M.V.; Quintanilha, J.A.; Elvidge, C.D. Estimating population and energy consumption in Brazilian Amazonia using DMSP night-time satellite data. Comput. Environ. Urban Syst. 2005, 29, 179–195. [Google Scholar] [CrossRef]
- Zhuo, L.; Ichinose, T.; Zheng, J.; Chen, J.; Shi, P.; Li, X. Modelling the population density of China at the pixel level based on DMSP/OLS non-radiance-calibrated night-time light images. Int. J. Remote Sens. 2009, 30, 1003–1018. [Google Scholar] [CrossRef]
- Chen, X.; Nordhaus, W. A test of the new VIIRS lights data set: Population and economic output in Africa. Remote Sens. 2015, 7, 4937–4947. [Google Scholar] [CrossRef]
- Chou, M.Y.; Lin, C.C.; Yue, J.; Tsai, H.F.; Sun, Y.Y.; Liu, J.Y.; Chen, C.H. Concentric traveling ionosphere disturbances triggered by Super Typhoon Meranti (2016). Geophys. Res. Lett. 2017, 44, 1219–1226. [Google Scholar] [CrossRef]
- China Central Meteorological Observatory: Typhoon Network. Available online: http://typhoon.nmc.cn/web.html (accessed on 1 August 2018).
- China National Committee for Disaster Reduction. Available online: http://www.jianzai.gov.cn/zxzq/ (accessed on 1 August 2018).
- NOAA Comprehensive Large Array-Data Stewardship System (CLASS). Available online: https://ngdc.noaa.gov/eog/viirs/download_dbs.html (accessed on 1 August 2018).
- GLOBELAND30. Available online: http://globallandcover.com/GLC30Download/index.aspx (accessed on 1 August 2018).
- Chavez, P.S. Image-based atmospheric corrections-revisited and improved. Photogramm. Eng. Remote Sens. 1996, 62, 1025–1035. [Google Scholar]
- Eivazi, A.; Kolesnikov, A.; Junttila, V.; Kauranne, T. Variance-preserving mosaicing of multiple satellite images for forest parameter estimation: Radiometric normalization. ISPRS-J. Photogramm. Remote Sens. 2015, 105, 120–127. [Google Scholar] [CrossRef]
- Gorroño, J.; Banks, A.C.; Fox, N.P.; Underwood, C. Radiometric inter-sensor cross-calibration uncertainty using a traceable high accuracy reference hyperspectral imager. ISPRS-J. Photogramm. Remote Sens. 2017, 130, 393–417. [Google Scholar] [CrossRef] [Green Version]
- Biday, S.G.; Bhosle, U. Radiometric Correction of Multitemporal Satellite Imagery. J. Comput. Sci. 2010, 6, 1027–1036. [Google Scholar] [CrossRef] [Green Version]
- Li, W.; Sun, K.; Zhang, H. Algorithm for relative radiometric consistency process of remote sensing images based on object-oriented smoothing and contourlet transforms. J. Appl. Remote Sens. 2014, 8, 083607. [Google Scholar] [CrossRef]
- Chen, X.; Vierling, L.; Deering, D. A simple and effective radiometric correction method to improve landscape change detection across sensors and across time. Remote Sens. Environ. 2005, 98, 63–79. [Google Scholar] [CrossRef]
- Fan, W.; Sun, S.; Wang, J. Comparison of relative radiometric correction methods for multi-temporal remote sensing imagery. Remote Sens. Inf. 2016, 31, 142–149. (In Chinese) [Google Scholar]
- Gadallah, F.; Csillag, F.; Smith, E. Destriping multisensor imagery with moment matching. Int. J. Remote Sens. 2000, 21, 2505–2511. [Google Scholar] [CrossRef]
- Radke, R.J.; Andra, S.; Al-Kofahi, O.; Roysam, B. Image change detection algorithms: A systematic survey. IEEE Trans. Image Process. 2005, 14, 294–307. [Google Scholar] [CrossRef]
- Zhang, X.; Zhu, J.; Xu, J. Earthquake disaster information extraction based on night-time lighting images. J. Seismol. Res. 2018, 41, 311–318. (In Chinese) [Google Scholar]
- Dai, X.; Khorram, S. The effects of image misregistration on the accuracy of remotely sensed change detection. IEEE Trans. Geosci. Remote Sens. 1998, 36, 1566–1577. [Google Scholar] [Green Version]
- Hall, O.; Hay, G.J. A multiscale object-specific approach to digital change detection. Int. J. Appl. Earth Obs. Geoinf. 2003, 4, 311–327. [Google Scholar] [CrossRef]
- Deng, S.; Wu, H.; Jiang, T. A study on relative radiometric normalization for remote sensing dynamic monitoring. Remote Sens. Inf. 2008, 4, 71–75. (In Chinese) [Google Scholar]
- Desclée, B.; Bogaert, P.; Defourny, P. Forest change detection by statistical object-based method. Remote Sens. Environ. 2006, 102, 1–11. [Google Scholar] [CrossRef]
- Zhang, Q.; Seto, K.C. Mapping urbanization dynamics at regional and global scales using multi-temporal DMSP/OLS nighttime light data. Remote Sens. Environ. 2011, 115, 2320–2329. [Google Scholar] [CrossRef]
- Chen, J.; Zhuo, L.; Shi, P.; Toshiaki, I. The study on urbanization process in China based on DMSP/OLS data: Development of a light index for urbanization level estimation. Int. J. Remote Sens. 2003, 7, 168–175. [Google Scholar]
- Letu, H.; Hara, M.; Yagi, H.; Naoki, K.; Tana, G.; Nishio, F.; Shuhei, O. Estimating energy consumption from night-time DMPS/OLS imagery after correcting for saturation effects. Int. J. Remote Sens. 2010, 31, 4443–4458. [Google Scholar] [CrossRef]
- Lo, C. Modeling the population of China using DMSP operational linescan system nighttime data. Photogramm. Eng. Remote Sens. 2001, 67, 1037–1047. [Google Scholar]
- Townsend, A.C.; Bruce, D.A. The use of night-time lights satellite imagery as a measure of Australia‘s regional electricity consumption and population distribution. Int. J. Remote Sens. 2010, 31, 4459–4480. [Google Scholar] [CrossRef]
- “Maria” Has Affected Nearly 250,000 People and Caused Direct Economic Losses of 1.57 Billion Yuan in Ningde. Available online: http://www.ndwww.cn/xw/ndxw/2018/0713/90568.shtml (accessed on 13 July 2018).
- Typhoon “Maria” Strikes, Catastrophe Insurance Becomes More Important. Available online: https://baijiahao.baidu.com/s?id=1607379570974150028&wfr=spider&for=pc (accessed on 30 July 2018).
- Lv, J. Flood situation and disaster in China during July 2018. China Flood Drought Manag. 2018, 28, 74. (In Chinese) [Google Scholar]
- Liu, S. A try to import a new basic data for fast evaluation of earthquake hazards: Utilizing the DMSP/OLS satellite nighttime light data. J. Inst. Disaster Prev. 2012, 14, 70–75. (In Chinese) [Google Scholar]
- Fan, X.; Nie, G.; Deng, Y.; An, J.; Zhou, J.; Li, H. Rapid detection of earthquake damage areas using VIIRS nearly constant contrast night-time light data. Int. J. Remote Sens. 2019, 40, 2386–2409. [Google Scholar] [CrossRef]
- Santiago, J.S.S.; Manuela, W.S., Jr.; Tan, M.L.L.; Saňez, S.K.B.; Tong, A.Z.U. Agency-driven post-disaster recovery: A comparative study of three Typhoon Washi resettlement communities in the Philippines. Int. J. Disaster Risk Reduct. 2018, 27, 480–489. [Google Scholar] [CrossRef]
- Kerekes, J.P.; Strackerjan, K.; Salvaggio, C. Spectral reflectance and emissivity of man-made surfaces contaminated with environmental effects. Opt. Eng. 2008, 47, 106201. [Google Scholar]
- Johnson, R.S.; Zhang, J.; Hyer, E.J.; Miller, S.D.; Reid, J.S. Preliminary investigations toward nighttime aerosol optical depth retrievals from the VIIRS Day/Night Band. Atmos. Meas. Tech. 2013, 6, 1245–1255. [Google Scholar] [CrossRef] [Green Version]


| Data Name | Data Description | Time | Source |
|---|---|---|---|
| Nighttime Light Data | The NPP-VIIRS DNB data is new nighttime light data with a spatial resolution of about 742 m | 2016, 2018.5–2018.8 | NOAA/NGDC. Available online: https://ngdc.noaa.gov/eog/viirs/download_dbs.html (accessed on 1 August 2018). |
| Socioeconomic Data | Annual statistical data of two types: The population is mainly permanent residents. The GDP is the gross domestic product of the region | 2017 | Fujian Statistical Yearbook, Guangdong Statistical Yearbook, Zhejiang Statistical Yearbook, Jiangxi Statistical Yearbook, China Population and Employment Statistics Yearbook, China Statistical Yearbook (County-Level) |
| Typhoon Path | The landfall path of typhoon “Maria” | 2018 | China Central Meteorological Observatory: Typhoon Network. Available online: http://typhoon.nmc.cn/web.html (accessed on 1 August 2018) |
| Administrative Boundaries | Vector files of provinces and prefectures in China | 2017 | National Geomatics Center of China. Available online: http://ngcc.sbsm.gov.cn/article/en/ (accessed on 1 August 2018). |
| Land Cover Maps | Land cover maps with a 30 m resolution | 2010 | GLOBELAND30. Available online: http://globallandcover.com/GLC30Download/index.aspx (accessed on 1 August 2018). |
| Region | Population and Prediction from NPP-VIIRS Nighttime Light Data | GDP And Prediction From NPP-VIIRS Nighttime Light Data | ||||
|---|---|---|---|---|---|---|
| RD | PD | RE | RD | PD | RE | |
| Caozhou | 2646 | 2053 | −0.22 | 101.64 | 152.22 | 0.50 |
| Fowchow | 4011 | 4874 | 0.22 | 121.56 | 98.70 | −0.19 |
| Fuzhou | 7570 | 8808 | 0.16 | 619.76 | 541.85 | −0.13 |
| Ganzhou | 8589 | 10402 | 0.21 | 219.23 | 188.49 | −0.14 |
| Jieyang | 6094 | 3058 | −0.50 | 206.12 | 217.45 | 0.05 |
| Lishui | 2680 | 4534 | 0.69 | 120.02 | 151.99 | 0.27 |
| Longyan | 2630 | 3977 | 0.51 | 189.57 | 142.16 | −0.25 |
| Meizhou | 4361 | 4894 | 0.12 | 104.56 | 127.47 | 0.22 |
| Nanping | 2660 | 4239 | 0.59 | 145.77 | 126.65 | −0.13 |
| Ningde | 2890 | 3562 | 0.23 | 162.31 | 166.10 | 0.02 |
| Putian | 2890 | 3438 | 0.19 | 182.34 | 252.05 | 0.38 |
| Quanzhou | 8580 | 9979 | 0.16 | 664.66 | 653.63 | −0.02 |
| Quzhou | 2575 | 3138 | 0.22 | 125.16 | 125.04 | 0.00 |
| Sanming | 2550 | 4615 | 0.81 | 186.08 | 125.30 | −0.33 |
| Shangrao | 6752 | 6465 | −0.04 | 181.78 | 117.29 | −0.35 |
| Shantou | 5579 | 3469 | −0.38 | 198.68 | 275.41 | 0.39 |
| Wenzhou | 8182 | 8302 | 0.01 | 510.16 | 501.50 | −0.02 |
| Xiamen | 3920 | 4705 | 0.20 | 348.43 | 406.44 | 0.17 |
| Yingtan | 1159 | 1185 | 0.02 | 71.35 | 70.24 | −0.02 |
| Zhangzhou | 5050 | 6468 | 0.28 | 312.54 | 326.45 | 0.04 |
| Average | - | - | 0.175 | - | - | 0.024 |
| Region and Data | Fitting Function | NPP-VIIRS Data vs. Population | NPP-VIIRS Data vs. GDP | ||||
|---|---|---|---|---|---|---|---|
| High Accuracy | Moderate Accuracy | Inaccurate | High Accuracy | Moderate Accuracy | Inaccurate | ||
| Prefecture regions | Prefecture | 65 | 10 | 25 | 70 | 30 | 0 |
| Partition prefecture | 35 | 35 | 30 | 90 | 10 | 0 | |
| County | 15 | 25 | 60 | 70 | 25 | 5 | |
| County regions | Prefecture | 34.5 | 23.7 | 41.8 | 19.8 | 27.1 | 53.1 |
| Partition prefecture | 31.6 | 26 | 42.4 | 6.2 | 3.4 | 90.4 | |
| County | 14.2 | 12.4 | 73.4 | 55.4 | 27.7 | 16.9 | |
| Region | Total Prefecture City Area (km2) | Retrieval Affected Area (km2) | Percent of Retrieval Affected Area (%) | Total Population (thousand people) | Affected Population Density (people/ km2) | Retrieval Affected People (people) | Percent of Retrieval Affected Population (%) |
|---|---|---|---|---|---|---|---|
| Caozhou | 3113.20 | 59.75 | 1.92 | 2,646 | 765.21 | 45,721 | 1.73 |
| Fowchow | 18,801.22 | 241.75 | 1.29 | 4,011 | 333.48 | 80,618 | 2.01 |
| Fuzhou | 11,696.64 | 221.50 | 1.89 | 7,570 | 314.69 | 69,704 | 0.92 |
| Ganzhou | 39,363.55 | 474.00 | 1.20 | 8,589 | 96.05 | 45,526 | 0.53 |
| Jieyang | 5257.95 | 176.00 | 3.35 | 6,094 | 190.53 | 33,534 | 0.55 |
| Lishui | 17,275.32 | 269.25 | 1.56 | 2,680 | 306.81 | 82,609 | 3.08 |
| Longyan | 19,025.94 | 265.75 | 1.40 | 2,630 | 159.26 | 42,324 | 1.61 |
| Meizhou | 15,864.50 | 64.25 | 0.40 | 4,361 | 205.34 | 13,193 | 0.30 |
| Nanping | 26,288.15 | 383.25 | 1.46 | 2,660 | 192.95 | 73,947 | 2.78 |
| Ningde | 13,048.93 | 326.50 | 2.50 | 2,890 | 649.51 | 212,065 | 7.34 |
| Putian | 3910.03 | 145.25 | 3.71 | 2,890 | 318.45 | 46,255 | 1.60 |
| Quanzhou | 11,045.42 | 312.75 | 2.83 | 8,580 | 225.09 | 70,396 | 0.82 |
| Quzhou | 8843.66 | 222.25 | 2.51 | 2,575 | 231.82 | 51,521 | 2.00 |
| Sanming | 22,963.87 | 338.50 | 1.47 | 2,550 | 149.28 | 50,532 | 1.98 |
| Shangrao | 22,743.76 | 335.50 | 1.48 | 6,752 | 242.52 | 81,364 | 1.21 |
| Shantou | 2176.70 | 122.25 | 5.62 | 5,579 | 561.00 | 68,582 | 1.23 |
| Wenzhou | 11,597.82 | 457.50 | 3.94 | 8,182 | 513.25 | 234,810 | 2.87 |
| Xiamen | 1579.90 | 69.25 | 4.38 | 3,920 | 516.85 | 35,792 | 0.91 |
| Yingtan | 3557.87 | 93.25 | 2.62 | 1,159 | 493.09 | 45,981 | 3.97 |
| Zhangzhou | 12,620.59 | 372.75 | 2.95 | 5,050 | 104.31 | 38,881 | 0.77 |
© 2019 by the authors. Licensee MDPI, Basel, Switzerland. This article is an open access article distributed under the terms and conditions of the Creative Commons Attribution (CC BY) license (http://creativecommons.org/licenses/by/4.0/).
Share and Cite
Zheng, Y.; Shao, G.; Tang, L.; He, Y.; Wang, X.; Wang, Y.; Wang, H. Rapid Assessment of a Typhoon Disaster Based on NPP-VIIRS DNB Daily Data: The Case of an Urban Agglomeration along Western Taiwan Straits, China. Remote Sens. 2019, 11, 1709. https://0-doi-org.brum.beds.ac.uk/10.3390/rs11141709
Zheng Y, Shao G, Tang L, He Y, Wang X, Wang Y, Wang H. Rapid Assessment of a Typhoon Disaster Based on NPP-VIIRS DNB Daily Data: The Case of an Urban Agglomeration along Western Taiwan Straits, China. Remote Sensing. 2019; 11(14):1709. https://0-doi-org.brum.beds.ac.uk/10.3390/rs11141709
Chicago/Turabian StyleZheng, Yuanmao, Guofan Shao, Lina Tang, Yuanrong He, Xiaorong Wang, Yening Wang, and Haowei Wang. 2019. "Rapid Assessment of a Typhoon Disaster Based on NPP-VIIRS DNB Daily Data: The Case of an Urban Agglomeration along Western Taiwan Straits, China" Remote Sensing 11, no. 14: 1709. https://0-doi-org.brum.beds.ac.uk/10.3390/rs11141709