Mapping Hydrothermal Zoning Pattern of Porphyry Cu Deposit Using Absorption Feature Parameters Calculated from ASTER Data

Abstract
:
1. Introduction
2. Methodology
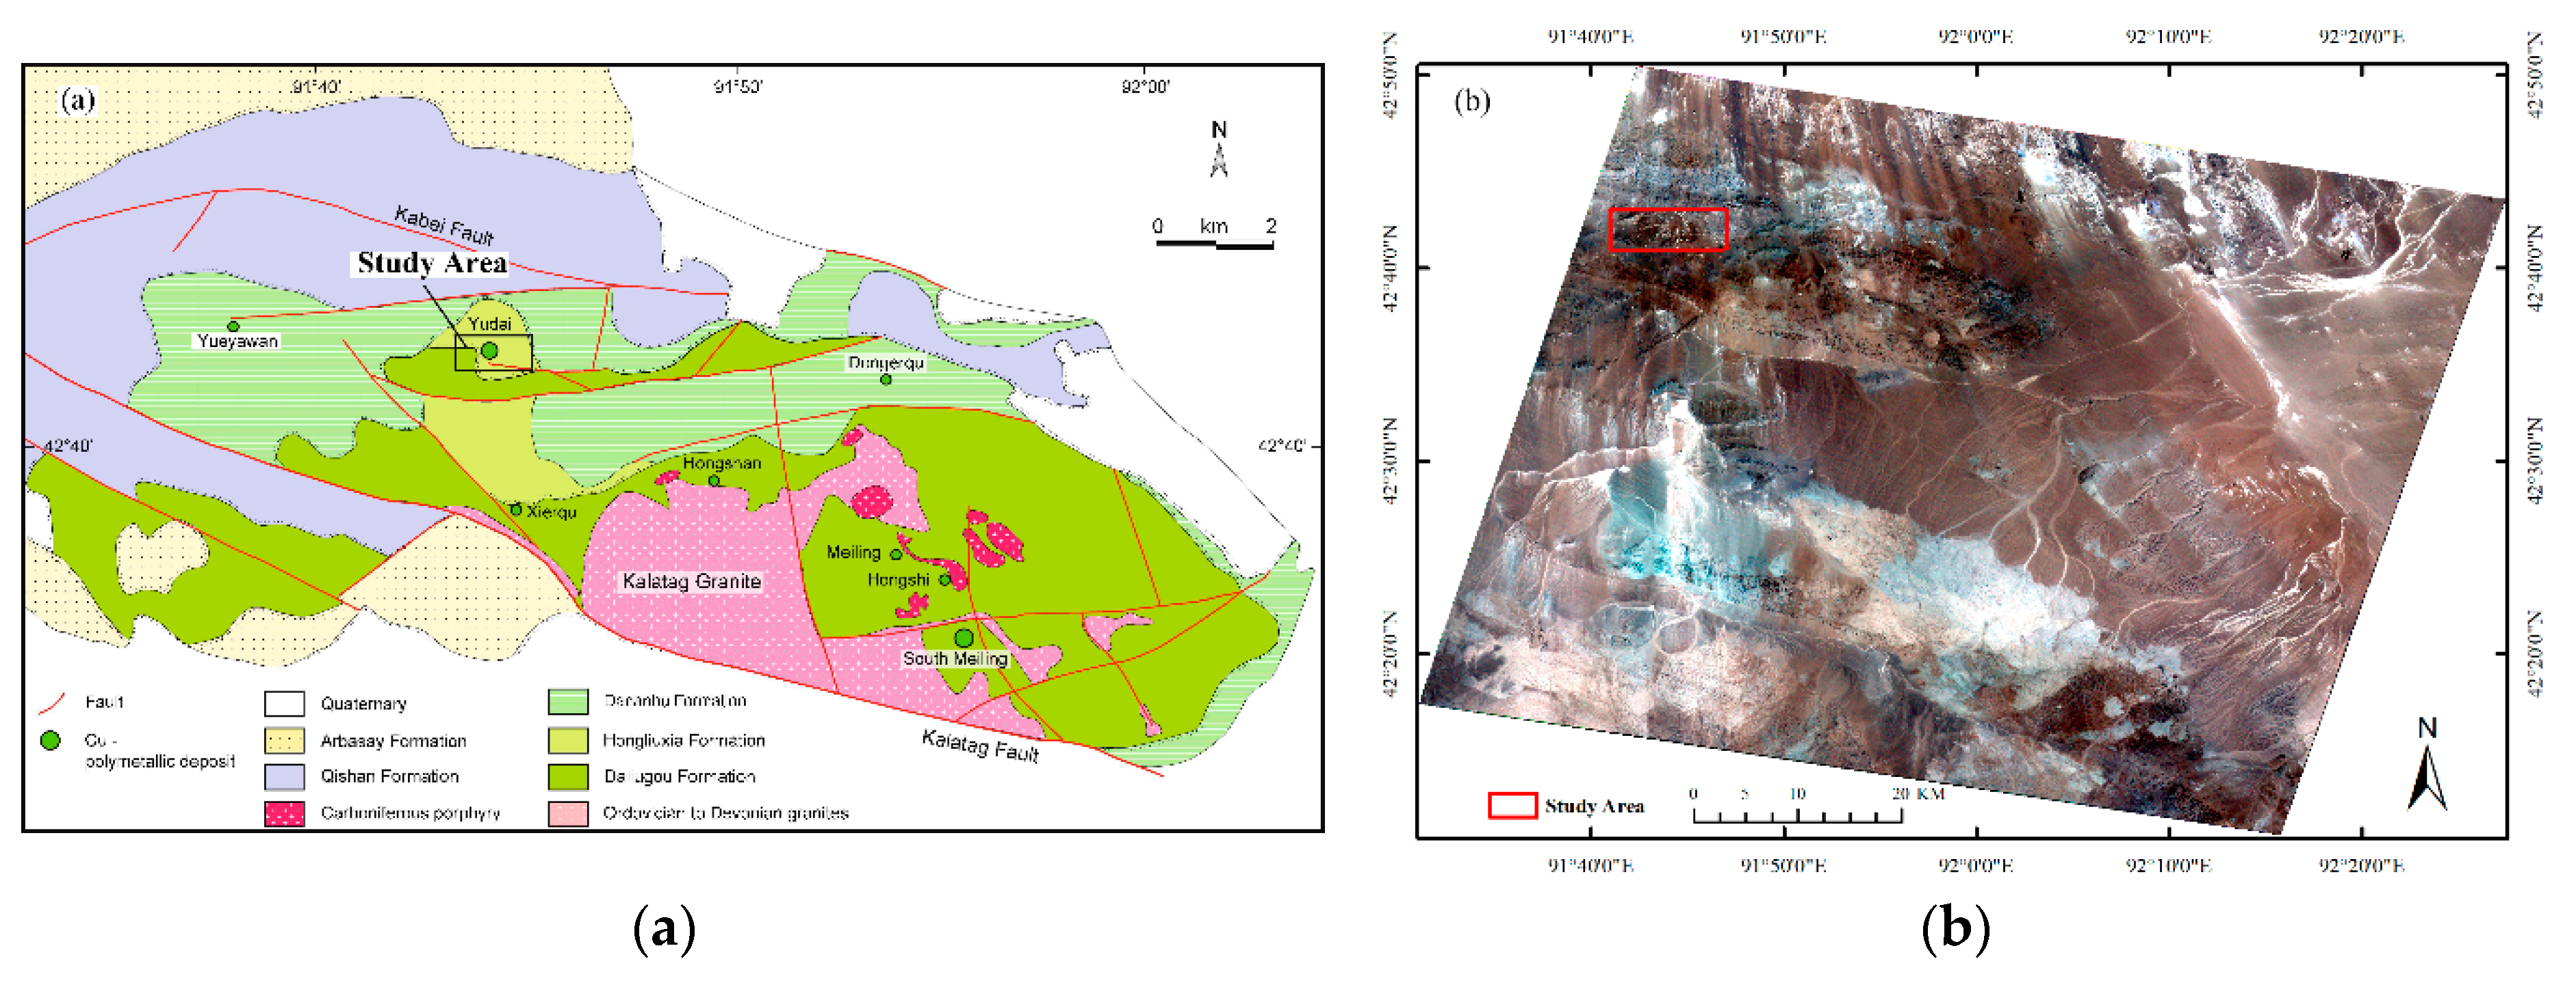
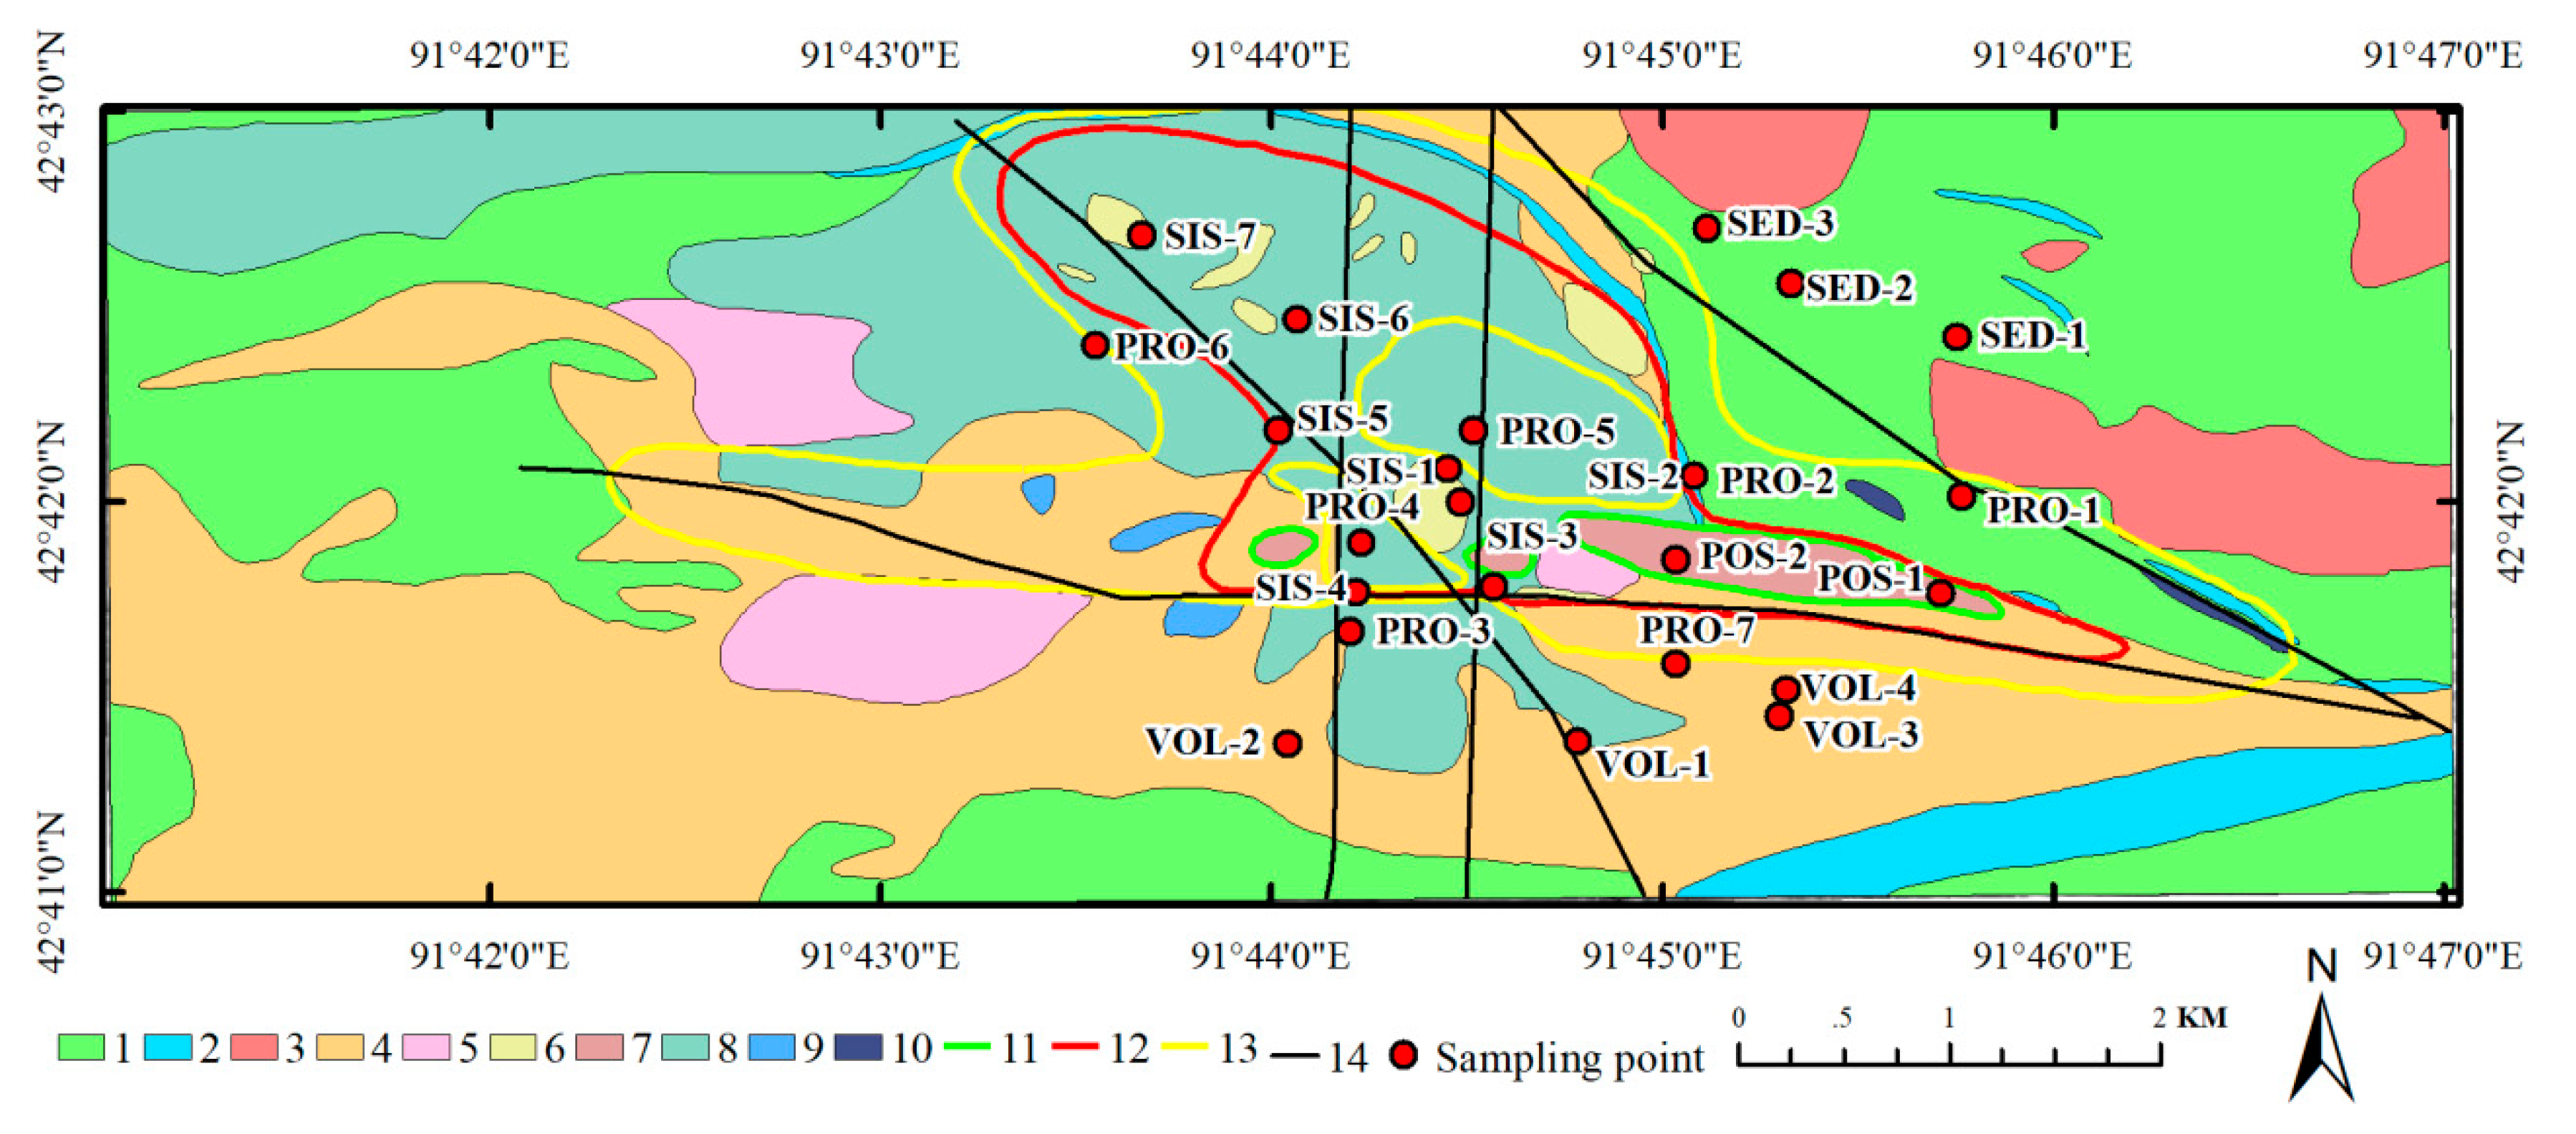
2.1. Research Site
2.2. ASTER Data
2.3. Informative ASTER Bands as Determined from Hyperspectral Information
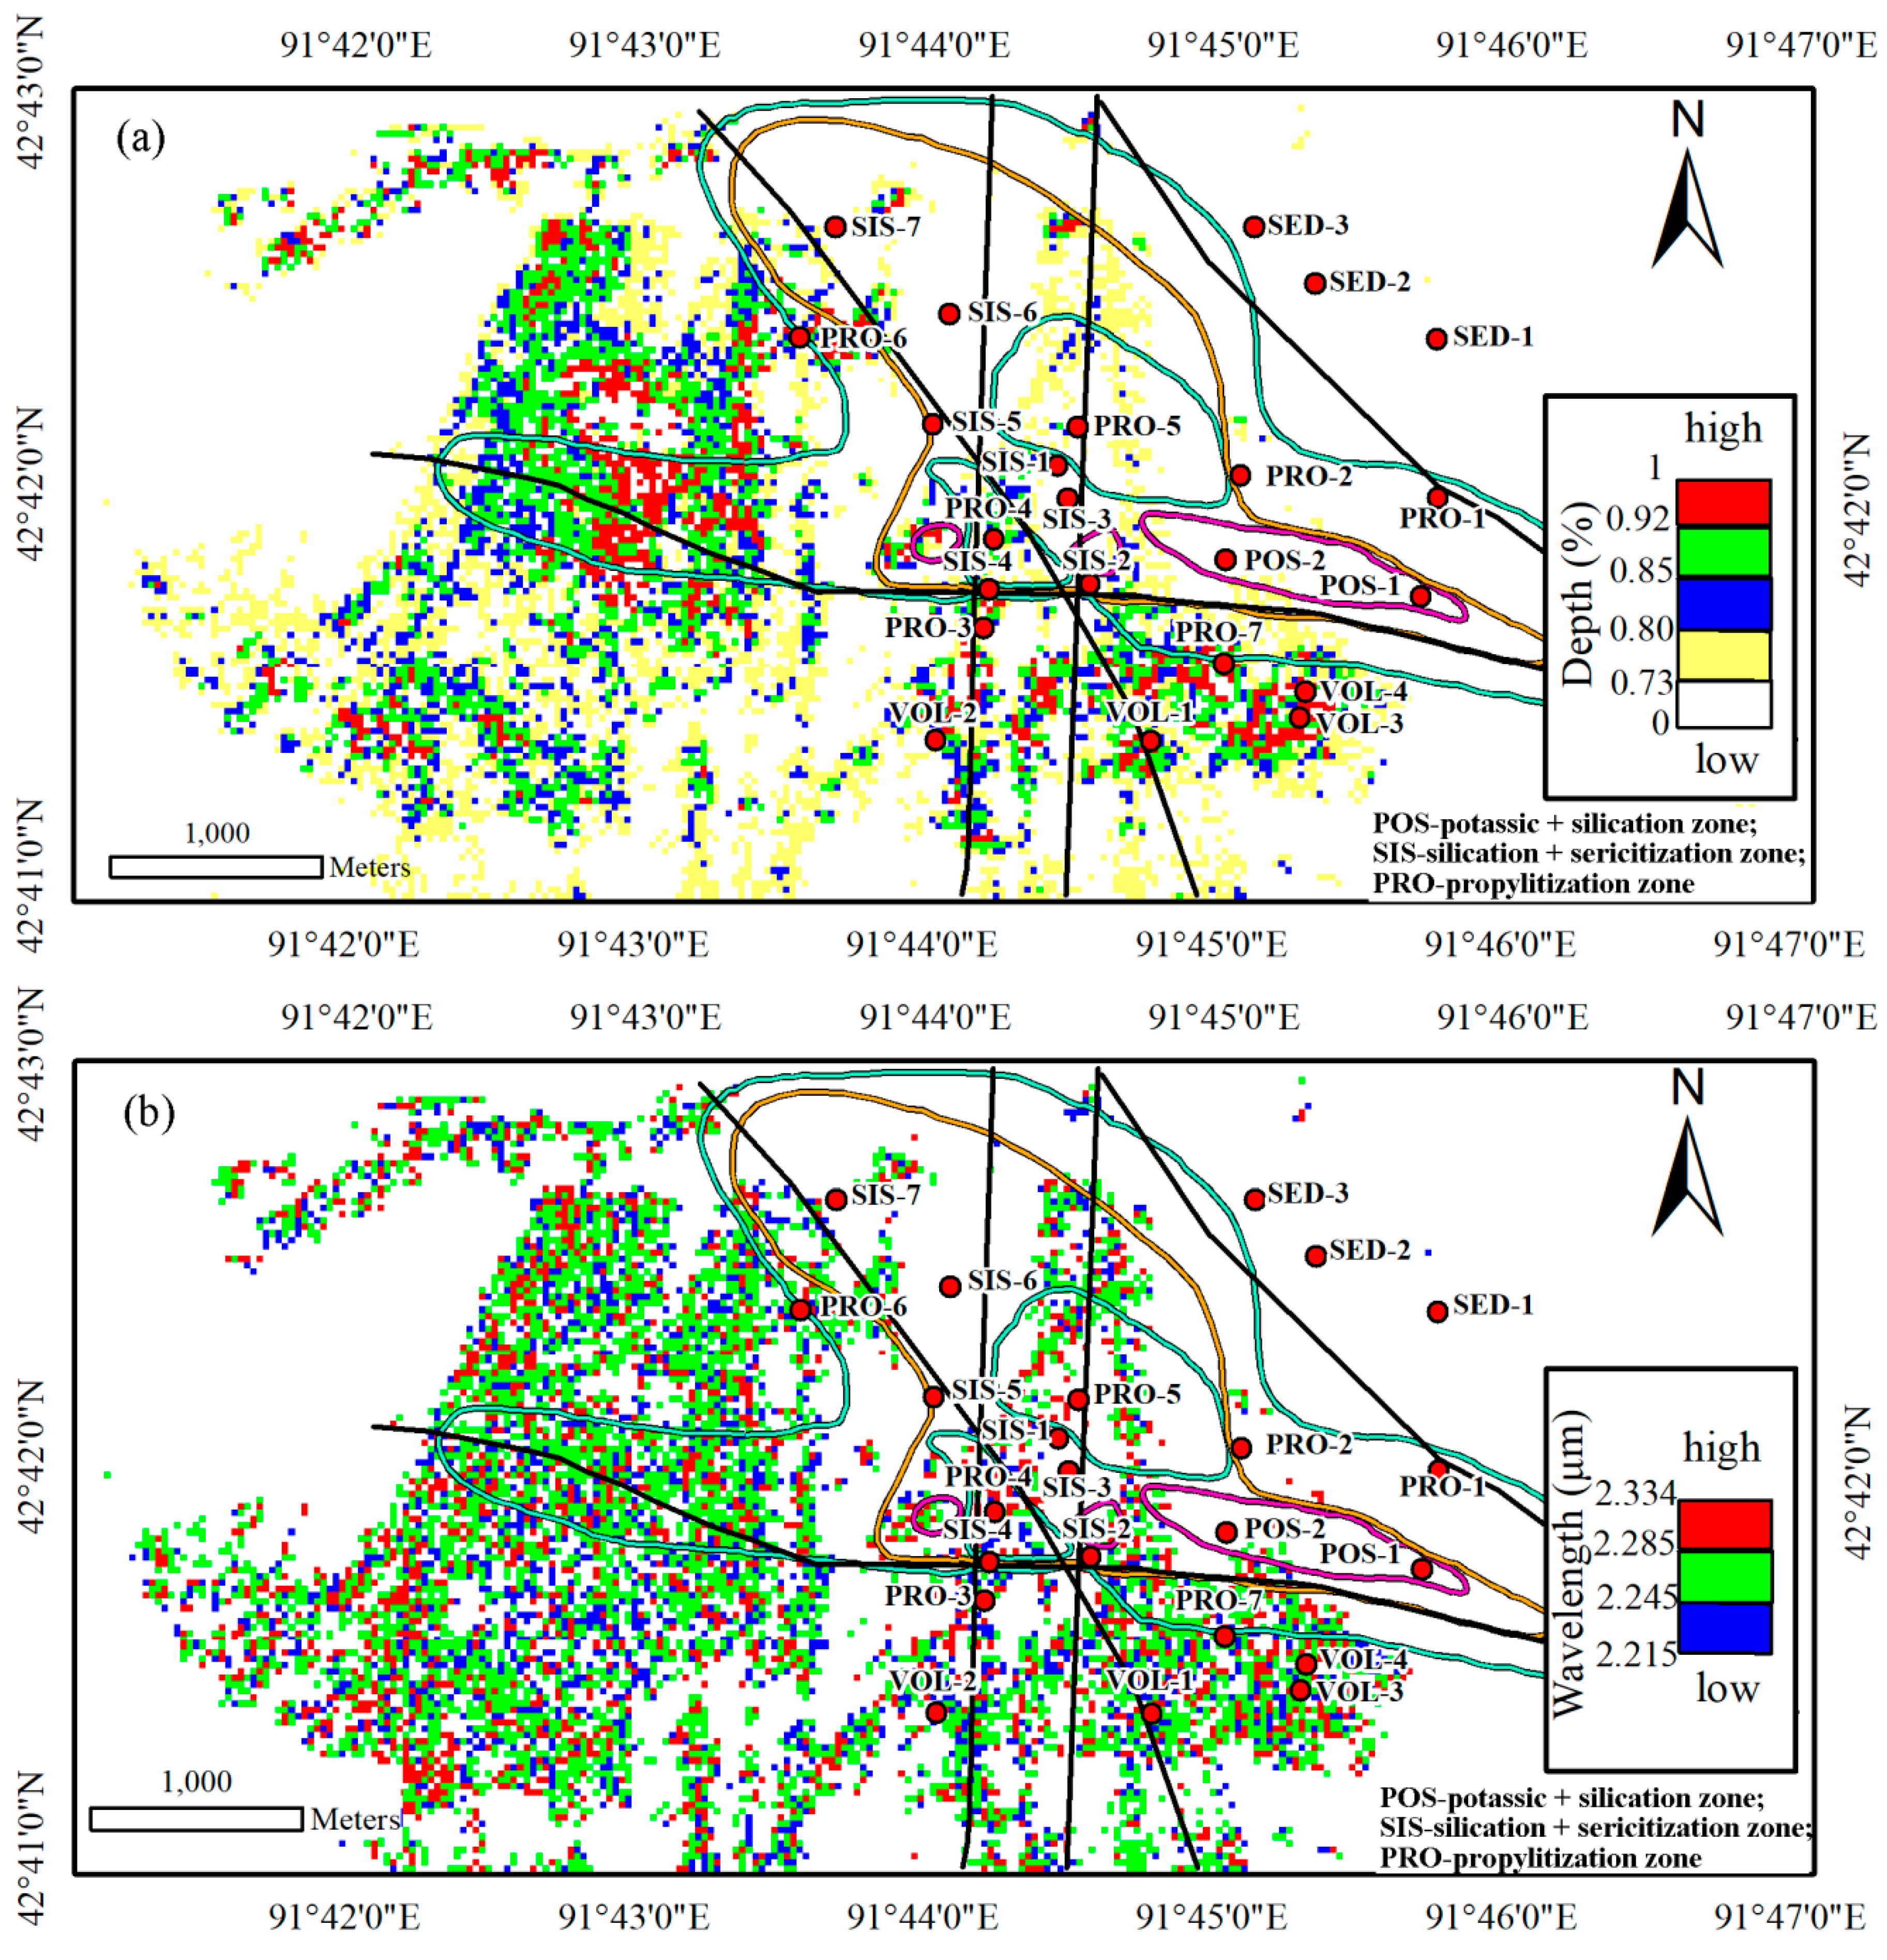
2.4. Absorption Feature Parameters for Mapping Hydrothermal Zoning Pattern
2.5. Statistical Approaches for Mapping the Hydrothermal Zoning Pattern
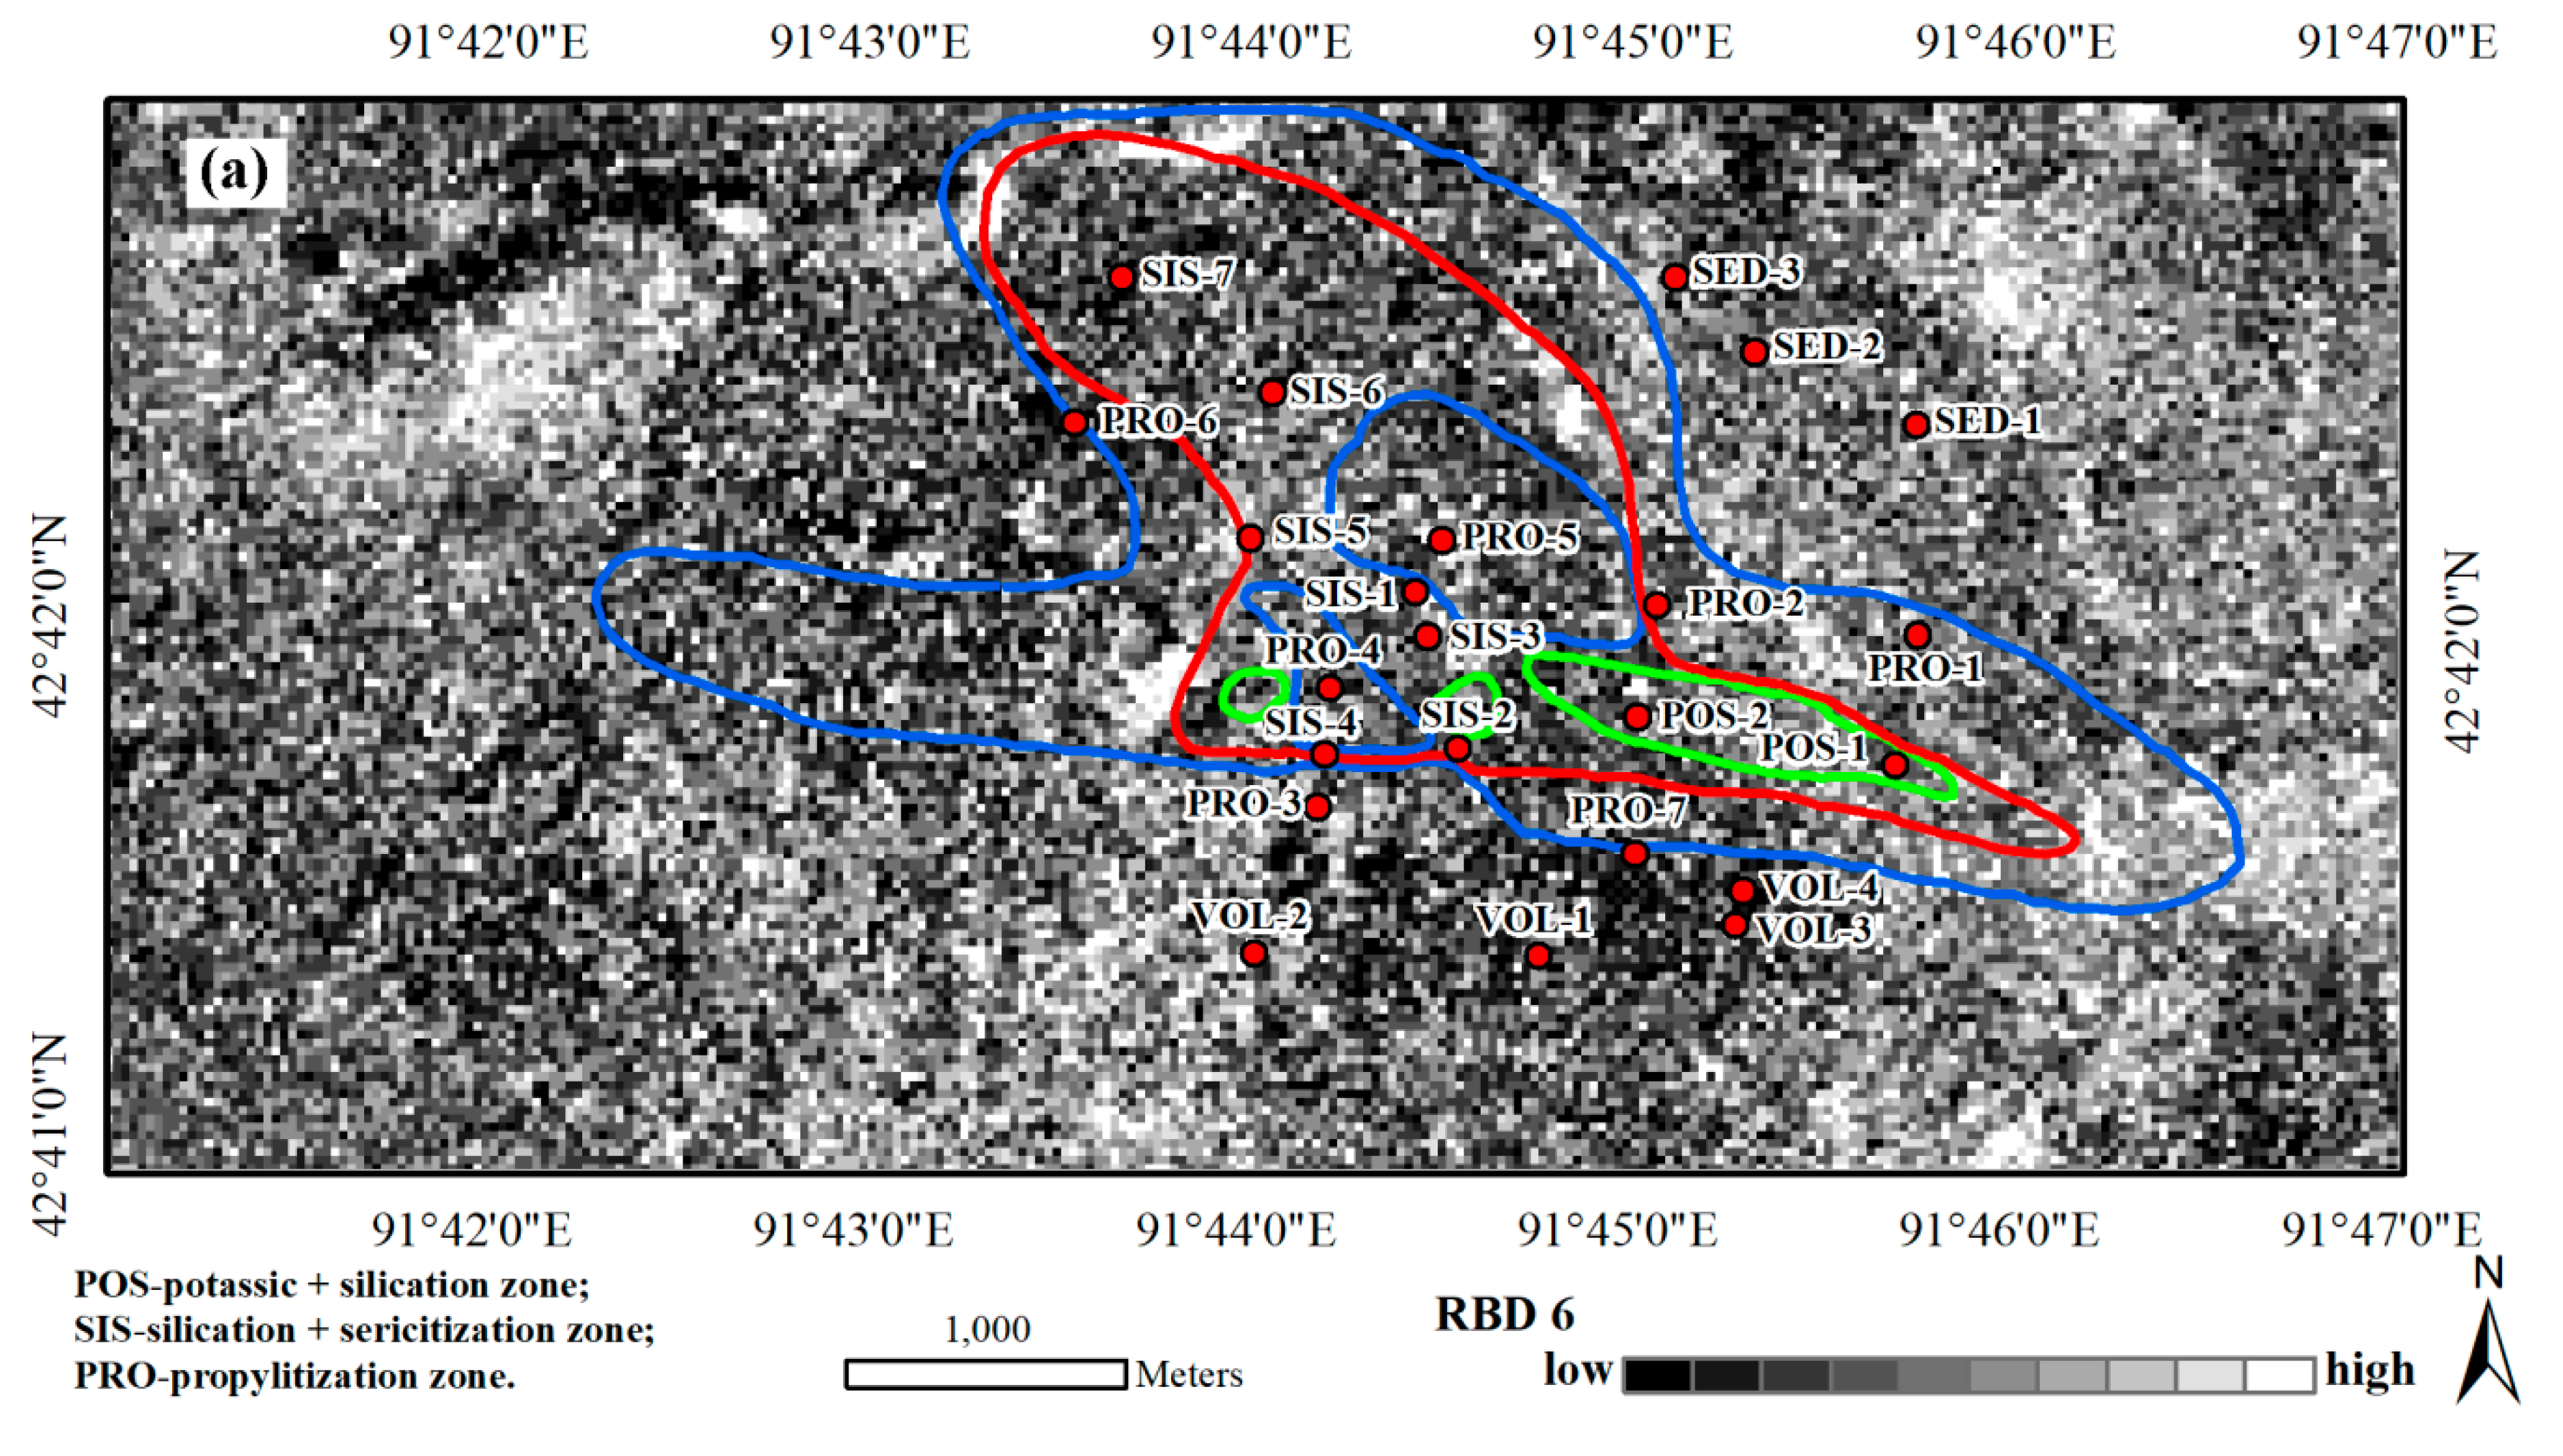
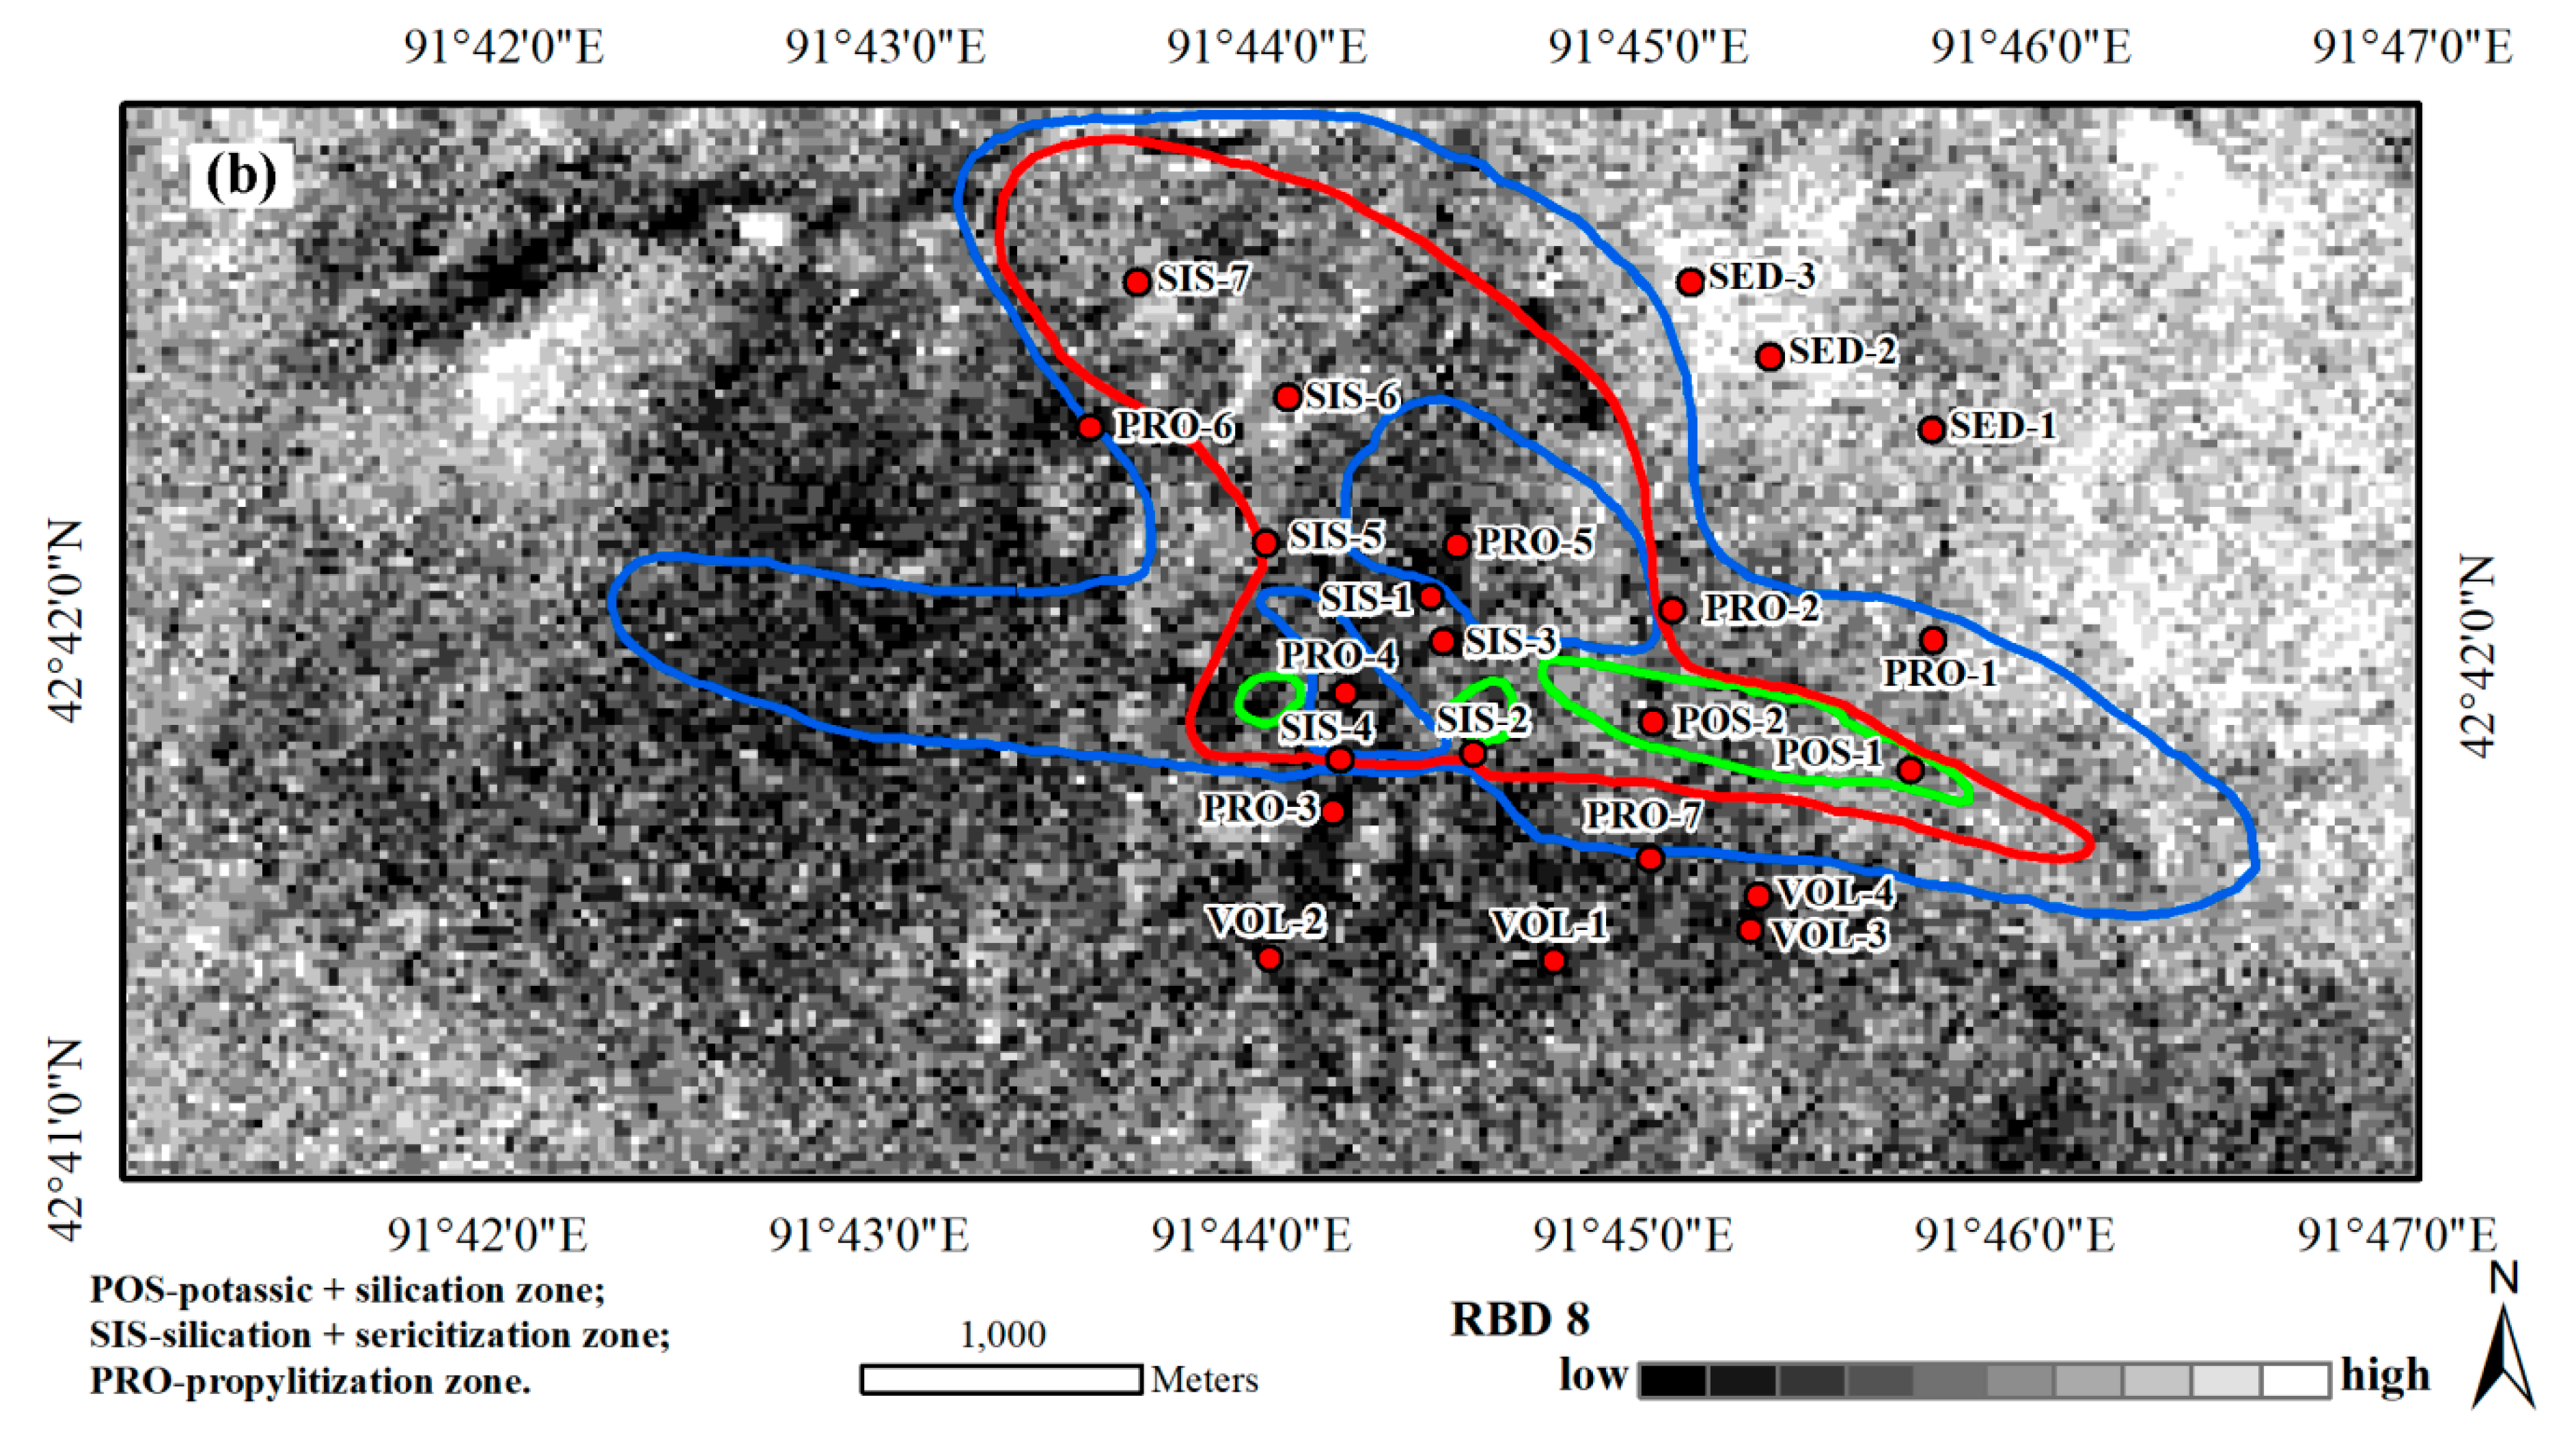
2.5.1. Relative Absorption Band Depth (RBD)
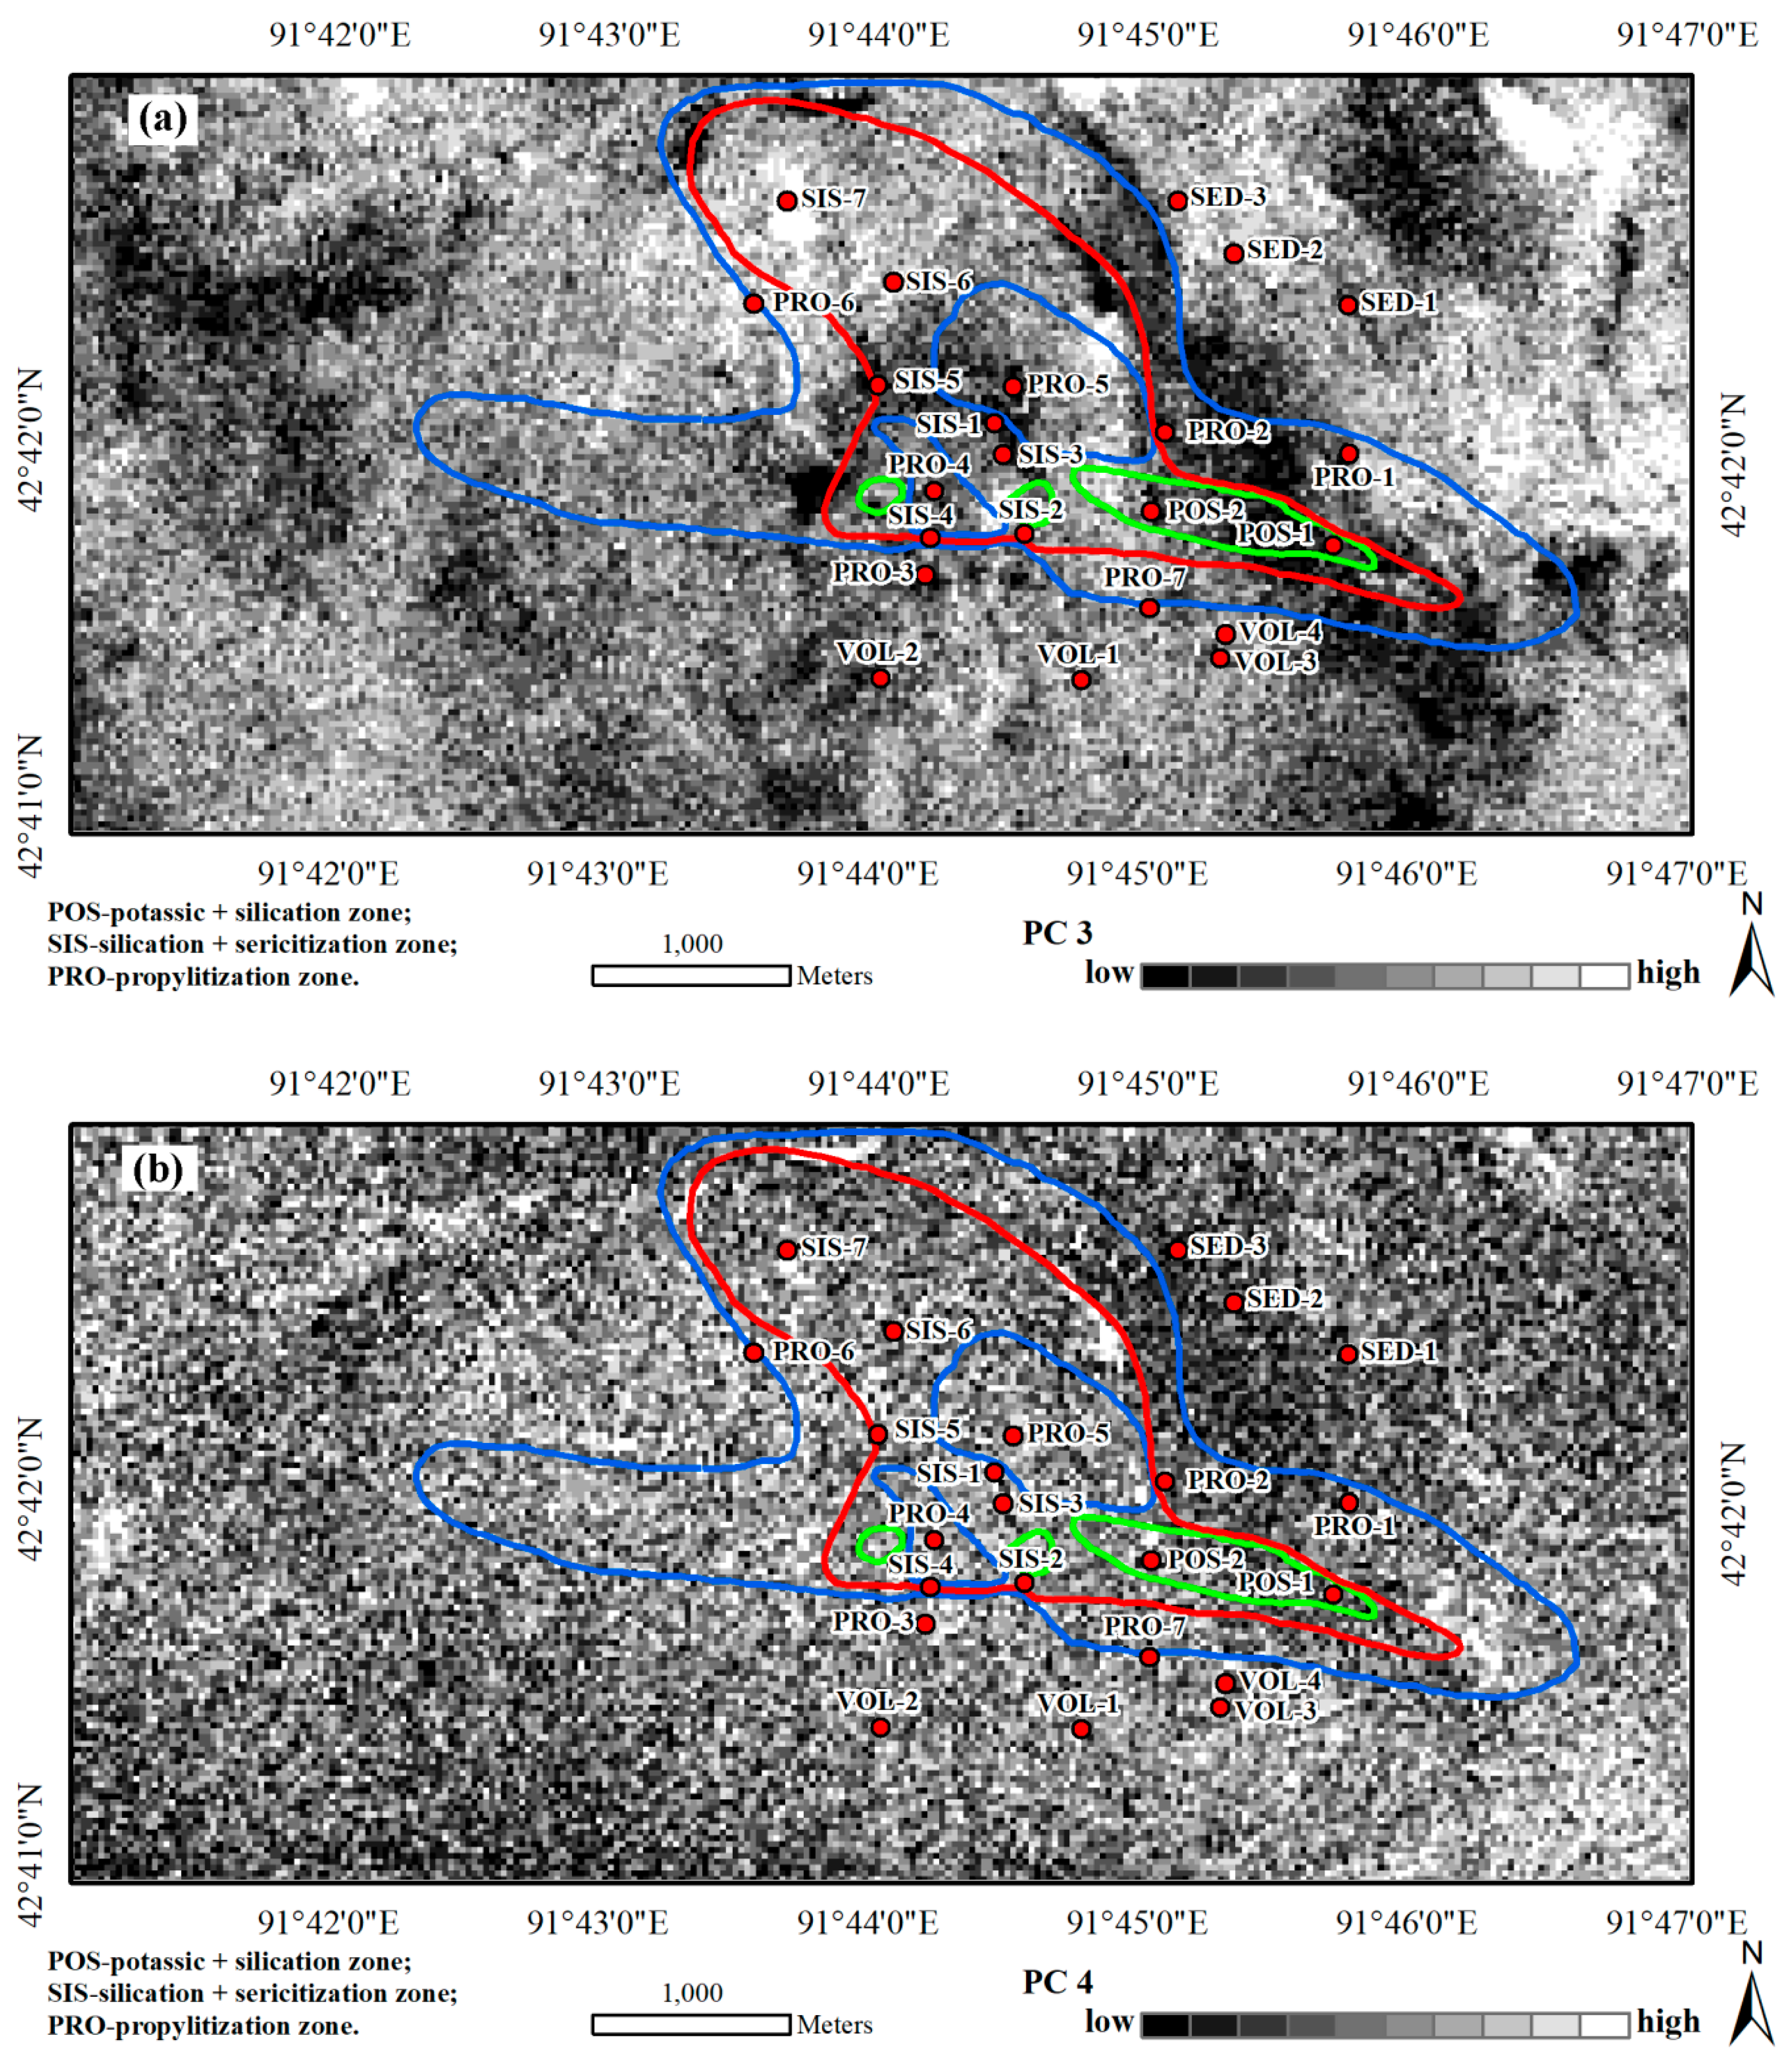
2.5.2. Principal Component Analysis (PCA)
2.6. Validation Data
3. Results
3.1. Absorption Feature Parameters Calculated Based on the Spectra of Hand-Specimen
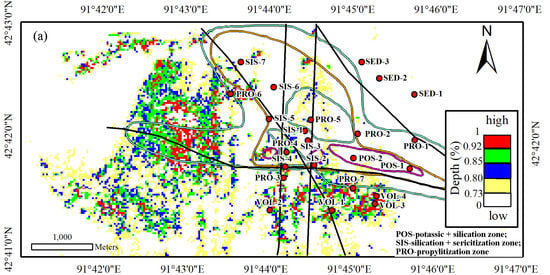
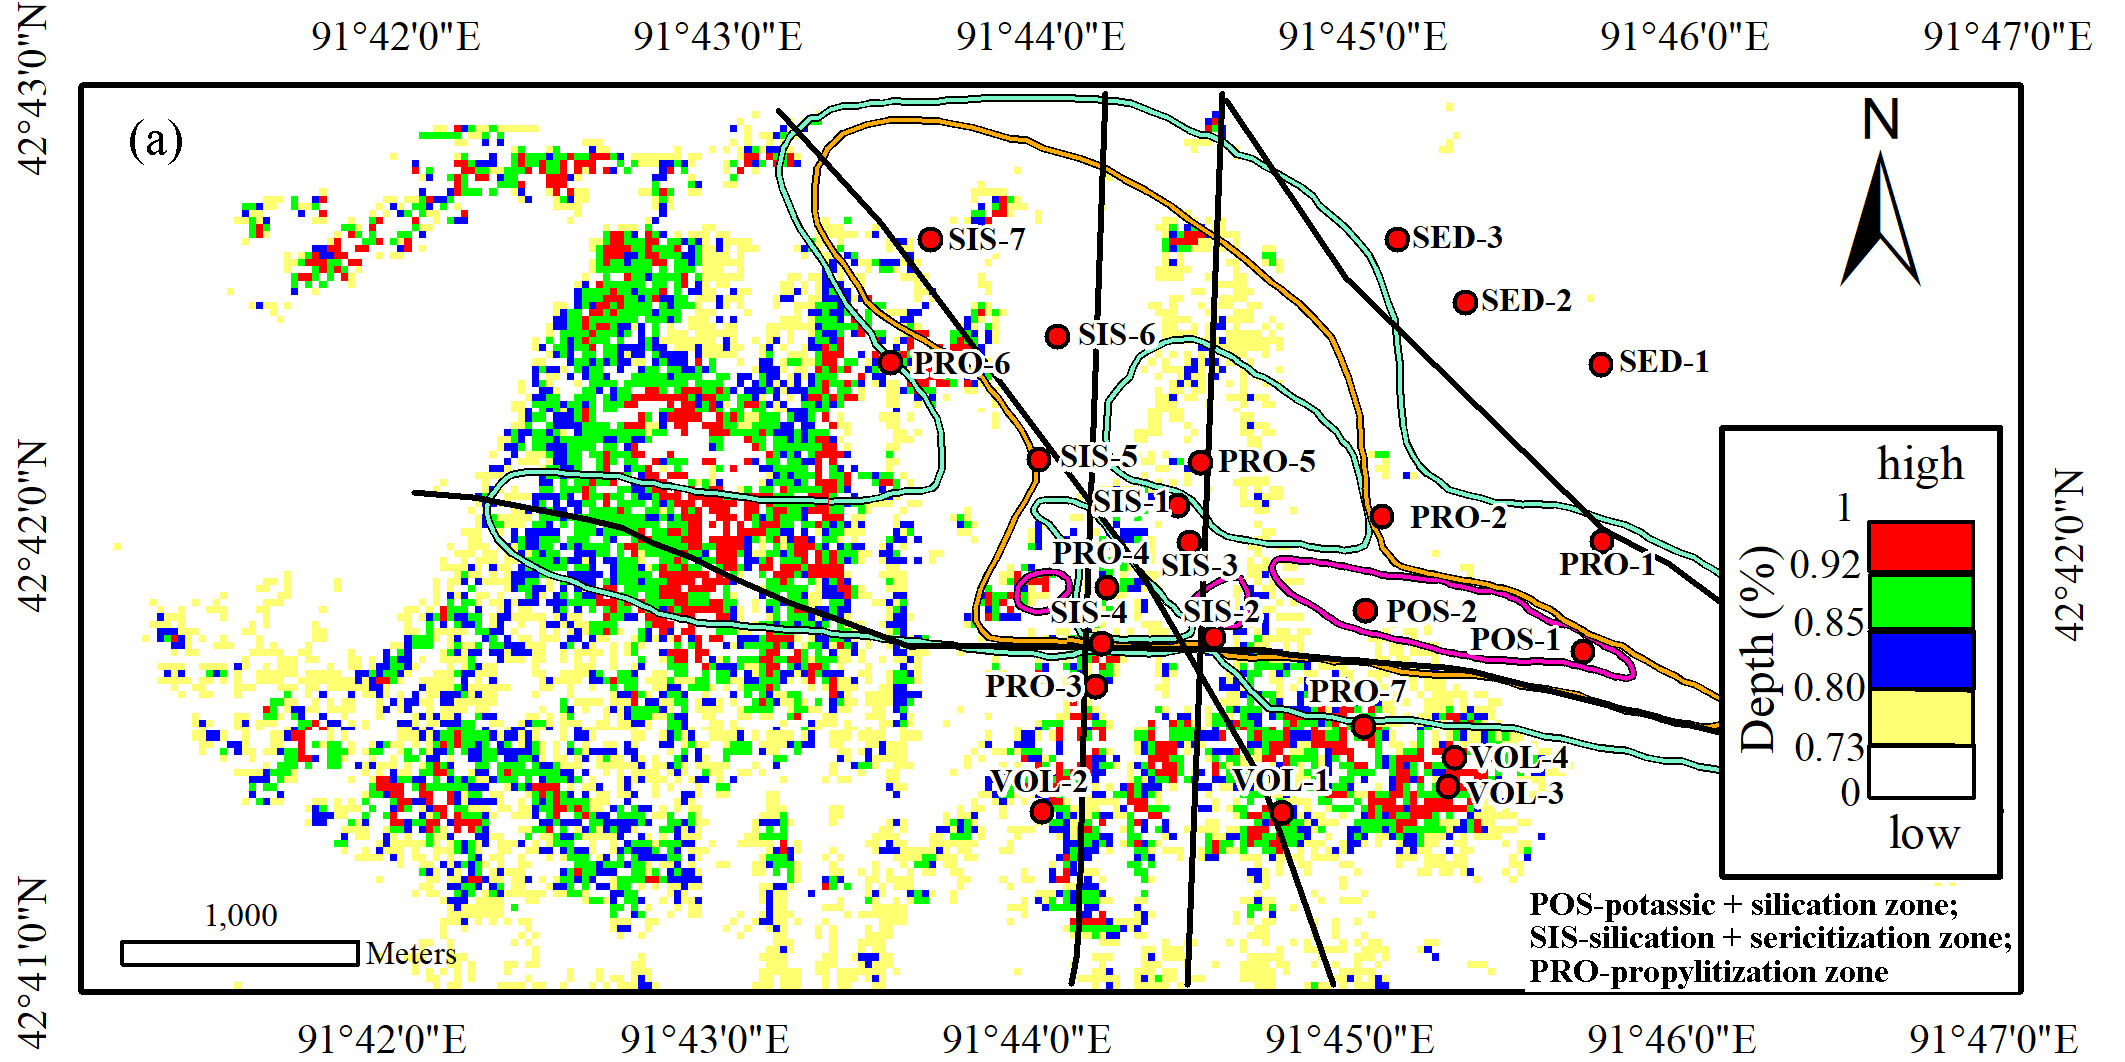
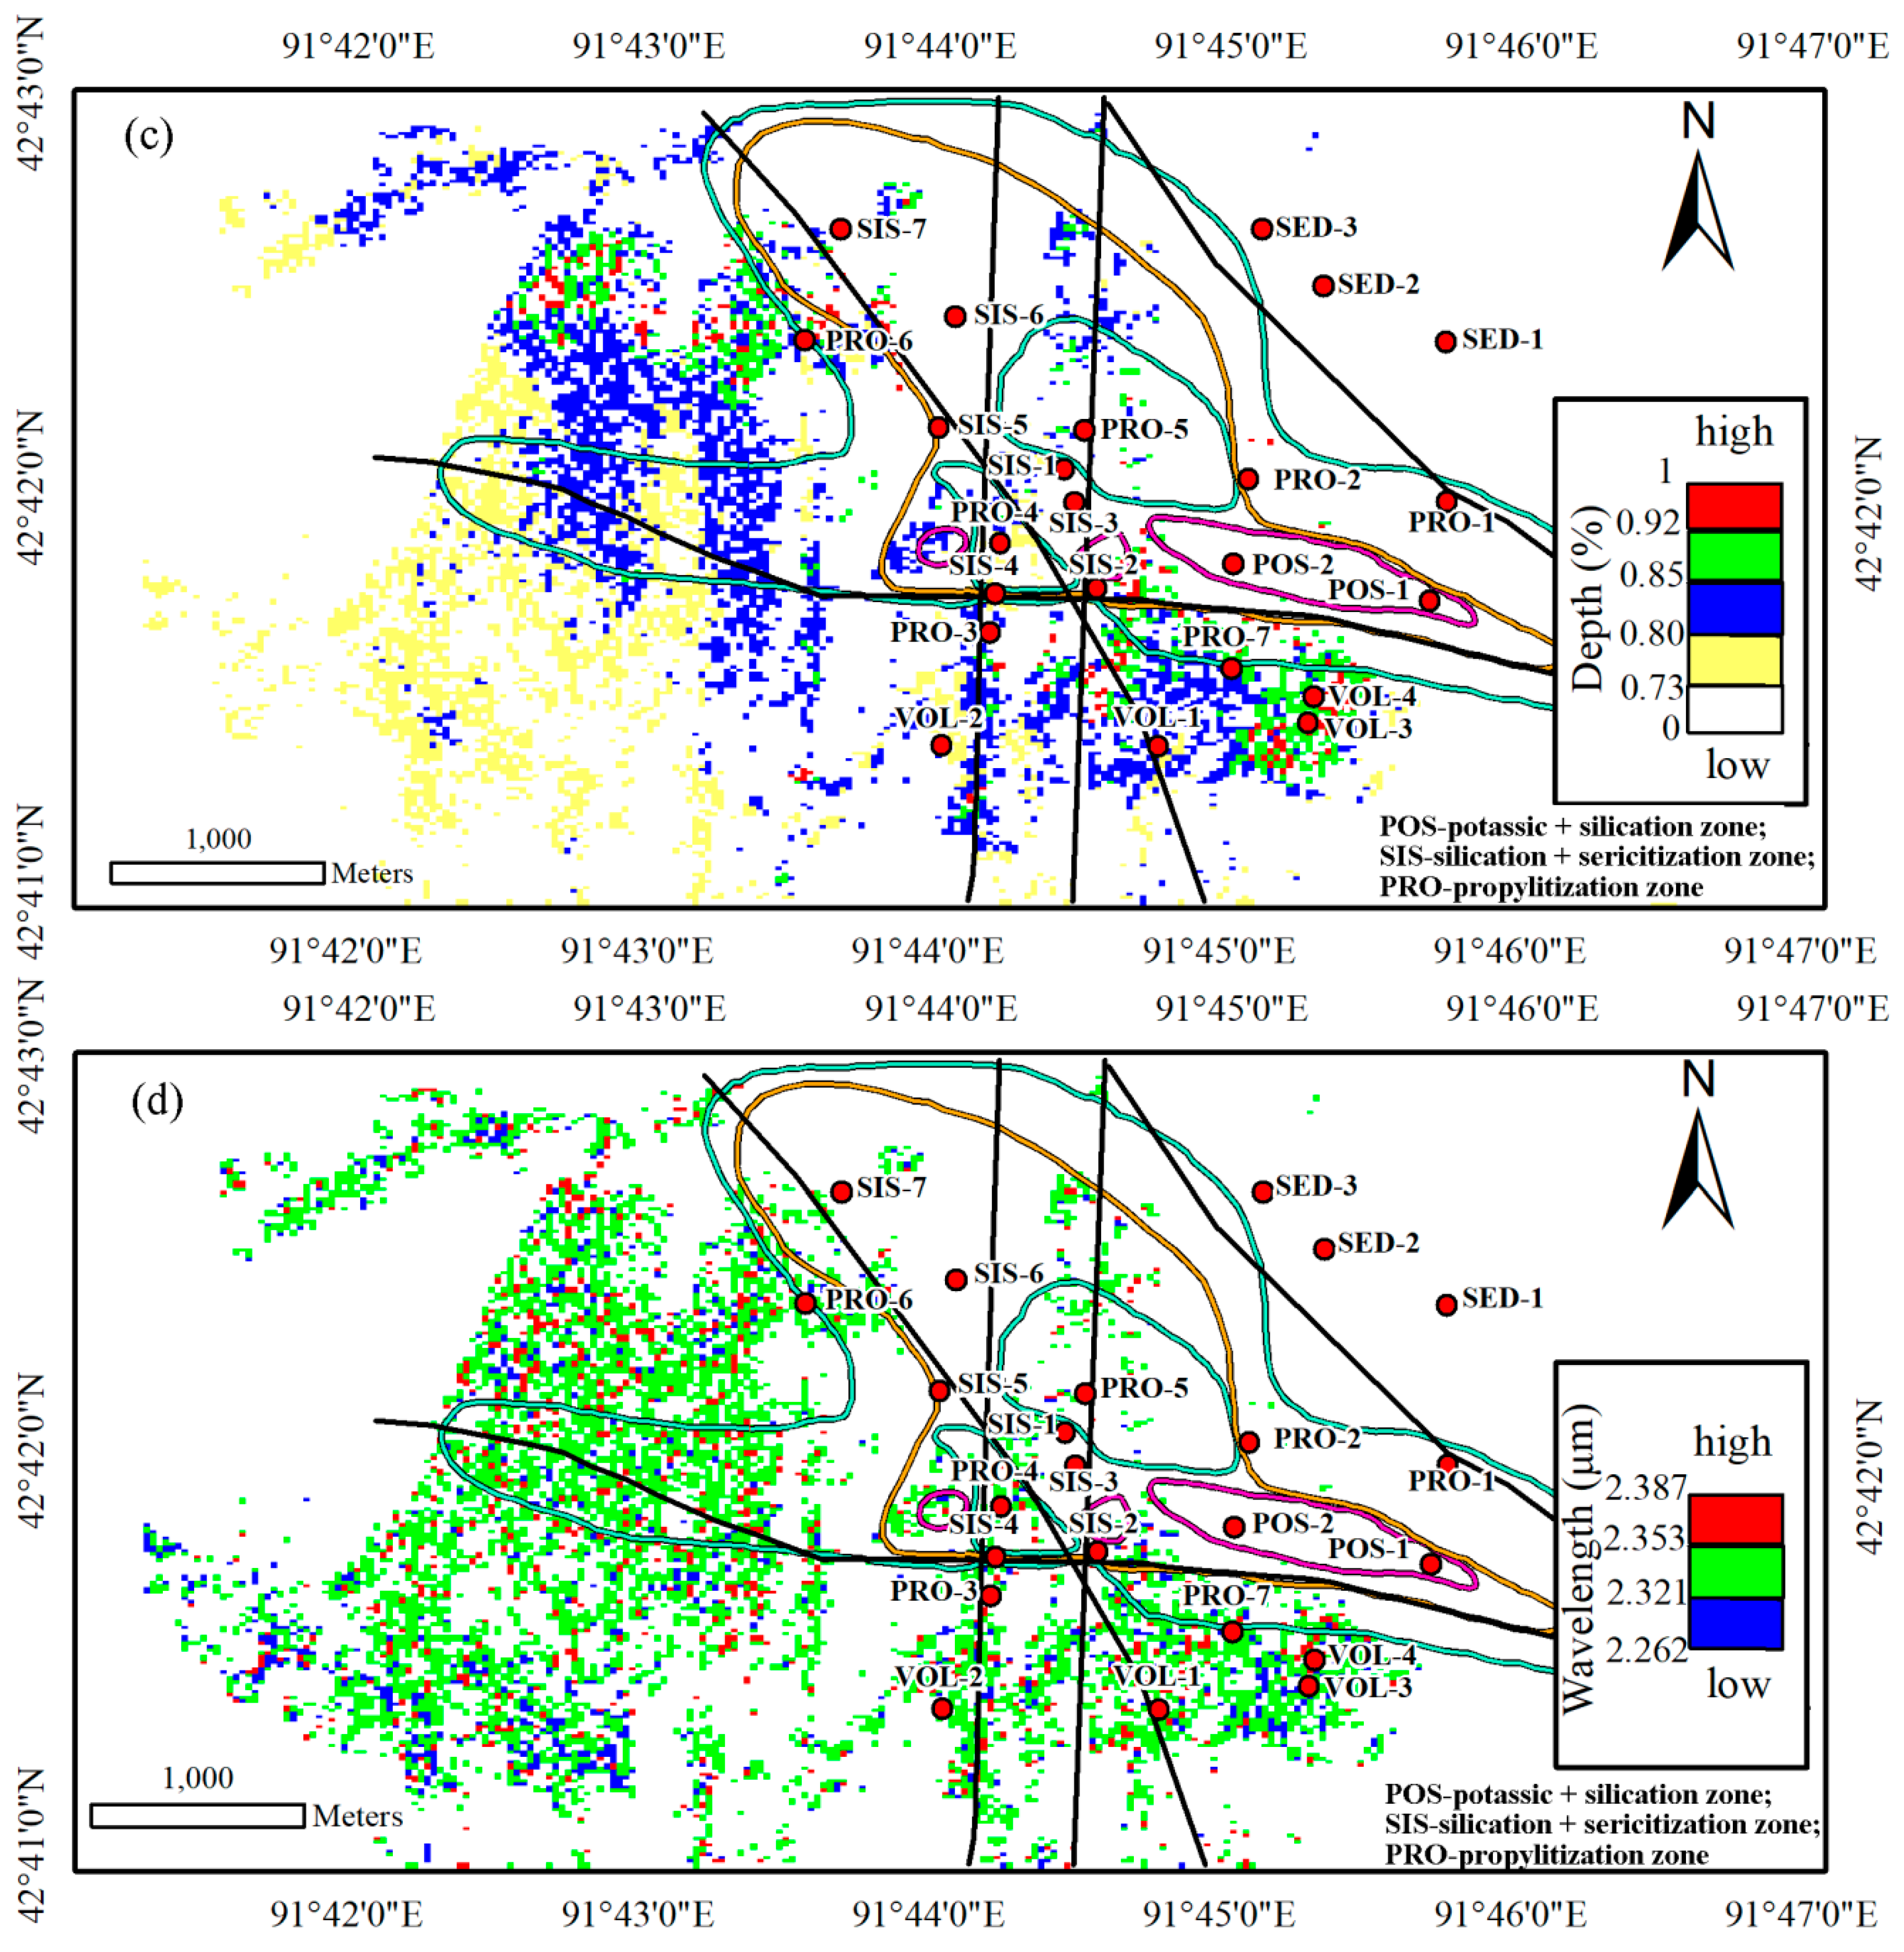
3.2. Absorption Feature Parameters Estimated from ASTER Data for Mapping Hydrothermal Zoning Pattern
3.3. Validation of Mapped Pattern with the Ground Truths
4. Discussion
4.1. Performances of Absorption Feature Parameters
4.2. Application Prospects in Eastern Tianshan
5. Conclusions
Author Contributions
Funding
Acknowledgments
Conflicts of Interest
References
- Sillitoe, R. Porphyry copper systems. Econ. Geol. 2010, 105, 3–41. [Google Scholar] [CrossRef]
- Lowell, J.D.; Guilbert, J.M. Lateral and vertical alteration-mineralization zoning in porphyry ore deposits. Econ. Geol. 1970, 65, 373–408. [Google Scholar] [CrossRef]
- Duan, Z.L.; Lv, X.F. A new approach of determining alteration-mineralization scope and zoning of porphyry copper deposits. Geol. Explor. 1982, 1, 57–62, (In Chinese with English abstract). [Google Scholar]
- Chen, L.; Wang, J.B.; Bagas, L.; Wu, X.B.; Zou, H.Y.; Zhang, H.Q.; Sun, Y.; Lv, X.Q.; Deng, X.H. Significance of adakites in petrogenesis of early Silurian magmatism at the Yudai copper deposit in the Kalatag district, NW China. Ore Geol. Rev. 2017, 91, 780–794. [Google Scholar] [CrossRef]
- Clark, R.N.; King, T.V.V.; Klejwa, M.; Swayze, G.A. High spectral resolution reflectance spectroscopy of minerals. J. Geophys. Res. 1990, 95, 12653–12680. [Google Scholar] [CrossRef] [Green Version]
- Crowley, J.K.; Brickey, D.W.; Rowan, L.C. Airborne imaging spectrometer data of the Ruby Mountains, Montana: Mineral discrimination using relative absorption band-depth images. Remote Sens. Environ. 1989, 29, 121–134. [Google Scholar] [CrossRef]
- Hunt, G.R. Spectral signatures of particulate minerals in the visible and near infrared. Geophysics 1977, 42, 501–513. [Google Scholar] [CrossRef]
- Hunt, G.R.; Ashley, P. Spectra of altered rocks in the visible and near infrared. Econ. Geol. 1979, 74, 1613–1629. [Google Scholar] [CrossRef]
- Hunt, G.R.; Salisbury, J.W. Mid-Infrared Spectral Behavior of Igneous Rocks. Technical Report AFRCL-TR-75-0356; US Air Force Cambridge Research Laboratory: Cambridge, MA, USA, 1974. [Google Scholar]
- Wang, Z.Y.; Zhang, T.B.; Yi, G.H.; Bie, X.J.; Wang, Q.; He, Y.X. Extraction of remote sensing alteration information and prospecting prediction of Chongjiang-Tinggong porphyry copper deposits in Tibet. Geol. Explor. 2016, 52, 1129–1137, (In Chinese with English abstract). [Google Scholar]
- Zhang, T.B.; Zhong, K.H.; Yi, G.H.; Ma, H. The extraction of remote sensing geological information and metalllogeneic prediction of gold mineralized concentrate district in Wulonggou, east Kunlun mountains. Geol. Explor. 2009, 45, 444–449, (In Chinese with English abstract). [Google Scholar]
- Bie, X.J.; Sun, C.M.; Zhang, T.B.; Yi, G.H.; Guo, N.; Wu, H. Extraction and optimization of ASTER remote sensing alteration information in the north of Yulong porphyry copper belt. China Min. Mag. 2014, 23, 71–74, (In Chinese with English abstract). [Google Scholar]
- Mahdevar, M.R.; Ketabi, P.; Saadatkhah, N.; Rahnamarad, J. Application of ASTER SWIR data on detection of alteration zone in the Sheikhabad area, eastern Iran. Arab. J. Geosci. 2015, 8, 5909–5919. [Google Scholar] [CrossRef]
- Chavez, P.S.; Sides, S.C.; Anderson, J.A. Comparison of three different methods to merge multiresolution and multispectral data: Landsat TM and SPOT panchromatic. Photogramm. Eng. Remote Sens. 1991, 57, 295–303. [Google Scholar]
- Yésou, H.; Besnus, Y.; Rolet, J. Extraction of spectral information from Landsat TM data and merger with SPOT panchromatic imagery–A contribution to the study of geological structures. ISPRS J. Photogramm. Remote Sens. 1993, 48, 23–36. [Google Scholar] [CrossRef]
- Hubbard, B.E.; Crowley, J.K.; Zimbelman, D.R. Comparative alteration mineral mapping using visible to shortwave infrared (0.4–2.4 μm) Hyperion, ALI, and ASTER imagery. IEEE Trans. Geosci. Remote Sens. 2003, 41, 1401–1410. [Google Scholar] [CrossRef]
- Hubbard, B.E.; Crowley, J.K. Mineral mapping on the Chilean-Bolivian Altiplano using co-orbital ALI, ASTER and Hyperion imagery: Data dimensionality issues and solutions. Remote Sens. Environ. 2005, 99, 173–186. [Google Scholar] [CrossRef]
- Rowan, L.C.; Mars, J.C. Lithologic mapping in the Mountain Pass, California area using Advanced Spaceborne Thermal Emissivity and Reflection Radiometer ASTER data. Remote Sens. Environ. 2003, 84, 350–366. [Google Scholar] [CrossRef]
- Rowan, L.C.; Hook, S.J.; Abrams, M.J.; Mars, J.C. Mapping hydrothermally altered rocks at Cuprite, Nevada using the Advanced Spaceborne Thermal Emissivity and Reflection Radiometer ASTER, a new satellite-imaging system. Econ. Geol. 2003, 98, 1019–1027. [Google Scholar] [CrossRef]
- Pour, A.B.; Hashim, M. The application of ASTER remote sensing data to porphyry copper and epithermal gold deposits. Ore Geol. Rev. 2012, 44, 1–9. [Google Scholar] [CrossRef] [Green Version]
- Gabr, S.; Ghulam, A.; Kusky, T. Detecting areas of high-potential gold mineralization using ASTER data. Ore Geol. Rev. 2010, 38, 59–69. [Google Scholar] [CrossRef]
- Kruse, F.A.; Boardman, J.W.; Huntington, J.F. Comparison of airborne hyperspectral data and EO-1 Hyperion for mineral mapping. IEEE Trans. Geosci. Remote. Sens. 2003, 41, 1388–1400. [Google Scholar] [CrossRef]
- Ninomiya, Y. Mapping quartz, carbonate minerals and mafic-ultramafic rocks using remotely sensed multispectral thermal infrared ASTER data. SPIE Int. Soc. Opt. Eng. 2002, 4710, 191–202. [Google Scholar]
- Van der Werff, H.; Van der Meer, F. Sentinel-2 for Mapping Iron Absorption Feature Parameters. Remote Sens. 2015, 7, 12635–12653. [Google Scholar] [CrossRef] [Green Version]
- Mao, Q.G.; Wang, J.B.; Fang, T.H.; Yu, M.J.; Sun, Y. Discovery of the middle Devonian Yudai porphyric Cu(-Au) deposit in the Kalatage area of eastern Tianshan Mountain, Xinjiang and its geological prospecting significance. Geol. Explor. 2017, 53, 1–11, (In Chinese with English abstract). [Google Scholar]
- Qin, K.Z.; Fang, T.H.; Wang, S.L.; Wang, X.D. Discovery of the Kalatage Cu-Au mineralized district and its prospecting potentiality, in the Paleozoic uplift at the south margin of the Tu-Ha Basin. Geol. China 2001, 28, 16–23, (In Chinese with English abstract). [Google Scholar]
- Fang, T.H.; Qin, K.Z.; Wang, S.L.; Jiang, F.Z.; Gan, X.P.; Zhou, Z.J. Elementary analysis on the geological background of Kalatage copper and gold deposit, Xinjiang. Miner. Depos. 2002, 21, 380–384, (In Chinese with English abstract). [Google Scholar]
- Mao, Q.G.; Fang, T.H.; Wang, J.B.; Wang, S.L.; Wang, N. Geochronology studies of the Early Paleozoic Honghai massive sulfide deposits and its geological significance in Kalatage area, eastern Tianshan Mountain. Acta Petrol. Sin. 2010, 26, 3017–3026, (In Chinese with English abstract). [Google Scholar]
- Deng, X.H.; Wang, J.B.; Pirajnoc, F.; Wang, Y.W.; Li, Y.C.; Li, C.; Zhou, L.M.; Chen, Y.J. Re-Os dating of chalcopyrite from selected mineral deposits in the Kalatag district in the eastern Tianshan Orogen, China. Ore Geol. Rev. 2016, 77, 72–81. [Google Scholar] [CrossRef]
- Deng, X.H.; Wang, J.B.; Wang, Y.W.; Li, Y.C.; Fang, T.H.; Mao, Q.G. Geological characteristics of the Hongshi Cu-Au deposit, eastern Tianshan, Xinjiang and discussion of the deposit genesis. Miner. Explor. 2014, 5, 159–168, (In Chinese with English abstract). [Google Scholar]
- Yamaguchi, Y.; Kahle, A.B.; Tsu, H.; Kawakami, T.; Pniel, M. Overview of Advanced Spaceborne Thermal Emission and Reflection Radiometer (ASTER). IEEE Trans. Geosci. Remote Sens. 1998, 36, 1062–1071. [Google Scholar] [CrossRef] [Green Version]
- Fujisada, H. Design and performance of ASTER instrument. Proc. Int. Soc. Opt. Eng. 1995, 2583, 16–25. [Google Scholar]
- Roberts, D.A.; Yamaguchi, Y.; Lyon, R.J.P. Comparison of various techniques for calibration of AIS data. In Proceedings of the 2nd Airborne Imaging Spectrometer Data Analysis Workshop; JPL Publication: Pasadena, CA, USA, 1986; pp. 21–30. [Google Scholar]
- Rowan, L.C.; Kingston, M.K.; Crowley, J.K. Spectral reflectance of carbonate and related alkalic igneous rocks: Selected samples from four North American localities. Econ. Geol. 1986, 81, 857–871. [Google Scholar] [CrossRef]
- Hunt, G.R.; Salisbury, J.W. Visible and near-infrared spectra of minerals and rocks: I Silicate minerals. Mod. Geol. 1970, 1, 283–300. [Google Scholar]
- Clark, R.N.; Swayze, G.A.; Gallagher, A.J.; King, T.V.V.; Calvin, W.M. The U.S. Geological Survey, Digital Spectral Library: Version 1: 0.2 to 3.0 Microns; Open-File Report 93-592; U.S. Geological Survey: Denver, CO, USA, 1993.
- van der Meer, F.D.; van der Werff, H.M.A.; van Ruitenbeek, F.J.A. Potential of ESA’s Sentinel-2 for geological applications. Remote Sens. Environ. 2014, 418, 124–133. [Google Scholar] [CrossRef]
- Van der Meer, F. Analysis of spectral absorption features in hyperspectral imagery. Int. J. Appl. Earth Sci. 2004, 5, 55–68. [Google Scholar] [CrossRef]
- Jolliffe, I. Principal Component Analysis. In International Encyclopedia of Statistical Science; Lovric, M., Ed.; Springer: Berlin, Germany, 2011. [Google Scholar]
- Crósta, A.P.; De Souza Filho, C.R.; Azevedo, F.; Brodie, C. Targeting key alteration minerals in epithermal deposits in Patagonia, Argentina, using ASTER imagery and principal component analysis. Int. J. Remote Sens. 2003, 24, 4233–4240. [Google Scholar] [CrossRef]
- Loughlin, W.P. Principal component analysis for alteration mapping. Photogramm. Eng. Remote Sens. 1991, 57, 1163–1169. [Google Scholar]
- Azizi, H.; Tarverdi, M.A.; Akbarpour, A. Extration of hydrothermal alterations from ASTER SWIR data from east Zanjan, northern Iran. Adv. Space Res. 2010, 46, 99–109. [Google Scholar] [CrossRef]
- Ducart, D.F.; Crosta, A.P.; Filio, C.R.S. Alteration mineralogy at the Cerro La Mina epithermal prospect, Patagonia, Argentina: Field mapping, short-wave infrared spectroscopy, and ASTER images. Econ. Geol. 2006, 101, 981–996. [Google Scholar] [CrossRef]
- Van der Meer, F.; Kopackova, V.; Koucká, L.; van der Werff, H.M.A.; van Ruitenbeek, F.J.A.; Bakker, W.H. Wavelength feature mapping as a proxy to mineral chemistry for investigating geologic system: An example from the Rodalquilar epithermal system. Int. J. Appl. Earth Obs. Geoinf. 2018, 64, 237–248. [Google Scholar] [CrossRef]
- Duke, E.F. Near-infrared spectra of muscovite, Tschermak substitution and metamoprhic reaction process–Implications for remote sensing. Geology 1994, 22, 621–624. [Google Scholar] [CrossRef]


| Characteristic Bands | |
|---|---|
| Iron Oxides/Hydroxides | |
| Jarosite | 2215 nm (doublet) |
| Aluminosilicates | |
| Illite/Kaolinite/Muscovite | 2200 nm |
| Carbonates/Mafic Minerals | |
| Calcite/Chlorite/Epidote | 2250 nm, 2350 nm |
| Alteration Zone and Stratum | Sample No. | Rock Type | Absorption Band (nm) | Absorption Band Characteristics | Corresponding to ASTER Bands |
|---|---|---|---|---|---|
| Potassic + silication alteration zone | POS-1 | Dacite | 1918 | Very strong, narrow | |
| 2211, 2350 | Moderate, narrow | Band 6, band 8 | |||
| POS-2 | Potassium alteration dacite | 1933, 2350 | Strong, narrow | Band 8 | |
| Silication + sericitization alteration zone | SIS-1 | Epidotization syenite | 1910, 2255 (doublet) | Moderate, narrow | Band 7 |
| SIS-2 | Surface stalinization crust (brownish red) | 1937 | Strong, broad | ||
| 2210, 2435 | Weak, narrow | Band 6 | |||
| SIS-3 | Limonitization powder | 1968 | Strong, broad | ||
| 2401 | Weak, narrow | Band 9 | |||
| SIS-4 | Diabase | 1900, 2250, 2336 | Very weak, narrow | Band 7, band 8 | |
| SIS-5 | Surface stalinization crust (brownish red) | 1927 | Strong, broad | ||
| 2210 | Weak, narrow | Band 6 | |||
| SIS-6 | Surface stalinization crust (brownish red) | 1927 | Moderate, broad | ||
| 2210 | Very weak, narrow | Band 6 | |||
| SIS-7 | Surface stalinization crust (brownish red) | 1914, 2198 | Strong, narrow | Band 6 | |
| Propylitization alteration zone | PRO-1 | Silicification rock | 1915 | Moderate, narrow | |
| 2215 (doublet), 2385 | Weak, narrow | Band 6 | |||
| PRO-2 | Covered gravel | Flat and straight, with no obvious absorption characteristics | |||
| PRO-3 | Grey-green altered tuff | 1900 | Weak, narrow | ||
| 2255 (doublet) | Very strong, narrow | Band 7 | |||
| PRO-4 | Grey-green altered almond-shaped andesite | 1950, 2261 (doublet) | Moderate, narrow | Band 7 | |
| PRO-5 | Yellow-green altered diorite porphyrite | 1947 | Moderate, narrow | ||
| 2258 (doublet) | Very strong, narrow | Band 7 | |||
| PRO-6 | Grey-green tuff | 2183 (doublet) | Strong, narrow | Band 5 | |
| 1915 | Moderate, narrow | ||||
| 2350 (doublet) | Weak, narrow | Band 8 | |||
| PRO-7 | Light gray-brown syenite porphyry | Flat and straight, with no obvious absorption characteristics | |||
| Clastic sedimentary stratum (D1d) | SED-1 | Argillaceous rock | 1915 | Moderate, narrow | |
| 2255 (doublet) | Moderate, narrow | Band 7 | |||
| SED-2 | Diorite porphyrite | 1915 | Moderate, narrow | ||
| 2255 (doublet) | Moderate, narrow | Band 7 | |||
| SED-3 | Dacite porphyry | 1911, 2215 | Strong, narrow | Band 6 | |
| Dacitic volcanic and volcaniclastic stratum | VOL-1 | Flat and low reflectance (5%–25%), with no obvious absorption characteristics | |||
| VOL-2 | |||||
| VOL-3 | |||||
| VOL-4 | |||||
| Band No. | Spectral Position (, nm) | Bandwidth (, nm) |
|---|---|---|
| 1 | 1656 | 10 |
| 2 | 2167 | 40 |
| 3 | 2209 | 40 |
| 4 | 2262 | 50 |
| 5 | 2336 | 70 |
| 6 | 2400 | 70 |
| Band 4 | Band 5 | Band 6 | Band 7 | Band 8 | Band 9 | |
|---|---|---|---|---|---|---|
| PC1 | 0.457 | 0.388 | 0.420 | 0.411 | 0.436 | 0.326 |
| PC2 | −0.782 | −0.108 | 0.006 | 0.197 | 0.437 | 0.384 |
| PC3 | 0.382 | −0.521 | −0.580 | 0.130 | 0.477 | 0.030 |
| PC4 | 0.167 | −0.155 | −0.081 | −0.219 | −0.396 | 0.859 |
| PC5 | −0.081 | 0.425 | −0.575 | 0.605 | −0.338 | 0.037 |
| PC6 | −0.003 | 0.601 | −0.387 | −0.602 | 0.348 | 0.080 |
| Sample No. | Wavelength Position (nm) | Absorption Depth (%) | |
|---|---|---|---|
| Band 5/6/7 | POS-1 1 | 2231 | 0.6362 |
| SIS-5 2 | 2234 | 0.5766 | |
| SIS-7 | 2225 | 0.5163 | |
| PRO-2 3 | 2238 | 0.9247 | |
| PRO-6 | 2199 | 0.8626 | |
| Band 7/8/9 | POS-1 | 2380 | 0.6784 |
| POS-2 | 2340 | 0.6862 | |
| SIS-1 | 2339 | 0.8042 | |
| SIS-4 | 2359 | 0.8237 | |
| PRO-3 | 2328 | 0.8094 | |
| PRO-4 | 2355 | 0.9073 | |
| PRO-5 | 2331 | 0.7561 | |
| PRO-7 | 2321 | 0.8639 |
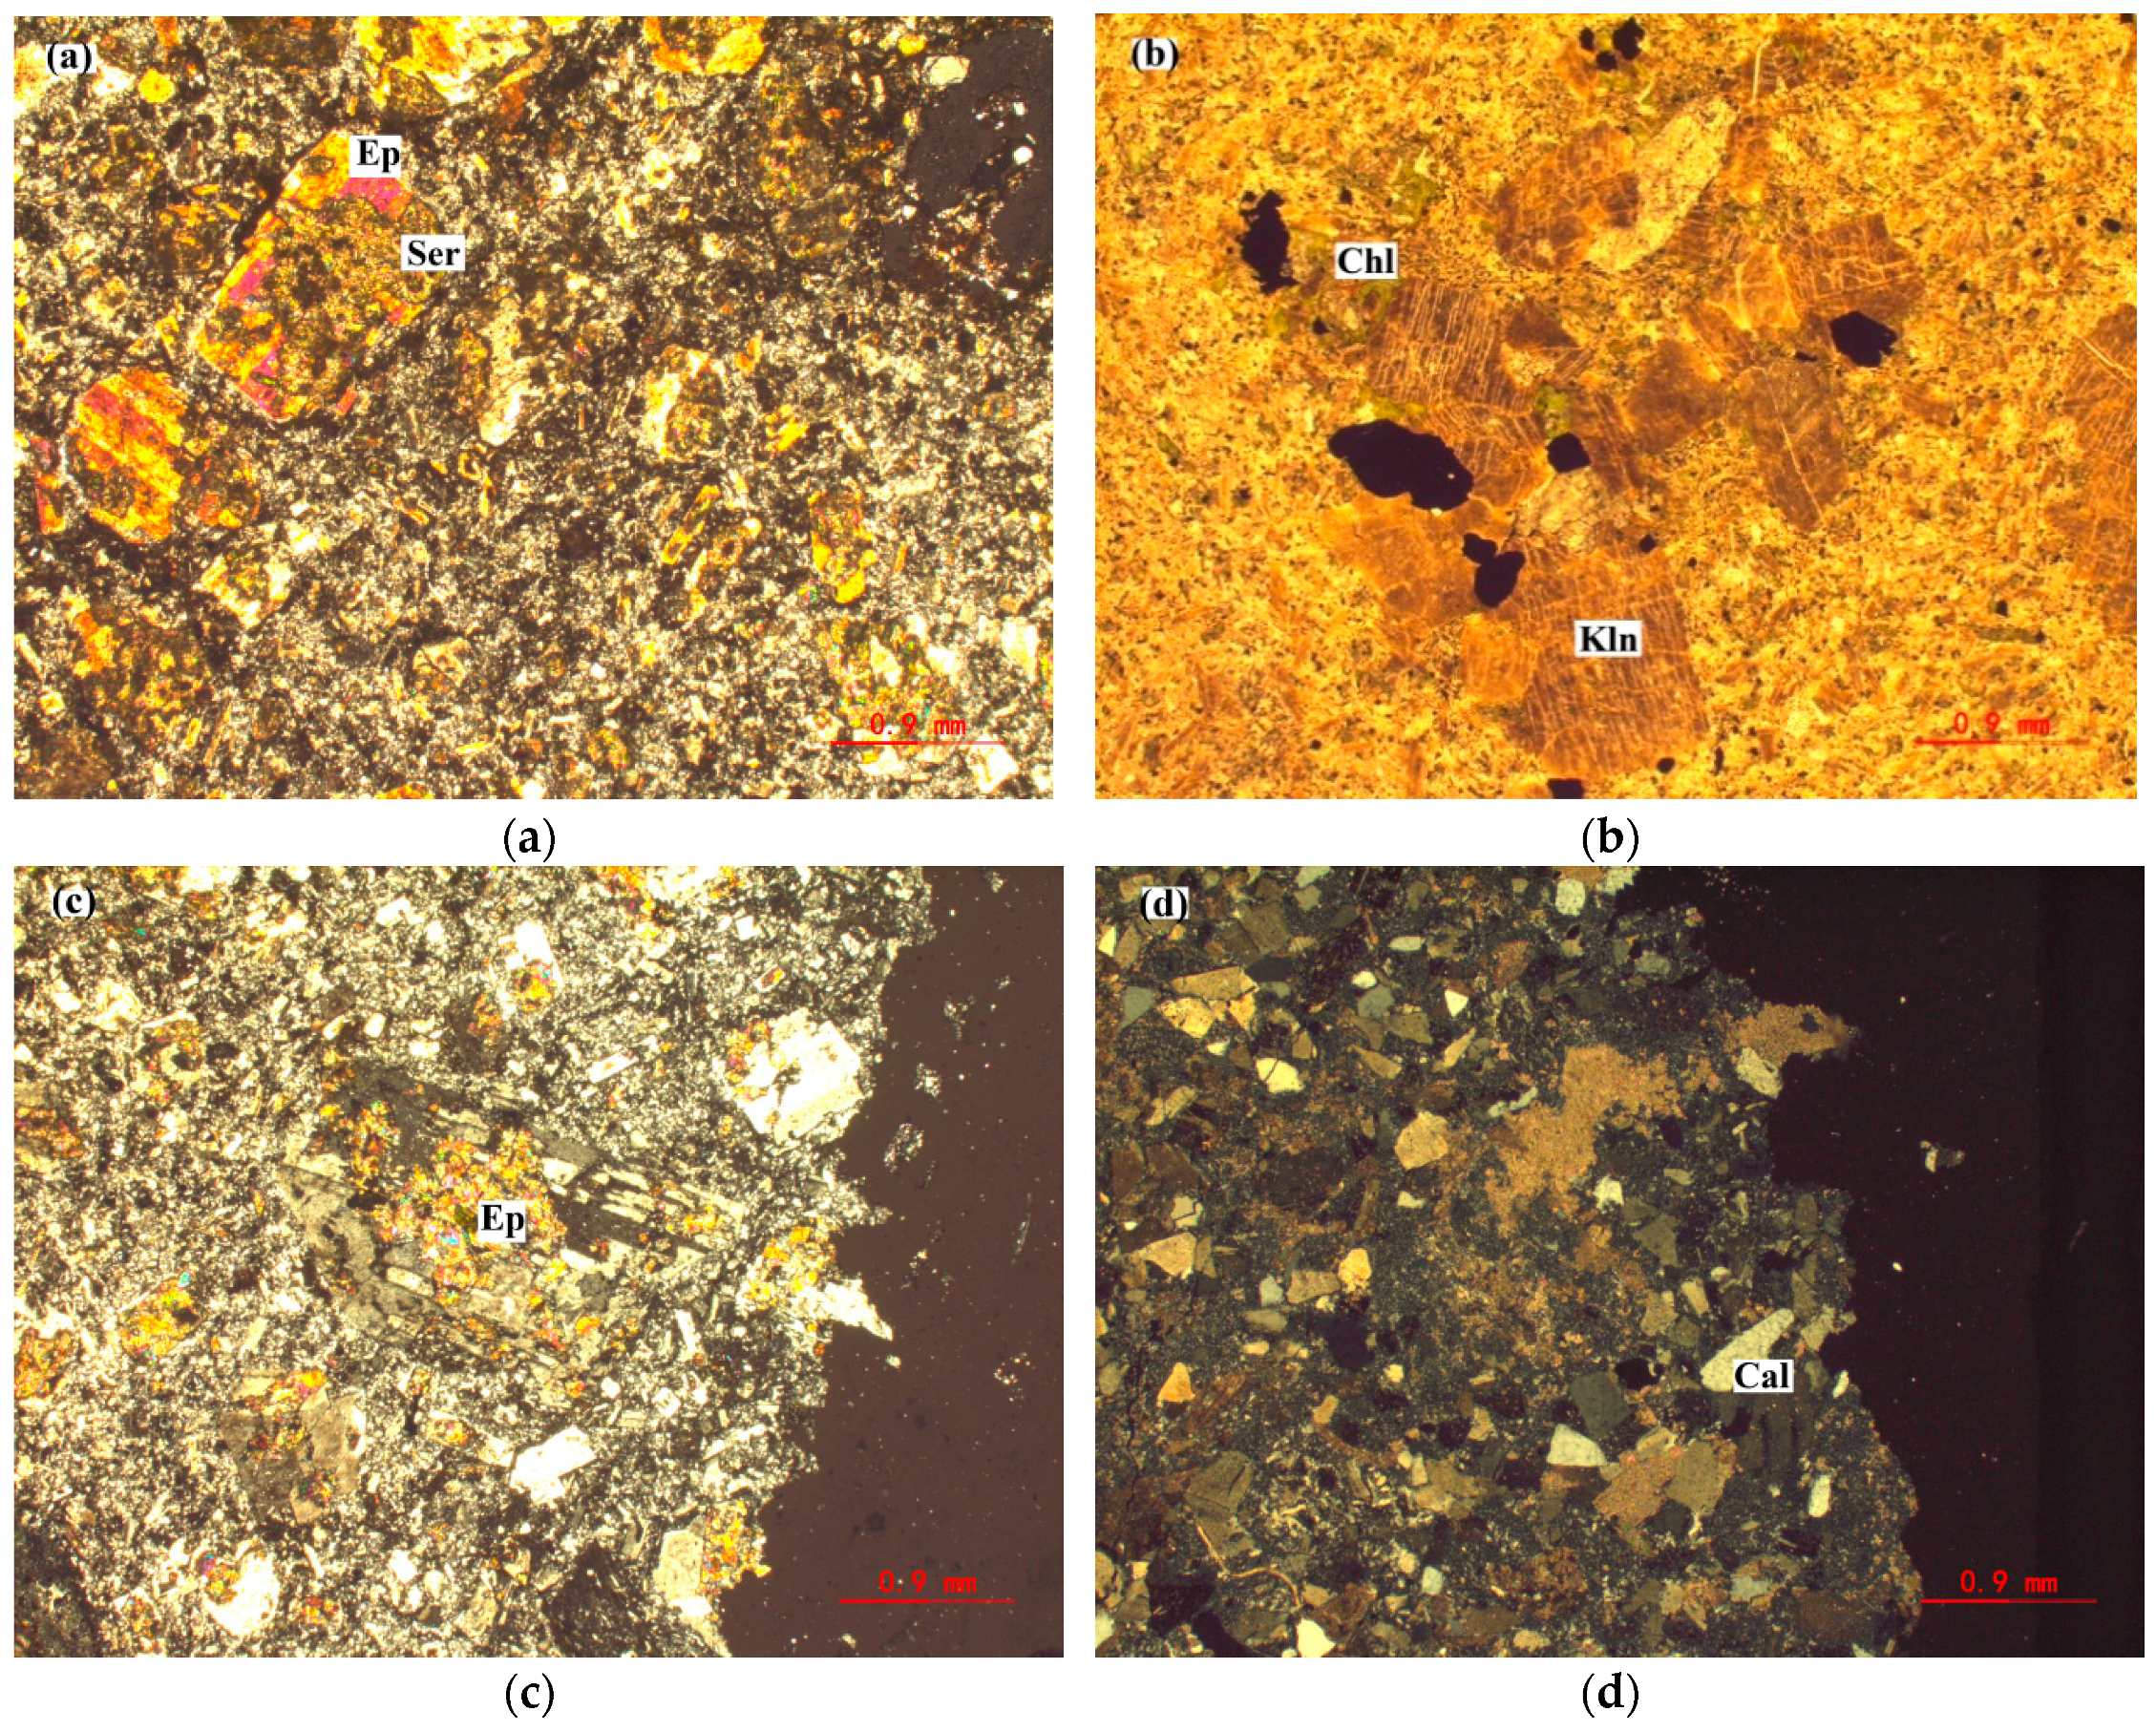
| Sample No. | Petrography |
|---|---|
| POS-1 1 | Feldspars, quartz, rock fragments, and alteration recrystallization into sericite and carbonate aggregates |
| PRO-3 2 | Plagioclase crystals altered to sericite and kaolinite, epidotization and chloritization of rock fragments, vitreous volcanic dust alteration recrystallization into cryptocrystalline feldspar, chlorite and cryptolite aggregates |
| PRO-4 | Sericitization, kaolinization, and chloritization of plagioclase, amygdaloidal structure filled with quartz, chlorite, and carbonate |
| PRO-5 | Sericitization, kaolinization, epidotization, and chloritization of plagioclase, and epidotization and chloritization of opaques |
| PRO-6 | Rock fragments, crystal fragments, and volcanic dust alteration recrystallization into cryptocrystalline feldspar and chlorite |
| PRO-7 | Mild argillaceous of plagioclase, mild argillaceous of potassium feldspar, and chloritization of biotite |
| Sample No. | USGS Matches | Score |
|---|---|---|
| POS-1 1 | muscovi3.spc, illite1.spc | 0.831, 0.821 |
| POS-2 | biotite.spc | 0.566 |
| SIS-1 2 | talc2.spc, chlorit1.spc, dolomit1.spc | 0.597,0.547, 0.495 |
| SIS-2 | goethit1.spc, montmor6.spc | 1, 1 |
| SIS-3 | limonite.spc | 0.523 |
| SIS-4 | dolomit1.spc | 0.915 |
| SIS-5 | goethit1.spc, montmor6.spc, muscovid.spc | 0.991 |
| SIS-6 | goethit1.spc | 0.846 |
| SIS-7 | muscovi8.spc | 0.971 |
| PRO-1 3 | jarosit1.spc | 0.842 |
| PRO-2 | unidentified | |
| PRO-3 | chlorit2.spc | 0.494 |
| PRO-4 | chlorit3.spc | 0.803 |
| PRO-5 | dolomit2.spc, epidote1.spc | 0.846, 0.666 |
| PRO-6 | kaolini1.spc, alunite5.spc, jarosit1.spc | 0.898, 0.862, 0.823 |
| PRO-7 | quartz3.spc | 0.913 |
© 2019 by the authors. Licensee MDPI, Basel, Switzerland. This article is an open access article distributed under the terms and conditions of the Creative Commons Attribution (CC BY) license (http://creativecommons.org/licenses/by/4.0/).
Share and Cite
Wu, M.; Zhou, K.; Wang, Q.; Wang, J. Mapping Hydrothermal Zoning Pattern of Porphyry Cu Deposit Using Absorption Feature Parameters Calculated from ASTER Data. Remote Sens. 2019, 11, 1729. https://0-doi-org.brum.beds.ac.uk/10.3390/rs11141729
Wu M, Zhou K, Wang Q, Wang J. Mapping Hydrothermal Zoning Pattern of Porphyry Cu Deposit Using Absorption Feature Parameters Calculated from ASTER Data. Remote Sensing. 2019; 11(14):1729. https://0-doi-org.brum.beds.ac.uk/10.3390/rs11141729
Chicago/Turabian StyleWu, Mengjuan, Kefa Zhou, Quan Wang, and Jinlin Wang. 2019. "Mapping Hydrothermal Zoning Pattern of Porphyry Cu Deposit Using Absorption Feature Parameters Calculated from ASTER Data" Remote Sensing 11, no. 14: 1729. https://0-doi-org.brum.beds.ac.uk/10.3390/rs11141729