Letter

Are There Sufficient Landsat Observations for Retrospective and Continuous Monitoring of Land Cover Changes in China?

1
School of Earth Sciences and Resources, China University of Geosciences, Beijing 100083, China
2
Key Laboratory of Land Surface Pattern and Simulation, Institute of Geographic Sciences and Natural Resources Research, Chinese Academy of Sciences, Beijing 100101, China
3
School of Biological, Earth and Environmental Sciences, University of New South Wales, Sydney, NSW 2052, Australia
4
Department of Microbiology and Plant Biology, and Center for Spatial Analysis, University of Oklahoma, Norman, OK 73019, USA
*
Author to whom correspondence should be addressed.
Remote Sens. 2019, 11(15), 1808; https://0-doi-org.brum.beds.ac.uk/10.3390/rs11151808
Submission received: 12 June 2019 / Revised: 22 July 2019 / Accepted: 29 July 2019 / Published: 1 August 2019

Abstract

:
Unprecedented human-induced land cover changes happened in China after the Reform and Opening-up in 1978, matching with the era of Landsat satellite series. However, it is still unknown whether Landsat data can effectively support retrospective analysis of land cover changes in China over the past four decades. Here, for the first time, we conduct a systematic investigation on the availability of Landsat data in China, targeting its application for retrospective and continuous monitoring of land cover changes. The latter is significant to assess impact of land cover changes, and consequences of past land policy and management interventions. The total and valid observations (excluding clouds, cloud shadows, and terrain shadows) from Landsat 5/7/8 from 1984 to 2017 were quantified at pixel scale, based on the cloud computing platform Google Earth Engine (GEE). The results show higher intensity of Landsat observation in the northern part of China as compared to the southern part. The study provides an overall picture of Landsat observations suitable for satellite-based annual land cover monitoring over the entire country. We uncover that two sub-regions of China (i.e., Northeast China-Inner Mongolia-Northwest China, and North China Plain) have sufficient valid observations for retrospective analysis of land cover over 30 years (1987–2017) at an annual interval; whereas the Middle-Lower Yangtze Plain (MLYP) and Xinjiang (XJ) have sufficient observations for annual analyses for the periods 1989–2017 and 2004–2017, respectively. Retrospective analysis of land cover is possible only at a two-year time interval in South China (SC) for the years 1988–2017, Xinjiang (XJ) for the period 1992–2003, and the Tibetan Plateau (TP) during 2004–2017. For the latter geographic regions, land cover dynamics can be analyzed only at a three-year interval prior to 2004. Our retrospective analysis suggest that Landsat-based analysis of land cover dynamics at an annual interval for the whole country is not feasible; instead, national monitoring at two- or three-year intervals could be achievable. This study provides a preliminary assessment of data availability, targeting future continuous land cover monitoring in China; and the code is released to the public to facilitate similar data inventory in other regions of the world.

Graphical Abstract

1. Introduction

With increasing human activities in recent decades [1], anthropogenic land cover changes are more frequent and intensive [2], especially in nations with economies in transition. China is a case in point of a country undergoing rapid and dramatic changes in land cover since the adoption of the Reform and Opening-up policy in 1978 [3,4], which drove rapid development of the economy, industrialization, and urbanization [5]. Previous studies show that the extensive croplands of China have been either transformed into built-up areas due to urban expansion, or returned to forests or grasslands as a consequence of ecological restoration projects [5,6], causing a set of consequences on climate, biodiversity, and human well-being [7,8]. Information on the magnitude and spatio-temporal patterns of land cover changes in China is needed to assess feedbacks on the environment and, to that end, consistent temporal and spatial land cover information over time is required [9,10].
Multi-temporal satellite remote sensing allows the observation of land cover change over time [11]. Prior researches showcase the contribution of these data to map and monitor the trajectory of land cover changes in China. For example, Liu et al. [12] produced time series of land use/cover datasets of China (NLCD-China) from 1990 to 2015 at a five-year interval, using Landsat and Chinese satellite imagery; Gong et al. [9,10] generated the 2010 and 2017 global land cover maps (FROM-GLC30, 30-m spatial resolution) from Landsat TM/ETM+ imagery and the 2017 global land cover map (FROM-GLC10, 10-m spatial resolution) using the Sentinel-2 imagery; Chen et al. [13] released the global land cover maps at 30-m spatial resolution (GlobeLand30) for the years 2000 and 2010 using Landsat TM/ETM+ imagery; and Wu et al. [14] produced land cover maps of China (ChinaCover) at 30-m spatial resolution for 2000 and 2010 using Landsat TM/ETM+ and HJ-1 imagery.
All these static land cover datasets have greatly advanced the understanding of land cover changes in China in the past decades, delivering information at fixed time scales (e.g., five-year interval), though they have hardly made efforts on tracking continuous land cover changes overtime [2]. In the context of this research ‘continuous land cover monitoring’ refers to the activity of monitoring land cover changes in a geographical region by the same time interval (e.g., once a year) during a consecutive period (e.g., 1984–2017). Continuous land cover monitoring at national scale is essential to assess environmental impact of rapid development. Static land cover maps (e.g., once a decade, five-year interval) are insufficient to depict spatio-temporal patterns of highly dynamic land cover changes.
Land cover changes can refer to type and/or intensity; land cover can change from one type to another [15,16,17]; and, as well, changes in land condition or intensity of use can occur within a land cover category [16,17]. For the first case, observations from different years (e.g., annual, biennial, three-year intervals) can provide information to characterize the change in land cover type; while series of observations are required for understanding processes of land condition changes. For example, monitoring changes of land cover types associated with anthropic activities, like deforestation or land reclamation, requires a smaller number of observations at specific ‘temporal windows’; unlike phenological changes of a crop, that need more intensive observations within a year.
Developments on big earth data [18] open opportunities for realizing satellite-based retrospective and continuous land cover monitoring, delivering information essential for sustainable land use planning and development. For example, cloud computing platforms such as Google Earth Engine (GEE) integrate all the available Landsat imagery, providing also widely-used classifiers [19], facilitating the rapid statistical analyses on Landsat observations for land cover mapping. As one of the most frequently used satellites for national land cover mapping, the Landsat series offer the longest consecutive land surface observations at 30-m spatial resolution [20]. Advantages of using Landsat-based imagery for land cover monitoring include: (a) Free and open access of all Landsat archive images [21,22]; (b) atmospheric correction and cross-calibration of all Landsat family sensors that deliver analysis-ready surface reflectance data for long-term land cover monitoring [23,24]; and (c) the spatial and temporal assemblage of cross-calibrated multi-spectral data over large geographical regions, resulting in image sets that can be processed to represent land cover over large areas, with an amount of spatial detail unique and indispensable for land-based studies [25]. Profiting from these characteristics, Zhu et al. [26,27] developed two algorithms for retrospective, continuous change detection and classification of land cover, using all available archive Landsat data, and applied them to the United States. For China, the Landsat satellite series cover the period of the policy of Reform and Opening-up (1978 onwards), providing a unique data source for continuous monitoring of human-induced land cover changes arising from these historical development policies. However, one question that remains unanswered is that of whether there are sufficient observations for monitoring and mapping historical and continuous land cover changes over China to advance the understanding of drivers and consequences of land cover changes.
This study assesses the availability of Landsat observations for retrospective and continuous monitoring of changes in land cover types in China, which is of importance for understanding impacts of anthropogenic activities related to land management and policy implementation. To this end, we undertook a quantitative analysis of all available Landsat 5 (L5), Landsat 7 (L7), and Landsat 8 (L8) observations that exist for the country from 1984 to 2017. Firstly, we provide a summary of the total and valid (i.e., without clouds, cloud shadows, and terrain shadows) number of Landsat observations for a 34-year time span. Secondly, we conduct statistical analyses to identify the number of Landsat observations, at a pixel scale, with at least one valid observation in optimal temporal windows for monitoring changes in land cover types. Finally, we conduct a geographic regional analysis to determine time intervals and periods within the 34 years of the analysis, for which Landsat data exists for sub-regional continuous land cover monitoring in China.

2. Materials and Method

2.1. Landsat Imagery

Given the impact of atmospheric effects on the true surface reflectance values of features, the use of surface reflectance data is recommended for detecting and monitoring land cover changes [28]. Hence, all L5/7/8 16-day surface reflectance images available in the GEE archive covering China from 1984 to 2017 were used (345,946 images, 270 terabytes in size). GEE provides ‘analysis ready data’, including atmospheric corrections, geometric corrections, and cross-calibrations among different Landsat sensors [23,29,30]. It further includes a CFmask mask (for masking of clouds, cloud shadows, water, and snow) and a per-pixel saturation mask for identifying invalid observations.

2.2. Identifying Valid Landsat Observations

Cloud coverage is the most obvious challenge to the application of Landsat data, particularly in the subtropics and tropics, which have been widely reported in previous studies [31,32,33]. Pixels of clouds, cloud shadows, and terrain shadows in individual Landsat scenes were further removed. In addition, the scan line corrector (SLC)-off no-data stripes in individual L7 scenes were excluded as well. The GEE archive contains a data Quality Assessment (QA) band of each Landsat scene, determined via CFmask [34,35,36]. The masks of clouds, cloud shadows, water, snow, and Landsat 7 SLC-off no-data stripes are included in the QA band. Hence, we set a threshold within the QA to identify and remove clouds, cloud shadows, and L7 SLC-off no-data stripes. In addition, terrain shadows were identified and removed using solar azimuth and zenith angles from the Landsat image metadata, and a digital elevation model derived from the Shuttle Radar Topography Mission [37]. Output pixels from this workflow were considered as valid observations with clear views that could be used for monitoring retrospective land cover dynamics.

2.3. Statistics of Total and Valid Landsat Observations

Firstly, in terms of the Landsat scenes, we counted yearly and monthly total numbers of Landsat images acquired over China from 1984 to 2017. Secondly, for individual Landsat pixels within China, the numbers of yearly/monthly total and valid observations from L5/7/8 from 1984 to 2017 were estimated. Finally, a national level estimation was conducted using the regionally average observations of total and valid Landsat observations using Equation (1):
A v e r a g e s e n s o r = p i x x l N n p i x x l s e n s o r N  
where A v e r a g e s e n s o r is the regionally averaged number of total/valid observations from the sensor {L5, L7, L8} in one specific period (year or month); n p i x x l s e n s o r is the number of total/valid observations from sensor {L5, L7, L8} in one pixel; and N is the total number of Landsat pixels within the entire China.

2.4. Potential for Continuous Land Cover Monitoring Using Landsat Observations

Previous studies highlight the significance of obtaining sufficient valid satellite observations for land cover monitoring in tropical and sub-tropical regions and for specific land uses [38,39,40], arguing that different monitoring activities and study areas may tolerate different quantities of cloud cover [33]. Working under the premise of homogeneity of land surface attributes within the same land cover category, a study area could be considered as a cloud-free region where land cover monitoring can be conducted if more than 95% of the pixels making up the ‘region’ have clear sky observations in a given time [39]. As such, a criterion of 95% of pixels with clear sky observations in a region was used to determine whether sufficient observations for land cover monitoring existed. That is to say,
IF “the percentage of Landsat pixels with at least one valid observation in a region was greater than, or equal to, 95% in a given time”,
THEN “sufficient valid observations to support land cover monitoring were available”.
Image selection within optimal image acquisition times (OIATs) is important for land cover monitoring. From the perspective of temporal windows, and in order to have a better interpretation of vegetation covers, a criterion was determined for the ‘acquisition date’ of remote sensing images to be within the growing season. Previous research establishes that the spatial patterns of the growing season beginning and end dates significantly correlate with spatial patterns of mean air temperatures in spring and autumn, respectively [41]. The OIATs for land cover mapping in different regions of China determined by Zhang et al. [42] consider six geographical regions (Figure 1 and Table 1). Table 1 shows the OIAT selected for each region based on Zhang et al. [42], to evaluate their potentials for continuous land cover monitoring.
For each region, the yearly percentages of Landsat pixels with at least one valid observation during the corresponding OIAT (Table 1) from 1984 to 2017 was calculated. If yearly percentages were consistently greater than or equal to 95% during a period, annual Landsat satellite-based land cover monitoring in this region was deemed feasible during the set period. If the premise failed to be fulfilled, the pixel percentages for each two-year interval during 1984–2017 (34 years, 17 epochs) were calculated for each image composite, to determine whether the observations could support continuous land cover monitoring in the region at two-year intervals. If the two-year data composite failed to meet the criterion established for long-term continuous land cover monitoring, the pixel percentages at three-year intervals during 1985–2017 (33 years, 11 epochs) and four-year intervals during 1986–2017 (32 years, 8 epochs) were calculated to ascertain time periods during which the observations could support long-term continuous land cover monitoring. It is worth noting that if OIATs by data composite met different time intervals (e.g., two-year and three-year intervals), the shortest time interval was chosen as the best scenario for continuous land cover monitoring.

3. Results

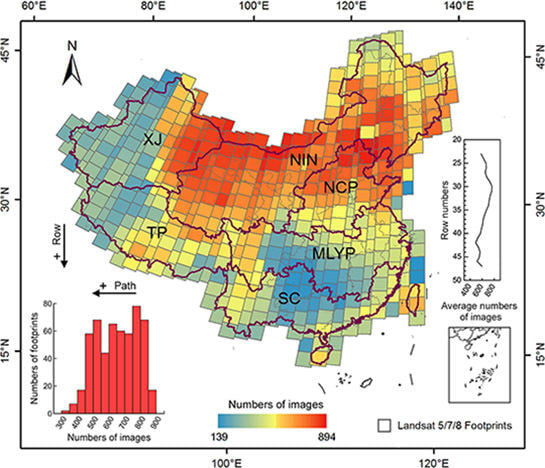
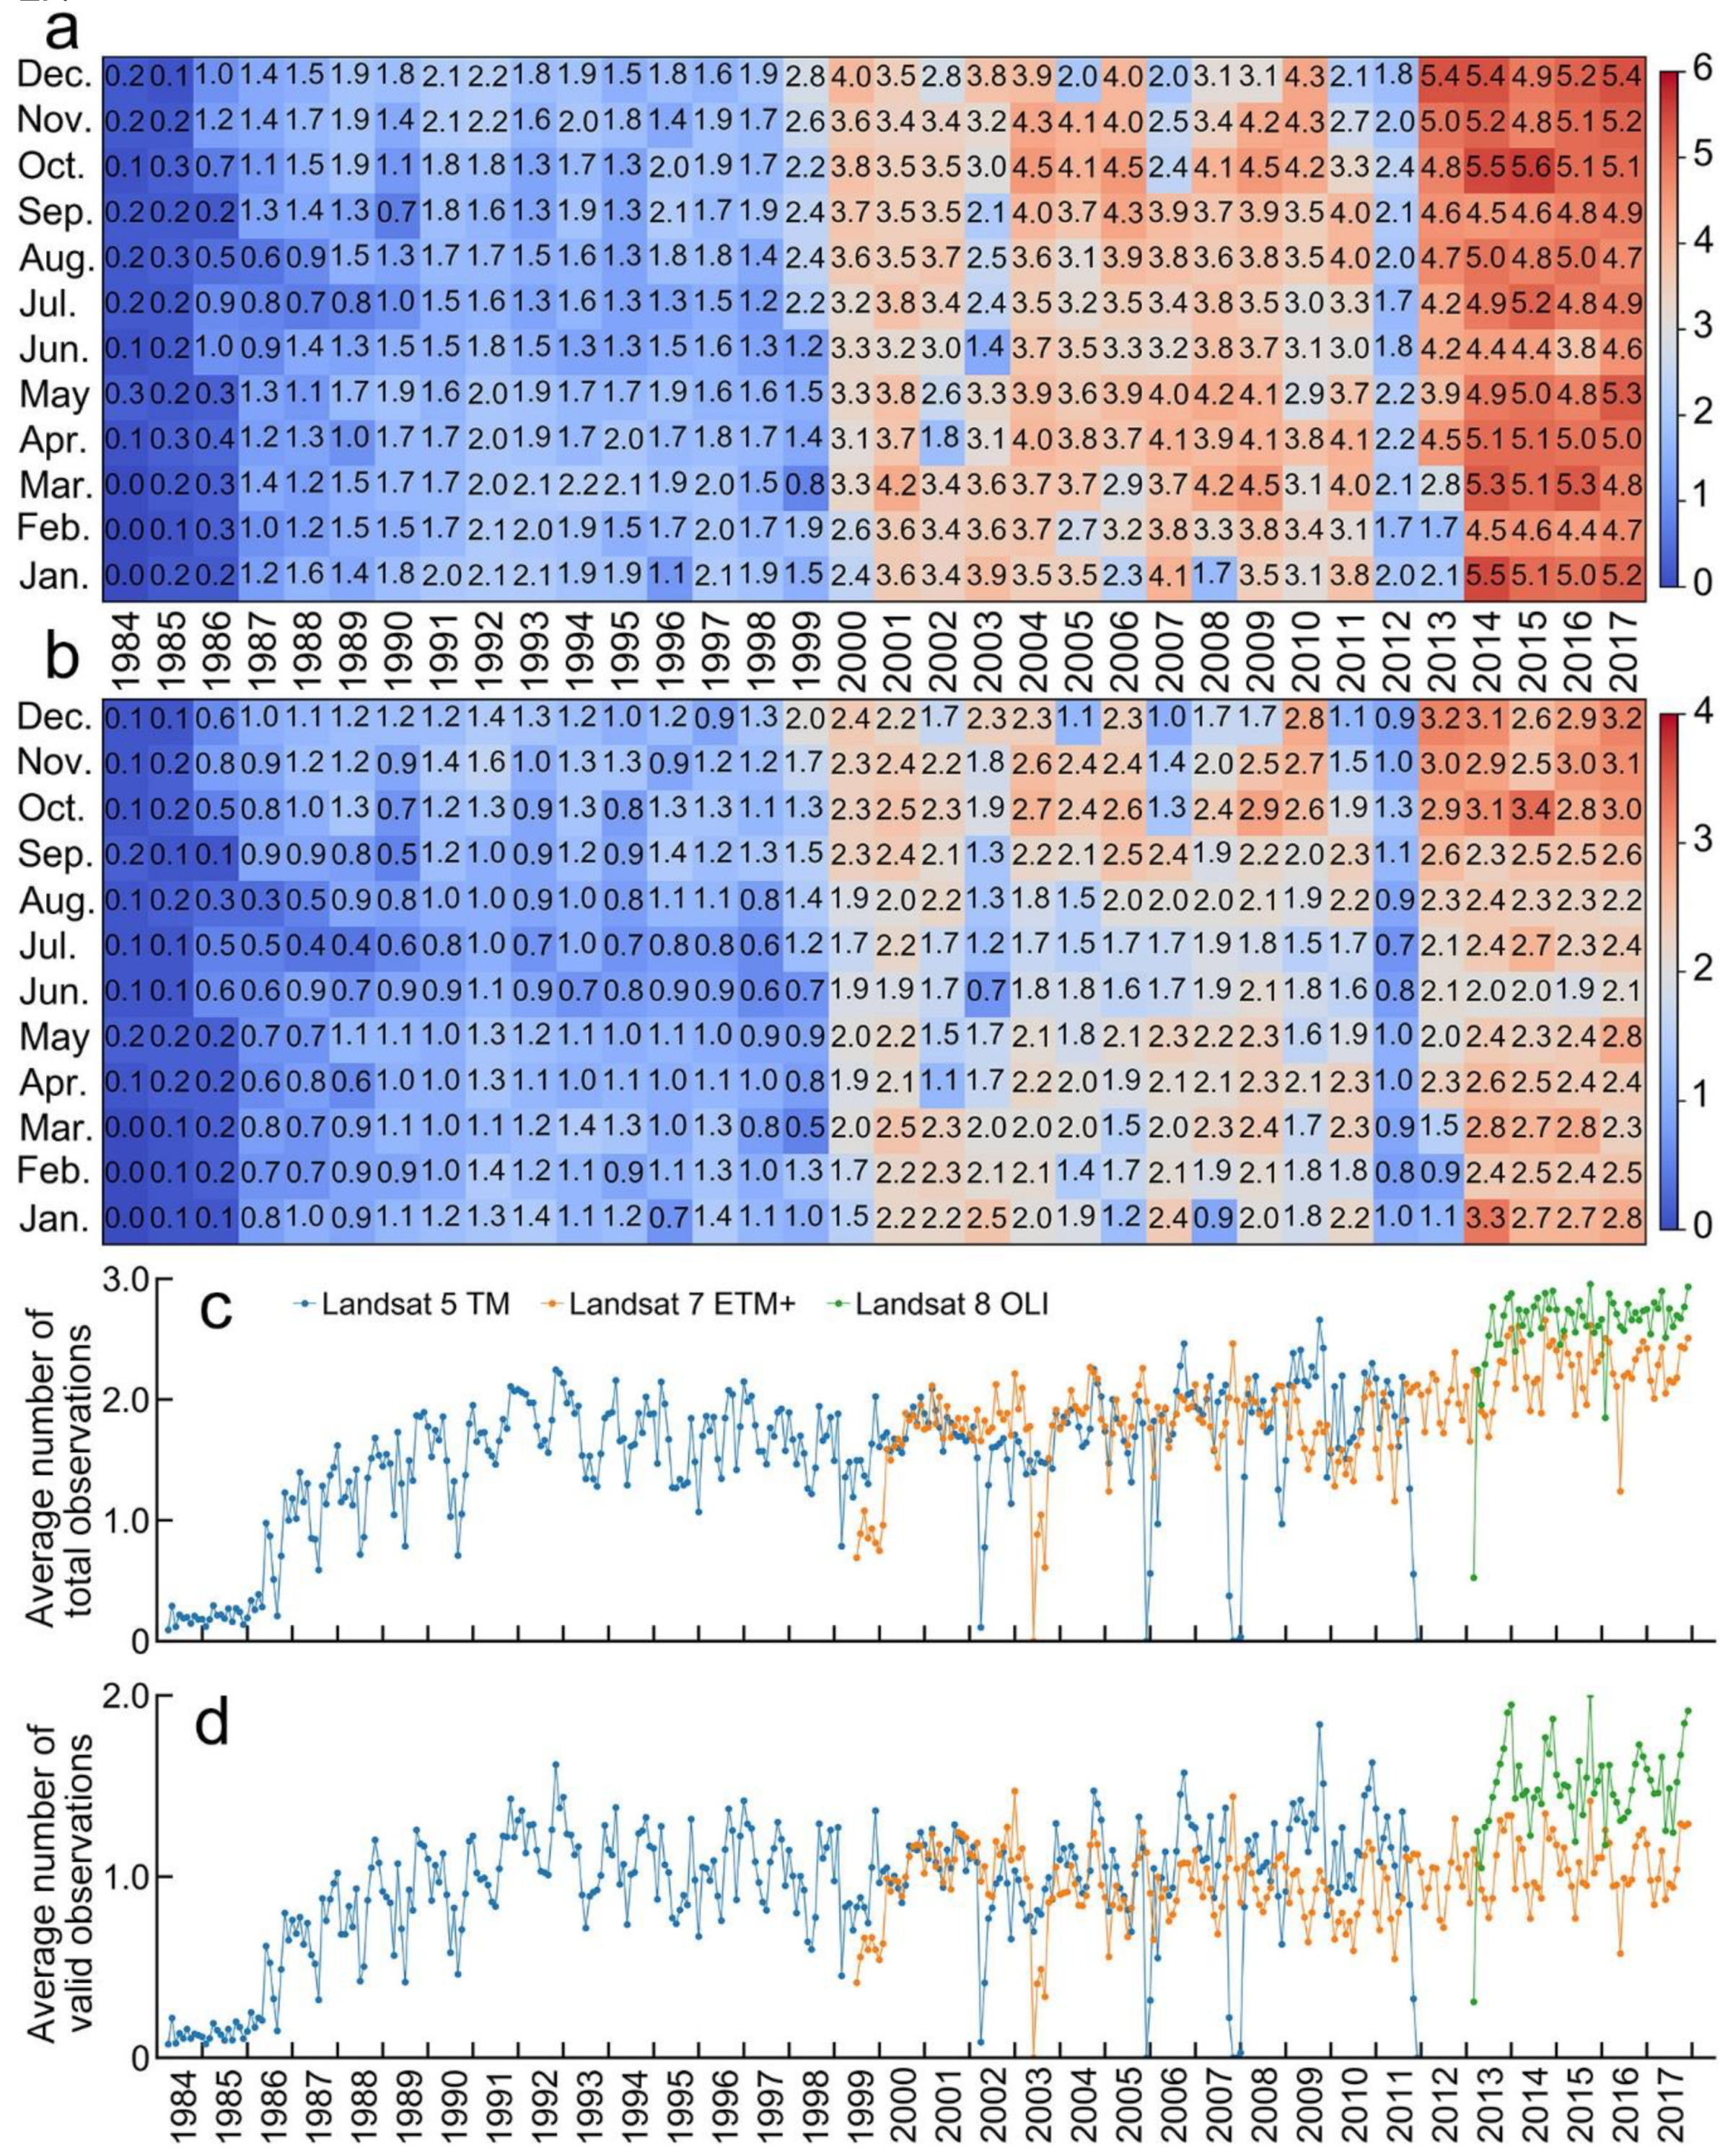
3.1. Statistics of Landsat Observations in China from 1984 to 2017

This section provides a brief description of yearly/monthly Landsat data statistics from individual scenes and at pixel level. The amount of annual Landsat imagery covering the territory of China triplicated from the early 1990s to 2017: from ~5000 images/year in 1991–1999, to ~10,000 images/year in 2000–2011, and to ~15,000 images/year in 2013–2017 (Text S1). A per-satellite analysis shows that L8 gathered more images per year, followed by the L7 and L5 (Text S1). Corresponding statistics at monthly scale are shown in Text S1.
Pixel-based statistics of observation numbers show that the yearly average number of total/valid Landsat observations generally increased from ~20/~10 in 1991–1999, to ~40/~20 in 2000–2011, and ~60/~30 in 2014–2017. Among the three sensors, the annual average number of total/valid observations from L8 were the highest, ranging from 22.75 to 32.67/13.38 to 18.77, respectively; followed by those from L7 (5.31 to 27.63/3.52 to 13.37) and L5 (1.63 to 25.73/1.13 to 15.50) (Text S2). Furthermore, the monthly average number of observations generally ranged from 0.1 to 2.0 (total) and 0.1 to 1.0 (valid) during 1984–1999 (Figure 2a,b). Since the launch of L7 in April 1999, the monthly average number of total/valid observations increased, ranging from 2.0 to 4.0 total observations, and from 1.0 to 3.0 valid observations. The breakdown of L5 in November 2011 caused a decrease of the monthly average observations in 2012, ranging from 1.0 to 2.0 (total) and from 0.1 to 1.0 (valid) observations. The launch of L8 in February 2013 raised dramatically the monthly average observations, ranging from 4.0 to 5.0 (total) and from 2.0 to 3.0 (valid) observations. Figure 2c,d provide a comparative illustration of the three satellites; the monthly average number of total/valid observations of L8 are the highest, and there is subtle difference between that of L5 and L7.
The spatial distributions of total and valid observations from Landsat satellite series (L5/7/8) in China from 1984 to 2017 vary (Figure 3a,b). A larger number of observations existed for North China than for South China. The average number of total and valid observations at one-degree latitude intervals within China increased with latitude (i.e., a larger number of total and valid observations are available at higher geographic latitudes). The per-pixel analysis shows that most pixels had a number of 400–1700 total and 100–1200 valid observations (Figure 3c,b). Moreover, patterns of total and valid Landsat observations change over different months (Text S3 and S4). Similarly, different satellites showed different spatial patterns of total and valid observations (Text S5).

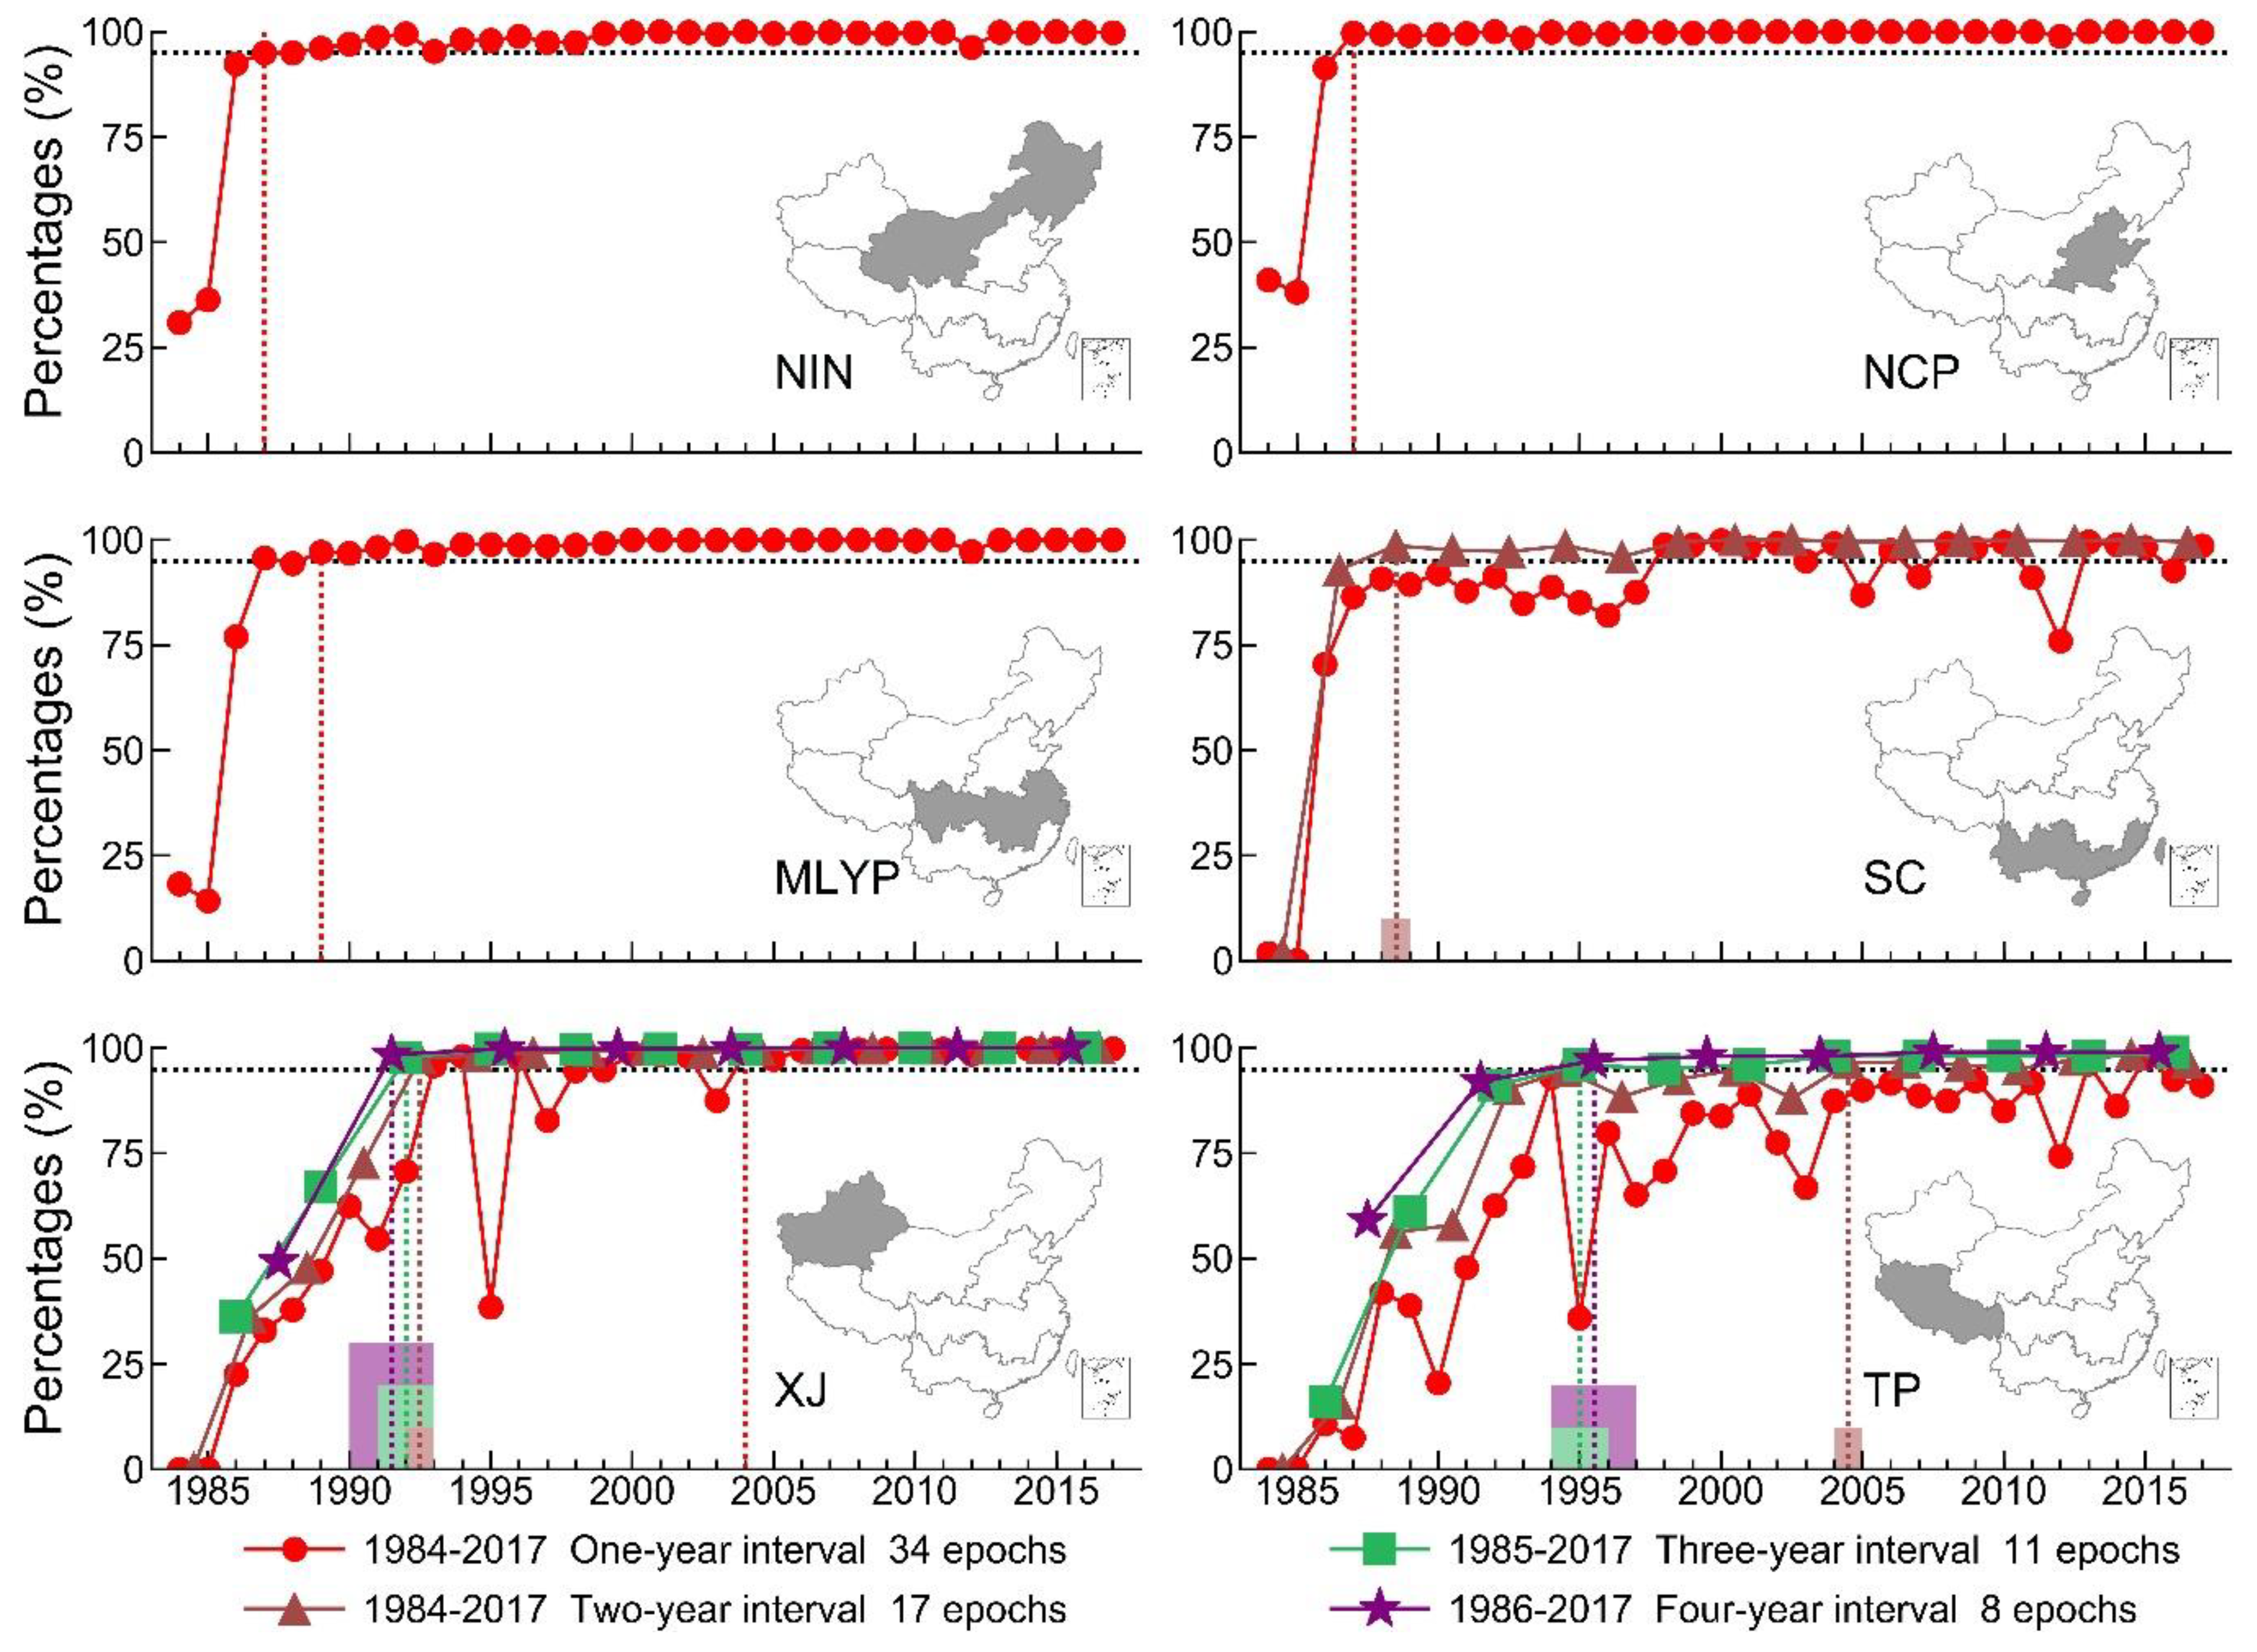
3.2. Feasibility of Retrospective, Continuous Land Cover Monitoring in China Using Landsat Observations

Figure 4 shows the yearly percentages of Landsat pixels from 1984 to 2017 with at least one valid observation during selected OIATs for each of the six regions considered (Table 1). Annual percentages were consistently greater than or equal to 95% in NIN (95.0–100%) and NCP (98.5–100%) for the period 1987–2017, and lower than 95% prior to 1987 (Figure 4a,b). For MLYP, the period 1989–2017 exhibited annual percentages consistently greater than or equal to 95% (96.6–100%), lowering for scenes acquired prior to 1989 (Figure 4c). For SC, yearly percentages were lower than 95% for 1984–1997 (0–92.0%) and fluctuated close to 95% during 1998–2017 (76.0–99.8%) (Figure 4d). Analysis at two-year intervals from 1984 to 2017 showed pixel percentages consistently greater than or equal to 95% in the epochs during 1988–2017 (96.0–100%), and lower than 95% prior to 1988. Yearly percentages were consistently greater than or equal to 95% in the region of XJ during 2004–2017 (97.3–99.8%) while less than, or fluctuating around, 95% before 2004 (0–98.5%) (Figure 4e); per-pixel composites at two-, three-, and four-year intervals for the same region showed percentages consistently greater than or equal to 95% in the epochs during 1992–2017 (97.6–100%), 1991–2017 (97.7–100%), and 1990–2017 (98.4–100%), respectively. For TP, yearly percentages were lower than 95% during 1984–2017 (except for 2013 and 2015) (Figure 4f). Per pixel composite analysis revealed values greater than or equal to 95% between 2004–2017 (95.0–98.4%) at two-year intervals, and during 1994–2017 with three- (95.0–99.0%) and four-year (97.0–99.0%) intervals.
Following the criterion that reasonable observations with percentages greater than or equal to 95% in a region in a given time meet the data requirement for land cover monitoring, we estimated periods and time intervals where retrospective, continuous land cover monitoring using Landsat data is possible in China. The results show sufficient Landsat observations exist to conduct inter-annual land cover monitoring in NIN, and the NCP from 1987 to 2017, while this availability decreases by two years (i.e., 1989–2017) in the MLYP. SC has enough observations to support continuous land cover monitoring retrospective to 1988–2017 at two-year intervals; while land cover monitoring is possible for the region of XJ on an annual basis during 2004–2017, and at two-year intervals for the period 1992–2017. The TP has insufficient observations for annual land cover monitoring, though it could support continuous land cover monitoring at two-year intervals (for 2004–2017) and three-year intervals (for 1994–2017).
In summary, statistical analysis shows that existing archive Landsat observations are insufficient for annual land cover monitoring of the entire country; though the task could be undertaken if two-year intervals are considered for the period 2004–2017. Retrospective and continuous (as defined in this research) land cover monitoring can be undertaken at three-year intervals for the epoch of 1994–2017.

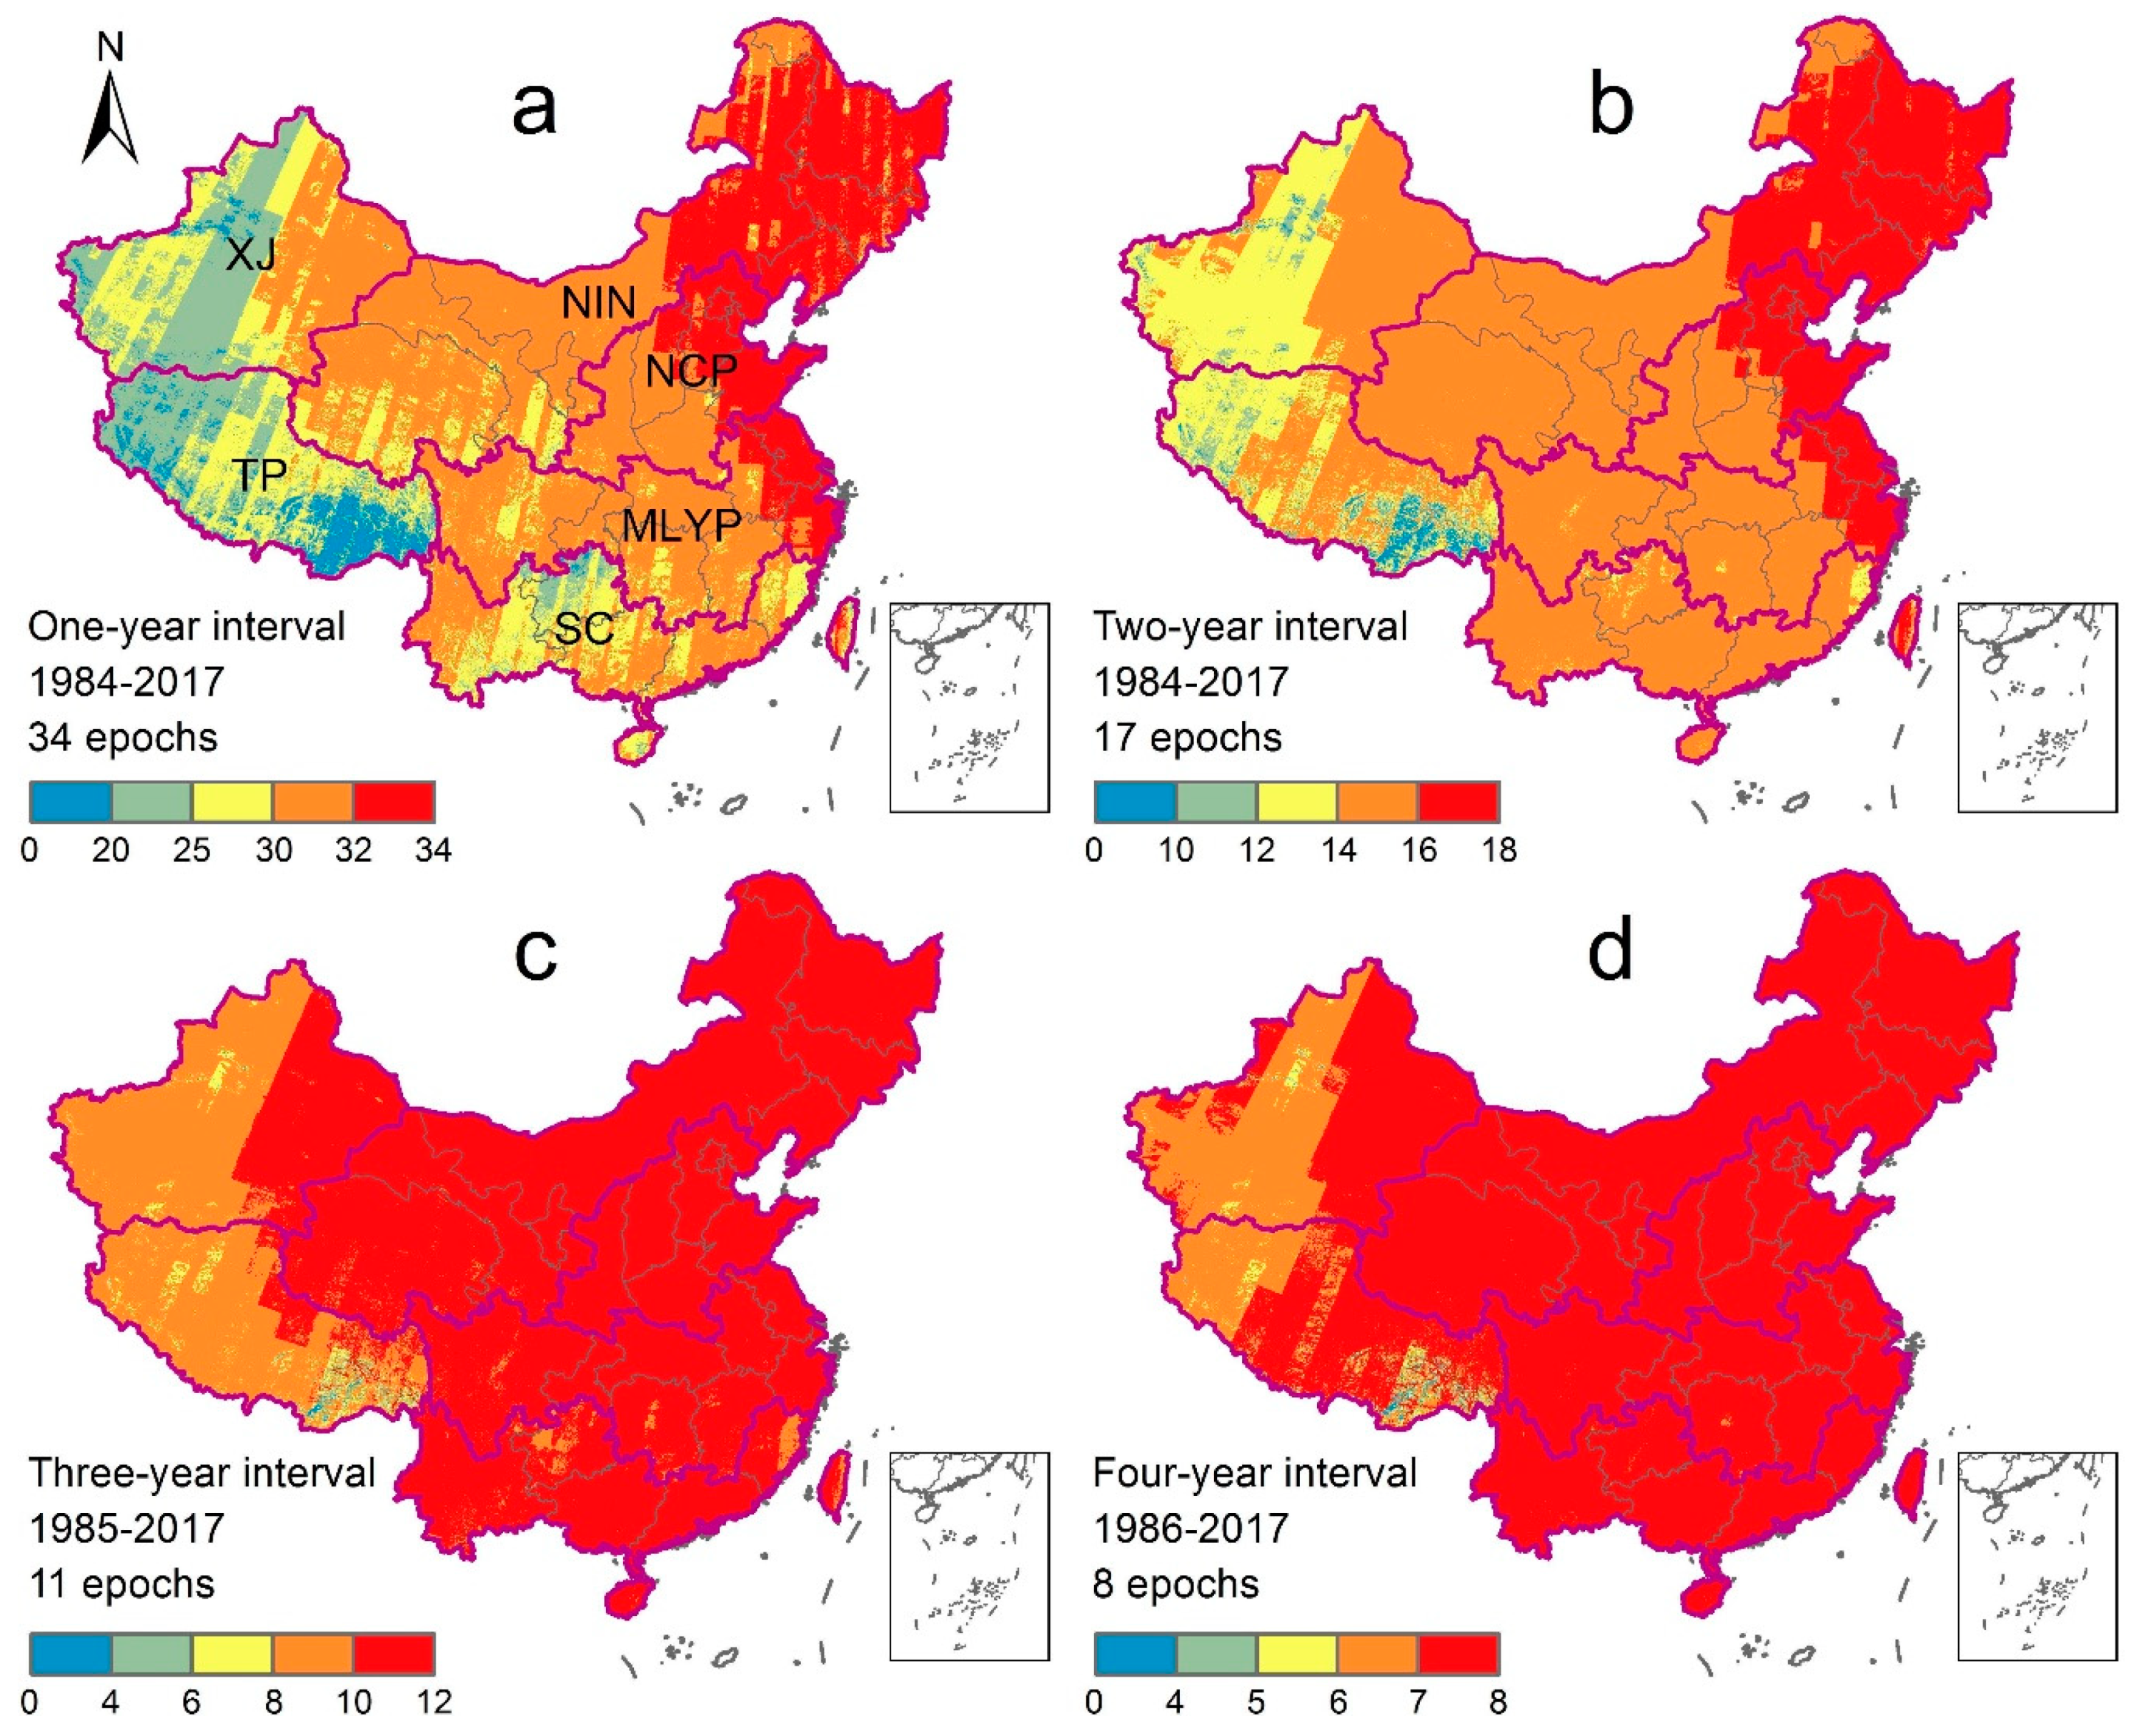
3.3. Spatial Patterns of Landsat Observations in Support of Continuous Land Cover Monitoring in China

Figure 5 illustrates the numbers of epochs within which at least one valid observation for an individual Landsat pixel exists. More epochs with sufficient observations to support land cover monitoring occur in eastern parts of China, followed by central and western parts. Enough satellite observations exist to support land cover monitoring for at least 31 years (over 1984 to 2017) in most parts of NIN, NCP, and MLYP. This result is consistent with the analysis presented in Section 3.2 (Figure 5a). The eastern parts of NIN, NCP, and MLYP have more years (>32 years) of ‘sufficient’ satellite observations for annual land cover monitoring, as compared to central and western parts. The lowest number of years with enough frequency of observations for annual land cover monitoring correspond to the TP and western parts of XJ.
Retrospective land cover monitoring at two-year intervals is possible for at least 15 epochs during 1984–2017, for most parts of the NCP, NIN, MLYP, SC, and eastern parts of XJ (Figure 5b). Our results show that enough Landsat observations exist for land cover monitoring in the eastern parts of NIN, NCP, and MLYP on 17 epochs (1984–2017). Land cover monitoring at three-year intervals is feasible in NIN, NCP, MLYP, SC, and eastern parts of XJ from 1985 to 2017 (11 epochs), while nine epochs (Figure 5c) fulfill the requirements in the TP and western parts of XJ. Continuous land cover monitoring at four-year intervals could be accomplished for eight occasions between 1986 to 2017 in NIN, NCP, MLYP, SC, eastern parts of XJ, and central parts of TP, while that is reduced to seven instances in western parts of XJ and northern parts of TP (Figure 5d).

4. Discussion

4.1. Pixel-Based vs. Scene-Based Landsat Observation Analyses

Scene-based analyses of Landsat data availability have been conducted in previous studies. For example, Asner et al. [43] reported that annual observations from L5 are possible in southern parts of the Brazilian Amazon basin, while impossible in the northern parts by analyzing cloud cover probability of images collected between 1984 and 1997. Xiao et al. [3] suggested that the L8 imagery in China meets the data requirements for land surface monitoring. However, these scene-based statistics fail to provide comprehensive estimates of observations based on whole scenes and per-pixel. Moreover, previous studies illustrated the implications of very conservative criteria for selecting cloud cover-free images based on ‘whole scene statistics’. It has been found that Landsat images with more than 40% cloud cover can contain almost 20% of the total clear observations [44]. Zhu et al. [26] documented that selecting Landsat images with less than 10% cloud cover for continuous land cover change detection results in omitting more than 50% of the total clear observations. Thus, pixel-based statistical analyses could provide more accurate information of Landsat data availability for land cover monitoring as compared to scene-based analyses.
Using pixel-based analyses for L7 imagery only, Ju et al. [45] reported that the requirement of at least one cloud-free observation in a year is feasible for the conterminous USA. However, these results could be severely constrained by cloud coverage and data availability if projected to global-scale applications. In this study, we provide for the first time a comprehensive investigation on all archive Landsat-satellite series data available for China, by using pixel-based analyses to ascertain whether sufficient observations exist at country and regional level for retrospective and continuous monitoring of land cover changes.

4.2. Observation Analyses from the Optimal Image Acquisition times (OIATs) to Time Series

This paper assumed one valid observation in the OIATs (Table 1) would be sufficient for land cover mapping in a certain year (Section 2.4). However, a single observation could miss critical features for land cover mapping. For example, it is challenging to accurately separate croplands from grasslands in the Farming-Pastoral Ecotone using only one valid observation in a year due to the lack of phenological information. Thus, to reduce and eliminate these uncertainties, the spatial, temporal, and spectral resolutions of satellite remote sensing observations need to be improved in the future by using virtual constellation of multi-satellites (e.g., Landsat + Sentinel-2). This is possible in the context of open data cubes (ODCs).
Overtime, studies of land cover changes have evolved from simplistic representations of changes using two points in time observations, to more complex time series of observations across different spatial and temporal scales [46], because the latter can depict temporal trends and distill complex change trajectories. By considering the spectral history of individual pixels on the ground as a time series, more nuanced knowledge of land cover changes is possible [28]. Tracking changes through time series has always been central to the Landsat mission, and a revolution of time series analyses that make full use of all available Landsat records to monitor land cover changes have been seen recently [35].
However, the trade-off between resolvable spatial detail and observation frequency makes it difficult to acquire Landsat data with both high spatial and temporal resolutions [47,48], especially in regions with high frequency of cloud cover. Given this, virtual constellation of Landsat and other sensors [46] could provide observations with both high spatial and temporal resolutions for time series analyses [49]. For example, integrating Landsat 8 and Sentinel-2 could enable approximately 60 observations per year for a track of land [50]. Other sensors like the Moderate Resolution Imaging Spectroradiometer (MODIS), Satellite Pour l’Observation de la Terre (SPOT), and China-Brazil Earth Resource Satellite (CBERS) provide important complementary observations as well. In terms of image classification algorithms, they have advanced from supervised or unsupervised pixel-based classifiers using single imagery before the 2000s, to machine learning classifiers that can include dense time series of observations [18]. The ongoing progresses in machine learning algorithms and the development of deep learning technologies are delivering more detailed information of land cover changes from satellite remote sensing [18].
Although significant advances have been achieved in the access of remote sensing observations and classification algorithms, it is still challenging to conduct time series applications over large geographic areas by making full use of these resources. In this regard, high-performance cloud computing platforms such as GEE and Amazon Web Services (AWS) are meeting demands for processing of large geospatial datasets with high efficiency. Global maps of forest cover (2000–2012) [51] and water bodies (1984–2015) [52] are examples of cloud-based computing maximizing the use of satellite image time series, and advanced classification algorithms for long-term tracking land cover changes.

5. Conclusions

This study is the first of its kind in that it provides comprehensive quantitative information of archive satellite data from the Landsat series (L5, 7, and 8) to support retrospective and continuous monitoring of land cover changes in China since 1984. Our results evidence that Landsat observations in China are not sufficient to support retrospective annual land cover monitoring over the whole country from 1984 to 2017, while it could meet the data requirement for continuous land cover monitoring from 2004 to 2017 at two-year interval, and from 1994 to 2017 at three-year interval. Regional scale analysis evidenced that sufficient Landsat observations exists for annual land cover monitoring in Inner Mongolia, the northeast and northwest regions of China, and the North China Plain over 20 years (1987–2017). These findings can guide selection of data sets for retrospective satellite-based monitoring of land cover dynamics over vast areas, anticipating where limitations may exist for annual land-based monitoring. The latter can provide evidence of ecological impacts and feedbacks associated with historical government decisions, such as China’s Reform and Opening-up policy.

Supplementary Materials

The following are available online at https://0-www-mdpi-com.brum.beds.ac.uk/2072-4292/11/15/1808/s1, Figure S1: Yearly and monthly amounts of L5, 7, and 8 surface reflectance images in China from 1984 to 2017, Figure S2: Monthly amounts of L5, 7, and 8 surface reflectance images in China from 1984 to 2017, Figure S3: Yearly average numbers of total and valid observations of L5, 7, and 8 in China from 1984 to 2017, Figure S4: Spatial distributions of total Landsat observations in January–December, Figure S5: Spatial distributions of valid Landsat observations in January–December, Figure S6: Spatial distributions of total and valid observations of L5, 7, and 8 in China from 1984 to 2017, Text S1: Yearly and Monthly Numbers of Landsat Imagery in China, Text S2: Yearly Average Numbers of Total and Valid Landsat Observations in China, Text S3: Spatial Distributions of Total Landsat Observations in China in Different Months, Text S4: Spatial Distributions of Valid Landsat Observations in China in Different Months, Text S5: Spatial Distributions of Landsat Observations in China in Terms of Different Sensors.

Author Contributions

J.D., J.L., and X.X. conceived and designed the experiments; Y.Z. performed the experiments; J.D., Y.Z., J.L., G.M., W.S., N.Y., G.Z., and X.X. analyzed the data; J.D., Y.Z., and G.M. wrote the paper.

Funding

This study is funded by the Strategic Priority Research Program (XDA19040301) and Key Research Program of Frontier Sciences (QYZDB-SSW-DQC005) of Chinese Academy of Sciences (CAS), and the “Thousand Youth Talents Plan”.

Acknowledgments

We thank Yanyan Pei, Jiadi Yin, Rui Zhao, Arifuzzaman Khondakar, and Mrinal Singha for their valuable comments during the study.

Conflicts of Interest

The authors declare no conflict of interest.

References

  1. Armesto, J.J.; Manuschevich, D.; Mora, A.; Smith-Ramirez, C.; Rozzi, R.; Abarzua, A.M.; Marquet, P.A. From the Holocene to the Anthropocene: A historical framework for land cover change in southwestern South America in the past 15,000 years. Land Use Policy 2010, 27, 148–160. [Google Scholar] [CrossRef]
  2. Dong, J.W.; Kuang, W.H.; Liu, J.Y. Continuous land cover change monitoring in the remote sensing big data era. Sci. China Earth Sci. 2017, 60, 2223–2224. [Google Scholar] [CrossRef]
  3. Xiao, C.; Li, P.; Feng, Z.; Wu, X. Spatio-temporal differences in cloud cover of Landsat-8 OLI observations across China during 2013–2016. J. Geogr. Sci. 2018, 28, 429–444. [Google Scholar] [CrossRef]
  4. Xu, N.; Gong, P. Significant coastline changes in China during 1991–2015 tracked by Landsat data. Sci. Bull. 2018, 63, 883–886. [Google Scholar] [CrossRef]
  5. Liu, J.; Kuang, W.; Zhang, Z.; Xu, X.; Qin, Y.; Jia, N.; Zhou, W.; Zhang, S.; Li, R.; Yan, C.; et al. Spatiotemporal characteristics, patterns, and causes of land-use changes in China since the late 1980s. J. Geogr. Sci. 2014, 24, 195–210. [Google Scholar] [CrossRef]
  6. Chang, B.; Li, R.; Zhu, C.; Liu, K. Quantitative Impacts of Climate Change and Human Activities on Water-Surface Area Variations from the 1990s to 2013 in Honghu Lake, China. Water 2015, 7, 2881–2899. [Google Scholar] [CrossRef] [Green Version]
  7. Friedl, M.A.; McIver, D.K.; Hodges, J.C.F.; Zhang, X.Y.; Muchoney, D.; Strahler, A.H.; Woodcock, C.E.; Gopal, S.; Schneider, A.; Cooper, A.; et al. Global land cover mapping from MODIS: Algorithms and early results. Remote Sens. Environ. 2002, 83, 287–302. [Google Scholar] [CrossRef]
  8. Foley, J.A.; Ruth, D.; Asner, G.P.; Carol, B.; Gordon, B.; Carpenter, S.R.; Chapin, F.S.; Coe, M.T.; Daily, G.C.; Gibbs, H.K.; et al. Global consequences of land use. Science 2005, 309, 570–574. [Google Scholar] [CrossRef]
  9. Gong, P.; Wang, J.; Yu, L.; Zhao, Y.C.; Zhao, Y.Y.; Liang, L.; Niu, Z.G.; Huang, X.M.; Fu, H.H.; Liu, S.; et al. Finer resolution observation and monitoring of global land cover: First mapping results with Landsat TM and ETM+ data. Int. J. Remote Sens. 2013, 34, 2607–2654. [Google Scholar] [CrossRef]
  10. Gong, P.; Liu, H.; Zhang, M.; Li, C. Stable classification with limited sample: Transferring a 30-m resolution sampleset collected in 2015 to mapping 10-m resolution global land cover in 2017. Sci. Bull. 2019, 64, 370–373. [Google Scholar] [CrossRef]
  11. Azzari, G.; Lobell, D.B. Landsat-based classification in the cloud: An opportunity for a paradigm shift in land cover monitoring. Remote Sens. Environ. 2017, 202, 64–74. [Google Scholar] [CrossRef]
  12. Liu, J.; Ning, J.; Kuang, W.; Xu, X.; Zhang, S.; Yan, C.; Li, R.; Wu, S.; Hu, Y.; Du, G.; et al. Spatio-temporal patterns and characteristics of land-use change in China during 2010–2015. Acta Geogr. Sin. 2018, 73, 789–802. [Google Scholar]
  13. Chen, J.; Chen, J.; Liao, A.; Cao, X.; Chen, L.; Chen, X.; He, C.; Han, G.; Peng, S.; Lu, M.; et al. Global land cover mapping at 30 m resolution: A POK-based operational approach. Isprs J. Photogramm. Remote Sens. 2015, 103, 7–27. [Google Scholar] [CrossRef]
  14. Wu, B.; Yuan, Q.; Yan, C.; Wang, Z.; Yu, X.; Li, A.; Ma, R.; Huang, J.; Chen, J.; Chang, C. Land Cover Changes of China From 2000 to 2010. Quat. Sci. 2014, 34, 723–731. [Google Scholar]
  15. Lambin, E.F.; Geist, H.J. Land-Use and Land-Cover Change: Local Processes and Global Impacts; Springer Science & Business Media: Berlin/Heidelberg, Germany, 2006; Volume 18. [Google Scholar]
  16. Grübler, A. Changes in Land Use and Land Cover: A Global Perspective; Cambridge University Press: Cambridge, UK, 1994; pp. 287–328. [Google Scholar]
  17. Turner, B.L.; Meyer, W.B. Global Land-Use and Land-Cover Change: An Overview; Cambridge University Press: Cambridge, UK, 1994; pp. 3–10. [Google Scholar]
  18. Dong, J.; Metternicht, G.; Hostert, P.; Fensholt, R.; Chowdhury, R.R. Remote sensing and geospatial technologies in support of a normative land system science: Status and prospects. Curr. Opin. Environ. Sustain. 2019, 38, 44–52. [Google Scholar] [CrossRef]
  19. Guo, H.D.; Wang, L.Z.; Liang, D. Big Earth Data from space: A new engine for Earth science. Sci. Bull. 2016, 61, 505–513. [Google Scholar] [CrossRef]
  20. Zhu, Z.; Wulder, M.A.; Roy, D.P.; Woodcock, C.E.; Hansen, M.C.; Radeloff, V.C.; Healey, S.P.; Schaaf, C.; Hostert, P.; Strobl, P.; et al. Benefits of the free and open Landsat data policy. Remote Sens. Environ. 2019, 224, 382–385. [Google Scholar] [CrossRef]
  21. Hermosilla, T.; Wulder, M.A.; White, J.C.; Coops, N.C.; Hobart, G.W.; Campbell, L.B. Mass data processing of time series Landsat imagery: Pixels to data products for forest monitoring. Int. J. Digit. Earth 2016, 9, 1035–1054. [Google Scholar] [CrossRef]
  22. White, J.C.; Wulder, M.A. The Landsat observation record of Canada: 1972–2012. Can. J. Remote Sens. 2014, 39, 455–467. [Google Scholar] [CrossRef]
  23. Wulder, M.A.; White, J.C.; Loveland, T.R.; Woodcock, C.E.; Belward, A.S.; Cohen, W.B.; Fosnight, E.A.; Shaw, J.; Masek, J.G.; Roy, D.P. The global Landsat archive: Status, consolidation, and direction. Remote Sens. Environ. 2016, 185, 271–283. [Google Scholar] [CrossRef] [Green Version]
  24. Markham, B.L.; Helder, D.L. Forty-year calibrated record of earth-reflected radiance from Landsat: A review. Remote Sens. Environ. 2012, 122, 30–40. [Google Scholar] [CrossRef] [Green Version]
  25. Wulder, M.A.; White, J.C.; Goward, S.N.; Masek, J.G.; Irons, J.R.; Herold, M.; Cohen, W.B.; Loveland, T.R.; Woodcock, C.E. Landsat continuity: Issues and opportunities for land cover monitoring. Remote Sens. Environ. 2008, 112, 955–969. [Google Scholar] [CrossRef]
  26. Zhu, Z.; Woodcock, C.E. Continuous change detection and classification of land cover using all available Landsat data. Remote Sens. Environ. 2014, 144, 152–171. [Google Scholar] [CrossRef] [Green Version]
  27. Zhu, Z.; Zhang, J.; Yang, Z.; Aljaddani, A.H.; Cohen, W.B.; Qiu, S.; Zhou, C. Continuous monitoring of land disturbance based on Landsat time series. Remote Sens. Environ. 2019. [Google Scholar] [CrossRef]
  28. Wulder, M.A.; Loveland, T.R.; Roy, D.P.; Crawford, C.J.; Masek, J.G.; Woodcock, C.E.; Allen, R.G.; Anderson, M.C.; Belward, A.S.; Cohen, W.B.; et al. Current status of Landsat program, science, and applications. Remote Sens. Environ. 2019, 225, 127–147. [Google Scholar] [CrossRef]
  29. Dwyer, J.L.; Roy, D.P.; Sauer, B.; Jenkerson, C.B.; Zhang, H.K.K.; Lymburner, L. Analysis Ready Data: Enabling Analysis of the Landsat Archive. Remote Sens. 2018, 10, 1363. [Google Scholar]
  30. Zhu, Z.; Fu, Y.C.; Woodcock, C.E.; Olofsson, P.; Vogelmann, J.E.; Holden, C.; Wang, M.; Dai, S.; Yu, Y. Including land cover change in analysis of greenness trends using all available Landsat 5, 7, and 8 images: A case study from Guangzhou, China (2000–2014). Remote Sens. Environ. 2016, 185, 243–257. [Google Scholar] [CrossRef]
  31. Dong, J.; Xiao, X.; Chen, B.; Torbick, N.; Jin, C.; Zhang, G.; Biradar, C. Mapping deciduous rubber plantations through integration of PALSAR and multi-temporal Landsat imagery. Remote Sens. Environ. 2013, 134, 392–402. [Google Scholar] [CrossRef]
  32. Liu, R.; Yang, L. Generation of new cloud masks from MODIS land surface reflectance products. Remote Sens Environ 2013, 133, 21–37. [Google Scholar] [CrossRef]
  33. Whitcraft, A.K.; Vemiote, E.F.; Becker-Reshef, I.; Justice, C.O. Cloud cover throughout the agricultural growing season: Impacts on passive optical earth observations. Remote Sens. Environ. 2015, 156, 438–447. [Google Scholar] [CrossRef]
  34. Zhu, Z.; Woodcock, C.E. Automated cloud, cloud shadow, and snow detection in multitemporal Landsat data: An algorithm designed specifically for monitoring land cover change. Remote Sens. Environ. 2014, 152, 217–234. [Google Scholar] [CrossRef]
  35. Zhu, Z. Change detection using landsat time series: A review of frequencies, preprocessing, algorithms, and applications. Isprs J. Photogramm. Remote Sens. 2017, 130, 370–384. [Google Scholar] [CrossRef]
  36. Zhu, Z.; Wang, S.X.; Woodcock, C.E. Improvement and expansion of the Fmask algorithm: Cloud, cloud shadow, and snow detection for Landsats 4-7, 8, and Sentinel 2 images. Remote Sens. Environ. 2015, 159, 269–277. [Google Scholar] [CrossRef]
  37. Zou, Z.; Xiao, X.; Dong, J.; Qin, Y.; Doughty, R.B.; Menarguez, M.A.; Zhang, G.; Wang, J. Divergent trends of open-surface water body area in the contiguous United States from 1984 to 2016. Proc. Natl. Acad. Sci. USA 2018, 115, 3810–3815. [Google Scholar] [CrossRef] [Green Version]
  38. Sano, E.E.; Ferreira, L.G.; Asner, G.P.; Steinke, E.T. Spatial and temporal probabilities of obtaining cloud-free Landsat images over the Brazilian tropical savanna. Int. J. Remote Sens. 2007, 28, 2739–2752. [Google Scholar] [CrossRef]
  39. Whitcraft, A.K.; Becker-Reshef, I.; Justice, C.O. A Framework for Defining Spatially Explicit Earth Observation Requirements for a Global Agricultural Monitoring Initiative (GEOGLAM). Remote Sens. 2015, 7, 1461–1481. [Google Scholar] [CrossRef] [Green Version]
  40. Whitcraft, A.K.; Becker-Reshef, I.; Killough, B.D.; Justice, C.O. Meeting Earth Observation Requirements for Global Agricultural Monitoring: An Evaluation of the Revisit Capabilities of Current and Planned Moderate Resolution Optical Earth Observing Missions. Remote Sens. 2015, 7, 1482–1503. [Google Scholar] [CrossRef] [Green Version]
  41. Chen, X.; Hu, B.; Yu, R. Spatial and temporal variation of phenological growing season and climate change impacts in temperate eastern China. Glob. Chang. Biol. 2005, 11, 1118–1130. [Google Scholar] [CrossRef]
  42. Zhang, Z.; Wang, X.; Zhao, X.; Liu, B.; Yi, L.; Zuo, L.; Wen, Q.; Liu, F.; Xu, J.; Hu, S. A 2010 update of National Land Use/Cover Database of China at 1:100000 scale using medium spatial resolution satellite images. Remote Sens. Environ. 2014, 149, 142–154. [Google Scholar] [CrossRef]
  43. Asner, G.P. Cloud cover in Landsat observations of the Brazilian Amazon. Int. J. Remote Sens. 2001, 22, 3855–3862. [Google Scholar] [CrossRef]
  44. Lu, D.; Batistella, M.; Moran, E. Integration of Landsat TM and SPOT HRG Images for Vegetation Change Detection in the Brazilian Amazon. Photogramm. Eng. Remote Sens. 2015, 74, 157–169. [Google Scholar] [CrossRef]
  45. Ju, J.; Roy, D.P. The availability of cloud-free Landsat ETM+ data over the conterminous United States and globally. Remote Sens. Environ. 2008, 112, 1196–1211. [Google Scholar] [CrossRef]
  46. Wulder, M.A.; Hilker, T.; White, J.C.; Coops, N.C.; Masek, J.G.; Pflugmacher, D.; Crevier, Y. Virtual constellations for global terrestrial monitoring. Remote Sens. Environ. 2015, 170, 62–76. [Google Scholar] [CrossRef] [Green Version]
  47. Zhang, W.; Li, A.; Jin, H.; Bian, J.; Zhang, Z.; Lei, G.; Qin, Z.; Huang, C. An Enhanced Spatial and Temporal Data Fusion Model for Fusing Landsat and MODIS Surface Reflectance to Generate High Temporal Landsat-Like Data. Remote Sens. 2013, 5, 5346–5368. [Google Scholar] [CrossRef] [Green Version]
  48. Houborg, R.; McCabe, M.F. Daily Retrieval of NDVI and LAI at 3 m Resolution via the Fusion of CubeSat, Landsat, and MODIS Data. Remote Sens. 2018, 10, 890. [Google Scholar] [CrossRef]
  49. Sidhu, N.; Pebesma, E.; Camara, G. Using Google Earth Engine to detect land cover change: Singapore as a use case. Eur. J. Remote Sens. 2018, 51, 486–500. [Google Scholar] [CrossRef]
  50. Griffiths, P.; Nendel, C.; Hostert, P. Intra-annual reflectance composites from Sentinel-2 and Landsat for national-scale crop and land cover mapping. Remote Sens. Environ. 2019, 220, 135–151. [Google Scholar] [CrossRef]
  51. Hansen, M.C.; Potapov, P.V.; Moore, R.; Hancher, M.; Turubanova, S.A.; Tyukavina, A.; Thau, D.; Stehman, S.V.; Goetz, S.J.; Loveland, T.R.; et al. High-Resolution Global Maps of 21st-Century Forest Cover Change. Science 2013, 342, 850–853. [Google Scholar] [CrossRef] [Green Version]
  52. Pekel, J.F.; Cottam, A.; Gorelick, N.; Belward, A.S. High-resolution mapping of global surface water and its long-term changes. Nature 2016, 540, 418–422. [Google Scholar] [CrossRef]
Figure 1. Spatial distributions of the total L5/7/8 images across the entirety of China from 1984 to 2017. NIN: Northeast China–Inner Mongolia–Northwest China; NCP: North China Plain; MLYP: Middle–Lower Yangtze Plain; SC: South China; XJ: Xinjiang; TP: Tibetan Plateau
Remotesensing 11 01808 g001
Figure 2. Monthly average number of Landsat observations. Monthly average number of total (a) and valid (b) observations of L5/7/8 in China from 1984 to 2017. Monthly average number of total (c) and valid (d) observations of L5 (1984–2011), L7 (1999–2017), and L8 (2013–2017) in China from 1984 to 2017, respectively.
Remotesensing 11 01808 g002
Figure 3. Spatial distributions of total (a) and valid (b) Landsat observations across the entirety of China from L5/7/8 from 1984 to 2017. Insets in (a) and (b) show average numbers of total and valid observations as function of geographic latitude; (c) and (d) show histograms of Landsat pixels with different total and valid observation numbers, respectively, from 1984 to 2017.
Remotesensing 11 01808 g003
Figure 4. Percentages of Landsat pixels with at least one valid observation during the OIATs (see Table 1) for the regions of NIN, NCP, and MLYP at one-year interval; SC at one- and two-year intervals; and XJ and TP with one-, two-, three-, and four-year intervals from 1984 to 2017. Black dotted horizontal lines represent 95%, while dotted vertical lines and shaded bars show start years or epochs when the percentages of Landsat pixels with at least one valid observation were consistently greater than or equal to 95%.
Remotesensing 11 01808 g004
Figure 5. Epoch numbers that meet the demand for at least one valid observation during the corresponding OIAT (see Table 1) for individual Landsat pixels in China during 1984–2017; at one- and two-year intervals (a,b) during 1985–2017, and 1986–2017 with three- and four-year interval (c,d), respectively.
Remotesensing 11 01808 g005
Table 1. Six geographical regions of China and the selected optimal image acquisition times (OIATs) based on Zhang et al. [42].
CodeRegionOIAT
NINNortheast China–Inner Mongolia–Northwest ChinaJune–September
NCPNorth China PlainMay–October
MLYPMiddle–Lower Yangtze PlainMarch–October
SCSouth ChinaOctober–December
XJXinjiangJune–September
TPTibetan PlateauJuly–September

