Spatio–temporal Assessment of Drought in Ethiopia and the Impact of Recent Intense Droughts


1
Center for Space and Remote Sensing Research, National Central University, No. 300, Jhongda Rd., Jhongli Dist., Taoyuan City 32001, Taiwan
2
Taiwan Group on Earth Observations, Zhubei City, Hsinchu County 30274, Taiwan
3
Taiwan International Graduate Program (TIGP), Earth System Science Program, Academia Sinica and National Central University, Taipei 112, Taiwan
4
College of Science, Bahir Dar University, P.O. Box 79, Bahir Dar, Ethiopia
*
Author to whom correspondence should be addressed.
Remote Sens. 2019, 11(15), 1828; https://0-doi-org.brum.beds.ac.uk/10.3390/rs11151828
Submission received: 16 June 2019
/
Revised: 26 July 2019
/
Accepted: 30 July 2019
/
Published: 5 August 2019
(This article belongs to the Special Issue Earth Observations for Environmental Sustainability for the Next Decade)
Abstract
:The recent droughts that have occurred in different parts of Ethiopia are generally linked to fluctuations in atmospheric and ocean circulations. Understanding these large-scale phenomena that play a crucial role in vegetation productivity in Ethiopia is important. In view of this, several techniques and datasets were analyzed to study the spatio–temporal variability of vegetation in response to a changing climate. In this study, 18 years (2001–2018) of Moderate Resolution Imaging Spectroscopy (MODIS) Terra/Aqua, normalized difference vegetation index (NDVI), land surface temperature (LST), Climate Hazards Group Infrared Precipitation with Stations (CHIRPS) daily precipitation, and the Famine Early Warning Systems Network (FEWS NET) Land Data Assimilation System (FLDAS) soil moisture datasets were processed. Pixel-based Mann–Kendall trend analysis and the Vegetation Condition Index (VCI) were used to assess the drought patterns during the cropping season. Results indicate that the central highlands and northwestern part of Ethiopia, which have land cover dominated by cropland, had experienced decreasing precipitation and NDVI trends. About 52.8% of the pixels showed a decreasing precipitation trend, of which the significant decreasing trends focused on the central and low land areas. Also, 41.67% of the pixels showed a decreasing NDVI trend, especially in major parts of the northwestern region of Ethiopia. Based on the trend test and VCI analysis, significant countrywide droughts occurred during the El Niño 2009 and 2015 years. Furthermore, the Pearson correlation coefficient analysis assures that the low NDVI was mainly attributed to the low precipitation and water availability in the soils. This study provides valuable information in identifying the locations with the potential concern of drought and planning for immediate action of relief measures. Furthermore, this paper presents the results of the first attempt to apply a recently developed index, the Normalized Difference Latent Heat Index (NDLI), to monitor drought conditions. The results show that the NDLI has a high correlation with NDVI (r = 0.96), precipitation (r = 0.81), soil moisture (r = 0.73), and LST (r = −0.67). NDLI successfully captures the historical droughts and shows a notable correlation with the climatic variables. The analysis shows that using the radiances of green, red, and short wave infrared (SWIR), a simplified crop monitoring model with satisfactory accuracy and easiness can be developed.
1. Introduction
In the era of climate change, there is a continuous need to thoroughly assess vulnerabilities caused by complex environmental, ecological, and anthropogenic factors. Drought, as a natural phenomenon, creates numerous multidimensional effects on agriculture, human health, and disease prevalence [1]. Various drought management and vulnerability schemes were thus developed to mitigate the influences of natural and human-made disturbances at regional [2,3] and global scales [4,5]. Vulnerability assessment of natural disasters has become a necessity for policy-makers and practitioners in reducing the impacts associated with them [6,7].
Drought is dryness due to an acute shortage of water, which lasts for several months or years. Drought considerably endangers food and water security. As a complex natural event, it stems from a lack of precipitation over a prolonged period of time, and its effect can be only witnessed slowly over a period of time [8,9]. Besides the shortages of precipitation, droughts are associated with differences between actual and potential evapotranspiration, soil moisture deficits, and reduced groundwater or reservoir levels. These characteristics make the definition of drought complex and, thus, there is no single universally accepted definition. Owing to the lack of comprehensiveness of a single agreed definition, the identification and monitoring of key characteristics of drought is difficult.
Several studies have provided comprehensive reports on indices that are used to monitor the impacts of droughts [10,11,12,13,14,15]. Generally, a variety of drought indices were developed from climatic and satellite data. The most widely used indexes include the Palmer Drought Severity Index (PDSI), Standardized Precipitation Index (SPI) [16], normalized difference vegetation index (NDVI) [17], Normalized Difference Water Index (NDWI) [18], Vegetation Condition Index (VCI), and Temperature Condition Index (TCI) [13]. Remote sensing data-based indices have been widely used and compared with the other approaches for assessing drought, as they are among the best in detecting the onset of drought and measuring the intensity, duration, and impact of drought globally [19]. The remote-sensing based indices for quantifying the state of vegetation, namely the combination of visible and infrared bands, provide unique characterization for the vegetative area, including biomass, growth status, and leaf area coverage, and serve as a basis for the estimation of vegetation condition [20]. Surface temperature may serve as a basis for the estimation of vegetation condition and evapotranspiration [21]. The performance of drought indices generated based on MODIS reflectance and land surface temperature (LST), in association with the standardized precipitation index (SPI), were extensively investigated to assess drought conditions on a global scale to regional scale in the southern Great Plains, USA [22], China [23], in eastern Africa, and in southern and southeastern Africa [24,25,26,27,28].
Ethiopia faces drought conditions every eight–ten years [29]. The country has been facing drought at a growing incidence throughout the past many decades [30]. Among these, the 1984–1985 drought affected the lives of more than two hundred thousand people and millions of livestock [31]. The climate in Ethiopia is changing, even though significant trends are not clear [32]. OXFAM reports that according to the survey made questioning local people in Ethiopia, the climate is experiencing an increase in the rate of drought [33]. The farmers report that good harvests are less common due to an extended extreme dry season and strong rain in the wet season, followed by a prolonged absence of precipitation, which is likely due to a manifestation of global warming. Both the rise in temperature and the long absence of precipitation are major factors for causing droughts. The projected increase of weather events such as droughts due to climate change derails the availability of water and will lead to a cut in agricultural production.
Ethiopia’s economy is essentially dependent on rain-fed agriculture, which is vulnerable to climate change [34]. 2015 was one of the driest years in large parts of Ethiopia [35]. The main rain season, locally called ‘kiremt’, was late and below normal conditions [36]. Consequently, the government called for emergency assistance for 10.2 million people [37]. The ultimate causes of this drought event originated from great distances, through atmospheric and oceanic circulations. The El Niño–Southern Oscillation (ENSO) phenomenon hugely impacts Ethiopian rainfall [38]. In particular, the warm-phase El Niño is closely linked with reserved rains during kiremt, over northern and central Ethiopia [39]. Under these circumstances, the evapotranspiration needs of plants were not met, leading to an intense reduction in vegetative production. Thus, the need to assess long-term vegetation trends and investigate the relationship between these changes and the variability in climatic conditions is increasingly important in Ethiopia.
The specific objectives of this research are: (i) to detect any long-term hydro-meteorological trends using the Mann–Kendall statistical test; (ii) to assess the drought patterns using the vegetation condition index; and (iii) to identify the main causes of NDVI change in relation to rainfall, soil moisture, LST, and ENSO. Additionally, this paper will be the first to attempt to incorporate the Normalized Difference Latent Heat Index (NDLI) as a proxy to evapotranspiration needs of the plant. NDLI, a combination of the green, red, and SWIR channels of the electromagnetic spectrum, has been found to be useful for the detection of plant water content [40]. It is highlighted that a better analysis of drought allows for the development and implementation of successful policies to better understand disruptive climate change in the region, to improve food security and strengthen climate resilience.
2. Study Area and Data
2.1. Study Area
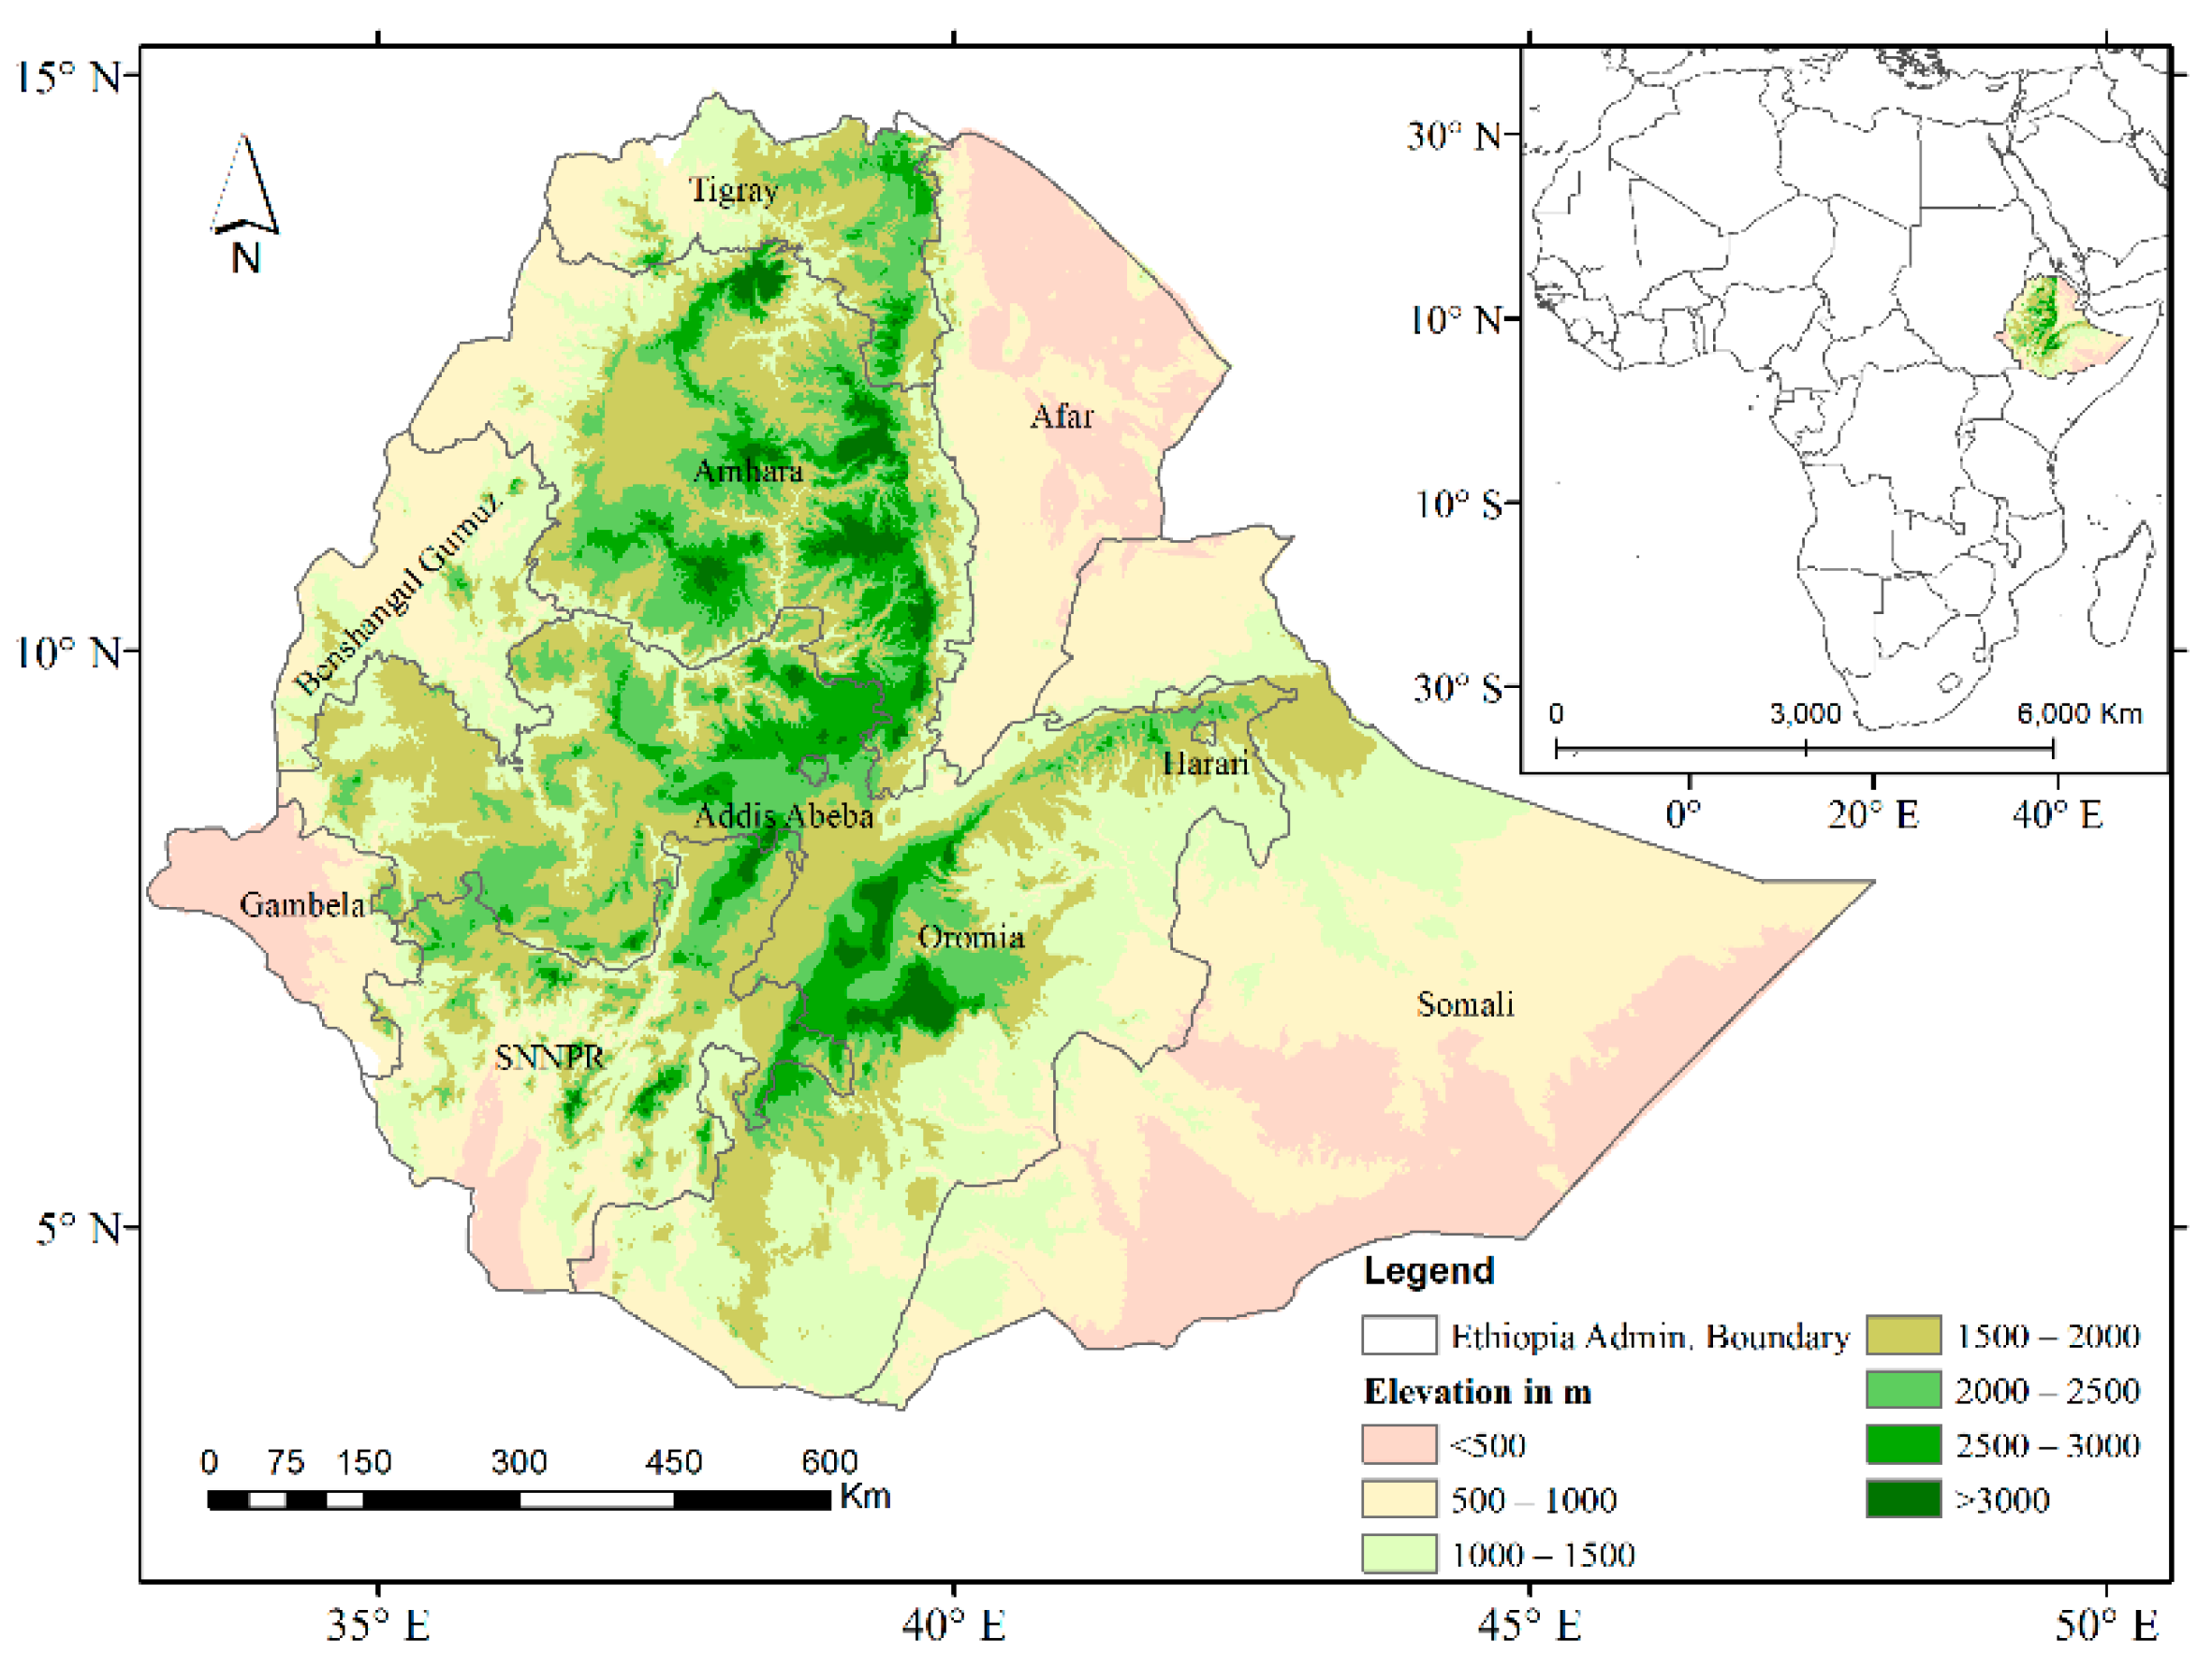
The study area, Ethiopia, is located between 3°00′ to 15°00′N and 32°00′ to 48°00′E in the inner part of the Horn of Africa, as shown in Figure 1. The country has a total area of 1.1 million square kilometers, is landlocked, and has the second largest population in Africa, second to Nigeria. The elevation ranges from 194 to 4539 m above mean sea level. The highland, with an altitude of 1500 m or above, is located at the central and northern parts of the country and constitutes roughly 35% of the country [41]. In a traditional way, based on elevation, at least three climatic zones are identified—the tropical (lowland zone), which is below 1830 m in elevation and has mean annual temperatures of 20–28 °C; the subtropical zone, which includes the highland areas of 1830–2440 m in elevation and with mean annual temperatures of 16–20 °C; and the cool zone, which is above 2440 m in elevation and with mean annual temperatures of 6–16 °C [42].
Due to its complex topographical and geographical features, the climate of Ethiopia exhibits strong spatial variation and different rainfall regimes [43]. Thus, rainfall shows considerable spatial heterogeneity in Ethiopia [44]. Much of the region is generally bimodal, with long rains in JJAS (June–September) and short rains during OND (October–December). The meridional translation of the Intertropical Convergence Zone (ITCZ) across the equator is the main factor of the MAM (March–May) and OND seasons [45]. Topography also plays a role in affecting the annual cycle of precipitation. The highland areas receive an annual rainfall of about 1200 mm, with the least temperature variation, whereas the lowland areas (Afar and Somali regions) receive an annual rainfall of less than 500 mm with larger temperature variations [41]. The spatial distribution of Ethiopian drought indicates that most of the drought and food crises events are concentrated in the central and northern highlands, extending from North Shewa through Wollo to Tigray [46].
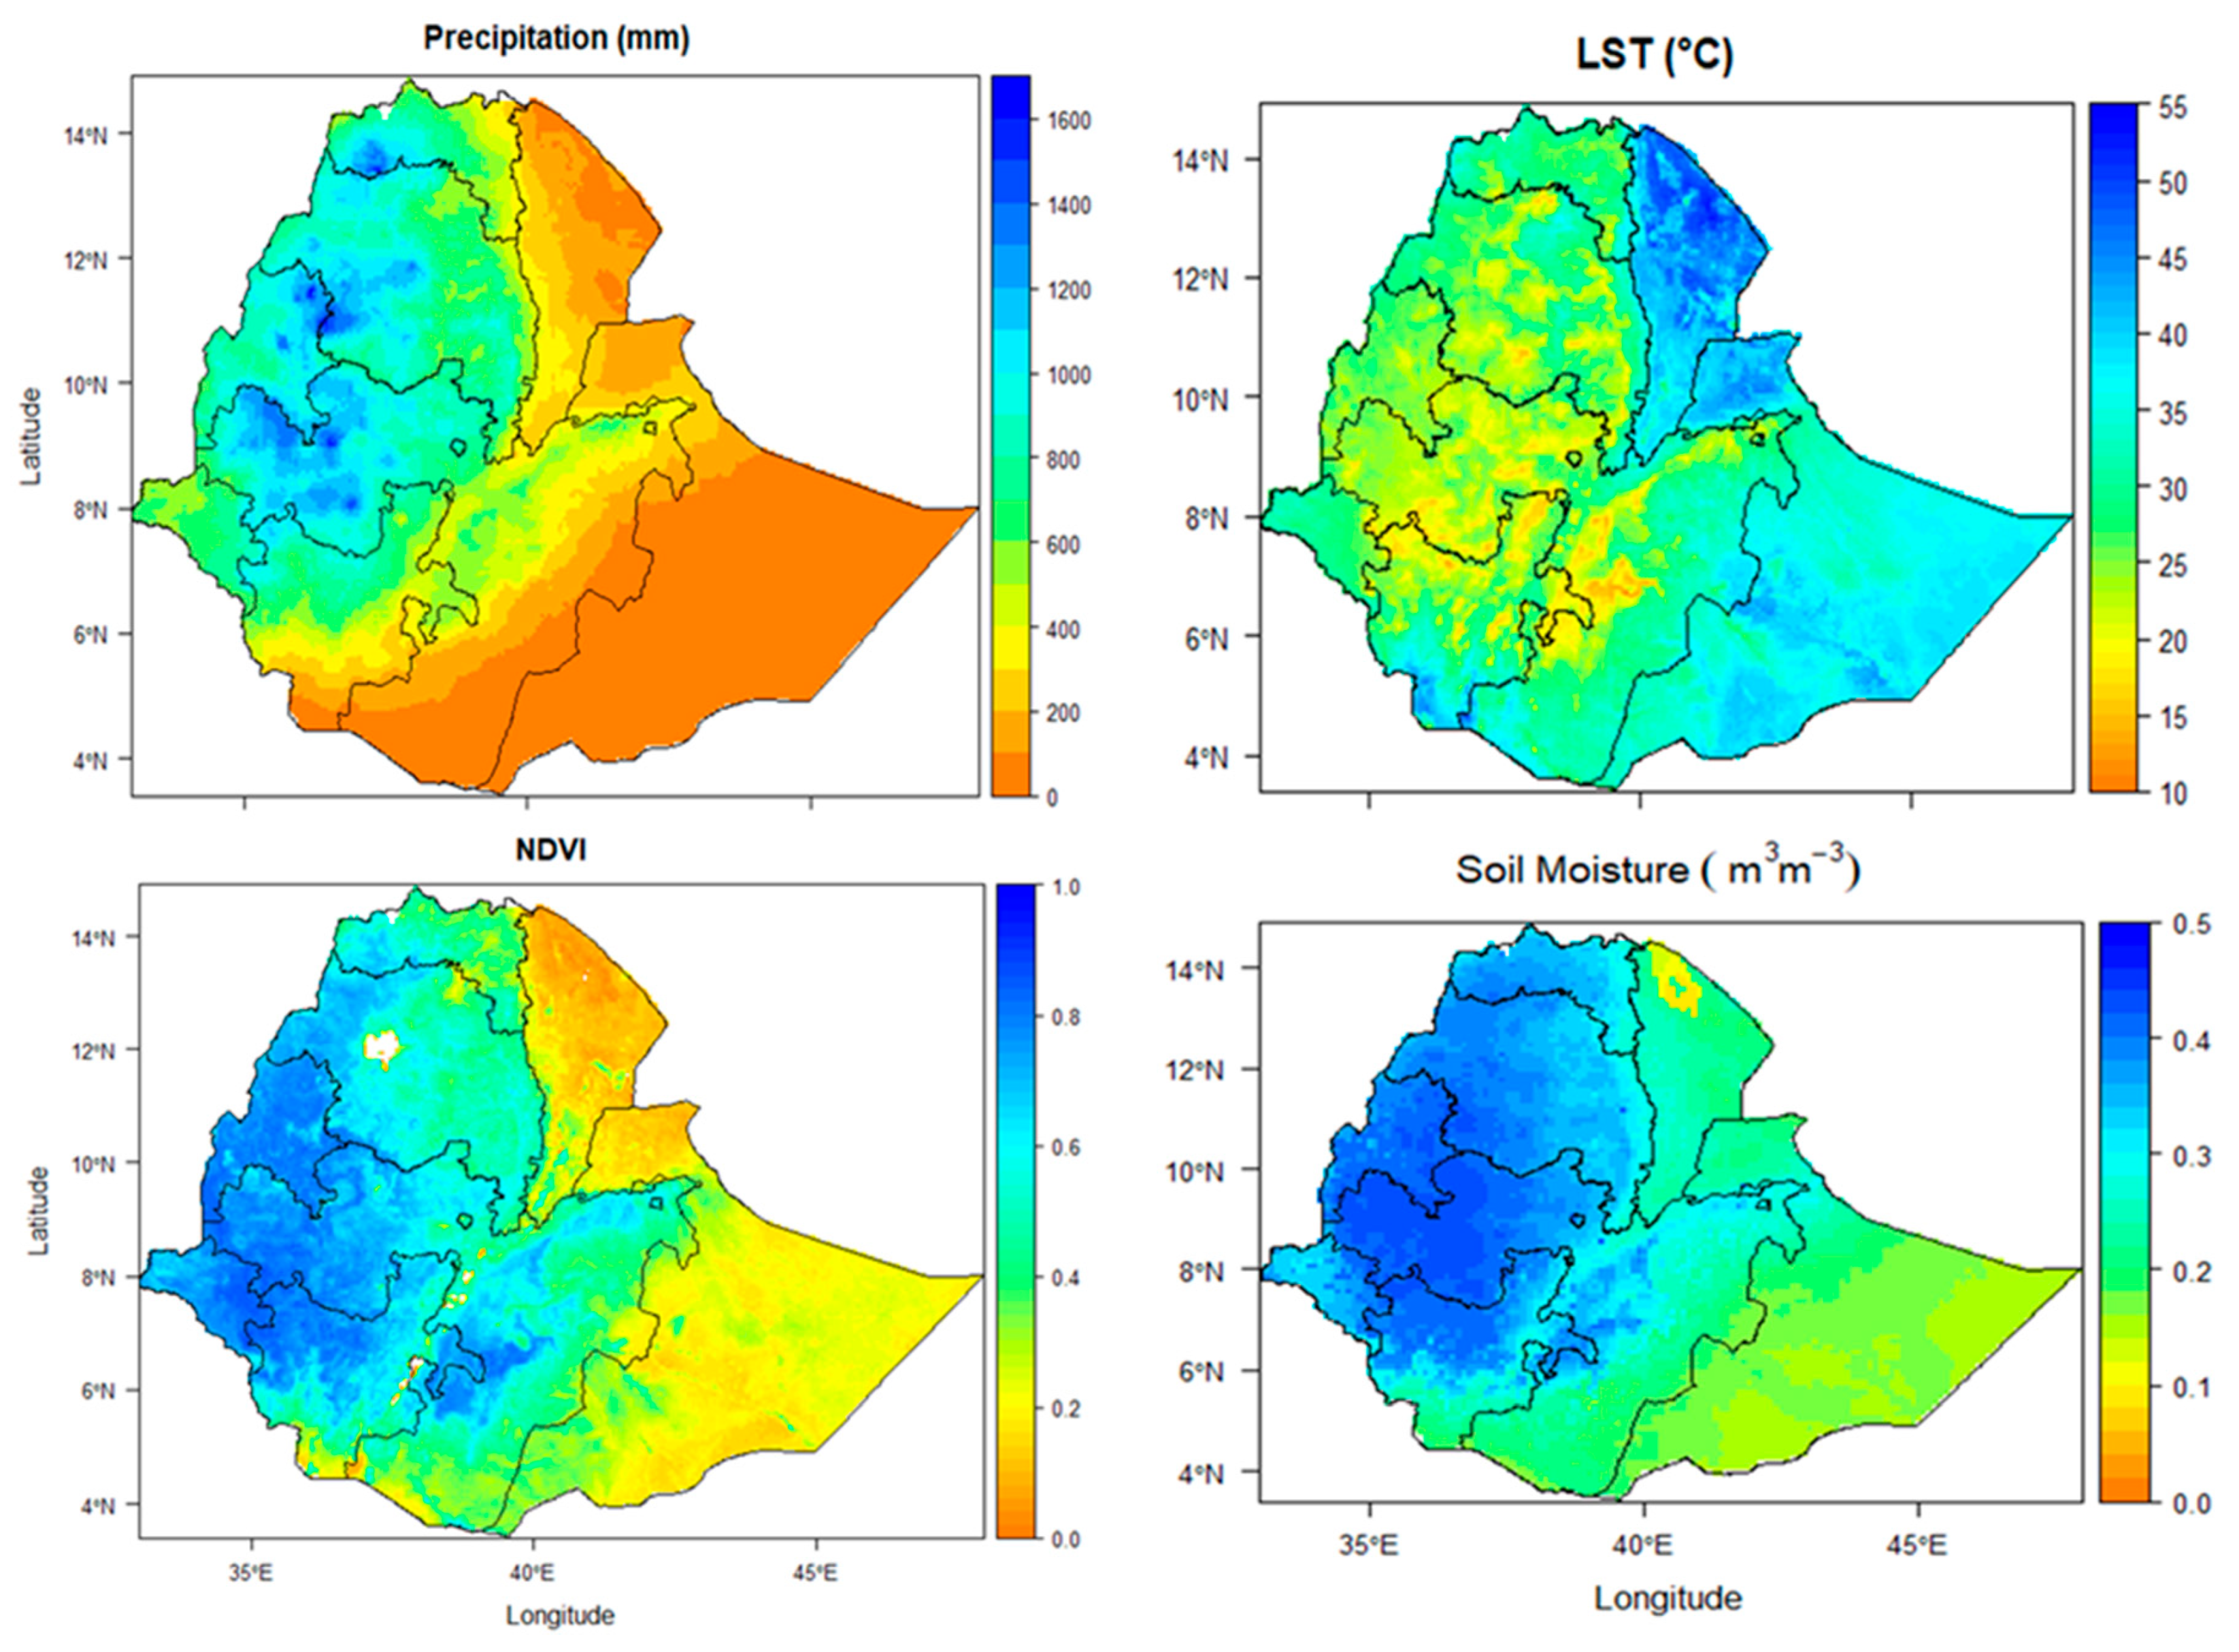
Based on the Climate Hazards Group Infrared Precipitation with Stations (CHIRPS) daily precipitation data obtained from the Climate Hazards Group at the University of California, Santa Barbara (UCSB) [35], the main rainfall season from June to September, locally called kiremt, accounts for 60–80% of the annual rainfall, with the remaining falling in the dry season, from October to May, Figure 2.
The rainfall significantly varies between the northeastern and the western highlands of Ethiopia, where orographic rainfall is substantial. Figure 2 additionally depicts that an average seasonal LST of the land derived from the solar radiation (MOD11A2 Terra v.006 product) of Ethiopia is between 10 °C and 54 °C, with maximum temperatures concentrated on the lowland areas. Similarly, the soil moisture (derived from the FLDAS Noah Land Surface Model L4) distribution for the top 0–10 cm layer increases in the western and northern parts of the country. Moreover, NDVI distributions derived from the MOD13Q1 Terra v.006 product confirm healthy vegetation and forests, mainly located in the western parts of Ethiopia, which match with the rainfall, LST, and soil moisture patterns.
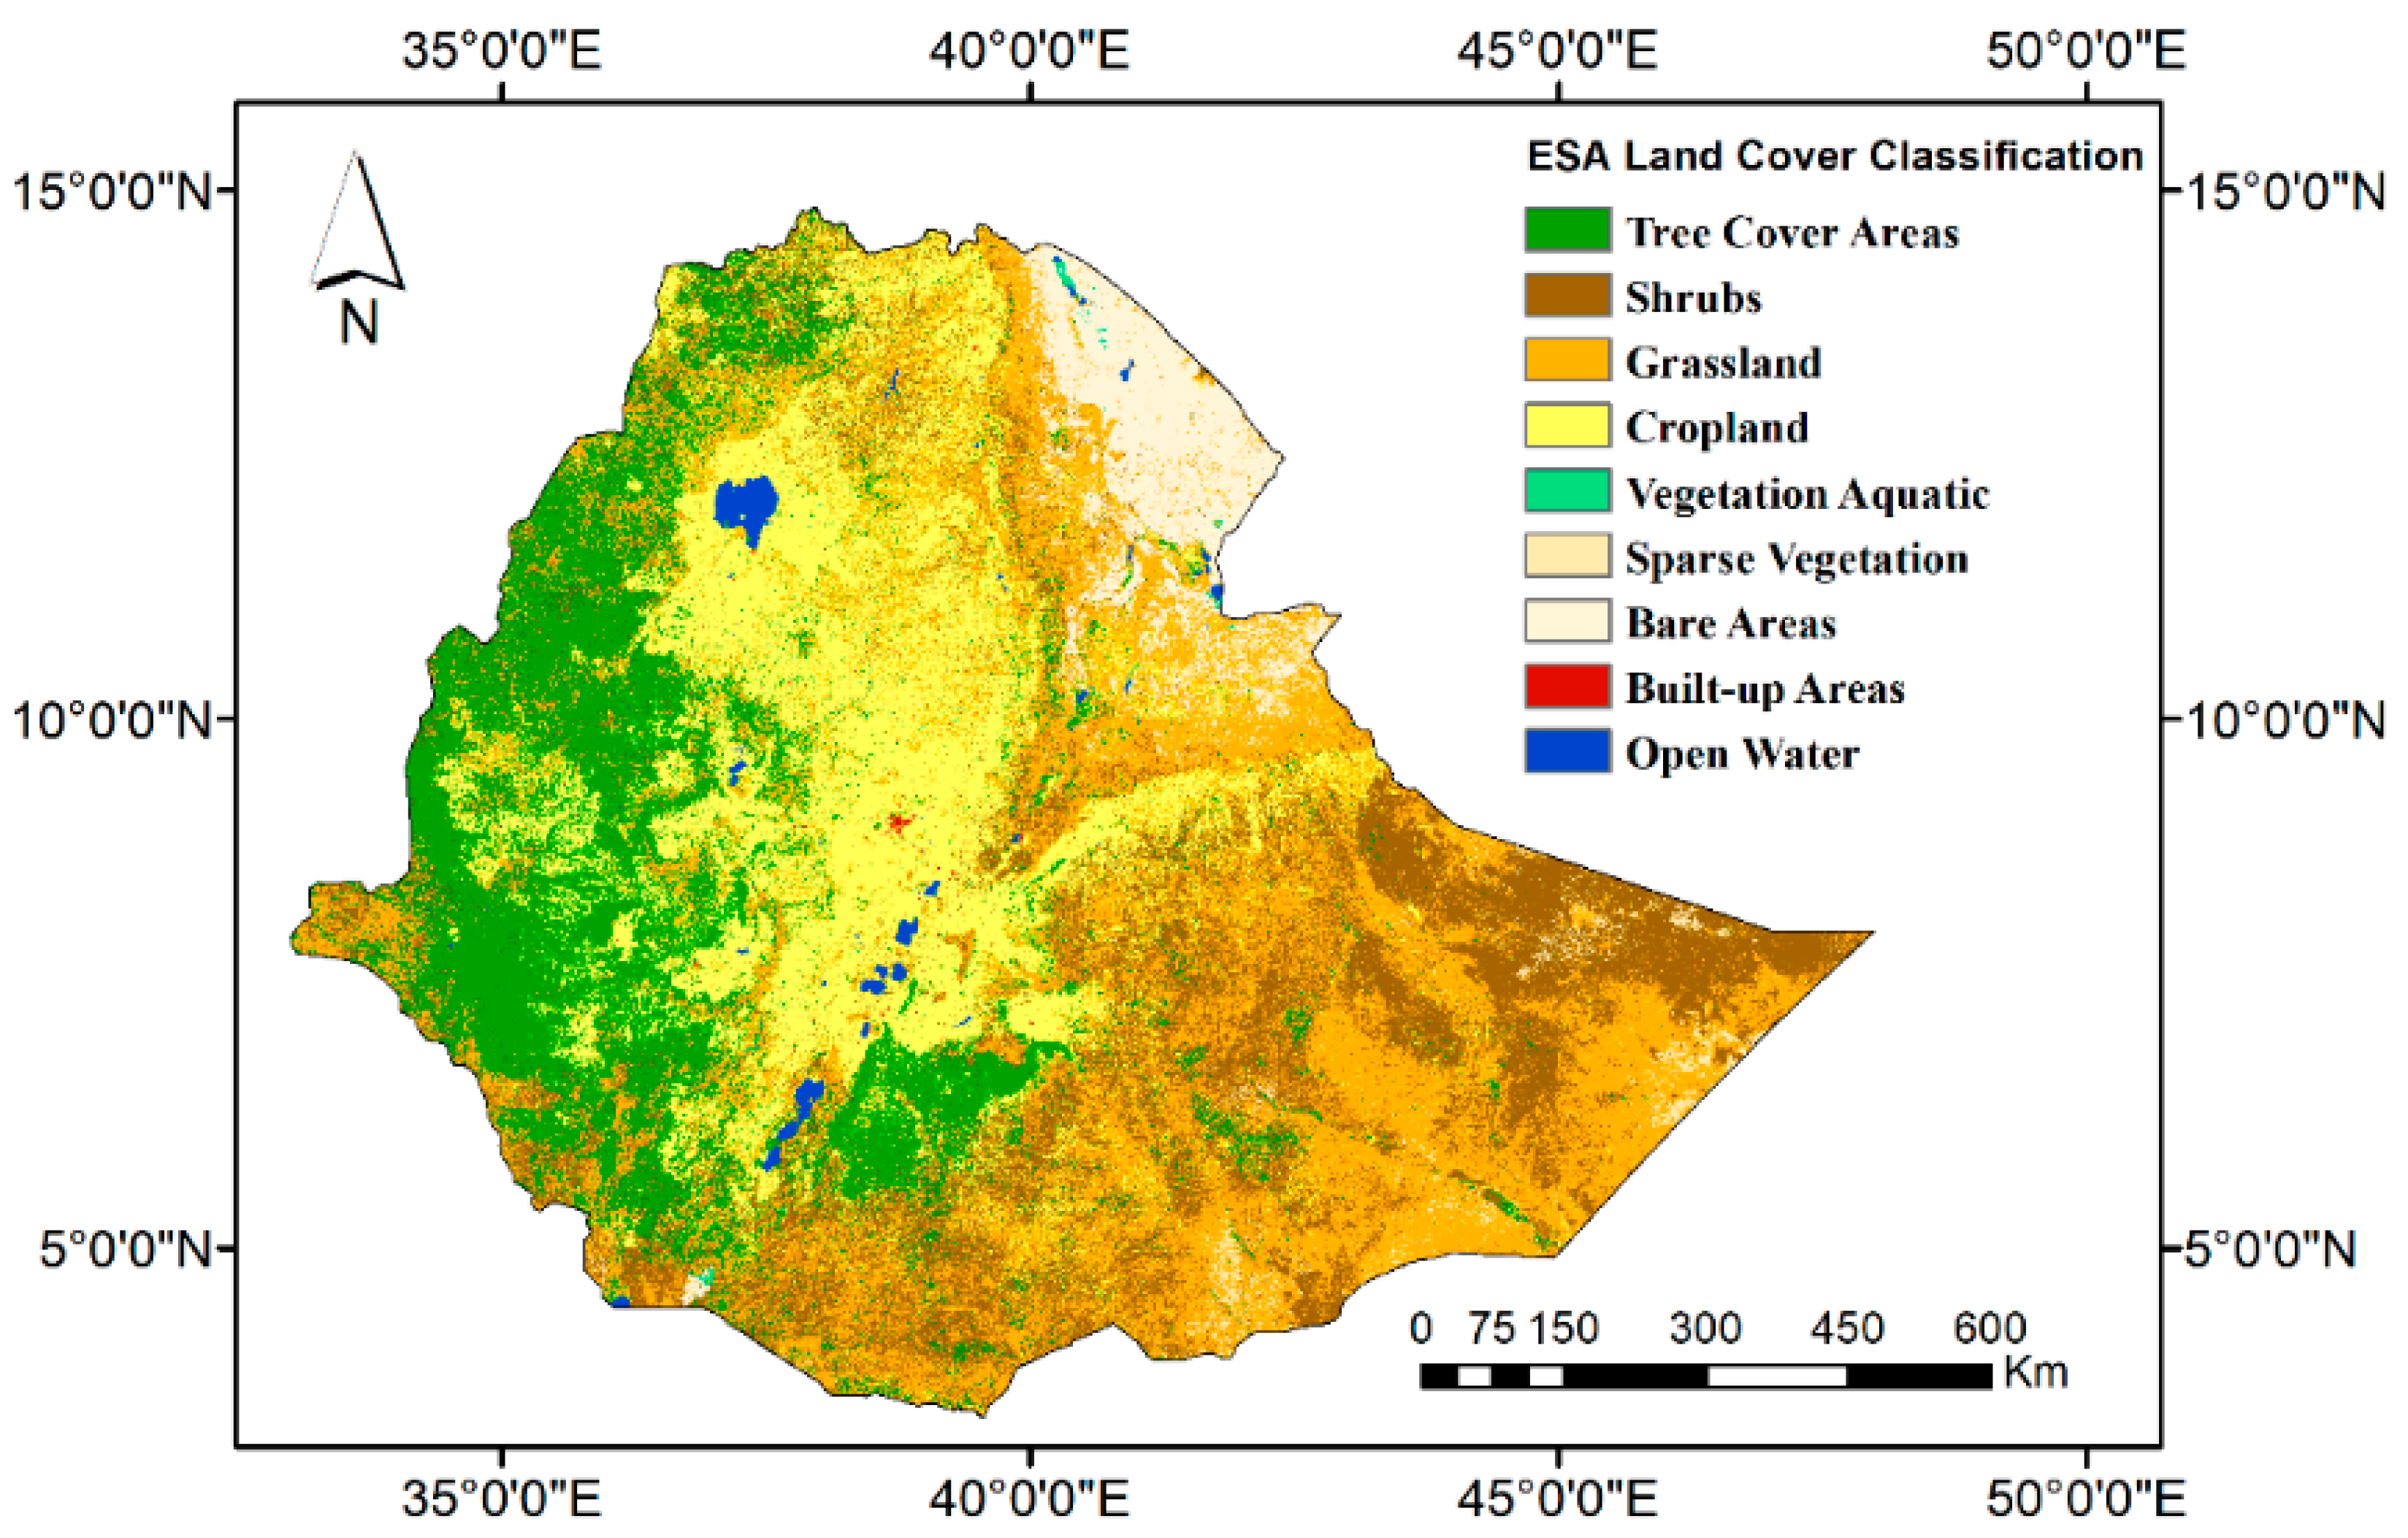
The land cover types for Ethiopia extracted from the European Space Agency (2016) Global Land Cover map are shown in Figure 3. The most dominant cover types are grassland, cropland, and shrubs, covering 29%, 26%, and 21% of the whole study area, respectively. The land cover in the highlands continually changes because of the persistent agricultural activities and higher population density as compared to the lowlands [47]. Large areas of agricultural farms, where people largely depend on the rain-fed farms, are of major concern due to recurrent drought incidents.
2.2. Datasets
The data for this study were acquired from four sources. With extensively high temporal and spatial resolution as compared to the other satellites, the products of MODIS onboard NASA Terra and Aqua satellites were suited for this study because of their large geographic coverage. We used the monthly averaged MODIS Terra 16 day datasets for the period from 2001 to 2018 (18 years) that are archived in the Google Earth Engine (GEE) image collection. Time series NDVI and LST covering the whole study area at 250 m and 1 km spatial resolution were generated from MODIS/006/MOD13Q1 and MODIS/006/MOD11A1 version 6 surface reflectance composite, respectively. Similarly, surface reflectance products of MODIS/006/MOD09GA were generated for computing the NDWI and NDLI [40]. The data were extracted and processed using the JavaScript code editor in the GEE platform (https://earthengine.google.com/ Mountain View, CA, USA), which offers a parallel computing environment for processing large datasets. For monitoring the spatial and temporal conditions of drought, we chose NDVI, but we also included the other parameters that trigger dry conditions. NDVI, the most common index for remote sensing of vegetation, is known to be saturated over areas with high leaf area indexes. Numerous vegetation indexes using the same set of near-infrared and red channels have been developed, even though these indices do not enjoy the same popularity as NDVI, which is known for its capability to distinguish vegetation from other types of land cover, but is not really designed to sense the water content in the vegetation canopy. Nevertheless, remote sensing of the water content has important implications in agriculture and forestry. For the detection of plant water content, the near-infrared region (NIR) and shortwave infrared regions (SWIR) have been found to be useful. Thus, NDWI is defined in a similar way to NDVI but uses the near-infrared channel to monitor the water content of the vegetation canopy. Fluctuations in the vegetation canopy are indicators of drought stress [18]. Besides NIR and SWIR, two spectral regions of the electromagnetic spectrum have been found to be useful for the detection of plant water content: the green and red channels. Liou et al. [40] recently developed the NDLI, which uses the green, red, and SWIR channels. NDLI is sensitive to water availability for different land covers at the land–air interface and outperforms the different versions of NDWI indexes. The spectral indices are calculated using the following formulas:
where are the spectral reflectance for MODIS band 4 (545–565 nm), band 1 (620–670 nm), band 2 (841–876 nm), and band 6 (1628–1652 nm), respectively.
The other data source used to generate time series rainfall data for the period from 2001 to 2018 was CHIRPS. CHIRPS is a 30+ year quasi-global rainfall dataset combining satellite observations from the Climate Prediction Center (CPC) and the National Climate Forecast System version 2 (CFSv2) and in situ precipitation observations [35,37]. It is widely used in Ethiopia for drought monitoring [38]. It is well demonstrated that CHIRPS can complement the sparse rain gauge network and provide high spatial and temporal resolution for trend analysis [48,49]. The CHIRPS data were accessed from the ftp server (ftp://ftp.chg.ucsb.edu/pub/org/chg/products/CHIRPS-2.0).
The monthly soil moisture (0–10 cm) was generated from the Famine Early Warning Systems Network (FEWS NET) Land Data Assimilation System (FLDAS) dataset, developed to assist food security assessments in data-sparse developing countries [50]. This is a natural tool to monitor drought conditions and was accessed from https://earlywarning.usgs.gov/fews/product/308.
In this study, we used the multivariate ENSO index (MEI) and the dipole mode index (DMI) to observe how vegetation responds to climatic conditions. The monthly mean MEI time series were retrieved from the National Oceanic and Atmospheric Administration (NOAA) website (https://www.esrl.noaa.gov/psd/enso/mei/, Washington, DC, USA). The MEI time series was calculated by taking the leading principal component time series of the empirical orthogonal function of the five variables, namely the sea level pressure, sea surface temperature, surface zonal winds, surface meridional winds, and Outgoing Longwave Radiation within the 30°S–30°N and 100°E–70°W region. Besides this, the DMI was calculated by taking the differences between the sea surface temperature anomalies in the western (50°E–70°E, 10°S–10°N) and eastern (90°E–110°E, 10°S–0°N) portions of the Indian Ocean [51]. The monthly DMI data was accessed from the Japan Agency for Marine-Earth Science and Technology (JAMSTEC) website (http://www.jamstec.go.jp/frcgc/research/d1/iod/iod/dipole_mode_index.html). The data used in these study are summarized on Table 1.
3. Methodology
3.1. Identification of Drought
A common way to calculate anomalies is to apply the Standardized Anomaly Index (SAI). SAI is a standardized departure from the long term mean and is calculated as:
where is the seasonal mean of variable , is the long term seasonal mean and is the standard deviation of the seasonal mean of all data. The anomaly maps were created by subtracting the seasonal climatology mean from the seasonal values and then dividing this by the standard deviation. The resulting maps depict the intensity of how good or bad the current season is compared with the average situation. Seasonal anomaly maps of precipitation, NDVI, LST, and soil moisture for the years 2015–2018 from the 2001–2014 climatology were computed to identify and quantitatively measure which part of Ethiopia was severely affected in the year 2015 and its recovery to normal conditions.
Besides the common SAI, another method to compare the current NDVI with historical values is the Vegetation Condition Index [52]. The VCI has been extensively used to monitor vegetation conditions [53]. It normalizes NDVI on a pixel-by-pixel basis, scaling between the minimum and maximum values of NDVI:
where NDVI, , and are the mean seasonal NDVI, and its absolute long-term minimum and maximum NDVI values, respectively, for each pixel. VCI varies in the range of 0 to 100 percent, reflecting relative changes in the vegetation condition from extremely low to high VCI [52]. As proposed by [52] and recently applied by [54], a threshold value of below 35% is used to indicate drought conditions as shown in Table 2.
3.2. Mann–Kendall Trend Analysis
The Mann–Kendall method is a non-parametric rank-based test method, which is commonly used to identify a monotonic trend in climate, by using remote sensing and hydro-metrological data [55]. The usefulness of a non-parametric test relies on its resilience to outliers, non-normality, missing values, and seasonality and, hence, it is necessary for this study [56,57,58]. The univariate Mann–Kendall statistic for time series data is given as:
where and are the seasonal mean values in years and , respectively, , and is the length of the time series. The sign of all possible differences is computed as:
When , the statistic is approximately normally distributed with mean E[S] = 0, and variance given by the following equation:
where is the number of data points in the jth tie group, and is the number of tie group in the time series. The test statistics is computed as:
Now, follows a standard normal distribution whereby its positive (negative) value indicates an upward (downward) trend. If is greater than , where represents the significance level, the trend is considered as significant. In this regard to the -transformation, this study is considered a 9.5% confidence level, where the null hypothesis was no trend was rejected if and the alternative hypothesis that increasing or decreasing monotonic trend exists in the series was accepted. The magnitude of the linear trend was then predicted by the Sen’s slope estimator [59], i.e., the change per unit time of a trend was computed as:
where and are the changing values of the variable at time steps and , respectively. A value close to zero means there is not much variation through time. A negative value of the slope depicts a negative trend, whereas a positive value indicates a positive trend. This method is recommended for remote sensing time series analysis and has been used for vegetation trend analysis [60]. The trend analysis described above was applied to the seasonal rainfall, NDVI, LST, and soil moisture values using the “spatialEco” package in R-project.
3.3. Multiple Linear Regression
Multiple linear regression is an extension of simple linear regression. It is used when to predict the value of a variable based on the value of two or more other variables. For instance, for analyzing a dependent variable (in this case NDVI) in light of related independent variables (precipitation, soil moisture, LST, NDWI, NDLI, MEI, DMI). It allows us to determine the overall fit of the model and the relative contribution of each of the predictors to the total variance explained. In this paper, we tried to quantify the susceptibility of NDVI to changes in climatic and hydro-metrological variables. Mathematically, a multiple linear regression model with predictor variables and a response can be written as:
and is the residual terms of the model, which tries to minimize, is the dependent variable in this case NDVI, represents the independent variables (precipitation, soil moisture, LST, NDWI, NDLI, MEI, DMI), is the intercept, and are the coefficients of Before we chose to analyze our data using multiple regression, we made sure that assumptions required for multiple regression were met. We checked the existence of a linear relationship by inspecting the scatter and partial regression plots between NDVI and each of the independent variables. By using the variance inflation factor (VIF) values, we further checked whether the explanatory variables were highly correlated with each other or not. A VIF measures the extent to which multicollinearity has increased the variance of an estimated coefficient. It looks at the extent to which an explanatory variable can be explained by all the other explanatory variables in the equation.
4. Results and Discussion
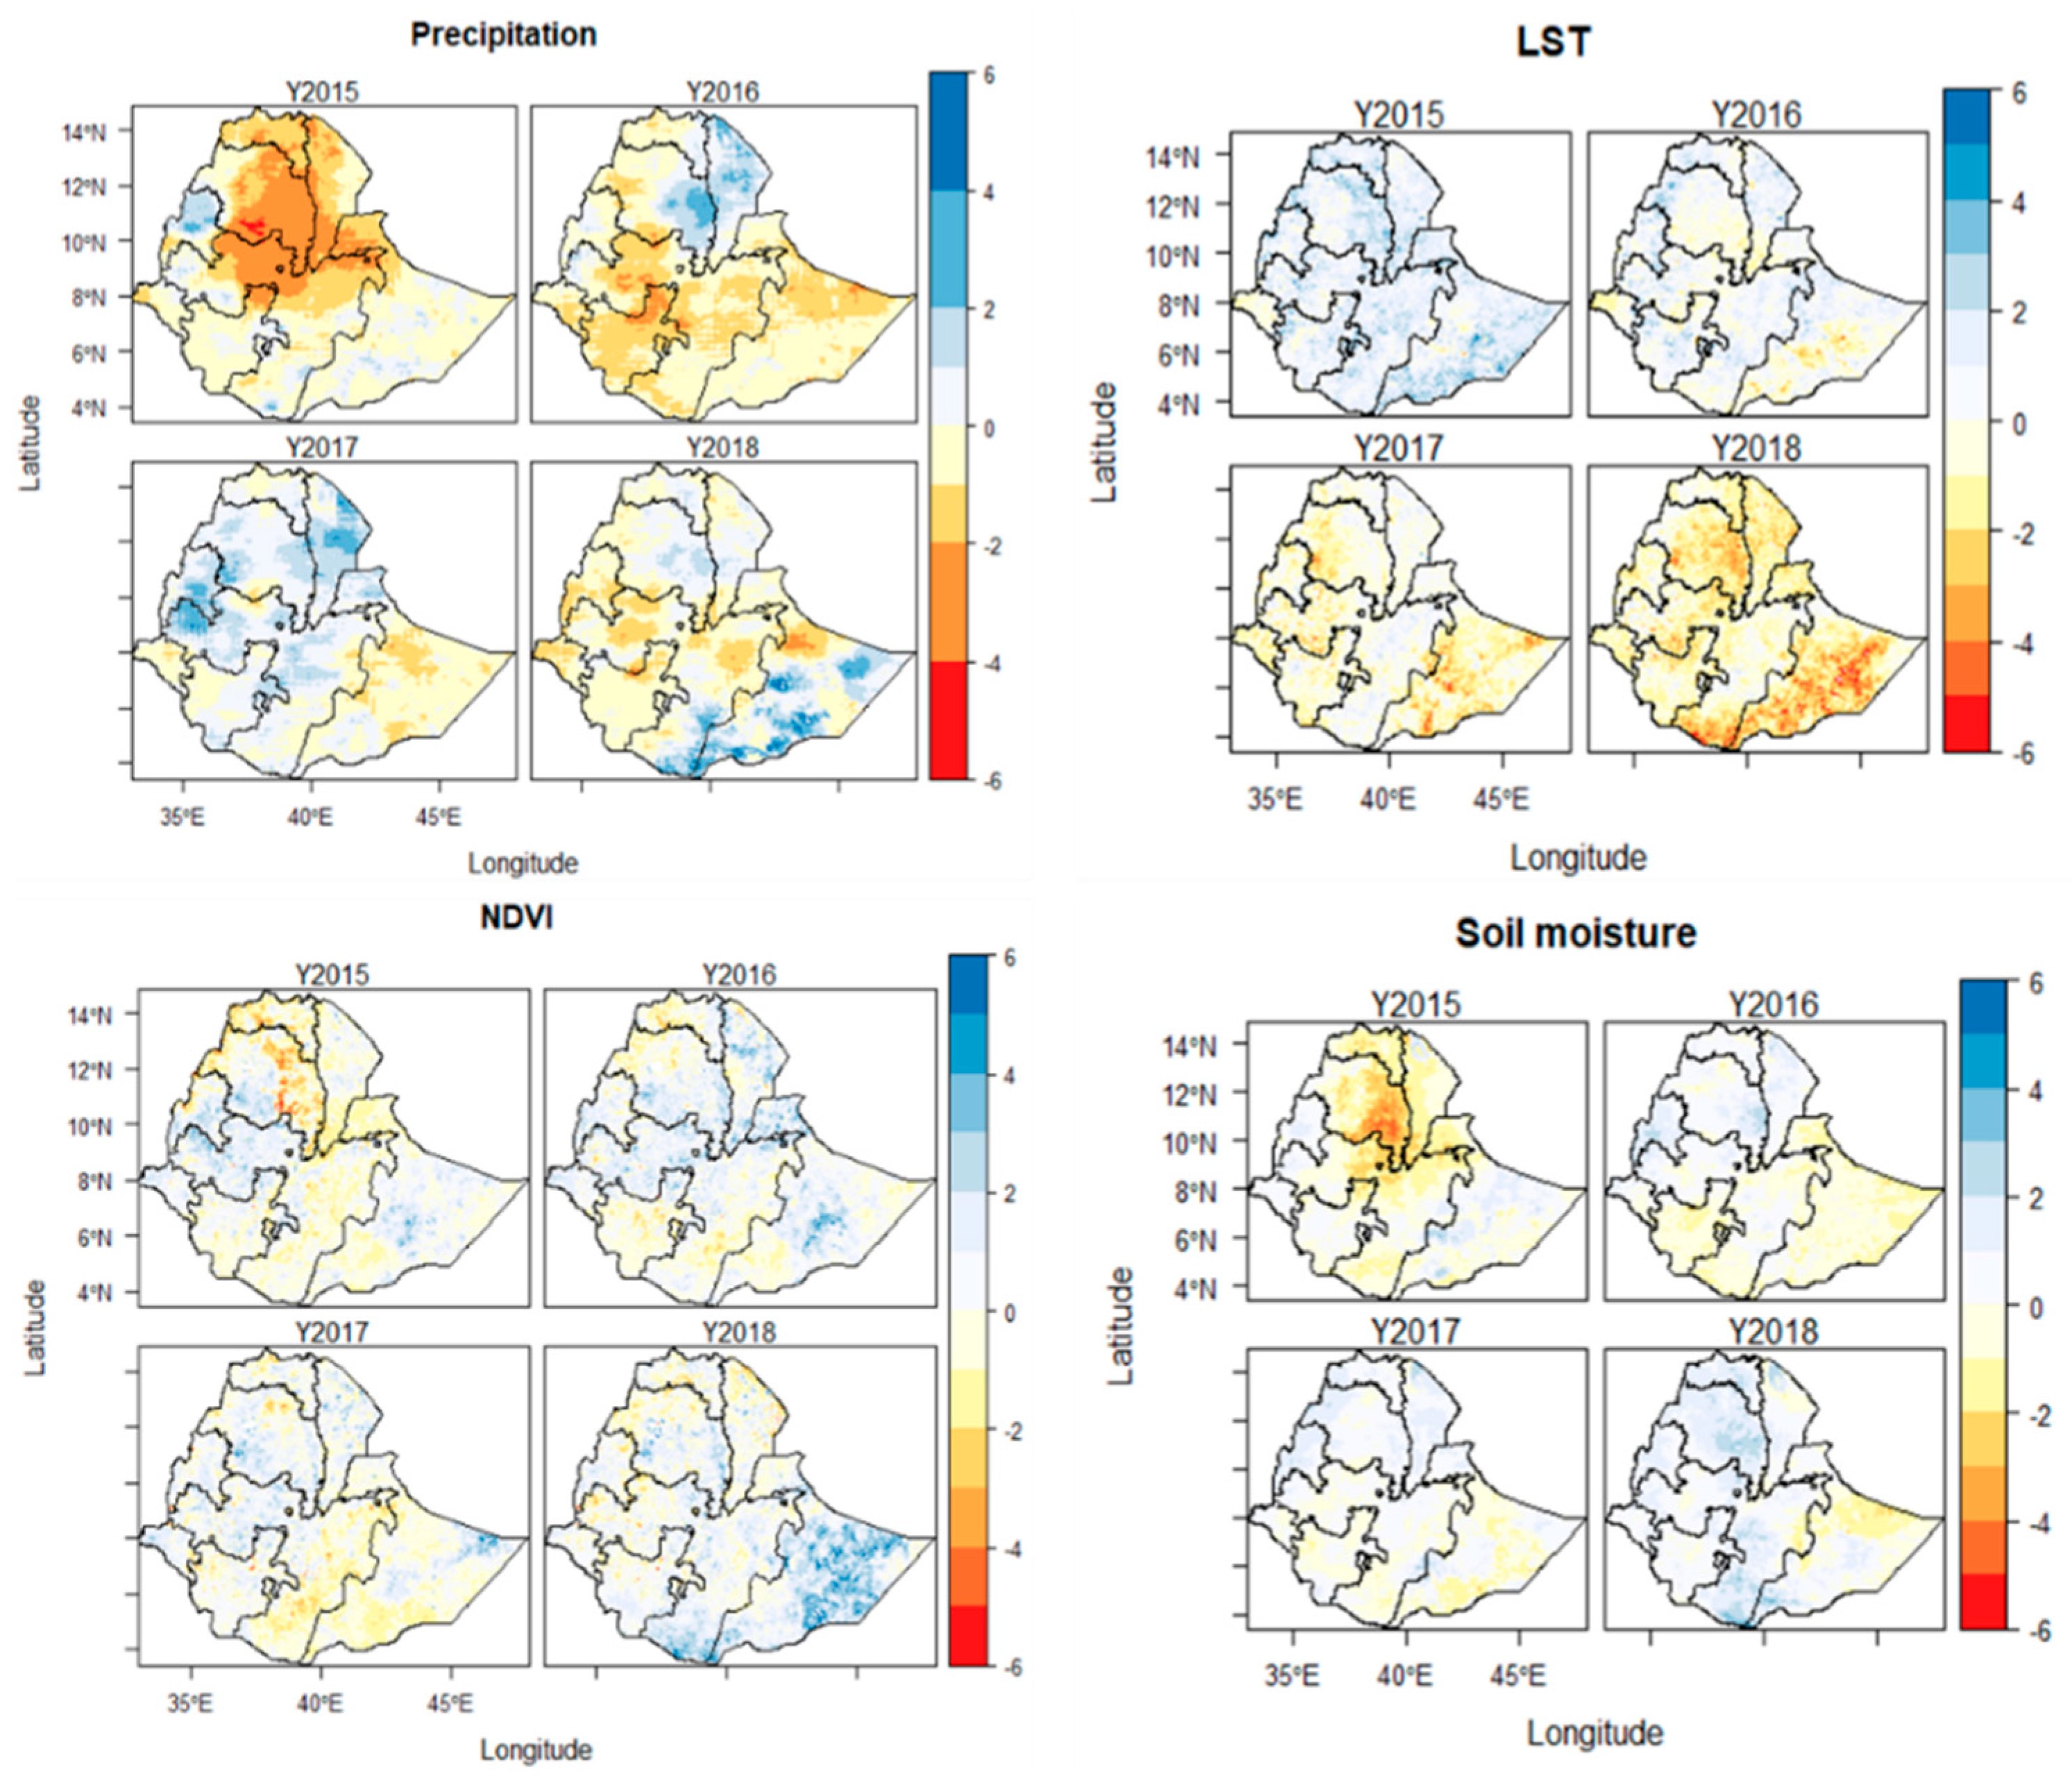
The most recent ENSO, which was developed in 2014 and strengthened in the summer, has caused global impacts [61]. In Ethiopia, the dry kiremt seasons are closely linked to the significantly warmer Pacific sea surface temperatures [39]. Figure 4 depicts that the strongest kiremt precipitation anomalies derived from the CHIRPS datasets are located in the central and northwestern parts of Ethiopia, with maximum −4.6 standardized deviations anomalies around −460 mm/year in 2015. Vegetation in Ethiopia is sensitive to water availability and severely affected by low precipitation. Correspondingly, large area negative NDVI deviations are a result of water stress concentrated in the western, northern, and central parts of Ethiopia, with maximum NDVI departures by approximately −2.5 standardized anomalies below average. In the same way, the 10 cm soil moisture and LST follow the same patterns as those of the precipitation anomalies, by approximately −3 and 3.5 standardized deviations from their corresponding normal conditions, respectively. During 2016, due to the dry conditions linked with La Niña, the negative precipitations of the southern and eastern parts of Ethiopia persisted, with maximum −4.0 standardized deviations anomalies around −305 mm/year. The dry conditions evolved from the north and central regions to the south and east parts. Across the region, however, NDVI did not follow the same pattern and the vegetation productivity did not quickly decline. This may have been due to the extended availability of water stored in soils for growing crops [62]. Following the return of ENSO to neutral conditions in 2017, the central and northern regions of Ethiopia become more favorable for crop development. During this period, the cropland areas experienced enhanced precipitation and vegetation, which was also closely linked to the increase in soil moisture. The agricultural data obtained from the annual agricultural sample survey of the Central Statistics Agency indicated increments from 7.32 to 28.93 quintals per hectare for maize, from 5.05 to 26.76 quintals per hectare for Teff, and from 2.28 to 29.67 quintals per hectare for wheat [63].
While in 2018 the precipitation showed negative anomalies, the maximum soil moisture and NDVI anomalies were about two standardized deviations above the average conditions. Similarly, the minimum LST departure was about −3 standardized deviations above the average conditions. It is worth mentioning that in 2018, compared to 2017, a higher precipitation in the southeast part of Ethiopia was observed, which was well-matched with increased NDVI.
4.1. Drought Patterns Based on VCI
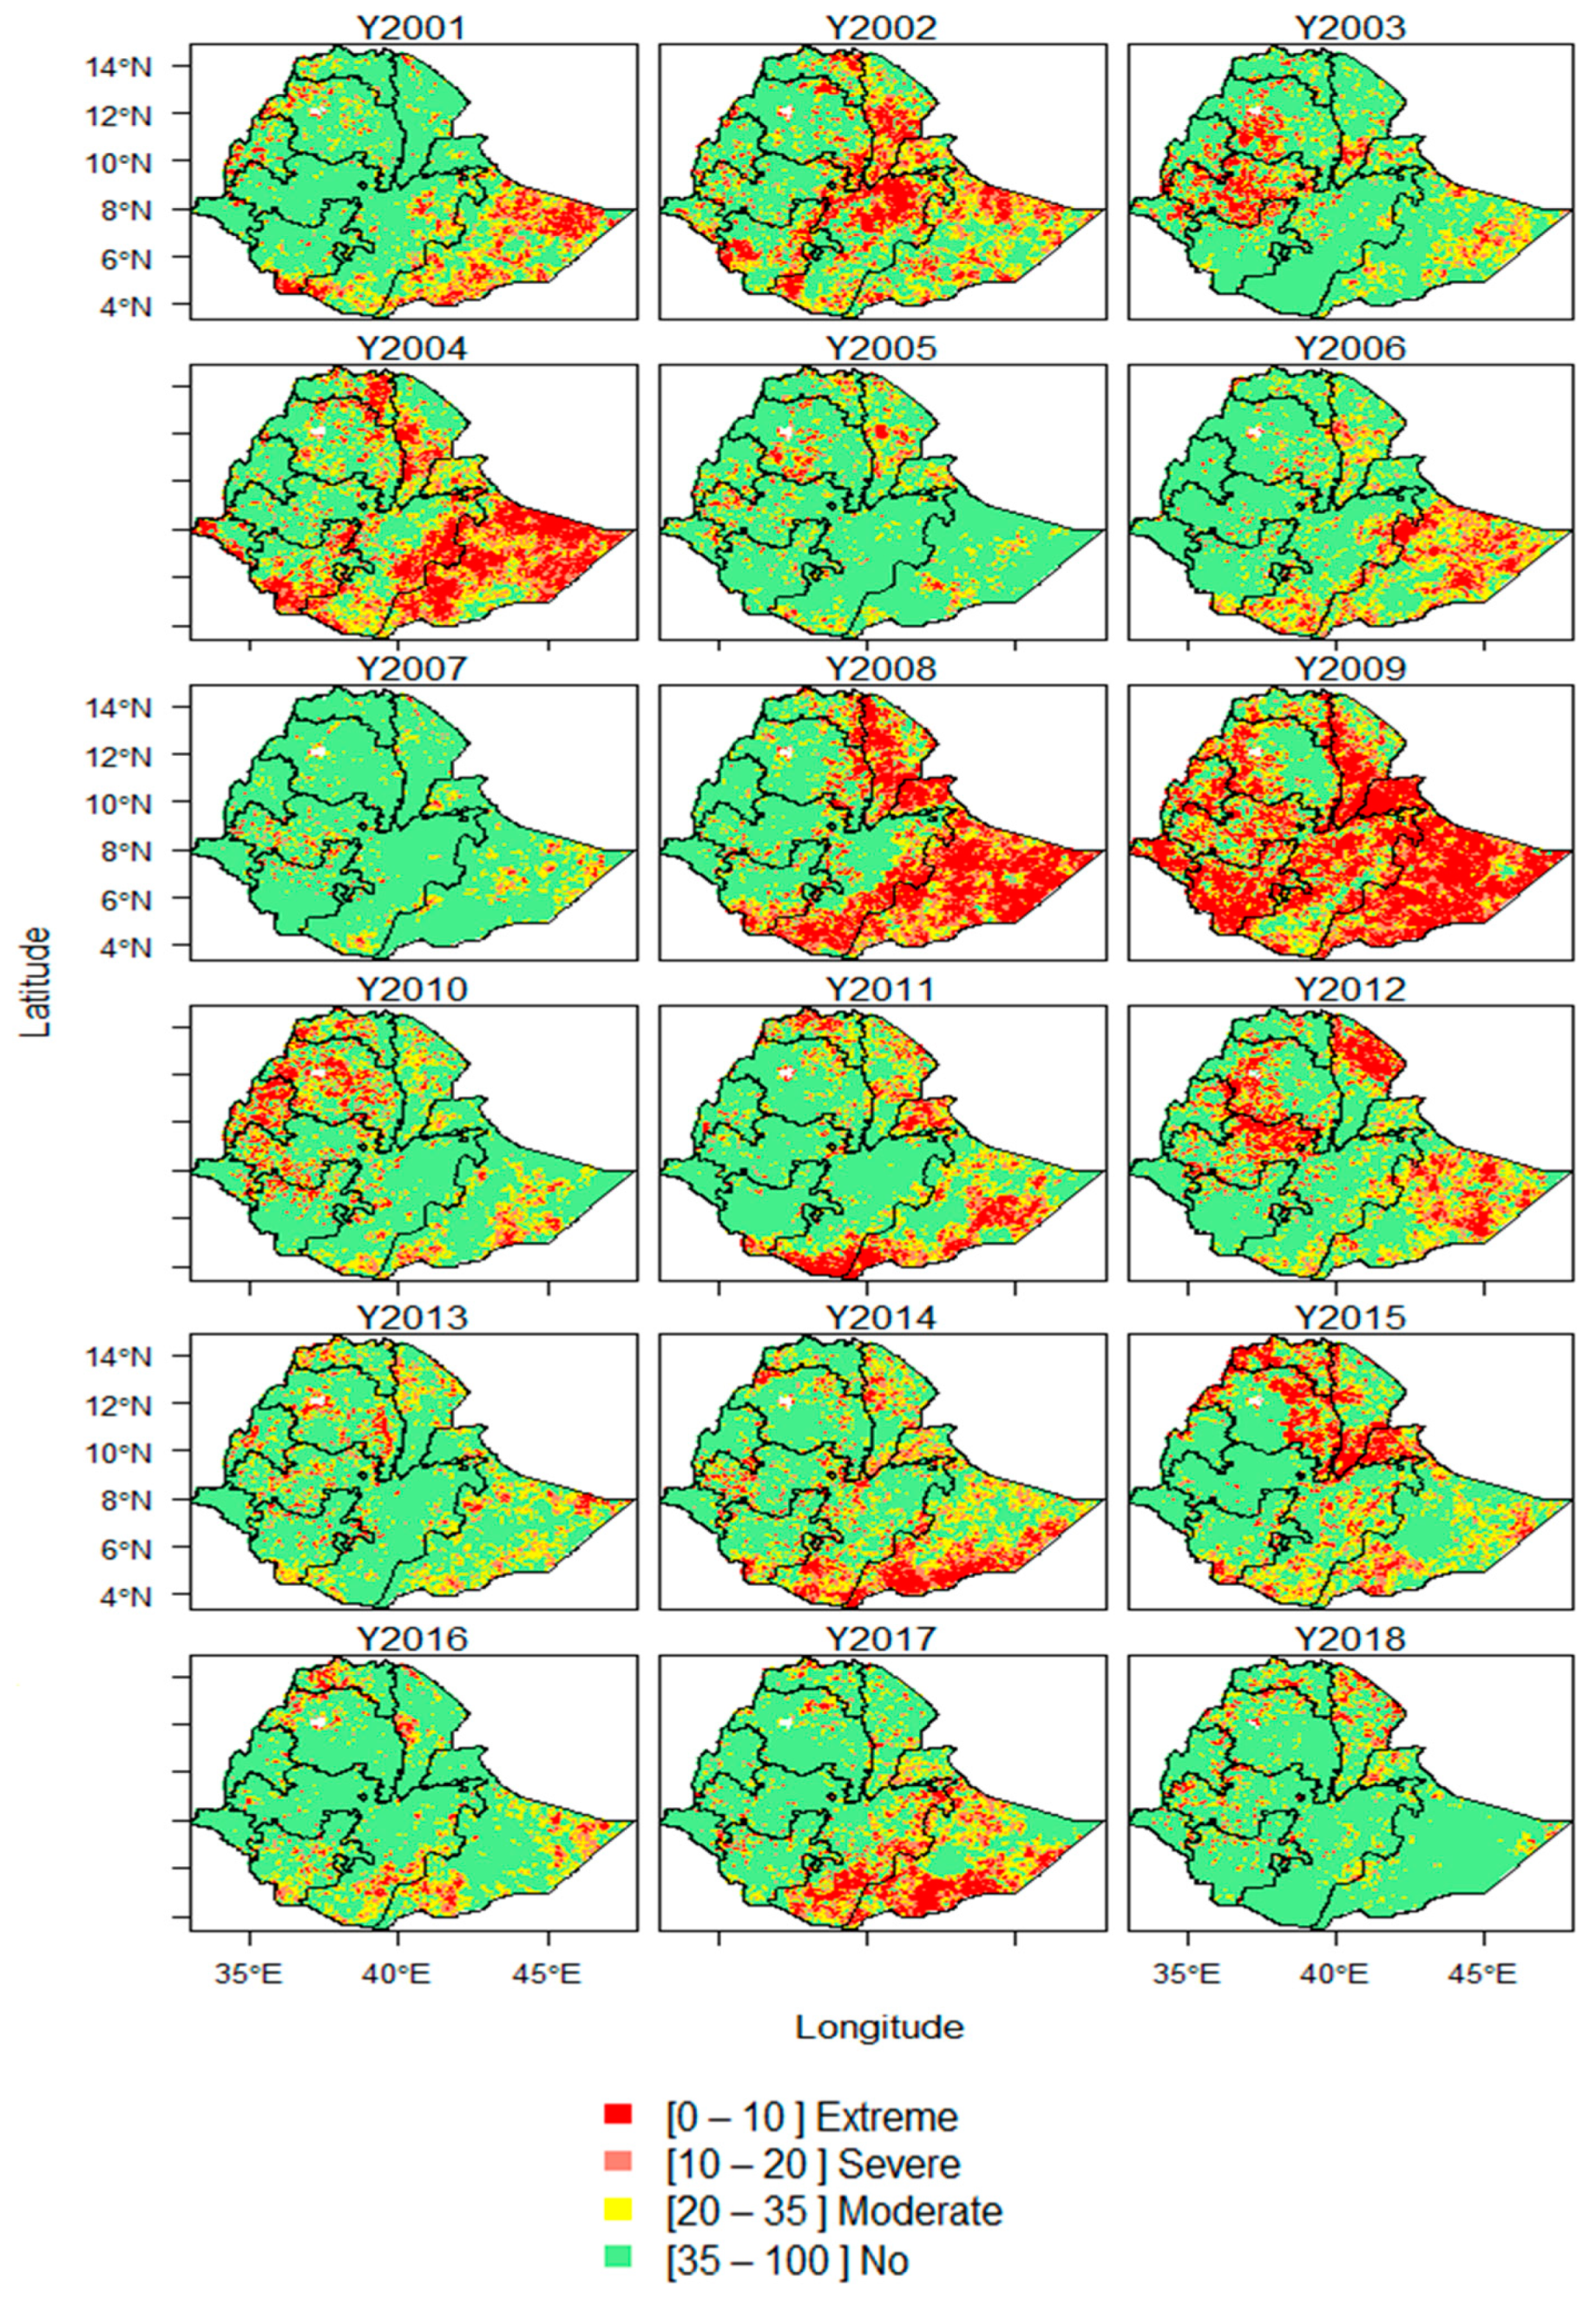
Figure 5 depicts the spatio–temporal persistence of drought detected by VCI during the growing season in Ethiopia over the past two decades. It is shown that the growing season signifies the maximum vegetation growth, and demonstrates the suitability of VCI to detect drought and assist the measures of vegetation health.
In this figure, regions which are greener indicate vegetation levels higher than the average conditions, whereas the red colors indicate poor conditions. Severe to extreme droughts were identified in the years 2002, 2003, 2004, 2009, 2010, 2012, and 2015 for the north, central, west, and southwest parts of the country, where the land is mainly covered by rain-fed agriculture. The results show a direct influence of ENSO on the vegetation of Ethiopia, especially during the El Niño years 2009–2010 and 2014–2015. During El Niño years, the NDVI values gradually declined and remained marginally below average. On the other hand, the years 2001, 2005, 2006, 2007, 2013, 2016, and 2018 reflect the near-normal NDVI throughout most of the rain-fed agriculture regions. In Ethiopia, an El Niño event would cause suppressed rainfall during the kiremt season, causing serious reductions in cereal yields and output [64]. On the other hand, when a La Niña event followed on from an El Niño, favorable and above average vegetation conditions were observed, for instance 2010–2011 and 2016–2017 La Niña events, which followed on from the 2009–2010 and 2014–2015 El Niño events, respectively.
4.2. Spatial and Temporal Trends
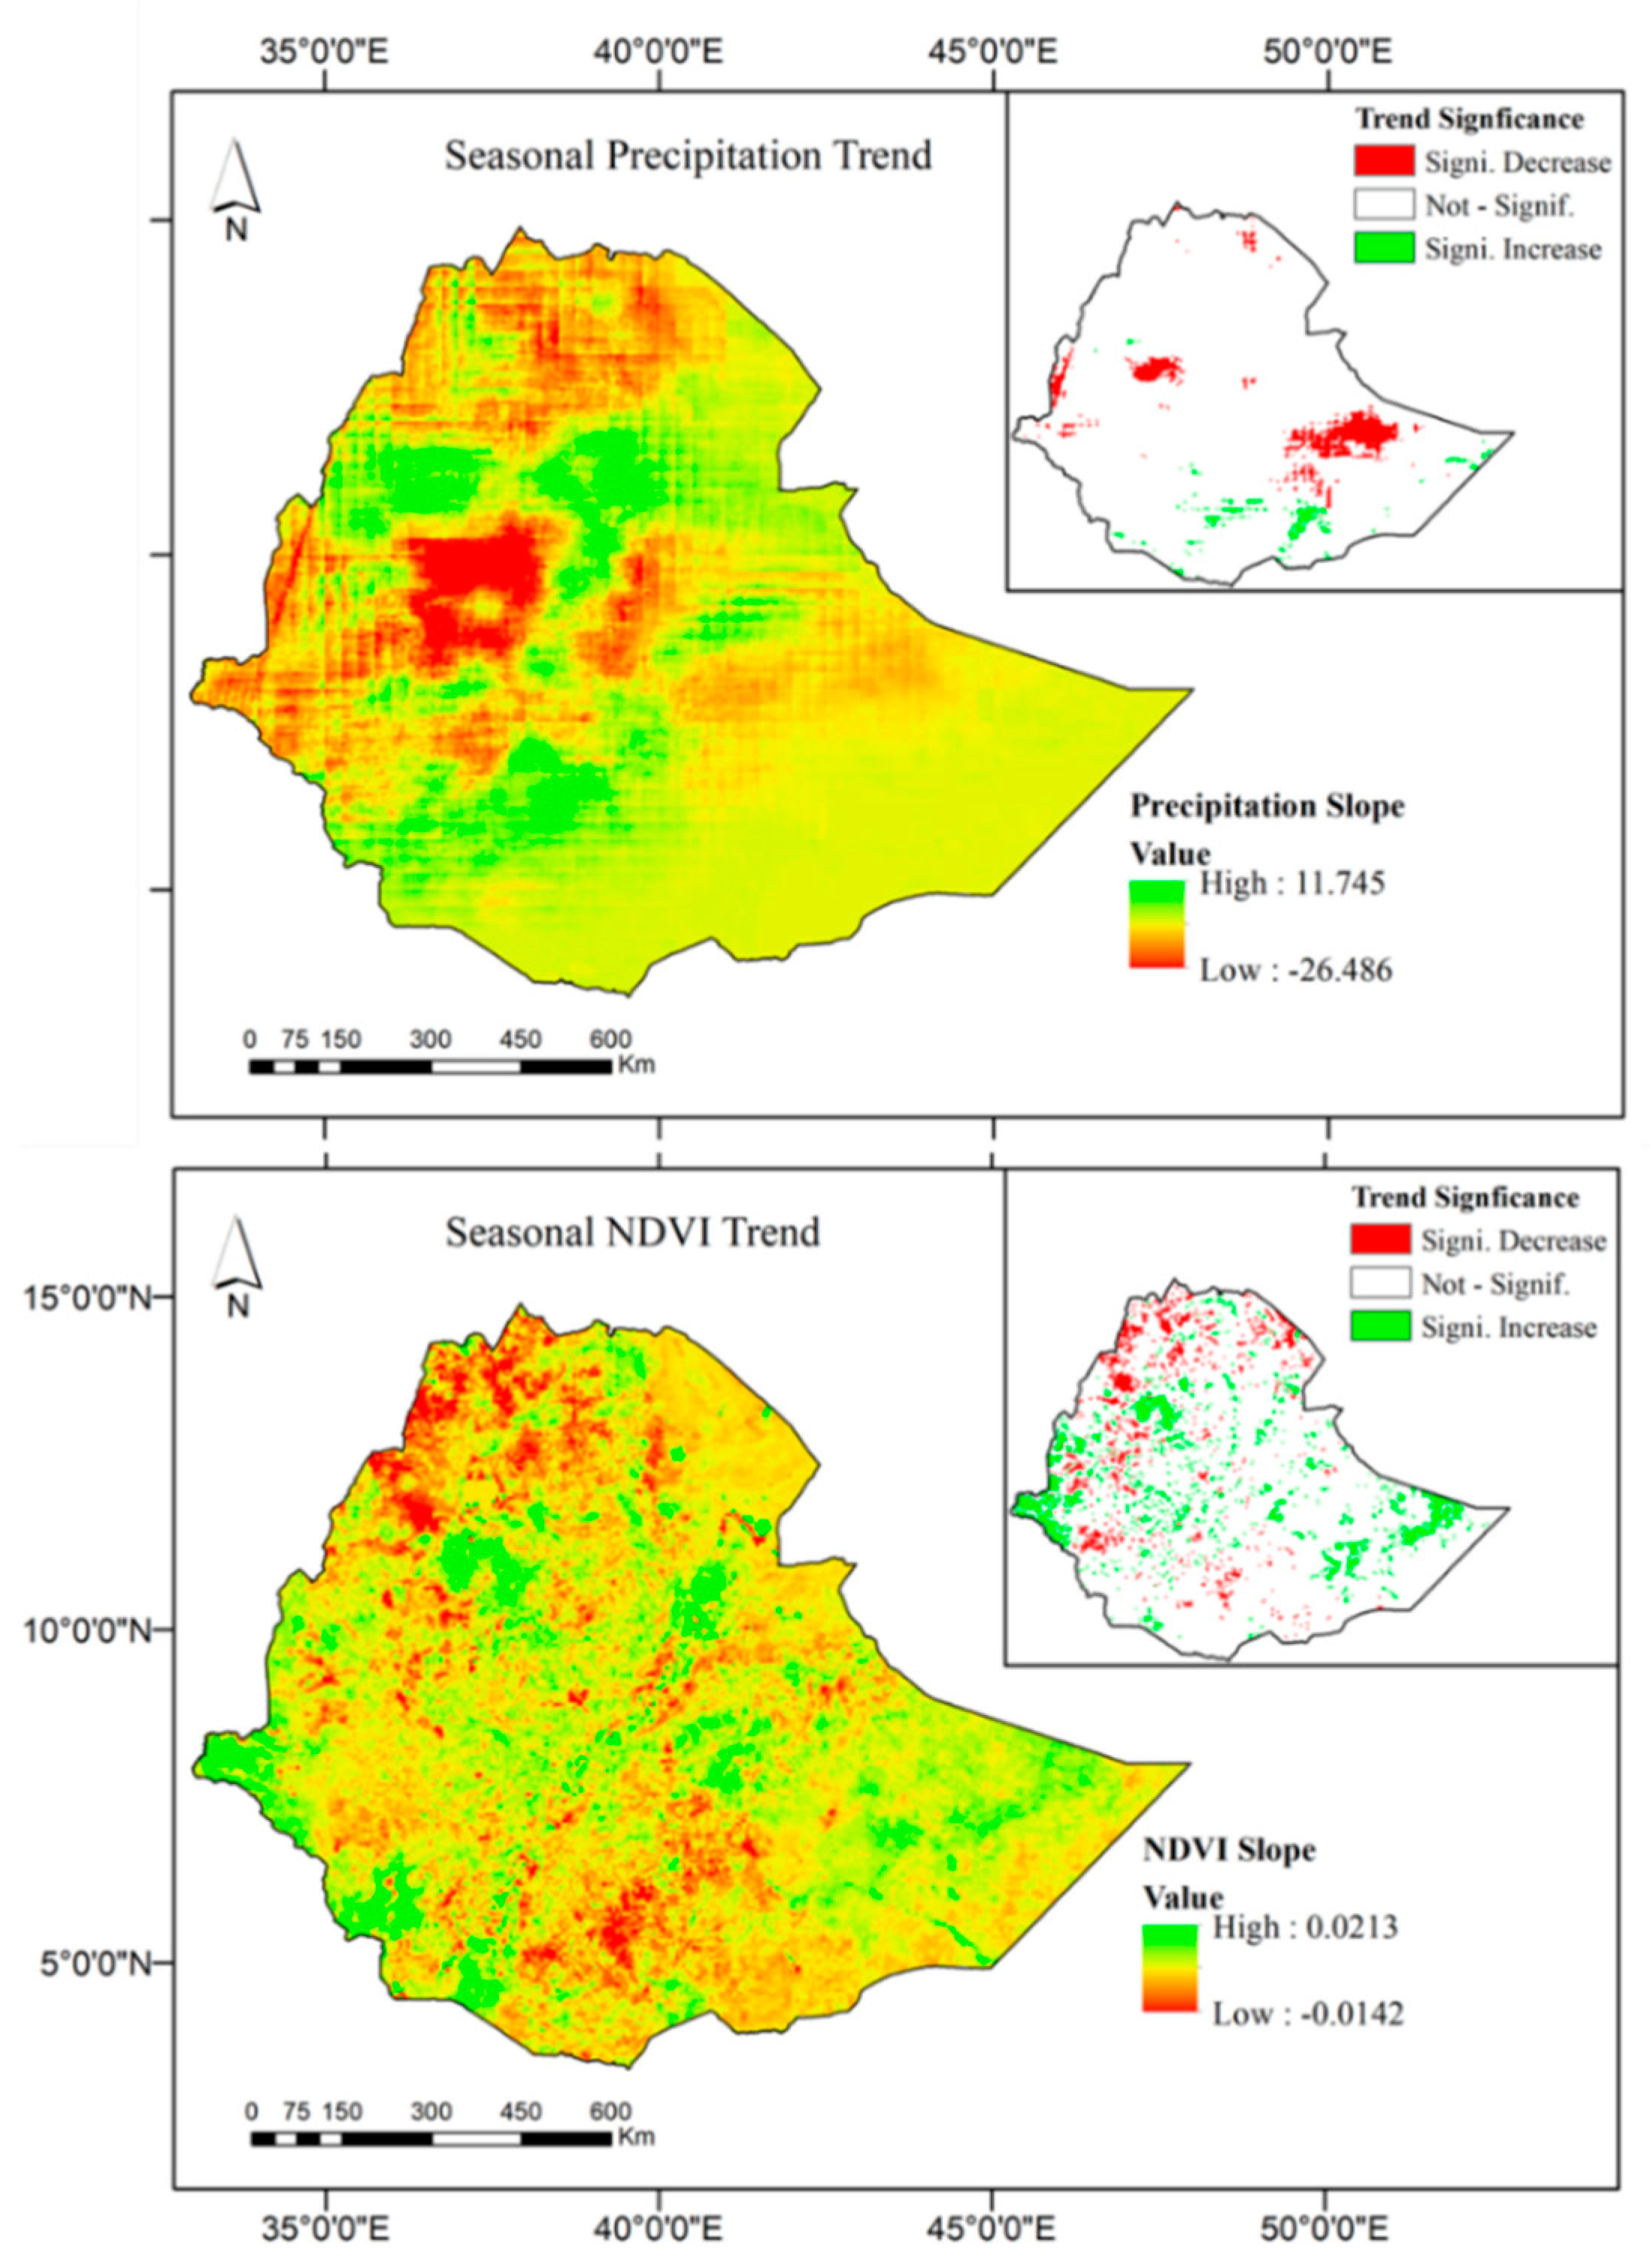
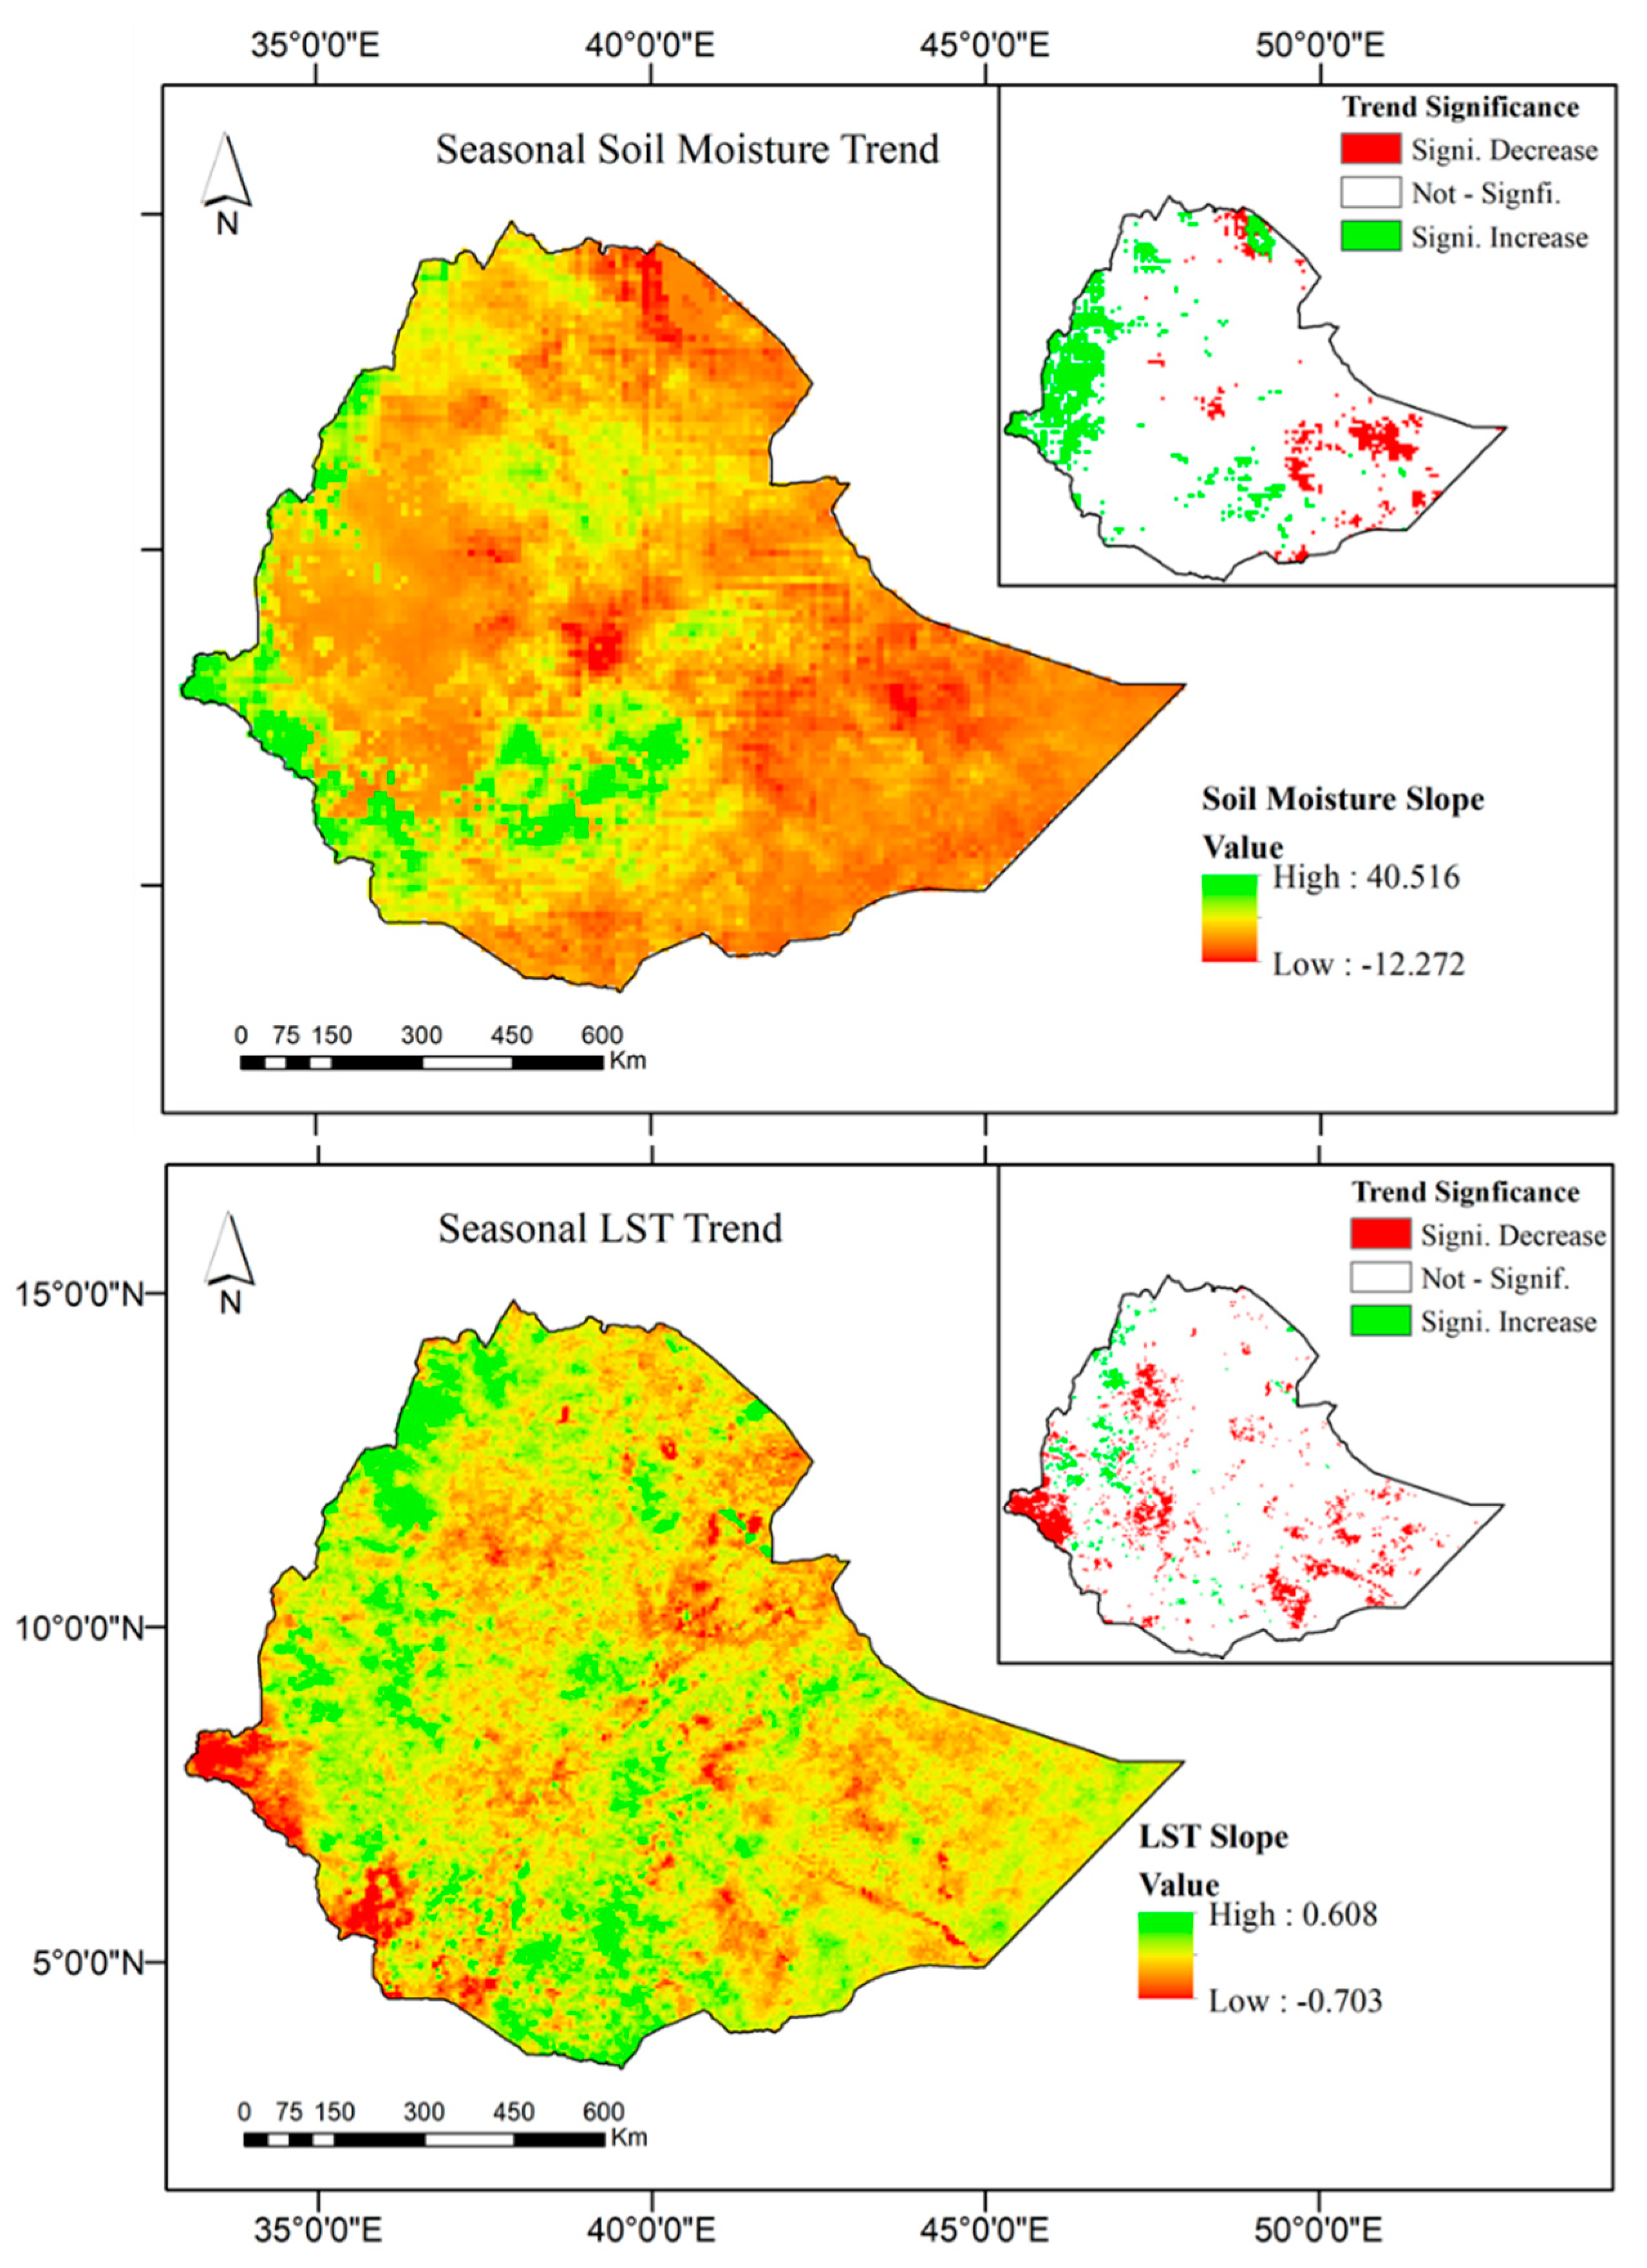
The spatial and temporal variability of the trends, together with the significance of the trends in precipitation, NDVI, soil moisture, and LST, are presented in Figure 6 and Figure 7. The Mann–Kendall test was carried out to observe whether the mentioned variables changed over space during the 18 years period in the country. The areas in green (positive slope value) indicate an increasing monotonic trend in precipitation, NDVI, soil moisture, and LST, whereas areas in red (negative slope value) indicate a decreasing monotonic trend in precipitation, NDVI, soil moisture, and LST.
The pixel-based trend analysis shows the growing season trend values of precipitation range from −26 to 11 mm, with significant changes occurring in the central and northern parts of the country. Specifically, the northern, central, and rift valley regions of Ethiopia experienced a decreasing rainfall trend, whereas western Benshangul and the highlands of the central Amhara region show an increasing trend. On the other hand, the lowland pastoral regions of Somali region did not show a significant trend. Generally speaking, 52.8% of all pixels in the country show a decreasing trend and significant trends concentrate on the central and lowlands regions of the country.
With respect to the NDVI trend, the northern and northwestern areas of the Tigrai and Amhara region, as well as the southern region, showed a decreasing trend during the study period. The growing season NDVI values ranged from −0.0142 to 0.0213, and overall 41.67% of the country indicated a decreasing trend. The significant decreasing trends were located in the northwestern part. Similar pixel-based trend analysis for LST depicted in Figure 7 showed that LST increased for the northwestern, central highland, and southern parts of the country, whereas there was an estimated 11% significance decrease concentrated on the western parts of the Gambella region. These results are in agreement with the recent findings of Workie et al. [65], who used a linear regression approach to detect trends. Similar procedures performed for soil moisture convey that decreasing significant trends can be observed in the central and lowland areas of Afar and Somali regions, whereas the southwestern part of Benshangul and western part of the Gambela region are experiencing a greening trend.
4.3. Multi Linear Regression and Correlation Statistics
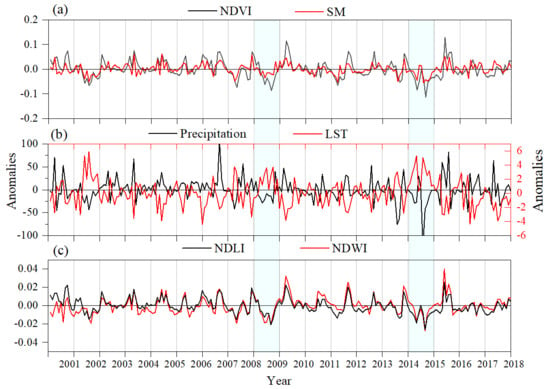
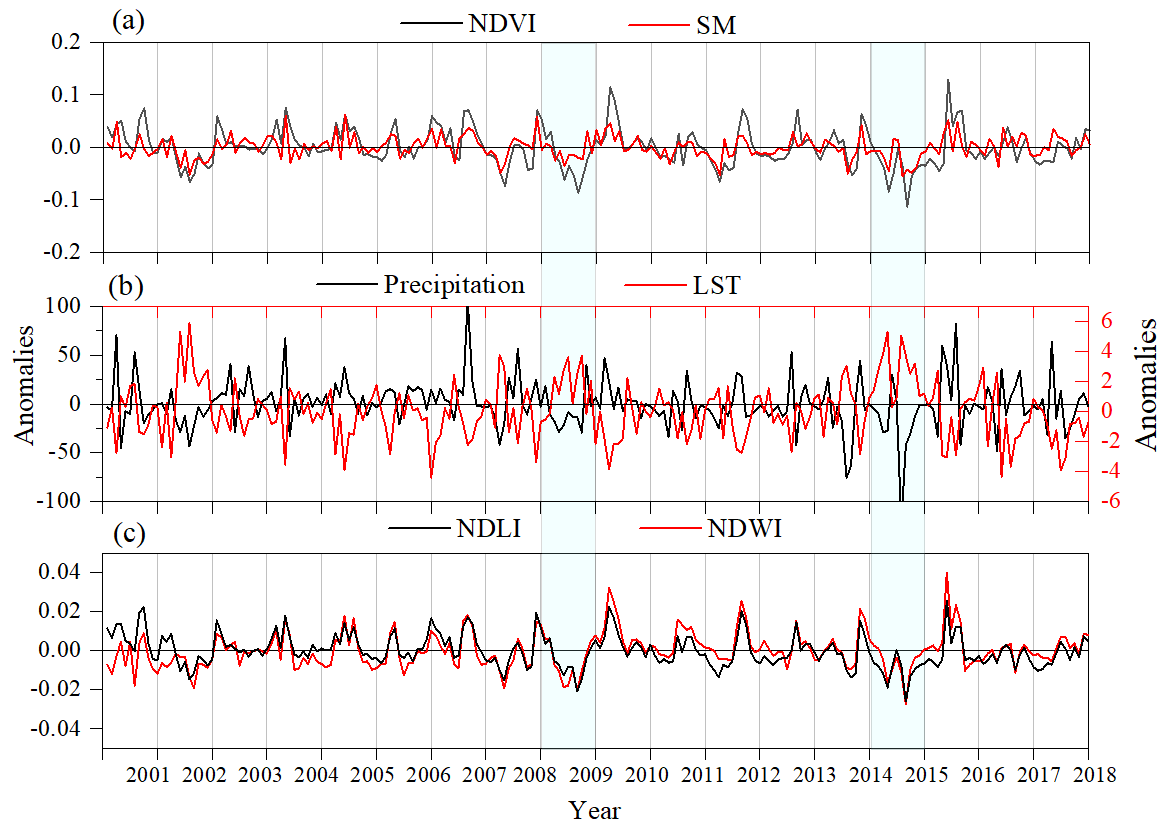
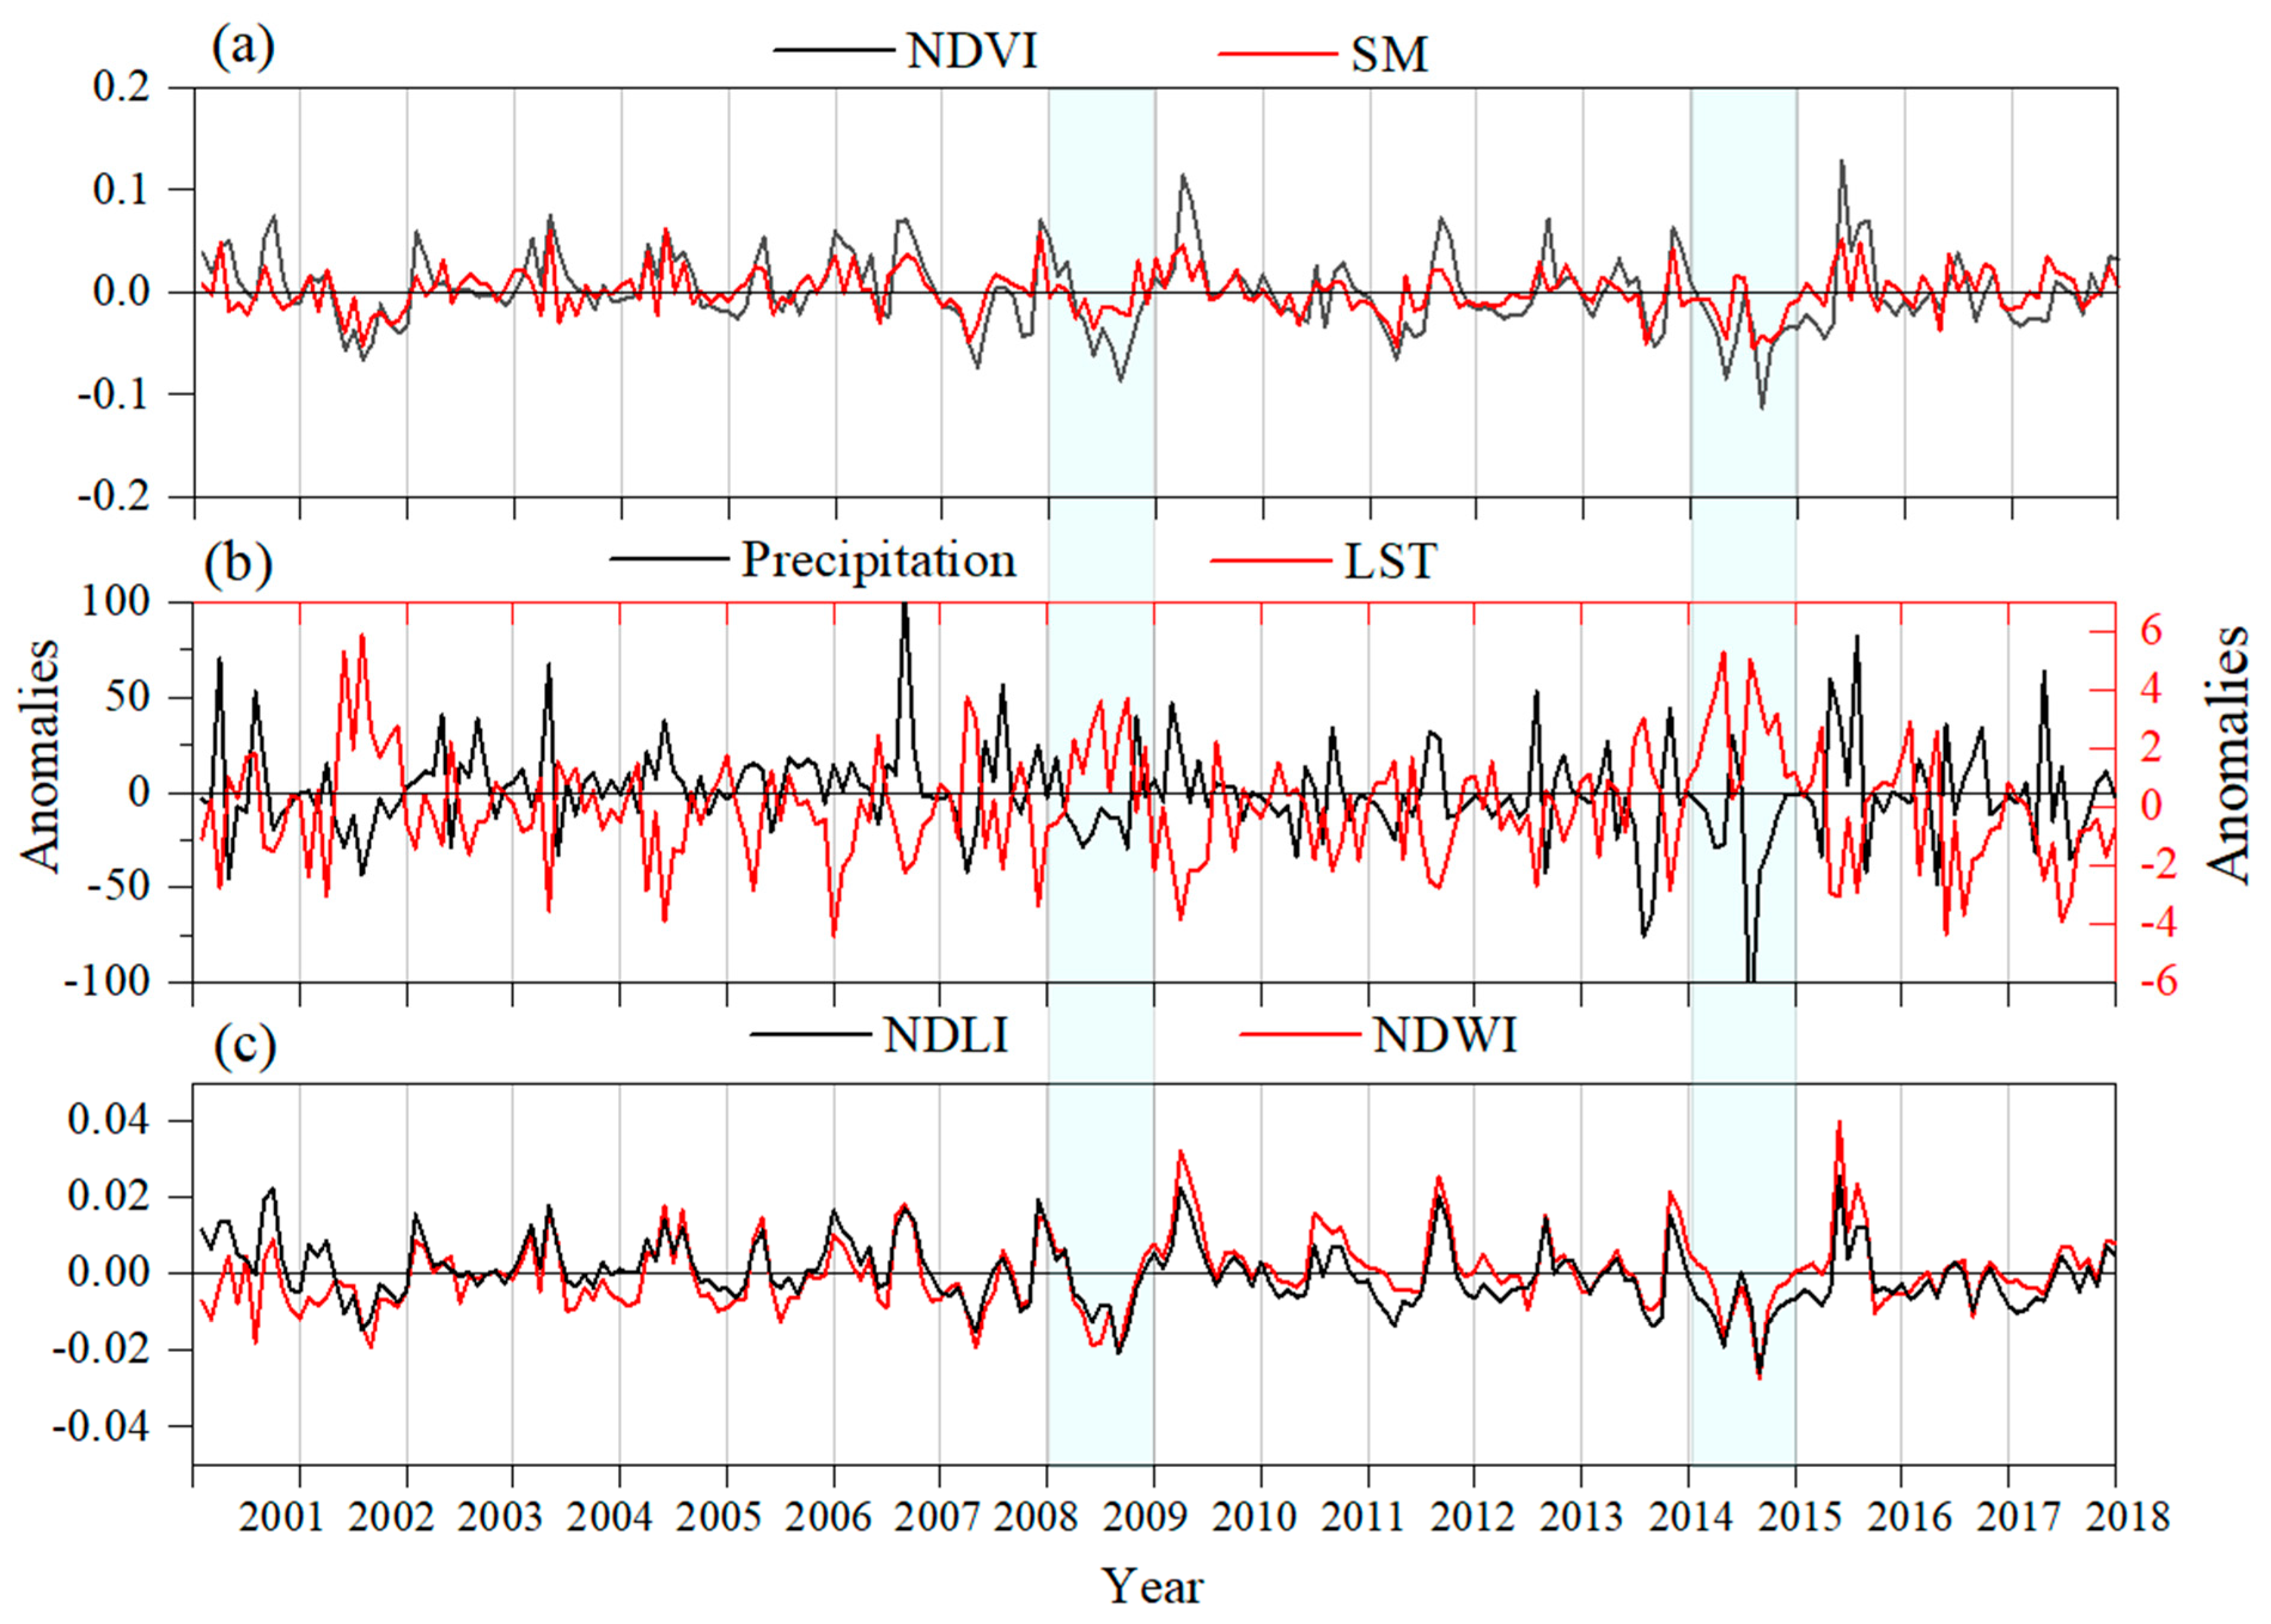
To facilitate relationships between NDVI and other parameters, a small box region (38E–39E, 9N–10N) which experienced significant decreasing trends, presented in Figure 4, Figure 6, and Figure 7 was extracted. Figure 8 shows the monthly anomalies time series plots for NDVI and soil moisture (Figure 8a), precipitation and LST (Figure 8b), and NDLI and NDWI (Figure 8c). Basically, the anomalies calculated by subtracting monthly climatology values from each month provide additional information about the variations present. The periods of severe droughts that resulted in countrywide drought conditions during the growing seasons are shaded with a box in Figure 8.
NDVI anomalies in this region were near normal for several years. In contrast, it showed slight green up in 2010 and late 2016, as conditions translate to weak La Niña. Maximum NDVI departures were observed in 2009 and 2015, where NDVI gradually decreased and remained slightly below average. In particular, the 2015 events were accompanied by higher precipitation anomalies of about −100 mm. There is an exact resemblance between the other parameters, with a clear identification of the drought and normal years. Considering the spatial drought patterns derived from VCI (Figure 5), the intense drought years certainly resulted in a decline in soil moisture and water availability. The water stress situations in the root zone were well captured by soil moisture values. The NDWI and NDLI indicate a similar pattern to that of NDVI, where they reached peaks in 2010 and 2016.
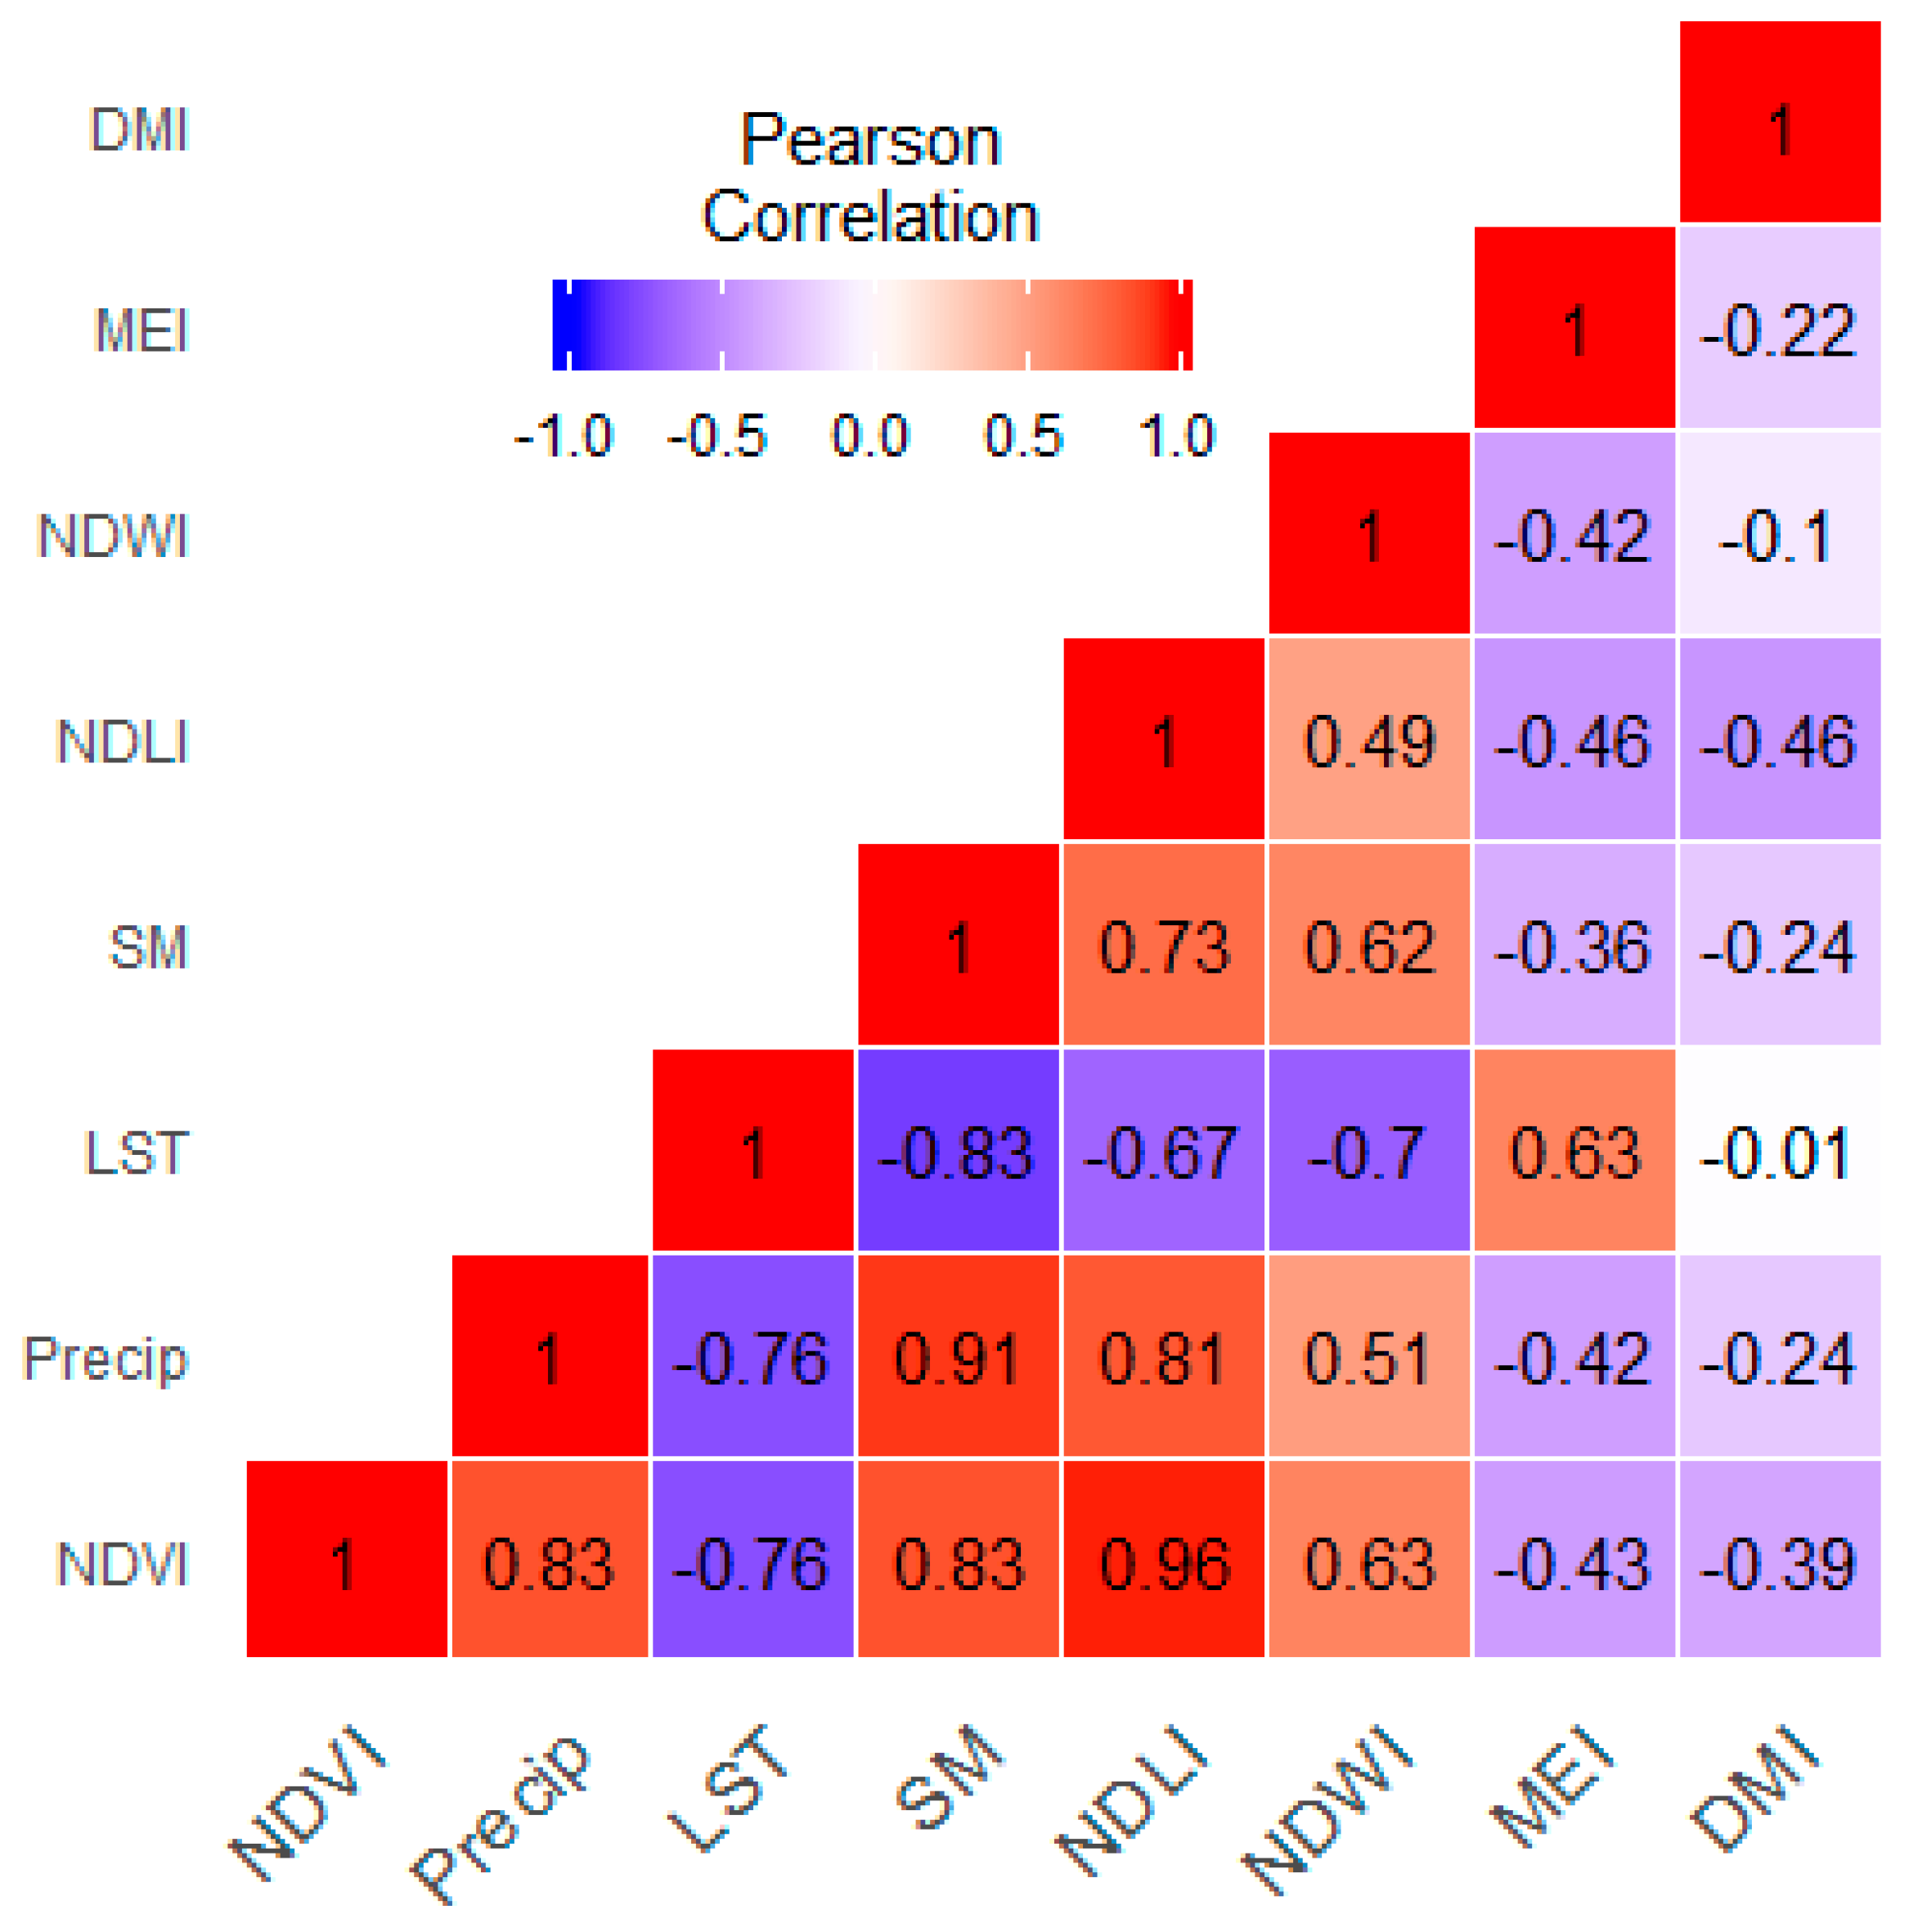
The Pearson correlation coefficients between NDVI and other factors (precipitation, soil moisture, LST, NDWI, NDLI, MEI, and DMI) on a seasonal time scale for the whole study record were computed to assess the relationship between them. The Pearson correlation coefficient was conducted using the statistics package in R. Figure 9 shows the heatmap, which summarizes the linear relationships between the parameters. There was a strong correlation between NDVI and precipitation (r = 0.83) soil moisture (r = 0.83), NDLI (r = 0.96), and NDWI (r = 0.63). The positive correlation between precipitation and NDVI implies that an enhanced precipitation supports vegetation growth and vice versa [66]. On the contrary, a significant negative correlation between NDVI and LST (r = −0.76) was observed. Furthermore, a less notable negative correlation of (r = −0.43, r = −0.39) was observed between NDVI and the two climatic indices MEI and DMI, respectively.
Since there are substantial correlations among NDVI, Precipitation, LST, soil moisture, NDLI, NDWI, MEI, and DMI (Figure 9), the detection of multicollinearity is crucial before plugging data into a regression model. Multicollinearity denotes predictors that are correlated with other predictors. The most widely-used diagnostic for multicollinearity is the VIF. We can see from Table 3 that the VIFs are all down to satisfactory values; they are all less than 5. Even though there is some multicollinearity in our data, it is not severe enough to warrant further corrective measures.
The results in Table 3 reveal the statistically significant relationship between NDVI, NDLI, and NDWI and MEI, with p-values of , and 0.0576, respectively. The significant relationships between NDVI, and NDLI and NDWI make it clear that an increase in water availability causes an upward trend in NDVI, which implies a decline in drought [67]. The results indicate that water availability in the soil was the main influencing factor on the spatially averaged NDVI. The significantly negative correlation between MEI and NDVI reaffirms the claim that ENSO variability plays a major role in the climatic conditions and control vegetation growth conditions of central and northern parts of Ethiopia [68]. The overall multiple linear regression is significant, with a multiple R-squared value of 0.978 and adjusted R-squared value of 0.962. However, precipitation, soil moisture, and LST have insignificant regression coefficients due to their p-values, which are far greater than 0.05. This is due to the interaction (correlation) between the independent variables, and often since p-value is a function of sample size, as well as variance, there is no single rule for setting the “significance” threshold [69]. The insignificant association observed between precipitation and NDVI could also be due to the delayed response of vegetation to precipitation [70], where a time lag effect was not considered in this study. For future prediction, an optimal regression equation (NDVI = −7.01 × 10⁻⁵ + 3.75 × NDLI + 0.518 × NDWI − 1.386 × 10⁻³ × MEI) was obtained via the backward elimination procedure in a stepwise regression analysis, which was achieved by dropping the least significant feature.
5. Conclusions
This study assessed the spatio–temporal variability of drought during the growing season in Ethiopia through VCI, anomaly maps, and trend analysis for the past two decades, from 2001 to 2018. The VCI results identified that severe to extreme countrywide droughts were identified in 2002, 2003, 2004, 2009, 2012, and 2015. On the other hand, the years 2001, 2005, 2006, 2007, 2013, 2016, and 2018 reflected near-normal NDVI throughout most of the rain-fed agriculture regions. These results are coherent with the findings of previous studies in indicating the onset, spatial, and temporal dynamics of agricultural drought in Ethiopia [18]. Pixel-based trend analysis showed that a significant precipitation decrease in the central areas is accompanied by a significant increase in LST. The increase in temperature in the growing season is of major concern, as it implies an increase in evapotranspiration and, thus, affects crop yields. Also, the browning in northwestern parts as estimated from NDVI trends was due to low rainfall and an increase in soil temperature. Furthermore, the anomaly maps for precipitation, soil moisture, and LST help us identify the locations and areas of potential concern regarding reduced crop harvest. We found that large areas of the central highland agricultural farms where people largely depend on rain-fed farms are of major concern due to recurrent drought incidents. Moreover, NDLI has a high correlation with NDVI, precipitation, LST, and soil moisture and successfully captured historical droughts (Figure 8). Additionally, the results of multilinear regression indicate that NDLI, NDWI, and MEI play a significant role in the variability of vegetation health. The analysis shows that using the radiances of green, red, and SWIR, a simplified crop monitoring model with satisfactory accuracy and easiness can be developed. Thus, NDLI can be a tool to help us better understand the vegetation vigor and moisture availability, and subsequently effectively assess large-scale temporal and spatial characteristics of drought.
This analysis can serve as an important input for food security studies and the planning of potential relief measures. However, this approach suffers from the low spatial and temporal resolution satellite images utilized, as this hugely impacts the quality of the trend analysis. Further research on detecting and assessing temporal and spatial trends is needed to offer essential information for planning agencies and government policies to monitor factors that trigger drought and to minimize their impact.
Author Contributions
G.M.M. and Y.-A.L. conceived the research, make helpful discussions during the conception of the research. G.M.M. conducted the research, performed analyses, and wrote the first manuscript draft. Y.-A.L. enhanced and finalized the manuscript for the communication with the journal.
Funding
This work was supported by the Ministry of Science and Technology under Grant MOST 105-2111-M-008-024-MY2 and Grant 105-2221-E-008-056-MY3.
Acknowledgments
The authors would like to thank Ravindra Babu Saginela for the discussion during the conception of the research.
Conflicts of Interest
The authors declare no conflict of interest.
References
- Singh, N.P.; Bantilan, C.; Byjesh, K. Vulnerability and policy relevance to drought in the semi-arid tropics of Asia—A retrospective analysis. Weather Clim. Extrem. 2014, 3, 54–61. [Google Scholar] [CrossRef]
- Nguyen, A.K.; Liou, Y.-A.; Li, M.-H.; Tran, T.A. Zoning eco-environmental vulnerability for environmental management and protection. Ecol. Indic. 2016, 69, 100–117. [Google Scholar] [CrossRef]
- Liou, Y.-A.; Nguyen, A.K.; Li, M.-H. Assessing spatiotemporal eco-environmental vulnerability by Landsat data. Ecol. Indic. 2017, 80, 52–65. [Google Scholar] [CrossRef] [Green Version]
- Nguyen, K.A.; Liou, Y.A. Global mapping of eco-environmental vulnerability from human and nature disturbances. Sci. Total Environ. 2019, 664, 995–1004. [Google Scholar] [CrossRef] [PubMed]
- Nguyen, K.-A.; Liou, Y.-A. Mapping global eco-environment vulnerability due to human and nature disturbances. Methods X 2019, 6, 862–875. [Google Scholar] [CrossRef] [PubMed]
- Nguyen, K.-A.; Liou, Y.-A.; Terry, J.P. Vulnerability of Vietnam to typhoons: A spatial assessment based on hazards, exposure and adaptive capacity. Sci. Total Environ. 2019, 682, 31–46. [Google Scholar] [CrossRef] [PubMed]
- Sitorus, E.; Nguyen, K.A.; Liou, Y.A. Forest fire impact on and vulnerability assessment of eco-environment in tropical rainforest: A case study of leuser ecosystem-Aceh, Indonesia. In AGU Fall Meeting Abstracts; 2018; Available online: http://adsabs.harvard.edu/abs/2018AGUFMGH23B1095S (accessed on 12 April 2019).
- Cheng, C.-H.; Nnadi, F.; Liou, Y.-A. Energy budget on various land use areas using reanalysis data in Florida. Adv. Meteorol. 2014, 2014, 1–13. [Google Scholar] [CrossRef]
- Hayes, M.; Svoboda, M.D.; Wardlow, B.D.; Anderson, M.; Kogan, F. Drought monitoring:Historical and current perspectives. In Remote Sensing of Drought: Innovative Monitoring Approaches; CRC Press: Boca Raton, FL, USA, 2012; pp. 1–19. [Google Scholar]
- Kuri, F.; Murwira, A.; Murwira, K.S.; Masocha, M. Predicting maize yield in Zimbabwe using dry dekads derived from remotely sensed Vegetation Condition Index. Int. J. Appl. Earth Obs. Geoinf. 2014, 33, 39–46. [Google Scholar] [CrossRef]
- Jiao, W.; Zhang, L.; Chang, Q.; Fu, D.; Cen, Y.; Tong, Q. Evaluating an enhanced vegetation condition index (VCI) based on VIUPD for drought monitoring in the continental United States. Remote Sens. 2016, 8, 224. [Google Scholar] [CrossRef]
- Townshend, J.R.G.; Justice, C.O. Analysis of the dynamics of African vegetation using the normalized difference vegetation index. Int. J. Remote Sens. 1986, 7, 1435–1445. [Google Scholar] [CrossRef]
- Kogan, F.N. Droughts of the late 1980s in the United States as derived from NOAA polar-orbiting satellite data. Bull. Am. Meteorol. Soc. 1995, 76, 655–668. [Google Scholar] [CrossRef]
- Dorjsuren, M.; Liou, Y.-A.; Cheng, C.-H. Time series MODIS and in situ data analysis for Mongolia drought. Remote Sens. 2016, 8, 509. [Google Scholar] [CrossRef]
- Tadesse, T.; Demisse, G.B.; Zaitchik, B.; Dinku, T. Satellite-based hybrid drought monitoring tool for prediction of vegetation condition in Eastern Africa: A case study for Ethiopia. Water Resour. Res. 2014, 50, 2176–2190. [Google Scholar] [CrossRef]
- Mckee, T.B.; Doesken, N.J.; Kleist, J. The relationship of drought frequency and duration to time scales. In Proceedings of the 8th Conference on Applied Climatology, Anaheim, CA, USA, 17–22 January 1993; American Meteorological Society: Boston, MA, USA, 1993; pp. 179–184. [Google Scholar]
- Rouse, J., Jr.; Haas, R.H.; Schell, J.A.; Deering, D.W. Monitoring vegetation systems in the Great Plains with ERTS, Third ERTS Symposium. NASA 1973, 1, 309–317. [Google Scholar]
- Gebrehiwot, T.; Van der Veen, A.; Maathuis, B. Governing agricultural drought: Monitoring using the vegetation condition index. Ethiop. J. Environ. Stud. Manag. 2016, 9, 354. [Google Scholar] [CrossRef] [Green Version]
- Cheng, C.-H.; Nnadi, F.; Liou, Y.-A. A Regional Land Use Drought Index for Florida. Remote Sens. 2015, 7, 17149–17167. [Google Scholar] [CrossRef] [Green Version]
- Wu, D.; Qu, J.J.; Hao, X. Agricultural drought monitoring using MODIS-based drought indices over the USA Corn Belt. Int. J. Remote Sens. 2015, 36, 5403–5425. [Google Scholar] [CrossRef]
- Liu, K.; Su, H.; Tian, J.; Li, X.; Wang, W.; Yang, L.; Liang, H. Assessing a scheme of spatial-temporal thermal remote-sensing sharpening for estimating regional evapotranspiration. Int. J. Remote Sens. 2018, 39, 3111–3137. [Google Scholar] [CrossRef]
- Wan, Z.; Wang, P.; Li, X. Using MODIS Land Surface Temperature and Normalized Difference Vegetation Index products for monitoring drought in the southern Great Plains, USA. Int. J. Remote Sens. 2004, 25, 61–72. [Google Scholar] [CrossRef]
- Du, L.; Tian, Q.; Yu, T.; Meng, Q.; Jancso, T.; Udvardy, P.; Huang, Y. A comprehensive drought monitoring method integrating MODIS and TRMM data. Int. J. Appl. Earth Obs. Geoinf. 2013, 23, 245–253. [Google Scholar] [CrossRef]
- Mutowo, G.; Chikodzi, D. Remote sensing based drought monitoring in Zimbabwe. Disaster Prev. Manag. An Int. J. 2014, 23, 649–659. [Google Scholar] [CrossRef]
- Rojas, O.; Vrieling, A.; Rembold, F. Assessing drought probability for agricultural areas in Africa with coarse resolution remote sensing imagery. Remote Sens. Environ. 2011, 115, 343–352. [Google Scholar] [CrossRef]
- Anderson, W.B.; Zaitchik, B.F.; Hain, C.R.; Anderson, M.C.; Yilmaz, M.T.; Mecikalski, J.; Schultz, L. Towards an integrated soil moisture drought monitor for East Africa. Hydrol. Earth Syst. Sci. 2012, 16, 2893–2913. [Google Scholar] [CrossRef] [Green Version]
- Masih, I.; Maskey, S.; Mussá, F.E.F.; Trambauer, P. A review of droughts on the African continent: A geospatial and long-term perspective. Hydrol. Earth Syst. Sci. 2014, 18, 3635–3649. [Google Scholar] [CrossRef]
- Yang, S.; Meng, D.; Gong, H.; Li, X.; Wu, X. Soil drought and vegetation response during 2001–2015 in North China based on GLDAS and MODIS data. Adv. Meteorol. 2018, 2018, 1–14. [Google Scholar] [CrossRef]
- Tsegay Wolde-Georgis. El Niño and Drought Early Warning in Ethiopia. Internet J. Afr. Stud. 1997. Available online: https://papers.ssrn.com/sol3/papers.cfm?abstract_id=1589710 (accessed on 16 March 2019).
- Edossa, D.C.; Babel, M.S.; Das Gupta, A. Drought analysis in the Awash River Basin, Ethiopia. Water Resour. Manag. 2010, 24, 1441–1460. [Google Scholar] [CrossRef]
- Kumar, B.G. Ethiopian famines 1973–1985: A case-study. Polit. Econ. Hunger 1990, 2, 173–216. [Google Scholar]
- Gore, T.; Hillier, D. Climate Change and Future Impacts on Food Security. Oxfam Policy Pract. Agric. Food L. 2011, 11, 57–62. [Google Scholar]
- Ayalew, D.; Tesfaye, K.; Mamo, G.; Yitaferu, B.; Bayu, W. Variability of rainfall and its current trend in Amhara region, Ethiopia. Afr. J. Agric. Res. 2012, 7, 1475–1486. [Google Scholar]
- Schmidt, W.; Peter Uhe, A.; Kimutai, J.; Otto, F.; Cullen, H. Climate and Development Knowledge Network and World Weather Attribution Initiative Raising Risk Awareness; Royal Netherlands Meteorological Institute: De Bilt, The Netherlands, 2017; pp. 2016–2017. [Google Scholar]
- Funk, C.; Peterson, P.; Landsfeld, M.; Pedreros, D.; Verdin, J.; Shukla, S.; Husak, G.; Rowland, J.; Harrison, L.; Hoell, A. The climate hazards infrared precipitation with stations—A new environmental record for monitoring extremes. Sci. Data 2015, 2, 150066. [Google Scholar] [CrossRef] [PubMed]
- Philip, S.; Kew, S.F.; Jan van Oldenborgh, G.; Otto, F.; O’Keefe, S.; Haustein, K.; King, A.; Zegeye, A.; Eshetu, Z.; Hailemariam, K.; et al. Attribution Analysis of the Ethiopian Drought of 2015. J. Clim. 2018, 31, 2465–2486. [Google Scholar] [CrossRef]
- USAID. El niño in Ethiopia, A Real-Time Review of Impacts and Responses2015-2016; USAID: Washington, DC, USA, 2016. Available online: https://www.agri-learning-ethiopia.org/wp-content/uploads/2016/06/AKLDP-El-Nino-Review-March-2016 (accessed on 28 May 2019).
- Camberlin, P. Rainfall anomalies in the source region of the Nile and their connection with the Indian summer monsoon. J. Clim. 1997, 10, 1380–1392. [Google Scholar] [CrossRef]
- Korecha, D.; Sorteberg, A. Validation of operational seasonal rainfall forecast in Ethiopia. Water Resour. Res. 2013, 49, 7681–7697. [Google Scholar] [CrossRef]
- Liou, Y.-A.; Le, M.S.; Chien, H. Normalized difference latent heat index for remote sensing of land surface energy fluxes. IEEE Trans. Geosci. Remote Sens. 2019, 57, 1423–1433. [Google Scholar] [CrossRef]
- Worqlul, A.W.; Jeong, J.; Dile, Y.T.; Osorio, J.; Schmitter, P.; Gerik, T.; Srinivasan, R.; Clark, N. Assessing potential land suitable for surface irrigation using groundwater in Ethiopia. Appl. Geogr. 2017, 85, 1–13. [Google Scholar] [CrossRef]
- Viste, E.; Korecha, D.; Sorteberg, A. Recent drought and precipitation tendencies in Ethiopia. Theor. Appl. Climatol. 2013, 112, 535–551. [Google Scholar] [CrossRef]
- Terefe, T.; Mengistu, G. Spatial and temporal variability of summer rainfall over Ethiopia from observations and a regional climate model experiment climate model experiments. Theor. Appl. Climatol. 2012, 111, 665–681. [Google Scholar]
- Seleshi, Y.; Camberlin, P. Recent changes in dry spell and extreme rainfall events in Ethiopia. Theor. Appl. Climatol. 2006, 83, 181–191. [Google Scholar] [CrossRef]
- Liebmann, B.; Hoerling, M.P.; Funk, C.; Bladé, I.; Dole, R.M.; Allured, D.; Quan, X.; Pegion, P.; Eischeid, J.K. Understanding recent eastern horn of africa rainfall variability and change. J. Clim. 2014, 27, 8630–8645. [Google Scholar] [CrossRef]
- Gebrehiwot, T.; van der Veen, A.; Maathuis, B. Spatial and temporal assessment of drought in the Northern highlands of Ethiopia. Int. J. Appl. Earth Obs. Geoinf. 2011, 13, 309–321. [Google Scholar] [CrossRef]
- Birhane, E.; Ashfare, H.; Fenta, A.A.; Hishe, H.; Gebremedhin, M.A.; Solomon, N. Land use land cover changes along topographic gradients in Hugumburda national forest priority area, Northern Ethiopia. Remote Sens. Appl. Soc. Environ. 2019, 13, 61–68. [Google Scholar] [CrossRef]
- Larbi, I.; Hountondji, F.; Annor, T.; Agyare, W.; Mwangi Gathenya, J.; Amuzu, J.; Larbi, I.; Hountondji, F.C.C.; Annor, T.; Agyare, W.A.; et al. Spatio-temporal trend analysis of rainfall and temperature extremes in the Vea Catchment, Ghana. Climate 2018, 6, 87. [Google Scholar] [CrossRef]
- Muthoni, F.K.; Odongo, V.O.; Ochieng, J.; Mugalavai, E.M.; Mourice, S.K.; Hoesche-Zeledon, I.; Mwila, M.; Bekunda, M. Long-term spatial-temporal trends and variability of rainfall over Eastern and Southern Africa. Theor. Appl. Climatol. 2019, 137, 1869–1882. [Google Scholar] [CrossRef]
- McNally, A.; Arsenault, K.; Kumar, S.; Shukla, S.; Peterson, P.; Wang, S.; Funk, C.; Peters-Lidard, C.D.; Verdin, J.P. A land data assimilation system for sub-Saharan Africa food and water security applications. Sci. Data 2017, 4, 170012. [Google Scholar] [CrossRef] [Green Version]
- Saji, N.H.; Goswami, B.N.; Vinayachandran, P.N.; Yamagata, T. A dipole mode in the tropical Indian Ocean. Nature 1999, 401, 360–363. [Google Scholar] [CrossRef]
- LIU, W.T.; KOGAN, F.N. Monitoring regional drought using the Vegetation Condition Index. Int. J. Remote Sens. 1996, 17, 2761–2782. [Google Scholar] [CrossRef]
- Winkler, L.; Gessner, U.; Hochschild, V. Identifying droughts affecting agrictlture in Africa based on remote sensing time series between 2000-2016: Rainfall anomalies and vegetation condition in the context of ENSO. Remote Sens. 2017, 9, 831. [Google Scholar] [CrossRef]
- Measho, S.; Chen, B.; Trisurat, Y.; Pellikka, P.; Guo, L.; Arunyawat, S.; Tuankrua, V.; Ogbazghi, W.; Yemane, T. Spatio-temporal analysis of vegetation dynamics as a response to climate variability and drought patterns in the Semiarid Region, Eritrea. Remote Sens. 2019, 11, 724. [Google Scholar] [CrossRef]
- Baniya, B.; Tang, Q.; Xu, X.; Haile, G.G.; Chhipi-Shrestha, G. Spatial and temporal variation of drought based on satellite derived vegetation condition index in Nepal from 1982. Sensors 2019, 19, 430. [Google Scholar] [CrossRef]
- De Jong, R.; de Bruin, S.; de Wit, A.; Schaepman, M.E.; Dent, D.L. Analysis of monotonic greening and browning trends from global NDVI time-series. Remote Sens. Environ. 2011, 115, 692–702. [Google Scholar] [CrossRef] [Green Version]
- Sobrino, J.A.; Julien, Y. Global trends in NDVI-derived parameters obtained from GIMMS data. Int. J. Remote Sens. 2011, 32, 4267–4279. [Google Scholar] [CrossRef]
- Julien, Y.; Sobrino, J.A.; Mattar, C.; Ruescas, A.B.; Jiménez-Muñoz, J.C.; Sòria, G.; Hidalgo, V.; Atitar, M.; Franch, B.; Cuenca, J. Temporal analysis of normalized difference vegetation index (NDVI) and land surface temperature (LST) parameters to detect changes in the Iberian land cover between 1981 and 2001. Int. J. Remote Sens. 2011, 32, 2057–2068. [Google Scholar] [CrossRef]
- Sen, P.K. Estimates of the regression coefficient based on Kendall’s Tau. J. Am. Stat. Assoc. 1968, 63, 1379–1389. [Google Scholar] [CrossRef]
- Tian, F.; Wang, Y.; Fensholt, R.; Wang, K.; Zhang, L.; Huang, Y. Remote sensing mapping and evaluation of NDVI trends from synthetic time series obtained by blending landsat and MODIS data around a coalfield on the Loess Plateau. Remote Sens. 2000, 5, 4255–4279. [Google Scholar] [CrossRef]
- Ravindrababu, S.; Ratnam, M.; Basha, G.; Liou, Y.-A.; Reddy, N. Large anomalies in the tropical upper troposphere lower stratosphere (UTLS) trace gases observed during the Extreme 2015–2016 El Niño Event by using satellite measurements. Remote Sens. 2019, 11, 687. [Google Scholar] [CrossRef]
- Anyamba, A.; Glennie, E.; Small, J.; Anyamba, A.; Glennie, E.; Small, J. Teleconnections and Interannual Transitions as Observed in African Vegetation: 2015. Remote Sens. 2018, 10, 1038. [Google Scholar] [CrossRef]
- Cochrane, L.; Bekele, Y.W. Average crop yield (2001–2017) in Ethiopia: Trends at national, regional and zonal levels. Data Br. 2018, 16, 1025–1033. [Google Scholar] [CrossRef]
- Korecha, D.; Barnston, A.G.; Korecha, D.; Barnston, A.G. Predictability of June–September rainfall in Ethiopia. Mon. Weather Rev. 2007, 135, 628–650. [Google Scholar] [CrossRef]
- Workie, T.G.; Debella, H.J. Climate change and its effects on vegetation phenology across ecoregions of Ethiopia. Glob. Ecol. Conserv. 2018, 13, e00366. [Google Scholar] [CrossRef]
- Yan, D.; Xu, T.; Girma, A.; Yuan, Z.; Weng, B.; Qin, T.; Do, P.; Yuan, Y.; Yan, D.; Xu, T.; et al. Regional Correlation between precipitation and vegetation in the Huang-Huai-Hai River Basin, China. Water 2017, 9, 557. [Google Scholar] [CrossRef]
- Zhao, W.; Zhao, X.; Zhou, T.; Wu, D.; Tang, B.; Wei, H. Climatic factors driving vegetation declines in the 2005 and 2010 Amazon droughts. PLoS ONE 2017, 12, e0175379. [Google Scholar] [CrossRef]
- Degefu, M.A.; Rowell, D.P.; Bewket, W. Teleconnections between Ethiopian rainfall variability and global SSTs: Observations and methods for model evaluation. Meteorol. Atmos. Phys. 2017, 129, 173–186. [Google Scholar] [CrossRef]
- Greenland, S.; Senn, S.J.; Rothman, K.J.; Carlin, J.B.; Poole, C.; Goodman, S.N.; Altman, D.G. Statistical tests, P values, confidence intervals, and power: A guide to misinterpretations. Eur. J. Epidemiol. 2016, 31, 337–350. [Google Scholar] [CrossRef]
- Wu, D.; Zhao, X.; Liang, S.; Zhou, T.; Huang, K.; Tang, B.; Zhao, W. Time-lag effects of global vegetation responses to climate change. Glob. Chang. Biol. 2015, 21, 3520–3531. [Google Scholar] [CrossRef]
Figure 1.
Location of the study area: the administrative boundary of Ethiopia, constituting the nine regional states, with a background showing an Advanced Spaceborne Thermal Emission and Reflection Radiometer digital elevation model of 30 m resolution.
Figure 1.
Location of the study area: the administrative boundary of Ethiopia, constituting the nine regional states, with a background showing an Advanced Spaceborne Thermal Emission and Reflection Radiometer digital elevation model of 30 m resolution.

Figure 2.
Long-term seasonal average of rainfall (mm), land surface temperature (LST, °C), normalized difference vegetation index (NDVI), and soil moisture (m3m−3) for the period from 2001 to 2018.
Figure 2.
Long-term seasonal average of rainfall (mm), land surface temperature (LST, °C), normalized difference vegetation index (NDVI), and soil moisture (m3m−3) for the period from 2001 to 2018.

Figure 3.
Land cover map of Ethiopia at 20 m spatial resolution during 2016, extracted from the European Space Agency.
Figure 3.
Land cover map of Ethiopia at 20 m spatial resolution during 2016, extracted from the European Space Agency.

Figure 4.
Standardized seasonal precipitation, LST, NDVI, and soil moisture anomalies from the 2001–2014 climatology averaged over June–September.
Figure 4.
Standardized seasonal precipitation, LST, NDVI, and soil moisture anomalies from the 2001–2014 climatology averaged over June–September.

Figure 5.
The spatio–temporal variability droughts detected by the NDVI-based vegetation condition. index for the growing season in Ethiopia for the period 2001 to 2018.
Figure 5.
The spatio–temporal variability droughts detected by the NDVI-based vegetation condition. index for the growing season in Ethiopia for the period 2001 to 2018.

Figure 6.
Spatial and temporal trends of seasonal precipitation, and NDVI in Ethiopia from 2001 to 2018. Positive slope values indicate an increasing monotonic trend, while negative slope values indicate a decreasing monotonic trend.
Figure 6.
Spatial and temporal trends of seasonal precipitation, and NDVI in Ethiopia from 2001 to 2018. Positive slope values indicate an increasing monotonic trend, while negative slope values indicate a decreasing monotonic trend.

Figure 7.
Spatial and temporal trends of seasonal LST and soil moisture in Ethiopia from 2001 to 2018. Positive slope values indicate an increasing monotonic trend, while negative slope values indicate a decreasing monotonic trend.
Figure 7.
Spatial and temporal trends of seasonal LST and soil moisture in Ethiopia from 2001 to 2018. Positive slope values indicate an increasing monotonic trend, while negative slope values indicate a decreasing monotonic trend.

Figure 8.
The monthly mean anomaly time series values of (a) NDVI and soil moisture, (b) precipitation and LST, and (c) NDLI and NDWI for 38E–39E, 9N–10N.
Figure 8.
The monthly mean anomaly time series values of (a) NDVI and soil moisture, (b) precipitation and LST, and (c) NDLI and NDWI for 38E–39E, 9N–10N.

Figure 9.
The heat map of Pearson correlation coefficients for NDVI, Precipitation, LST, soil moisture, NDLI, NDWI, MEI, and DMI.
Figure 9.
The heat map of Pearson correlation coefficients for NDVI, Precipitation, LST, soil moisture, NDLI, NDWI, MEI, and DMI.


Table 1.
Datasets characteristics and source.
| Data | Source | Characteristics |
|---|---|---|
| Precipitation | CHIRPS | Monthly precipitation at 0.05 × 0.05 from Jan. 2001 to Dec. 2018 |
| NDVI | MODIS | Monthly NDVI at 250 m from Jan. 2001 to Dec. 2018 |
| LST | MODIS | Monthly LST at 1 km from Jan. 2001 to Dec. 2018 |
| NDWI | MODIS | Estimated from surface reflectance at 500 m from Jan. 2001 to Dec. 2018 |
| NDLI | MODIS | Estimated from surface reflectance at 500 m from Jan. 2001 to Dec. 2018 |
| Soil Moisture | FLDAS Noah | Monthly soil moisture (0–10cm) at 0.10 × 0.10 from Jan. 2001 to Dec. 2018 |
| MEI | NOAA | Monthly MEI time series from Jan. 2001 to Dec. 2018 |
| DMI | JAMSTEC | Monthly DMI time series from Jan. 2001 to Dec. 2018 |
Table 2.
Drought categories derived from the Vegetation Condition Index (VCI).
| VCI Percentage | Drought Severity Level |
|---|---|
| >35 | No drought |
| 20–35 | Moderate drought |
| 10–20 | Severe drought |
| <10 | Extreme drought |
Table 3.
The output of the multiple linear regression (MLR) model, in which NDVI was the dependent variable and precipitation, LST, soil moisture, NDWI, NDLI, MEI, and DMI were independent variables.
Table 3.
The output of the multiple linear regression (MLR) model, in which NDVI was the dependent variable and precipitation, LST, soil moisture, NDWI, NDLI, MEI, and DMI were independent variables.
| Variable | Estimate | Std. Error | t-Value | p-Value | Sig | VIF |
|---|---|---|---|---|---|---|
| Precip. | −2.215 × 10⁻⁵ | 3.788 × 10⁻⁵ | −0.585 | 0.5594 | 2.387 | |
| LST | 4.577 × 10⁻⁴ | 6.140 × 10⁻⁴ | 0.745 | 0.456 | 3.433 | |
| SM | 5.505 × 10⁻² | 6.104 × 10⁻² | 0.902 | 0.368 | 4.622 | |
| NDLI | 3.697 | 1.363 × 10⁻¹ | 27.125 | <2.00 × 10⁻¹⁶ | *** | 3.407 |
| NDWI | 0.528 | 1.097 × 10⁻¹ | 4.813 | 2.86 × 10⁻⁶ | *** | 2.804 |
| MEI | −1.470 × 10⁻³ | 7.704 × 10⁻⁴ | −1.909 | 0.0576 | . | 1.089 |
| DMI | −4.552 × 10⁻⁴ | 5.439 × 10⁻³ | −0.187 | 0.852 | 1.099 |
Significance. codes: 0 ‘***’ 0.001 ‘**’ 0.01 ‘*’ 0.05 ‘.’ 0.1 ‘ ’ 1.
© 2019 by the authors. Licensee MDPI, Basel, Switzerland. This article is an open access article distributed under the terms and conditions of the Creative Commons Attribution (CC BY) license (http://creativecommons.org/licenses/by/4.0/).
Share and Cite
MDPI and ACS Style
Liou, Y.-A.; Mulualem, G.M. Spatio–temporal Assessment of Drought in Ethiopia and the Impact of Recent Intense Droughts. Remote Sens. 2019, 11, 1828. https://0-doi-org.brum.beds.ac.uk/10.3390/rs11151828
AMA Style
Liou Y-A, Mulualem GM. Spatio–temporal Assessment of Drought in Ethiopia and the Impact of Recent Intense Droughts. Remote Sensing. 2019; 11(15):1828. https://0-doi-org.brum.beds.ac.uk/10.3390/rs11151828
Chicago/Turabian StyleLiou, Yuei-An, and Getachew Mehabie Mulualem. 2019. "Spatio–temporal Assessment of Drought in Ethiopia and the Impact of Recent Intense Droughts" Remote Sensing 11, no. 15: 1828. https://0-doi-org.brum.beds.ac.uk/10.3390/rs11151828
Note that from the first issue of 2016, this journal uses article numbers instead of page numbers. See further details here.