Technical Note

Leveraging Commercial High-Resolution Multispectral Satellite and Multibeam Sonar Data to Estimate Bathymetry: The Case Study of the Caribbean Sea

1
Environment Systems Ltd., Aberystwyth SY23 3AH, UK
2
German Aerospace Center (DLR), Remote Sensing Technology Institute, Rutherfordstraße 2, 12489 Berlin, Germany
3
Foundation for Research and Technology—Hellas (FORTH), Institute of Applied and Computational Mathematics, N. Plastira 100, Vassilika Vouton, 70013 Heraklion, Greece
4
German Aerospace Center (DLR), Earth Observation Center (EOC), 82234 Weßling, Germany
*
Authors to whom correspondence should be addressed.
Remote Sens. 2019, 11(15), 1830; https://0-doi-org.brum.beds.ac.uk/10.3390/rs11151830
Submission received: 27 June 2019 / Revised: 26 July 2019 / Accepted: 2 August 2019 / Published: 6 August 2019
(This article belongs to the Special Issue Satellite Derived Bathymetry)

Abstract

:
The global coastal seascape offers a multitude of ecosystem functions and services to the natural and human-induced ecosystems. However, the current anthropogenic global warming above pre-industrial levels is inducing the degradation of seascape health with adverse impacts on biodiversity, economy, and societies. Bathymetric knowledge empowers our scientific, financial, and ecological understanding of the associated benefits, processes, and pressures to the coastal seascape. Here we leverage two commercial high-resolution multispectral satellite images of the Pleiades and two multibeam survey datasets to measure bathymetry in two zones (0–10 m and 10–30 m) in the tropical Anguilla and British Virgin Islands, northeast Caribbean. A methodological framework featuring a combination of an empirical linear transformation, cloud masking, sun-glint correction, and pseudo-invariant features allows spatially independent calibration and test of our satellite-derived bathymetry approach. The best R2 and RMSE for training and validation vary between 0.44–0.56 and 1.39–1.76 m, respectively, while minimum vertical errors are less than 1 m in the depth ranges of 7.8–10 and 11.6–18.4 m for the two explored zones. Given available field data, the present methodology could provide simple, time-efficient, and accurate spatio-temporal satellite-derived bathymetry intelligence in scientific and commercial tasks i.e., navigation, coastal habitat mapping and resource management, and reducing natural hazards.

Graphical Abstract

1. Introduction

Extending over 1.6 million square kilometres of coastline [1], the global seascape (corals, seagrasses, mangroves, tidal flats) is front and centre in supporting Earth’s interconnected natural and human ecosystems. Over three billion people live near, and rely on, the coastal seascape for their food, energy, water, protection, and livelihoods. Economic activities associated with the coastal environment totalled to US$750 billion in 2010, which under a “business-as-usual scenario” is expected to nearly triple by 2030 [2]. However, during the Anthropocene Epoch [3]—the era of significant human influence on the Earth’s climate—a projected global warming of 1.5 °C, and more significantly of 2.0 °C, above pre-industrial levels could induce detrimental and irreversible impacts on the health of the coastal seascape. This would exacerbate the risks (e.g., extreme weather events, failure of climate-change mitigation and adaptation, natural and human-made disasters, biodiversity loss and ecosystem collapse, and water crises) across biodiversity, water, food, energy, and well-being [4,5].
Bathymetry is a fundamental property of the global coastal seascape. It provides insights into the scientific, economic, and ecological processes and pressures acting upon coastal regions. Knowledge of the seabed morphology is important for effective coastal resource management (i.e., coastline conservation, maritime spatial planning, and blue economy), safe navigation, coastal development, improved benthic habitat mapping and monitoring, and support in mitigation plans for natural hazards. Historically, instruments and sensors have been mapping bathymetry by actively, or passively, measuring sound (such as single beam (SBES) and multibeam echosounders (MBES)), or light (including satellite-derived bathymetry (SDB), Light Detection and Ranging (LiDAR), and Satellite Altimetry) [6].
Focusing on the optical and passive domain of bathymetry estimation, SDB has been traditionally a time and cost-efficient approach for calculating water depth with small processing requirements in shallow, remote, and large regions. Emerging in the 1970s, SDB from multispectral satellite images has featured mainly empirical methods which establish linear and log-transformed ratio-based statistical relationships between visible wavelength bands and in situ depth values, over the optically shallow benthos, most commonly the first 15 m of depth [7,8]. Whether the seafloor is optically shallow or not depends on the physical environment and the satellite remote sensing technology. The physical environment conditions concern the atmosphere (e.g., aerosols, clouds), water surface (e.g., waves, sun-glint, sky-glint), and water column conditions (e.g., turbidity, suspended material), at the time of image acquisition. The remote sensing technology relates to the satellite instrument per se (e.g., signal-to-noise-ratio, satellite sensor pointing and geometry). Empirical relationships feature three assumptions: (a) Field observations used to train and validate the resulting empirical models are spatially independent of each other; (b) model residuals display a normal distribution and random location; and (c) homogeneous and unvarying water column and seabed albedo.
In the last 20 years, in addition to empirical approaches, a plethora of new SDB methods has been presented: Semi-analytical, analytical, and physics-based, following the model-driven spectral optimisation technique of [9,10]; photogrammetric [11,12]; and hybrid [13]. The advantages of such approaches over the aforementioned empirical methods are their higher accuracy and robustness to variable water column optical conditions and bottom types, and their extrapolation ability beyond the extent of the employed in situ data (i.e., not scene and/or site-specific). In contrast, physics-based, photogrammetric, and hybrid SDB methods require greater computational power, in situ data availability, and technical capacity.
In the last decade, technological advances in Earth observation, cloud-computing platforms, artificial intelligence, and constellations of higher spatial, temporal, and radiometric resolution satellite sensors, have enabled new methodological developments, as well as scientific, operational, and commercial applications in the domain of SDB. From small-scale, single-image approaches in specialised software and local servers [14,15,16], to large-scale multi-temporal practices, commonly within cloud geospatial platforms [17,18,19,20], these applications have been unlocking the potential and increasing the value of bathymetric estimations from space.
Independently of the remote sensing technology advances, suitable field bathymetric datasets to calibrate and validate relevant SDB models and products have been integral to the scale and accuracy of most SDB approaches since the 1970s. It is these elements that facilitate the future scalability, democratisation, standardisation, and automation in this coastal remote sensing domain. The calibration and validation observations have been collected and offered by acoustic and optical means of various spatial resolutions and accuracies from SBES, MBES, and LiDAR [7,8,12,14,15,16,17,18,19,20].
The problems of the currently available bathymetry datasets for small government departments relate to a lack of spatial resolution, spatial coverage [21], and the temporal frequency of repeatable surveys. SBES, MBES, and LiDAR models capture the spatial resolution required, but not always at the spatial coverage needed and at reasonable costs. An SDB approach allows departments to utilise the benefits of Earth observation imagery, extrapolating the accuracy from MBES data, potentially across entire exclusive economic zones (EEZ). However, intersecting field observations are still required but are not always available; a common problem for most small Caribbean island countries. The methodology of [18], initially applied to Sentinel-2 in Google Earth Engine (GEE), allows for the application of SDB from in situ data collected ~566 km away. If the method was transferrable to Caribbean waters, using ~2m resolution imagery and trained software staff, it would provide local government departments access to much-needed bathymetry data for marine spatial planning (at a suitable spatial resolution, spatial extent, and at relatively low cost), utilising in situ data collected from a more data-rich island.
Here, we leverage the commercial high-resolution (2 m) multispectral satellite imagery of the Pleiades and multibeam field soundings to estimate bathymetry in two locations around the tropical islands of Anguilla and the British Virgin Islands (BVI), in the northeast Caribbean. The aim of this study is to explore the suitability of the combination of high-resolution satellite and multibeam data, and the methodology of [18] for bathymetry extraction in a tropical benthic seascape. To achieve this, we exploit two different MBES surveys, collected nearly simultaneously with two Pleiades satellite images, to apply the designed methodology of [18] in a local-server and single-scene exercise. In addition to a statistical assessment, we review the suitability of our SDB approach in a tropical seascape environment, according to the International Hydrographic Organization’s (IHO) Category Zones of Confidence (CATZOC) depth ranges—0–10 m and 10–30 m [22]—to keep in mind the potential application of uses within navigation. Last but not least, we discuss what we consider as the three most significant elements for repeatable planetary-scale SDB calculations.

2. Materials and Methods
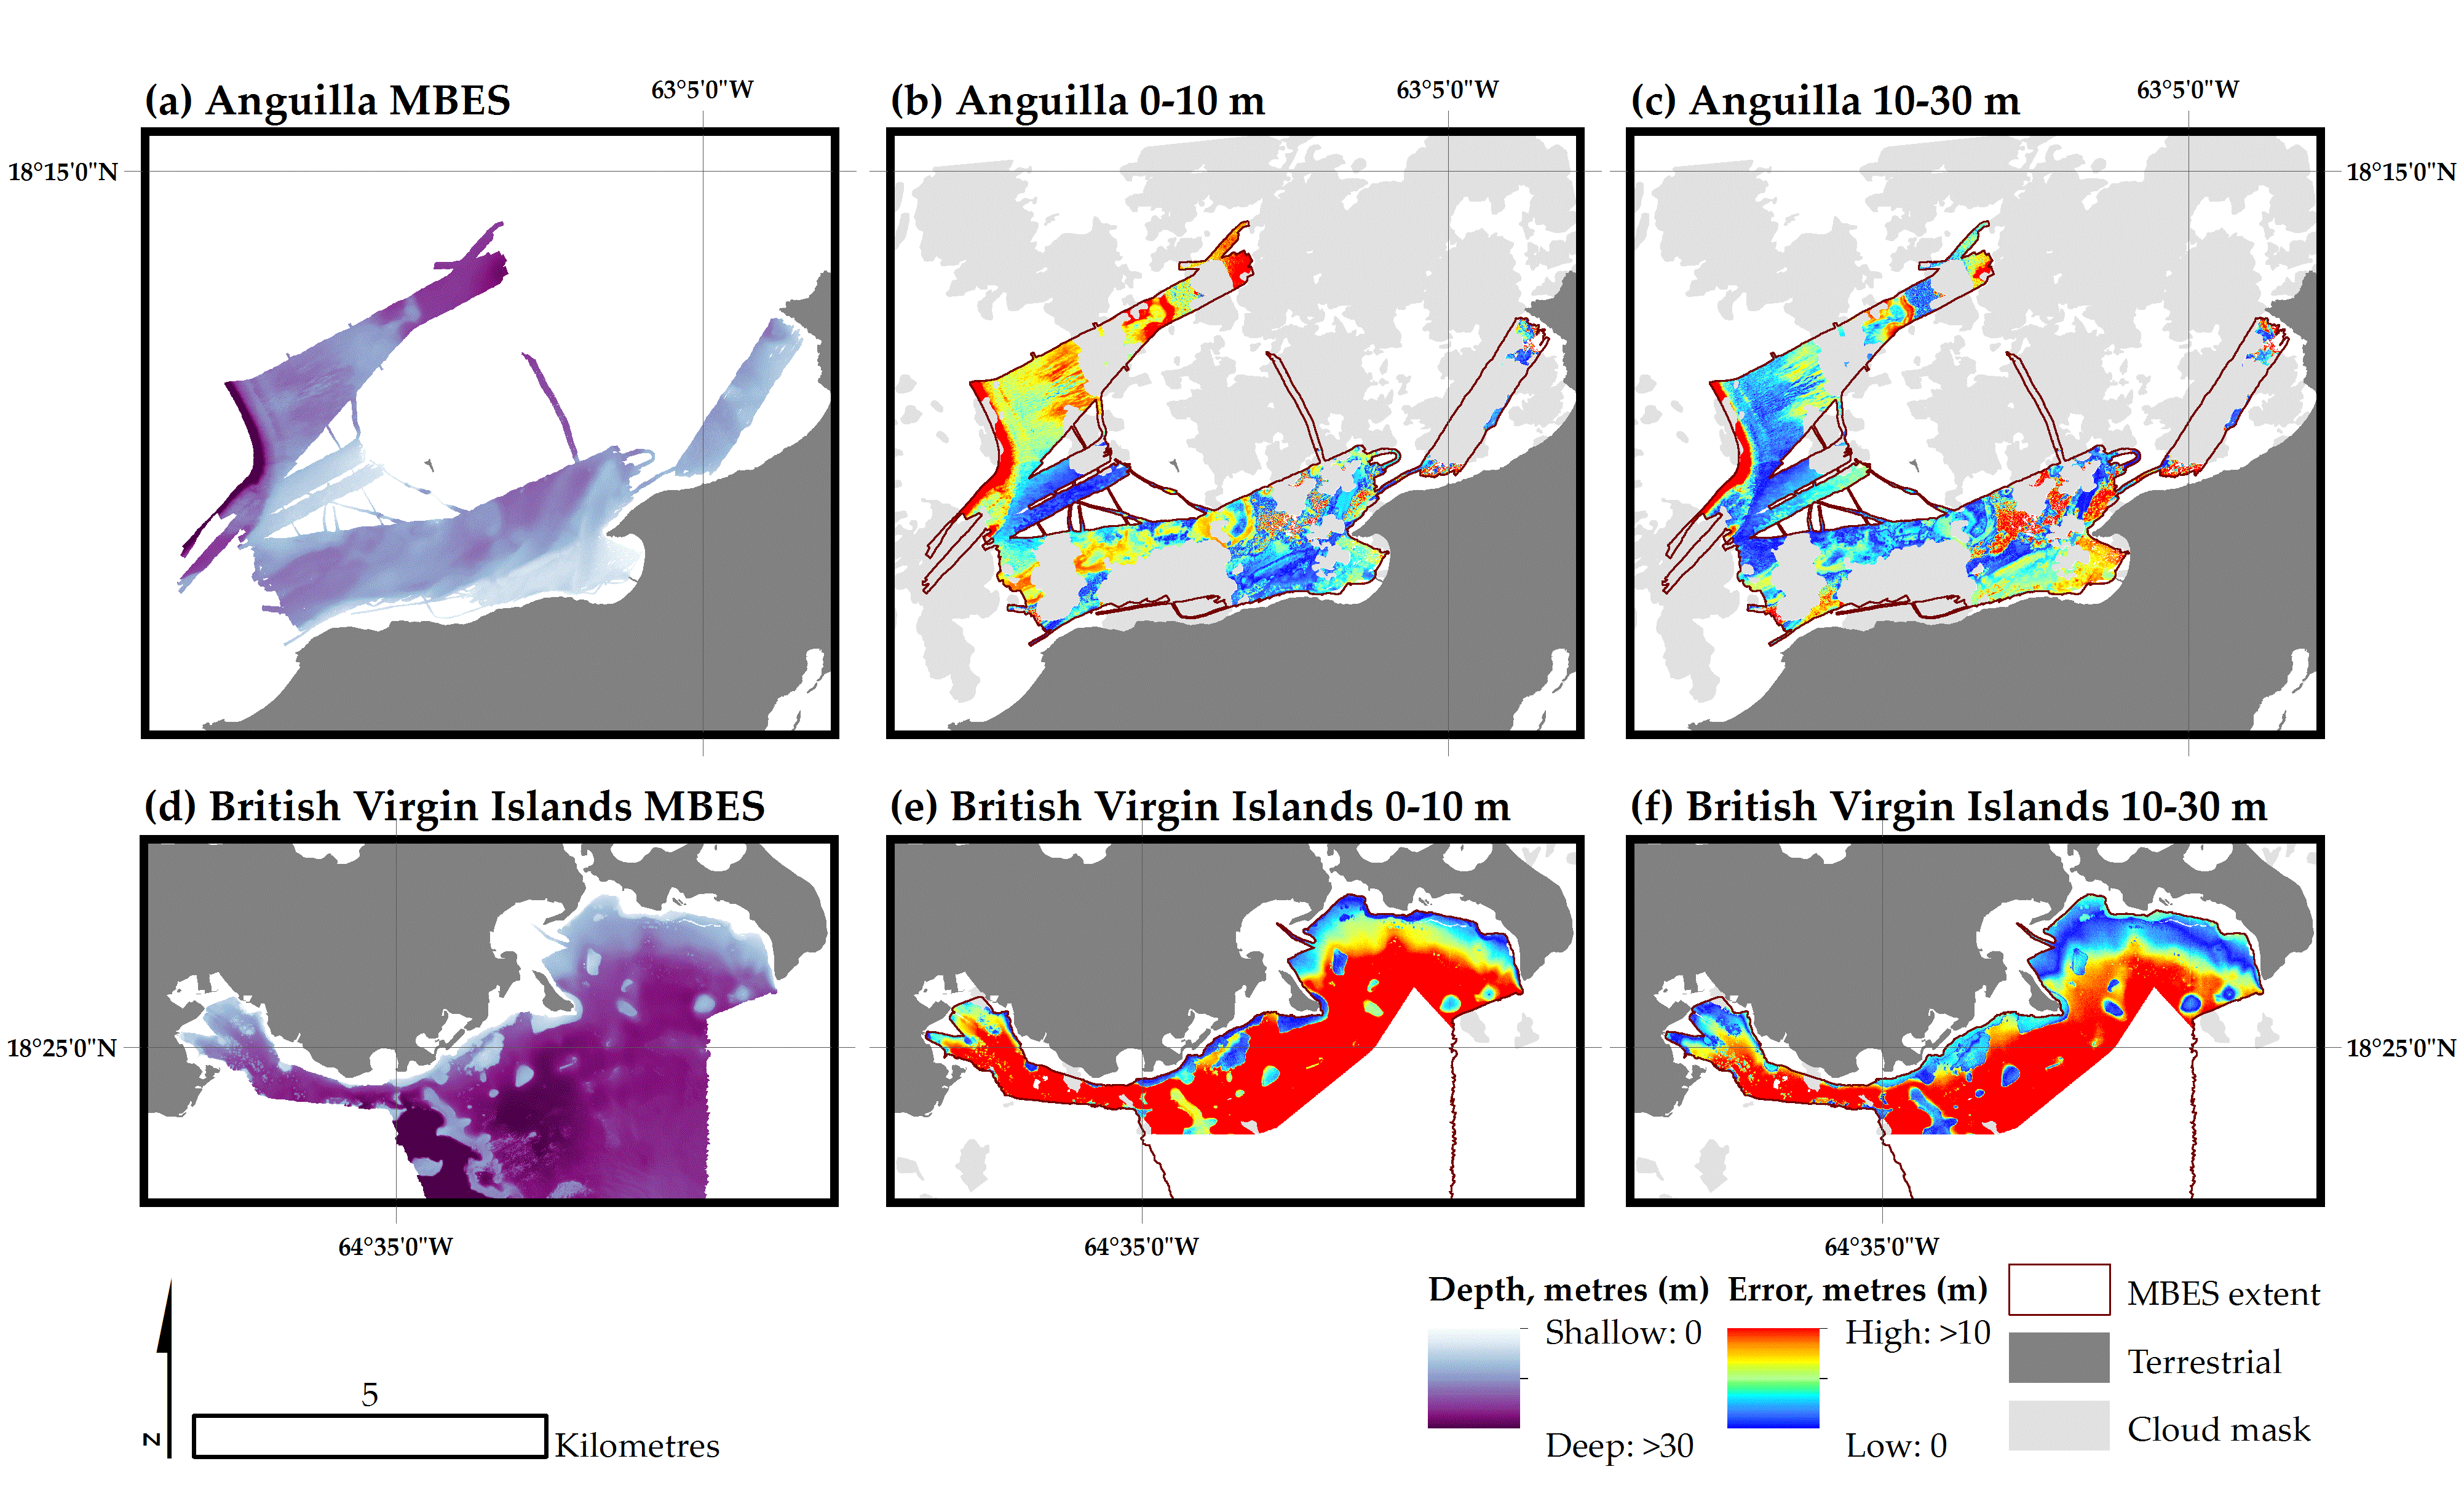
2.1. Study Sites

Both of the study sites are United Kingdom Overseas Territories (UKOT), located as part of the Leewards islands (Figure 1a), a group of islands in the northeast Caribbean that is the interface between the Caribbean Sea and the Atlantic Ocean. The first study site covers the northern coast of Anguilla (Figure 1c), focussing on Long Bay, Road Bay, around Sandy Island, and parts of Crocus Bay. There is a mix of benthic habitats, including seagrasses, sandy substrates, soft coral reefs, and algae [23]. The region selected is predominantly less than 30 m deep, but adjacent to a drop (>40 m deep) west of Sandy Island. The second site forms part of BVI—an archipelago of 50 islands 167 km to the west of Anguilla. The selected site is along the southern coast of the main island, Tortola, from Road Town (the capital) east to bluff bay (Figure 1b). The marine habitats are a mixture of seagrasses (Syringodium filiforme and Thalassia testudinum), sandy/rocky substrates, sponges, hard and soft coral reefs, and algae [24]. The area experiences heavy marine traffic from the Road Town Ferry Terminal, Tortola Cruise Ship Pier and private/commercial yachts in the harbours along the coast. There are also shallow (10–20 m) bank reefs with very steep faces (up to 60° incline).

2.2. In Situ and Satellite Data

2.2.1. Multibeam Echosounder Surveys

Between 29 August 2016 and 03 September 2016, the Centre for Environment, Fisheries and Aquaculture Science (Cefas) collected bathymetric survey data for Anguilla using a Kongsberg 3002 multi-beam echo sounder, for the Darwin Plus project “DPLUS045: Mapping Anguilla’s ‘Blue Belt’ Ecosystem Services”. The UK Hydrographic Office (UKHO) and Cefas processed the raw data and gridded to 2 m by the using Caris Sips and Hips, and assessed with 99% agreement against IHO Standards for Hydrographic Surveys Order 1a and Special Order [25]. Depth data for BVI was surveyed using a “Teledyne-Reson T20-P multibeam echosounder, Applanix POS MV Wavemaster Inertial Motion Unit with Fugro GPS corrections, SAIV SD-204 CTD profiler, PDS2000 and Pos-Pac data acquisition software [26].” UKHO and MMT captured the data between 11 July 2014 and 03 August, as part of the Darwin Plus project “DPLUS026: British Virgin Islands MPA and hydrographic survey capacity building”. UKHO processed the data using QPS FMGT.2.2.2.

2.2.2. Pleiades Imagery

This study obtained two Pleiades satellite imagery. The first, for Anguilla, was acquired as part of the Darwin Plus project “DPLUS045: Mapping Anguilla’s ‘Blue Belt’ Ecosystem Services”, undertaken by Cefas. The second, for BVI, was acquired as part of the Joint Nature Conservation Committee (JNCC) funded project “Using radar-based terrain mapping to model the vulnerability of 5 UK Overseas Territories to natural hazards and the value of natural capital in mitigating impacts”, undertaken by Environment Systems Ltd. The datasets for both study sites utilised 4-band multispectral products, with blue, green, red and near-infrared bands, and at a ground resolution of 2.0 m. The design specification for Pleiades imagery suggests a positional accuracy of 0.5 m CE90, with appropriate ground control points and digital elevation models [27]. The dates of capture and sensor details are available in Table 1.
Both images were selected, from the pool available within the separate projects, due to their intersect with the available MBES data, cloud-cover, sea-surface conditions and relatively low sediment load. Despite this, in the BVI image, we observe relatively high turbidity levels in the very shallow waters of Road Harbour. Orthrectification of the data took place using ENVI 5.3, corrected for a position in ArcGIS Desktop 10.0 against ESRI World Imagery, radiometrically corrected to top-of-atmosphere reflectance (TOA) in ENVI 5.3, and projected with respect to EPSG:32620 (WGS 84/UTM Zone 20 N).

2.3. Satellite Data Preprocessing

To extract quantitative data from satellite imagery, the same pre-processing workflow must be applied to all image datasets; from raw digital numbers to an atmospherically and water column corrected image. This study amends the pre-processing workflow from [18] (hereafter Traganos18), whereby multi-temporal Sentinel-2 images, in GEE, had been cloud and land masked, and atmospherically corrected, before being converted to temporal composites for sun-glint correction, radiometric normalisation and smoothing. The workflow allowed multiple sets of temporal composites to radiometrically replicate a training composite using pseudo-invariant features (PIF), modelling the reference atmospheric and water column conditions. This meant the same bathymetric algorithm coefficients could be performed on all the validation composites. This study deviates from the original by use of high-resolution imagery from Pleiades, and the use of commercially available software (QGIS 3.4) instead of GEE. As such, some workflow processes were adapted or removed. The deviations and adaptations of the processing steps from Traganos18 applied to the TOA Pleiades were as follows:
  • The cloud mask data that were supplied with the raw Pleiades imagery were not accurate or precise enough for use. All clouds over marine environments were manually delineated and masked in QGIS 3.4.
  • The Pleiades data lacks the shortwave-infrared of Sentinel-2 used within the classification and regression tree (CART) classifier. A CART classifier using the Pleiades imagery was considered, but did not reflect the existing boundaries used by the island GIS departments. To ensure interoperability with existing departmental data, all terrestrial environments were masked using OpenStreetMap boundary data in QGIS 3.4.
  • The modified dark pixel subtraction (DPS) method [28] was implemented in QGIS 3.4.
  • The temporal image composition [29] was outside the scope of this study and was not performed.
  • The sun-glint correction algorithm [30] was performed on the single scene Pleiades images, within QGIS 3.4.
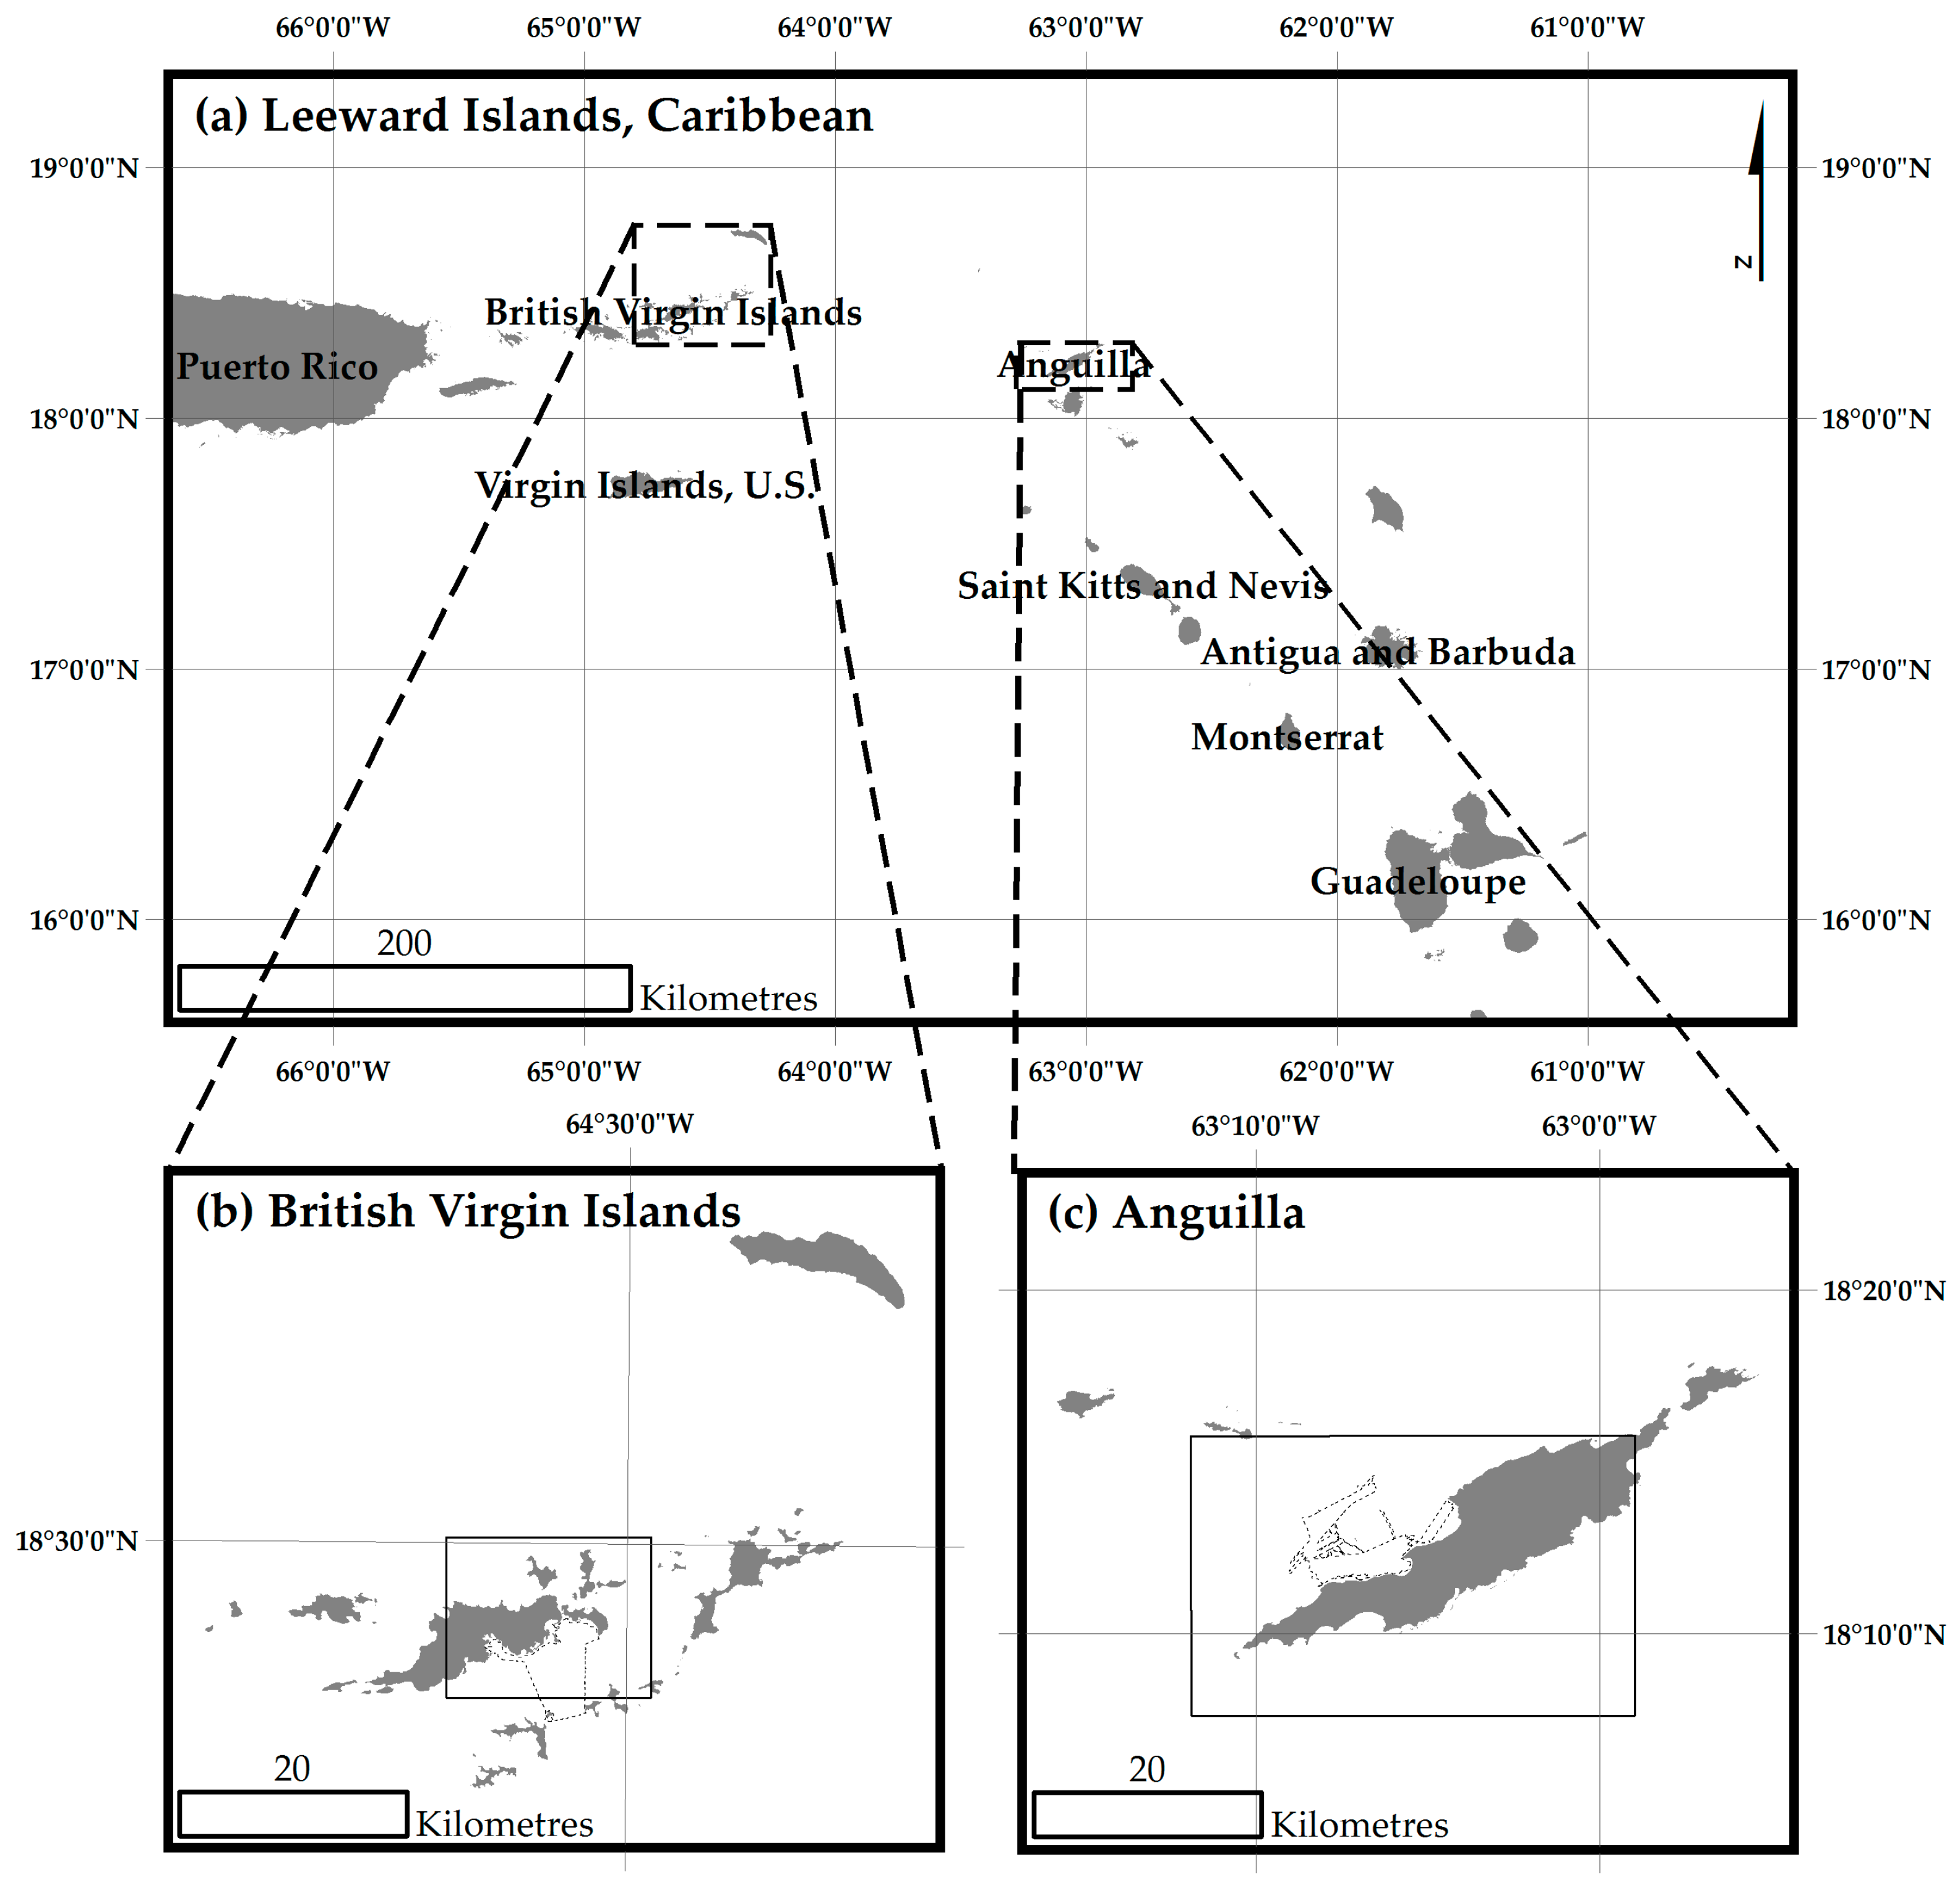
  • There was no deviation from how the PIF were extracted, modelled or applied [31], except for the vegetation types used to represent dark features. In this study, shallow sand was used in all sites as bright features. Thalassia testudinum (turtle grass) and Syringodium filiforme (manatee grass) were used as dark features for the Anguilla site and BVI site respectively. The location used to extract the bright and dark featured are displayed in Figure 2.
  • The 3 × 3 low pass filter was applied in QGIS 3.4.

2.4. Empirical Satellite-Derived Bathymetries (SDB)

The majority of empirical SDB modelling using 4-band imagery, such as the Pleiades, utilises the linear relationship between the spectral decay of the optical wavelengths against survey in situ data. To remain consistent with the study from Traganos18, the blue and green bands were used to form the predicted SDB output. Similarly, this study utilised the SDB algorithm developed by [7] (hereafter Lyzenga85), which consistently demonstrated higher R2 and lower RMSE values than other examined approaches in the study by Traganos18. The Lyzenga85 method relies on a relationship to be formed between each band (subtracted by its mean signal over deep water), its respective linear spectral decay, and in situ depth data, to form:
z = a + bi ln(xxsi) + bj ln(xjxsj),
where z is the SDB prediction; a and b are the multiple linear regression intercept and slope coefficients (respectively) for band i (blue) and j (green); x is the pre-processed radiance values for band i and j, and xs is the mean deep-water values for band i and j.
The MBES rasters from both case study sites were resampled to 2.0 m, snapped to the intersecting Pleiades imagery, and converted to point data. The Anguilla SDB models were trained from the MBES at two depth ranges, 0–10 m and 10–30 m, representing the IHO’s CATZOC depth ranges. The resulting multiple linear regression intercept, blue band slope, green band slope, R2 and RMSE values, for both depth ranges, are given in Table 2.
The multiple linear regression statistics, ANOVA results, statistical calculations and residual outputs for the 0–10 m and 10–30 m models are available in Tables S1 and S2, respectively. The same intercept, B1 coefficients, and B2 coefficients for each model depth in Anguilla, were used to model the same depth range for the BVI SDB.

2.5. Accuracy and Error
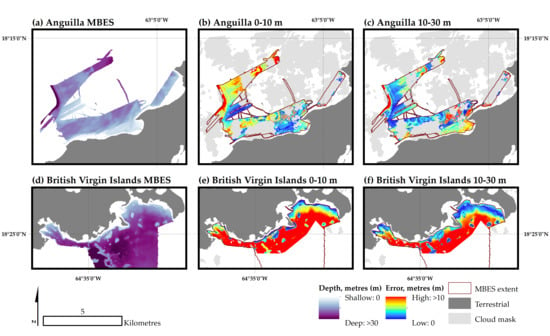
Both the MBES data in Anguilla and BVI were used to validate the output SDBs. Table 3 offers information on the number of training and validation points for each study site and model depth, after accounting for cloud and other areas of NoData.
Vertical accuracy for all the output models was calculated from the residuals of the SDB values subtracted by the MBES, so that negative values indicated an underestimation of depth compared to the MBES (i.e., the SDB was too shallow), and positive values representing overestimation. The absolute values of error were used to calculate spatial datasets of the vertical accuracies.

3. Results

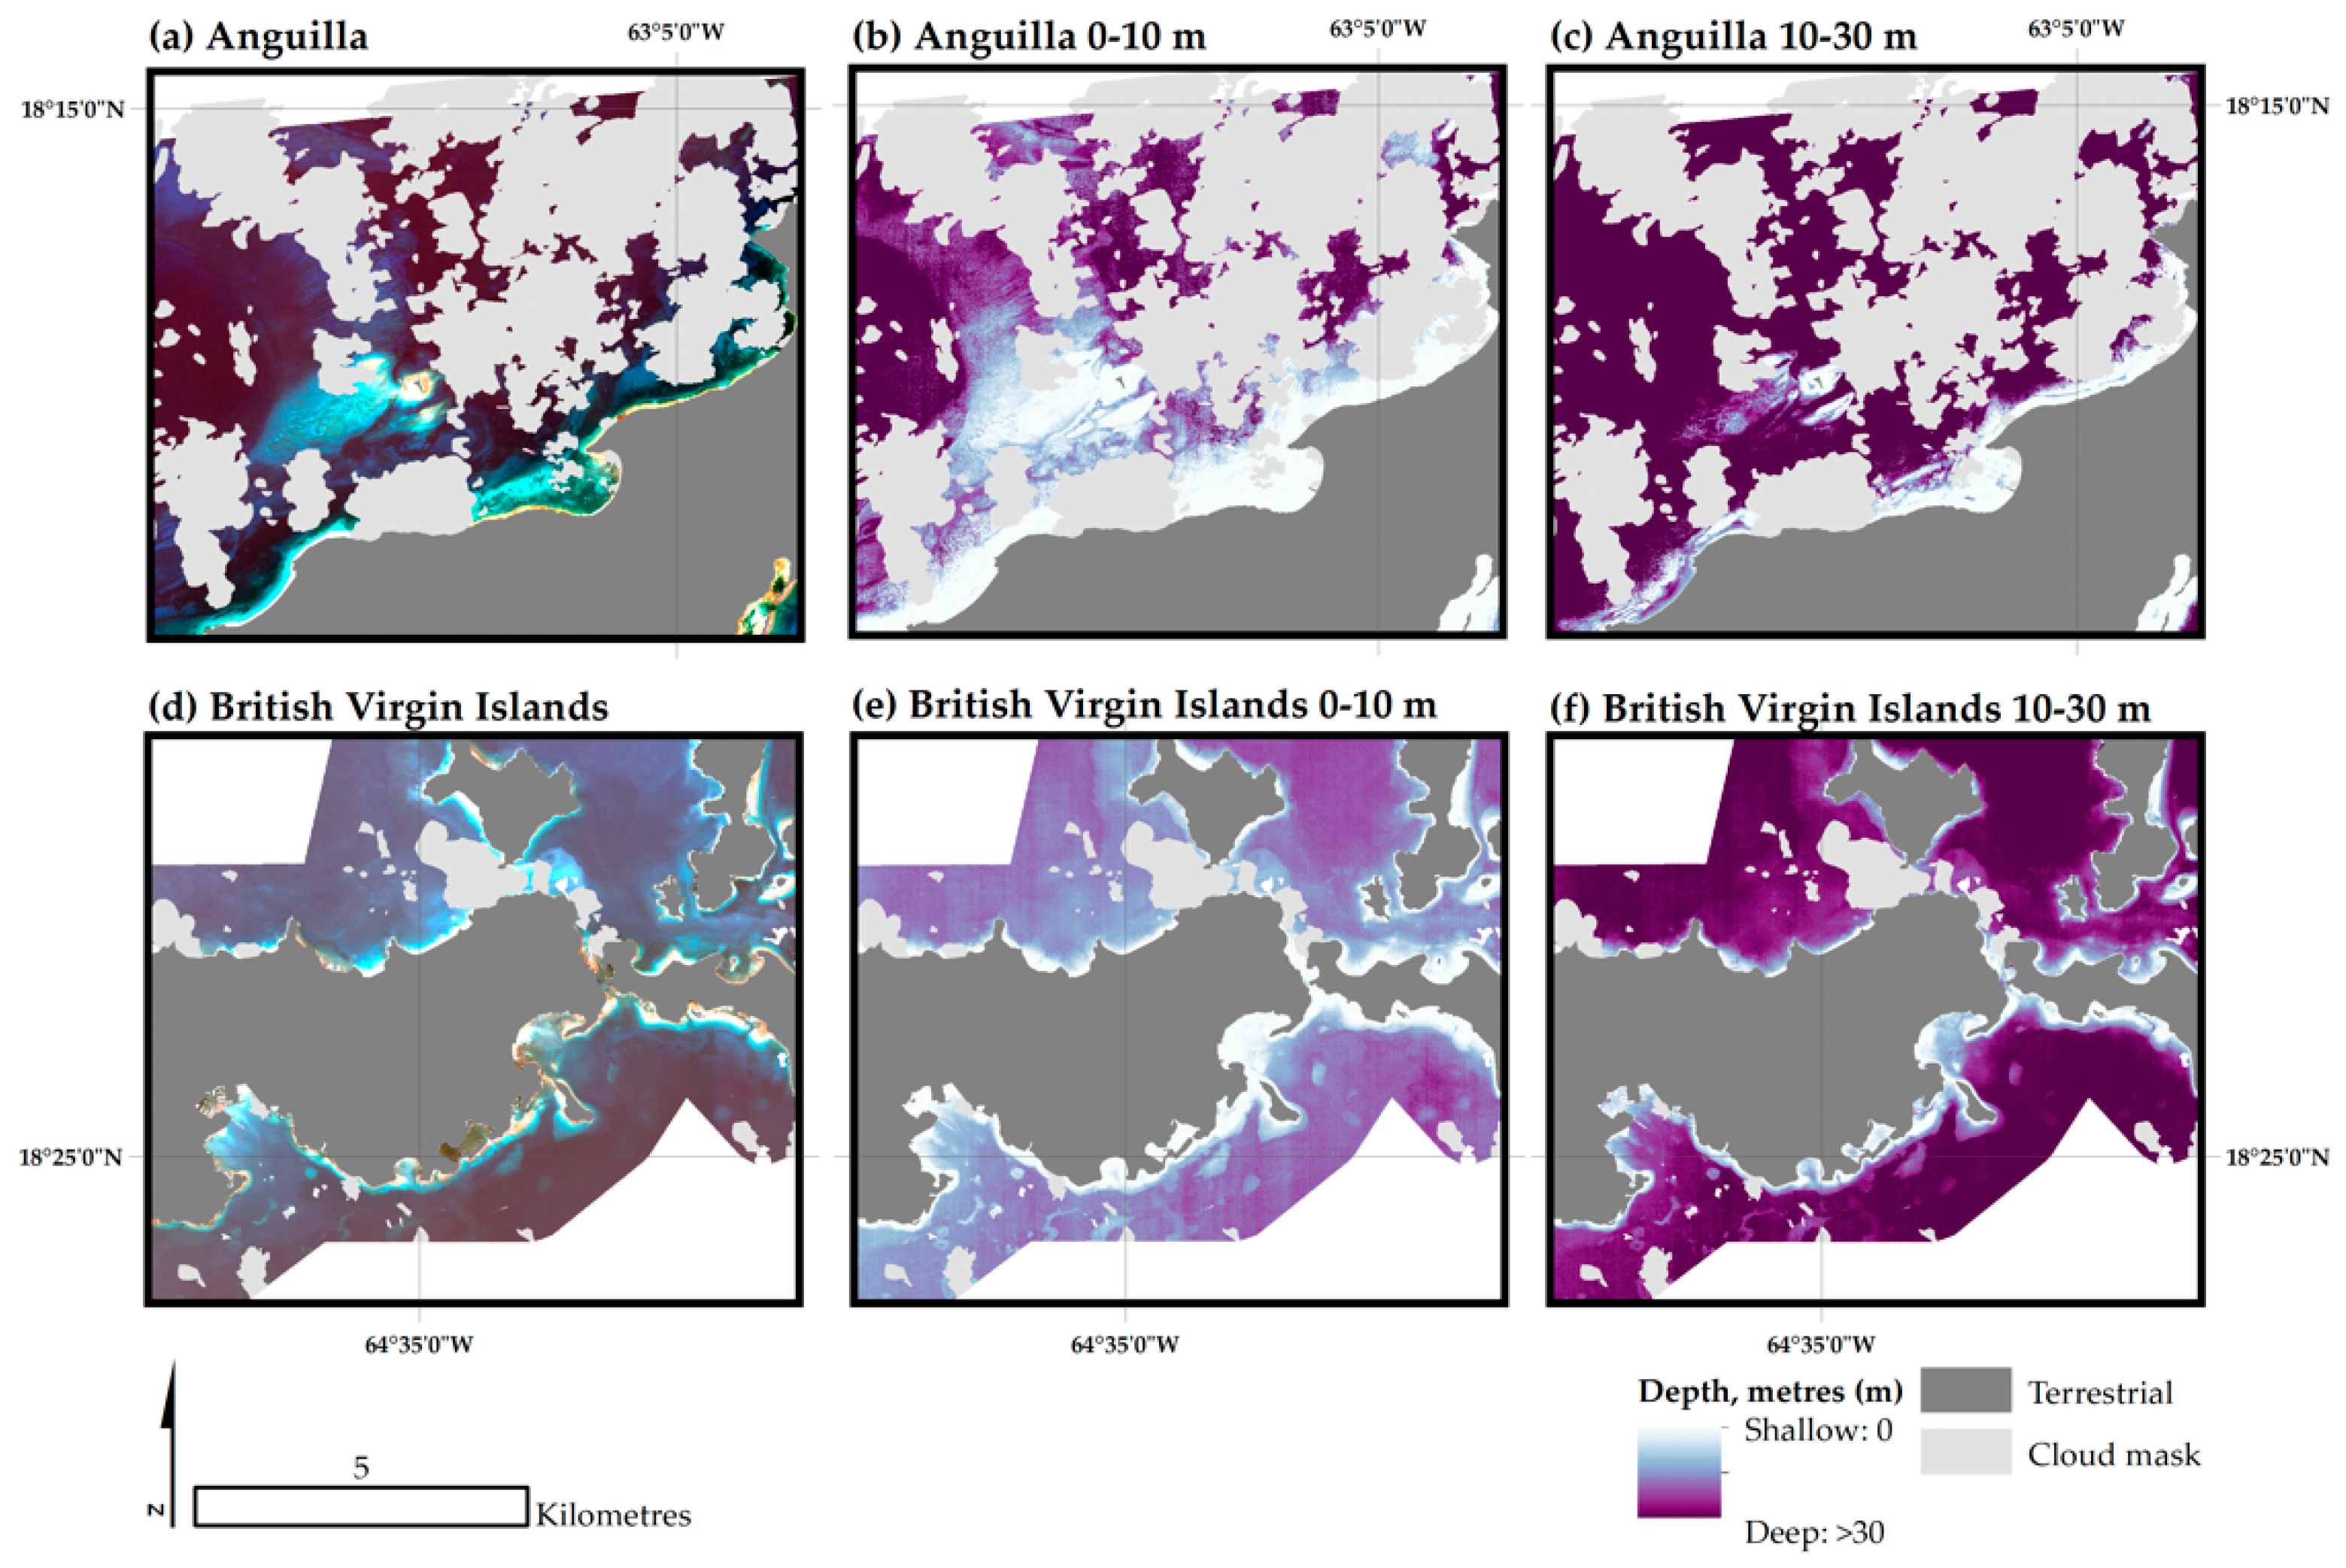
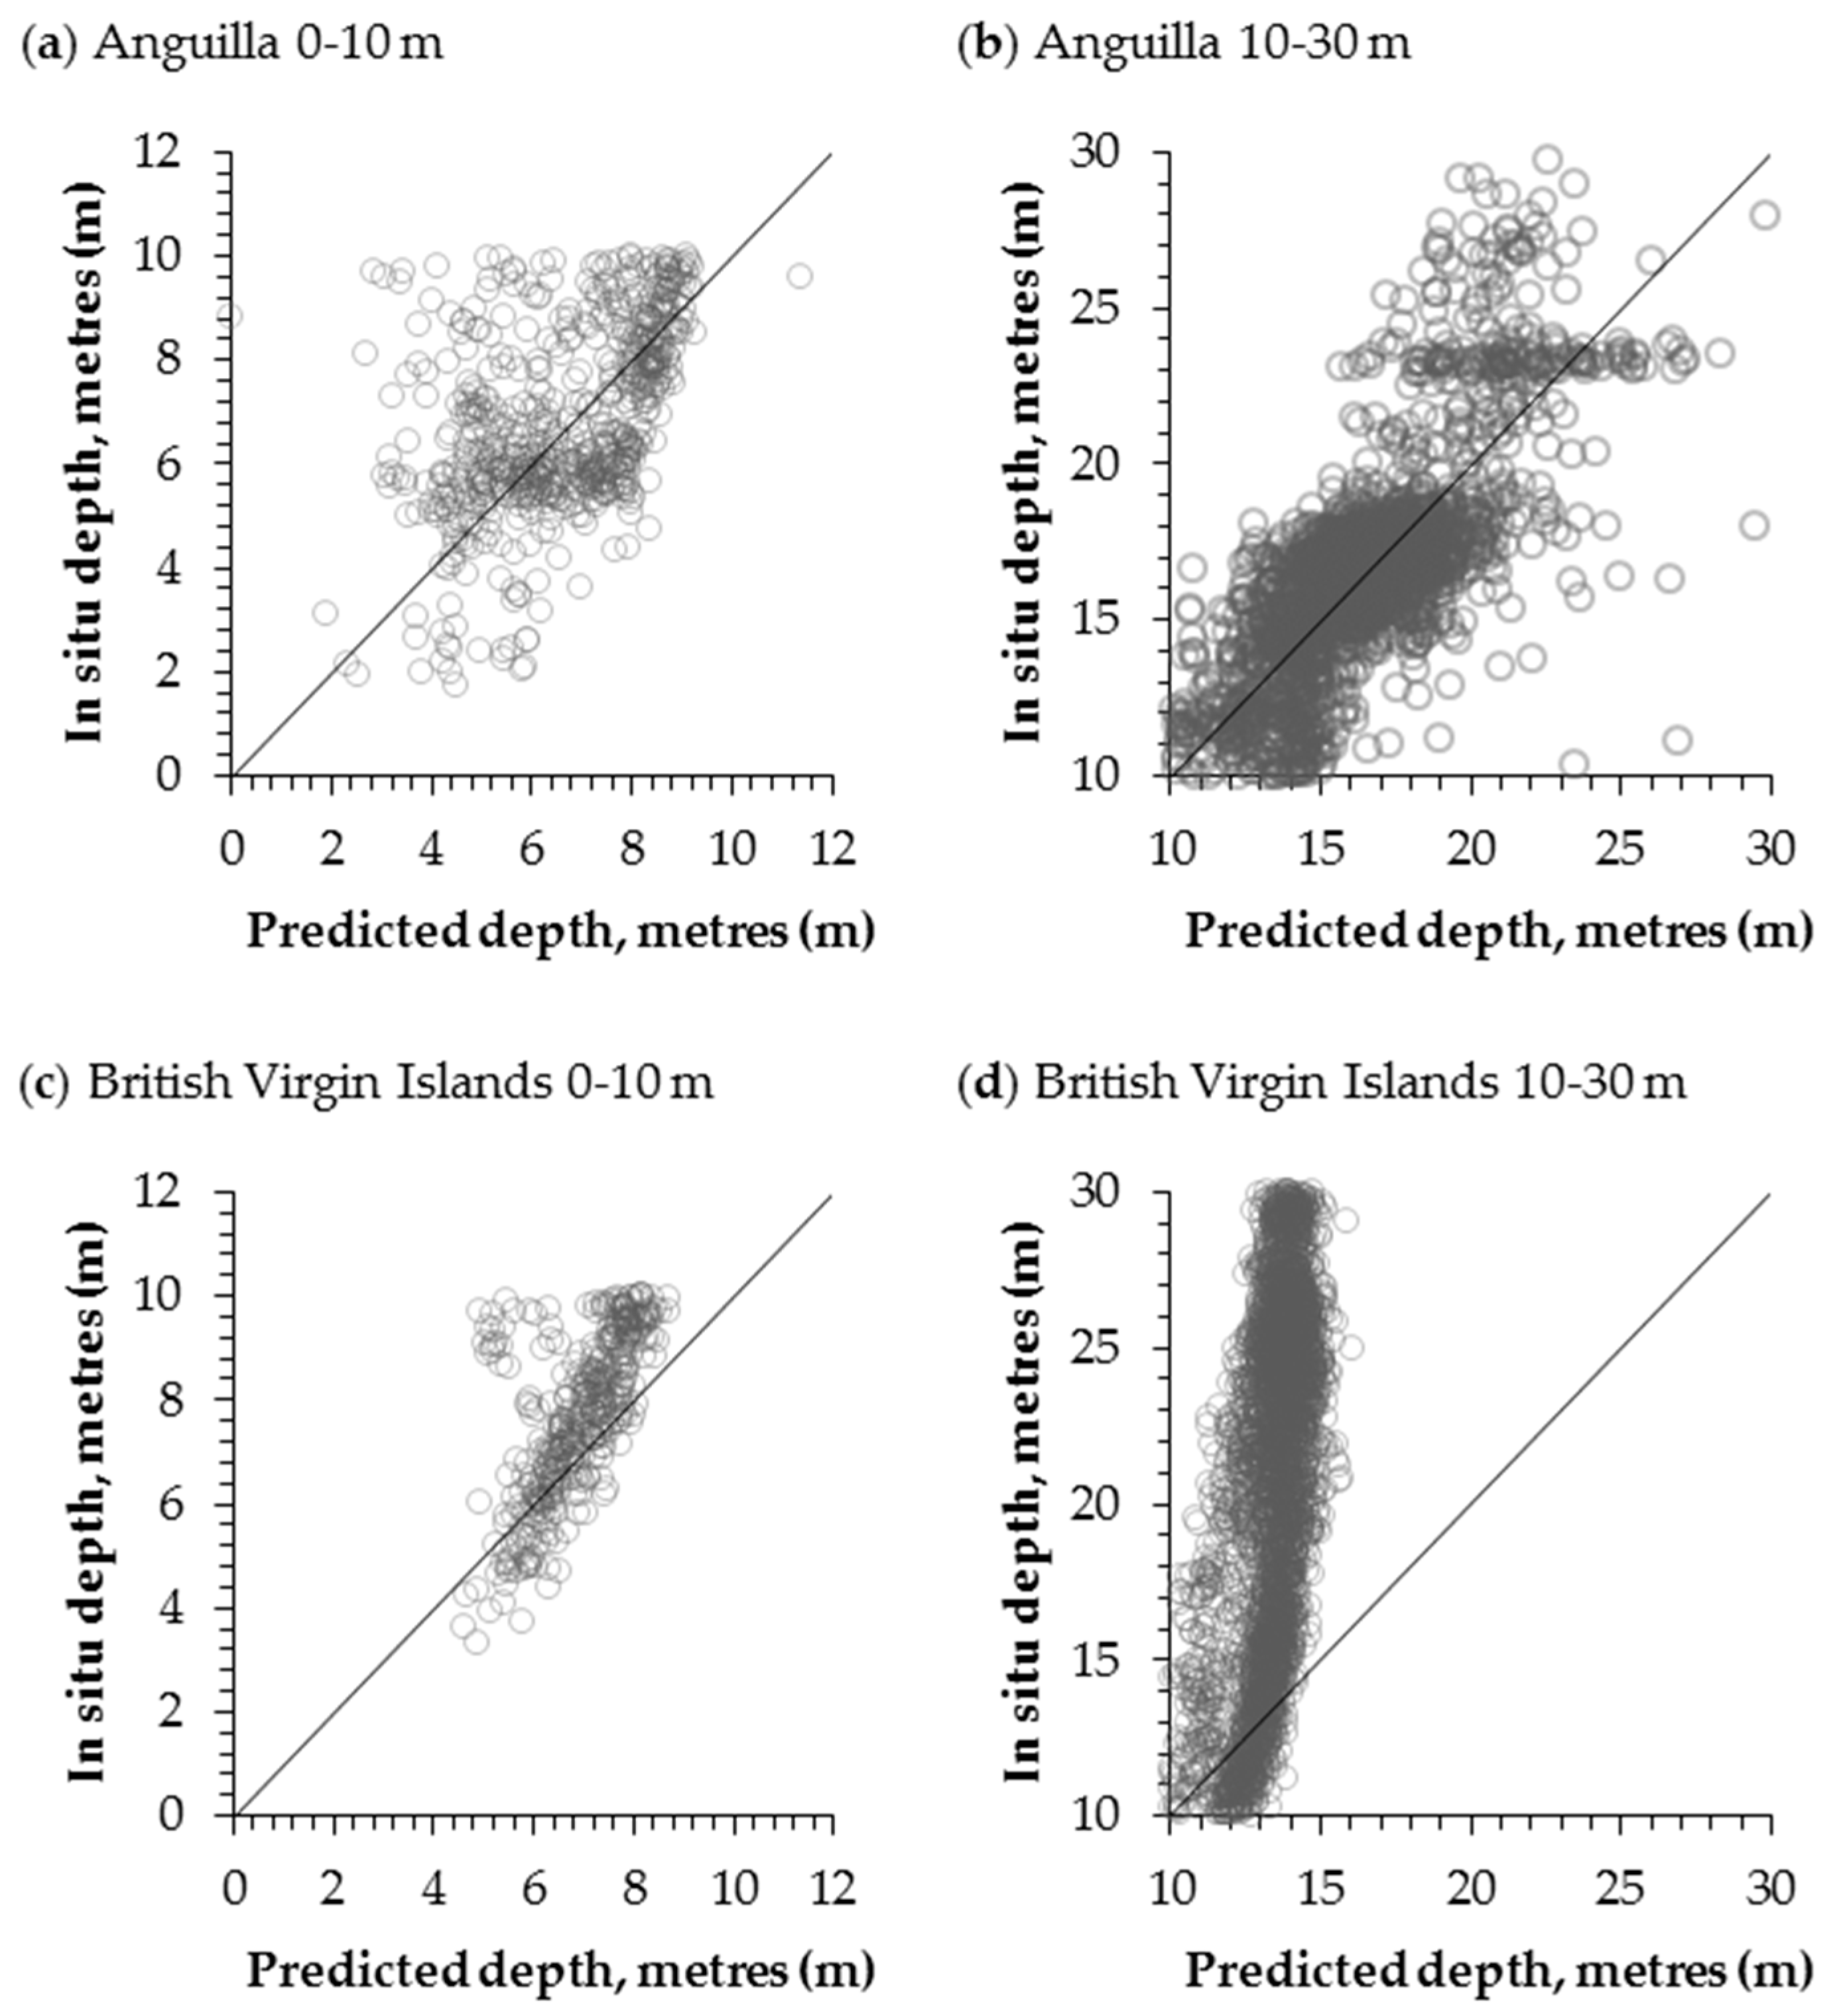
3.1. SDB Estimations and Accuracies

Figure 3 shows the pre-processed Pleiades imagery (Figure 3a,d) alongside their respective SDB models for Anguilla and the British Virgin Islands. In Anguilla (Figure 3b,c), the maximum depth was predicted to be 13.5 m for the 0–10 m model and 33.4 m in the 10–30 m model. The BVI models (Figure 3e,f) predicted shallower maximum depths of 8.7 m for the 0–10 m model, and 16.0 m for the 10–30 m. On local cumulative cut statistical stretches between 2% and 98%, based on the image extents, all four models visually represent the contours of the MBES surface.
Figure 4 illustrates the linear fit between the MBES survey data, and the SDB estimated bathymetry models. The statistical results (Table 4) show that, for Anguilla, the 0–10 m model had the lowest RMSE value of 1.76 m and accounted for 23% of the variance. This is in contrast to the 10–30 m SDB, which had the highest R2 value of 0.56 and a relatively higher RMSE of 2.40 m. For the BVI models, the 0–10 m model had the lowest RMSE value of 1.39 m and explained 44% of the variance, whilst the 10–30 m model had a 7.6 m greater RMSE error, but explained three-quarters of the variation with an R2 value of 0.33.
The full validation results of the Anguilla-derived and BVI-derived 0–10 m and 10–30 m SDB models, are available in Tables S3 and S4, respectively.

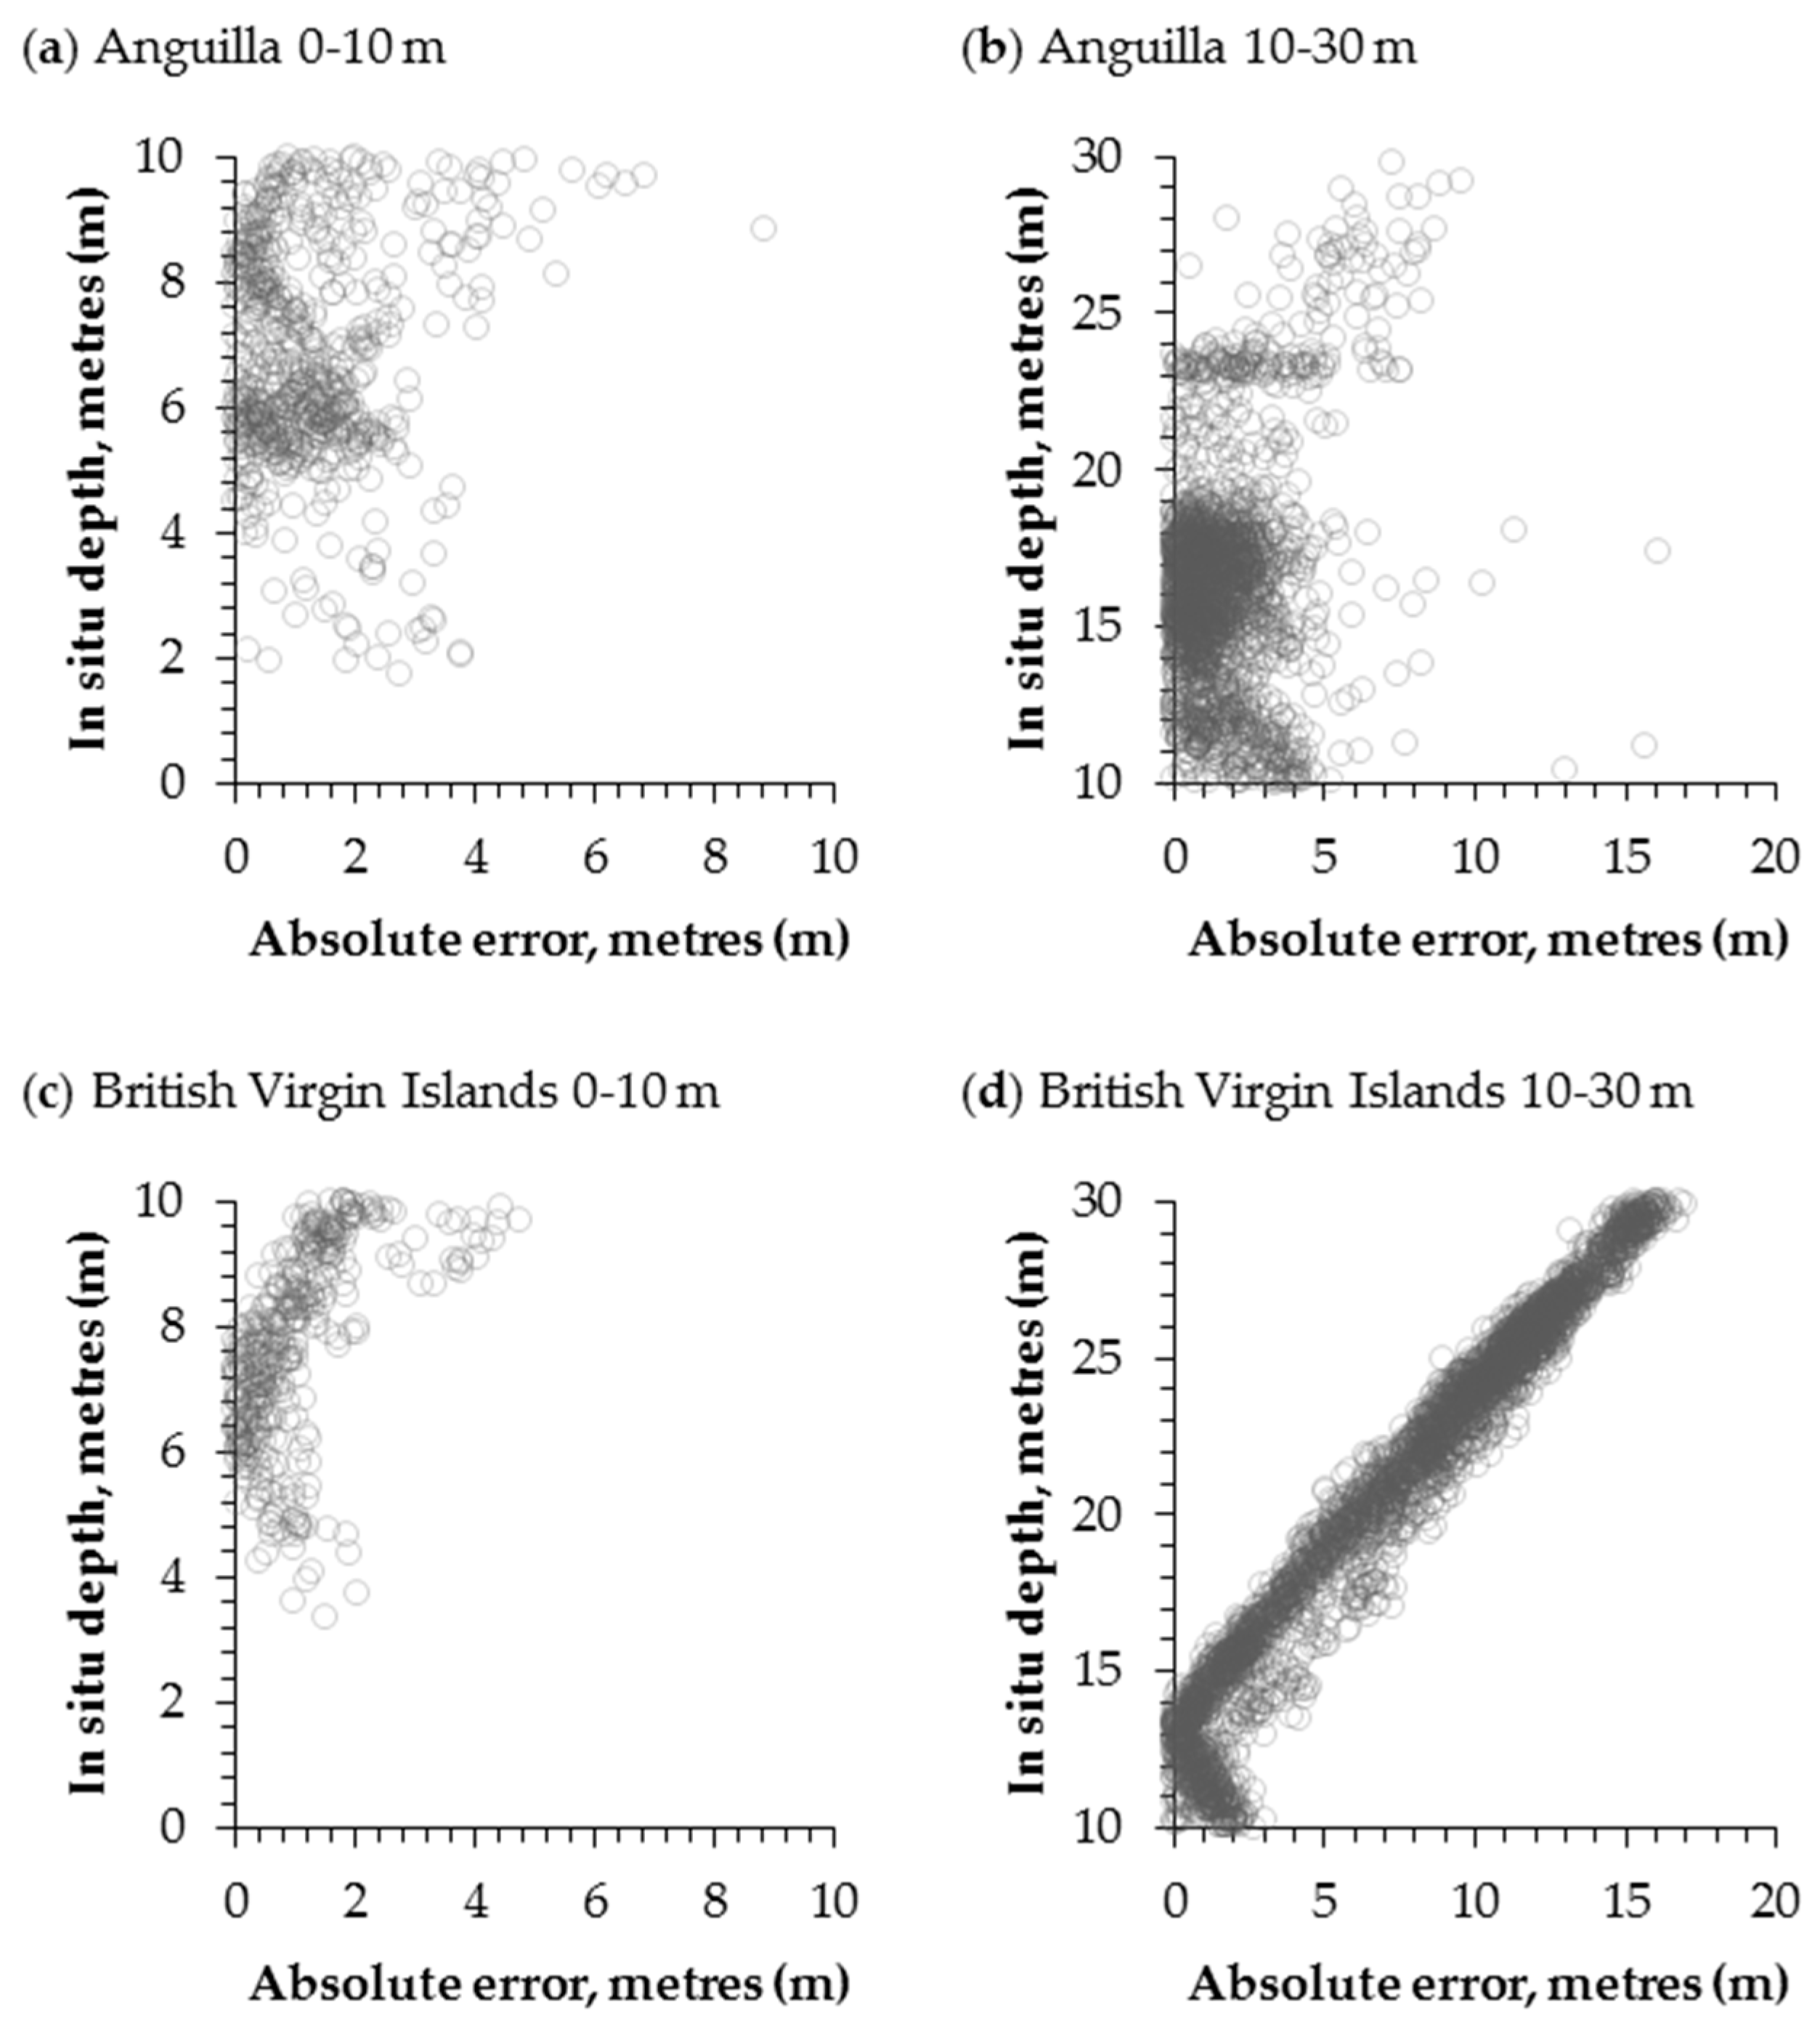
3.2. SDB Vertical Errors

Figure 5 illustrates the MBES survey data (Figure 5a,d) for both study sites; alongside the absolute vertical residuals for both the 0–10 m and 10–30 m depth models (Figure 5b,c,e, respectively).
For the Anguilla training site, the 0–10 m SDB underestimates the MBES by up to 8.8 m (at a depth of 8.8 m) and overestimates up to 4.3 m (at a depth of 9.2 m). The 10–30 m SDB model underestimates up to 9.5 m (at a depth of 29.2 m) and overestimates up to 16.1 m (at a depth of 17.4 m), compared to the in situ MBES data. For the BVI validations, the 0–10 m SDB model underestimates the MBES up to 1.25 m (at a depth of 9.9 m) and overestimates by a maximum of 4.6 m (at a depth of 3.3 m). The 10–30 m SDB model underestimates up to a maximum of 15.95 m (at a depth of 29.1 m), and overestimates by a maximum of 5.89 m (at 11.2 m depth).
Figure 6 illustrates the absolute SDB vertical error for both study sites. There is no clear trend in absolute error with depth in Anguilla, for either the 0–10 m or 10–30 m model residuals (R2 = 0.33 and 0.25 respectively). Here, the 0–10 m model has a lower mean absolute residual error of 1.3 m, compared to the mean 1.8 m observed for the 10–30 m model. In BVI, both the 0–10 m and 10–30 m residual errors do show clear linear trends (R2 = 0.92 and 0.98 respectively), suggesting an increase in vertical error with depth.
Comparing the SDB in BVI against the seabed classification data [24], in both depth models the greatest errors occur in areas of Thalassia testudinum (turtle grass) and Xestopongia muta (giant barrel sponge) within deep water (>25 m). Shallow waters containing shoal reefs, Xestopongia muta, Thalassia testudinum and Syringodium filiforme, demonstrate absolute errors less than 5.0 m. However, an area of shallow sand within Road Harbour has higher than expected error values for its depth, though the Pleiades image for this region suggests a relatively high load of suspended sediment.

4. Discussion

4.1. Suitability of the Pleiades Imagery for High-Resolution SDB Estimations

The combination of two high-resolution (2 m) satellite images of Airbus’ Pleaides with two independent in situ multibeam measurements allows us to calculate and validate bathymetry in two depth zones—0–10 m and 10–30 m—in two tropical sites in the Caribbean Sea. The study focusses on utilising the methodology of [18], developed with the use of cloud-based geospatial analysis and multi-temporal image composites in a temperate region. The SDB model reaches the highest R-squared value of 0.56 (10–30 m depth range) and the lowest RMSE of 1.76 m (0–10 m depth range) for the training site of Anguilla; and a highest R-squared value of 0.44 and a lowest RMSE of 1.39 m for the validation site of the BVI. Assessment of vertical errors in both areas indicates mean errors of 1.3 m and 1.8 m in the depth ranges between 0–10 m, and 10–30 m, respectively, around Anguilla. In the BVI region, we observe the greatest vertical accuracy, therefore, smallest over or underestimation, of less than 1.0 m, on average, between 7.8–10.0 m, and between 11.6–18.4 m of water depth.
Beyond these depths, the signal in the Pleiades imagery becomes saturated, possibly because of relatively (observed) adverse sea state conditions compared to the Anguillan training data including wind waves, swell, and turbidity. These conditions can obscure certain topographical features from the Pleiades signal, such as the (up to) ~60° inclined bank reefs of BVI. Across this study area, the topography of these reefs drops from a depth of 12 m to 30 m across a profile of only 40 m across, whereas the Pleiades signal only reduces by ~2%, even after line-arising for spectral decay. This signal saturation explains the deviation from x = y in the validation plots of BVI, as well as the clear trend in increasing error with depth for the 10–30 m BVI SDB model, and highlights the importance of image selection for practical applications.
According to the findings, Pleiades’ position accuracy, and the IHO’s CATZOC [22], the herein calculated SDB information could potentially match Zone A2 of the CATZOC: ± 1.2 m in the depth range of 0–10 m and ± 1.6 m in the depth range of 10–30 m. These zones assist in risk assessment for navigation in specific geographic areas. A satisfied zone A2 means a “full area search undertaken with significant seafloor detected and depths measured” (Seafloor Coverage) and “a controlled, systematic survey achieving position and depth accuracy less than ZOC A1 using a modern survey echosounder and a sonar or mechanical sweep system” (Typical Survey Characteristics) [22]. This categorisation highlights the suitability of the high-resolution satellite image archive of the Pleiades for providing SDB charts of high reliability for navigational purposes.

4.2. Thematic, Geographical and Methodological Comparisons

We can draw comparisons to the existing literature of spaceborne SDB endeavours, thematically, geographically, and methodologically. Albeit a sparse current application of the Pleiades data for bathymetry estimations, a recent photogrammetric approach [32], also within a tropical setting (this of Moorea in French Polynesia), extracted topobathymetry between −20 m and 12.07 m of elevation, implementing atmospherically corrected Pleiades triplet imagery and the ratio transformation of [8] (in contrast to the linear transformation of [7] here). Comparison to a LiDAR-derived bathymetric digital surface model showed an RMSE of 0.83 m, two-fold lower than the RMSE of 1.76 m in Anguilla and the 1.39 m in BVI in the 0–10 m range of the present study. It is noteworthy that the SDB results of both levels 0 and 1 of radiometric corrections of [32] are also higher than our found metrics, RMSE of 1.06 m for level 0 (Digital Number) and RMSE of 1.17 m for level 1 (Top-of-Atmosphere). These differences may arise from the less complex underwater environment of Moorea (in contrast to the herein Caribbean sites) and/or the clearer atmospheric, water surface and water column conditions at the time of acquisition of the Pleiades imagery in [32].
In a geographical comparison, a recent SDB approach [33] in Puerto Rico, following an Adaptive-Geographically Weighted Regression model with coarser satellite data (Landsat-8 and RapidEye), estimated bathymetry in depths between 0–20 m with an R2 of 0.95 and 0.99, and RMSE of 1.14 m and 0.4 m for Landsat-8 and RapidEye, respectively. We could attribute the better performance of the weighted regression-based SDB effort in similar coastal environments, to its more sophisticated treatment of the heterogeneity of water column properties and bottom types, and additionally, its use of bands for estimation and correction in the red and NIR wavelengths. Another adaptive-based SDB study [34], in the south-eastern coast of the Dominican Republic, employed Planet’s 3.7 m resolution Doves, and mapped bathymetry up to 15 m with R2 and RMSE in the ranges of 0.70–0.91 and 1.37–1.98 m, correspondingly. While the RMSE values calculated within this study fall within the observed range of [34], the coefficients of determinations explain at best 20% less variation; we could interpret this difference on the basis of the more optical impediments observed in our study sites, related to high sediment loads and considerable grounds of seagrasses.
Finally, in a methodological comparison with the first showcase of the herein utilised methodology [18], which used multi-temporal composites of the coarser 10 m Sentinel-2 imagery in a cloud environment to extract bathymetry in the temperate waters of Greece, a lower RMSE is examined, but also R2 in the present study (for similar depth ranges). We speculate that this discrepancy is due to the exploitation of the multi-temporal imagery in [18], which addresses better (in contrast to our single-image approach here) intra and inter-image interferences associated to atmospheric, water surface and water quality conditions.

4.3. The Pros and Cons of the Current SDB Approach

We exploit this section to concisely cite the pros and cons of our applied SDB framework:
Pros:
  • High-spatial-resolution and accurate SDB calculations of 2 m in a tropical environment which could fit into Zone A2 of CATZOC and be used for navigation purposes.
  • Efficient in time, technical capacity, and computation (in comparison to state-of-the-art physics-based, photogrammetric, and adaptive-based methods).
  • Minimization of statistical bias of neighbouring observations according to the first law of geography [35] by implementing two geographically independent (distance of ~147 km) MBES-derived datasets.
  • Reduction of radiometric differences between the Pleiades images employed in SDB training and validation (through the use of pseudo-invariant features) which could have inflicted greater vertical errors otherwise.
Cons:
  • Two-year difference between the used Pleiades imagery for SDB calibration and validation and the in situ data from the site of BVI. However, while this temporal difference should theoretically impose quantitative disagreements, in this case, due to the broader absence of river runoffs in the northeast Caribbean Sea, we do not expect it to have influenced the SDB estimations.
  • Empirical SDB methods like [7,8] assume homogeneous and unique water column conditions and bottom types. Here, the Anguilla and BVI benthos feature a mixture of seagrasses, sand, rocks, sponges, corals, and algae; and in conjunction with increased sedimentation in the satellite image from BVI, they violate the aforementioned empirical assumption and might have affected our observations.
  • The cost of the herein in situ information by MBES survey data might be expensive and elusive for other SDB-related projects, applications, and studies. Nevertheless, the initial development and application of the current SDB processing chain have exhibited accurate results with the use of low-cost bathymetric systems and data.

4.4. Back to the Future: The Three Actors for Global SDB Coverage

There are three main actors to perform accurate and repeatable SDB estimations on a global scale. The first is the sensors; current and near-future deployment of single and flocks of commercial and space-agency-funded satellite sensors are providing, and will continue to provide, the necessary global observations for new methodological developments, scientific and operational applications, and innovative breakthroughs in the domain of SDB. Sensors that fit the above description and hence worth mentioning here are:
  • Planet’s Doves—a commercial constellation of 120+ shoebox-size multispectral, satellites offering daily VNIR collections globally at 3 m spatial resolution since 2013 [19,36];
  • NASA’s GEDI (Global Ecosystem Dynamics Investigation)—a two-year, high-resolution spaceborne LiDAR mission deployed on the International Space Station on 5 December 2018 [37];
  • NASA’s ICESat-2 (Ice, Cloud and Land Elevation Satellite-2)—a three-year, satellite-based LiDAR mission equipped with its ATLAS (Advanced Topographic Laser Altimeter System) sensor, launched on September 15 2018, whose suitability for SDB extractions in different natural environments has been already explored [38,39];
  • DLR’s EnMAP (Environmental Analysis and Mapping Program) —an envisaged five-year spaceborne imaging spectroscopy mission. Expected for launch in 2020, EnMAP will offer VNIR + SWIR hyperspectral data of 30 m spatial sampling and four-day temporal revisit. This will unlock new SDB mapping and monitoring ventures with a minimum spectral sampling distance of 7.5 nm and a signal-to-noise ratio of 400:1 in the VNIR wavelength range [40].
While the aforesaid satellite missions were engineered for terrestrial applications predominantly, their imaging sensor characteristics match the ones proposed by the coastal and inland remote sensing community for accurate and effective global spatial and temporal seabed monitoring [41]; and accordingly, their satellite data could be potentially exploited solely and/or synergistically for SDB estimations.
The second actor is the reference data; building upon the sixth paragraph of the Introduction, large-scale SDB methods, applications, and operations require the availability of suitable large-scale calibration and validation depth data. Naturally, for such SDB tasks at a global scale, multibeam-based information is neither the most affordable nor practical source nor the solution. A combination of existing and near-future acquisitions of low-cost citizen-derived/crowdsourced SBES, and high-resolution MBES and LiDAR inventories of higher cost and accuracy is required to accomplish calibration and validation of models and products, from local to universal scopes.
The third actor for planetary SDB coverage is the Cloud computing infrastructures, such as Google Earth Engine [42], Microsoft Azure [43], Amazon AWS [44], and Copernicus DIAS [45]. These can, and will, host the storage, processing, analysis, and leveraging of both commercial and public satellite data, relevant field observations, and their produced SDB intelligence, from regional to global scales [18]. We envisage that only by developing and adopting interoperability between the different cloud platforms and spaceborne data, can we realise highly accurate standardised and automated ARD (Analysis Ready Data)-based methodological approaches for spatial and temporal scalability. It is this approach that will democratise the calculation of bathymetry globally, and will guide strengthened solutions to our current natural, economic and societal challenges.

5. Conclusions

In the present study, we applied the methodological framework of [18], which combines simple and well-established (in the context of coastal aquatic remote sensing) empirical radiometric corrections and algorithms. We examine the suitability of leveraging the high-resolution multispectral satellite imagery of the Pleiades and MBES survey data for SDB estimations in two tropical islands of the northeast Caribbean. Our results extend the application of the SDB mapping approach of [18] in tropical regions (in addition to temperate ones); and showcase its potential for navigation purposes (based on IHO’S CATZOC), coastal aquatic habitat mapping of corals and seagrasses, and coastal resource management, more broadly.
In its present single-scene application, the methodology is constrained by the presence of clouds, correct selection of bright and dark features for the implementation of pseudo-invariant features, and suitable satellite imagery with optimum water surface and water column conditions (i.e., clear of waves and turbidity). It can evidently offer high-resolution, accurate, rapid SDB extractions without large demands in technical capacity and computation in a plethora of coastal environments. The transferability of [18] to the Leeward Islands of the Caribbean, but applied using high-resolution imagery, allows for the regions data-poor government departments to leverage the high-cost of in situ data from other data-rich island countries.
In the near future, we aim to amalgamate the herein implemented methodological approach, advances in new multispectral, hyperspectral, and LiDAR satellite sensors, and open and public satellite datasets (e.g., Sentinel-2 and Landsat series), existing and newly acquired in situ depth survey data, and cloud computing platforms to scale up SDB estimations in space and time.

Supplementary Materials

The following are available online at https://0-www-mdpi-com.brum.beds.ac.uk/2072-4292/11/15/1830/s1, Table S1: Pike_etal_2019_RemoteSensing_SDB_SupplementaryMaterial.xlsx.

Author Contributions

S.P., J.W. and K.M. conceived the idea; S.P. and D.T. performed the analysis and prepared the manuscript; D.P., J.W. and K.M. supported the analysis and contributed to the manuscript; N.C. and P.R. contributed to the manuscript.

Funding

S.P., J.W., K.M., D.P. and N.C. are supported by the European H2020 Project 641762 ECOPOTENTIAL: Improving future ecosystem benefits through Earth Observations. D.T. is supported by a DLR-DAAD Research Fellowship (No. 57186656).

Acknowledgments

This work contributed to and was partially supported by ECOPOTENTIAL: Improving Future Ecosystem Benefits Through Earth Observations, under grant agreement No 641762; part of the European Union’s Horizon 2020 Research and Innovation programme. Dimosthenis Traganos is supported by a DLR-DAAD Research Fellowship (No. 57186656).

Conflicts of Interest

The authors declare no conflict of interest.

References

  1. Coastal and Marine Ecosystems—Marine Jurisdictions: Coastline Length. Available online: https://web.archive.org/web/20120419075053/http://earthtrends.wri.org/text/coastal-marine/variable-61.html (accessed on 12 June 2019).
  2. OECD. An overview of the ocean economy: Assessments and recommendations. In The Ocean Economy in 2030; OECD Publishing: Paris, France, 2016; pp. 24–33. Available online: https://0-doi-org.brum.beds.ac.uk/10.1787/9789264251724-4-en (accessed on 12 June 2019).
  3. Lewis, S.; Maslin, M. Defining the Anthropocene. Nature 2015, 519, 171–180. [Google Scholar] [CrossRef] [PubMed]
  4. Collins, A. The Global Risks Report 2019, 14th ed.; World Economic Forum: Geneva, Switzerland, 2019; Available online: http://www3.weforum.org/docs/WEF_Global_Risks_Report_2019.pdf (accessed on 12 June 2019).
  5. IPBES Global Assessment Preview. Available online: https://www.ipbes.net/news/ipbes-global-assessment-preview (accessed on 12 June 2019).
  6. Wölfl, A.-C.; Snaith, H.; Amirebrahimi, S.; Devey, C.W.; Dorschel, B.; Ferrini, V.; Huvenne, V.A.I.; Jakobsson, M.; Jencks, J.; Johnston, G.; et al. Seafloor Mapping—The Challenge of a Truly Global Ocean Bathymetry. Front. Mar. Sci. 2019, 6, 283. [Google Scholar] [CrossRef]
  7. Lyzenga, D.R. Shallow-water bathymetry using combined lidar and passive multispectral scanner data. Int. J. Remote Sens. 1985, 6, 115–125. [Google Scholar] [CrossRef]
  8. Stumpf, R.P.; Holderied, K.; Sinclair, M. Determination of water depth with high-resolution satellite imagery over variable bottom types. Limnol. Oceanogr. 2003, 48, 547–556. [Google Scholar] [CrossRef]
  9. Lee, Z.; Carder, K.L.; Mobley, C.D.; Steward, R.G.; Patch, J.S. Hyperspectral Remote Sensing for Shallow Waters. 1. A Semianalytical Model. Appl. Opt. 1998, 37, 6329–6338. [Google Scholar] [CrossRef] [PubMed]
  10. Lee, Z.; Carder, K.L.; Mobley, C.D.; Steward, R.G.; Patch, J.S. Hyperspectral Remote Sensing for Shallow Waters. 2. A Semianalytical Model. Appl. Opt. 1999, 38, 3831–3843. [Google Scholar] [CrossRef] [PubMed]
  11. Hodul, M.; Bird, S.; Knudby, A.; Chenier, R. Satellite derived photogrammetric bathymetry. ISPRS J. Photogramm. Remote Sens. 2018, 142, 268–277. [Google Scholar] [CrossRef]
  12. Chénier, R.; Faucher, M.-A.; Ahola, R.; Shelat, Y.; Sagram, M. Bathymetric Photogrammetry to Update CHS Charts: Comparing Conventional 3D Manual and Automatic Approaches. ISPRS Int. J. Geo-Inf. 2018, 7, 395. [Google Scholar] [CrossRef]
  13. Kerr, J.M.; Purkis, S. An algorithm for optically-deriving water depth from multispectral imagery in coral reef landscapes in the absence of ground-truth data. Remote Sens. Environ. 2018, 2010, 307–324. [Google Scholar] [CrossRef]
  14. Traganos, D.; Reinartz, P. Mapping Mediterranean seagrasses with Sentinel-2 imagery. Mar. Pollut. Bull. 2018, 134, 197–209. [Google Scholar] [CrossRef] [Green Version]
  15. Traganos, D.; Reinartz, P. Machine learning-based retrieval of benthic reflectance and Posidonia oceanica seagrass extent using a semi-analytical inversion of Sentinel-2 satellite data. Int. J. Remote Sens. 2017, 39, 9428–9452. [Google Scholar] [CrossRef]
  16. Poursanidis, D.; Traganos, D.; Reinartz, P.; Chrysoulakis, N. On the use of Sentinel-2 for coastal habitat mapping and satellite-derived bathymetry estimation using downscaled coastal aerosol band. Int. J. Appl. Earth Obs. Geoinf. 2019, 80, 58–70. [Google Scholar] [CrossRef]
  17. Pe’eri, S.; Madore, B.; Nyberg, J.; Snyder, L.; Parrish, C.; Smith, S. Identifying bathymetric differences over Alaska’s North Slope using a satellite-derived bathymetry multi-temporal approach. J. Coast. Res. 2016, 76, 56–63. [Google Scholar] [CrossRef]
  18. Traganos, D.; Poursanidis, D.; Aggarwal, B.; Chrysoulakis, N.; Reinartz, P. Estimating Satellite-Derived Bathymetry (SDB) with the Google Earth Engine and Sentinel-2. Remote Sens. 2018, 10, 859. [Google Scholar] [CrossRef]
  19. Poursanidis, D.; Traganos, D.; Chrysoulakis, N.; Reinartz, P. Cubesats Allow High Spatiotemporal Estimates of Satellite-Derived Bathymetry. Remote Sens. 2019, 11, 1299. [Google Scholar] [CrossRef]
  20. Sagawa, T.; Yamashita, Y.; Okumura, T.; Yamanokuchi, T. Satellite Derived Bathymetry Using Machine Learning and Multi-Temporal Satellite Images. Remote Sens. 2019, 11, 1155. [Google Scholar] [CrossRef]
  21. Hell, B.; Broman, B.; Jakobsson, L.; Jakobsson, M.; Magnusson, A.; Wiberg, P. The Use of Bathymetric Data in Society and Science: A Review from the Baltic Sea. Ambio 2012, 41, 138–150. [Google Scholar] [CrossRef] [PubMed]
  22. International Hydrographic Organization (IHO). S-57 Supplement No. 3—Supplementary Information for the Encoding of S-57 Edition 3.1 ENC Data; International Hydrographic Organization: Monaco, Principauté de Monaco, 2014; Available online: https://www.iho.int/iho_pubs/standard/S-57Ed3.1/S-57_e3.1_Supp3_Jun14_EN.pdf (accessed on 12 June 2019).
  23. DPLUS0045 Anguilla Seabed Classification from MBES data. Available online: http://data.cefas.co.uk/#/View/19316 (accessed on 23 January 2019).
  24. DPLUS026 British Virgin Islands Seabed Classification Map. Available online: http://data.cefas.co.uk/#/View/18174 (accessed on 23 January 2019).
  25. DPLUS0045 Anguilla MBES Bathymetry 2m. Available online: http://data.cefas.co.uk/#/View/19312 (accessed on 23 January 2019).
  26. British Virgin Islands multibeam bathymetry data. Available online: http://data.cefas.co.uk/#/View/3511 (accessed on 23 January 2019).
  27. Astrium GEO-Information Services. Pléiades Imagery—User Guide. Available online: http://satimagingcorp.s3.amazonaws.com/site/pdf/User_Guide_Pleiades.pdf (accessed on 17 June 2019).
  28. Armstrong, R.A. Remote sensing of submerged vegetation canopies for biomass estimation. Int. J. Remote Sens. 1993, 14, 621–627. [Google Scholar] [CrossRef]
  29. Robinson, N.P.; Allred, B.W.; Jones, M.O.; Moreno, A.; Kimball, J.S.; Naugle, D.E.; Erickson, T.A.; Richardson, A.D. A Dynamic Landsat Derived Normalized Difference Vegetation Index (NDVI) Product for the Conterminous United States. Remote Sens. 2017, 9, 863. [Google Scholar] [CrossRef]
  30. Hedley, J.D.; Harborne, A.R.; Mumby, P.J. Technical note: Simple and robust removal of sun glint for mapping shallow-water benthos. Int. J. Remote Sens. 2005, 26, 2107–2112. [Google Scholar] [CrossRef]
  31. Schott, J.R.; Salvaggio, C.; Vochok, W.J. Radiometric scene normalization using pseudo-invariant features. Remote Sens. Environ. 1988, 26, 1–16. [Google Scholar] [CrossRef]
  32. Collin, A.; Hench, J.L.; Pastol, Y.; Planes, S.; Thiault, L.; Schmitt, R.J.; Holbrook, S.J.; Davies, N.; Troyer, M. High resolution topobathymetry using a Pleiades-1 triplet: Moorea Island in 3D. Remote Sens. Environ. 2018, 208, 109–119. [Google Scholar] [CrossRef]
  33. Vinayaraj, P.; Raghavan, V.; Masumoto, S. Satellite-Derived Bathymetry using Adaptive Geographically Weighted Regression Model. Mar. Geod. 2016, 39, 458–478. [Google Scholar] [CrossRef]
  34. Li, J.; Schill, S.R.; Knapp, D.E.; Asner, G.P. Object-Based Mapping of Coral Reef Habitats Using Planet Dove Satellites. Remote Sens. 2019, 11, 1445. [Google Scholar] [CrossRef]
  35. Tobler, W.R. A computer movie simulating urban growth in the Detroit region. Econ. Geogr. 1970, 46, 234–240. [Google Scholar] [CrossRef]
  36. Allen Coral Atlas. 2019. Available online: http://www.allencoralatlas.com (accessed on 14 June 2019).
  37. Hancock, S.; Armston, J.; Hofton, M.; Sun, X.; Tang, H.; Duncanson, L.I.; Kellner, J.; Dubayah, R. The GEDI Simulator: A Large-Footprint Waveform LidarSimulator for Calibration and Validationof Spaceborne Missions. Earth Space Sci. 2019, 6, 294–310. [Google Scholar] [CrossRef] [PubMed]
  38. Forfinski-Sarkozi, N.A.; Parrish, C.E. Analysis of MABEL Bathymetry in Keweenaw Bay and Implications for ICESat-2 ATLAS. Remote Sens. 2016, 8, 772. [Google Scholar] [CrossRef]
  39. Li, Y.; Gao, H.; Jasinski, M.; Zhang, S.; Stoll, J. Deriving High-Resolution Reservoir Bathymetry From ICESat-2 Prototype Photon-Counting Lidar and Landsat Imagery. IEEE Trans. Geosci. Remote Sens. 2019, in press. [Google Scholar] [CrossRef]
  40. Guanter, L.; Kaufmann, H.; Segl, K.; Foerster, S.; Rogass, C.; Chabrillat, S.; Kuester, T.; Hollstein, A.; Rossner, G.; Chlebek, C.; et al. The EnMAP Spaceborne Imaging Spectroscopy Mission for Earth Observation. Remote Sens. 2017, 7, 8830. [Google Scholar] [CrossRef]
  41. Turpie, K.; Ackelson, S.; Bell, T.; Dierssen, H.; Goodman, J.; Green, O.R.; Guild, L.; Hochberg, E.; Klemas, V.V.; Lavender, S.; et al. Global Observations of Coastal and Inland Aquatic Habitats. Available online: https://hyspiri.jpl.nasa.gov/downloads/RFI2_HyspIRI_related_160517/RFI2_final_coastalpp_TurpieKevinR.pdf (accessed on 18 June 2019).
  42. Gorelick, N.; Hancher, M.; Dixon, M.; Ilyushchenko, S.; Thau, D.; Moore, R. Google Earth Engine: Planetary-scale geospatial analysis for everyone. Remote Sens. Environ. 2017, 202, 18–27. [Google Scholar] [CrossRef]
  43. Microsoft Azure. 2019. Available online: https://azure.microsoft.com/en-us/ (accessed on 14 June 2019).
  44. Amazon AWS. 2019. Available online: https://aws.amazon.com/ (accessed on 14 June 2019).
  45. Copernicus DIAS. 2019. Available online: https://www.copernicus.eu/en/access-data/dias (accessed on 14 June 2019).
Figure 1. Area of interest for the study sites; (a) the Leeward Islands of the Caribbean; (b) the British Virgin Islands, and (c) Anguilla. The bounding boxes indicate the geographic corners of the satellite imagery. The dotted extent represents the boundary of in situ data available.
Remotesensing 11 01830 g001
Figure 2. Location of pseudo-invariant features (right column panels) for (a) Anguilla and (b) the British Virgin Islands.
Remotesensing 11 01830 g002
Figure 3. Pre-processed Pleiades imagery and satellite-derived bathymetry (SDB) outputs for Anguilla (ac) and the British Virgin Islands (df). The pre-processed Pleiades images, including cloud and terrestrial masking, sun-glint correction, pseudo-invariant features, and low pass 3 × 3 filter (a,d); the SDB outputs, trained on in situ data at depths of 0–10 m (b,e); the SDB outputs trained on in situ data at depths of 10–30 m (c,f).
Remotesensing 11 01830 g003
Figure 4. Validation plots of in situ multibeam echosounders survey data (x-axis) and predicted depth from the modelled satellite-derived bathymetry (y-axis) models in Anguilla (a,b) and the British Virgin Islands (c,d) for: The depth ranges of 0–10 m (a,c) and 10–30 m (b,d).
Remotesensing 11 01830 g004
Figure 5. In situ multibeam echosounder (MBES) survey data and vertical error of the satellite-derived bathymetry (SDB) models for Anguilla (ac) and the British Virgin Islands (df). The MBES survey data, resampled to 2 m where necessary (a,d); the vertical accuracy of the SDB models trained to depths of 0–10 m (b,e); the vertical accuracy of the SDB models trained to depths of 10–30 m (c,f). Note that high error values indicate the positive difference between the SDB and the MBES, and therefore both over- and under- estimation.
Remotesensing 11 01830 g005
Figure 6. In situ multibeam echosounder (MBES) survey data and absolute vertical error of the satellite-derived bathymetry (SDB) models for Anguilla (a,b) and the British Virgin Islands (c,d).
Remotesensing 11 01830 g006
Table 1. Overview of the Pleiades imagery capture.
Study SiteDate of AcquisitionSensor AzimuthSensor Viewing AngleSolar AzimuthSolar Elevation
Anguilla15 August 2016180.3323.6698.1368.01
BVI25 January 2016179.992.51147.7546.49
Table 2. Lyzenga85 multiple linear regression coefficients for each depth range.
Model DepthInterceptB1 CoefficientB2 CoefficientR-Squared ValueRMSE Value, Metres (m)
0–10 m0.0−9.067.720.941.74
10–30 m0.0−16.0714.190.982.29
Table 3. Number of training and validation points used for each study site.
Study SiteModelTraining PointsValidation Points
Anguilla0–10 m
10–30 m
606
1840
607
1839
British Virgin Islands0–10 m
10–30 m
-375
3260
Table 4. Comparative statistical results between the two study sites and two depth ranges. Displayed in bold are the highest R2 and lowest RMSE values for each study site.
Study SiteDepth Range, Metres (m)R-Squared ValueRMSE Value, Metres (m)
Anguilla0–100.231.76
10–300.562.40
British Virgin Islands0–100.441.39
10–300.338.99

