1. Introduction
1.1. Tropical Cyclone Hazards
Tropical cyclones (TCs), including typhoons and hurricanes, are considered to be among the most destructive natural hazards in terms of their severity, duration and areas affected. Every year in various parts of the world, they cause loss of human lives, crops and livestock, and extensive damage to infrastructure, transport and communication systems. Information on the distribution and variation of TCs, along with the effects of climate variability and global warming on their occurrence, is therefore crucial for assessing vulnerability and for disaster prevention [
1,
2,
3,
4]. The Asia region is especially prone to TC occurrence and their negative impacts. Nguyen et al. [
4], for example, used 21 indicators to identify vulnerability to typhoons using geospatial techniques by implementing a conceptual framework modified from an eco-environmental vulnerability assessment, suitable for implementation at regional to global scales [
5,
6,
7,
8]. Accurately predicting the migratory track, intensity and rainfall of TCs is a key research focus for meteorologists and weather forecasters [
9]. Factors influencing track orientation, shape, sinuosity, and ultimately points of landfall are of particular interest [
10,
11]. Satellite-based cloud images are useful for analyzing TC cloud structure and dynamics [
12,
13,
14,
15,
16].
1.2. Dual-Vortex Interactions
When two TCs approach one another, they can influence each other through a cyclone–cyclone vortex interaction. The dual-vortex interaction, known as the ‘Fujiwhara effect’ (also referred to as the Fujiwhara interaction or a binary interaction), occurs between two TC systems that are close enough (generally less than 1400 km apart) to affect each other significantly and cause a tendency towards mutual rotation. Studying the various possible behavior patterns of a dual-vortex interaction is important as it offers the potential to improve weather forecasting. Several such dual-vortex interactions have been studied in the past [
17,
18,
19,
20]. For instance, Hart and Evans [
21] simulated the interaction of dual vortices in horizontally-sheared environmental flows on a beta plane, and the intensification of Hurricane Sandy in 2012 during the warm seclusion phase of its extratropical transition was investigated by Galarneau et al. [
22].
The interaction between TCs and other types of adjacent weaker cyclonic systems such as tropical depressions (TDs) and tropical storms (TSs) has further been identified as an additional type of interaction. For example, Wu et al. [
23] proposed that the position of TS Bopha in 2000 between typhoons Saomai and Wukong caused these two systems to interact. Similarly, Liu et al. [
24] examined the interaction between typhoons Tembin and Bolaven in 2012. TDs sandwiched between them resulted in an indirect cyclone–cyclone interaction. However, modelling the impacts of a TD positioned between two mature cyclones is problematic and profoundly complicates the numerical weather predictions for such conditions. To characterize multiple dual-vortex interactions, Liou et al. [
25] proposed empirical formulas (hereinafter referred to as the ‘Liou–Liu formulas’) for determining threshold distances between them. The formulas are empirically related to the size factor, height difference, rotation factor, and the current intensity (CI) that takes into account maximum wind speed and intensity. The Liou–Liu formulas successfully predicted and quantified the impacts of intermediate TDs and are therefore adopted in this paper. Nonetheless, because various types of dual-vortex interactions may exist, much further investigation is needed to deepen our understanding of such phenomena and to improve cyclone track predictions in future.
The Northwest Pacific (NWP) is the most active ocean basin for TC (typhoon) formation in the world. Studying the influence of cooler air masses, air flows and outflow jets on typhoons is especially important in the NWP basin because upper cooler air masses exert a temperature gradient to the north, while lower air flows transfer warm and humid air to south of any typhoons that form. Air flow behaves in a fluid manner, meaning air naturally flows from areas of higher pressure to where the pressure is lower. Like any fluid, air flow may exhibit both laminar and turbulent flow patterns. Laminar flow (‘air flow’ mentioned in this paper) occurs when air can flow smoothly. Turbulent flow (‘jet flow’ mentioned in this paper) occurs when there is an irregularity which alters the direction of movement. The simultaneous existence of both upper cool air masses and lower warm and humid air flows can greatly affect typhoon intensity. Lee et al. [
26], for example, reported that during the winter seasons of 2013 and 2014, typhoons Haiyan and Hagupit both intensified into super-typhoons through their interactions with cold fronts in the NWP Ocean. Cold fronts at the leading edge of cooler air masses were found to exert greater temperature gradients between fronts and the main body of typhoon circulation, assisting typhoon enhancement. During summer over the NWP Ocean, southwest air flows may also play a role in amplifying typhoon intensity [
27]. A better visualization of such influences is clearly necessary in studying typhoon intensification processes. Liou et al. [
28] built upon earlier work on super-typhoon formation in winter to investigate the seasonal dependence on distribution and profiles. Their findings are potentially helpful in advancing the understanding and predictability of super-typhoons in order to reduce their impacts on human lives and wellbeing.
1.3. Aims
The observation and quantification of dual-vortex interactions are important for weather prediction models and forecasts. The present study documents a case of successive dual-vortex interactions from the perspective of satellite observations. It aims to validate cyclonic interactions based on the generalized Liou–Liu formulas, which calculate threshold distances between the centers of two cyclonic systems required for their interaction, as developed by Liou et al. [
25] in an earlier study. This is accomplished through investigating an unusual case involving three consecutive interactions in the Pacific region east of Taiwan in 2017. Three sets of dual-vortex interactions occurred between (1) Typhoon Noru and TS Kulap; (2) Typhoon Noru, Typhoon Nesat, and jet flows and air flows separating them; and (3) Typhoon Nesat and TD Haitang. The consecutive phenomena all demonstrate different varieties of dual-vortex interactions. The abovementioned aims are tackled by performing three specific tasks: (1) Examining the main features of multiple TC interactions through a study of quadruple typhoons Noru, Kulap, Nesat and Haitang in 2017; (2) applying useful empirical equations that have the potential to quantify the interactions observed as a function of distance, size, height difference and rotation factors; and (3) highlighting the satellite image analyses techniques that were applied.
2. Overview of Typhoons Noru, Kulap, Nesat and Haitang in 2017
When multiple TCs develop in proximity to one another, either simultaneously or in close succession, a triple or quadruple sequence of cyclone–cyclone interactions may occur. The primary focus of our study here is on the life cycle of typhoons Noru, Kalup, Nesat and Haitang in 2017. The goal was to improve our understanding of interactions between simultaneously occurring cyclone systems and the effects of nearby cooler air masses, jet flows and air flows that influenced them. Attention was directed especially on typhoon intensity, corresponding distances between typhoons and influential environmental cooler air masses and air flows, characteristics of a mutual interaction, the induction of outflow jets, and the observed effects on typhoon intensification. Cloud disturbances were used to analyze typhoon development and movement.
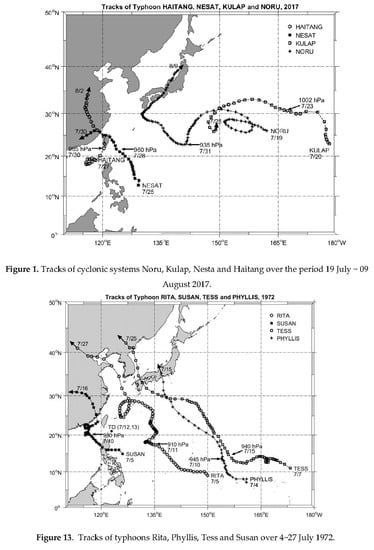
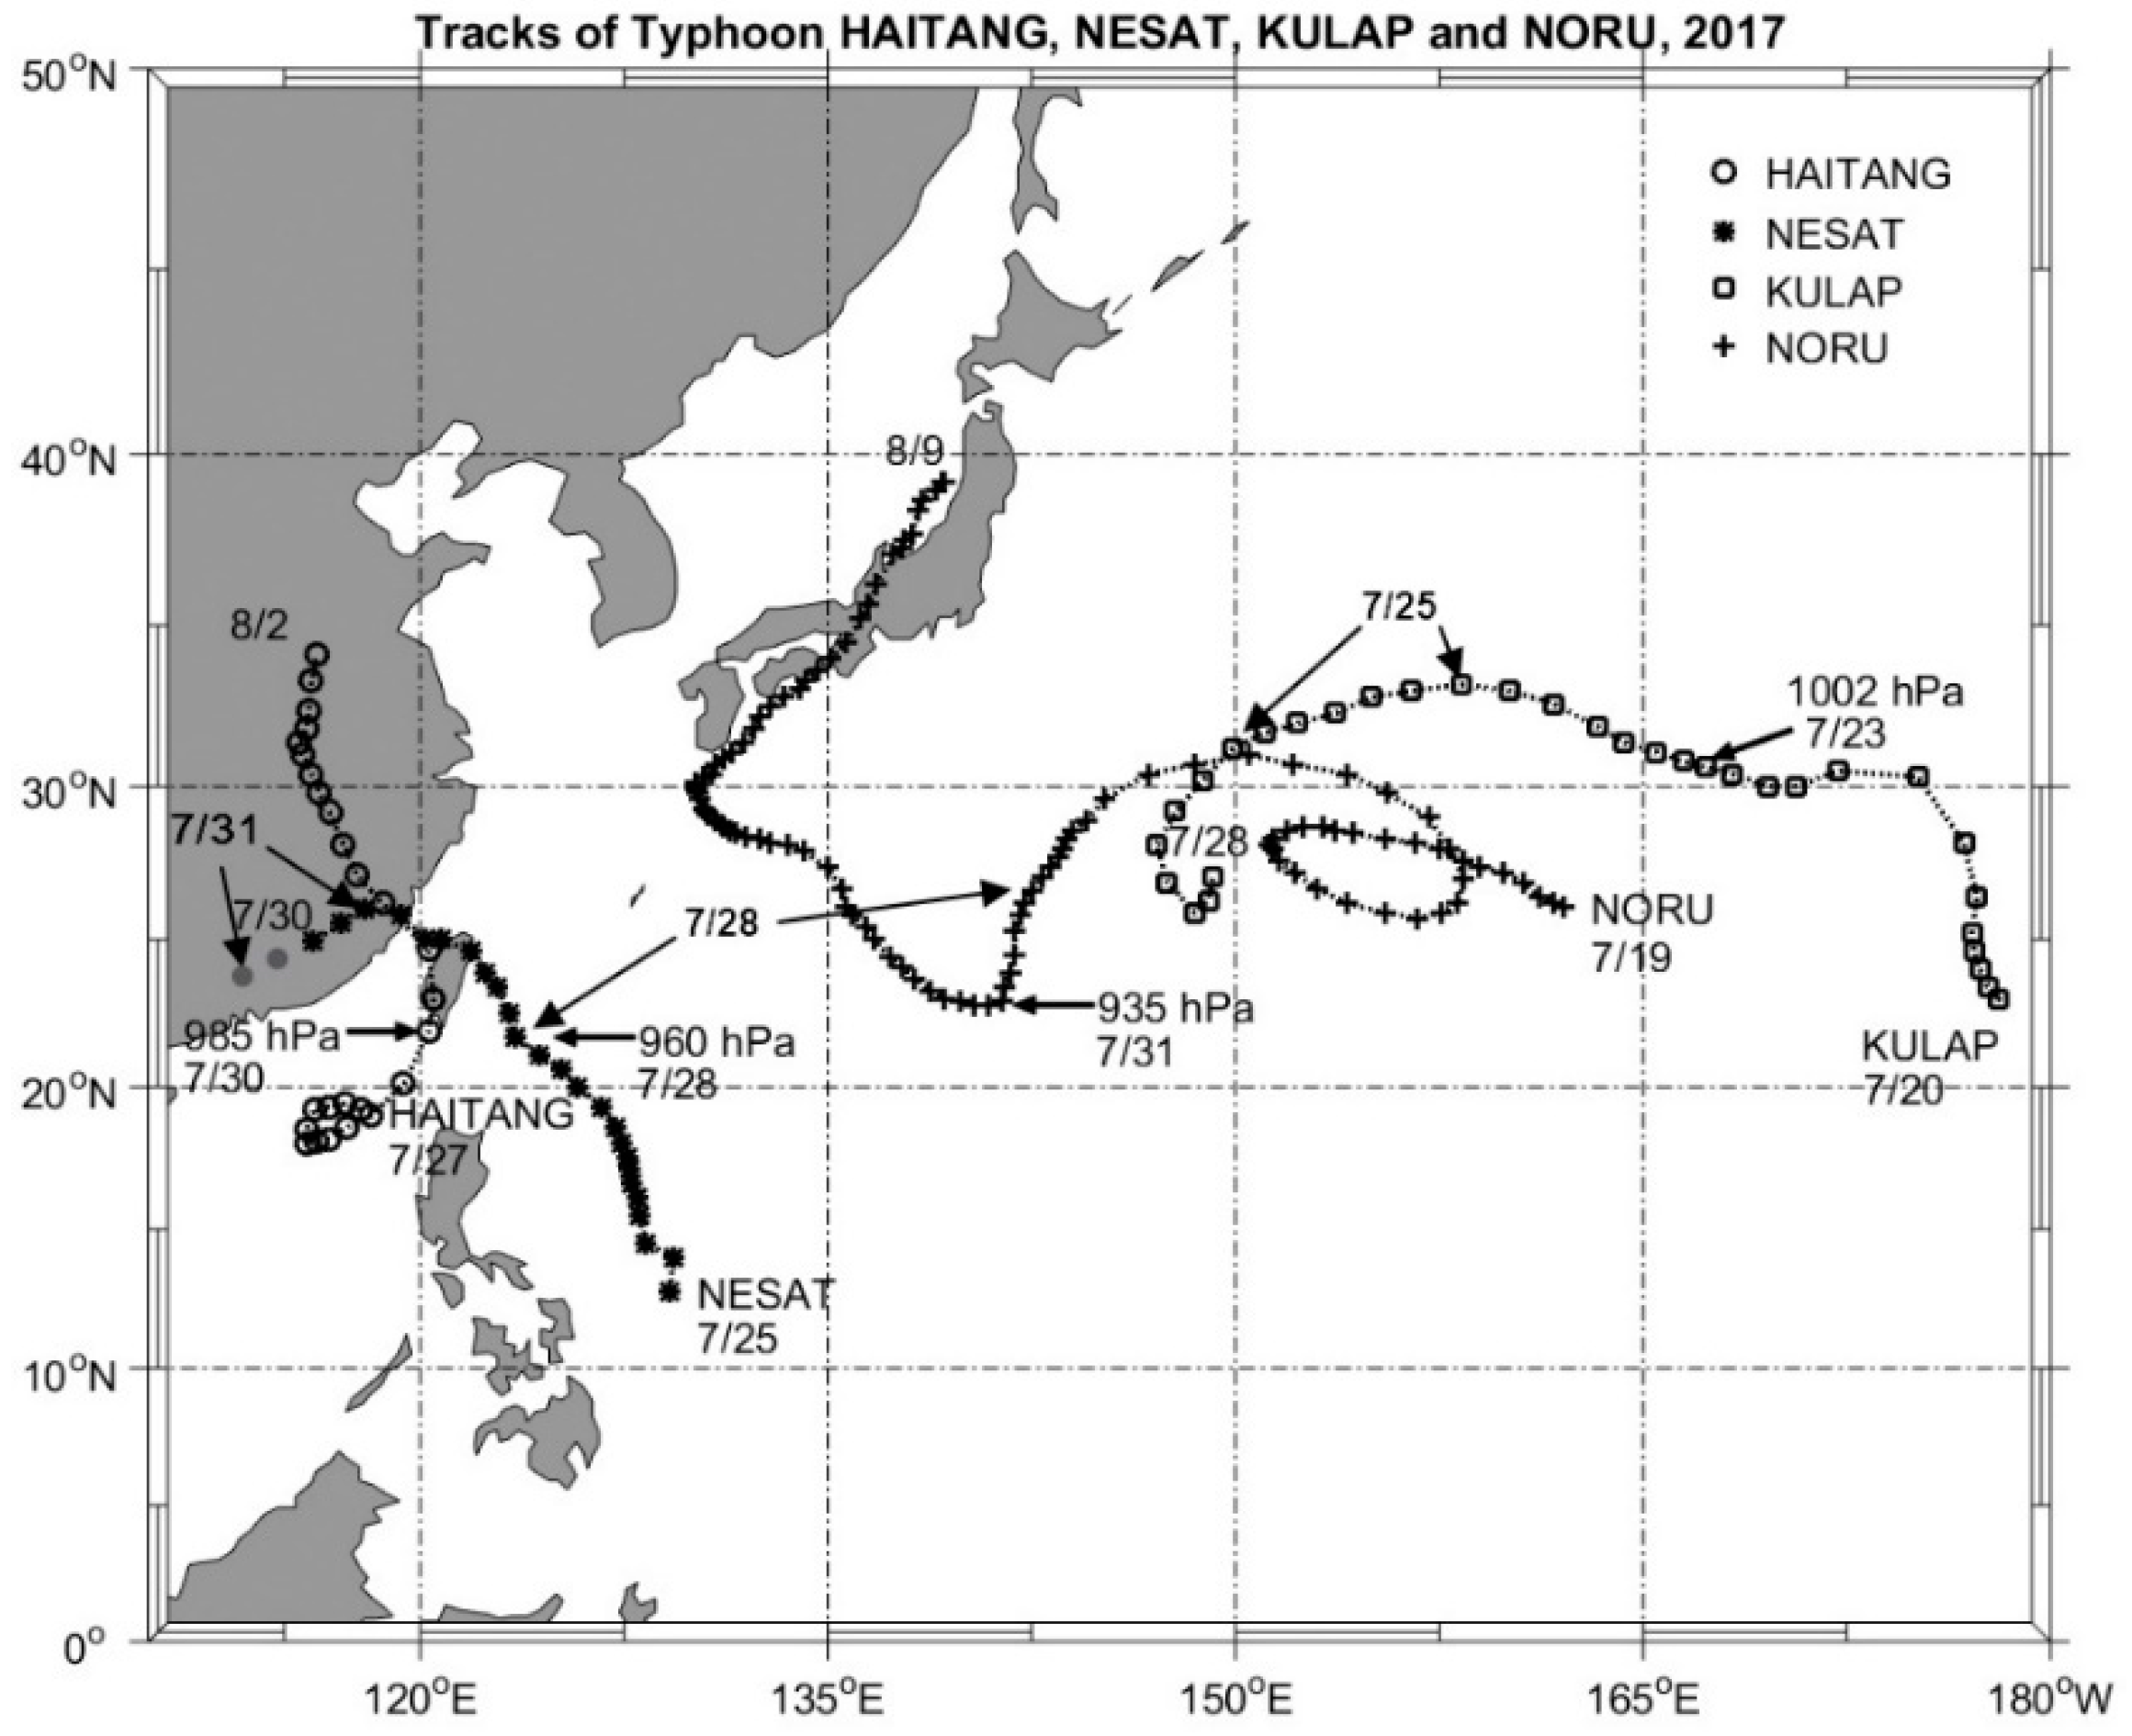
Tracks of cyclonic systems Noru, Kulap, Nesat and Haitang over the period 19 July–09 August 2017 are presented in
Figure 1. Initially, on 23 July 2017, Typhoon Noru was affected by adjacent environmental cooler air masses and jet flows, and it made a U-turn in its track direction. Over 25–27 July, another system, TS Kulap, then approached Noru in the opposite direction. The interaction weakened Kulap, which resulted in its merger with Noru following another track U-turn. Over 27–28 July, although typhoons Noru and newly-formed Nesat laid some 2000–2500 km apart, it was seen that both typhoons experienced rotation on 28 July 2017 and changed direction after that time. This was therefore regarded as an ‘indirect’ dual-vortex interaction between Noru and Nesat. Subsequently, from 29 to 31 July, Typhoon Haitang, the last system to form within the study period, tracked close to Typhoon Nesat. A typical effect was observed as the two systems began orbiting cyclonically, creating the third in the observed sequence of dual-vortex interactions. The typhoon positions and timings of the three dual-vortex interactions are noted for 25, 28 and 31 July in
Figure 1.
Owing to this complex sequence of multiple interactions, it is important to locate and clearly recognize the four tropical cyclones of interest over the timeframe of 23 July–01 August. In addition, because a jet flow in the region between typhoons Noru and Nesat exerted a strong influence during this period, the effects of the jet flow on the development and behavior of the two typhoons needed to be examined.
3. Data and Methodology
3.1. Himawari-8 Geostationary Weather Satellite Images
By utilizing images of the Himawari-8 geostationary weather satellite (longitude 140.7°E), a new empirical technique was recently introduced for the automatic determination of the center of a tropical cyclone system. The data were obtained from the visible (0.55–0.75 µm), water vapor absorption (6.2 µm) and thermal infrared (10.4 µm) channels at thirty (30) minute time intervals. This innovative technique determines the point around which the fluxes of the gradient vectors of brightness temperature (BT) tend to converge [
27].
To calculate the variables for measuring an individual typhoon’s cloud system, center and intensity, the spectral features of the geostationary satellite IR window and water vapor channel data were used. Hourly data were utilized from two infrared channels: IR1 (10.5 to 11.5 μm) and IR2 (11.5 to 12.5 μm), along with IR3, which is a set of water vapor channels (WV 6.5 to 7.0 μm) [
24]. Shortwave infrared (SIR) channels are capable of detecting ice-clouds or ice-covered surfaces within clouds [
29,
30,
31,
32,
33,
34]. This is achieved by observing cloud effective temperatures and optical depths with detectors at 3.7 [
32] or 3.8 μm wavelengths [
29,
30], thereby facilitating the crude characterization of a cloud vertical structure through a variety of empirical methods [
29,
30]. Using both IR1 (10.5–11.5 µm) and IR3 (WV 6.5–7.0 µm) channels, which provide cloud images useful for typhoon observation and analysis, an algorithm was proposed to extract cloud systems and spiral TC patterns in the IR images [
35].
3.2. Differential Averaging Technique
Methods of comparison in microwave technology rely on the comparison of an unknown value of a quantity with a measured quantity using a well-known functional relationship. Among the advantages are a high sensitivity to environmental disturbance. The differential averaging technique is considered as one kind of functional relationship [
36]. In applications, the difference values of two quantities are obtained by the differential mode (DM), and the average values of the two quantities are obtained by the common mode (CM). Comparisons are then made using the difference values divided by the average values (DM/CM). Consequently, the desired quantities (as objects) are detected, and the undesired quantities (as background noise) are cancelled through the comparison.
Recently, observations of weather systems began to take measurements at 30-minute intervals within four channels: Visible (0.55–0.75 μm), thermal infrared windows IR1 (10.5–11.5 μm) and IR2 (11.5–12.5 μm), water vapor absorption IR3 (5.6–7.2 μm), and shortwave infrared (SIR) (3.7, 3.8 or 4.0 μm). In many applications requiring the analysis of cloud structure and dynamics, optical cloud images are obtained from the visible channel, cloud-top images from the IR1 and IR2 infrared window channels, cloud water vapor images from the water vapor absorption channel, and ice-cloud images or ice-covered surfaces in clouds from the SIR channels [
29,
30,
31,
32,
33,
34].
Furthermore, a new set of NDCI (normalized difference convection index) images was generated to provide additional information from satellite images [
35]. For analyzing complex weather systems such as typhoons, which are formed from clouds, ice-clouds and water vapor, cloud-image extraction techniques are needed to acquire as much detail as possible on the desired features. One of the available techniques for extraction is the differential averaging technique, which involves the NDCI operator and the filter. The NDCI operator was applied here to geosynchronous satellite infrared (IR1) images (A
IR1) and IR3 water vapor (WV) images (A
WV). The NDCI images generated are the output results from differences between the differential mode images and the summary average images in the common mode. The differential mode extracts the water vapor from the IR1 images, whereas the common mode takes the average among IR1 images and WV images. The NDCI operator thus improves the operation by providing clearer images and by depicting the differences better. The differential mode and the common mode are written as:
The equation of the NDCI operator is therefore expressed as:
where NDCI values lie between −1 and +1. The NDCI value equals +1 when WV = 0, and it equals −1 when IR1 = 0. A clear sky or atmosphere with thin cloud and dry air will have 0 ≤ NDCI ≤ +1. Cloud systems, on the other hand (wet air), will have −1 ≤ NDCI ≤ 0. Generally, a typhoon system exhibits convection with deep vertical development, so it consists of both dry and wet air and thus generates a value of −1 ≤ NDCI ≤ +1.
3.3. Application of the Liou–Liu Formulas
The Liou–Liu formulas are helpful because they describe TC interactions in a quantitative way, which should improve the numerical modelling of weather forecasting. Moreover, they can characterize both specific and generalized dual-vortex interactions. For two simultaneous individual cyclones named TC
1 and TC
2, values CI
1 and CI
2 are used to represent their current intensities, corresponding to the maximum central wind speed and intensity at the sea surface (
Table 1). The pressure–wind relationship for intense TCs was examined with a particular focus on the physical connections between the maximum surface wind and the minimum sea-level pressure [
37]. The effects of vortex size, background environmental pressure and the presence of complex vortex features were generally omitted. For a maximum wind speed of 50 km/hr, for example, CI was therefore determined to be 1.346 by using the look-up
Table 1, CI = 1 + [(50 − 41) / (54 − 41)] × (1.5 − 1.0).
The application of the Liou–Liu formula [
25] for the threshold distance d
th (km) indicates whether TC
1 and TC
2 experience a dual-vortex interaction with each other, as follows:
In some situations, a tropical depression (TD) or a tropical storm (TS) (i.e., an area of low pressure) occupies the region lying between two individual cyclone systems. A cyclone’s interaction with an intervening TD or TS is a different situation from a regular cyclone-to-cyclone interaction. Upward convection in between may occur because a TD or TS is smaller in size than a cyclone. Such upward convections may strengthen the cyclone and sustain its rotation. Thus, it becomes important to include size ratios, height differences, and rotation in calculating threshold distances. Under such conditions, the Liou–Liu formulas for threshold distances d
th1 and d
th2 can determine whether or not two sets of dual-vortex interactions can be identified, between TC
1 (CI
1) and TD (CI
d) and between TC
2 (CI
2) and TD (CI
d), respectively. Following this method, the Liou–Liu formula for the threshold distance D to quantitatively define the dual-vortex interaction can be written as:
Note here that, in a case of two or more cyclonic interactions (Equation (4)), the symbol d
th represents the threshold distance between respective cyclone centers, whereas in Equation (5), the same symbols (d
th1 or d
th2) represent the threshold distance between TD or TS and the cyclone centers. F
1 and F
2 are tuning factors dependent on the size factors and are related to height-difference and rotation factors.
where
the size factor = size (TD or TS)/size(TC
1,2);
is the height difference between TC
1,2 and TD or TS, where
= (
h(TC
1,2)
− h(TD) or
h(TS))
/(
h(TC
1,2); and
is the rotation factor, with
= +1 for counter-clockwise rotation between TC
1,2 and TD or TS, or −1 for clockwise rotation [
20].
3.4. Cold Front Detection
In meteorology, a cold front is defined as the transition zone where a cold air mass is replacing a warmer air mass. It is accompanied by a strong temperature gradient and frontal cloud bands. A meteorological cold front can be identified from distinctive reflectance characteristics in IR imagery owing to the large temperature contrast along the frontal cloud bands. It is noticeable that the cold cloud top is located near the leading edge of the front where the cold air mass interacts with adjacent warm air.
A technique to detect cold air masses and to delimit the position of a cold front in IR cloud imagery is proposed as follows. IR cloud imagery is a type of thermal imagery in which the cloud-top temperature is detected by an IR sensor. For low temperatures (e.g., −70 °C at a cloud top) the image brightness limit is obtained. For high temperatures (e.g., 25 °C at the sea surface) the image darkness limit is obtained. The IR sensor is saturated with a designated lowest saturation temperature (e.g., from −75 °C to −77 °C). The summed values of the saturation temperature and the cold air masses then determine the brightness contours on the cloud imagery. A cold front is the boundary of the low temperature cold air mass, while higher temperature air flow is located in advance of the cold front. Therefore, the position of the cold front is delimited as the abrupt discontinuity in temperature distribution at the leading edge of the cold air mass. The technique described above was used here to mark the cold front position and for calculating its shortest distance from a cyclone center in order to analyze their mutual interaction over time.
4. Observations on Dual-Vortex Interactions
4.1. Advantages of NDCI Images over IR Images
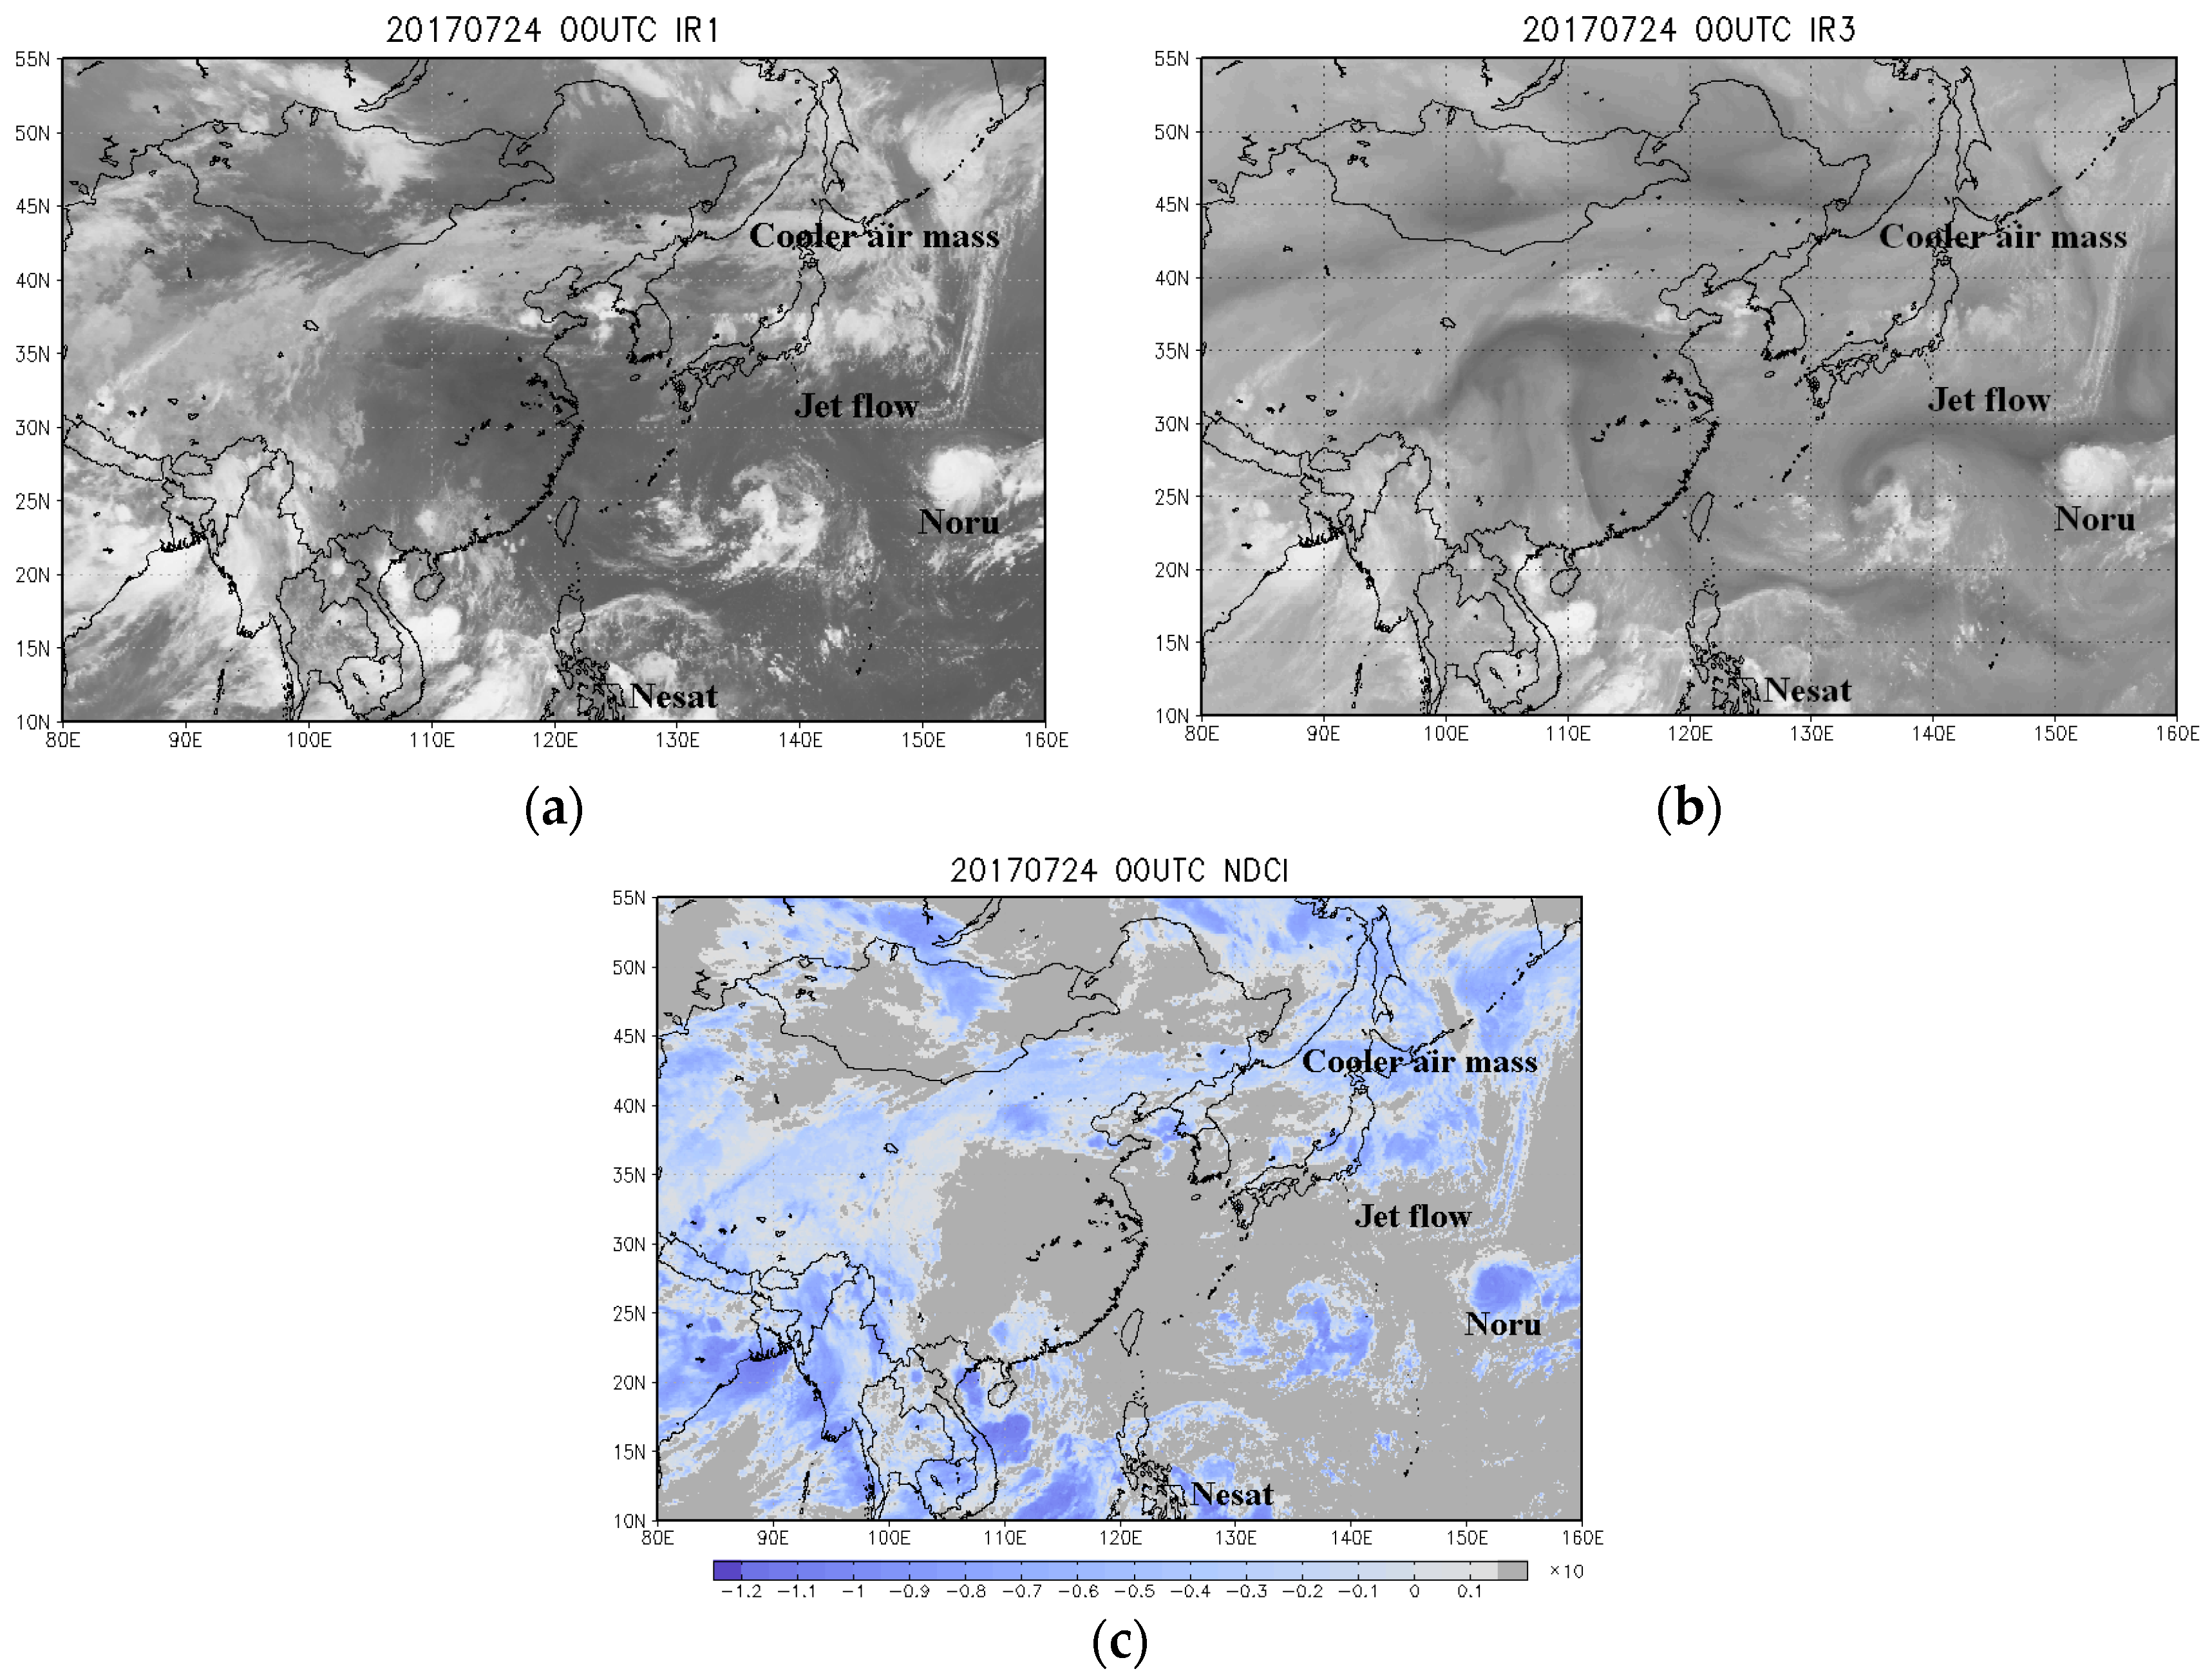
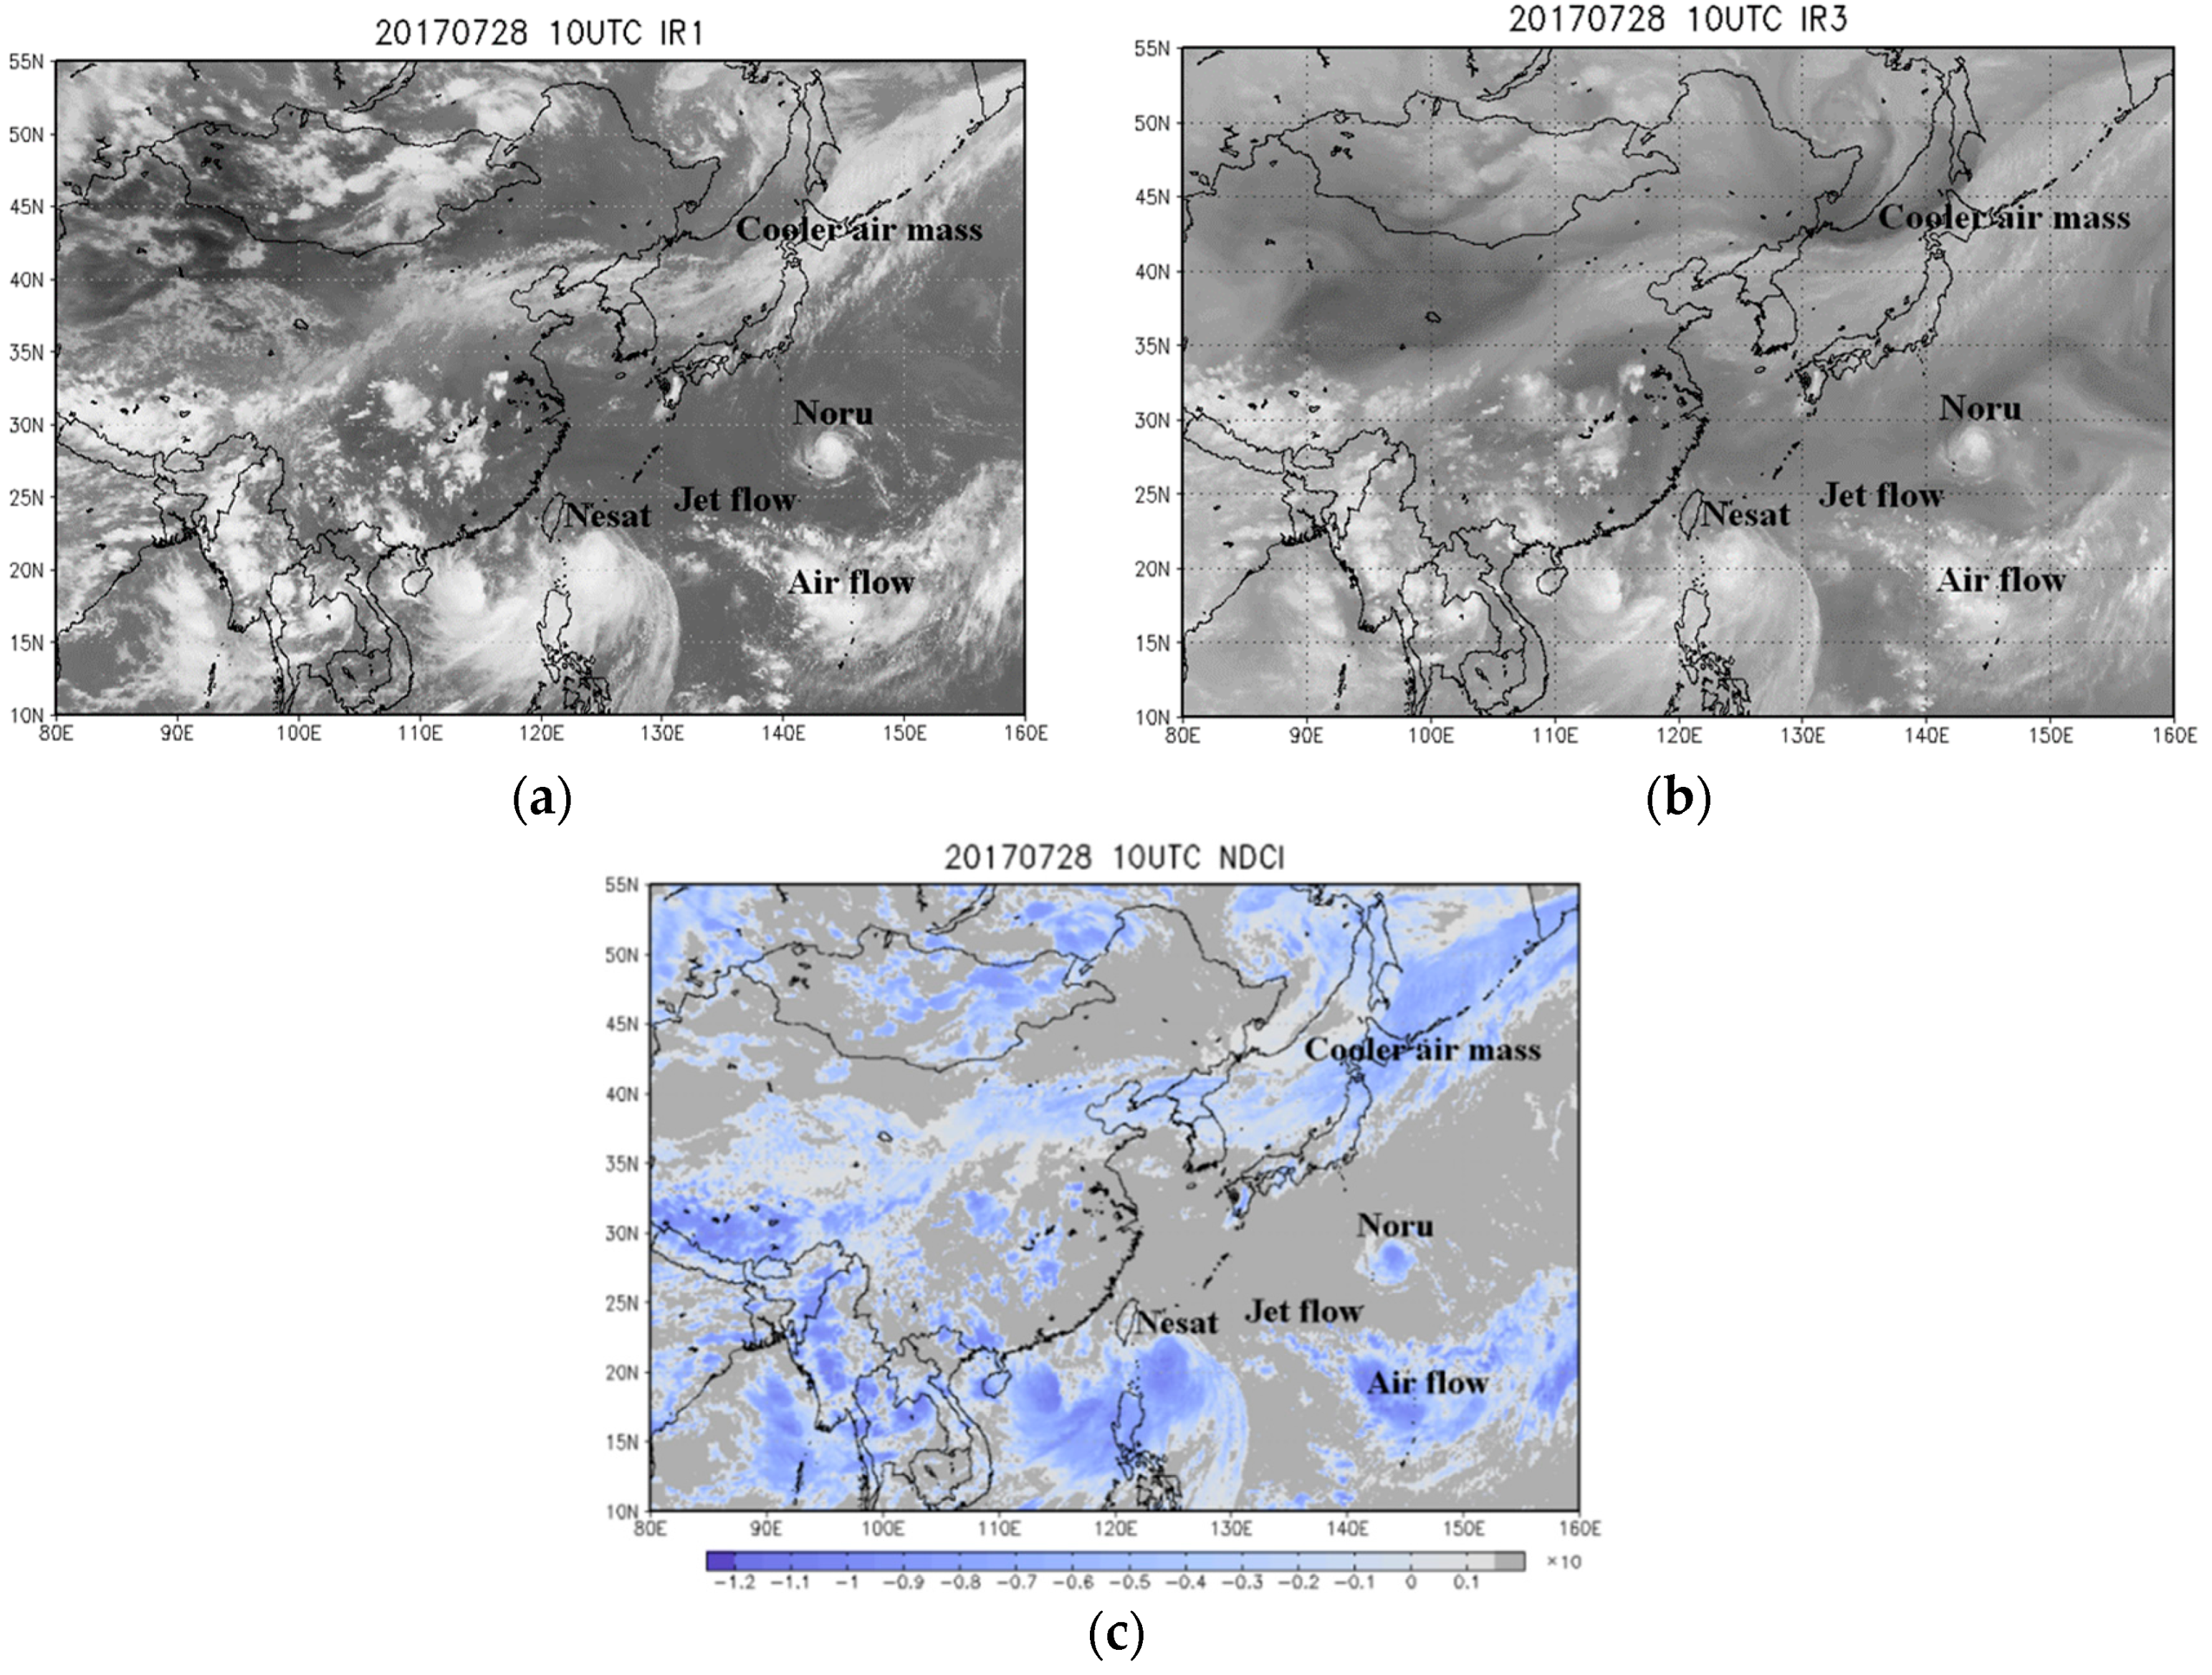
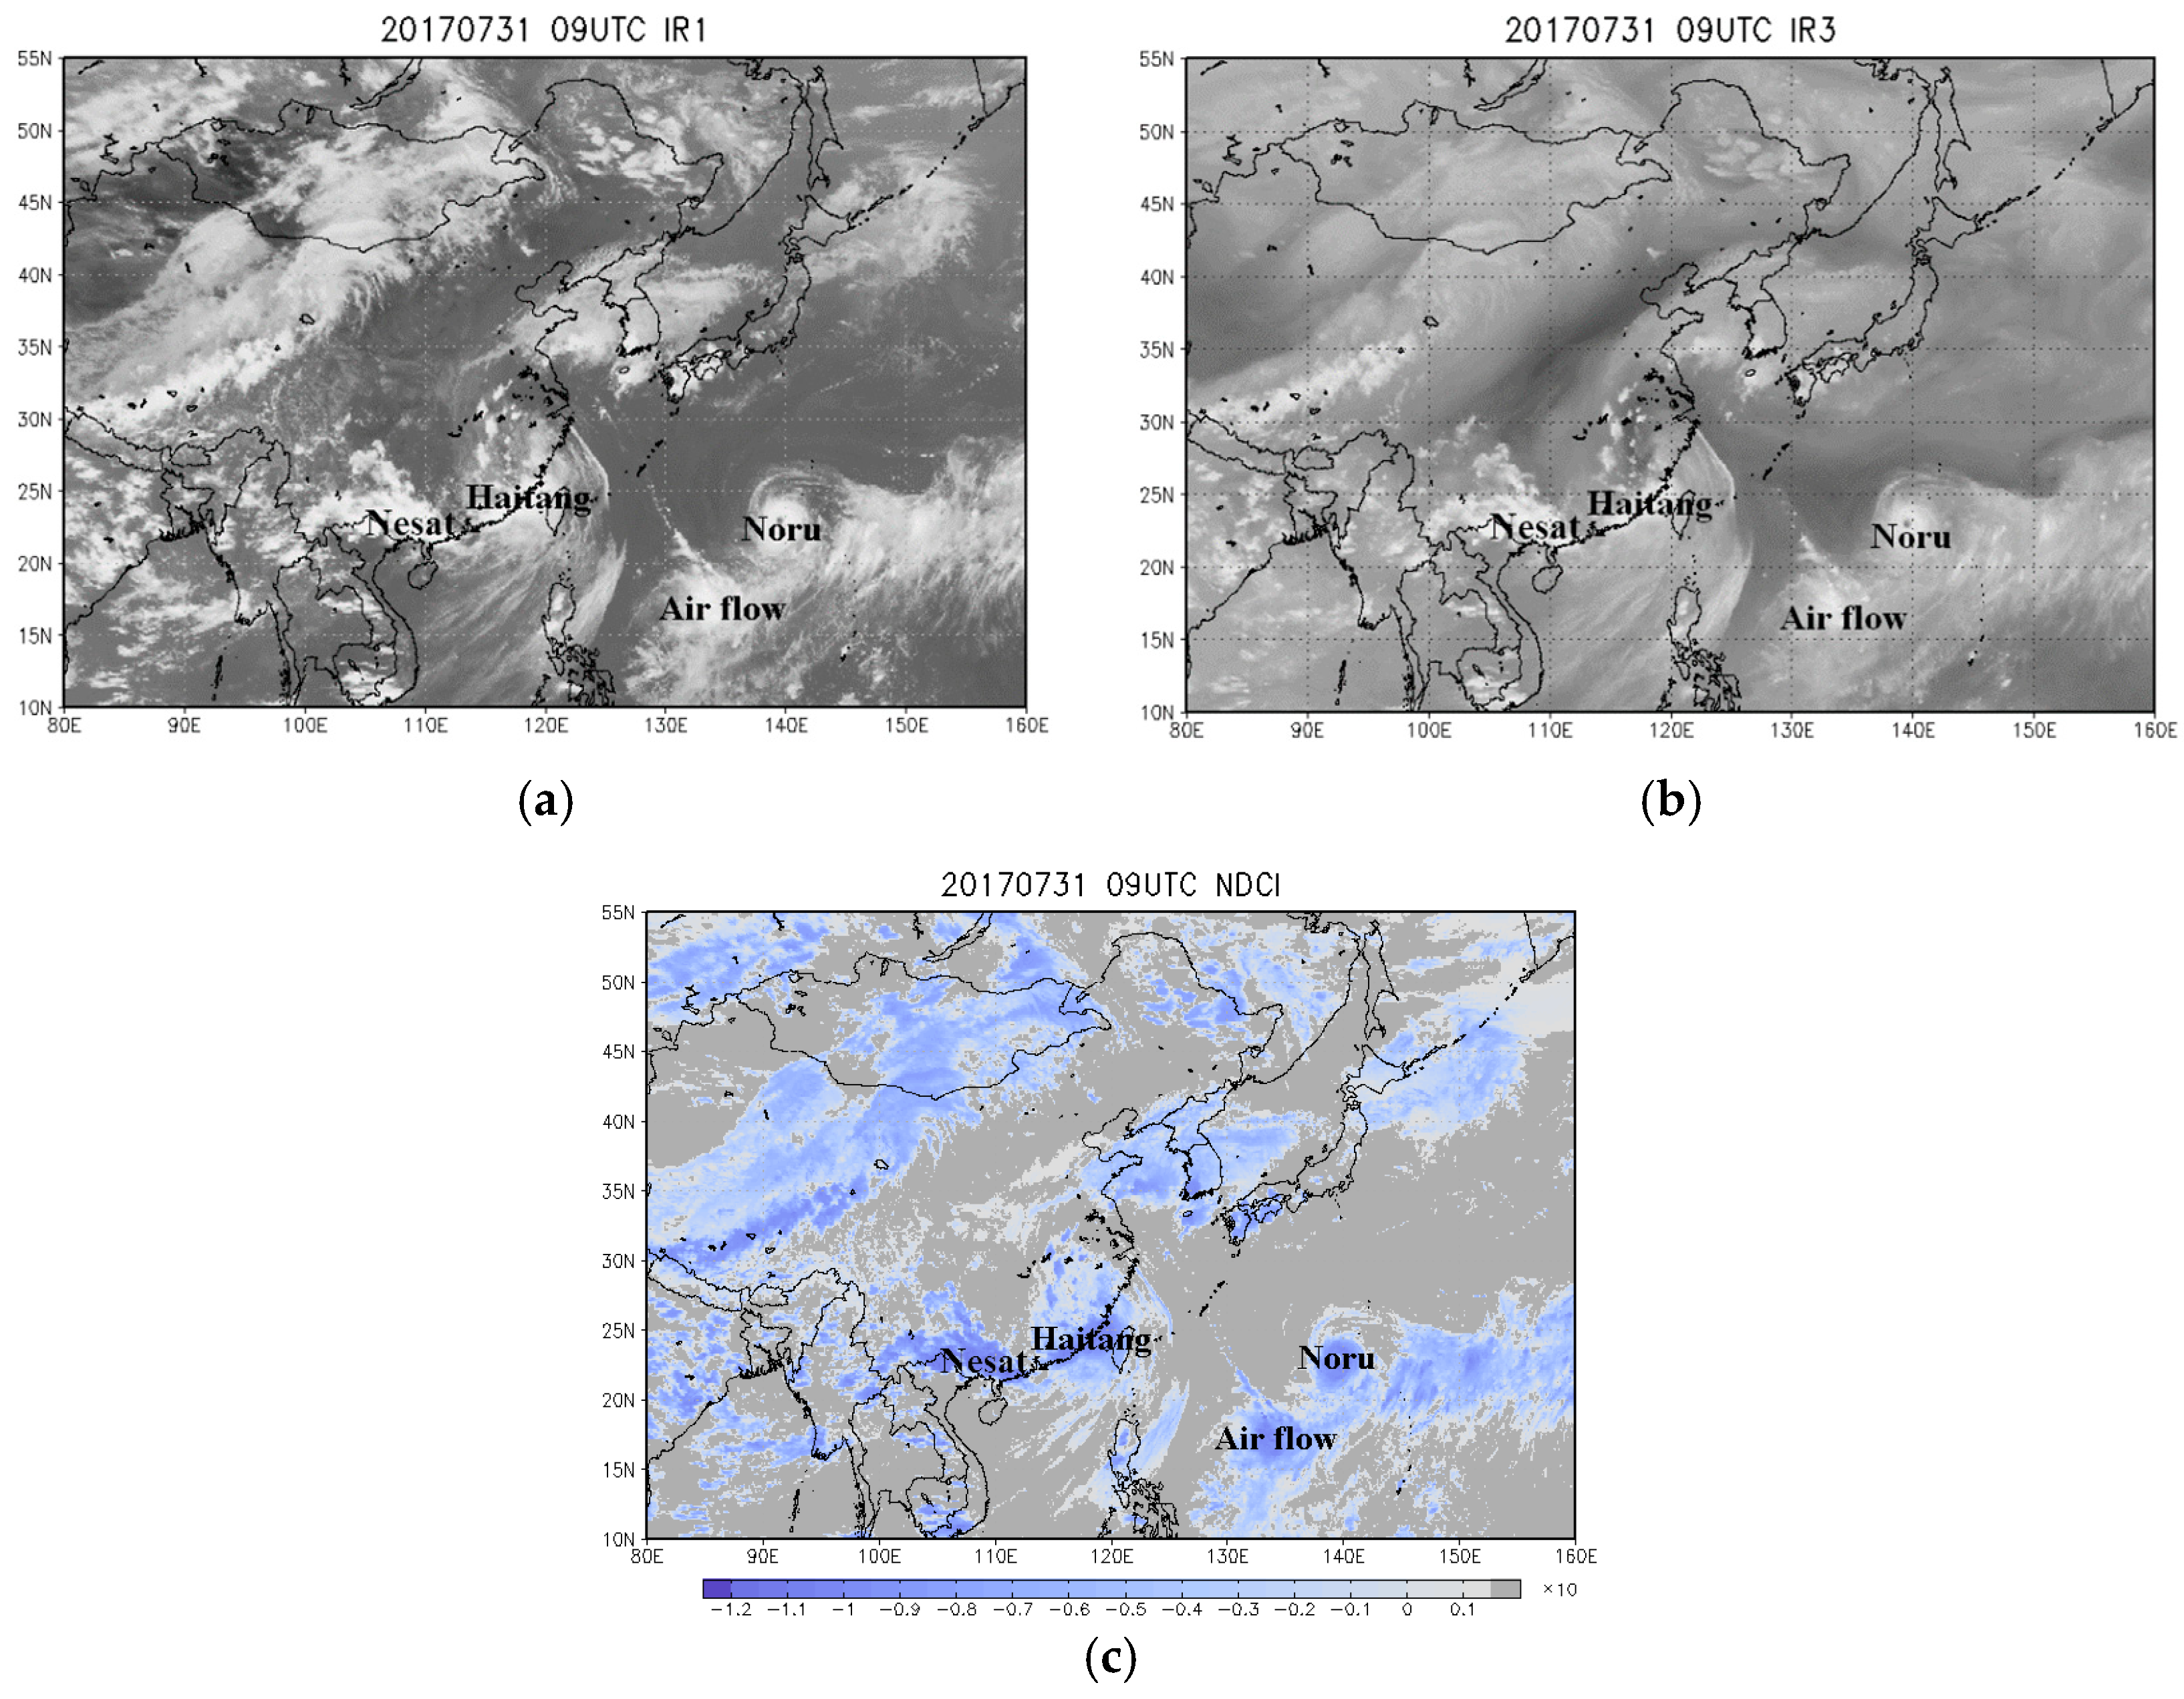
Before describing the characteristics of the sequence of dual-vortex interactions observed during the study period, it is useful to highlight the advantages of using NDCI images to complement the use of IR1 and IR3 images for analysis. From
Figure 2 and
Figure 3, the advantage of NDCI images over the individual channel images IR1 and IR3 can be seen. The NDCI images are able to enhance the differences between the individual IR images. The IR1 image exhibits not only the desired objects (typhoons Noru, Nesat, and cooler air masses and jet flows) but also the undesired background noise. In contrast, the NDCI image shows the desired objects more clearly while reducing the undesired background noise.
The best way to demonstrate is to give examples of cloud structural features that are easily visible in the NDCI images (i.e., the third subplot of
Figure 2,
Figure 3 and
Figure 4), but which are not as clear in the corresponding IR1 or IR3 images. Three examples are provided to serve as illustration. First, in
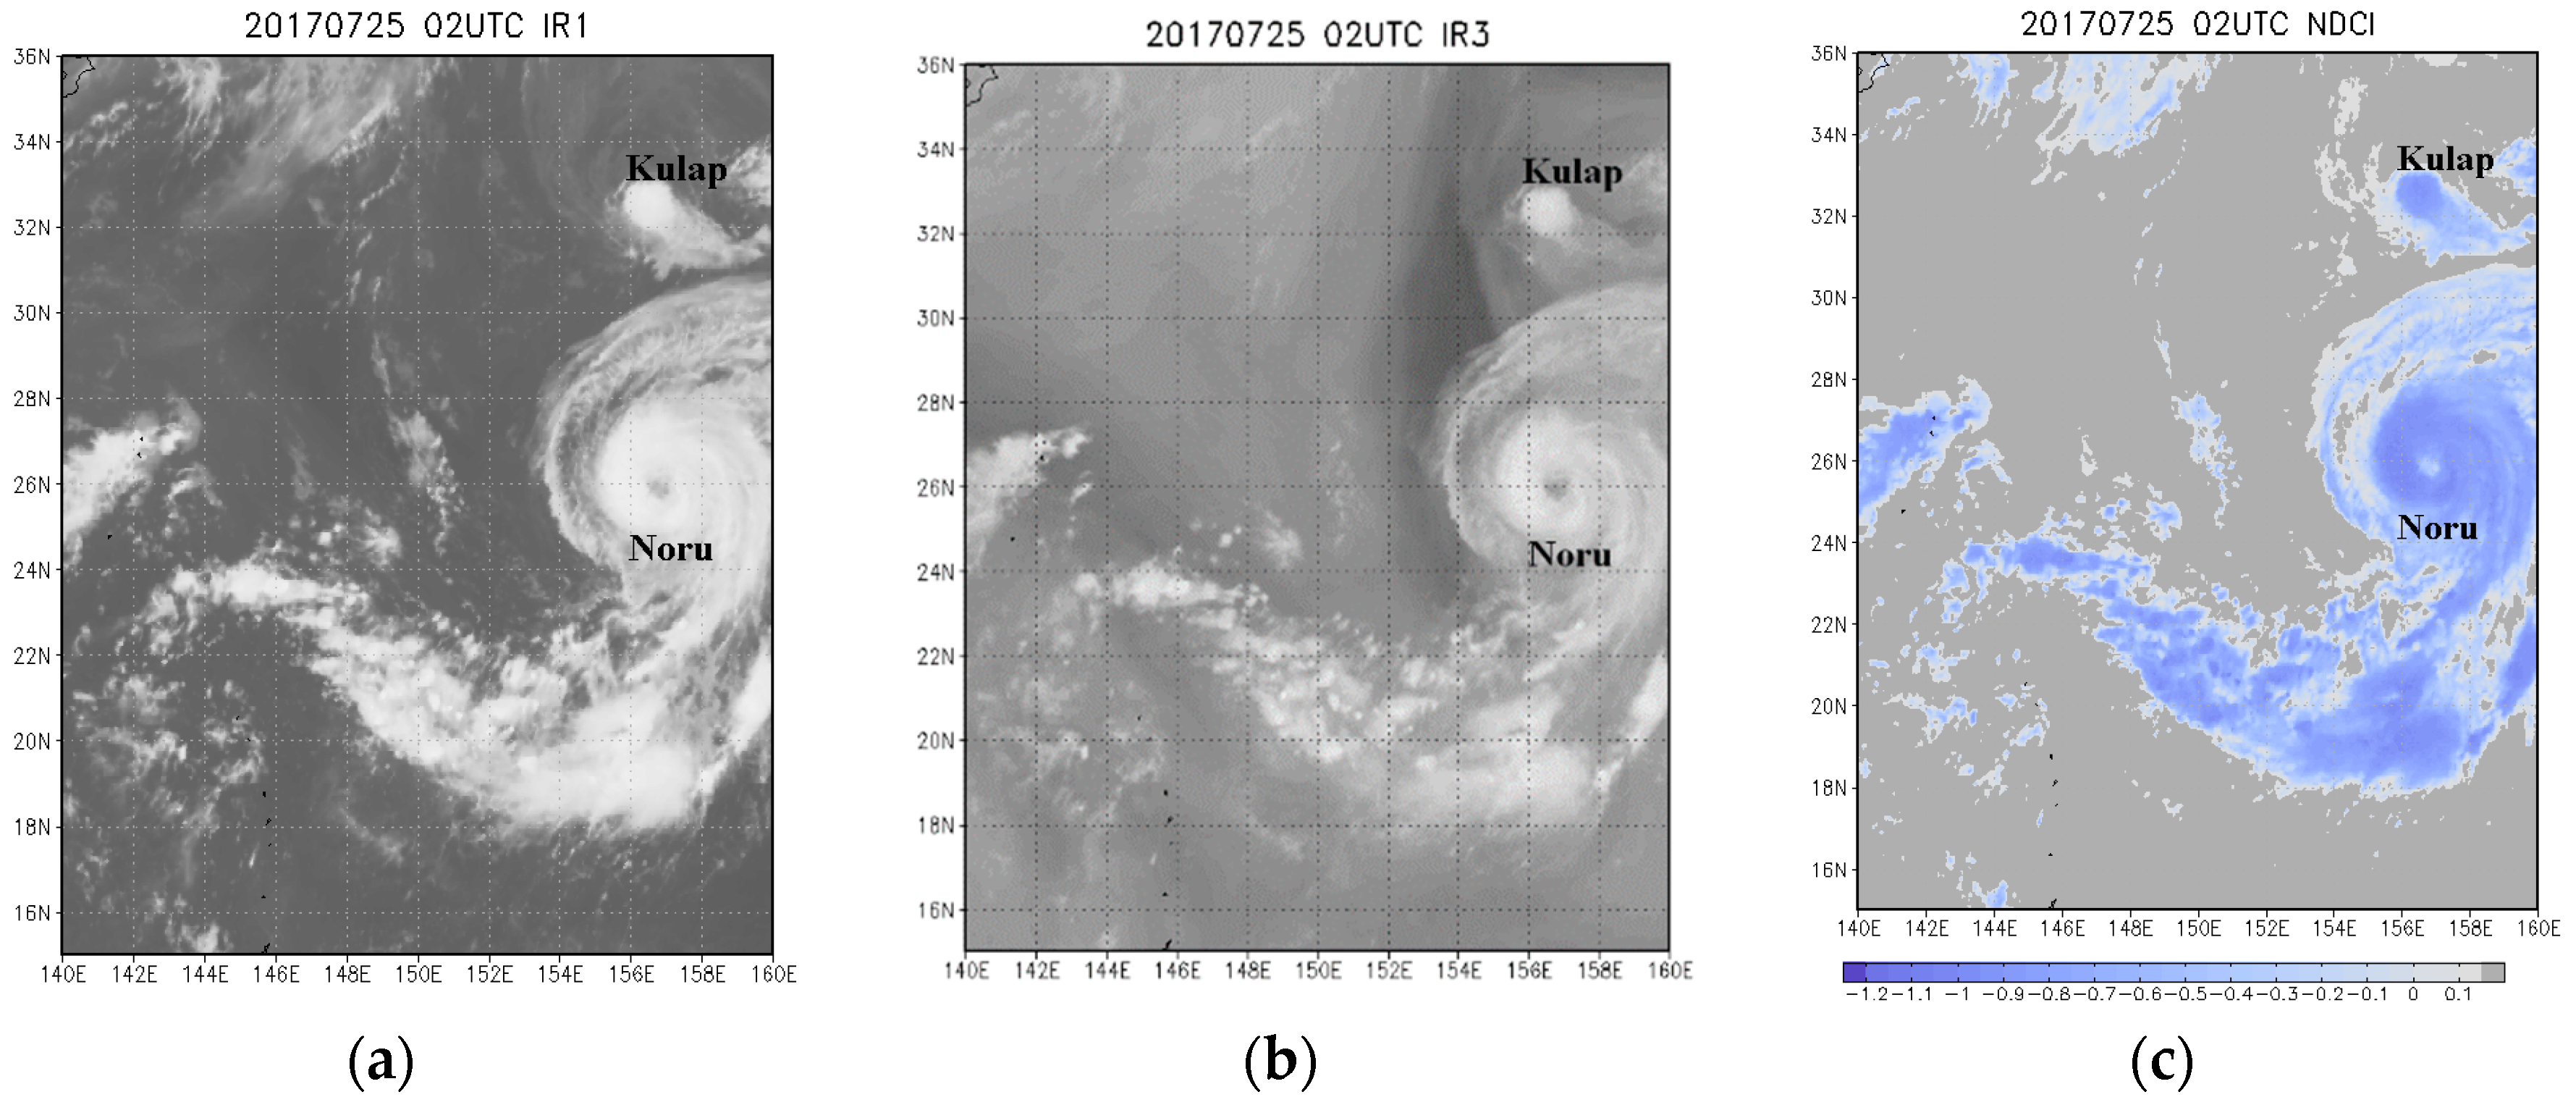
Figure 2, the IR1 image suggests that the cloud associated with the cooler air mass in the north east quadrant appears to be divided into two major sections with a notable gap separating them. However, this apparent gap is much less pronounced in the NDCI image, thus indicating the strong coupling of the two cloud masses that is not obvious from IR1. Note also that the signatures of these cloud masses can hardly be distinguished in IR3. In
Figure 3, the second example refers to the southern peripheral spiral cloud arm of Typhoon Noru. The superiority of the NDCI image over the IR1/IR3 images is again clear. In
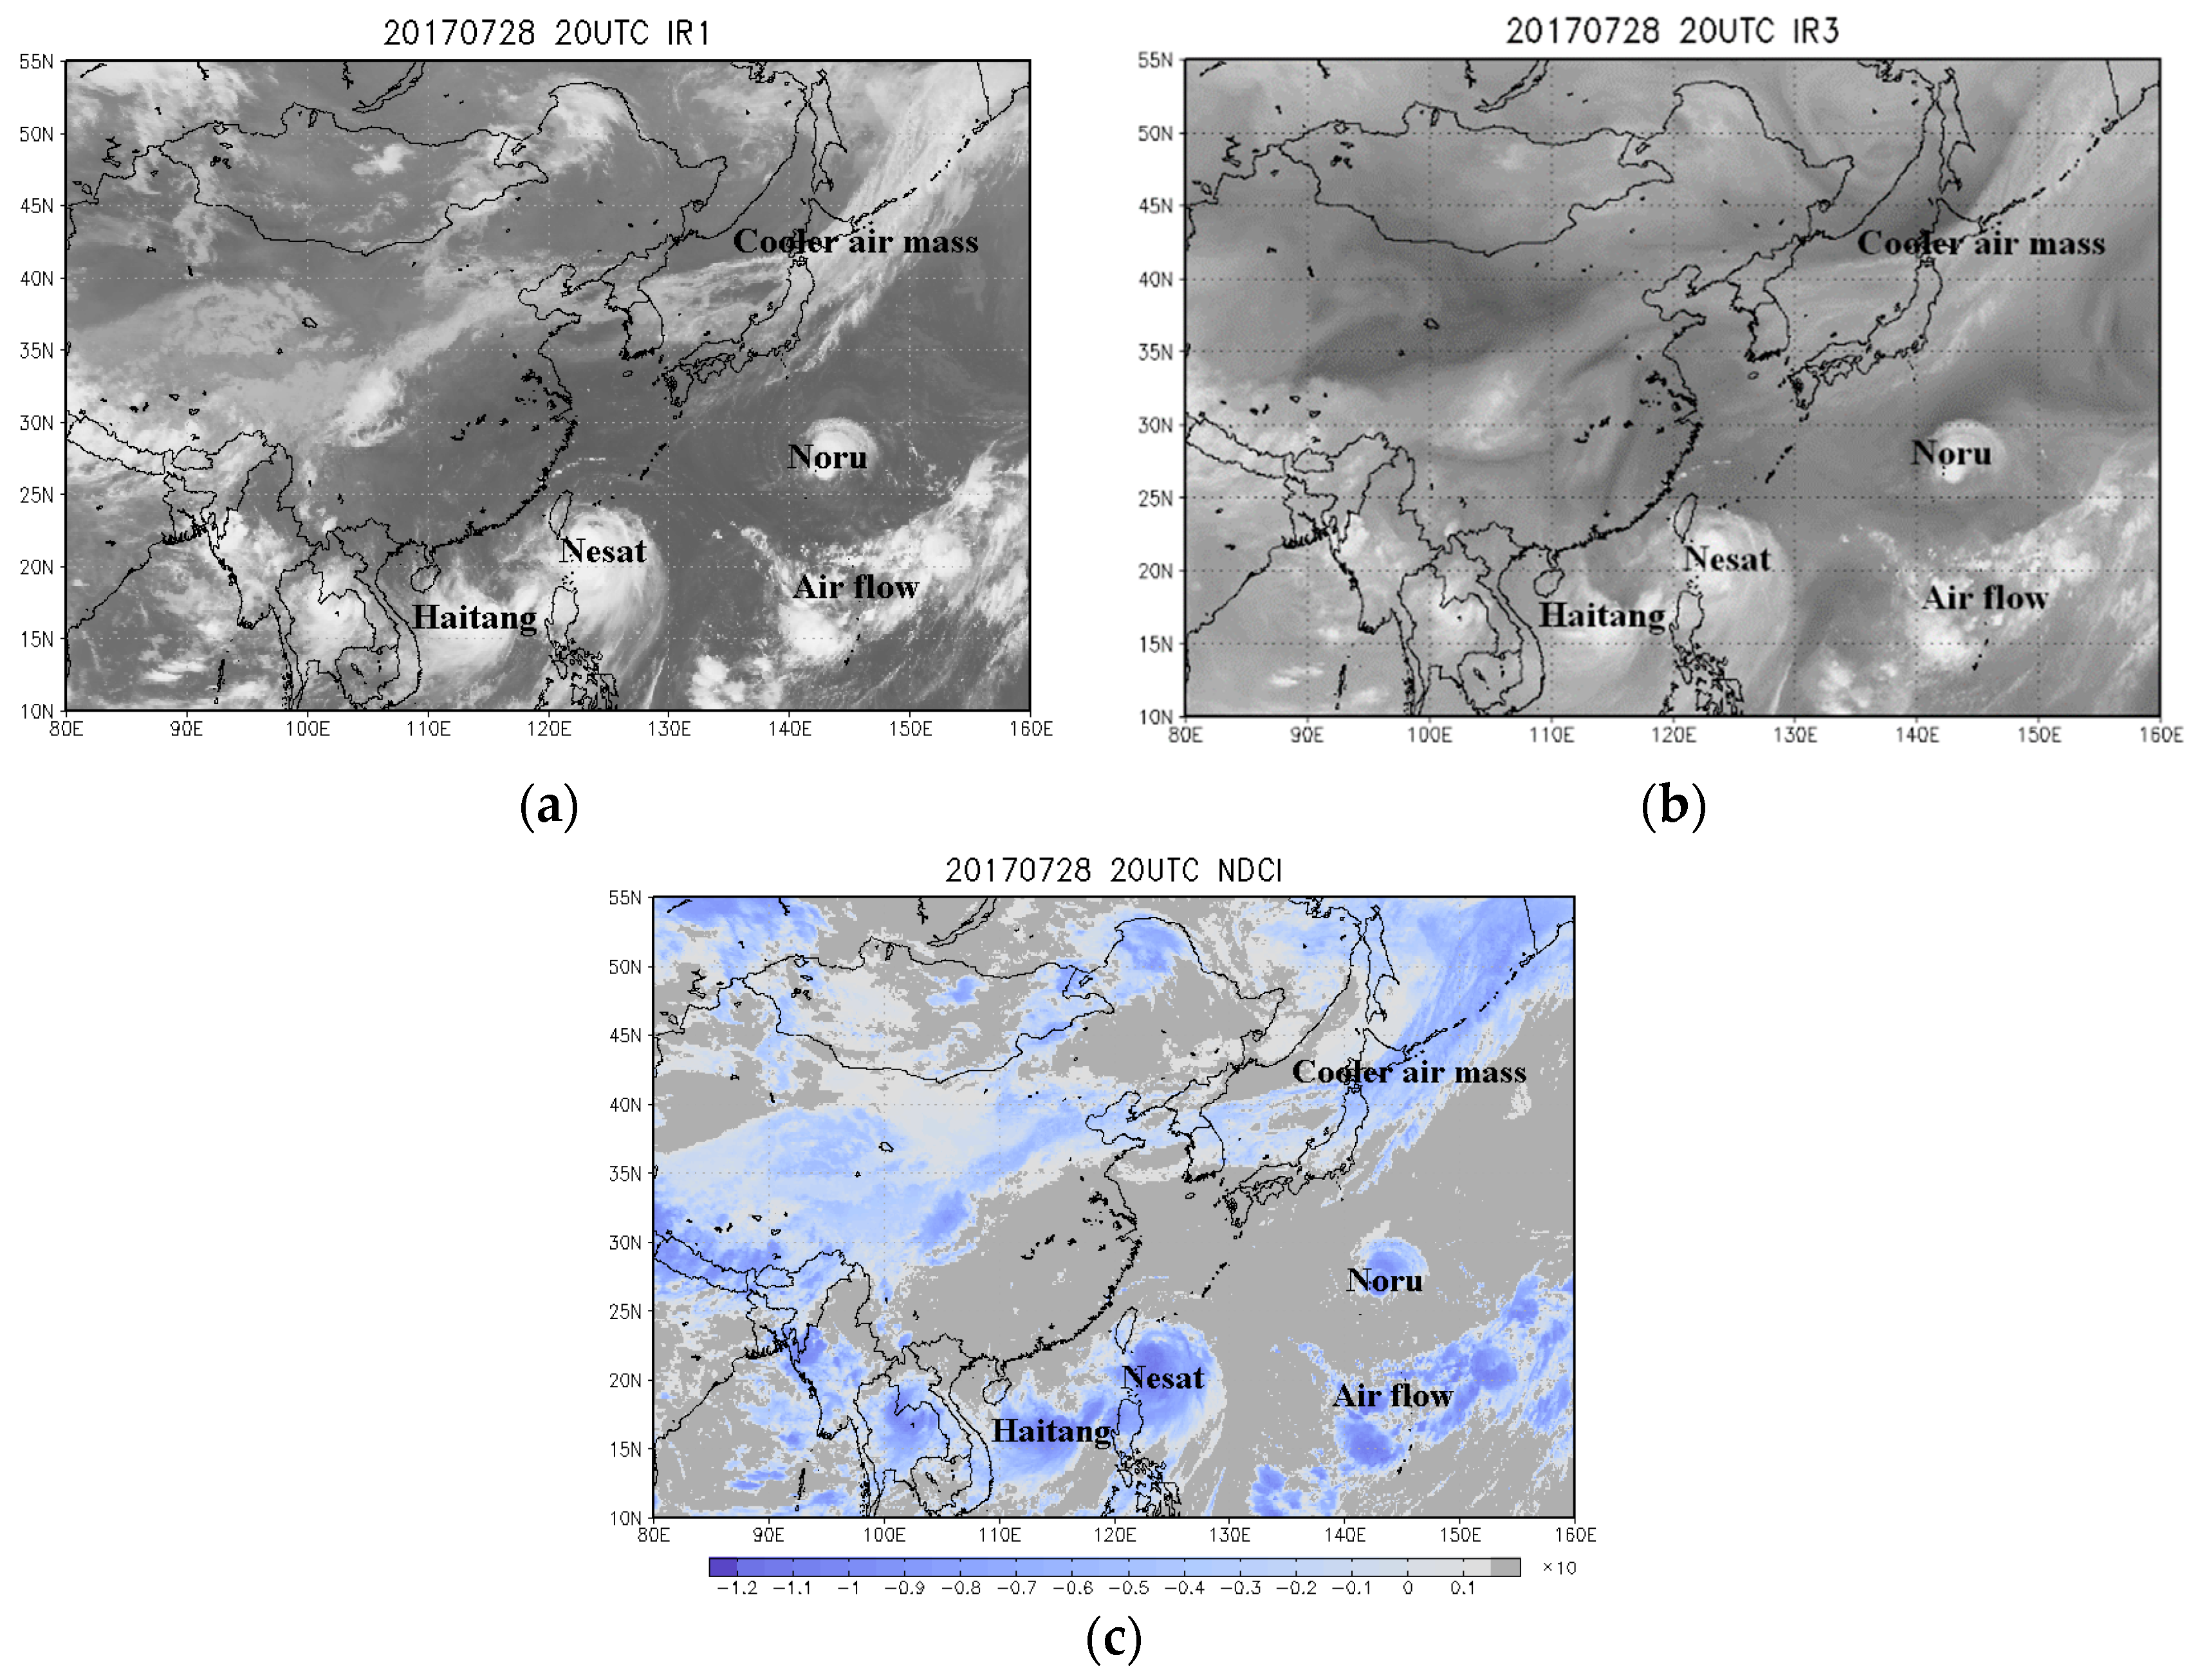
Figure 4, the air flow pattern in the south east quadrant provides a third example which shows the contrast between the relative lack of clarity in the IR3 image compared with the much improved visibility in the NDCI image.
4.2. First Dual-Vortex Interaction
Tropical Storm Noru formed on 21 July 2017, tracking west to northwest on 22 July. Noru intensified significantly over two days until being upgraded to a severe tropical storm on 23 July. Subsequently, Noru slowed down and remained stationary, owing to a dominant steering environment of high pressure ridges on both sides. The steering flows derived from cooler air masses to the west and predominant air flows to the south of the system. Noru rapidly intensified into a typhoon and started to track east-southeastward under the steering influence to the south. Meanwhile, Tropical Storm Kulap moved westward, as shown in
Figure 1.
On 24 July, typhoons Noru and Nesat lay some 3100–3200 km apart, while TS Kulap was located to the east of Noru near 33°N 162°E (outside the frame shown). Typhoon Noru and TS Kulap approached one another from opposite directions. A straight-line colder cloud top was observed flowing towards Typhoon Noru in a clear V-shaped pattern. This is the outward jet flow from cooler air masses to the north, as seen in
Figure 2. Typhoon Noru was probably influenced by adjacent environmental cooler air masses and jet flows, and it made a U-turn in its track. Noru’s directional change facilitated its continuing interaction with these adjacent cooler air masses. The first observed Fujiwhara-type dual-vortex interaction then commenced on 24 July between Noru and Kulap. The interaction caused Kulap to migrate to the north of Noru early on 25 July. Thereafter, Kulap completely merged with Noru. The beginning of the merger of TS Kulap with Typhoon Noru at 02:30 on 25 July is shown in
Figure 3.
Air flow to the south became the primary steering influence on Noru, turning the system northeastward and then northward on 26 July. The typhoon then began to track westward along the southern periphery of air flow to the northeast on 27 July. The complex combination of cooler air masses and air flows that surrounded Noru are seen in
Figure 4.
4.3. Second Dual-Vortex Interaction
Air flow and jet flow occupying the region (23°N, 133–137°E) between typhoons Noru and Nesat affected both typhoons over 28–29 July. Though Noru and Nesat were separated by a considerable distance of 2000–2500 km, the effects of mid-level air flows and upper jet flows in between the two typhoons can be discerned. The intervening middle air flows and jet flows (900–1100 km) likely had some influence on the intensity and movement of both typhoons. The outward jet flow was the turbulent air flow that occurs between typhoons Noru and Nesat. This is therefore considered to be a special case of an ‘indirect’ dual-vortex interaction. Evidence suggests that that typhoons Noru and Nesat each intensified to become stronger typhoons, and both experienced changes in their track directions as a result of their mutual interaction (refer to
Figure 1). The track behavior incorporating effects of the intervening air flows and jet flows is shown in
Figure 5 and
Figure 6.
4.4. Third Dual-Vortex Interaction
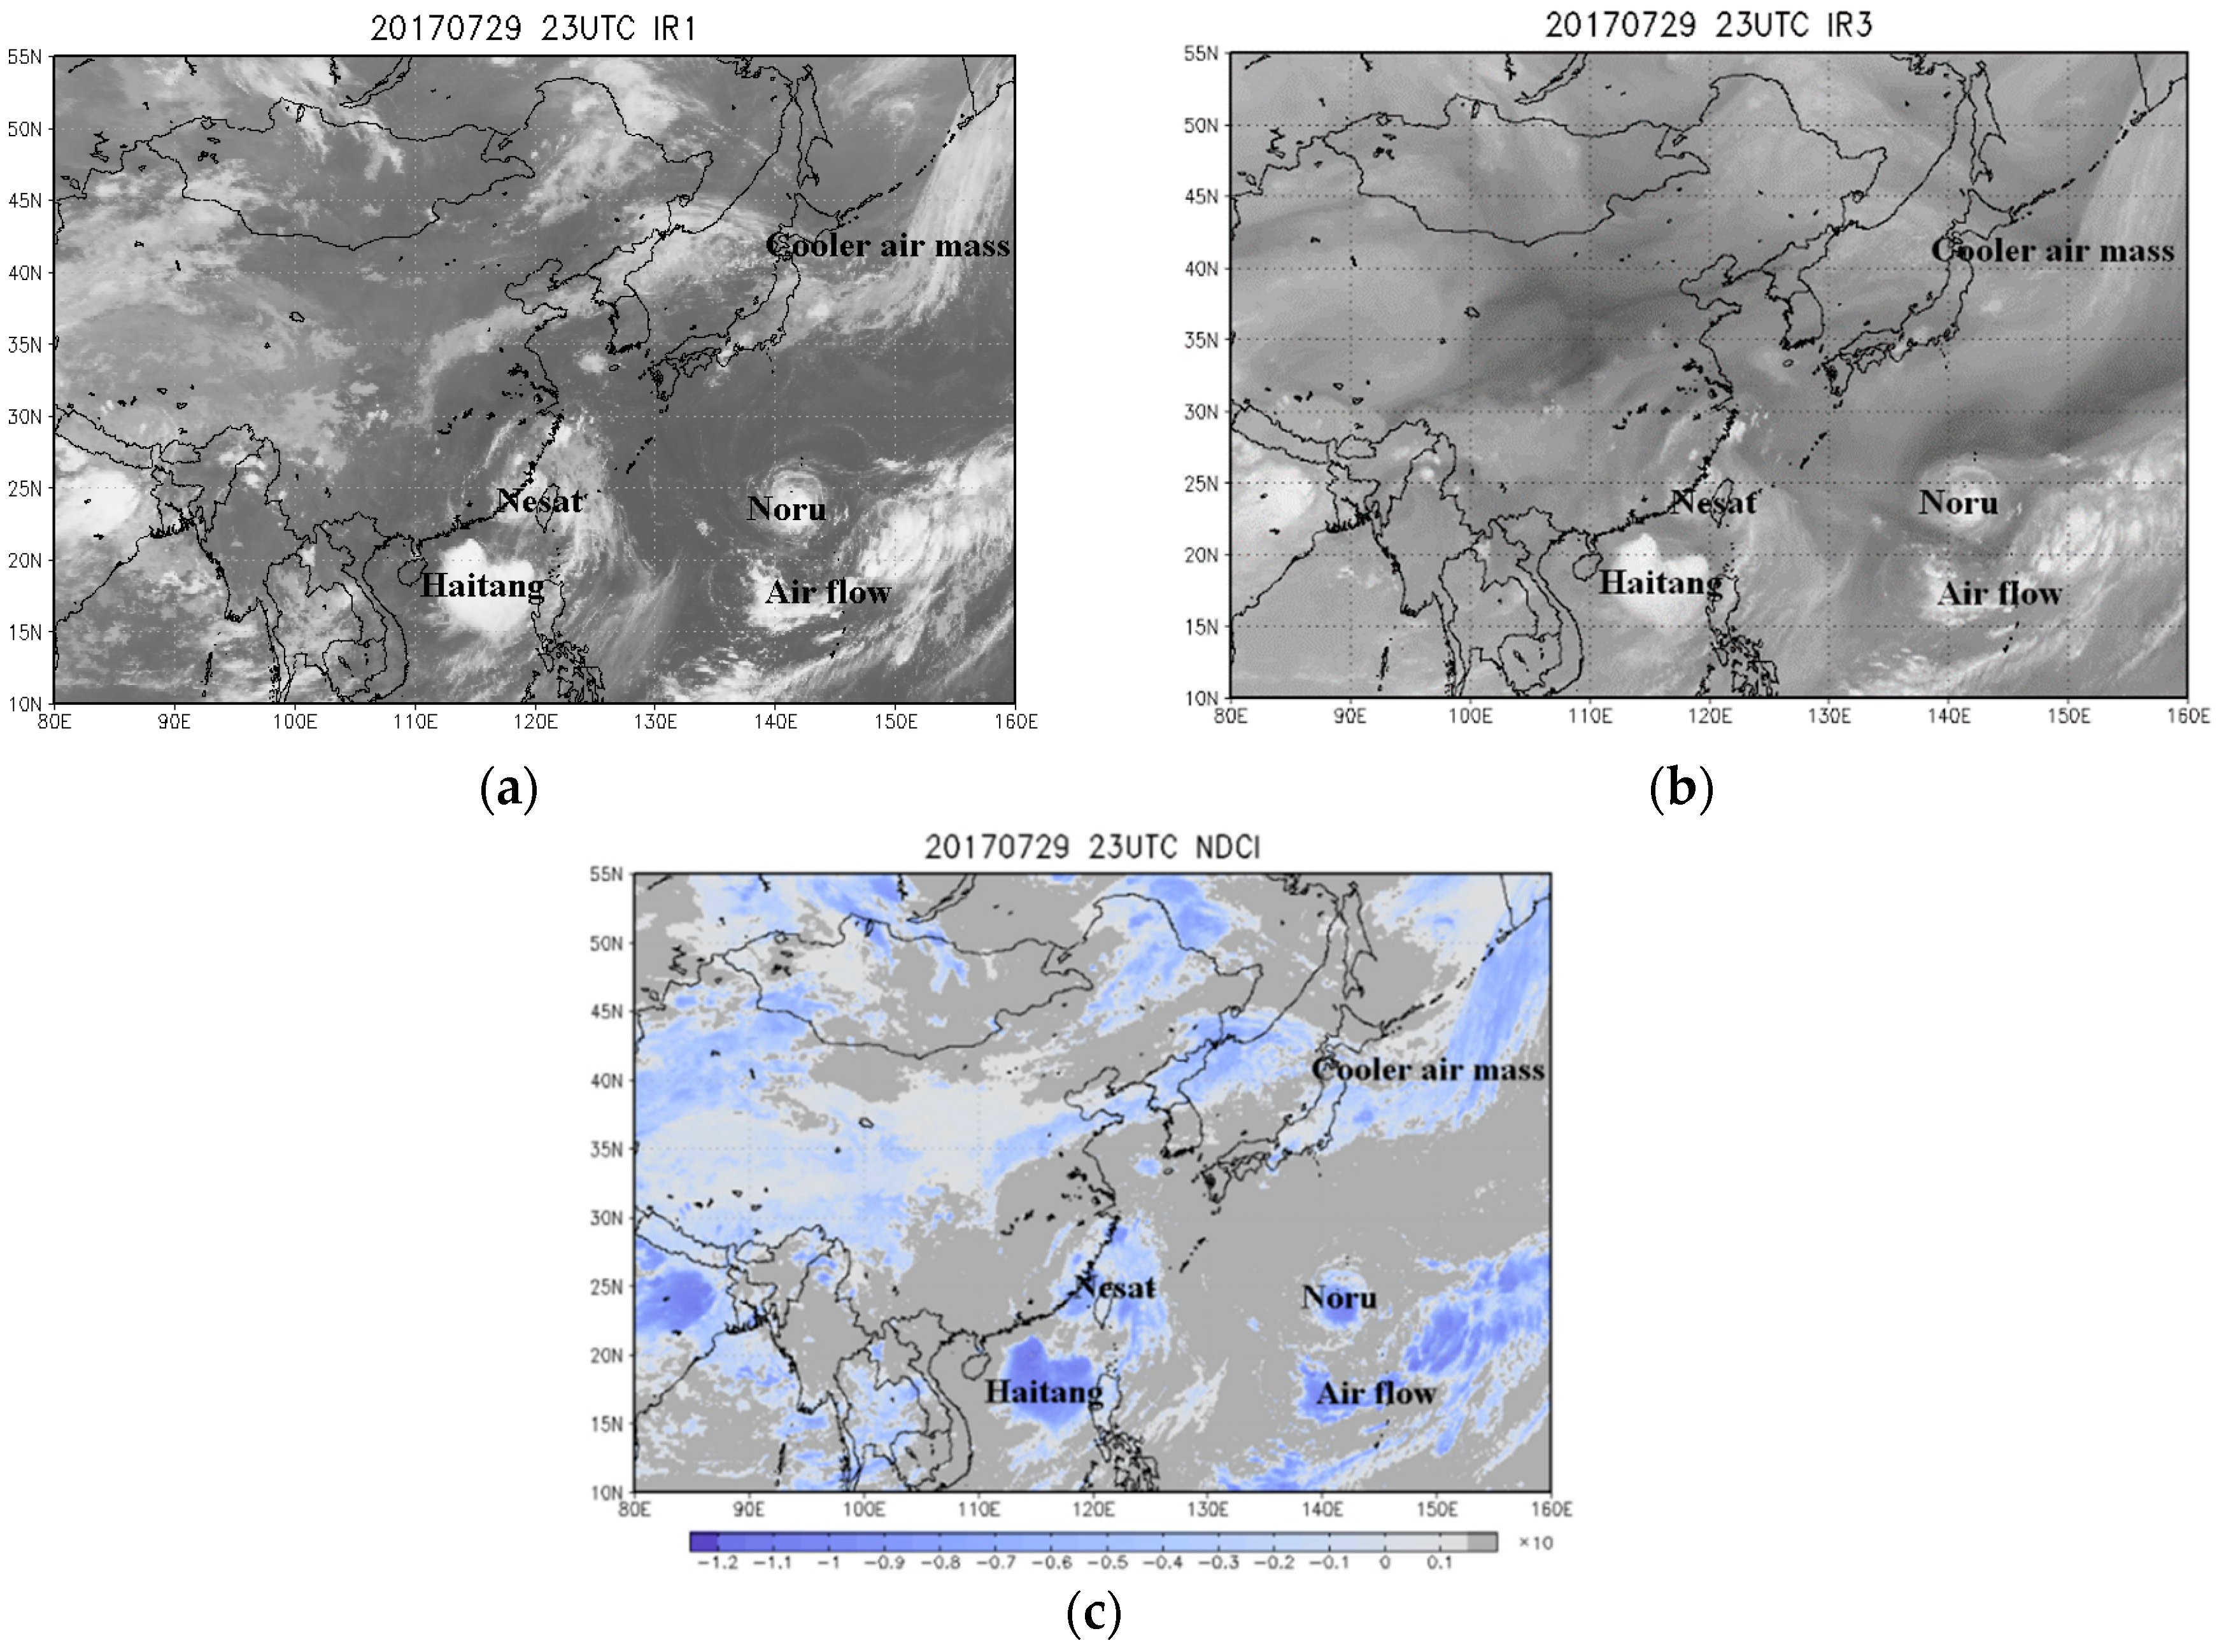
In
Figure 5, a new cyclonic system, named Tropical Storm Haitang, formed on 27 July. The subsequent interaction between Typhoon Nesat and TS Haitang produced the third consecutive dual-vortex interaction during the period of interest, in
Figure 6, specifically the twin circulation of the two typhoons around a common center, shown for 22:50 on 29 July. TS Haitang then crossed south-western Taiwan and made landfall in Fujian Province of mainland China. Simultaneously, Typhoon Noru took on annular characteristics with a symmetrical ring of deep convection surrounding a well-defined 30 km diameter eye, as shown for 09:00 on 31 July in
Figure 7. After 2 August, Noru travelled northwards to Japan and made landfall on Kyushu Island. Long-lived Noru hit Japan with heavy rain.
5. Analysis and Discussion
Details of the triple consecutive dual-vortex interaction described above are next tabulated for further analysis.
Table 2 shows the results calculated for interactions between Typhoon Noru and TS Kulap over three consecutive three-day intervals (20–23 July, 23–25 July and 25–27 July). Tabulated values for CI (current intensity) and d (measured distance) were calculated using Equation (4). It was found that a dual-vortex interaction was demonstrated during the interval of 25–27 July 2017. During this period, the measured distances (1100–1000 km) between the two systems remained marginally shorter than the calculated threshold distance d
th required for an interaction (1133 km). It might be argued that the 25–27 July interactions between Typhoon Noru and TS Kulap cannot be quantitatively confirmed because the threshold distance (1133 km) was only 3% greater than the measured distance, which may have been similar in scale to errors inherent in measurement. Yet, even if it is the case, the threshold distance calculated from the Liou–Liu formula may still be used qualitatively to indicate to possibility of a cyclone interaction.
It was next possible to determine the threshold distances for interaction between typhoons Noru and Nesat over the three intervals: 27–28 July, 28–29 July and 29–31 July. This was accomplished using Equation (5) by substituting
F1 = F2 = 1 for approximation and CI = 1 for the middle jet flows (an unclassified TD at 22°N 136°E). For
F1 = F2 = 1, the variations of size factors (size(TD or TS)–size(TC
1,2)) and related height-difference (
h(TC
1,2) >> (
h(TD) or
h(TS))) and rotation factors (
= +1 counter-clockwise rotation) were considered [
20]. Otherwise, applying the wavenumber-one perturbation technique [
38] and the vertical maximum values of radar reflectivity with geopotential height [
39] were used to obtain the values of
F1 and
F2. The results are listed in
Table 3. The measured distances (2500–2000 km) between two typhoons for the first interval were slightly greater than the calculated threshold distances (2217–2226 km). This means that only a weak interaction was possible between typhoons Noru and Nesat. During the second and third intervals, however, an indirect dual-vortex interaction was indicated, because the measured distances (2000–1600 and 1600–1700 km) between the two typhoons were shorter than the calculated threshold distances (2226–2258 and 2258–2287 km). Thus, the second in the sequence of dual-vortex interactions was clearly demonstrated.
Table 4 shows the interactions between Typhoon Nesat and TS Haitang over three consecutive intervals (26–28 July, 28–29 July and 29–31 July). Tabulated CI and d values were again calculated using Equation (4). It was seen that the second and third intervals demonstrated clear dual-vortex interactions, when the measured distances (1000–1200 and 700–900 km) between the two typhoons were shorter than the calculated threshold distances (1155–1198 and 1198–1155 km).
As a result of the triple consecutive sets of dual-vortex interactions described, Typhoon Noru survived to become a long-lasting system and travelled approximately 6900 km over 22 days from 19 July to 9 August. Typhoon Noru consequently attained the third longest longevity on record for tropical cyclones in the NWP Ocean, ranked only behind typhoons Rita and Wayne in 1972 and 1986, respectively, as indicated in
Table 5.
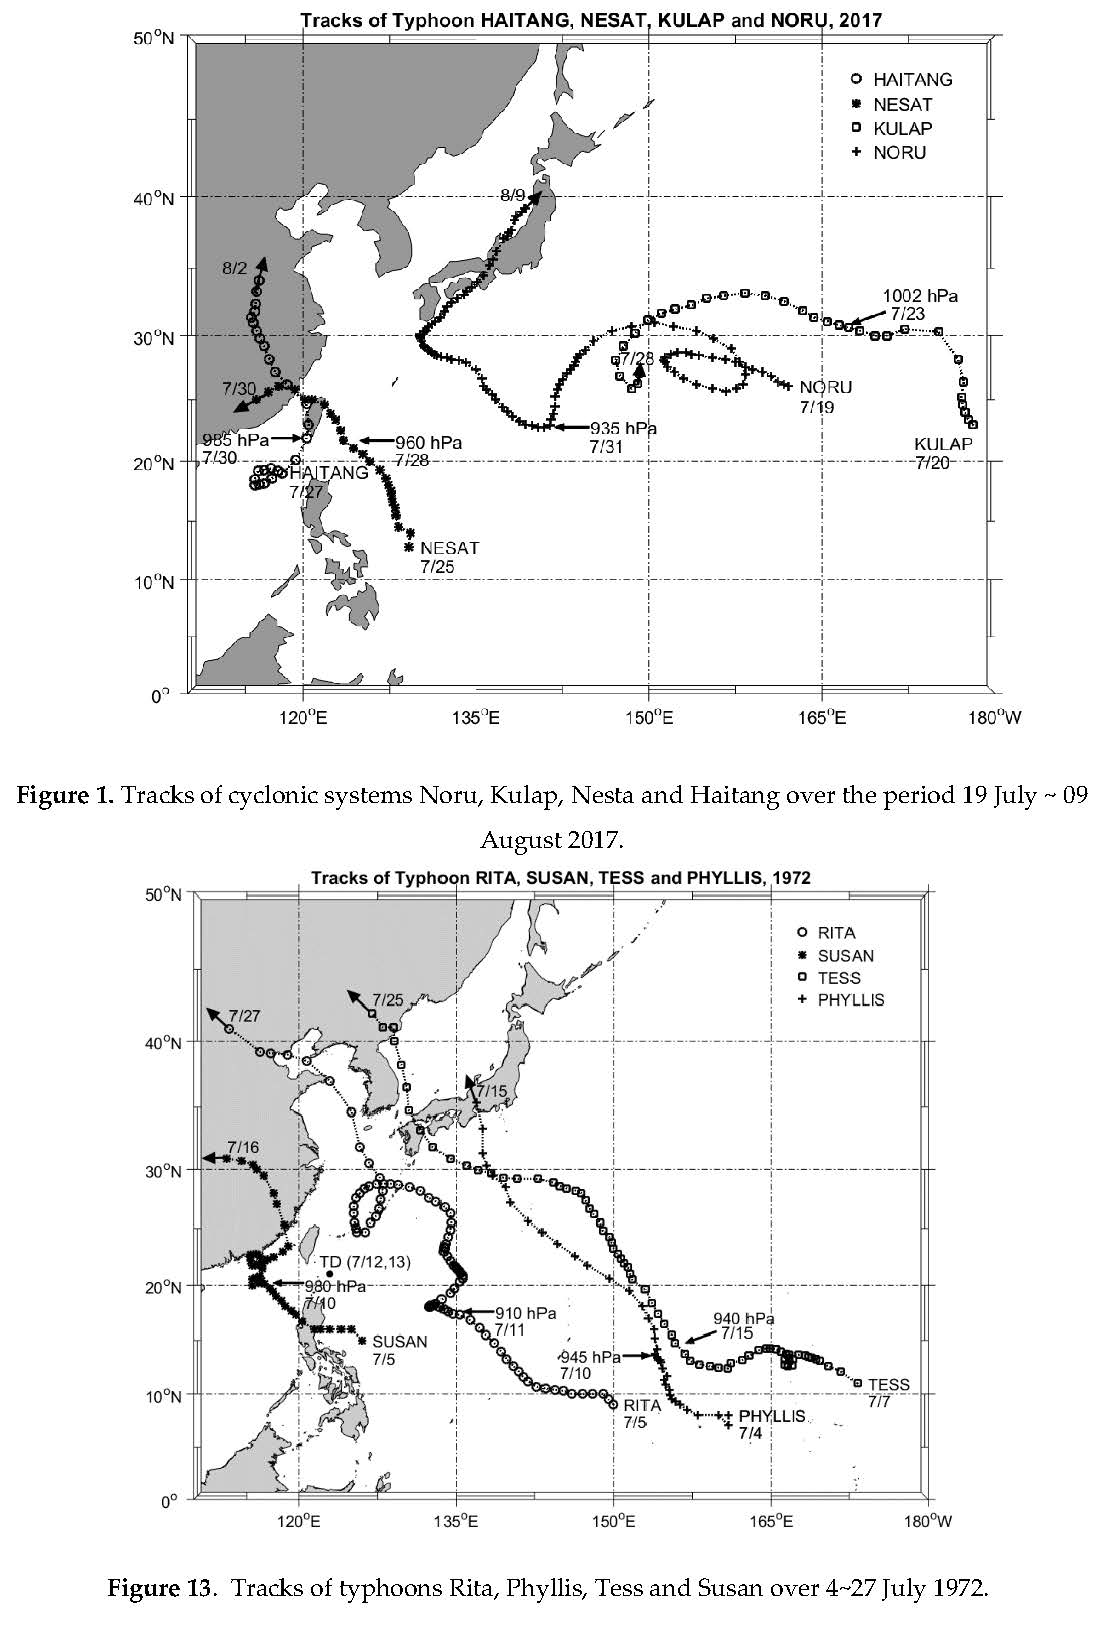
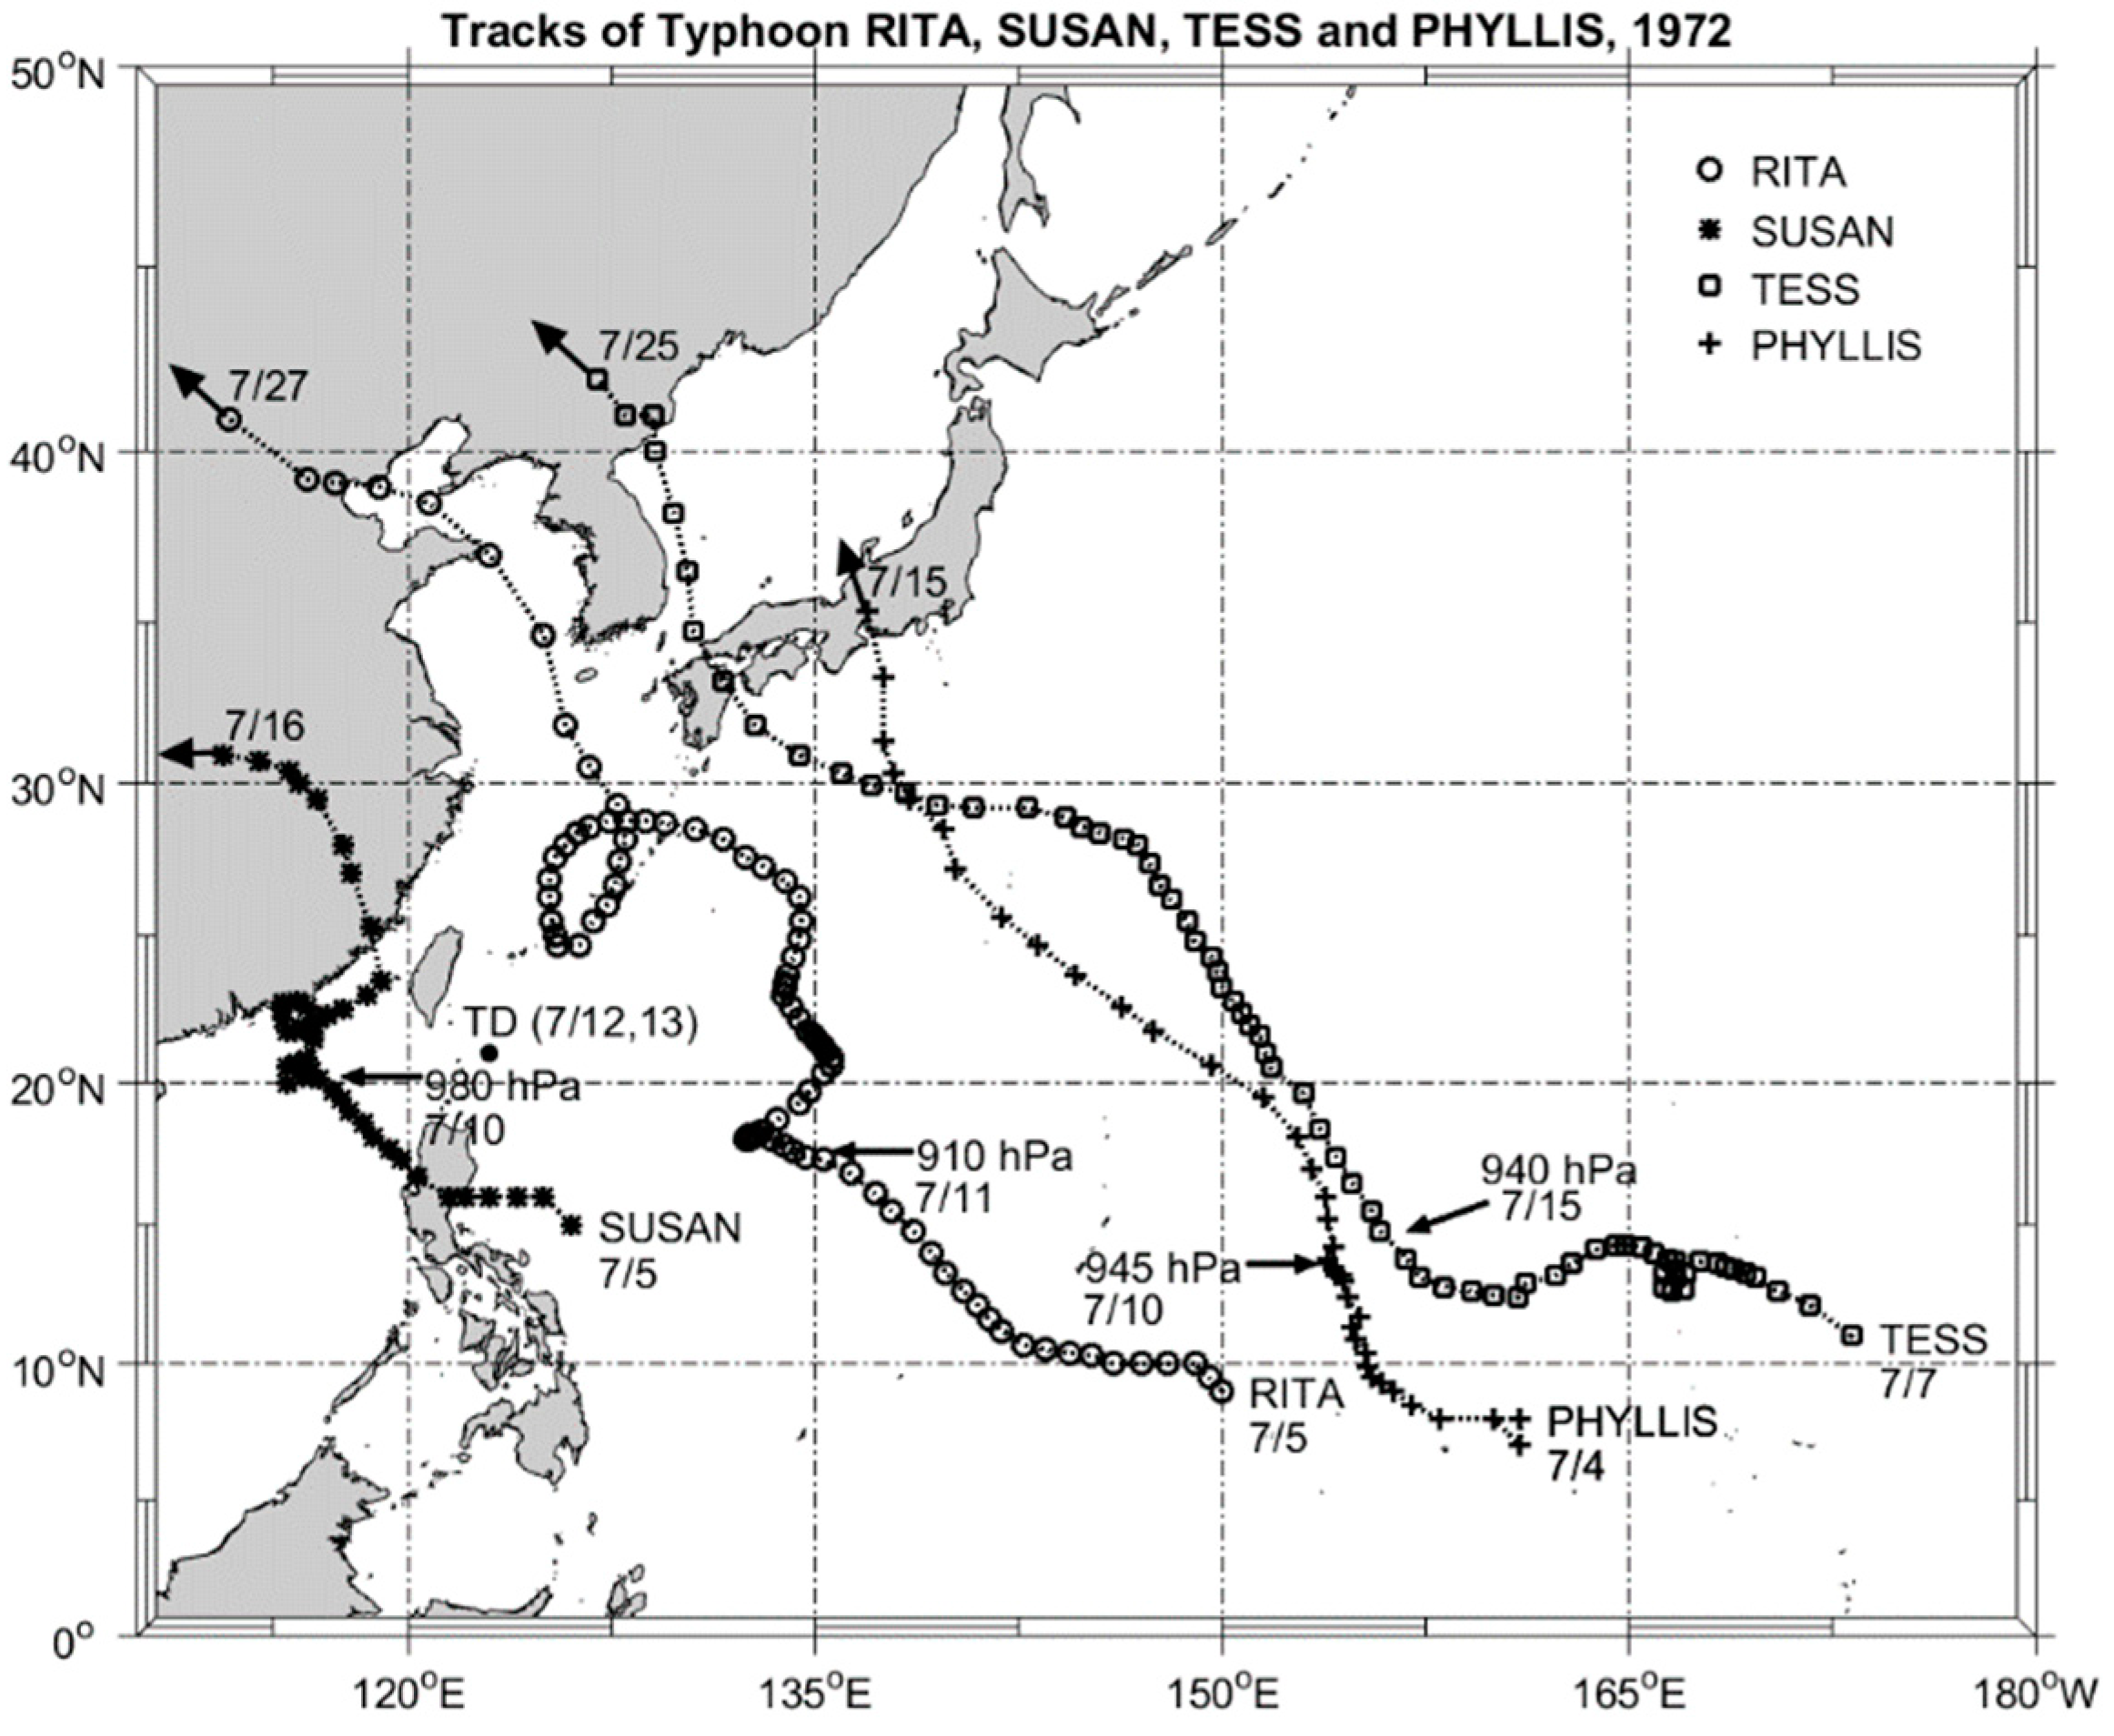
Typhoons Rita, Phyllis, Tess and Susan during the typhoon season of 1972 belonged to a remarkable quadruple-typhoon interaction event, as seen from the track map in
Figure 8.
Table 6 gives details on three consecutive dual-vortex interactions between typhoons Phyllis and Tess (10 July), typhoons Rita and Susan (12 July), and typhoons Rita and Tess (23 July), as characterized using Equations (4) and (5).
The first dual-vortex interaction occurred between typhoons Phyllis and Tess on 10 July 1972. The interaction was possible because the measured distance separating the typhoons (1000 km) was shorter than the calculated required threshold distance (1240 km). The interaction caused Typhoon Tess to change direction.
Typhoons Rita and Susan were separated by a measured distance of 1400 km on 12 July 1972. According to Equation (4) (
Table 6), this exceeded the calculated threshold distance for an interaction of 1250 km. However, the presence of an intervening tropical depression (TD) (i.e., a low pressure area) between the typhoons was influential, because it facilitated an indirect dual-vortex interaction between Rita and Susan in spite of their large separation. Approximating using the tuning factors
F1 = F2 = 1 and a value of CI = 0.1 for the low pressure disturbance (unclassified TD at 27°N 125°E), Equations (4) and (5) are thus able to predict the interaction between Rita and Susan. The measured distances between Typhoon Rita and the TD (900 km) as well as Susan and the TD (400 km) were shorter than the calculated threshold distance (2480 km). This second interaction resulted in Typhoon Susan executing a small loop in its track.
The third interaction occurred between typhoons Rita and Tess on 23 July 1972. The measured distance (750 km) between them was much shorter than the calculated threshold distance (1220 km) according to Equation (4). In consequence, the resulting strong Fujiwhara-type rotation caused Rita to execute a large loop in its track. Thus, a consecutive triple sequence of dual-vortex interactions can be demonstrated between the four typhoons Rita, Phyllis, Tess and Susan, and their intervening areas of tropical depressions.
From the above discussion, the following points emerge and should be highlighted:
Special cases of quadruple typhoons, simultaneously forming in the same region or in quick succession, can give rise to a triple sequence (‘trilogy’) of dual-vortex interactions.
Middle air flows or intervening low pressure areas (tropical depressions) are important environmental influences that should not be ignored in assessment of cyclone interaction behavior.
The Liou–Liu formulas (based on current intensity values) can be applied to verify and quantify dual-vortex interactions by comparing measured distances between typhoons with calculated threshold distances required for interaction.
Dual-vortex interactions are frequently associated with an increase in typhoon track sinuosity through changes in track direction and/or the execution of complex/looping tracks.
The longevity (survival time) of an individual typhoon may be significantly enhanced through a sequence of multiple dual-vortex interactions during its lifespan.
6. Conclusions
The integration of remote sensing imagery, a differential averaging technique, and the Liou–Liu formulas was used to identify a ‘trilogy’ of consecutive dual-vortex interactions between typhoons Noru, Kulap, Nesat, Haitang and environmental air flows in the Northwest Pacific basin during the 2017 typhoon season. Analyzing the satellite imagery of the interaction between typhoons benefits from the application of a differential averaging technique. The NDCI operator and filter applied to geosynchronous satellite IR1 infrared images and IR3 water vapor images were able to depict the differences and generate a processed set of NDCI images with suitable clarity for investigation.
Three distinct dual-vortex interactions among four cyclone systems (and neighboring cooler environmental air masses, air flows and jet flows) occurred in a consecutive sequence. The interactions were validated using the Liou–Liu empirical formulas, which are used for calculating threshold distances for interactions as related to current intensity (CI) values.
The first dual-vortex interaction caused Typhoon Noru to experience Fujiwhara rotation and to merge with the approaching TS Kulap. In the second interaction, typhoons Noru and Nesat were possibly strengthened through the influence of intervening air flows and jet flows, even though a considerable distance separated the typhoons. It has been suggested that this is a special type of ‘indirect’ cyclone–depression–cyclone interaction, which can nonetheless be influential in mutual typhoon intensification. The third interaction between Haitang and Nesat again resulted in Fujiwhara rotation and changes in typhoon track directions.
Examining the main characteristics of Typhoon Noru in particular, the time series of pressure (intensity) and saturation area shows that a relationship through time exists with distance from other interacting typhoons. Long-lived Typhoon Noru survived from 19 July to 9 August and followed a complex track, with a loop and several U-turns resulting from the sequence of interactions described. On 31 July, Noru became a super-typhoon attaining an intensity of 930 hPa before striking Japan with torrential rain.
Additionally illuminating is the comparison with Typhoon Rita in 1972, which similarly experienced complex multiple interactions with typhoons Phyllis, Tess and Susan. Coincidentally, the 1972 Rita and the 2017 Noru events both involved a sequential trilogy of interactions among four individual typhoon systems, with the interactions leading to significantly enhanced typhoon longevity. It is recommended that further quantitative observations using satellite cloud images of interactions between multiple synchronous/sequential typhoons be undertaken, as this should eventually lead to improved track forecasting and weather prediction in these particularly unusual synoptic circumstances.

 ,
, 


