Article

Influence of Soil Background on Spectral Reflectance of Winter Wheat Crop Canopy

by
Elena Prudnikova
1,2,*,
Igor Savin
1,2,
Gretelerika Vindeker
1,3,
Praskovia Grubina
1,
Ekaterina Shishkonakova
1 and
David Sharychev
1,2
1
V. V. Dokuchaev Soil Science Institute, Moscow 119017, Russia
2
Agroengineering Department, Agrarian and Technological Institute, Peoples’ Friendship University of Russia (RUDN University), Moscow 117198, Russia
3
Faculty of Soil Science, Moscow State University, Moscow 119991, Russia
*
Author to whom correspondence should be addressed.
Remote Sens. 2019, 11(16), 1932; https://0-doi-org.brum.beds.ac.uk/10.3390/rs11161932
Submission received: 24 June 2019 / Revised: 15 August 2019 / Accepted: 16 August 2019 / Published: 19 August 2019
(This article belongs to the Section Remote Sensing in Agriculture and Vegetation)

Abstract

:
The spectral reflectance of crop canopy is a spectral mixture, which includes soil background as one of the components. However, as soil is characterized by substantial spatial variability and temporal dynamics, its contribution to the spectral reflectance of crops will also vary. The aim of the research was to determine the impact of soil background on spectral reflectance of crop canopy in visible and near-infrared parts of the spectrum at different stages of crop development and how the soil type factor and the dynamics of soil surface affect vegetation indices calculated for crop assessment. The study was conducted on three test plots with winter wheat located in the Tula region of Russia and occupied by three contrasting types of soil. During field trips, information was collected on the spectral reflectance of winter wheat crop canopy, winter wheat leaves, weeds and open soil surface for three phenological phases (tillering, shooting stage, milky ripeness). The assessment of the soil contribution to the spectral reflectance of winter wheat crop canopy was based on a linear spectral mixture model constructed from field data. This showed that the soil background effect is most pronounced in the regions of 350–500 nm and 620–690 nm. In the shooting stage, the contribution of the soil prevails in the 620–690 nm range of the spectrum and the phase of milky ripeness in the region of 350–500 nm. The minimum contribution at all stages of winter wheat development was observed at wavelengths longer than 750 nm. The degree of soil influence varies with soil type. Analysis of variance showed that normalized difference vegetation index (NDVI) was least affected by soil type factor, the influence of which was about 30%–50%, depending on the stage of winter wheat development. The influence of soil type on soil-adjusted vegetation index (SAVI) and enhanced vegetation index (EVI2) was approximately equal and varied from 60% (shooting phase) to 80% (tillering phase). According to the discriminant analysis, the ability of vegetation indices calculated for winter wheat crop canopy to distinguish between winter wheat crops growing on different soil types changed from the classification accuracy of 94.1% (EVI2) in the tillering stage to 75% (EVI2 and SAVI) in the shooting stage to 82.6% in the milky ripeness stage (EVI2, SAVI, NDVI). The range of the sensitivity of the vegetation indices to the soil background depended on soil type. The indices showed the greatest sensitivity on gray forest soil when the wheat was in the phase of milky ripeness, and on leached chernozem when the wheat was in the tillering phase. The observed patterns can be used to develop vegetation indices, invariant to second-type soil variations caused by soil type factor, which can be applied for the remote assessment of the state of winter wheat crops.

Graphical Abstract

1. Introduction

Remote sensing data are actively used to assess and monitor the state of crops [1,2,3,4,5]. Modern systems for monitoring agricultural lands use satellite data to predict crop yields at various levels (global, national) [6,7,8]. Such information affects the pricing policy of agricultural producers and the situation on the global agricultural market. It is also used to make management decisions in the framework of ensuring the food security of the population at the national level, which is of particular relevance due to the increased frequency of extreme natural phenomena (in particular, droughts) in the main areas of agricultural production caused by global climate change [9].
There are two main groups of approaches which can be used for crop assessment and monitoring on the basis of remote sensing data: statistical and physical approaches [10,11,12]. Statistical approaches are based on the empirical relationships between crop characteristics and vegetation indices [13,14]. Physical approaches are based on canopy radiative transfer models (RTM) such as PROSAIL [12,15,16,17].
In most cases, the assessment of the state of crops and the content of nitrogen and chlorophyll in them from remote sensing data is based on their spectral reflectance in the visible and near-infrared spectral regions which is a spectral mixture composed of the reflectance of all components forming crop canopy, including soil background [18,19,20,21,22,23,24,25,26].
However, soil is a background with dynamic spectral characteristics. In general, soil spectral reflectance depends on several soil properties: surface roughness, moisture content, organic matter content, texture, mineralogical composition, carbonate content, total iron, and water soluble salts [27,28,29,30].
These properties can be divided into two groups, considering their effect on soil spectral reflectance [31]. The first group comprises soil characteristics influencing the intensity of spectral reflectance (“brightness”), which corresponds to the position of spectral curve preserving its shape. Second group of the properties influences the spectral energy distribution in the visible range and therefore responsible for the change of the reflectance curve shape, and position of extremes. The variations of soil spectral reflectance attributed to the soil brightness are referred to as the changes of the first type or primary variations, while the variations attributed to the change of reflectance curve shape and extremes position are known as the changes of the second type or secondary variations [32,33].
Under the statistical approaches, most studies on the effect of soil on the results of the remote estimation of crops are devoted to soil brightness and focus on the red and near-infrared spectral regions [32,34,35,36].
To minimize the influence of soil brightness, a concept of a soil line (or line of soil brightness) was proposed [37,38]. According to this concept, pixels related to the open soil surface form one line in the spectral space of the red and near-infrared regions of the spectrum. Thus, the soil line can be used to avoid the effect of soil background on spectral reflectance of vegetation canopy based on distances or angles to the vegetation isolines. Many vegetation indices that correct the influence of the soil background work this way such as EVI, EVI2, SAVI, TSAVI [32,39,40,41].
However, this approach performs successfully only in the case of first-type changes; that is, when soil remains on the same soil line. With variations of the second type, soil changes the soil line, which most indices correcting the influence of soil do not take into account. To date, there are only a few studies that somehow address the issue of minimizing the impact of second-type changes of soil background on the vegetation indices [33].
Soil type has been widely used as an indicator of secondary variations of soil spectral reflectance [32,33,34,42]. Several studies have assessed the effect of soil type on the estimation of biophysical parameters with vegetation indices [14].
Under the physical approaches, the issue of influence of soil background is solved by the incorporation of soil reflectance into RTM, simulating the reflectance of crop canopy [43,44,45]. Soil brightness parameter is often used to account for soil brightness variations. Soil reflectance variability can also be reproduced by soil parametrization (SOILEMP), which mainly considers changes in soil brightness and changes in the shape of soil spectral curve due to the variations of inorganic carbon content [43,44].
While the application of RTM for retrieval of crop characteristics has some advantages over the application of vegetation indices, it requires the collection of additional data (leaf structure parameter, leaf chlorophyll content, etc.) [15,45,46]. Moreover, the determination of crop characteristics (for example, leaf area index (LAI) or chlorophyll content) with RTM requires additional complex computations (inversion of RTM) [43,47]. Due to these reasons, statistical approaches on the basis of vegetation indices are more widely used in crop monitoring.
As our knowledge of the soil type effect on the reflectance of crop canopy and on the vegetation indices is quiet limited and the search for optimal vegetation index is still ongoing it is very important to determine how the influence of the soil background changes along the visible and near-infrared spectral range depending on the stage of crop development.
The introduction of a temporal dimension into the studies requires the consideration of the soil surface dynamics. Soil surface properties was found to change under the impact of rainfall during the vegetative season (not only soil surface moisture or roughness, but also soil surface mineralogical composition, organic matter content, salts content and so on) [48,49,50,51,52]. Corresponding changes in soil surface spectral reflectance will create a site-specific soil line dynamics, introducing additional uncertainty in the assessment of the crop state from remote sensing data. The effect of this factor on vegetation indices has not yet been tested.
Therefore, our research is devoted to (1) studying the effect of soil background on the spectral reflectance of crop canopy in the visible and near infrared parts of the spectrum at different stages of crop development, and (2) the assessment of the effect of soil type factor and of the dynamics of the surface of arable soil on vegetation indices often used for crop monitoring.

2. Materials and Methods

2.1. Study Area

For our research we chose winter wheat, as it is one of the most important agricultural crops all over the world. Thus, the object of the study is the spectral reflectance of winter wheat crop canopy of variety Moskovskaya 39, prevailing in the region of the study. The influence of soil background was studied on three contrasting types of soil: gray forest soils (Albic Luvisols), alluvial soils (Eutric Fluvisols), leached chernozem (Luvic Chernozem) (soil names in brackets are given according to WRB soil classification [53]). They differ in soil properties affecting soil spectral reflectance. In that way we did not study the influence of certain soil properties, but the combinations of them linked to the soil name.
The test plots are located in the Yasnogorsk and Shchekino districts of the Tula region of Russia (Figure 1). The sowing of winter wheat in this region is carried out in the second half of September. The autumn growing season ends at the beginning of November with the establishment of steady snow cover. The beginning of spring vegetation falls from the end of March to the beginning of April. Harvesting occurs in late July to early August.
Weed density varies with crop development stage. The projective cover of weeds on the surface of the crop canopy is rather low at the beginning and middle of the growing season of winter wheat, but usually increases significantly when the yellowing of winter wheat plants begins. At the same time, the projective cover of weeds on a field with chernozem was minimal at the beginning and middle of the growing season and reached a maximum by the end of the growing season. Fields with gray forest and alluvial arable soils had similar weed density, but on alluvial soils, weed projective cover increased slightly by the end of the winter wheat growing season [54].
Gray forest soils and leached chernozems are developed on heavy loams. In the fields, there are areas of slightly and moderately eroded soil varieties, as well as deposited soils on concave parts of the slopes. The organic matter content in chernozems is about 4%–5%, decreasing to 3%–4% on the eroded varieties and increasing to 5%–6% on the deposited ones. The organic matter content in the arable horizon of gray forest soils is lower (from 3%–4% for non-eroded soils to 2%–3% for eroded varieties). Alluvial soils are developed on medium loamy alluvium. The organic matter content in their ploughed horizon varies from 1% to 4%.

2.2. Methods

2.2.1. Collection of Spectral and Field Data

In the period April–June 2018, several trips to test sites were made (Table 1). The dates for the trips where chosen in such a way to cover all main stages of winter wheat development: tillering, shooting, milky ripeness. Each test site was visited once in a month starting from second half of April. As test plots 1 and 2 are located very close, they were visited on the same day. Test plot 3 was visited several days prior or after plots 1 and 2.
Generally, we followed the approach used in the MOCCCASIN FP7 Project, described in [55].
During each trip, spectral data were collected using a HandHeld-2 spectroradiometer operating in the range of 325–1075 nm (https://www.malvernpanalytical.com/en/support/product-support/asd-range/fieldspec-range/handheld-2-hand-held-vnir-spectroradiometer). Reflectance measurements were made using radiance reflected from a sample and radiance incidence reflected from a 100% reflectance reference target (white reference panel). The white reference panel is positioned horizontally near the sample and is oriented to receive all of the available incident illumination while at the same time avoiding shadowing and light reflected from surrounding objects Since the reflected radiance from the panel is very close to the total energy falling on the sample, this reading can be used in the denominator of the reflectance measurement. Sample reflectance is calculated by the HandHeld 2 instrument software.
Spatial location of the points was chosen in such a way to cover various states of winter wheat crops within each plot. At each point, spectral data for the winter wheat crop canopy, open soil surface, winter wheat leaves and weeds were registered with five-fold repetition. To measure the spectral reflectance of winter wheat leaves, the green leaves of the plants were picked and laid in a thick layer. We used the reflectance of leaves because they form the upper layer of crop canopy directly available to remote sensors. To measure the spectral reflectance of weeds, they were torn off and placed in a dense layer. The spectroradiometer was held perpendicular to the surface of the measured object at the distance of 30 cm. The reflectance of the open undisturbed soil surface was measured between rows of winter wheat at a distance of 20 cm after removing all surrounding vegetation. To measure spectral reflectance of the crop canopy, the spectroradiometer was held perpendicular to the measured canopy at a height of 1.5 m.
Simultaneously with the measurement of spectral data at each point, crops were photographed in the nadir from a standard height of 1.5 m, which is commonly used in crop canopy studies [55,56], with a Canon camera. Five photos were made for each point.
Spectral curves were averaged and smoothed using the Savitsky–Golay filter in the R software (prospectr package) [57]. In addition, due to the high noise level, data up to 350 nm and after 900 nm were excluded from the analysis [48].
The obtained photographs were analyzed in the ILWIS 3.3 Academic program. Supervised classification was used to distinguish between open soil and vegetation. To determine the area occupied by weeds, vector masks of weeds were created. The projected area occupied by winter wheat was determined as a difference between the projected area occupied by the vegetation and the projected area occupied by the weeds. As a result, we determined the projected area for each object (soil, weeds, winter wheat) on the top of the canopy on each photo. As five photos were taken at each study point, we averaged the obtained values to determine the projected area for each object at each point.
The general strategy of the study is presented in Figure 2.

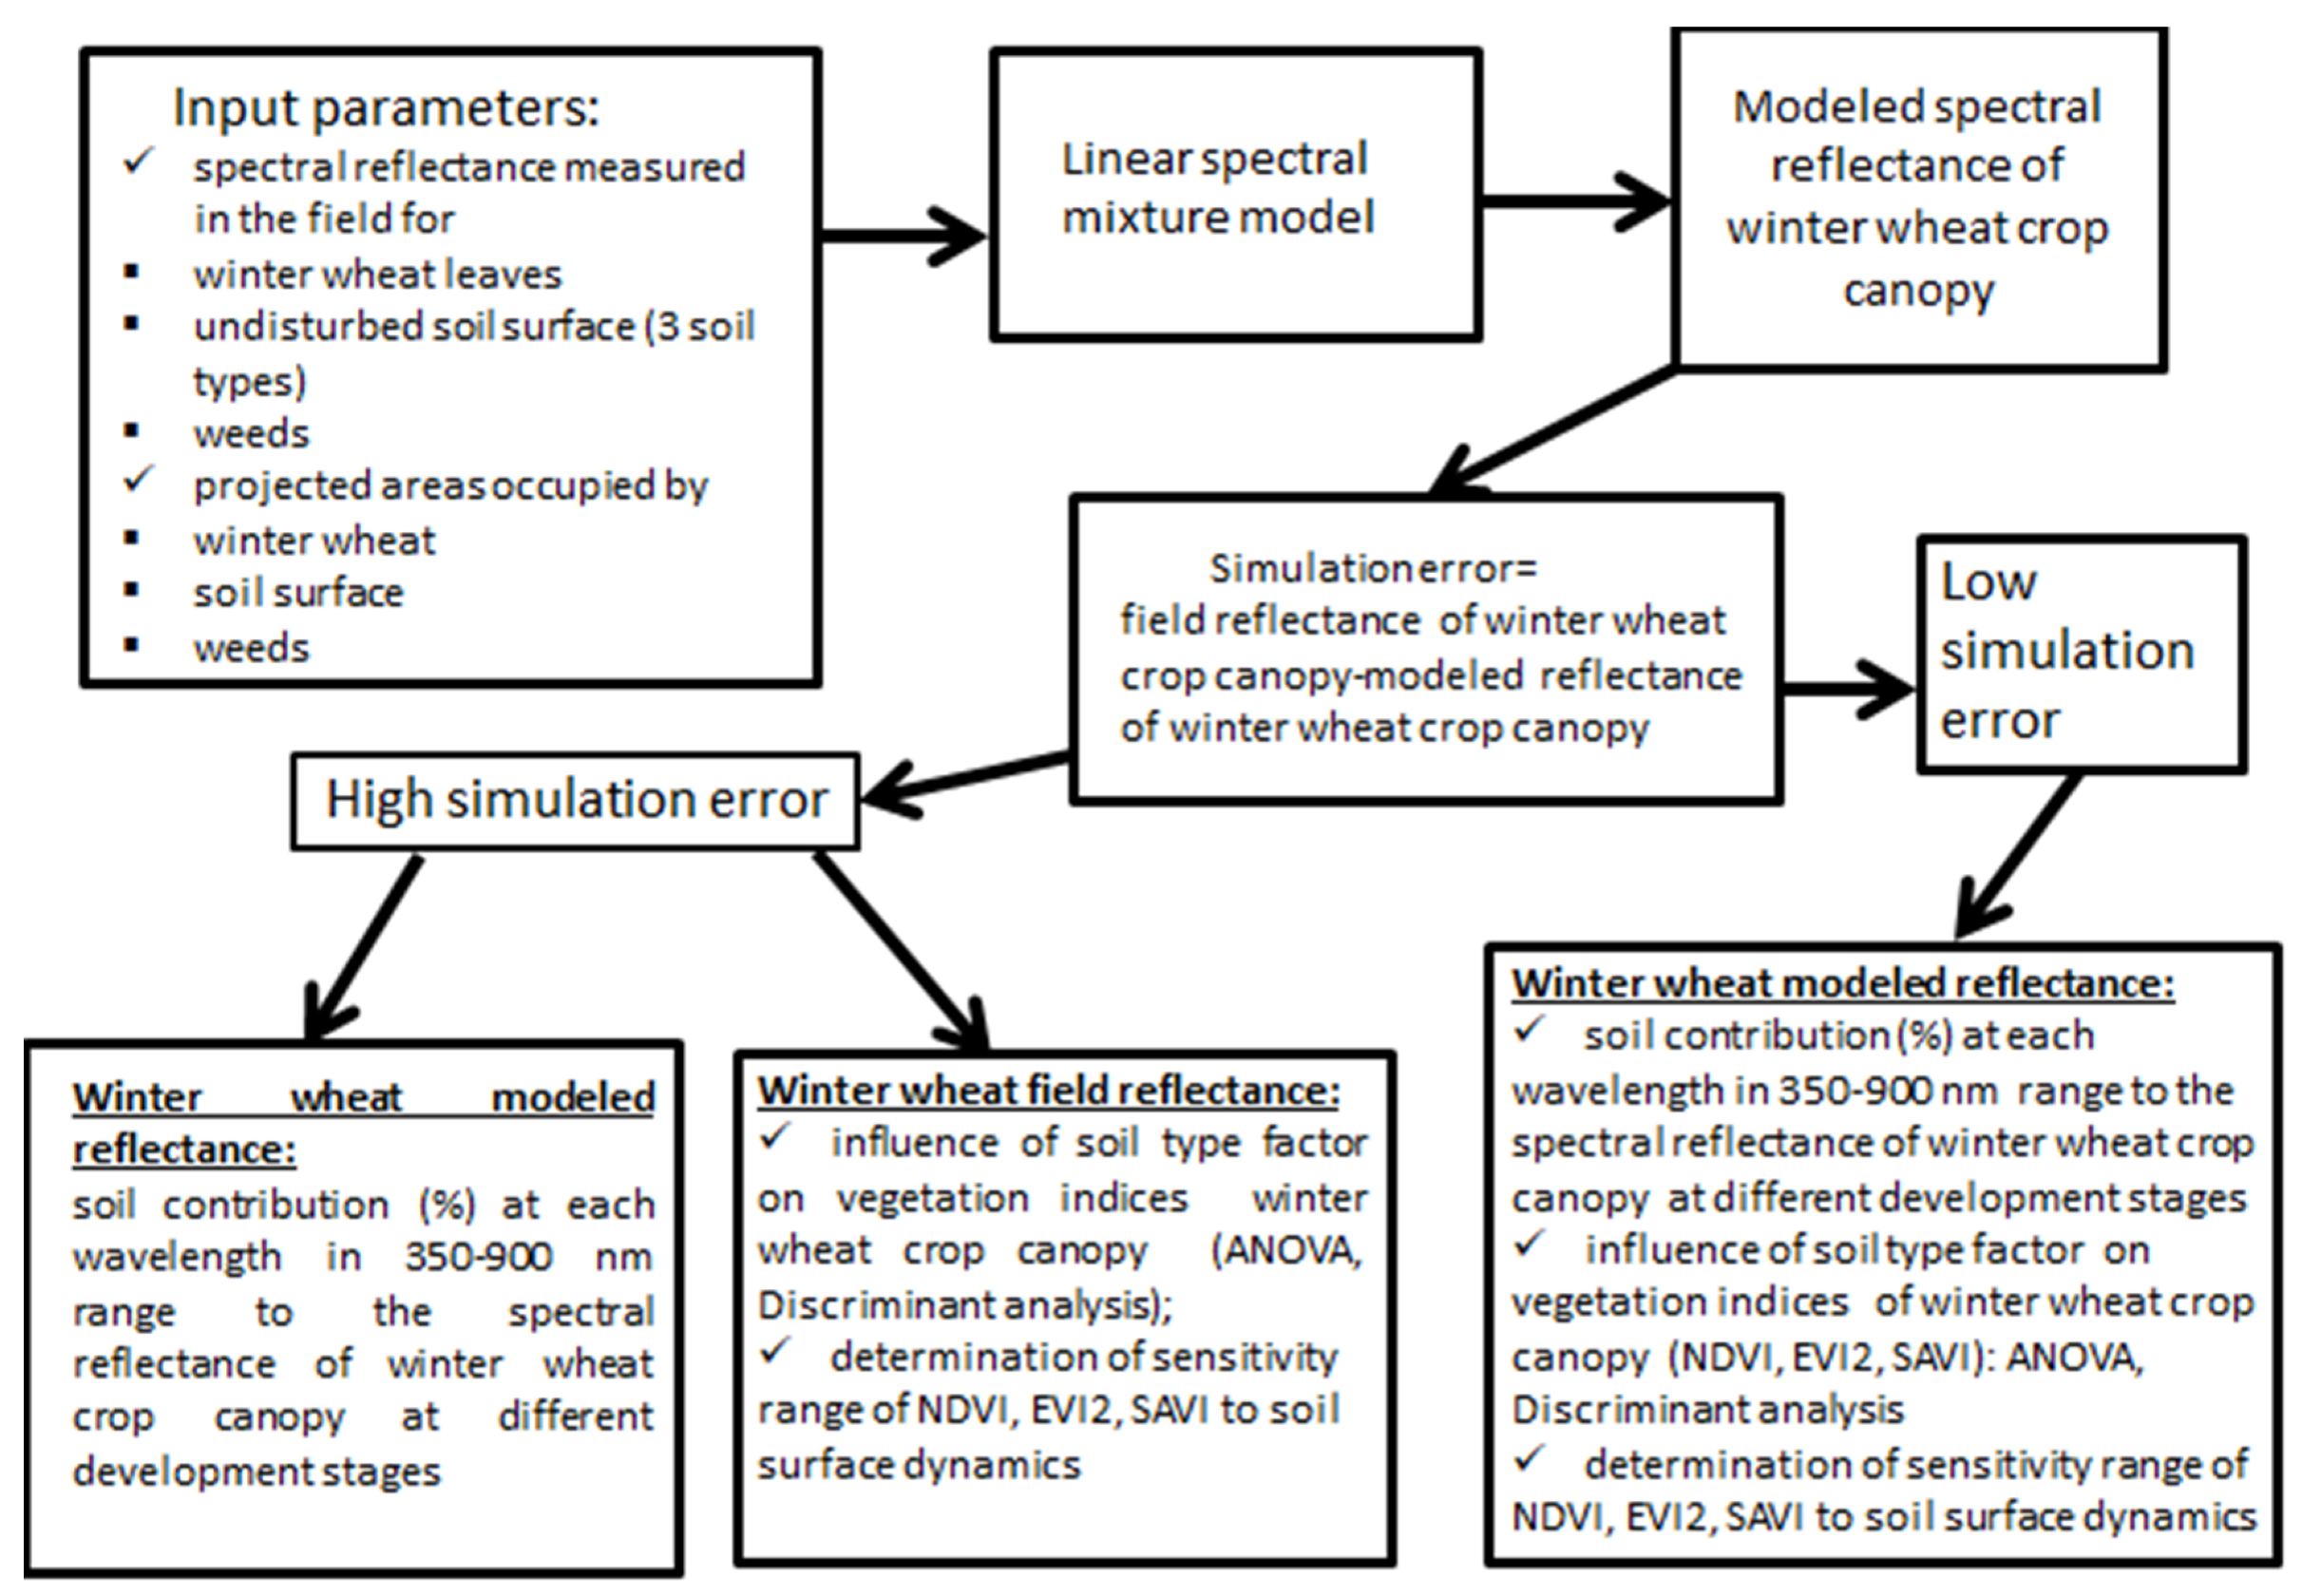
2.2.2. Assessment of Soil Contribution to the Spectral Reflectance of the Crop Canopy

The spectral reflectance of the crop canopy is a spectral mixture of reflectances of the agricultural crop (in this case, winter wheat), open soil surface and weeds. According to the linear spectral mixture model, the contribution of each object in the spectral mixture is determined by the area occupied by the object and its reflectance [58,59]; thus, the spectral reflectance of the crop canopy can be modeled as:
SRcc = s1∗SRsoil + s2∗SRlv + s3∗SRweeds
where SRcc is modeled spectral reflectance of crop canopy; SRsoil—spectral reflectance of soil surface measured in the field; SRlv—spectral reflectance of leaves of studied crop measured in the field; SRweeds—spectral reflectance of weeds measured in the field; s1—the projected area of open soil surface; s2 and s3—the projected areas of studied crop and weeds on the top of the crop canopy (s1 + s2 + s3 = 1). s1, s2 and s3 were determined during photo analysis. Their value range changes from 0 to 1, where 1 means full coverage (100% of area presented on photo is covered by an object).
Based on this model, the reflectance of winter wheat crop canopy at all wavelengths of the considered range (350–900 nm) was simulated for each soil type (hereafter, the reflectance of the spectral mixture). To estimate the model performance at each wavelength, a simulation error was calculated as a difference between the spectral reflectance of the crop canopy measured in the field and the reflectance of the spectral mixture.
The obtained models were further used to assess the contribution of soil to the spectral reflectance of winter wheat crop canopy. Based on Equation (1), the soil contribution at each wavelength was calculated as follows:
Soil contribution (%) = (s1∗SRsoil)/SRcc∗100
where s1—the projected area occupied by open soil surface (the same as s1 in Equation (1)), SRsoil—spectral reflectance of open soil surface measured in the field (the same as SRsoil in Equation (1)), SRcc—modeled spectral reflectance of crop canopy.
At the stage of milky ripeness, the leaves of winter wheat were too multicolored. Soil contribution at this stage was calculated in relation to the spectral reflectance of the winter wheat crop canopy, measured in the field at the corresponding stage:
Soil contribution (%) = (s1∗SRsoil)/SRccf∗100
where SRccf—the reflectance of crop canopy measured in the field.

2.2.3. Assessment of Soil Type Influence on the Vegetation Indices of the Crop Canopy

The effect of soil type on vegetation indices was estimated for NDVI [60], SAVI [32] and EVI2 [36]:
NDVI = (NIR−RED)/(NIR + RED),
SAVI = 1.5∗(NIR−RED)/(NIR + RED + 0.5),
EVI2 = 2.5∗(NIR−RED)/(NIR + 2.4∗RED + 1),
where RED—spectral reflectance in red part of the spectrum, NIR—spectral reflectance in near-infrared part of the spectrum.
NDVI is widely used in crop monitoring [1,2,3]. At the same time, it has been shown to be sensitive to soil brightness with a low amount of vegetation [34]. SAVI, based on the concept of a soil line, was proposed to minimize the effects of soil moisture [32]. EVI2 was developed as an alternative to EVI, an index that minimizes the influence of the state of the atmosphere and soil moisture, in order to exclude the blue portion of the spectrum, where a limited number of satellite systems work [36,61].
Since red (620–690 nm) and near-infrared (760–900 nm) spectral regions are used to calculate these indices, the maximum, minimum, and average reflectance of winter wheat crop canopy were determined for each of these regions, and then several combinations were calculated for each index.
Moreover, since the RedEdge region is also considered informative for determining the state of agricultural crops [62,63,64,65], additional combinations where the reflectance in the red channel was replaced with the RedEdge reflectance (average value at 720–730 nm) were calculated (Table 2, Table S1 of Supplementary Materials).
Then, in the SPSS program, an analysis of variance (ANOVA) was conducted, during which it was determined whether the soil type influences the vegetation indices for winter wheat crop canopy and the size of soil type influence.
The factor “soil type” included three classes: 1—gray forest soils; 2—alluvial soils; 3—chernozem. The presence of a statistically significant effect of the factor was recognized at the level of p < 0.05.
The assessment of the degree of influence of soil type was carried out based on the parameter eta squared (η), the value of which reflects the proportion of variability of the dependent variable (vegetation index), which is explained by the analyzed factor (soil type).
In addition, after identifying the presence of a statistically significant effect of the soil type, post hoc analysis based on the Scheffe criterion was carried out to determine for each calculated combination whether the differences in the values of indices for crops between soil types were statistically significant.
We further used the discriminant analysis to classify whiter wheat crops growing on different soil types on the basis of vegetation indices calculated for winter wheat crop canopy. Soil type factor with three levels (the same as in ANOVA analysis) was used as a dependent variable. Different combinations of studied vegetation indices (shown in Table 2) for the winter wheat crop canopy were used as predictors in the models. Separate model was created for each calculated combination of NDVI, EVI2 and SAVI. Classification accuracy showed the percentage of correctly classified group cases for each combination. Discriminant analysis was performed in SPSS. The results of discriminant analysis confirmed the degree of soil type influence on vegetation indices of winter wheat crop canopy.

2.2.4. Assessment of the Influence of the Soil Surface State on the Sensitivity of Vegetation Indices

To assess the extent to which the values of the vegetation indices of crops at different stages of their development differ from the values of the vegetation indices for the open soil surface in different states, graphs were constructed by analogy with [32]. The values of the index were located along the OY axis, and the values of average reflectance in the red part of spectrum were located along the OX axis. We used indices, calculated using average reflectance values for red and NIR parts of spectrum. For each index, graphs were built separately for each type of soil. On each graph, the values for crops and the open soil surface were plotted as points. Then, the vegetation isolines and lines of the open soil surface were drawn through the points for each stage of crop development.
Ref. [32] considered the index to be sensitive to soil background when it changed with a change in the reflectance of soil surface in the red spectral region. We expand this concept to include soil surface dynamics in the following way: the index is considered to be sensitive to the soil surface state when it changes with a change in the reflectance of soil surface in red spectral region and that results in a situation where the values for crops and soil become very close. The graphs highlighted the sensitivity areas of the indices: ranges of values in which crops and soil can be mixed.

3. Results

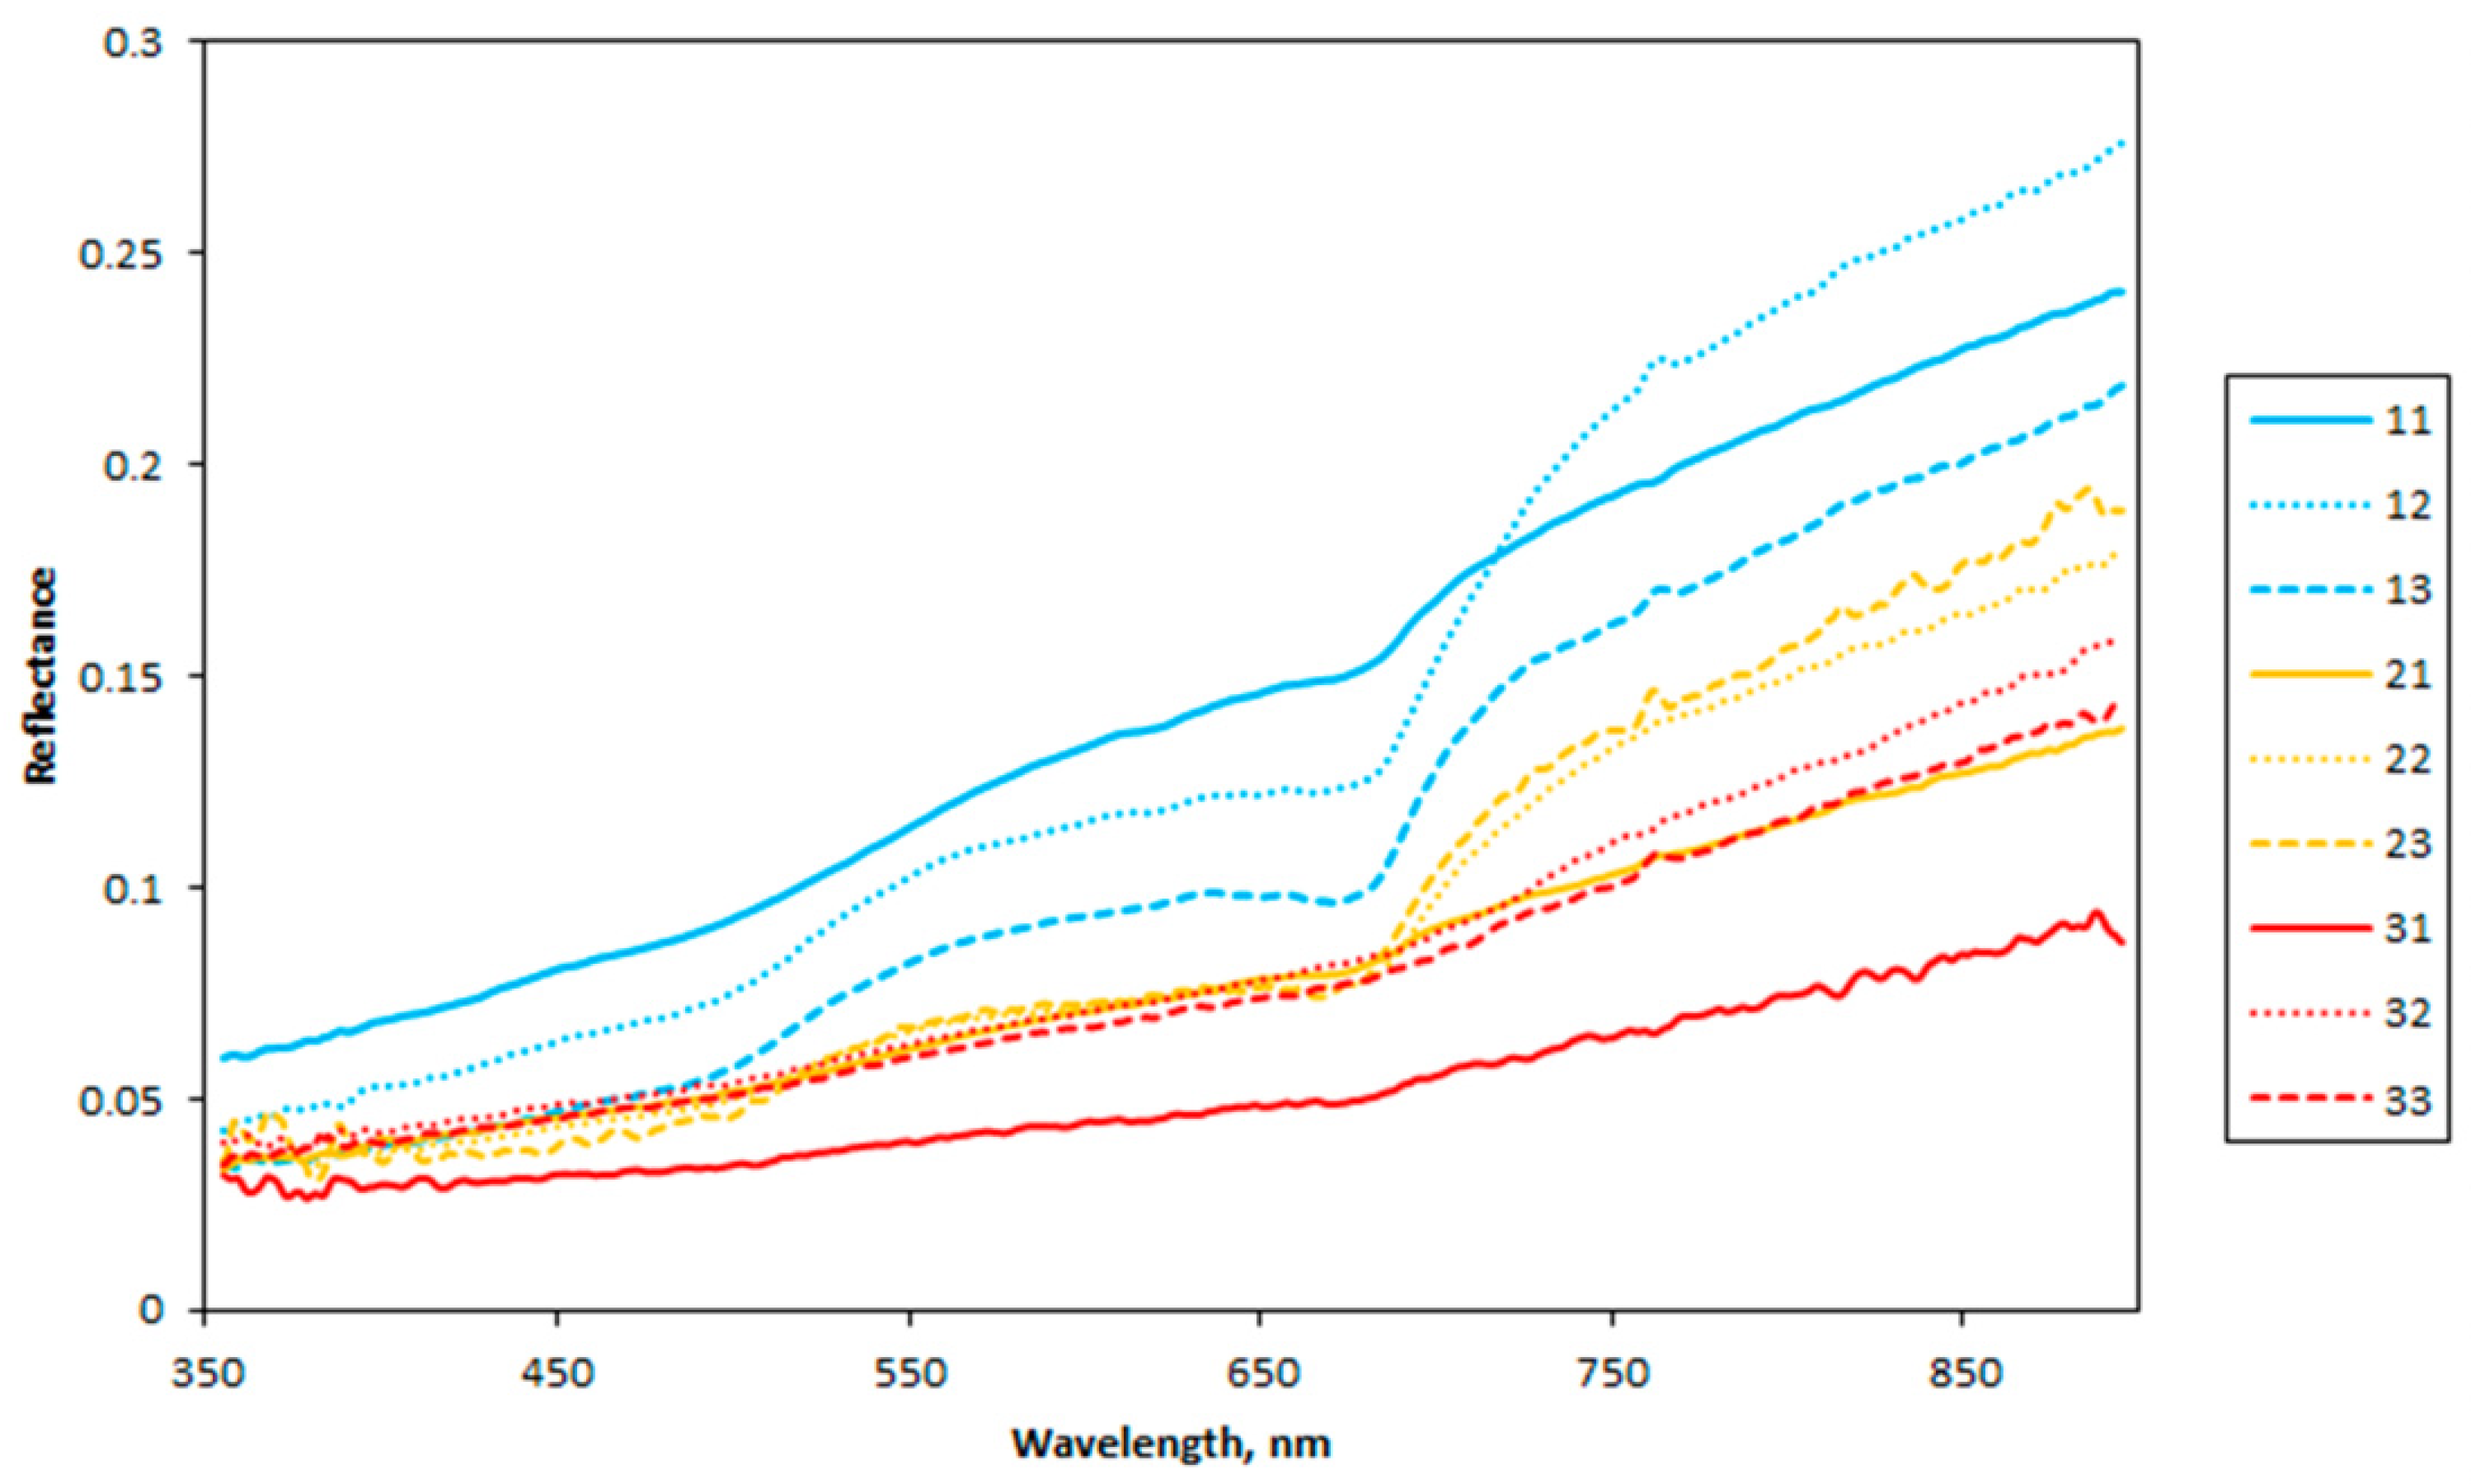
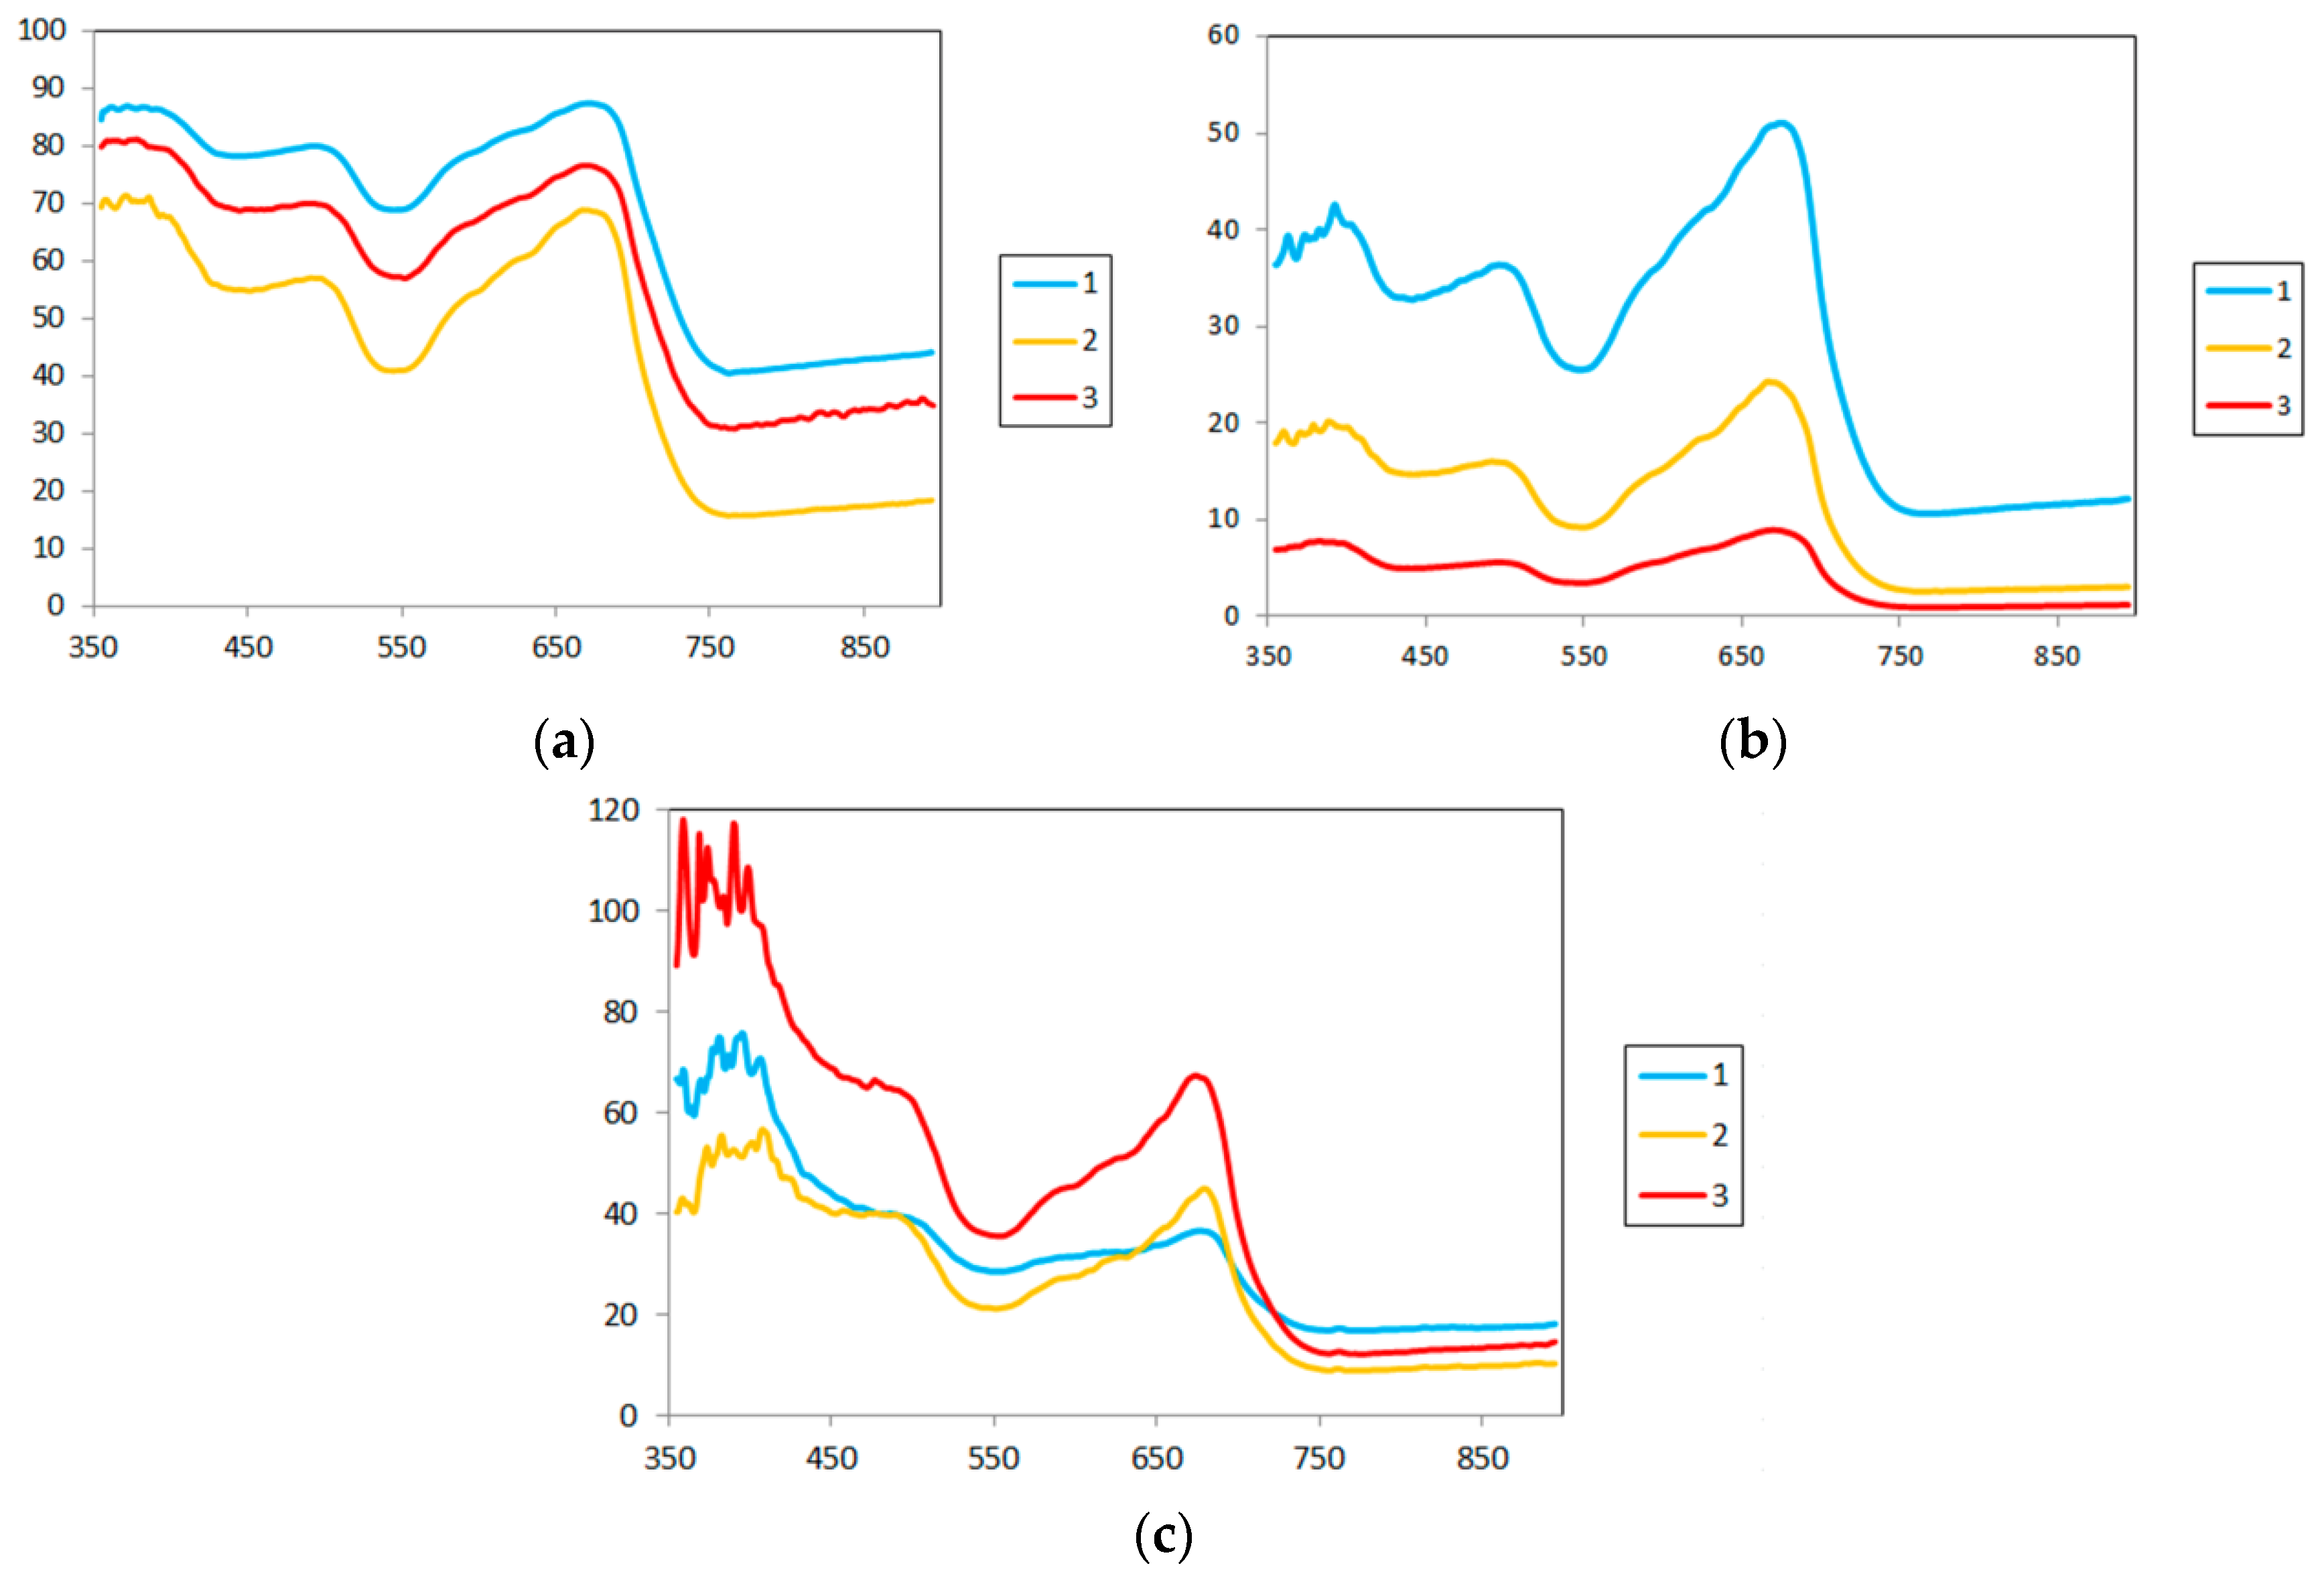
3.1. Spectral Reflectance of Analyzed Soil Types

Analysis of the spectral reflectance of the studied soil types for different stages of winter wheat development showed that at the tillering stage, their spectral reflectance in the range of 350–900 nm gradually increased (Figure 3).
In the case of chernozem, the same pattern was observed at the shooting and milky ripeness stages. At these two stages, small differences in the spectral reflectance of chernozem were registered after 740 nm.
The spectral reflectance of alluvial soils in the shooting and milky ripeness phases was quite similar, significantly differing from the reflectance in the tillering phase only in the 690–900 nm region.
As for gray forest soils, their reflectance varied quite strongly. Compared to the tillering stage, where it gradually increased in the analyzed part of the spectrum, in the shooting and milky ripeness phases, there was a local increase in reflectance in the 500–600 nm region of the spectrum, followed by a decrease in the 600–690 nm region and an increase after 690 nm. The difference between these two phases lies in the intensity of the reflectance and in the pattern of the increase in reflectance in the NIR part of the spectrum. Such behavior of the spectral reflectance of gray forest soil at shooting and milky ripeness phases can be associated with the development of a biological crust on the soil surface [66,67].
Thus, gray forest soils are characterized by the highest reflectance values and they most strongly transformed at different times of spectral data acquisition. Alluvial soils occupy an intermediate position between gray forest soils and leached chernozem. Leached chernozems, in this case, had lower reflectance intensity and the least drastic changes in the spectral reflectance between different times of spectral measurements. The differences in overall reflectance values of the studied soils are mainly due to the variations in their organic matter content as they have similar texture and mineralogical composition. Leached chernozem with the highest content of organic matter has the lowest reflectance intensity. Gray forest and alluvial soils have lower organic matter content what results in the increased contribution of soil minerals to their reflectance and, therefore, higher overall reflectance intensity.
Generally, soil surface roughness was more or less the same starting from the period of crop emergence to crop harvesting. As the measurements were made in sunny weather (near midday time), optically active soil surface layer (1–2 mm) was dry. Therefore, the main factor of soil surface spectral variations within soil type was a transformation of the surface under the impact of rainfall which is known to result in changes of soil surface organic matter content and mineralogical composition or in the development of biological crust [49,50,51,52,65,67].
Scatterplots of the reflectance values of open soil surface in NIR-Red space show that soil surface dynamics results in rather high scattering of spectral measurements from the line for shooting and milky ripeness stages (Figure 4). Gray forest and alluvial soils vary the most. This result suggests that the ability of soil-line-based indices to correct for soil background variations is limited by temporal soil line variability.

3.2. The Analysis of Modeled Crop Reflectance

For the tillering stage, the calculated reflectance of the spectral mixture was quite close to the spectral reflectance of winter wheat crop canopy in the visible part of the spectrum for considered soil types (Figure 5a). The maximum difference here was 0.05 units of reflectance for alluvial soils and leached chernozem, and 0.07 for gray forest soils. The greatest difference between the simulated reflectance and reflectance of winter wheat crop canopy for alluvial soils and leached chernozem was observed in the spectral range of 680–740 nm, while for gray forest soils, this was in the area after 770 nm. For leached chernozem, it did not exceed 0.07, whereas for gray forest soils and for alluvial soils these values were 0.1 and 0.12, respectively.
As for the shooting stage, the difference between the simulated reflectance and the reflectance of the winter wheat crop canopy in the visible part of the spectrum did not exceed 0.1 (Figure 5b). For gray forest and alluvial soils, it remained within 0.06. However, the difference increased in the near infrared part of the spectrums, reaching 0.54 for leached chernozem, 0.25 for gray forest soils and 0.23 for alluvial soils. High error of modelling the reflectance of winter wheat crop canopy in the near infrared region is due to the increased transmission of plant leaves in this part of the spectrum [26].
Thus, the model of a linear spectral mixture significantly overestimated the reflectance of the winter wheat crop canopy in the shooting stage in the near-infrared part of the spectrum, overpredicting the contribution of winter wheat reflectance, which was especially pronounced in the case of leached chernozem. At the same time, during the shooting stage in the visible part of the spectrum, the error decreased for gray forest and alluvial soils and increased for leached chernozem.
Given the size of the errors in individual parts of the spectrum, the obtained spectral mixture models were used only to identify the general features of soil contribution to the spectral reflectance of winter wheat crop canopy. Moreover, we suggest that the accuracy of the spectral models should be estimated prior their application in developing and testing vegetation indices resistant to soil influence.

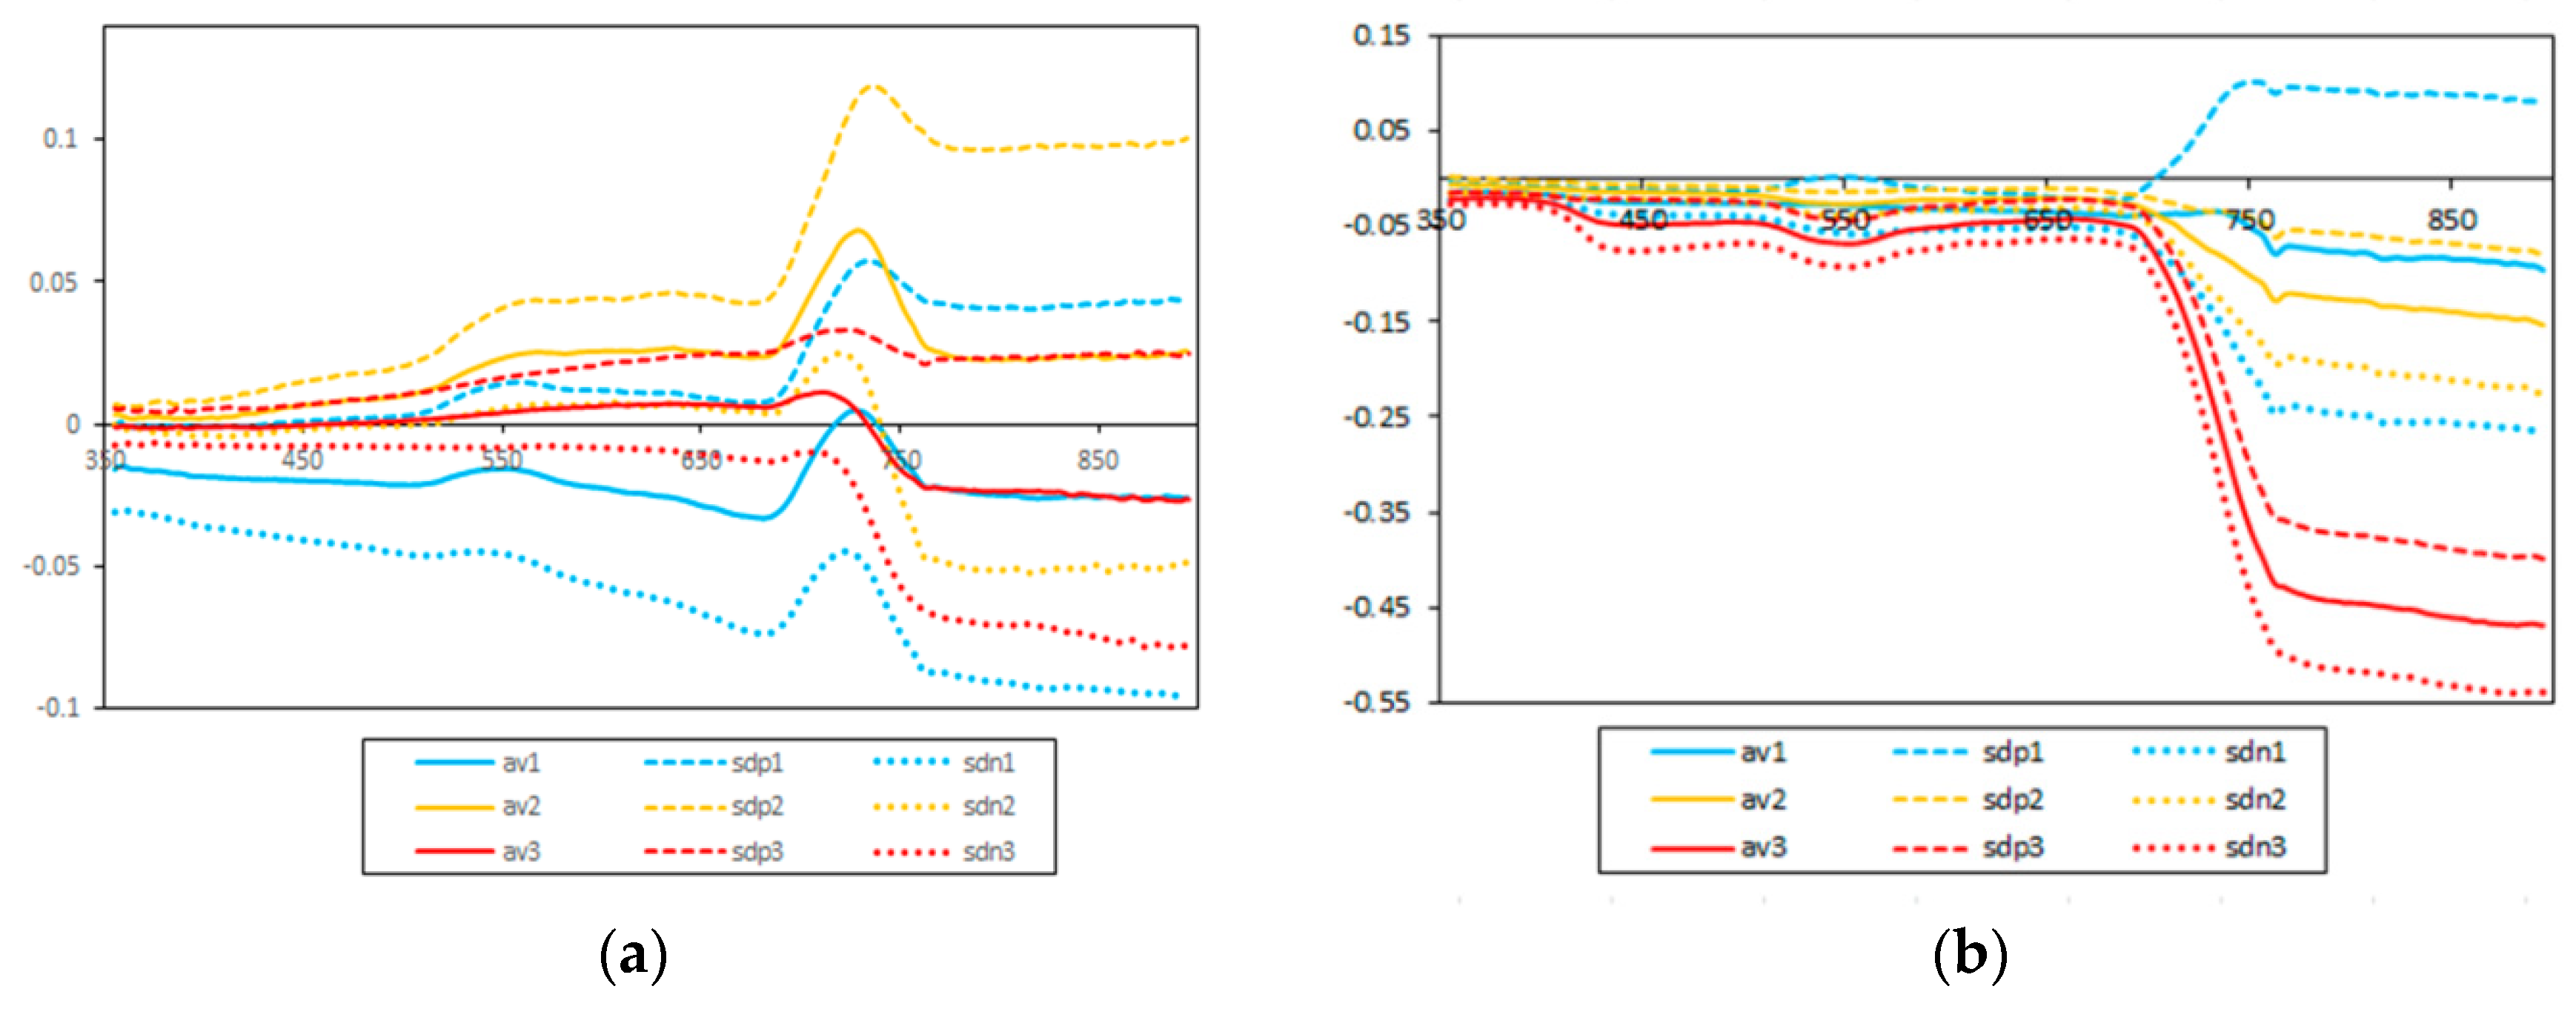
3.3. Soil Background Contribution to the Reflectance of Winter Wheat Crop Canopy (on the Basis of Modeled Refelctance of Winter Wheat Crop Canopy)

According to the calculations carried out for the tillering stage, soil made the greatest contribution to the simulated spectral reflectance of the winter wheat crop canopy in the regions of 350–400 nm and 600–690 nm (Figure 6a). A slight decrease was observed in the region of 550 nm: the region of chlorophyll influence. The smallest impact was noted in the region after 750 nm.
The soil contribution in the shooting stage of winter wheat development was significantly lower, with the exception of gray forest soils, where the decrease was not so pronounced (Figure 6b), which can be explained by the characteristics of the spectral reflectance of this soil type (Figure 3). At the same time, the influence of the soil background in the region after 750 nm decreased significantly, approaching 0. At this stage of development, the density of winter wheat plants and their projective cover were the largest, which explains the decrease in the contribution of soil to the visible and near-infrared spectral regions.
According to the results for the tillering and shooting stages, the greatest modeling error was noted for soil types with the smallest contribution at this stage of winter wheat development. In this case, the smaller the contribution was, the higher the error was (Figure 5b and Figure 6b).
At the stage of milky ripeness, the contribution of soil in the visible part of the spectrum (especially in the region of 350–500 nm) significantly increased (Figure 6c). The soil input to the spectral reflectance of winter wheat crop canopy in the region of 620–960 nm remained fairly high. After 750 nm, the contribution of soil stayed minimal. The observed increase in the contribution of soil in the visible part of the spectrum was most likely because during the phase of milky ripeness, the winter wheat plants were yellowing, and the crops became a mixture of green and yellow plants.
In general, the high contribution of soil to the reflectance of winter wheat crop canopy in the red part of the spectrum (620–690 nm) is attributable to the fact that the spectral reflectance of vegetation in this spectral area is decreasing, reaching a minimal value, while the soil spectral reflectance, on the contrary, keeps increasing, approaching a maximum in the near-infrared part of the spectrum.
The difference in the contribution of different soil types to the spectral reflectance of winter wheat crop canopy agrees with the difference in their organic matter content. Gray forest and alluvial soils with lower organic matter content have the highest contribution due to higher influence of soil minerals which are not masked by the coating of organic matter. The influence of chernozem soils with high organic matter content which masks the contribution of soil minerals to soil reflectance, on winter wheat crop canopy reflectance is lower.

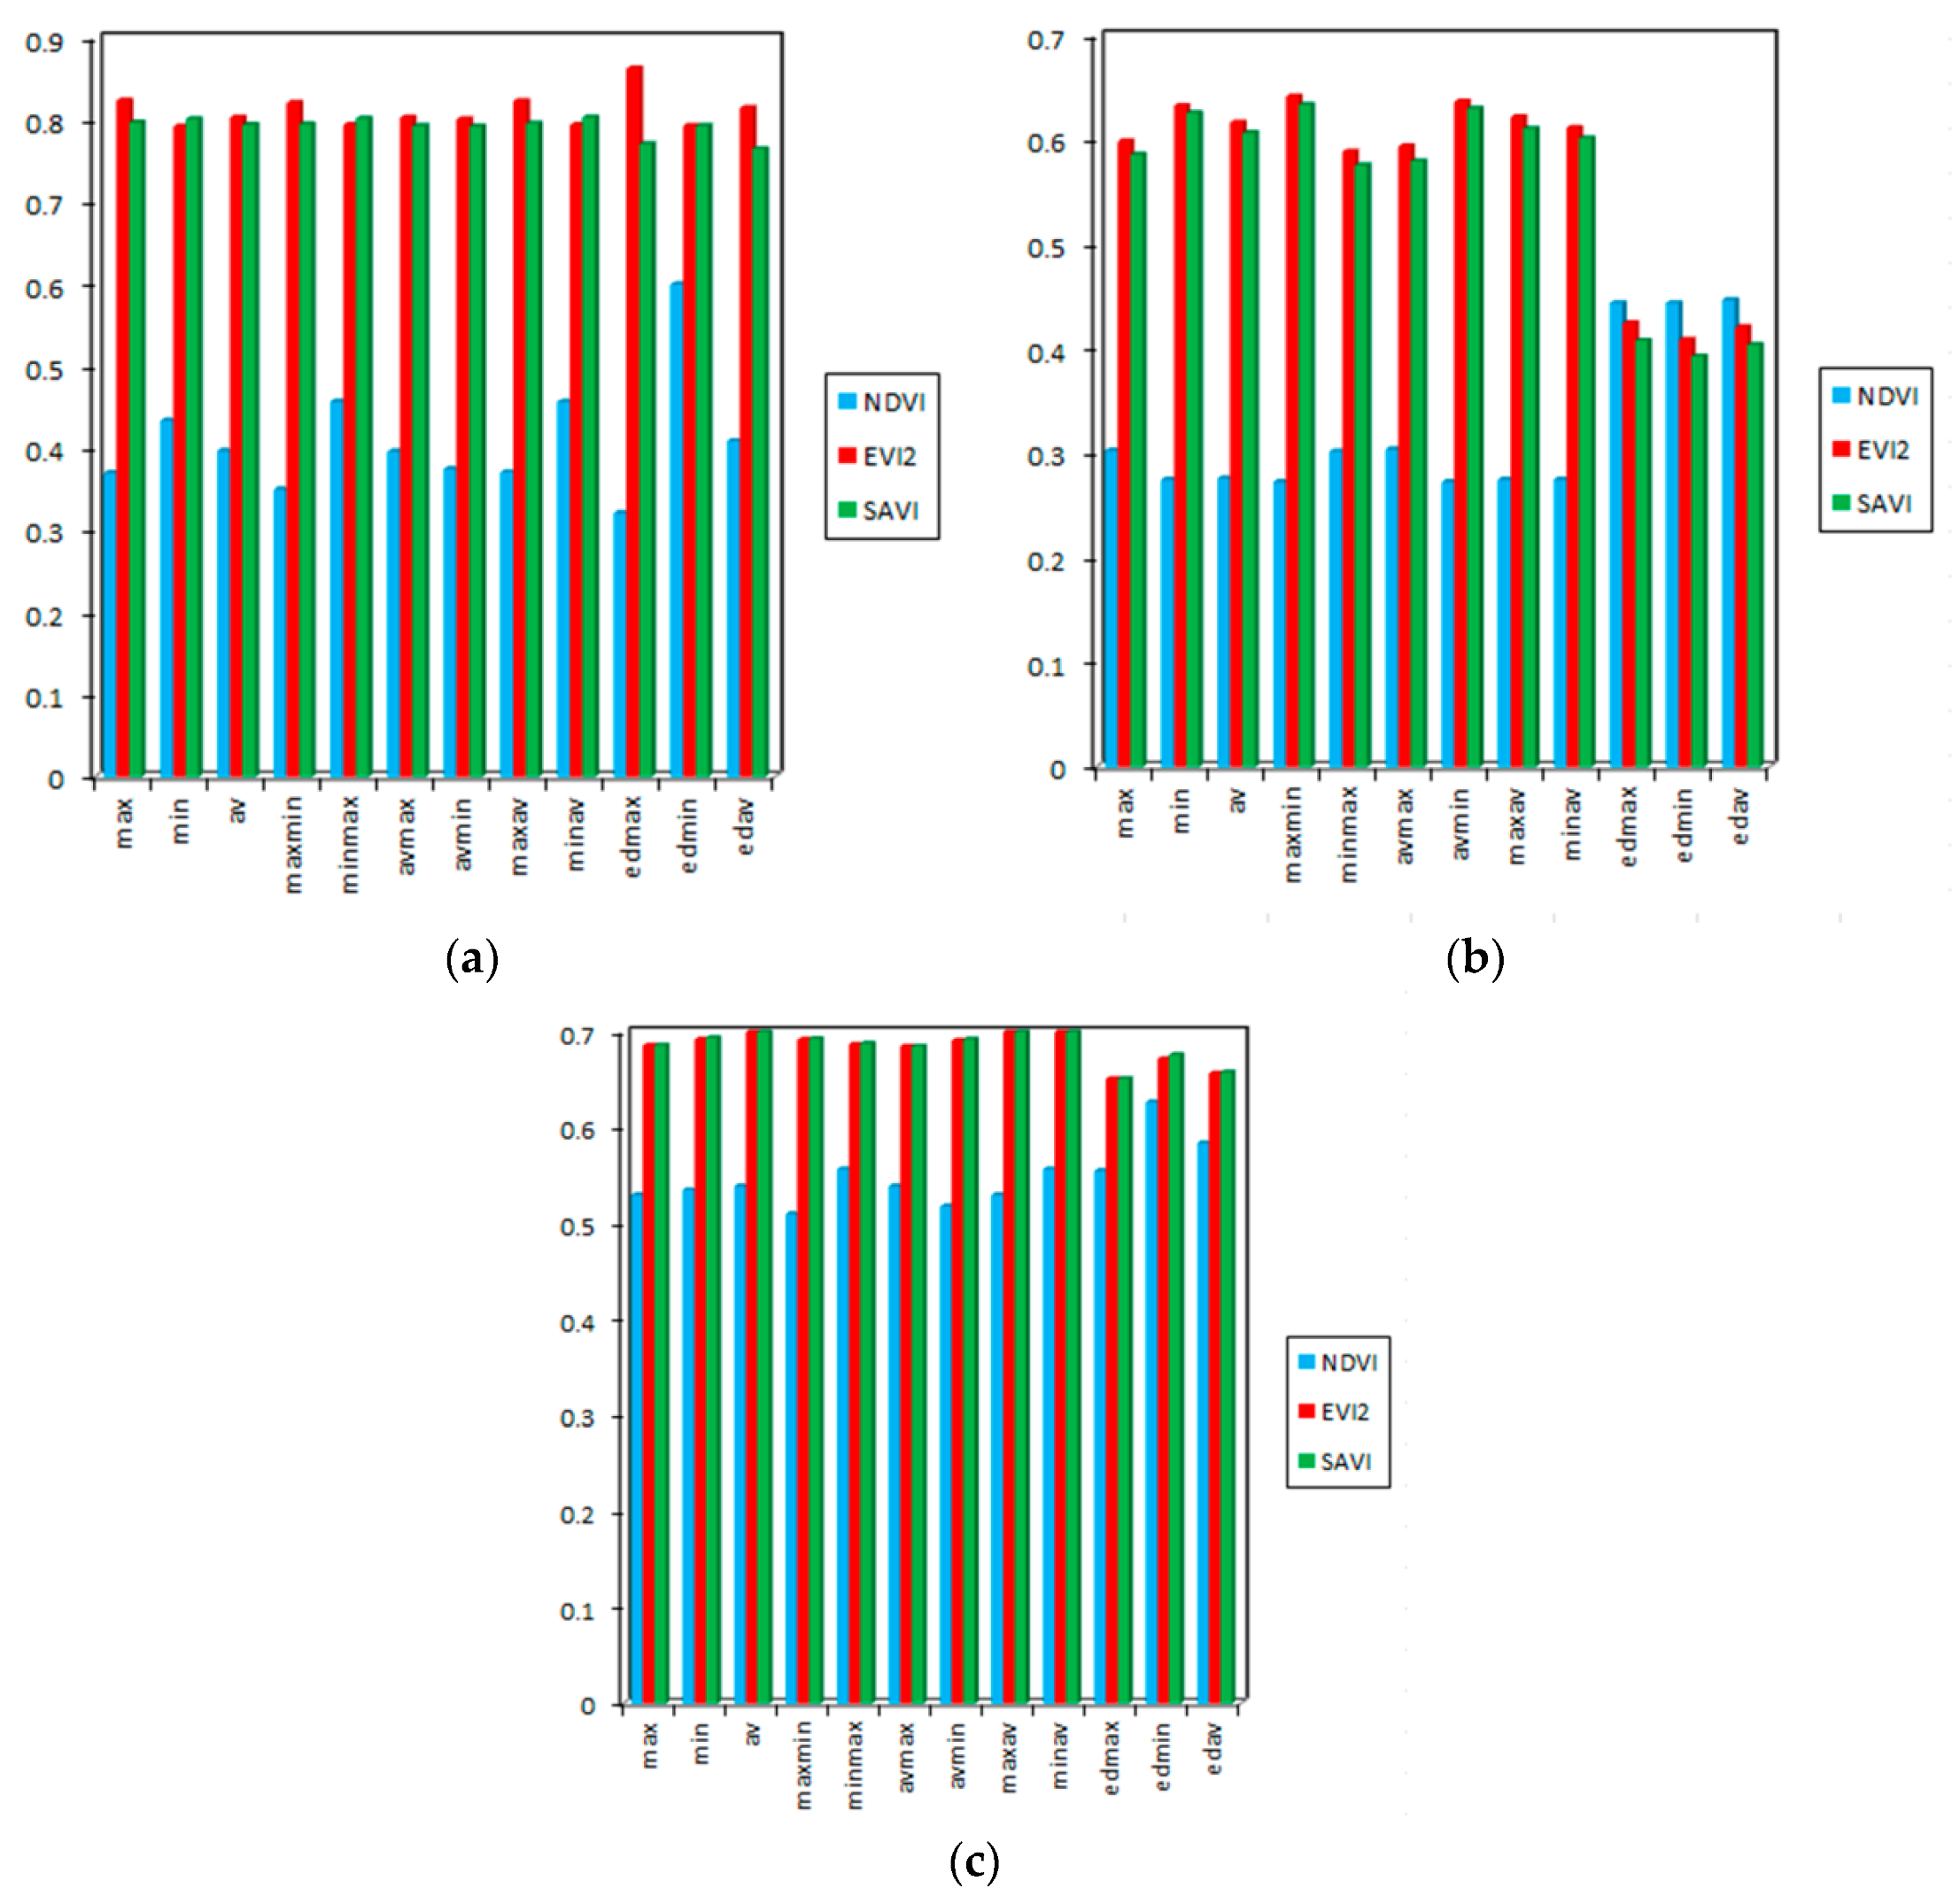
3.4. Effect of Soil Type on NDVI, SAVI and EVI2 Values at Different Stages of Winter Wheat Development (on the Basis of Field Data on Spectral Reflectance of Winter Wheat Crop Canopy)

3.4.1. Tillering Stage

On average, the soil factor caused about 40% of the variability of the NDVI values for the winter wheat crop canopy (Figure 7a, Tables S2 and S5 of Supplementary Materials). The influence of the soil factor reached 60% when the reflectance of winter wheat canopy in the RedEdge region, and the wavelengths with minimal reflectance in the NIR part were used for index calculation.
For most of the NDVI combinations, winter wheat crops formed two homogeneous groups: (1) crops on gray forest and alluvial soils, and (2) crops on leached chernozem (the detailed results of post hoc analysis for tillering stage are provided in Table S8 of Supplementary Materials).
However, when the red part of the spectrum and the wavelengths with maximum reflectance in the NIR region were used to calculate NDVI, significant differences were observed only between winter wheat crops on alluvial soils and leached chernozem.
In addition, the replacement of the red region with RedEdge led to the change in the composition of homogeneous groups: winter wheat crops on gray forest soils and leached chernozem fell into one homogeneous group, and winter wheat crops on alluvial soils into another.
In the case of EVI2, the influence of the soil type factor for all the combinations was generally about 80%. The maximum (85%) was noted when using the RedEdge and the wavelength with maximum reflectance in the near IR region of the spectrum for the calculation (Figure 7a).
As for SAVI, the influence of the soil factor for all combinations was approximately 80%. A slight decrease was noted when the red region was replaced with RedEdge.
For all variants of calculation, winter wheat crops on the considered soil types significantly differed from each other in the values of SAVI and EVI2.

3.4.2. Shooting Phase

The greatest influence of the soil factor (45%) on NDVI was noted for the combinations where the red region was replaced with RedEdge (Figure 7b, Tables S3 and S6 of Supplementary Materials). At the same time, for most of the combinations, winter wheat crops on leached chernozem did not reliably statistically differ from those on gray forest soil and from winter wheat crops on alluvial soils (the detailed results of post hoc analysis for shooting stage are provided in Table S9 of Supplementary Materials). Only when using the minimum reflectance in the red part of the spectrum in calculations did winter wheat crops on leached chernozem and gray forest soils fall into one homogeneous group and winter wheat crops on alluvial soils into another.
In the case of EVI2 and SAVI, for most combinations, the influence of the soil factor was about 60%, decreasing to 40% when RedEdge was used in calculations (Figure 7b).
At the same time, when using the red and NIR parts of the spectrum for calculating EVI2 and SAVI, two homogeneous groups were formed: (1) winter wheat crops on gray forest and alluvial soils, and (2) winter crops on leached chernozem. When replacing the red part of the spectrum with RedEdge, the composition of homogeneous groups changed in such a way that winter wheat crops on leached chernozem and gray forest soils fell into one group and those on alluvial soils into another.

3.4.3. Milky Ripeness Phase

The influence of the soil factor on winter wheat crop canopy NDVI was approximately 50%, reaching 60% when RedEdge and the minimum reflectance in the NIR were used in calculations (Figure 7c, Tables S4 and S7 of Supplementary Materials).
As for SAVI and EVI2, the contribution of the soil factor in most combinations remained at 70%, slightly decreasing when RedEdge was used in the calculations.
At the same time, practically in all variants of NDVI calculation, two homogeneous groups were formed: (1) winter wheat crops on gray forest soils, and (2) winter wheat crops on alluvial soils and leached chernozem (the detailed results of post hoc analysis for milky ripeness stage are provided in Table S10 of Supplementary Materials).
When RedEdge and the maximum or average reflectance in the NIR part of the spectrum were used in the calculation, significant differences were observed only between winter wheat crops on gray forest soils and leached chernozem.
In the case of SAVI and EVI2, in all variants of the calculation, the winter wheat crops on gray forest soils were significantly different from those on alluvial soils and leached chernozem.
Thus, the replacement of the red part with RedEdge increased the impact of soil type factor on NDVI values for all considered stages of winter wheat development. The effect was opposite in the case of EVI2 and SAVI at shooting and milky ripeness stages. The most pronounced changes in the influence of soil type factor caused by the introduction of RedEdge reflectance were observed at the shooting stage.
The application of the RedEdge part of the spectrum also led to similar changes in the compositions of homogenous groups for NDVI at the tillering stage and EVI2 and SAVI at the shooting stage.
When RedEdge was not used in calculation, in the case of NDVI, the general scheme of change in composition of homogenous groups looked as follows: winter wheat crops on chernozem soils move from a separate group at the tillering stage to mixed groups at shooting stage, staying in the same group with alluvial soils in the stage of milky ripeness, while winter wheat crops on gray forest soils formed a separate group. In the case of EVI2 and SAVI, mixed groups are formed starting from shooting stage where winter wheat crops on chernozem soils stay in a separate group, similar to the situation with NDVI values at the tillering stage. At the stage of milky ripeness, winter wheat crops on gray forest soils formed a separate group, as in the case of NDVI.

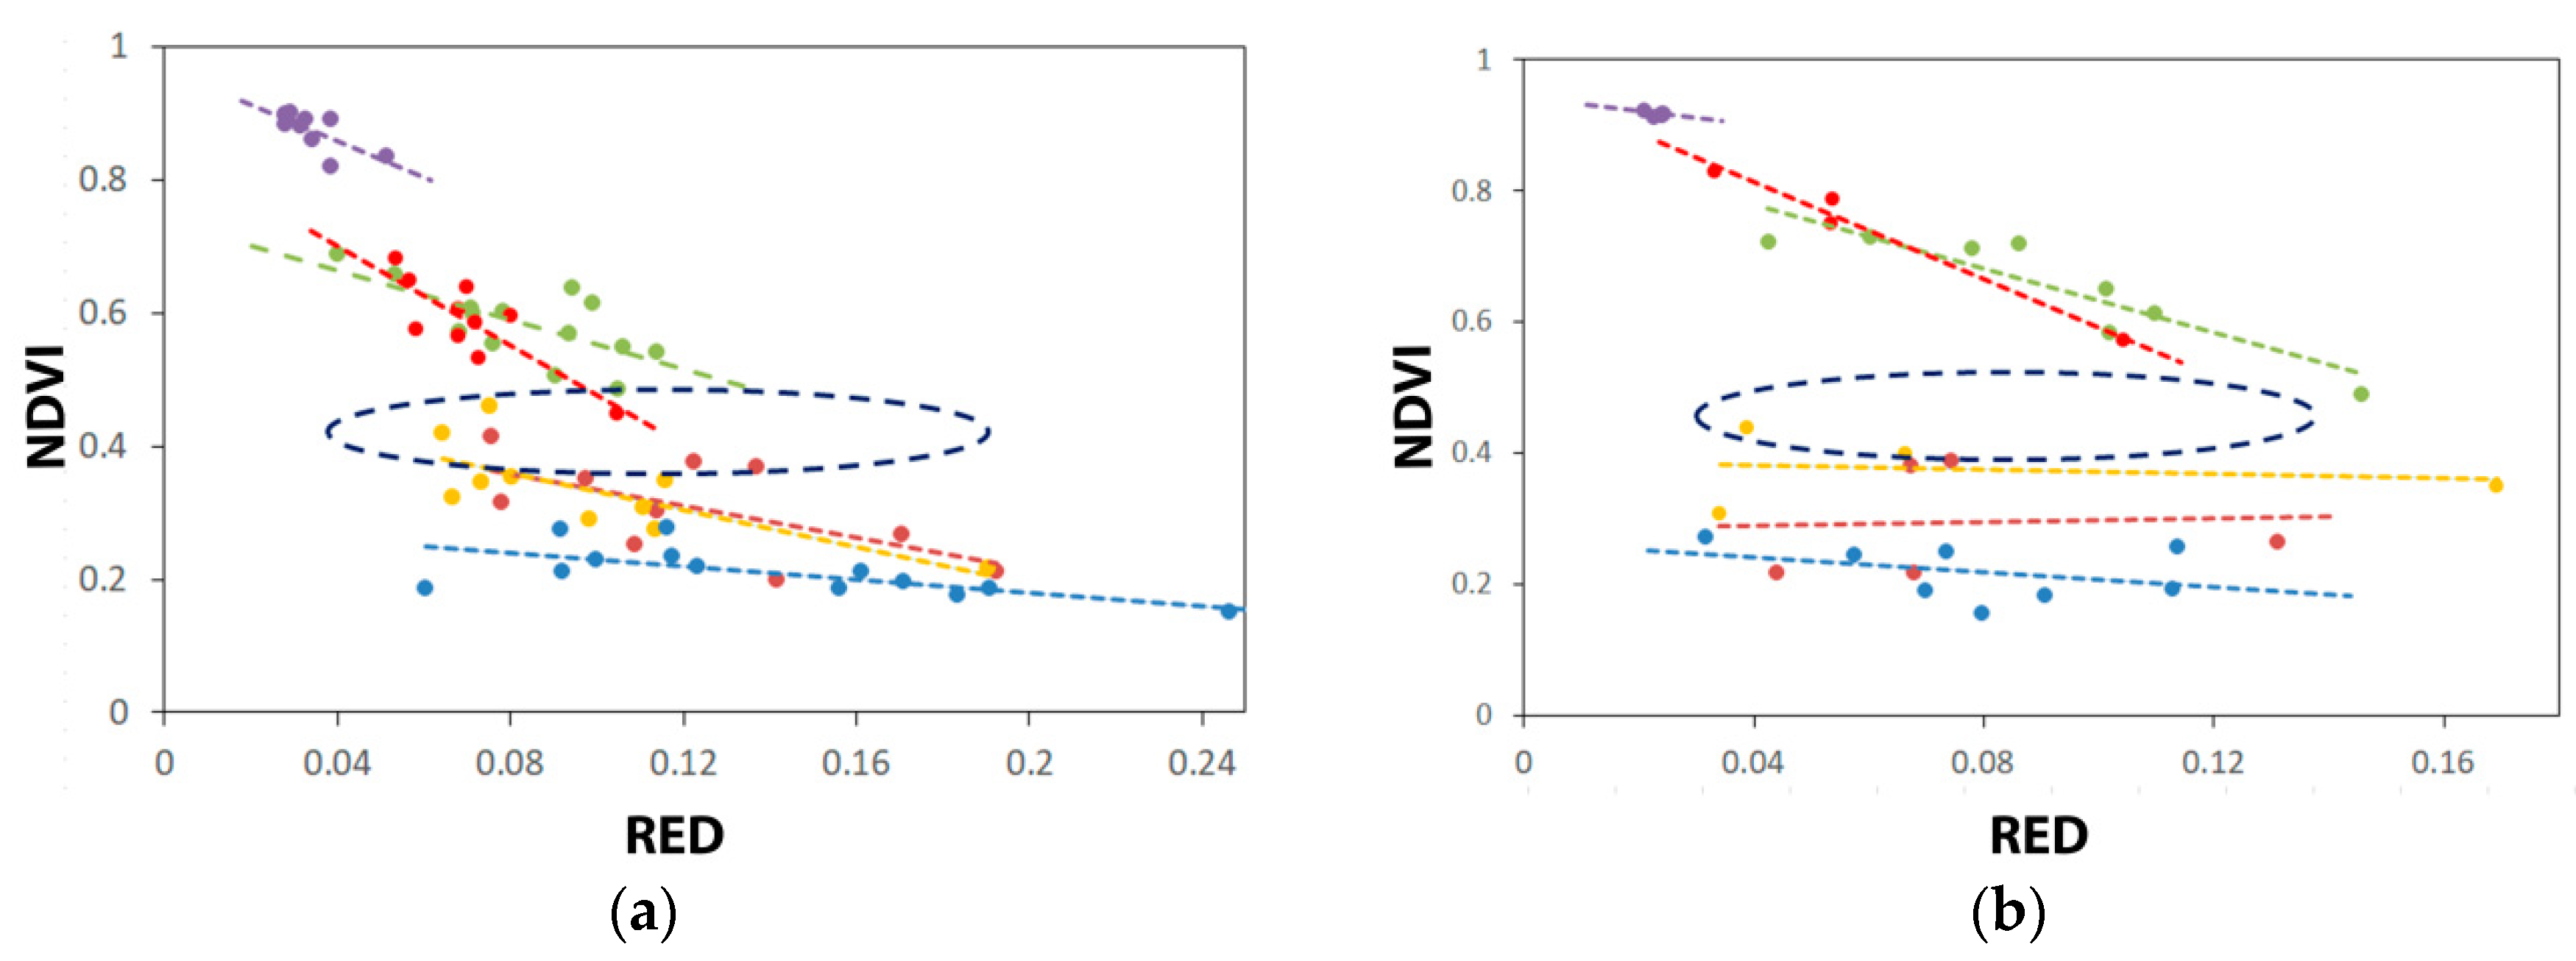
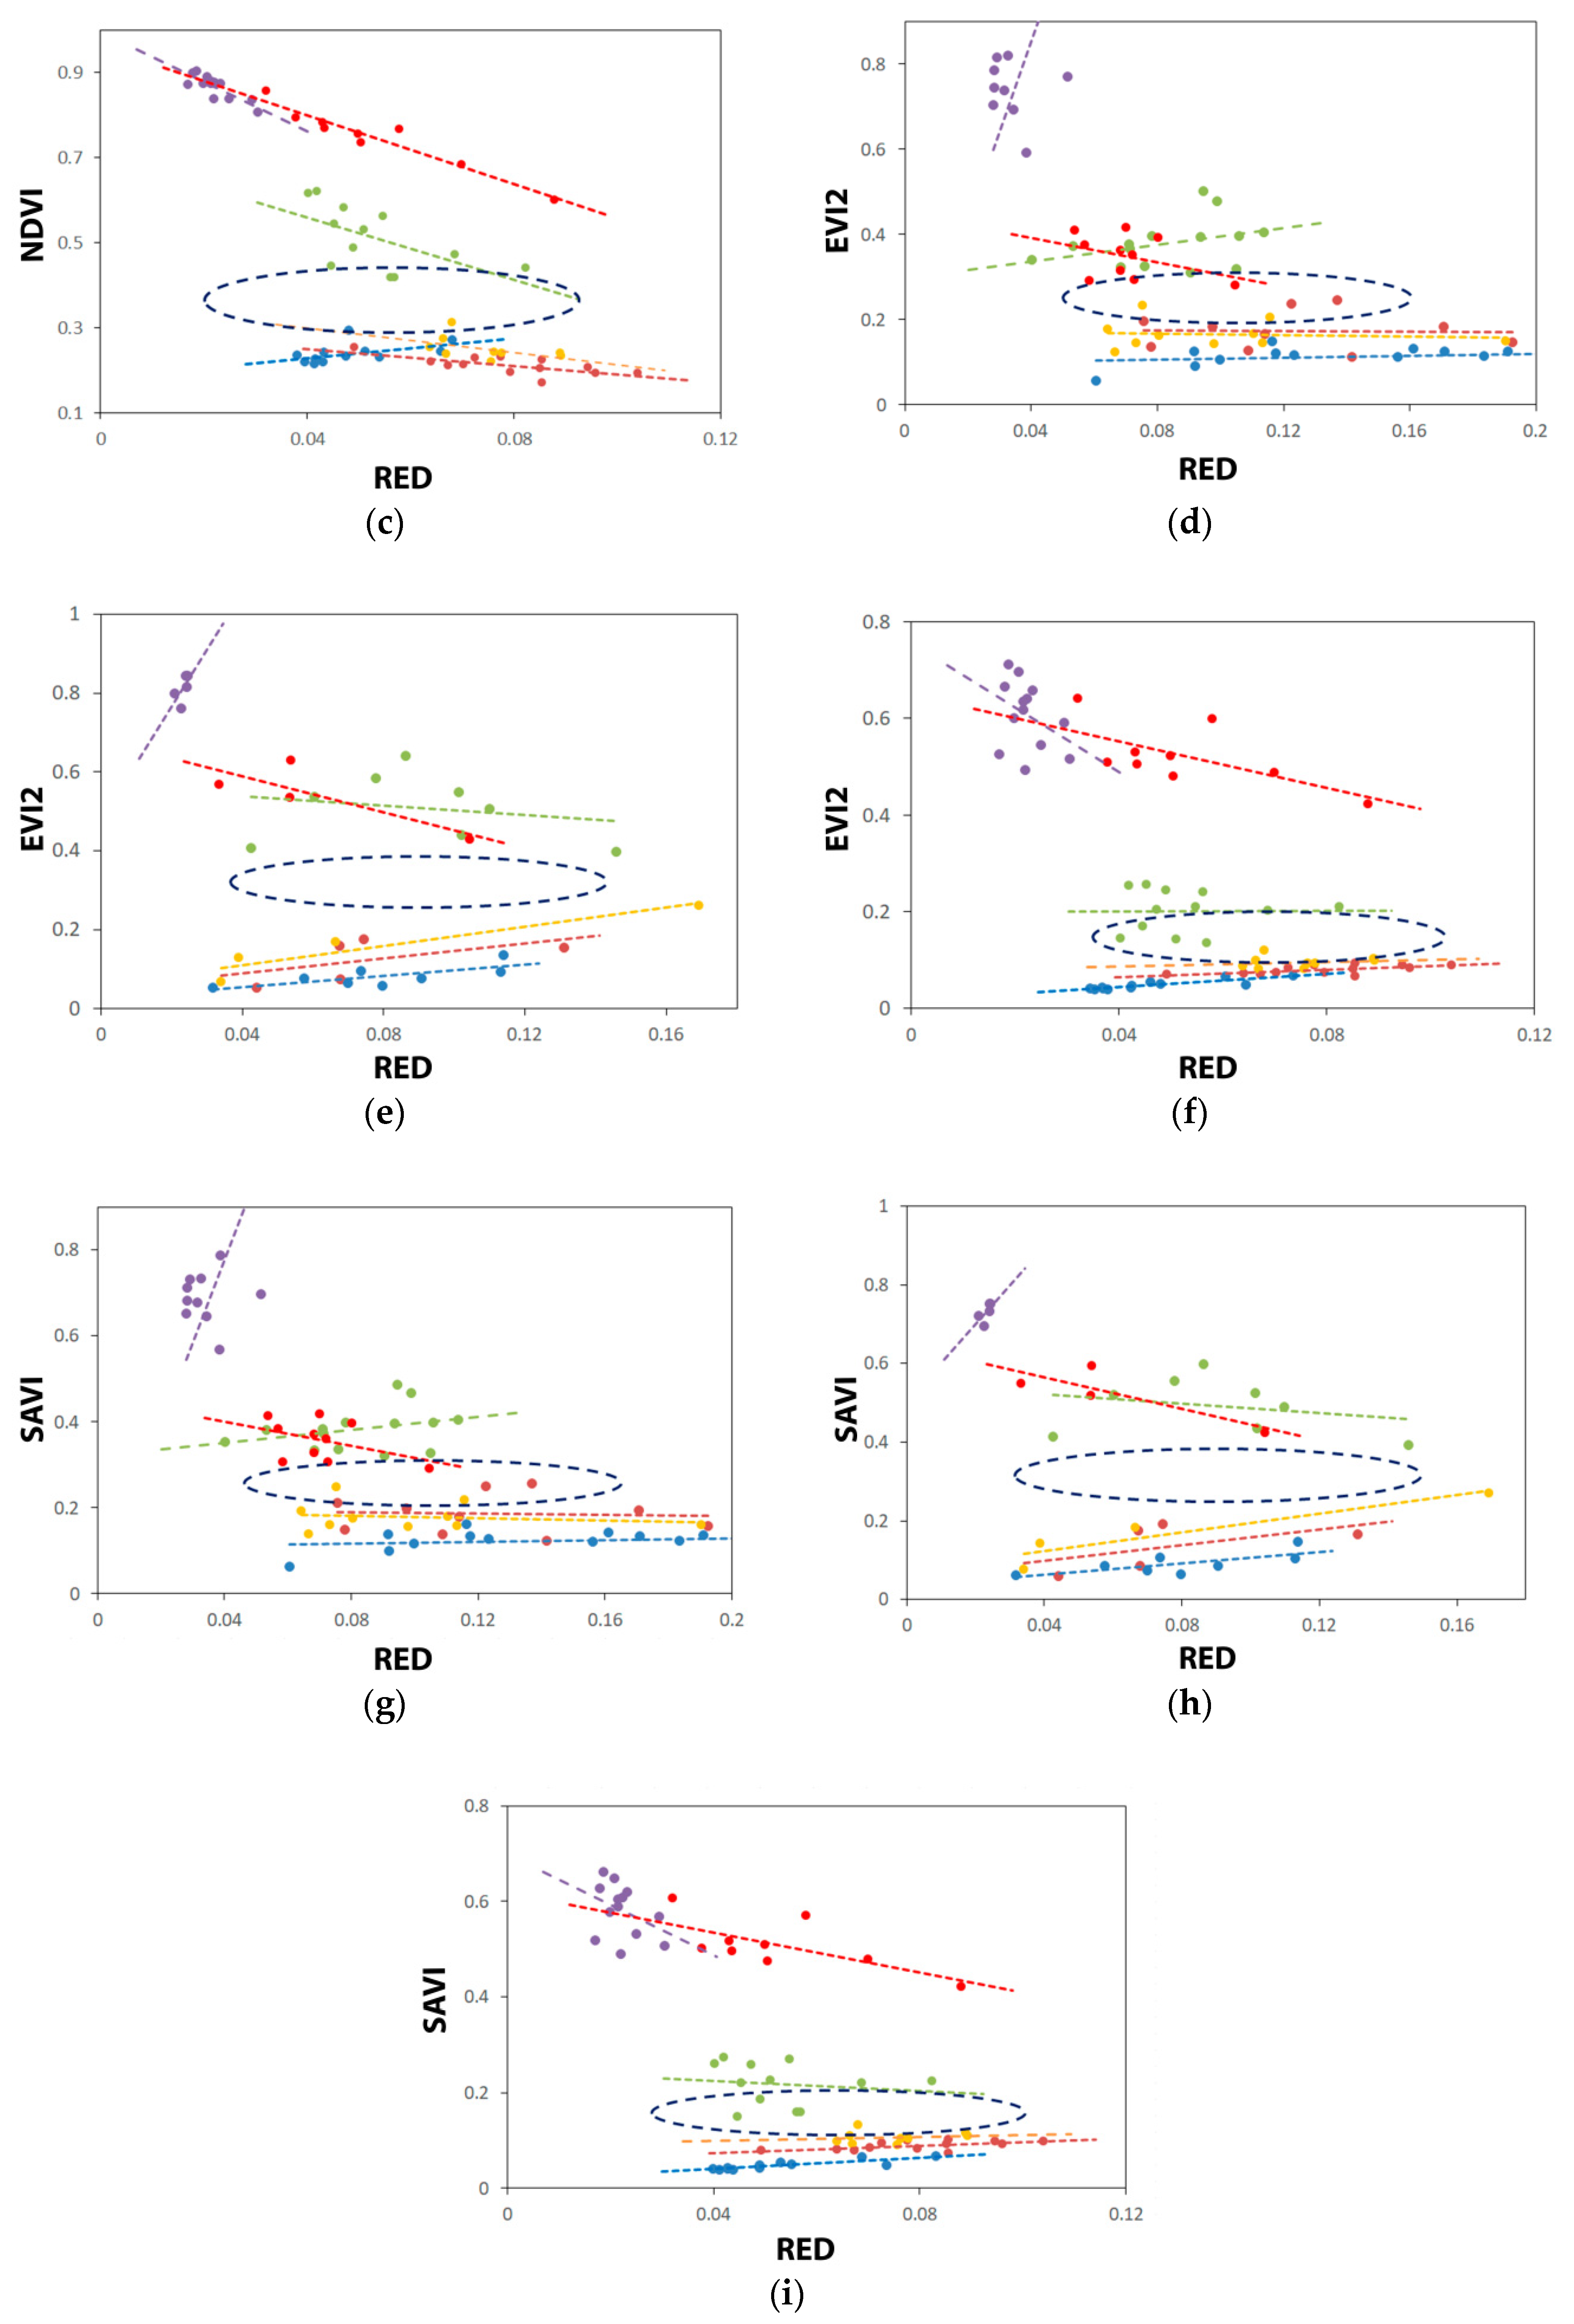
3.4.4. Separability of Winter Wheat Crops Growing on Different Soil Types on the Basis of NDVI, EVI2 and SAVI (Results of Discriminant Analysis)

In the tillering stage, the highest accuracy of the classification (94.1%) was observed in the case of EVI2 calculated using the average reflectance of the winter wheat crop canopy in the near-infrared part of the spectrum and its reflectance in the RedEdge region (Table 3). This combination ensured that 92.9% of the cases with gray forest soils, 87.5% of the cases with alluvial soils, and all the cases with chernozem soils were classified correctly.
In the case of SAVI, the greatest accuracy (91.2%) was also observed for the combination including the reflectance in the RedEdge region. The accuracy for NDVI in this stage of winter wheat development generally stayed in the range of 55–65%.
In the shooting stage, the highest accuracy for EVI2 and SAVI (75%) was registered for the combination using maximum or average reflectance of winter wheat crop canopy in the near-infrared region and its minimum reflectance in the red region (Table 3). These combinations ensured the correct classification of 60% of the cases with gray forest soils, 80% of the cases with alluvial soils and 84.6% of the cases with chernozem soils.
The introduction of the RedEdge region led to a decrease in the classification accuracy for EVI 2 and SAVI by 20–29%.
The greatest classification accuracy for NDVI (57.1%) was observed for the combination using the average reflectance of winter wheat in the near-infrared region and its maximum reflectance in the red region or the reflectance in the RedEdge region.
In the milky ripeness stage, the classification accuracy for NDVI was the highest compared to other stages. It exceeded the accuracy for EVI2 and SAVI when the RedEdge region was used, reaching 82.6%. These combinations ensured that all the cases with gray forest soils and 77.8% of cases with chernozem soils were classified correctly. However, 50% of cases with alluvial soils were assigned wrongly.
The performance of EVI2 and SAVI reached 82.6% for the combinations with maximum and average reflectance of winter wheat crop canopy in the near-infrared region and its average or minimum reflectance in the red part of the spectrum. These combinations (except the av combination for SAVI) ensured the correct classification of 60% of the cases with gray forest soils, 80% of the cases with alluvial soils, and 84.6% of the cases with chernozem soils.
Thus, the magnitude of soil type influence on the vegetation indices of winter wheat crop canopy is so high that they can be used to distinguish between winter wheat crops growing on different soils with the overall accuracy up to 94%, depending on the index and stage of winter wheat development.

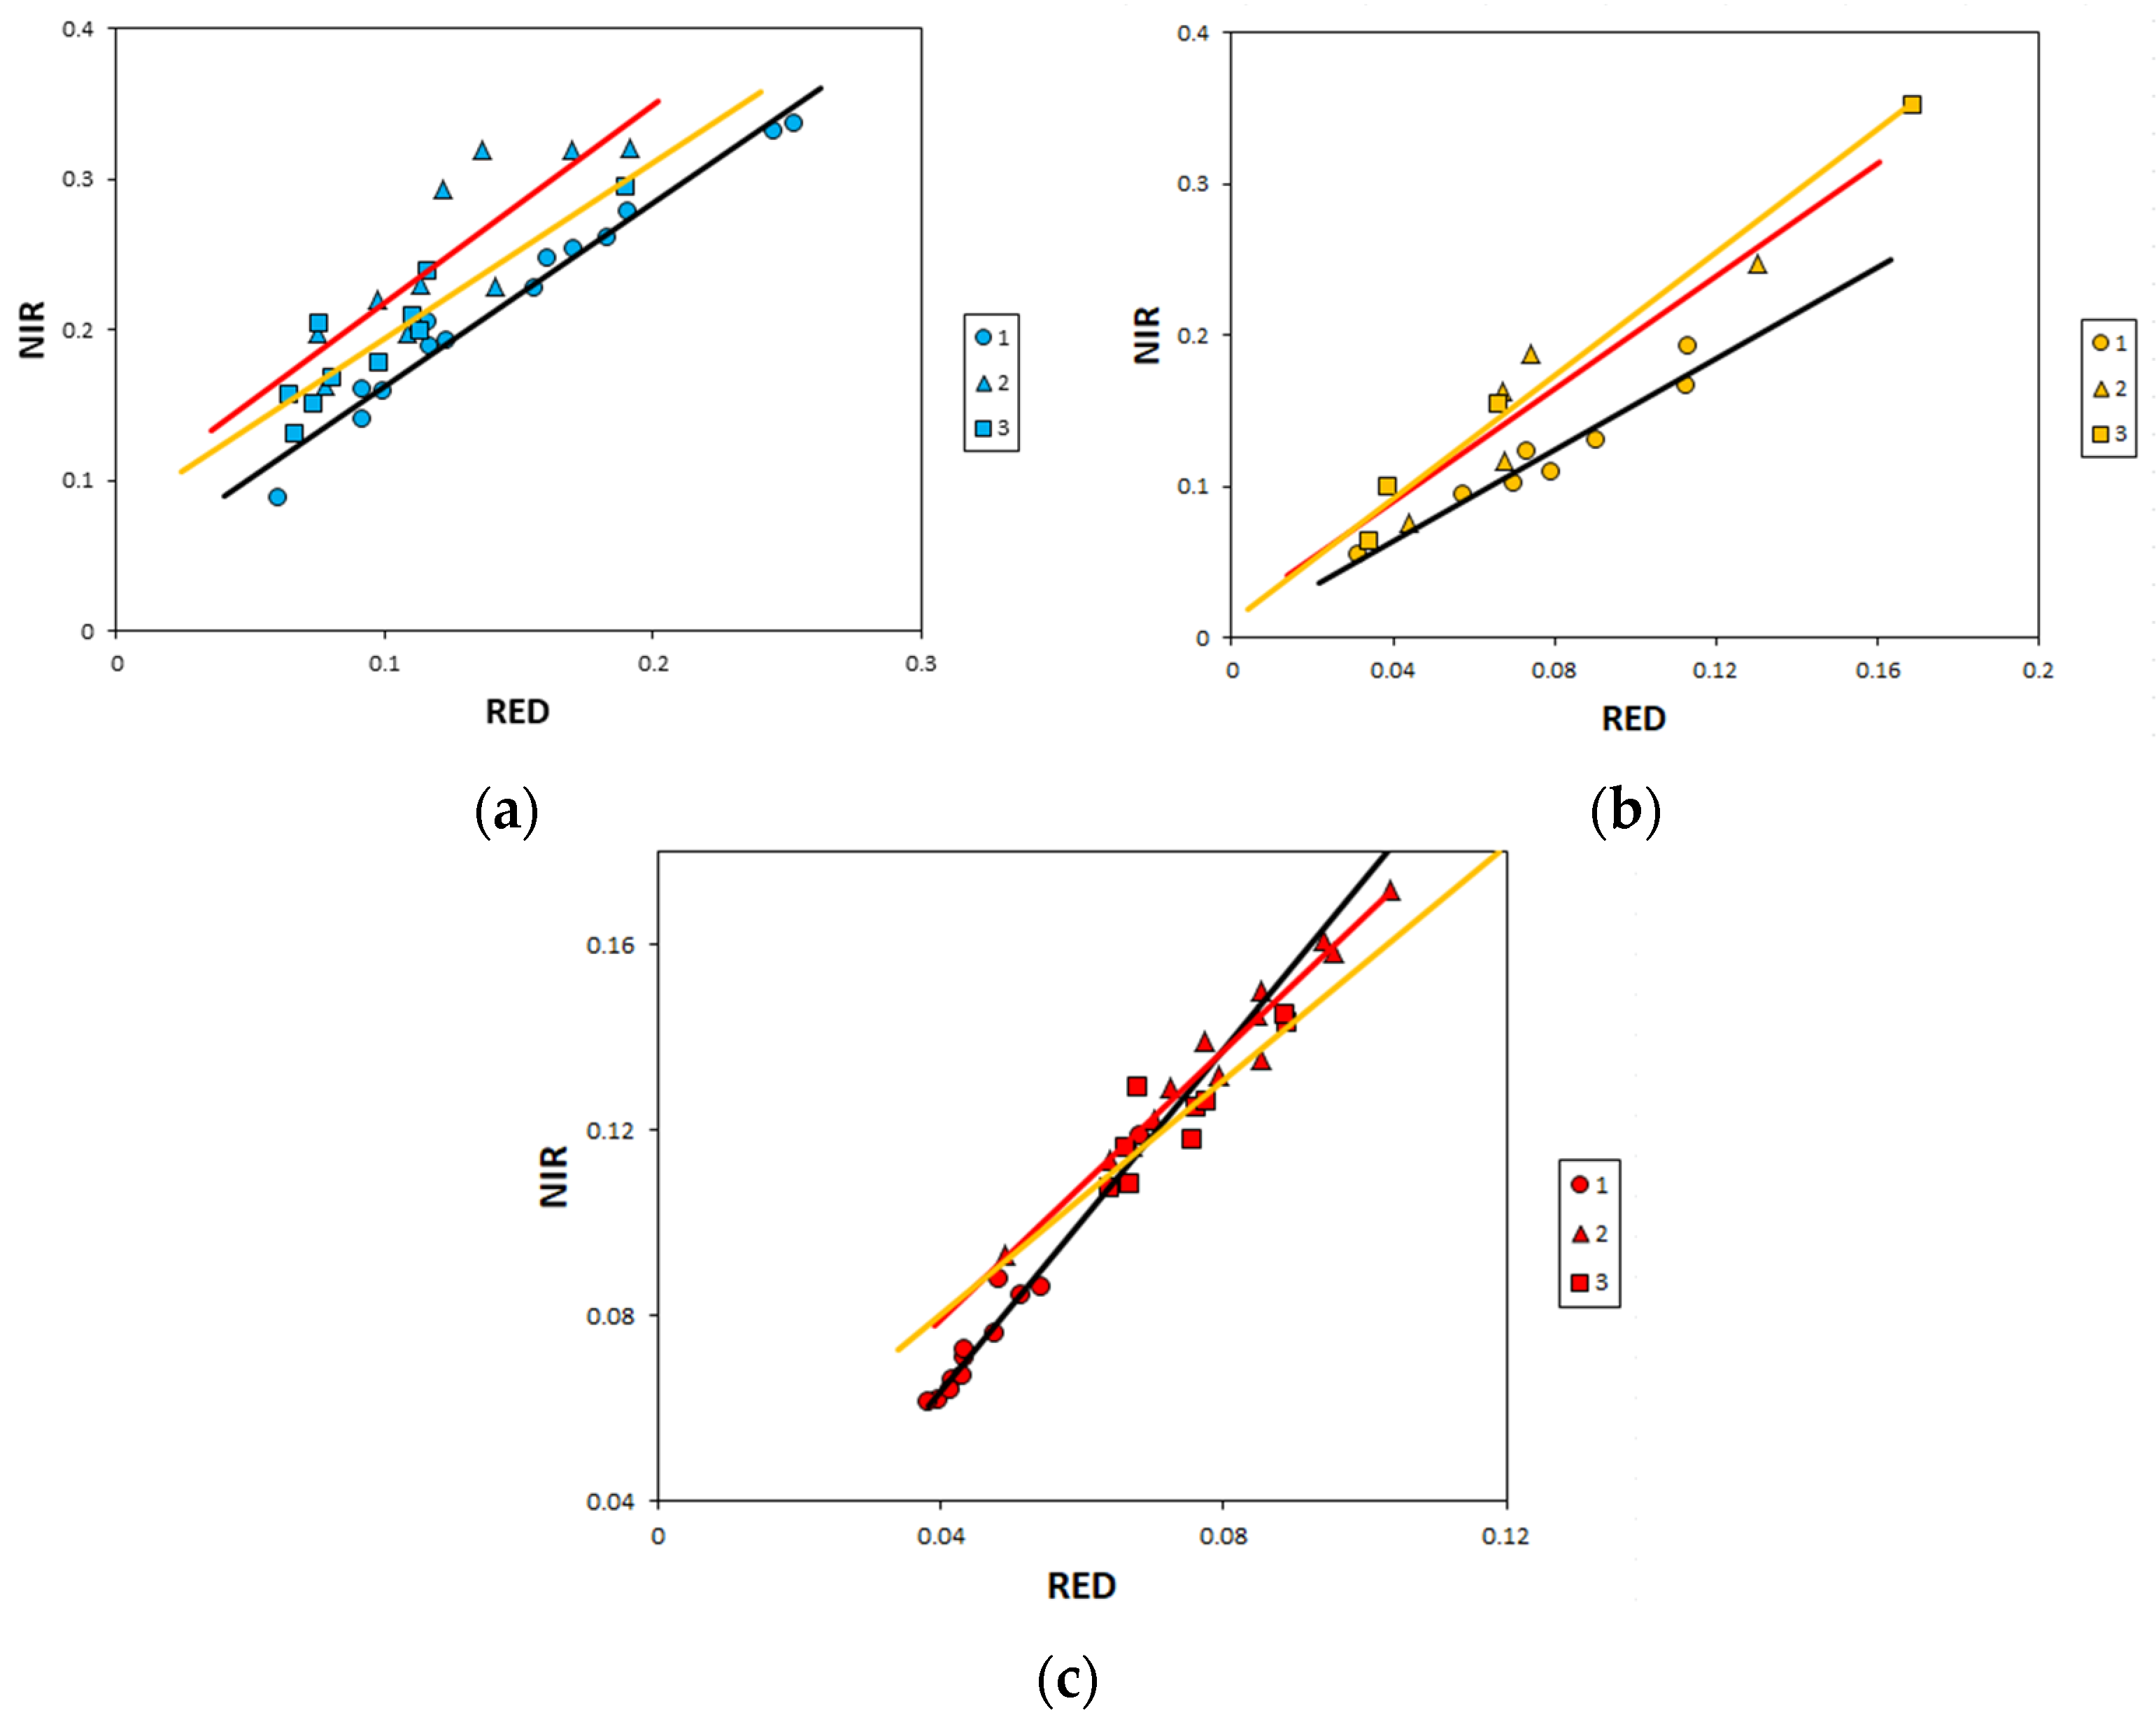
3.5. Effect of Soil Surface State on the Sensitivity of NDVI, EVI2 and SAVI (On the Basis of Field Data on Spectral Reflectance of Winter Wheat Crop Canopy)

The open surface of arable soils behaves differently depending on the time of the survey and the type of soil, which is confirmed by observed changes in the slope and position of the spectra of the open soil surface (Figure 8, Table S11 of Supplementary Materials).
The values of the vegetation indices of the open soil surface increased with the transition from tillering to milky ripeness. In the case of gray forest soil, the lines of the open soil surface in the tillering and shooting stages almost coincided for all of the indices (Figure 8a,d,g).
In the shooting stage, there was quite a large variation in the values of reflectance in the red part of the spectrum and in the values of the indices in the case of gray forest and alluvial soils, which may be due to the within-field variations of the soil characteristics.
The sensitivity of the NDVI to the soil surface state was most pronounced on gray forest soils, where the value of the index of crops in the tillering stage and milky ripeness may coincide with the value of the index for the open surface of the soil. On leached chernozem, NDVI was sensitive to the soil background only in the tillering stage of winter wheat development.
For alluvial soils, vegetation indices showed the least sensitivity to the soil background.
The NDVI sensitivity region for gray forest and alluvial soils lies in the region of 0.4–0.5, while for leached chernozem, this value is 0.3–0.4 (Figure 8a–c).
In the case of EVI2 and SAVI, despite the different slope of the isolines of vegetation and the open surface lines of the studied soils, the situation was the same as in the case of NDVI (Figure 8d–i).
The sensitivity areas of EVI2 and SAVI for gray forest soils lies in the region of 0.2–0.3, whereas for alluvial soils these values are 0.3–0.4, and 0.1–0.2 for leached chernozem.
All indices were insensitive to the soil background when winter wheat was in the shooting phase.

4. Discussion

The application of the linear spectral mixture approach to modeling the spectral reflectance of the crop canopy showed that it can be used only for the visible part of the spectrum. This is in agreement with [26]. The errors in the near-infrared regions were too high to suggest its appropriateness for the analysis of the influence of soil type factor on the vegetation indices. RTM are generally considered to be the most appropriate way to model crop canopy reflectance [14,43,46]. However, their application requires the collection of additional data which is not always possible. Replacement of actual values of required parameters with their constant values can result in significant errors when reproducing spectral reflectance of crop canopy measured in the field.
Observed changes in the soil background contribution to the reflectance of winter wheat crop canopy in red and NIR regions followed the pattern suggested by [34] after their experiments with winter wheat and cotton. As the crop canopy develops, the absorption of light in the red region by vegetation prevails over the reflectance by soil surface. That explains the registered decrease of soil impact in the red region during winter wheat development. The reflectance of crop canopy in the NIR region is overall higher and decrease of soil background impact during the winter wheat development is more pronounced.
It is not only the red and infrared regions that are used in vegetation studies. There are several vegetation indices incorporating different parts of the visible range of the spectrum [65,68,69,70,71]. However, the influence of soil background on the reflectance of crop canopy in the visible region has barely been studied. At the same time, our results show that the soil contribution in the visible part of the spectrum was rather high, especially in the tillering and milky ripeness stages of winter wheat development. This can affect the accuracy of the predictions made on the basis of indices applying information from the visible range. Thus, additional studies are necessary for understanding the soil influence on such indices and to find out the proper ways to correct it.
In contrast to the results acquired by [32,34], we found that NDVI even in case of low vegetation density (tillering stage) was least affected by the soil type factor. While SAVI and EVI2 were found to be greatly influenced by soil background.
SAVI was shown to become more sensitive to soil background (particularly, to changes in soil brightness) with the development of crop canopy [72]. In our case, the influence of soil background in the shooting stage (maximum green biomass) was slightly lower than in the other stages, but still two times higher than in the case of NDVI. As SAVI and EVI2 demonstrated very similar behavior, we believe the same pattern will be observed for other vegetation indices calculated in similar way.
The difference between our and previously published results on the influence of soil background on SAVI and EVI2 is due to the fact that these indices were developed assuming the existence of the global or general soil line. It means that there is one soil line for a large area and its position in NIR-RED space is “fixed”, so the distance from it or angles from it can be used in index calculation to correct for soil background influence.
There have been studies attempting to prove the existence of the global or general soil line. Ref. [73] demonstrated the existence of three unique soil lines depending on soil type, moisture content, and roughness. Ref. [74] reported a general soil line covering the 14 most common soil types in the southeastern Brazil.
At the same time, [75] showed the existence of individual soil lines differing both in slope and intercept for 20 studied soils. Ref. [42] showed for 26 contrasting soil types that the soil type was a major factor in variations of soil lines, proving that the assumption about the existence of global soil line is incorrect.
We strongly agree with [42] that each soil has a unique soil line. Which means that existing indices based on the global soil line will fail to correct soil background influence when monitored crops grow on different (contrasting) soils. This conclusion is supported by our results.
Additionally, [76] demonstrated that the application of global soil line in vegetation studies leads to the errors in the estimation of biophysical parameters on the basis of vegetation indices. Parameters of the soil lines were also shown to change with organic matter content or soil texture [31].
Despite the importance of this issue, there have been very few studies attempting to deal with this problem. Ref. [14] showed with hyperspectral data that soil lines derived on the basis of different spectral regions can be successfully used to calculate soil line-based vegetation indices that are well correlated with the LAI of the studied vegetation. The impact of two soil types was considered in this study (“light” and “dark”). Their results demonstrated that in case of dark soils, the effect of the soil is less than in the case of light soils. This coincided with our findings on the lower contribution of chernozem soils with high organic matter content to the reflectance of the winter wheat crop canopy compared to the contribution of gray forest soils with lower organic matter content and the greater impact of mineralogical composition.
The most recent study proposes a new soil line replacing red band with red-swir band [33]. The obtained results are very promising. However, as the authors used MODIS data with spectral resolution of the swir-band of 500 m, we believe that field studies are necessary to fully understand the real performance of the suggested approach.
Therefore, as the high influence of soil type factor on SAVI and EVI2 is due to the way they are calculated, we believe that similar situation will be observed in cases of other crops that are biologically similar to winter wheat, while the size of the influence will differ depending mainly on the properties of the soil background.
For our research, we chose 3 contrasting soil types. However, soil type is a classification unit, being, to a certain extent, an integral characteristic of the soil. Its geographical boundaries usually do not coincide with the geographical boundaries of soil properties, variations of which affect the reflectance curve shape, and position of extremes. While it is common practice to consider soil type as a source of soil secondary variations in studying the impact of soil on vegetation indices, we think that future research should be focused on the way in which certain soil properties affect soil line parameters and the contribution of soil background to the spectral reflectance of crop canopy.
Most studies developing and testing the minimization of soil impact on vegetation indices do not consider temporal dynamics of soil surface. For example, [70] used the reflectance of 20 trays of different sieved soils in dry and wet state, studying soil spectral effects on 4-space vegetation discrimination. Ref. [33] used soil spectra of different soil types selected from several spectral libraries. [35] used variations in soil line parameters to develop TSAVI. However, the transformation of the open soil surface of arable lands is not a simple process of change in moisture content or in surface roughness. It results in the formation of a surface layer with different properties (organic matter content, texture, porosity, mineralogical composition) [49] and spectral reflectance [50,51]. We observed increased scattering of soil surface reflectance values in NIR-Red spectral space at the shooting and milky ripeness stages. This means that soil spectral data acquired at different spectral dates should not be used to derive soil line parameters when calculating soil line-based vegetation indices due to temporal soil line dynamics.
Our findings showed that the dynamics of the surface of arable soil not only affects the contribution of the soil to the spectral reflectance of the winter wheat crop canopy in certain parts of the spectrum, but it is also accompanied by a change in the values of vegetation indices for the soil in such a way that they become close to the values of the vegetation indices for winter wheat crops at certain stages of their development. We believe that while the sensitivity range may vary, general situation will be very similar for other crops.
The way we assessed the sensitivity of vegetation indices is not common, as it is usually estimated in terms of the ability of vegetation indices to reflect the changes in crop characteristics [14,33,43]. We estimated the extent to which the values of the vegetation indices of crops at different stages of their development differ from the values of the vegetation indices for the open soil surface in different states. Sensitivity range is the value range at which soil can be mixed up with the crop canopy. This can be crucial when we use vegetation indices to assess biophysical parameters such as LAI, for example. Additional research is necessary to determine how exactly this sensitivity range influences vegetation index sensitivity to crop characteristics. Ref. [32], in a study with grass and cotton, found that only NDVI was sensitive to changes in the spectral reflectance of soil surface in the red region, while SAVI was independent. Our findings show that SAVI and EVI2 demonstrated independence only on gray forest soils at the tillering stage of winter wheat development, proving that they do not account for soil surface dynamics.
In addition, under certain conditions, a biological crust can form on the soil surface, the presence of which will modify the reflectance of soil surface affecting its contribution to the reflectance of crop canopy. The impact of biological soil crust on the reflectance of crop canopy has not yet been studied or acknowledged.
Our research shows that the simplification of soil background influence to brightness variations leads to the underestimation of soil impact on the reflectance of crop canopy and vegetation indices calculated for crop monitoring. Given the variability of the soil, the use of a universal vegetation index is hardly possible. Vegetation indices should be adapted to local soil conditions. The information about soil characteristics should undoubtedly be a part of crop monitoring systems at all levels. However, substantial research is necessary to lay the foundation for this.

5. Conclusions

The effect of soil background on the spectral reflectance of the winter wheat crop canopy was most pronounced in the 350–500 and 620–690 nm regions of the visible range. In the shooting phase, the contribution of soil prevailed in the 620–690 nm region of the spectrum, and, in the phase of milky ripeness, in the 350–500 nm region. The minimum contribution at all stages of winter wheat development was observed after 750 nm. The degree of soil influence was different for different soil types.
As for the vegetation indices, NDVI was found to be the least affected by soil type factor. The smallest impact was noted in the shooting phase, except for cases where the red region was replaced with RedEdge. In the phase of milky ripeness, the influence of soil on the NDVI of crops increased. The effect of soil type on SAVI and EVI2 was approximately the same and varied from 60% (shooting phase) to 80% (tillering phase). When replacing the red part of the spectrum with RedEdge in the shooting phase, the influence of the soil type factor decreased to 40%.
According to the discriminant analysis, the ability of vegetation indices calculated for winter wheat crop canopy to distinguish between winter wheat crops growing on different soil types changed from the classification accuracy of 94.1% (EVI2) in the tillering stage to 75% (EVI2 and SAVI) in the shooting stage to 82.6% in the milky ripeness stage (EVI2, SAVI, NDVI).
The range of sensitivity of vegetation indices to the soil background changed depending on soil type. The indices showed the greatest sensitivity on the gray forest soil when the crops were in the phase of milky ripeness and on the leached chernozem when the winter wheat crops were in the tillering phase.
While the exact results obtained are valid only for the analyzed soil types and winter wheat crops, the general patterns identified (large influence of soil type factor on SAVI and EVI, spectral regions of highest soil influence) will be common to crops biologically similar to winter wheat. There may be some differences in the influence of soil background on the reflectance of crop canopy when other winter wheat varieties are concerned. However, this is a subject for further research.
The observed behavior can be used to develop indices, invariant to secondary variations caused by soil type factor, which can be applied for the remote assessment of the state of winter wheat crops growing on different soils.

Supplementary Materials

The following are available online at https://0-www-mdpi-com.brum.beds.ac.uk/2072-4292/11/16/1932/s1, Table S1: Spectral reflectance of winter wheat crop canopy in Red, Red Edge and NIR regions of spectrum, Table S2: NDVI values for winter wheat crop canopy, Table S3: EVI2 values for winter wheat crop canopy, Table S4: SAVI values for winter wheat crop canopy, Table S5: Influence of soil type factor on values of vegetation indices of winter wheat crop canopy at tillering stage (ANOVA results, supporting Figure 7a of original manuscript), Table S6: Influence of soil type factor on values of vegetation indices of winter wheat crop canopy at shooting stage (ANOVA results, supporting Figure 7b of original manuscript), Table S7: Influence of soil type factor on values of vegetation indices of winter wheat crop canopy at milky ripeness stage (ANOVA results, supporting Figure 7c of original manuscript), Table S8: Results of post hoc analysis for tillering stage: multiple comparisons using Sheffe criterion (ANOVA results, supporting Section 3.4.1. of original manuscript), Table S9: Results of post hoc analysis for shooting stage: multiple comparisons using Sheffe criterion (ANOVA results, supporting Section 3.4.2. of original manuscript), Table S10: Results of post hoc analysis for milky ripeness stage: multiple comparisons using Sheffe criterion (ANOVA results, supporting Section 3.4.3. of original manuscript), Table S11: Average values of soil reflectance in red part of spectrum and vegetation indicies (presented data on soil was used to create Figure 8 of original manuscript).

Author Contributions

Conceptualization, I.S.; methodology, I.S. and E.P.; validation, G.V., P.G., E.S. and D.S.; formal analysis, E.P., P.G., G.V. and E.S.; investigation, G.V., P.G., E.S. and D.S.; resources, I.S. and D.S.; data curation, E.S.; writing—original draft preparation, E.P.; writing—review and editing, E.P. and I.S.; visualization, E.P.; supervision, I.S.; project administration, I.S.; funding acquisition, I.S.

Funding

The publication has been prepared with the support of the «RUDN University Program 5-100», and RFBR research project No. 18-016-00052.

Conflicts of Interest

The authors declare no conflict of interest. The funders had no role in the design of the study; in the collection, analyses, or interpretation of data; in the writing of the manuscript, or in the decision to publish the results.

References

  1. Becker-Reshef, I.; Justice, C.; Sullivan, M.; Vermote, E.; Tucker, C.; Anyamba, A.; Small, J.; Pak, E.; Masuoka, E.; Schmaltz, J.; et al. Monitoring global croplands with coarse resolution earth observations: The global agriculture monitoring (GLAM) project. Remote Sens. 2010, 2, 1589–1609. [Google Scholar] [CrossRef]
  2. Loupian, E.A.; Savin, I.Y.; Bartalev, S.A.; Tolpin, V.A.; Balashov, I.V.; Plotnikov, D.E. Sputnikovyi servis monitoringa sostoyaniya rastitel’nosti (“VEGA”) (Satellite Service for Vegetation Monitoring VEGA). Sovrem. Probl. D. Zond. Zemli Kosmosa 2011, 8, 190–198. [Google Scholar]
  3. Eerens, H.; Piccard, I.; Royer, A.; Orlandi, S.; Genovese, G. Methodology of the MARS crop yield forecasting system. Remote Sens. Inf. Data Proc. Anal. 2004, 3, 53–56. [Google Scholar]
  4. Atzberger, C. Advances in remote sensing of agriculture: Context description, existing operational monitoring systems and major information needs. Remote Sens. 2013, 5, 949–981. [Google Scholar] [CrossRef]
  5. Wu, B.; Meng, J.; Li, Q.; Yan, N.; Du, X.; Zhang, M. Remote sensing-based global crop monitoring: Experiences with China’s CropWatch system. Int. J. Dig. Earth 2014, 7, 113–137. [Google Scholar] [CrossRef]
  6. Rembold, F.; Atzberger, C.; Savin, I.; Rojas, O. Using low resolution satellite imagery for yield prediction and yield anomaly detection. Remote Sens. 2013, 5, 1704–1733. [Google Scholar] [CrossRef]
  7. Savin, I. Crop yield prediction with SPOT VGT in Mediterranean and Central Asian countries. In Proceedings of the ISPRS WG VIII/10 Workshop, Remote Sensing Support to Crop Yield Forecast and Area Estimates, Stresa, Italy, 30 November–1 December 2006; Volume 30, p. 129134. [Google Scholar]
  8. Savin, I.Y.; Bartalev, S.A.; Loupian, E.A.; Tolpin, V.A.; Khvostikov, S.A. Crop yield forecasting based on satellite data: Opportunities and perspectives. Sovrem. Probl. D. Zond. Zemli Kosmosa 2010, 7, 275–285. [Google Scholar]
  9. Lesk, C.; Rowhani, P.; Ramankutty, N. Influence of extreme weather disasters on global crop production. Nature 2016, 529, 84–87. [Google Scholar] [CrossRef]
  10. Baret, F.; Buis, S. Estimating canopy characteristics from remote sensing observations: Review of methods and associated problems. In Advances in Land Remote Sensing; Springer: Dordrecht, The Netherlands, 2008; pp. 173–201. [Google Scholar]
  11. Kimes, D.S.; Knyazikhin, Y.; Privette, J.L.; Abuelgasim, A.A.; Gao, F. Inversion methods for physically-based models. Remote Sens. Rev. 2000, 18, 381–439. [Google Scholar] [CrossRef]
  12. Dorigo, W.A.; Zurita-Milla, R.; de Wit, A.J.; Brazile, J.; Singh, R.; Schaepman, M.E. A review on reflective remote sensing and data assimilation techniques for enhanced agroecosystem modeling. Int. J. Appl. Earth Observ. Geoinf. 2007, 9, 165–193. [Google Scholar] [CrossRef]
  13. Haboudane, D.; Miller, J.R.; Pattey, E.; Zarco-Tejada, P.J.; Strachan, I.B. Hyperspectral vegetation indices and novel algorithms for predicting green LAI of crop canopies: Modeling and validation in the context of precision agriculture. Remote Sens. Environ. 2004, 90, 337–352. [Google Scholar] [CrossRef]
  14. Darvishzadeh, R.; Skidmore, A.; Atzberger, C.; van Wieren, S. Estimation of vegetation LAI from hyperspectral reflectance data: Effects of soil type and plant architecture. Int. J. Appl. Earth Observ. Geoinf. 2008, 10, 358–373. [Google Scholar] [CrossRef]
  15. Jacquemoud, S.; Baret, F. Prospect: A model of leaf optical properties spectra. Remote Sens. Environ. 1990, 34, 75–91. [Google Scholar] [CrossRef]
  16. Combal, B.; Baret, F.; Weiss, M.; Trubuil, A.; Mace, D.; Pragnere, A.; Myneni, R.; Knyazikhin, Y.; Wang, L. Retrieval of canopy biophysical variables from bidirectional reflectance: Using prior information to solve the ill-posed inverse problem. Remote Sens. Environ. 2003, 84, 1–15. [Google Scholar] [CrossRef]
  17. Meroni, M.; Colombo, R.; Panigada, C. Inversion of a radiative transfer model with hyperspectral observations for LAI mapping in poplar plantations. Remote Sens. Environ. 2004, 92, 195–206. [Google Scholar] [CrossRef]
  18. Maes, W.H.; Steppe, K. Perspectives for remote sensing with unmanned aerial vehicles in precision agriculture. Trends Plant Sci. 2019, 24, 152–164. [Google Scholar] [CrossRef]
  19. Zhang, J.; Han, W.; Huang, L.; Zhang, Z.; Ma, Y.; Hu, Y. Leaf chlorophyll content estimation of winter wheat based on visible and near-infrared sensors. Sensors 2016, 16, 437. [Google Scholar] [CrossRef]
  20. Zarco-Tejada, P.J.; González-Dugo, M.V.; Fereres, E. Seasonal stability of chlorophyll fluorescence quantified from airborne hyperspectral imagery as an indicator of net photosynthesis in the context of precision agriculture. Remote Sens. Environ. 2016, 179, 89–103. [Google Scholar] [CrossRef]
  21. Feng, W.; Zhang, H.-Y.; Zhang, Y.-S.; Qi, S.-L.; Heng, Y.-R.; Guo, B.-B.; Ma, D.-Y.; Guo, T.-C. Remote detection of canopy leaf nitrogen concentration in winter wheat by using water resistance vegetation indices from in-situ hyperspectral data. Field Crops Res. 2016, 198, 238–246. [Google Scholar] [CrossRef]
  22. Carlson, T.N.; Ripley, D.A. On the relation between NDVI, fractional vegetation cover, and leaf area index. Remote Sens. Environ. 1997, 62, 241–252. [Google Scholar] [CrossRef]
  23. Camino, C.; González-Dugo, V.; Hernández, P.; Sillero, J.C.; Zarco-Tejada, P.J. Improved nitrogen retrievals with airborne-derived fluorescence and plant traits quantified from VNIR-SWIR hyperspectral imagery in the context of precision agriculture. Int. J. Appl. Earth Observ. Geoinf. 2018, 70, 105–117. [Google Scholar] [CrossRef]
  24. Bogue, R. Sensors key to advances in precision agriculture. Sens. Rev. 2017, 37, 1–6. [Google Scholar] [CrossRef]
  25. Bégué, A.; Arvor, D.; Bellon, B.; Betbeder, J.; de Abelleyra, D.; Ferraz, R.P.D.; Lebourgeois, V.; Lelong, C.; Simões, M.; Verón, S.R. Remote sensing and cropping practices: A review. Remote Sens. 2018, 10, 99. [Google Scholar] [CrossRef]
  26. Drake, N.A.; Mackin, S.; Settle, J.J. Mapping vegetation, soils, and geology in Semiarid shrublands using spectral matching and mixture modeling of SWIR AVIRIS imagery. Remote Sens. Environ. 1999, 68, 12–25. [Google Scholar] [CrossRef]
  27. Nocita, M.; Stevens, A.; van Wesemael, B.; Aitkenhead, M.; Bachmann, M.; Barthès, B.; Ben Dor, E.; Brown, D.J.; Clairotte, M.; Csorba, A.; et al. Soil spectroscopy: An alternative to wet chemistry for soil monitoring. In Advances in Agronomy; Elsevier: Amsterdam, The Netherlands, 2015; Volume 132, pp. 139–159. ISBN 978-0-12-802135-4. [Google Scholar]
  28. Forkuor, G.; Hounkpatin, O.K.L.; Welp, G.; Thiel, M. High resolution mapping of soil properties using remote sensing variables in south-western Burkina Faso: A comparison of machine learning and multiple linear regression models. PLoS ONE 2017, 12, e0170478. [Google Scholar] [CrossRef]
  29. Pinheiro, É.; Ceddia, M.; Clingensmith, C.; Grunwald, S.; Vasques, G. Prediction of soil physical and chemical properties by visible and near-infrared diffuse reflectance spectroscopy in the Central Amazon. Remote Sens. 2017, 9, 293. [Google Scholar] [CrossRef]
  30. Wijewardane, N.K.; Ge, Y.; Morgan, C.L.S. Moisture insensitive prediction of soil properties from VNIR reflectance spectra based on external parameter orthogonalization. Geoderma 2016, 267, 92–101. [Google Scholar] [CrossRef] [Green Version]
  31. Prudnikova, E.Y.; Savin, I.Y. The possibilities of soil line concept application for the detection of soil properties. In Global Soil Map-Digital Soil Mapping from Country to Globe; CRC Press: Boca Raton, FL, USA, 2017; pp. 97–101. [Google Scholar]
  32. Huete, A.R. A soil-adjusted vegetation index (SAVI). Remote Sens. Environ. 1988, 25, 295–309. [Google Scholar] [CrossRef]
  33. Chen, X.; Guo, Z.; Chen, J.; Yang, W.; Yao, Y.; Zhang, C.; Cui, X.; Cao, X. Replacing the red band with the red-SWIR band (0.74ρred + 0.26ρswir) can reduce the sensitivity of vegetation indices to soil background. Remote Sens. 2019, 11, 851. [Google Scholar] [CrossRef]
  34. Jackson, R.D.; Huete, A.R. Interpreting vegetation indices. Prev. Vet. Med. 1991, 11, 185–200. [Google Scholar] [CrossRef]
  35. Baret, F.; Guyot, G.; Major, D.J. TSAVI: A vegetation index which minimizes soil brightness effects on LAI and APAR estimation. In Proceedings of the 12th Canadian Symposium on Remote Sensing Geoscience and Remote Sensing Symposium, IEEE, Vancouver, BC, Canada, 10–14 July 1989; Volume 3, pp. 1355–1358. [Google Scholar]
  36. Jiang, Z.; Huete, A.; Didan, K.; Miura, T. Development of a two-band enhanced vegetation index without a blue band. Remote Sens. Environ. 2008, 112, 3833–3845. [Google Scholar] [CrossRef]
  37. Kauth, R.J.; Thomas, G.S. The tasselled cap--a graphic description of the spectral-temporal development of agricultural crops as seen by Landsat. In Proceedings of the LARS symposia, West Lafayette, Indiana, 29 June–1 July 1976; p. 159. [Google Scholar]
  38. Richardson, A.J.; Wiegand, C.L. Distinguishing vegetation from soil background information. Photogramm. Eng. Remote Sens. 1977, 43, 1541–1552. [Google Scholar]
  39. Qi, J.; Chehbouni, A.; Huete, A.R.; Kerr, Y.H.; Sorooshian, S. A modified soil adjusted vegetation index. Remote Sens. Environ. 1994, 48, 119–126. [Google Scholar] [CrossRef]
  40. Baret, F.; Guyot, G. Potentials and limits of vegetation indices for LAI and APAR assessment. Remote Sens. Environ. 1991, 35, 161–173. [Google Scholar] [CrossRef]
  41. Huete, A.; Justice, C.; Liu, H. Development of vegetation and soil indices for MODIS-EOS. Remote Sens. Environ. 1994, 49, 224–234. [Google Scholar] [CrossRef]
  42. Baret, F.; Jacquemoud, S.; Hanocq, J.F. The soil line concept in remote sensing. Remote Sens. Rev. 1993, 7, 65–82. [Google Scholar] [CrossRef]
  43. Atzberger, C.; Jarmer, T.; Schlerf, M.; Kötz, B.; Werner, W. Retrieval of wheat bio-physical attributes from hyperspectral data and SAILH + PROSPECT radiative transfer model. In Proceedings of the 3rd EARSeL Workshop on imaging spectroscopy, Herrsching, Germany, 13–16 May 2003; pp. 473–482. [Google Scholar]
  44. Atzberger, C. Inverting the PROSAIL canopy reflectance model using neural nets trained on streamlined databases. J. Spectr. Imag. 2010, 1, a2. [Google Scholar] [CrossRef]
  45. Machwitz, M.; Giustarini, L.; Bossung, C.; Frantz, D.; Schlerf, M.; Lilienthal, H.; Wandera, L.; Matgen, P.; Hoffmann, L.; Udelhoven, T. Enhanced biomass prediction by assimilating satellite data into a crop growth model. Environ. Modell. Softw. 2014, 62, 437–453. [Google Scholar] [CrossRef]
  46. Duan, S.-B.; Li, Z.-L.; Wu, H.; Tang, B.-H.; Ma, L.; Zhao, E.; Li, C. Inversion of the PROSAIL model to estimate leaf area index of maize, potato, and sunflower fields from unmanned aerial vehicle hyperspectral data. Int. J. Appl. Earth Observ. Geoinf. 2014, 26, 12–20. [Google Scholar] [CrossRef]
  47. Darvishzadeh, R.; Matkan, A.A.; Ahangar, A.D. Inversion of a radiative transfer model for estimation of rice canopy chlorophyll content using a lookup-table approach. IEEE J. Select. Topics Applied Earth Observ. Remote Sens. 2012, 5, 1222–1230. [Google Scholar] [CrossRef]
  48. Prudnikova, E.Y.; Savin, I.Y. Study of the optical properties of an exposed soil surface. J. Opt. Technol. 2016, 83, 642. [Google Scholar] [CrossRef]
  49. Vindeker, G.V.; Prudnikova, E.Y.; Savin, I.Y. Transformation of open soil surface under the impact of rainfall in model experiment. Dokuchaev Soil Bull. 2018, 95, 23–40. [Google Scholar] [CrossRef]
  50. Eshel, G.; Levy, G.J.; Singer, M.J. Spectral reflectance properties of crusted soils under solar illumination. Soil Sci. Soc. Am. J. 2004, 68, 1982. [Google Scholar] [CrossRef]
  51. Ben-Dor, E.; Goldlshleger, N.; Benyamini, Y.; Agassi, M.; Blumberg, D.G. The spectral reflectance Properties of soil structural crusts in the 1.2- to 2.5-μm spectral region. Soil Sci. Soc. Am. J. 2003, 67, 289. [Google Scholar] [CrossRef]
  52. Prudnikova, E.; Savin, I. Effect of open soil surface patterns on soil detectability based on optical remote sensing data. Proceedings 2018, 2, 357. [Google Scholar] [CrossRef]
  53. IUSS Working Group WRB. World reference base for soil resources 2014: International soil classification system for naming soils and creating legends for soil maps. Update 2015. World Soil Resour. Rep. 2015, 106, 188. [Google Scholar]
  54. Savin, I.Y.; Dokukin, P.A.; Verniuk, Y.I.; Zhogolev, A.V. About the influence of weeds on spring barley NDVI determined from MODIS satellite data. Sovr. Probl. DZZ Kosm. 2017, 14, 185–195. [Google Scholar] [CrossRef]
  55. De Wit, A.; Roerink, G.; Bartalev, S.; Virchenko, O.; Plotnikov, D.; Savin, I.; Kleschenko, A. A dataset of spectral and biophysical measurements over Russian wheat fields. Open Data J. Agric. Res. 2018, 4, 22–27. [Google Scholar] [CrossRef]
  56. Demarez, V.; Duthoit, S.; Baret, F.; Weiss, M.; Dedieu, G. Estimation of leaf area and clumping indexes of crops with hemispherical photographs. Agric. Forest Meteorol. 2008, 148, 644–655. [Google Scholar] [CrossRef] [Green Version]
  57. Stevens, A.; Ramirez-Lopez, L.; Stevens, M.A.; Rcpp, L. Package ‘Prospectr’. Technical Report. 2015. Available online: ftp://rm.mirror.garr.it/mirrors/CRAN/web/packages/prospectr/prospectr.pdf (accessed on 19 August 2019).
  58. Bioucas-Dias, J.M.; Plaza, A.; Dobigeon, N.; Parente, M.; Du, Q.; Gader, P.; Chanussot, J. Hyperspectral unmixing overview: Geometrical, statistical, and sparse regression-based approaches. IEEE J. Sel. Top. Appl. Earth Observ. Remote Sens. 2012, 5, 354–379. [Google Scholar] [CrossRef]
  59. Adams, J.B.; Smith, M.O.; Johnson, P.E. Spectral mixture modeling: A new analysis of rock and soil types at the Viking Lander 1 Site. J. Geophys. Res. 1986, 91, 8098. [Google Scholar] [CrossRef]
  60. Deering, D.W. Rangeland Reflectance Characteristics Measured by Aircraft and Spacecraft Sensors. Ph.D. Thesis, Texas A&M Universtiy, College Station, TX, USA, 1978. [Google Scholar]
  61. Huete, A.; Didan, K.; Miura, T.; Rodriguez, E.P.; Gao, X.; Ferreira, L.G. Overview of the radiometric and biophysical performance of the MODIS vegetation indices. Remote Sens. Environ. 2002, 83, 195–213. [Google Scholar] [CrossRef]
  62. Lee, K.-S.; Cohen, W.B.; Kennedy, R.E.; Maiersperger, T.K.; Gower, S.T. Hyperspectral versus multispectral data for estimating leaf area index in four different biomes. Remote Sens. Environ. 2004, 91, 508–520. [Google Scholar] [CrossRef]
  63. Sharma, L.K. Evaluation of Active Optical Ground-Based Sensors to Detect Early Nitrogen Deficiencies in Corn. Ph.D. Thesis, North Dakota State University, Fargo, ND, USA, April 2014. [Google Scholar]
  64. Dash, J.; Curran, P.J. The MERIS terrestrial chlorophyll index. International Journal of Remote Sensing 2004, 25, 5403–5413. [Google Scholar] [CrossRef]
  65. Xie, Q.; Dash, J.; Huang, W.; Peng, D.; Qin, Q.; Mortimer, H.; Casa, R.; Pignatti, S.; Laneve, G.; Pascucci, S. Vegetation indices combining the red and red-edge spectral information for leaf area index retrieval. IEEE J. Select. Topics Appl. Earth Observ. Remote Sens. 2018, 11, 1482–1493. [Google Scholar] [CrossRef]
  66. Karnieli, A.; Sarafis, V. Reflectance spectrophotometry of cyanobacteria within soil crusts—A diagnostic tool. Int. J. Remote Sens. 1996, 17, 1609–1615. [Google Scholar] [CrossRef]
  67. Román, J.R.; Rodríguez-Caballero, E.; Rodríguez-Lozano, B.; Roncero-Ramos, B.; Chamizo, S.; Águila-Carricondo, P.; Cantón, Y. Spectral response analysis: An indirect and non-destructive methodology for the chlorophyll quantification of biocrusts. Remote Sens. 2019, 11, 1350. [Google Scholar] [CrossRef]
  68. Hunt, E.R., Jr.; Doraiswamy, P.C.; McMurtrey, J.E.; Daughtry, C.S.; Perry, E.M.; Akhmedov, B. A visible band index for remote sensing leaf chlorophyll content at the canopy scale. Int. J. Appl. Earth Observ. Geoinf. 2013, 21, 103–112. [Google Scholar] [CrossRef] [Green Version]
  69. Haboudane, D.; Tremblay, N.; Miller, J.R.; Vigneault, P. Remote estimation of crop chlorophyll content using spectral indices derived from hyperspectral data. IEEE Trans. Geosci. Remote Sens. 2008, 46, 423–437. [Google Scholar] [CrossRef]
  70. Vincini, M.; Frazzi, E.; D’Alessio, P. A broad-band leaf chlorophyll vegetation index at the canopy scale. Precis. Agric. 2008, 9, 303–319. [Google Scholar] [CrossRef]
  71. Gitelson, A.A.; Gritz, Y.; Merzlyak, M.N. Relationships between leaf chlorophyll content and spectral reflectance and algorithms for non-destructive chlorophyll assessment in higher plant leaves. J. Plant Physiol. 2003, 160, 271–282. [Google Scholar] [CrossRef]
  72. Major, D.J.; Baret, F.; Guyot, G. A ratio vegetation index adjusted for soil brightness. Int. J. Remote Sens. 1990, 11, 727–740. [Google Scholar] [CrossRef]
  73. Jasinski, M.F.; Eagleson, P.S. The structure of red-infrared scattergrams of semivegetated landscapes. IEEE Trans. Geosci. Remote Sens. 1989, 27, 441–451. [Google Scholar] [CrossRef]
  74. Galvão, L.S.; Vitorello, Í. Variability of laboratory measured soil lines of soils from southeastern Brazil. Remote Sens. Environ. 1998, 63, 166–181. [Google Scholar] [CrossRef]
  75. Huete, A.R.; Post, D.F.; Jackson, R.D. Soil spectral effects on 4-space vegetation discrimination. Remote Sens. Environ. 1984, 15, 155–165. [Google Scholar] [CrossRef]
  76. Yoshioka, H.; Miura, T.; Demattê, J.A.; Batchily, K.; Huete, A.R. Soil line influences on two-band vegetation indices and vegetation isolines: A numerical study. Remote Sens. 2010, 2, 545–561. [Google Scholar] [CrossRef]
Figure 1. Geographical location of test fields: 1—gray forest soils, 2—alluvial soils, 3—leached chernozem.
Remotesensing 11 01932 g001
Figure 2. The scheme of the presented study.
Remotesensing 11 01932 g002
Figure 3. The average spectral reflectance of open soil surface at different stages of winter wheat development: the first number indicates the type of soil (1—gray forest, 2—alluvial, 3—chernozem), while the second number indicates the stage of winter wheat development (1—tillering, 2—shooting stage, 3—milky ripeness).
Remotesensing 11 01932 g003
Figure 4. Scatterplot of reflectance of open soil surface in NIR-Red spectral space for gray forest soil (a), alluvial soil (b), and chernozems (c) at different stages of winter wheat development with fitted soil lines: 1—tillering (black line), 2—shooting (red line), 3—milky ripeness (orange line).
Remotesensing 11 01932 g004
Figure 5. The difference between the reflectance of the crop canopy and the simulated reflectance of the spectral mixture: (a) tillering stage; (b) shooting stage: av—mean; sdp—average + standard deviation, sdn—average–standard deviation; 1—gray forest soils, 2—alluvial soils, 3—leached chernozem.
Remotesensing 11 01932 g005
Figure 6. The average contribution of the soil background to the spectral reflectance of the winter wheat crop canopy (%) in the tillering stage (a), shooting stage (b) and milky ripeness stage (c): 1—gray forest soil, 2—alluvial soil, 3—leached chernozem.
Remotesensing 11 01932 g006
Figure 7. The influence of the soil type factor on the variation of vegetation indices of winter wheat crops (the value of 1 corresponds to 100%): (a) tillering phase, (b) shooting phase, (c) milky ripeness phase.
Remotesensing 11 01932 g007
Figure 8. Isolines of vegetation and open soil surface (gray forest soil—(a,d,g); alluvial soils—(b,e,h); leached chernozems—(c,f,i)) at different stages of winter wheat development (tillering stage: crops—green points, soil—blue points; shooting stage: crops—purple points, soil—brown points, the stage of milky ripeness: crops—red points, soil—orange points). The sensitivity area of the vegetation index is marked with a black dotted line.
Remotesensing 11 01932 g008aRemotesensing 11 01932 g008b
Table 1. Number of survey points of field data collection in test areas at different stages of crop development.
Stage of Winter Wheat DevelopmentSoil Type
Gray ForestAlluvialChernozem
Tillering14813
Shooting10513
Milky ripeness1049
Table 2. Combinations of vegetation indices calculated using maximum, minimum and average reflectance values in red (620–690 nm) and near-infrared (760–900 nm) regions of spectrum, and reflectance in RedEdge region (average value at 720–730 nm).
Parts of SpectrumNIR Reflectance
MaximumMinimumAverage
RED reflectanceMaximummaxminmaxavmax
Minimummaxminminavmin
Averagemaxavminavav
RedEdge reflectanceedmaxedminadav
Table 3. Classification accuracy of the discrimination of winter wheat crops growing on different soil types on the basis of NDVI, EVI2 and SAVI (% of correctly classified original group cases).
Stage of Winter Wheat DevelopmentIndexCalculated Combination
MaxMinAvMaxminMinmaxAvmaxAvminMaxavMinavEdmaxEdminEdav
TilleringNDVI58.864.761.858.861.858.858.858.864.75067.655.9
EVI285.385.385.385.385.385.385.385.385.391.288.294.1
SAVI85.385.385.385.385.385.385.385.385.391.285.388.2
ShootingNDVI53.6505053.653.657.150505057.157.157.1
EVI271.471.471.47567.971.47571.471.446.45050
SAVI71.471.471.47571.471.47571.471.446.45050
Milky ripenessNDVI69.660.965.265.269.669.665.265.265.278.382.682.6
EVI273.978.382.682.673.978.382.682.678.373.973.978.3
SAVI73.978.378.382.673.960.982.682.673.973.978.378.3

