Article

Time Series of Landsat Imagery Shows Vegetation Recovery in Two Fragile Karst Watersheds in Southwest China from 1988 to 2016

1
The State Key Laboratory of Remote Sensing Science, Institute of Remote Sensing and Digital Earth, Chinese Academy of Sciences, Beijing 100101, China
2
University of Chinese Academy of Sciences, Beijing 100049, China
3
Department of Environmental Science, Policy, and Management, University of California, Berkeley, CA 94720-3114, USA
4
The Key Laboratory of Land Surface Pattern and Simulation, Institute of Geographical Sciences and Natural Resources Research, Chinese Academy of Sciences, Beijing 100101, China
5
Department of Geosciences, Texas Tech University, Lubbock, TX 79409, USA
6
Key Laboratory of Ecosystem Network Observation and Modeling, Institute of Geographical Sciences and Natural Resources Research, Chinese Academy of Sciences, Beijing 100101, China
7
College of Environment and Planning, Henan University, Kaifeng 475004, China
8
Department of sediment research, China Institute of Water Resources and Hydropower Research, Beijing 100048, China
9
Department of Geographical Sciences, University of Maryland, College Park, MD 20742, USA
10
Key Laboratory of Karst Dynamics, Institute of Karst Geology, Chinese Academy of Geological Sciences, Guilin 541004, China
11
The International Research Center on Karst, UNESCO, Guilin 541004, China
*
Author to whom correspondence should be addressed.
Remote Sens. 2019, 11(17), 2044; https://0-doi-org.brum.beds.ac.uk/10.3390/rs11172044
Submission received: 2 July 2019 / Revised: 4 August 2019 / Accepted: 28 August 2019 / Published: 30 August 2019

Abstract

:
Since the implementation of China’s afforestation and conservation projects during recent decades, an increasing number of studies have reported greening trends in the karst regions of southwest China using coarse-resolution satellite imagery, but small-scale changes in the heterogenous landscapes remain largely unknown. Focusing on two typical karst regions in the Nandong and Xiaojiang watersheds in Yunnan province, we processed 2,497 Landsat scenes from 1988 to 2016 using the Google Earth Engine cloud platform and analyzed vegetation trends and associated drivers. We found that both watersheds experienced significant increasing trends in annual fractional vegetation cover, at a rate of 0.0027 year−1 and 0.0020 year−1, respectively. Notably, the greening trends have been intensifying during the conservation period (2001–2016) even under unfavorable climate conditions. Human-induced ecological engineering was the primary factor for the increased greenness. Moreover, vegetation change responded differently to variations in topographic gradients and lithological types. Relatively more vegetation recovery was found in regions with moderate slopes and elevation, and pure limestone, limestone and dolomite interbedded layer as well as impure carbonate rocks than non-karst rocks. Partial correlation analysis of vegetation trends and temperature and precipitation trends suggested that climate change played a minor role in vegetation recovery. Our findings contribute to an improved understanding of the mechanisms behind vegetation changes in karst areas and may provide scientific supports for local afforestation and conservation policies.

Graphical Abstract

1. Introduction

As a fundamental component of global terrestrial ecosystems, vegetation not only plays a critical role in global material and energy cycles [1], but also has considerable impacts on regulating global carbon balance, mitigating atmospheric CO2 concentration, and maintaining global climate stability [2]. The response of vegetation to global change has attracted extensive attention in the science community over the past decades [3]. For instance, Zhu et al. [4] revealed a greening trend in Earth’s terrestrial vegetation using three long-term remotely sensed datasets coupled with ten ecosystem models. Similarly, Chen et al. [5] highlighted the leaderships played by China and India in global greening trends based on recent satellite data. Besides, Piao et al. [6] comprehensively detected and attributed the vegetation greening trend in China during the past three decades based on three different remotely sensed Leaf Area Index (LAI) data sets and five different process-based ecosystem models. Since ecologically fragile regions are more sensitive to climate change, more research has been focused on vegetation change in ecologically sensitive areas. For example, Stow et al. [7] studied the changes of Arctic tundra lands using multi-temporal remote sensing techniques. Moreover, Fang et al. [8] investigated the vegetation vulnerability to drought stress in arid and semi-arid ecosystems (the Loess Plateau in China) using a bivariate probabilistic framework. Additionally, numerous studies have addressed the vegetation change and associated influencing factors in the Qinghai-Tibetan Plateau, known as the “Earth’s third pole” [9]. For example, Song et al. [10] analyzed the trends in vegetation change and its relationships with climate change and human activities on the Qinghai-Tibet Plateau from 2000 to 2016 using a growing season integrated enhanced vegetation index (GSIEVI).
The karst regions in southwest China are some of the largest exposed carbonate rock areas globally, covering approximately 0.54 million km2 [11] and supporting over 0.22 billion people [12]. Characterized by a small carrying capacity and increasing human population, these fragile regions have long been reported to suffer from serious soil erosion and vegetation degradation due to large numbers of people living on limited land resources [13]. This leads to the emergence of karst rocky desertification (KRD), in which karstified lands previously covered by vegetation and soil are transformed into a bare rocky landscape [14]. Previous studies showed that over 80% of the KRD areas are located in southwest China [11], leading to an increase in other environmental disasters (e.g., droughts, floods and landslides) and poverty [15]. In order to reverse land degradation and improve local people’s livelihood, the state and local governments have implemented several large-scale ecological restoration projects (ERPs) over the past two decades, such as the Grain for Green Program, the Natural Forest Conservation Program, and the Karst Rocky Desertification Restoration Project [16].
Numerous studies have revealed that large parts of karst ecosystems in southwest China have undergone a significant increase in vegetation cover after nearly 20 years of ERPs implementation. For example, Cai et al. [17] reported a significant vegetation greening trend in 41% of forests spanning 2000 to 2010 in the karst areas of Guizhou Province, southwest China using Moderate-Resolution Imaging Spectroradiometer (MODIS) Normalized Difference Vegetation Index (NDVI) time series data (1 km). Likewise, Wang et al. [18] concluded with improved vegetation cover in 58.7% of karst regions in hilly southern China by adopting a time series of MODIS Terra NDVI data (250 m) over the same period. In addition, Tong et al. [19] assessed vegetation trends in Guangxi and Guizhou Provinces in southwest China using MODIS satellite time series (2001–2013) at a spatial resolution of 250 m, and found that 67% of the study area presenting increasing trends in annual growing season NDVI. However, the factors responsible for this change are still debated due to different data sets being used as well as the complex landscape of southwest China karst. For example, Brandt et al. [13] found the growing season vegetation cover in South China karst increased from 69% in 1999 to 81% in 2017 based on GEOV2 FCover data set (1 km), and attributed the greening trend to a direct or indirect effect of forestry and conservation projects starting from 2001. Nevertheless, Hou et al. [20] highlighted the finding that temperature may be a controlling factor for the vegetation growth in the karst regions of southwest China since about 70% of the area showed a positive relationship between GIMMS growing-season NDVI and temperature. Furthermore, Wang et al. [18] attributed the greening trend in hilly southern China to the combined influence of human activities and climate change. Additionally, many previous studies were based on a limited time span during the post-ERPs period, and therefore were unable to quantify vegetation change during the pre-ERPs period and thus may fail to reveal the actual drivers of change.
In recent years, scientists have been empowered to explore karst vegetation change over long time periods at various spatial scales using freely available satellite imagery. For instance, Tong et al. [16] used the GIMMS NDVI 3g data set with a spatial resolution of 8 km spanning from 1982 to 2011 to quantitatively evaluated the effectiveness of ecological engineering in karst regions of southwest China at the county level based on a newly proposed Project Effectiveness Index (PEI). Further, Tong et al. [21] confirmed the dominant contribution of ecological engineering to increased vegetation growth over the last three decades in southwest China using three independent Earth observation time series (i.e., MODIS leaf area index (LAI), GIMMS 3g LAI and vegetation optical depth (VOD) data sets) with relatively coarse-resolution imagery (over 5 km). In the meanwhile, Liu et al. [22] revealed that climate change exhibited a strong and significant impact on vegetation dynamics in 54.1% of southwest China during 1982–2015 based on AVHRR NDVI3g dataset (8 km), multivariate regression analysis coupled with multiple time scale analysis. However, coarse-resolution data cannot identify small-scale changes [16], especially when taking into account the high heterogeneity of vegetation composition in karst areas [23]. Thus, the research results from previous studies need to be reaffirmed with higher-resolution data.
In addition, according to mineralogical and geochemical studies, the soil layers in karst environments originate principally from residues left behind after dissolution of the underlying carbonate rocks, namely, limestone and dolomite [24,25]. Thus, the topsoil thickness is closely associated with the silicate mineral content contained in the parent carbonate rocks [26]. Further, dolomite and limestone have significant differences in karst morphology, rock fissure development, soil thickness and water retention of weathering shell [26]. The response of vegetation growth and distribution to this particular geological setting are not well elucidated despite the fact that lithology acts as the key factor determining the spatial allocation of water and soil resources as well as the geochemical cycles of nutrients. Research that ignores the influence of karst lithology on vegetation restoration of degraded karst ecosystems will likely impact the ability to discern important driving mechanisms of vegetation change in karst regions. In our study, we aimed to fill this knowledge gap.
The Landsat series of satellites provides the longest temporal record of Earth observations spanning over last four decades since 1972 [27]. The Landsat imagery has become one of the most effective remotely sensed data for earth system science research because of its capability of long-term continuous observation, global coverage, as well as moderate temporal and spatial resolution and scientific data archiving and distribution strategies, rendering it widely used in regional vegetation dynamics monitoring [28]. For instance, Qi et al. [29] employed three Landsat TM images in 1990, 2004 and 2011 to examine the evolution patterns of vegetation communities in a karst area of southwest China. Similarly, Wang et al. [30] also used three Landsat TM images in 1990, 2000 and 2010 to quantify and differentiate the changes in fractional vegetation cover in karst and non-karst regions in Guangxi, southwest China. In general, most of these studies adopted a single image in the start and end years to directly depict the vegetation growth change over the whole study period, which neglected the continuity of vegetation changes over time and were thus difficult to reflect the actual situation. Here we utilized all available 30 m resolution Landsat images spanning 1988-2016 to construct a long time series of dataset that we then used to quantify the spatiotemporal variations of vegetation cover and associated drivers in karst ecosystems on a finer pixel scale.
Previously, limited by computational capacity, large-scale ecological remote sensing mapping and analysis at higher temporal and spatial resolutions were often costly in terms of time and financial resources. In recent years, Google Inc. has developed an advanced cloud-based computing platform, the Google Earth Engine (GEE), which stores nearly 40 years of publicly available satellite imagery (e.g., Landsat, MODIS and Sentinel) and specializes in geospatial data processing as well as visualization for up to planetary-scale research [31]. The GEE platform provides open-access to supercomputing facilities and cloud computing and storage [32], thereby eliminating many of the computational barriers related to Landsat data. The platform has been widely used in land mapping. For example, Hansen et al. [33] mapped 30-meter-resolution global forest loss and gain from 2000 to 2012 based on the Landsat imagery and GEE cloud platform. Meanwhile, Pekel et al. [34], used three million Landsat images to quantify high-resolution changes in global surface water spanning the last 32 years supported by the GEE platform.
The objective of this study is to quantify changes in fractional vegetation cover (FVC) in typical karst watersheds and to understand the causal mechanisms behind vegetation trend in southwest China. This is achieved by: (1) Producing a time series of Landsat NDVI composites from 1988 to 2016, and (2) investigating the relationships between long-term FVC change and natural factors (i.e., climate change, topography and lithology) as well as human-induced afforestation and conservation projects. Results of this study may provide reference data and scientific guidance for ecological restoration in rocky desertification regions of southwest China and elsewhere.

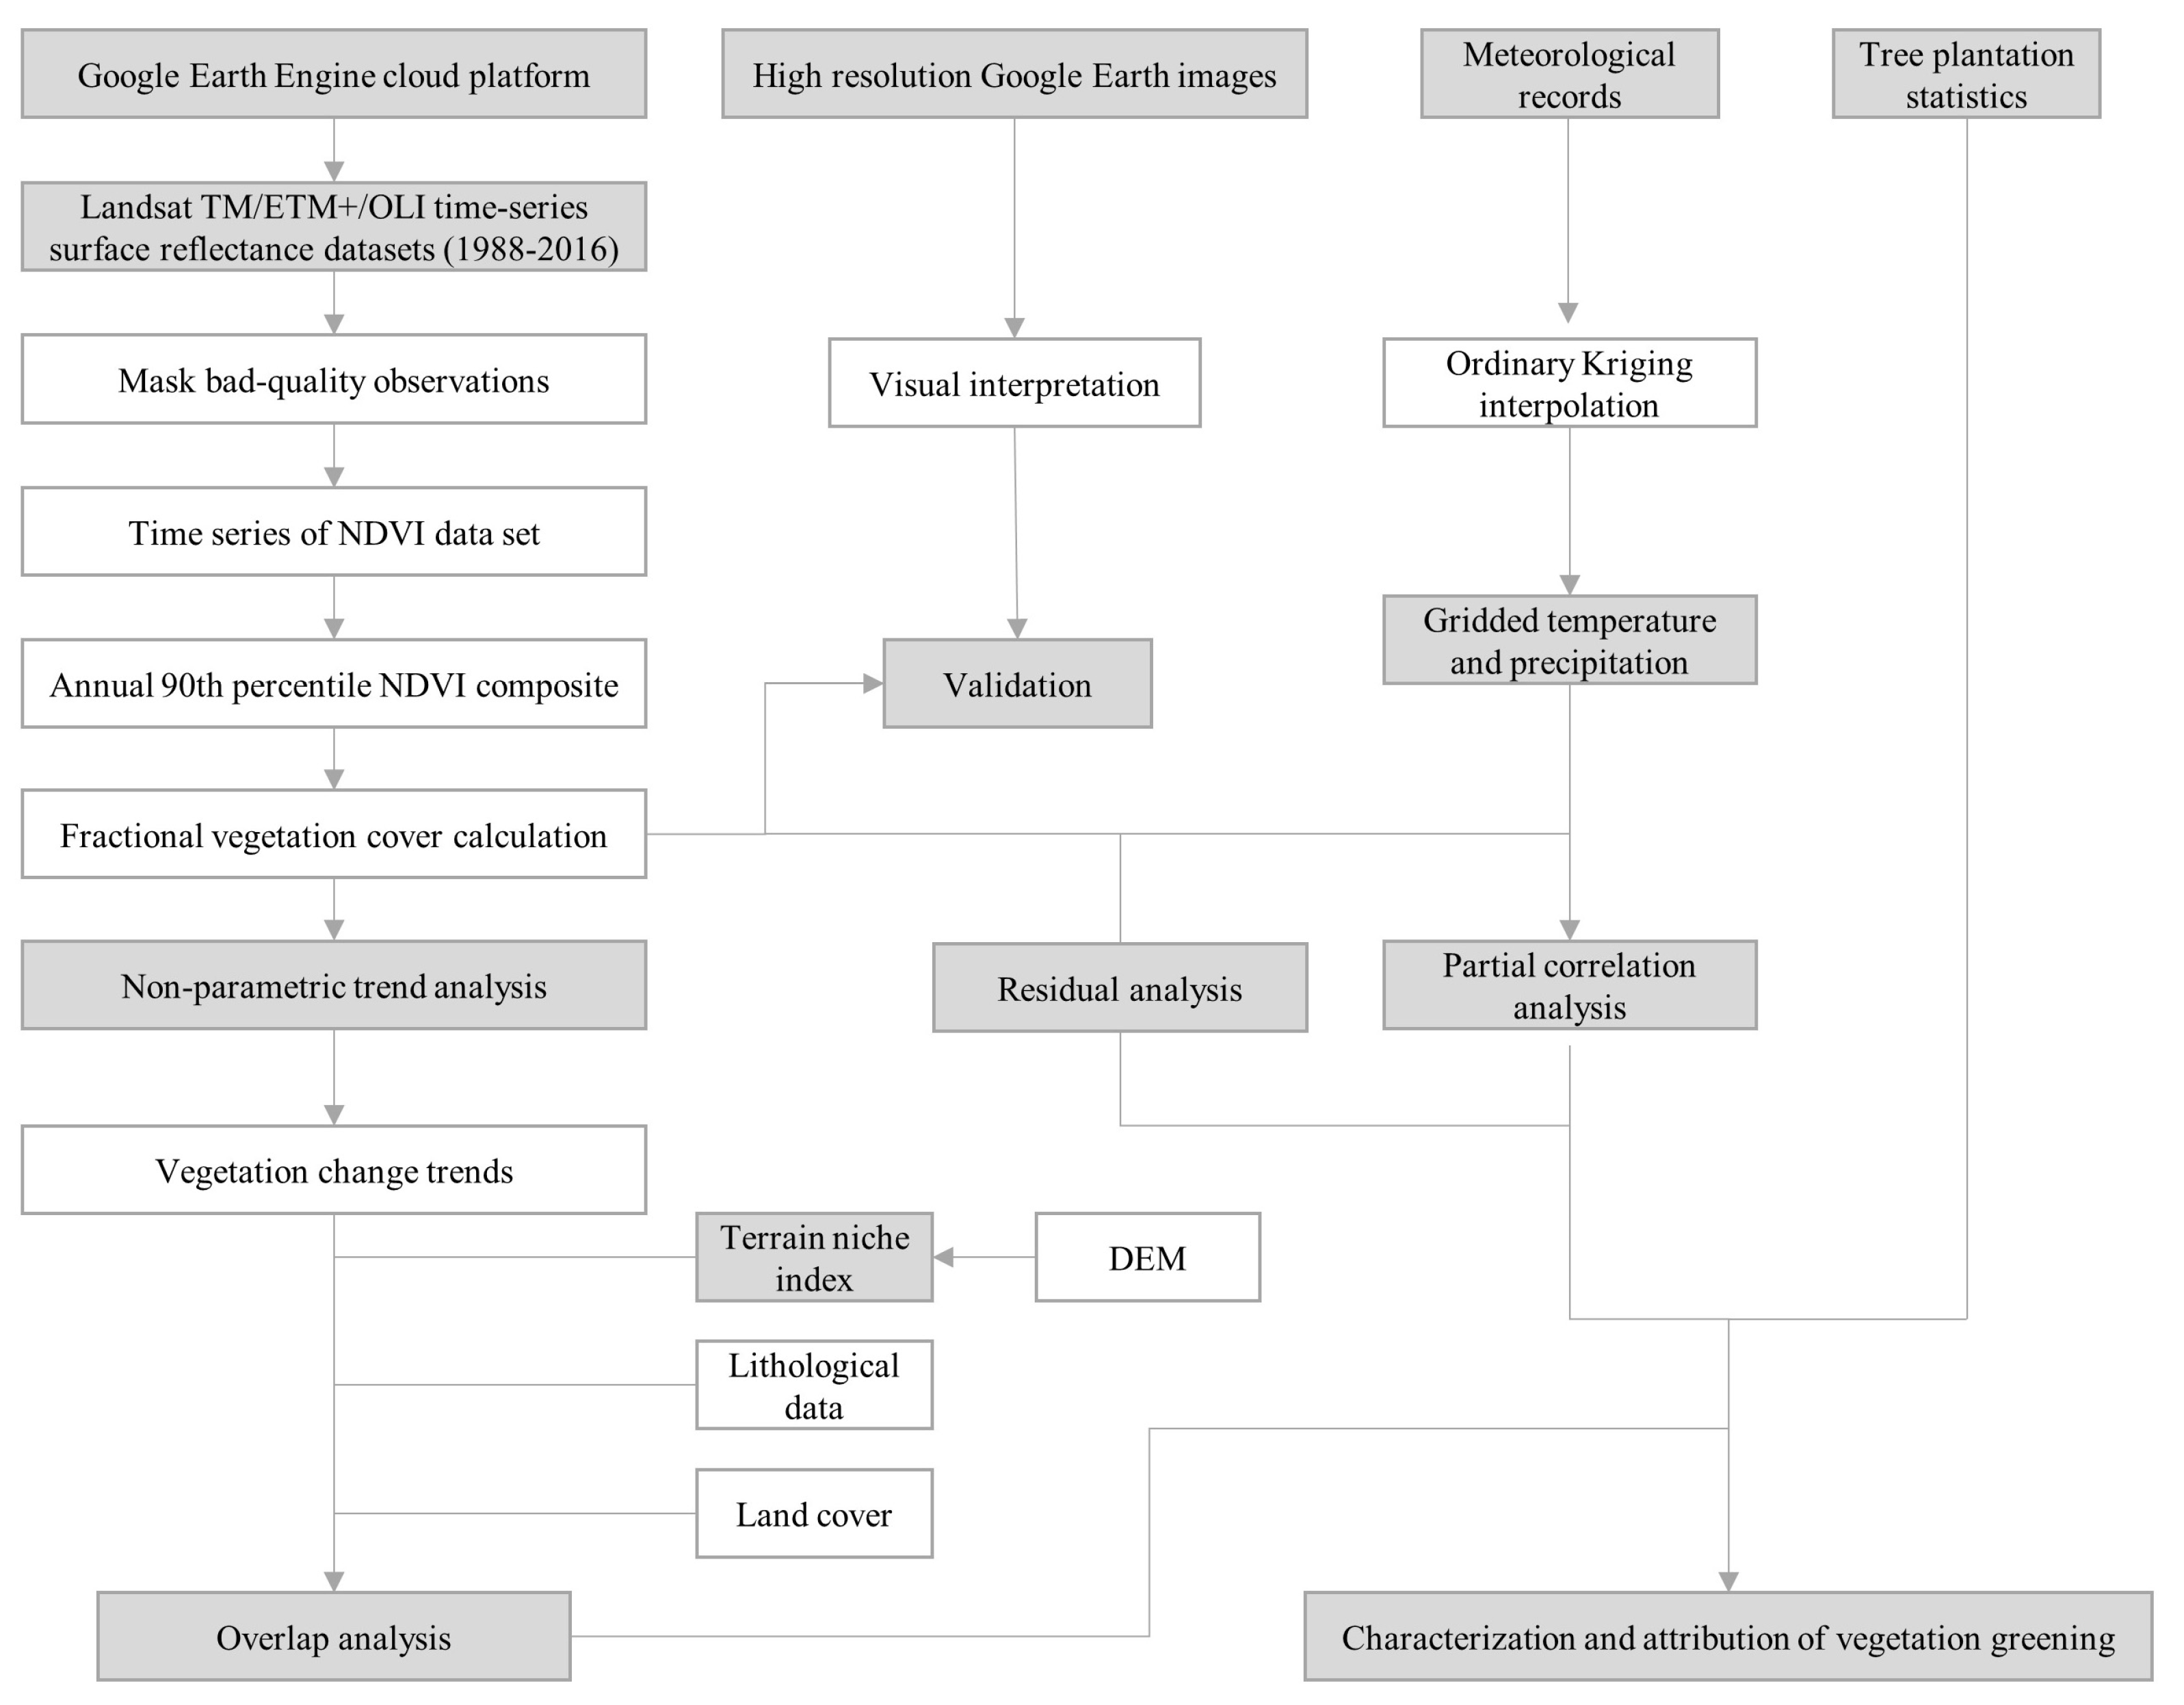
2. Materials and Methods
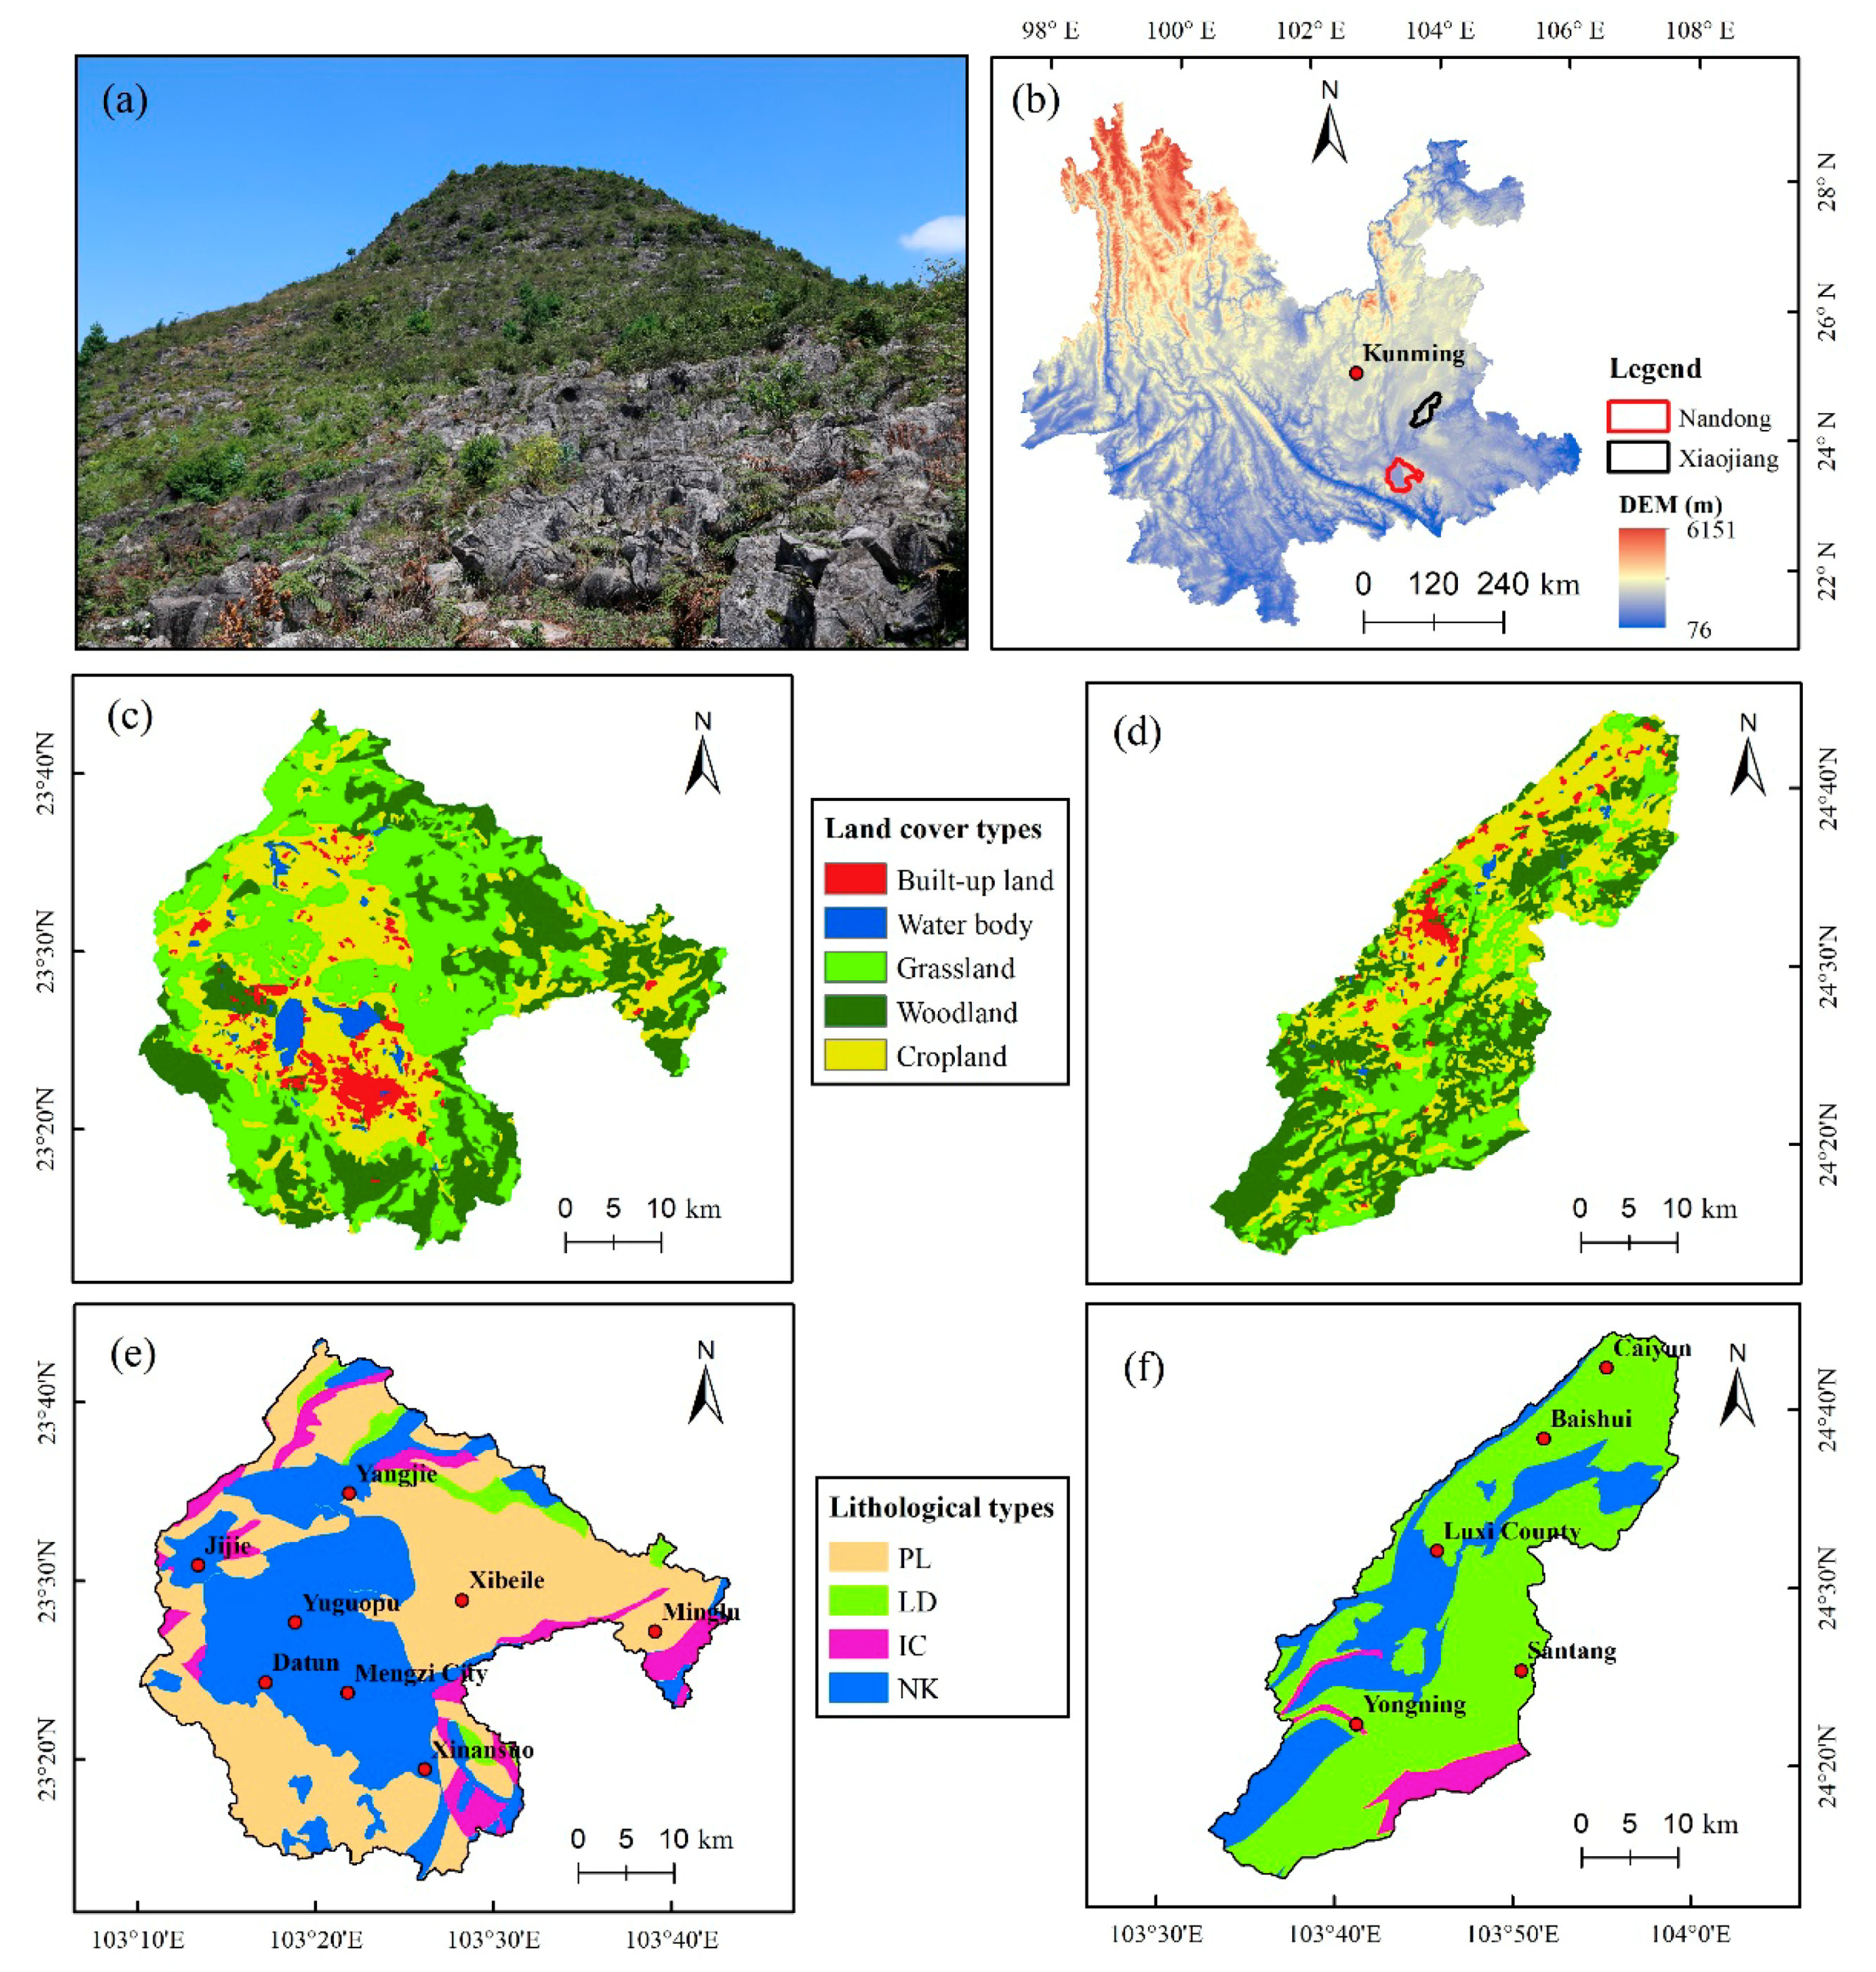
2.1. Study Area

We selected two ecologically fragile karst watersheds located in typical karst faulted basins in southwest China as the study area: Nandong underground river watershed (hereafter termed Nandong watershed) and Xiaojiang watershed (Figure 1). The Nandong watershed (1617.13 km2) is located in an agricultural region on the Yun-Gui Plateau in Yunnan province (23°10′–23°43′ N, 103°10′–103°42′ E). It is the largest and a typical underground river system developed in carbonate rocks with elevations ranging from 1056 m to 2788 m. Carbonate rocks cover approximately 992.10 km2 or 61.35% of the total area of the watershed. Pure limestone, limestone and dolomite interbedded layer and impure carbonate rocks accounted for 81.15%, 6.09% and 12.77% of the carbonate rock area, respectively. The bedrock for the rest of the watershed is composed of clastic rocks (non-karst region). The watershed is primarily characterized by a subtropical monsoon climate, with a mean annual temperature of 19.8 °C and mean annual precipitation of 830 mm.
Xiaojiang watershed, a first-level tributary of the Nanpan River, is located in eastern Yunnan province (24°10′–24°45′ N, 103°30′–104°05′ E), with elevations ranging from 854 m to 2463 m. The land area of the watershed attains 1008.39 km2, with 73.68% of the area covered by karst landscape. Limestone and dolomite interbedded layer and impure carbonate rocks account for 93.30% and 6.70% of the carbonate rock area, respectively. Non-karst region occupies 26.32% of the watershed. The climate condition in Xiaojiang is mainly subtropical plateau monsoon, featured by distinct dry and rainy seasons. The mean annual temperature is 15.2 °C. The mean annual precipitation is 1000 mm, with more than 80% of precipitation concentrated from June to October.
The primary vegetation types in these two karst watersheds are a patchwork of agricultural vegetation, forest plantations, orchards and natural vegetation (i.e., forests, shrubs and grasslands). Both watersheds have suffered from degradation from an increasing human population using scant land resources over the past decades [12]. Figure 1a clearly illustrates the typical rocky desertification landscape in southwest China. Starting in 2001, both watersheds were targets for a series of large-scale afforestation and conservation efforts. Under these projects, local rural householders are provided with free tree seedlings and economic subsidies as compensation for income loss when steep-sloped farmlands are planted with trees instead of farm crops [35].

2.2. Data and Processing

Figure 2 shows the research workflow for detecting and attributing karst vegetation greening trends over 1988–2016 using time-series Landsat images and other geospatial data sets. The GEE platform (https://earthengine.google.org/) allows users to easily develop customized algorithms to perform up to planetary-scale geospatial analysis through JavaScript and Python application programming interfaces (API), using Google's massive computational capabilities [31]. In this study, most of the procedures for image collection, processing and analysis were carried out via this platform. The entire archive of the Landsat 5 Thematic Mapper (TM), the Landsat 7 Enhanced Thematic Mapper Plus (ETM+) and the Landsat 8 Operational Land Imager (OLI) orthorectified Surface Reflectance (SR) products acquired from January 1, 1988 to December 31, 2016 was used to create annual NDVI composites at a 30 m spatial resolution for each given year. All required Landsat SR images were separately retrieved from the LANDSAT/LT05/C01/T1_SR, LANDSAT/LT07/C01/T1_SR and LANDSAT/LC08/C01/T1_SR Image Collections stored in GEE. Both watersheds are frequently affected by the cloudy and rainy weather coupled with rugged terrain conditions, leading to cloud and shadow contamination on numerous satellite images [23]. Landsat SR products contain pixel quality flag information indicating clear, cloud, shadow, water, snow/ice conditions, as derived from the CFMask algorithm [36], which was used to mask bad-quality observations, including clouds, shadows, cirrus, snow/ice together with scan-line corrector (SLC)-off gaps within each composite period. In total, there were 1,508 and 989 Landsat scenes collected and processed during 1988-2016 for Nandong and Xiaojiang watersheds, respectively (Supplementary Materials, Figure S1). As well, Figure S2 shows the spatial distribution of the good-quality Landsat observation numbers at the pixel scale from 1988 to 2016 in both watersheds.
For each pixel and year, we calculated the 90th percentile in the NDVI time series using all available Landsat SR images, representing the annual growing season conditions. As annual maximum NDVI value can be susceptible to noise [13], it was not considered here. NDVI is the normalized ratio of near-infrared and red visible reflectance [37], calculated as Equation (1):
N D V I = ρ N I R ρ R e d ρ N I R + ρ R e d
where ρNIR represents surface reflectance of the near infrared band (band 4 for Landsat 5, 7; band 5 for Landsat 8) and ρRed is surface reflectance of the red band (band 3 for Landsat 5, 7; band 4 for Landsat 8).
The Advanced Spaceborne Thermal Emission and Reflection Radiometer (ASTER) Global Digital Elevation Model Version 2 (GDEM V2) with a spatial resolution of 1 arc-second (approximately 30 m), downloaded from the Geospatial Data Cloud site, Computer Network Information Center, Chinese Academy of Sciences (http://www.gscloud.cn), was used to derive the elevation and slope for Nandong and Xiaojiang watersheds. The DEM data was resampled to 30 m spatial resolution using a nearest neighbor resampling algorithm to match the Landsat NDVI composite images.
We obtained climate data (monthly temperature and precipitation) for 29 meteorological ground stations between January 1988 and December 2016 from the National Meteorological Information Center (http://data.cma.cn/). The spatial distribution of meteorological stations has been shown in Figure S3. The monthly temperature within a year was averaged to achieve the annual mean temperature (AMT) whereas monthly precipitation was aggregated to attain annual total precipitation (ATP). Ordinary Kriging (OK) approach was employed to generate spatially interpolated climate data with the same spatial resolution and geographic coordinate system as those of the NDVI data. The OK interpolation method takes into account the effects of topography on temperature and precipitation [38]. All gridded images were then cropped to cover the study areas using the watershed boundary vector data.
Lithological data depicting spatial distribution of various types of carbonate rocks as well as non-karst rocks were acquired from Karst Distribution Map of Southwest China (scale: 1:500,000, vector format) provided by the Institute of Karst Geology, Chinese Academy of Geological Sciences.
Land cover data at 30 m spatial resolution in 2015 were provided by the Data Center for Resources and Environmental Sciences, Chinese Academy of Sciences (http://www.resdc.cn), representing the various categories of human-induced impacts on vegetation changes [39]. The primary land cover types in both watersheds included cropland, woodland, grassland, water body and built-up land (Figure 1c,d).
Human population and GDP data between 1996 and 2016 were collected from the Yunnan Statistical Yearbook [40]. Moreover, tree plantation statistics from 2002 to 2016 were collected from China Forestry Yearbook [41].

2.3. Analysis Methods

2.3.1. Fractional Vegetation Cover Calculation

Fractional vegetation cover (FVC) is defined as the percentage occupied by vegetation (including leaves, stem and branches) in a vertical projection relative to the total statistical area [42]. In the present study, the FVC was retrieved from a sub-pixel model, which assumes the remotely sensed response in a mixed pixel is composed of a linearly weighted combination of vegetated and non-vegetated components, with the most widely used remote sensing spectral response being NDVI [43], since NDVI is the optimal indicator of vegetation growth and strongly correlated with vegetation cover [44]. The calculation formula of the sub-pixel model is calculated as [45]:
λ = f N D V I v e g + ( 1 f ) N D V I s o i l
then,
f = λ N D V I s o i l N D V I v e g N D V I s o i l
where f represents the proportion of vegetation area in the mixed pixels, λ is the NDVI value of the mixed pixels, NDVIveg and NDVIsoil denote the NDVI values of fully vegetated pixels and pure bare soil pixels, respectively. Annual growing season FVC (hereafter termed as annFVC) was selected to reflect the highest level of vegetation cover within a specific year, using the yearly NDVI composites described in Section 2.2. With reference to previous studies [45,46], NDVIsoil was assigned with the 5th percentile in the NDVI frequency cumulative table each year, and NDVIveg was taken as the 95th percentile in the NDVI frequency cumulative table each year.

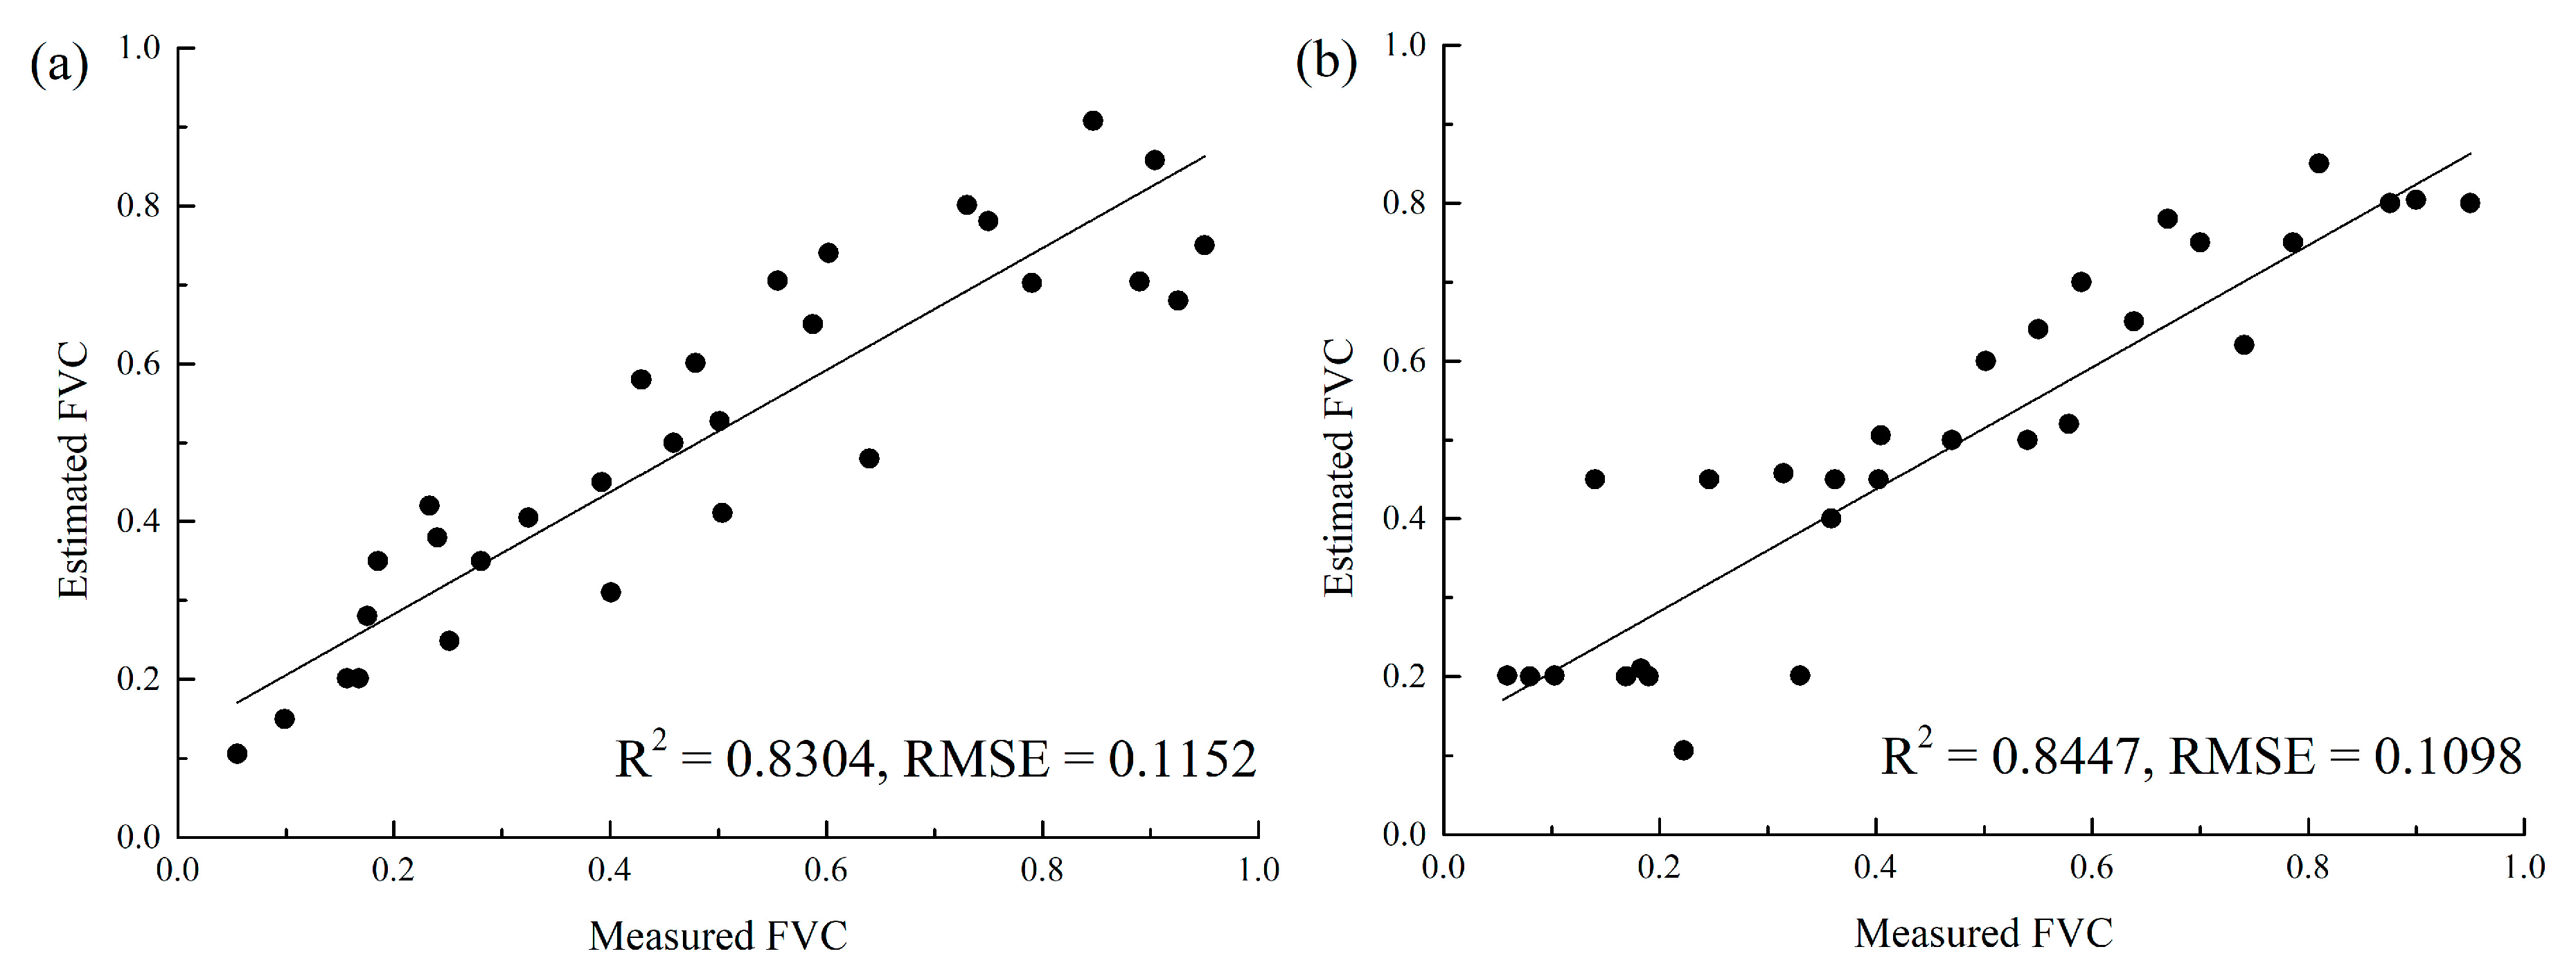
2.3.2. Accuracy Assessment and Validation

The accuracy of the proposed sub-pixel model was assessed by comparing the estimated FVC and measured FVC. In this study, we randomly selected 60 samples (30 for each watershed) from the estimated FVC generated by the model, which were then converted into square cells in .shp format using ArcGIS 9.3 software. Subsequently, these square cells were imported in Google Earth. High spatial resolution Google Earth images were used to derive the measured FVC through visual interpretation [47]. Finally, we used two indicators to validate the model accuracy, namely, the coefficient of determination (R2) and root mean square error (RMSE). The corresponding formulas are expressed as follow:
R 2 = ( i = 1 n ( y ^ i y ^ ¯ ) × ( y i y ¯ ) / ( i = 1 n ( y ^ i y ^ ¯ ) 2 × i = 1 n ( y i y ¯ ) 2 ) ) 2
δ R M S E = 1 n i = 1 n ( y i y ^ i ) 2
where n represents the total number of samples; y i and y ^ i denote the measured value and estimated value, respectively; y ¯ and y ^ ¯ represent the average measured value and average estimated value, respectively. The higher the R2 is, the lower the RMSE is, the higher accuracy the model produces [48].

2.3.3. Trend Analysis

In order to quantify the temporal trend of time-series annFVC at the pixel scale, we employed the nonparametric Mann–Kendall test [49,50]. In contrast to the linear regression method, the Mann–Kendall test does not require data conform to a normal distribution, and can effectively reduce the impacts of outliers and data errors [51]. Moreover, the Mann–Kendall test can use spatial autocorrelation principles to characterize geographic phenomena, and the results are more intuitive from a geographic perspective and enhance the ability to monitor trends in relatively short time series. For a given time series FVCt, the Mann–Kendall test statistic is given as follows:
Z = { S 1 V a r ( S ) ( S > 0 ) 0 ( S = 0 ) S + 1 V a r ( S ) ( S < 0 )
S = i = 1 n 1 j = i + 1 n sgn ( F V C j F V C i )
V a r ( S ) = n ( n 1 ) ( 2 n + 5 ) 18
sgn ( F V C j F V C i ) = { 1   ( F V C j F V C i > 0 ) 0   ( F V C j F V C i = 0 ) 1 ( F V C j F V C i < 0 )
where FVCi and FVCj represent the pixel’s annFVC values of years i and j (j > i), respectively, and n is the length of time series (29 years in this study). The value of Z ranges from -∞ to +∞, with the positive Z values indicating increasing trends while negative Z values denoting decreasing trends [52]. At a given significance level of α, if the condition of |Z| > u1-α/2 is met, a significant time series trend is detected. u1-α/2 is obtained from the standard normal distribution table. In the present study, we used the significance level α = 0.05, which corresponds to the u1-α/2 value of 1.96.
Furthermore, we used the nonparametric Sen’s slope estimator to compute the slope of the trend if a linear trend was presented using the Mann–Kendall method. The Sen’s slope estimator calculates the median of slopes between N pairs of data [53], which is also reportedly to be insensitive to outliers [52]. The specific calculation formula is shown as follows:
T S = M e d i a n ( F V C j F V C i j i ) ,   1988 i   <   j 2016
where N = n (n − 1)/2, n is the length of time series (29 years), and FVCi and FVCj represent the pixel’s annFVC values of years i and j, respectively. If TS > 0, the annFVC shows an increasing trend. If TS < 0, the annFVC presents a decreasing trend.
In our study, we categorized the annFVC trends as three types: increasing (positive slope, statistically significant), decreasing (negative slope, statistically significant), and stable (statistically insignificant). Additionally, to show trends in annFVC at the watershed scale, we calculated the mean of annFVC values of all the pixels within the specific watershed. We further integrated layers of lithological data and average annual annFVC data together with annFVC trend maps using spatial overlay analysis in ArcGIS (version 9.3) to reveal the responses of vegetation recovery to lithological attributes in both watersheds.

2.3.4. Terrain Niche Index

To characterize the topographic variations in the complex landscape of southwest China karst, we utilized the terrain niche index (TNI) [19], which combines both elevation and slope and could help identify the spatial distribution characteristics of vegetation trends on the different terrain gradients. The higher the elevation is, the larger the slope is, the greater the TNI will be, and vice versa. The specific mathematical expression for TNI is calculated as follows:
TNI = lg [ ( e E + 1 ) ( s S + 1 ) ]
where e represents the elevation of the pixel, E refers to the average elevation of the whole study area, s is the slope angle of the pixel, and S denotes the average slope angle in the study area. In this work, the TNI values were grouped into five classes with an interval of 0.2. All pixels in each TNI interval were categorized based on the vegetation trends so as to explore the impacts of topographic variables on the vegetation change trends.

2.3.5. Relationship Analysis among annFVC and Climatic Factors

We applied partial correlation analysis to evaluate the correlation between climatic factors (temperature and precipitation) and annFVC data, which provides a measure of the degree of association between two variables while excluding the impact of the third one [54], and thus proves to be more accurate to identify the primary climatic driving factor in contrast to the simple correlation analysis [55]. The partial correlation coefficients can be computed as follows:
r x y z = r x y r x z r y z ( 1 r x z 2 ) ( 1 r 2 y z )
where rxy·z is the partial correlation coefficient between variables x and y given the controlling variable z, and rxy, rxz and ryz denote the correlation coefficients between x and y, x and z, y and z, respectively. The correlation coefficient formula can be expressed as follows:
r x y = i = 1 N ( x i x ¯ ) ( y i y ¯ ) i = 1 N ( x i x ¯ ) 2 i = 1 N ( y i y ¯ ) 2
where rxy is the correlation coefficient between variables x and y, i is the sequence number of time series, N is the total number of time series, x ¯ and y ¯ represent the mean values of time series xi and yi, respectively.
The partial correlation coefficient ranges from –1 to 1, with the value of –1 and 1 representing a perfect negative and positive correlation controlling for some variables, respectively [56]. While the coefficient value of 0 indicates no linear relationships between the variables. In this study, the statistical analysis was performed pixel-by-pixel and tested at significance level of 95% based on Student’s t-test.

2.3.6. Residual Analysis

In order to separate the climate impacts on vegetation change trends from those induced by human activities, we employed the widely used residual analysis method [16,18]. To be specific, the observed annFVC was regressed against temperature and precipitation. The annFVC-climate regression model was thus used to predict the annFVC values for each of the pixel in both watersheds. Consequently, the resulting differences between the observed annFVC and predicted annFVC represent the human-induced vegetation changes. The specific mathematical expressions were described as follows:
f h u m a n = f o b s f p r e
f p r e = a T e m p + b P r e c + c
where fhuman represent the annFVC contributed by human activities, fobs represent the observed annFVC, while fpre is the predicted annFVC using the regression model. Temp and Prec represent the annual temperature and precipitation, respectively. a and b denote the regression coefficients while c is a constant.
We also used the trend analysis to detect the change trends of residuals. An increasing trend of residuals over time denotes positive impacts induced by human activities on vegetation growth. In contrast, a decreasing trend indicates negative human-induced impacts on vegetation growth (vegetation degradation). While no trends detected for residuals suggest insignificant human impacts on vegetation changes.

3. Results

In this study, we found that both watersheds exhibited a significant increasing trend in annual fractional vegetation cover during the period 1988–2016. In particular, more than 50% of all pixels in both watersheds showed a higher increase rate since the start of the afforestation and conservation efforts in 2001. Moreover, the change trends presented distinct spatial heterogeneity. Residual analysis and partial correlation indicated that human-induced ecological engineering rather than climate change was the primary driver of the vegetation variations.

3.1. Accuracy Validation of the Sub-Pixel Model

Figure 3 shows the validation result of the estimated annFVC derived from the sub-pixel model. It is indicated that the model-derived annFVC had strong relationships with the measured annFVC in both watersheds. Specifically, for Nandong watershed, R2 and RMSE were 0.8304 and 0.1152, respectively. While for Xiaojiang watershed, R2 and RMSE were 0.8447 and 0.1098, respectively. These results demonstrated the high effectiveness and reliability of the sub-pixel model in our study areas, which is also in line with the results of Tong et al. [45] and Jiang et al. [44].

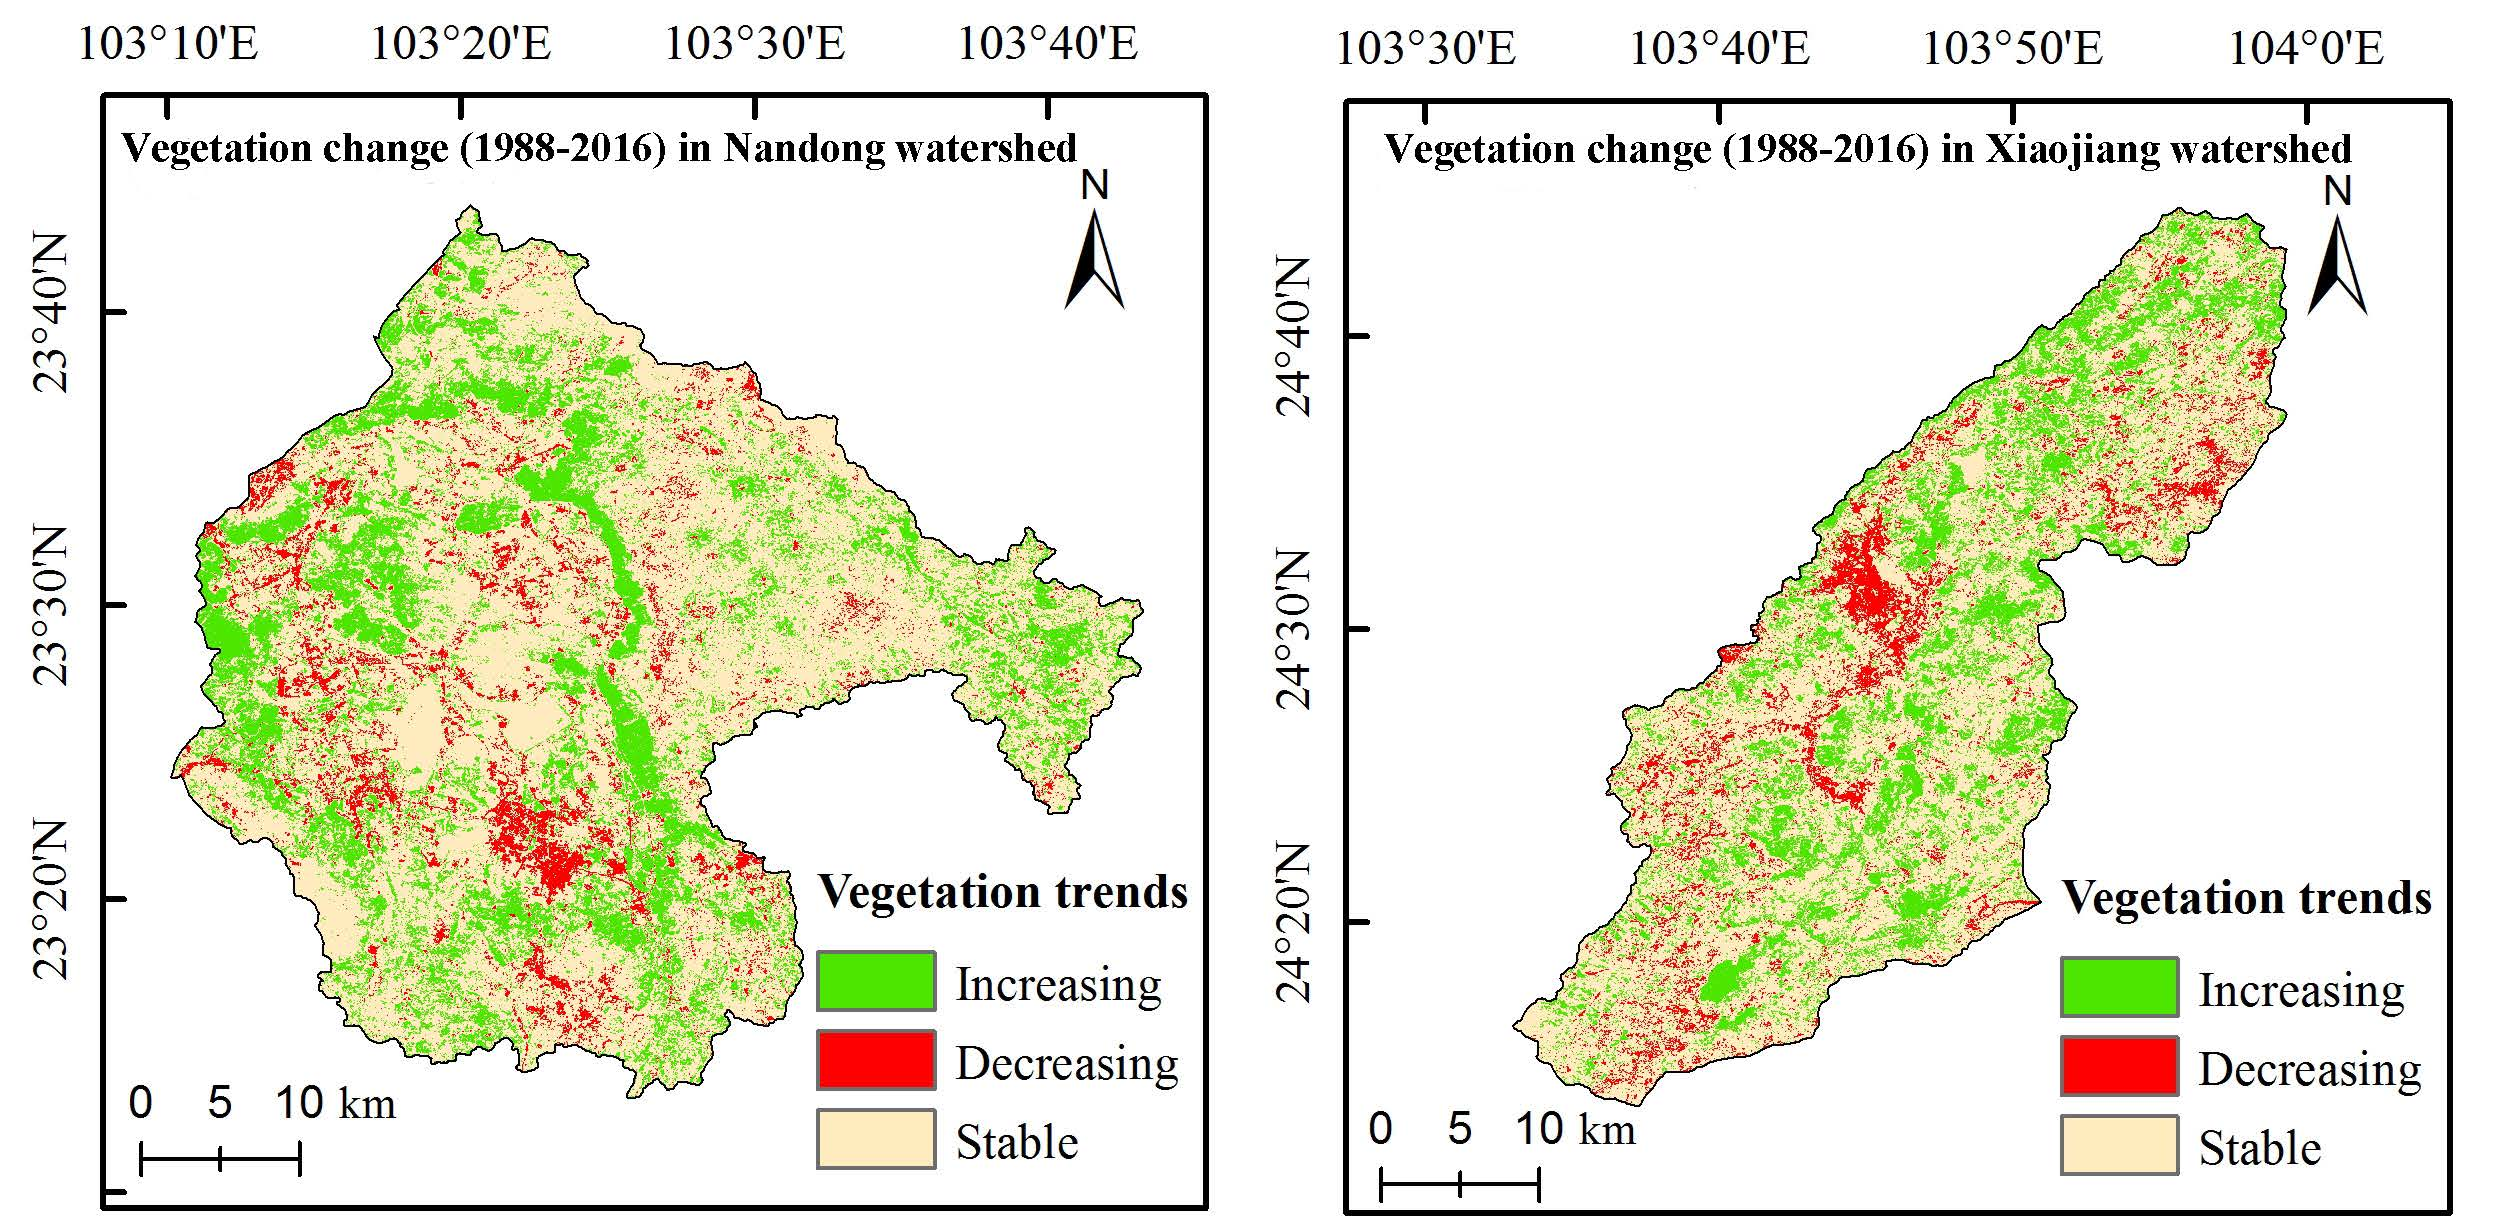
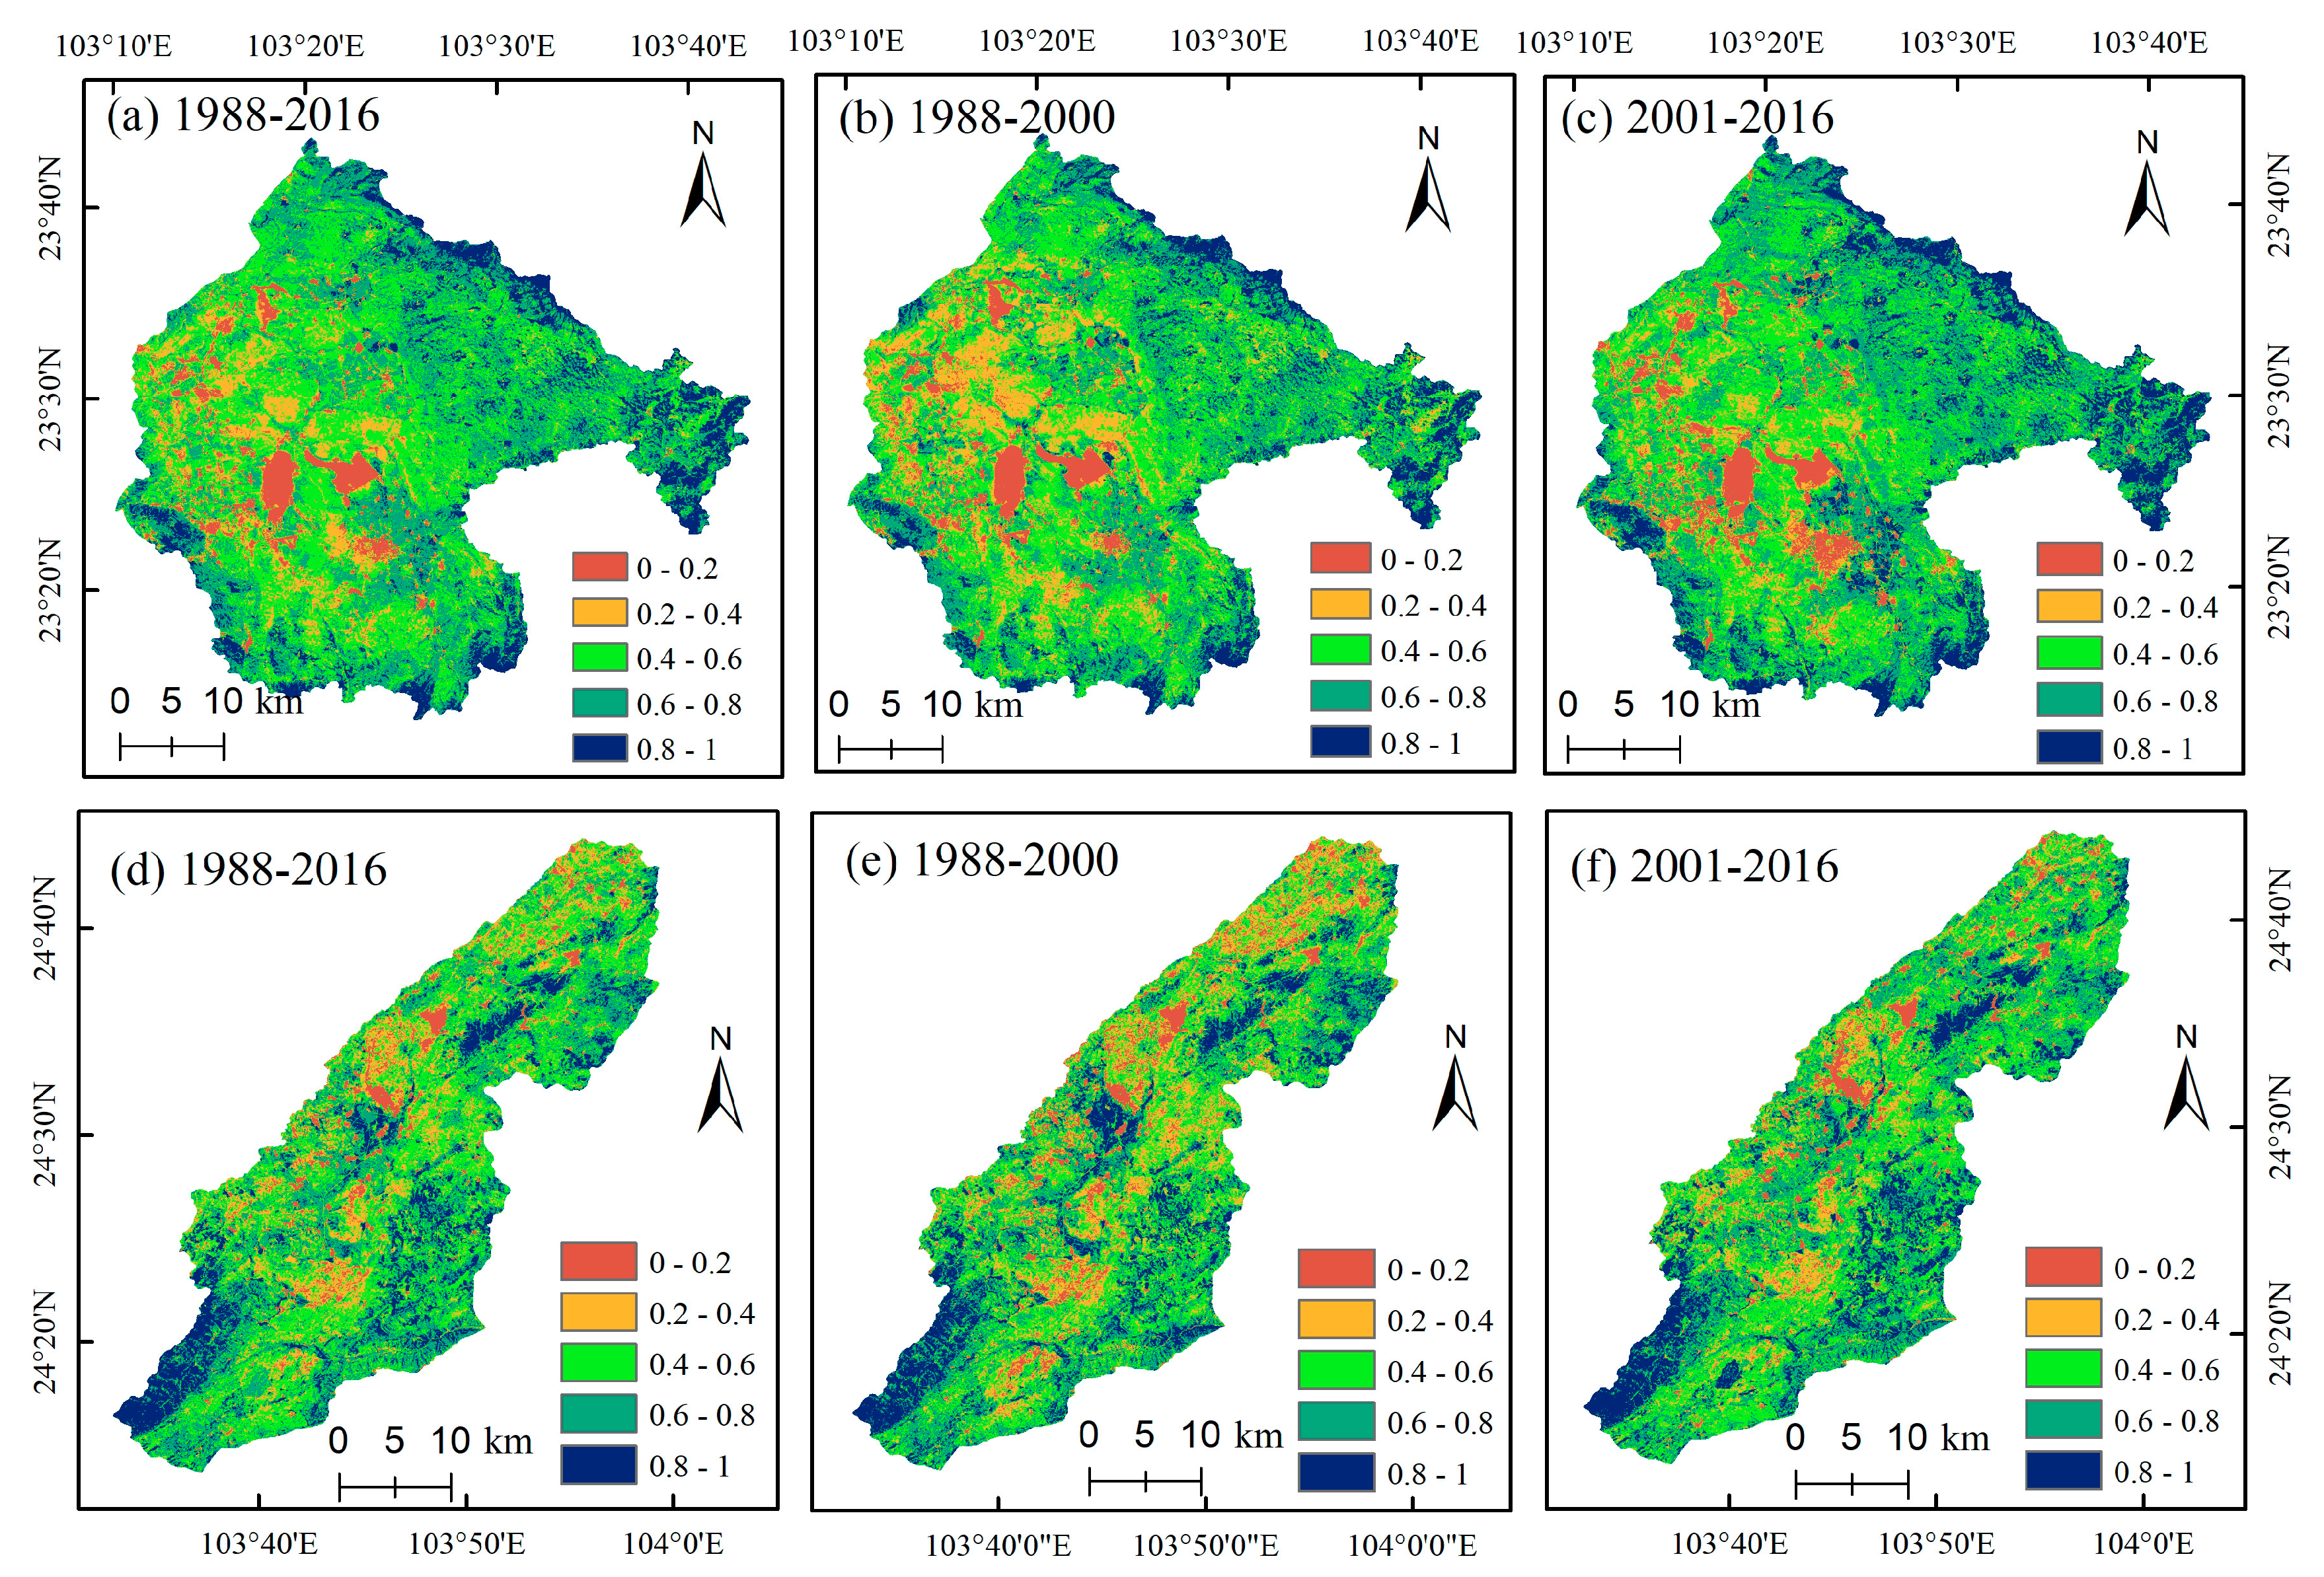
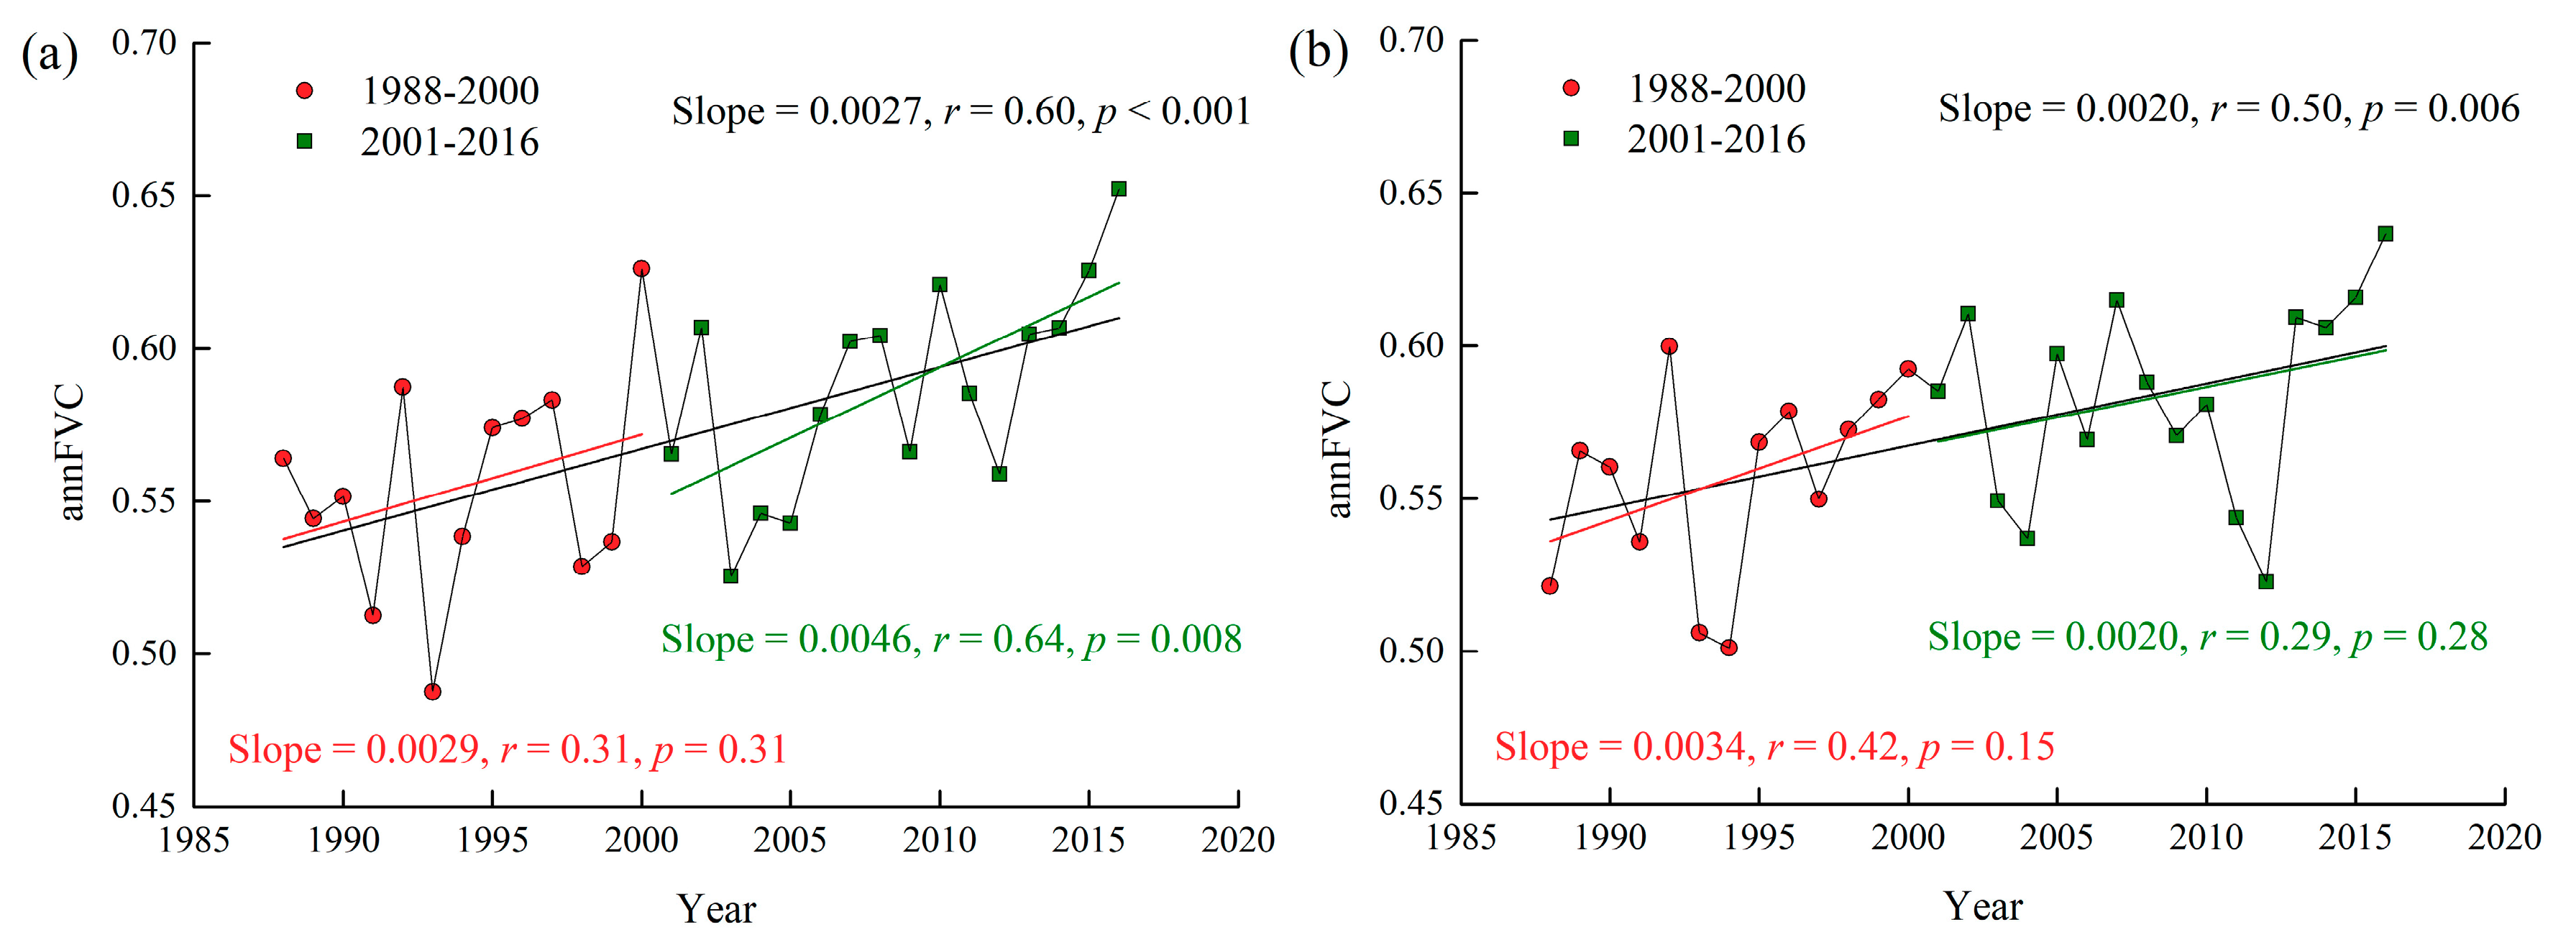
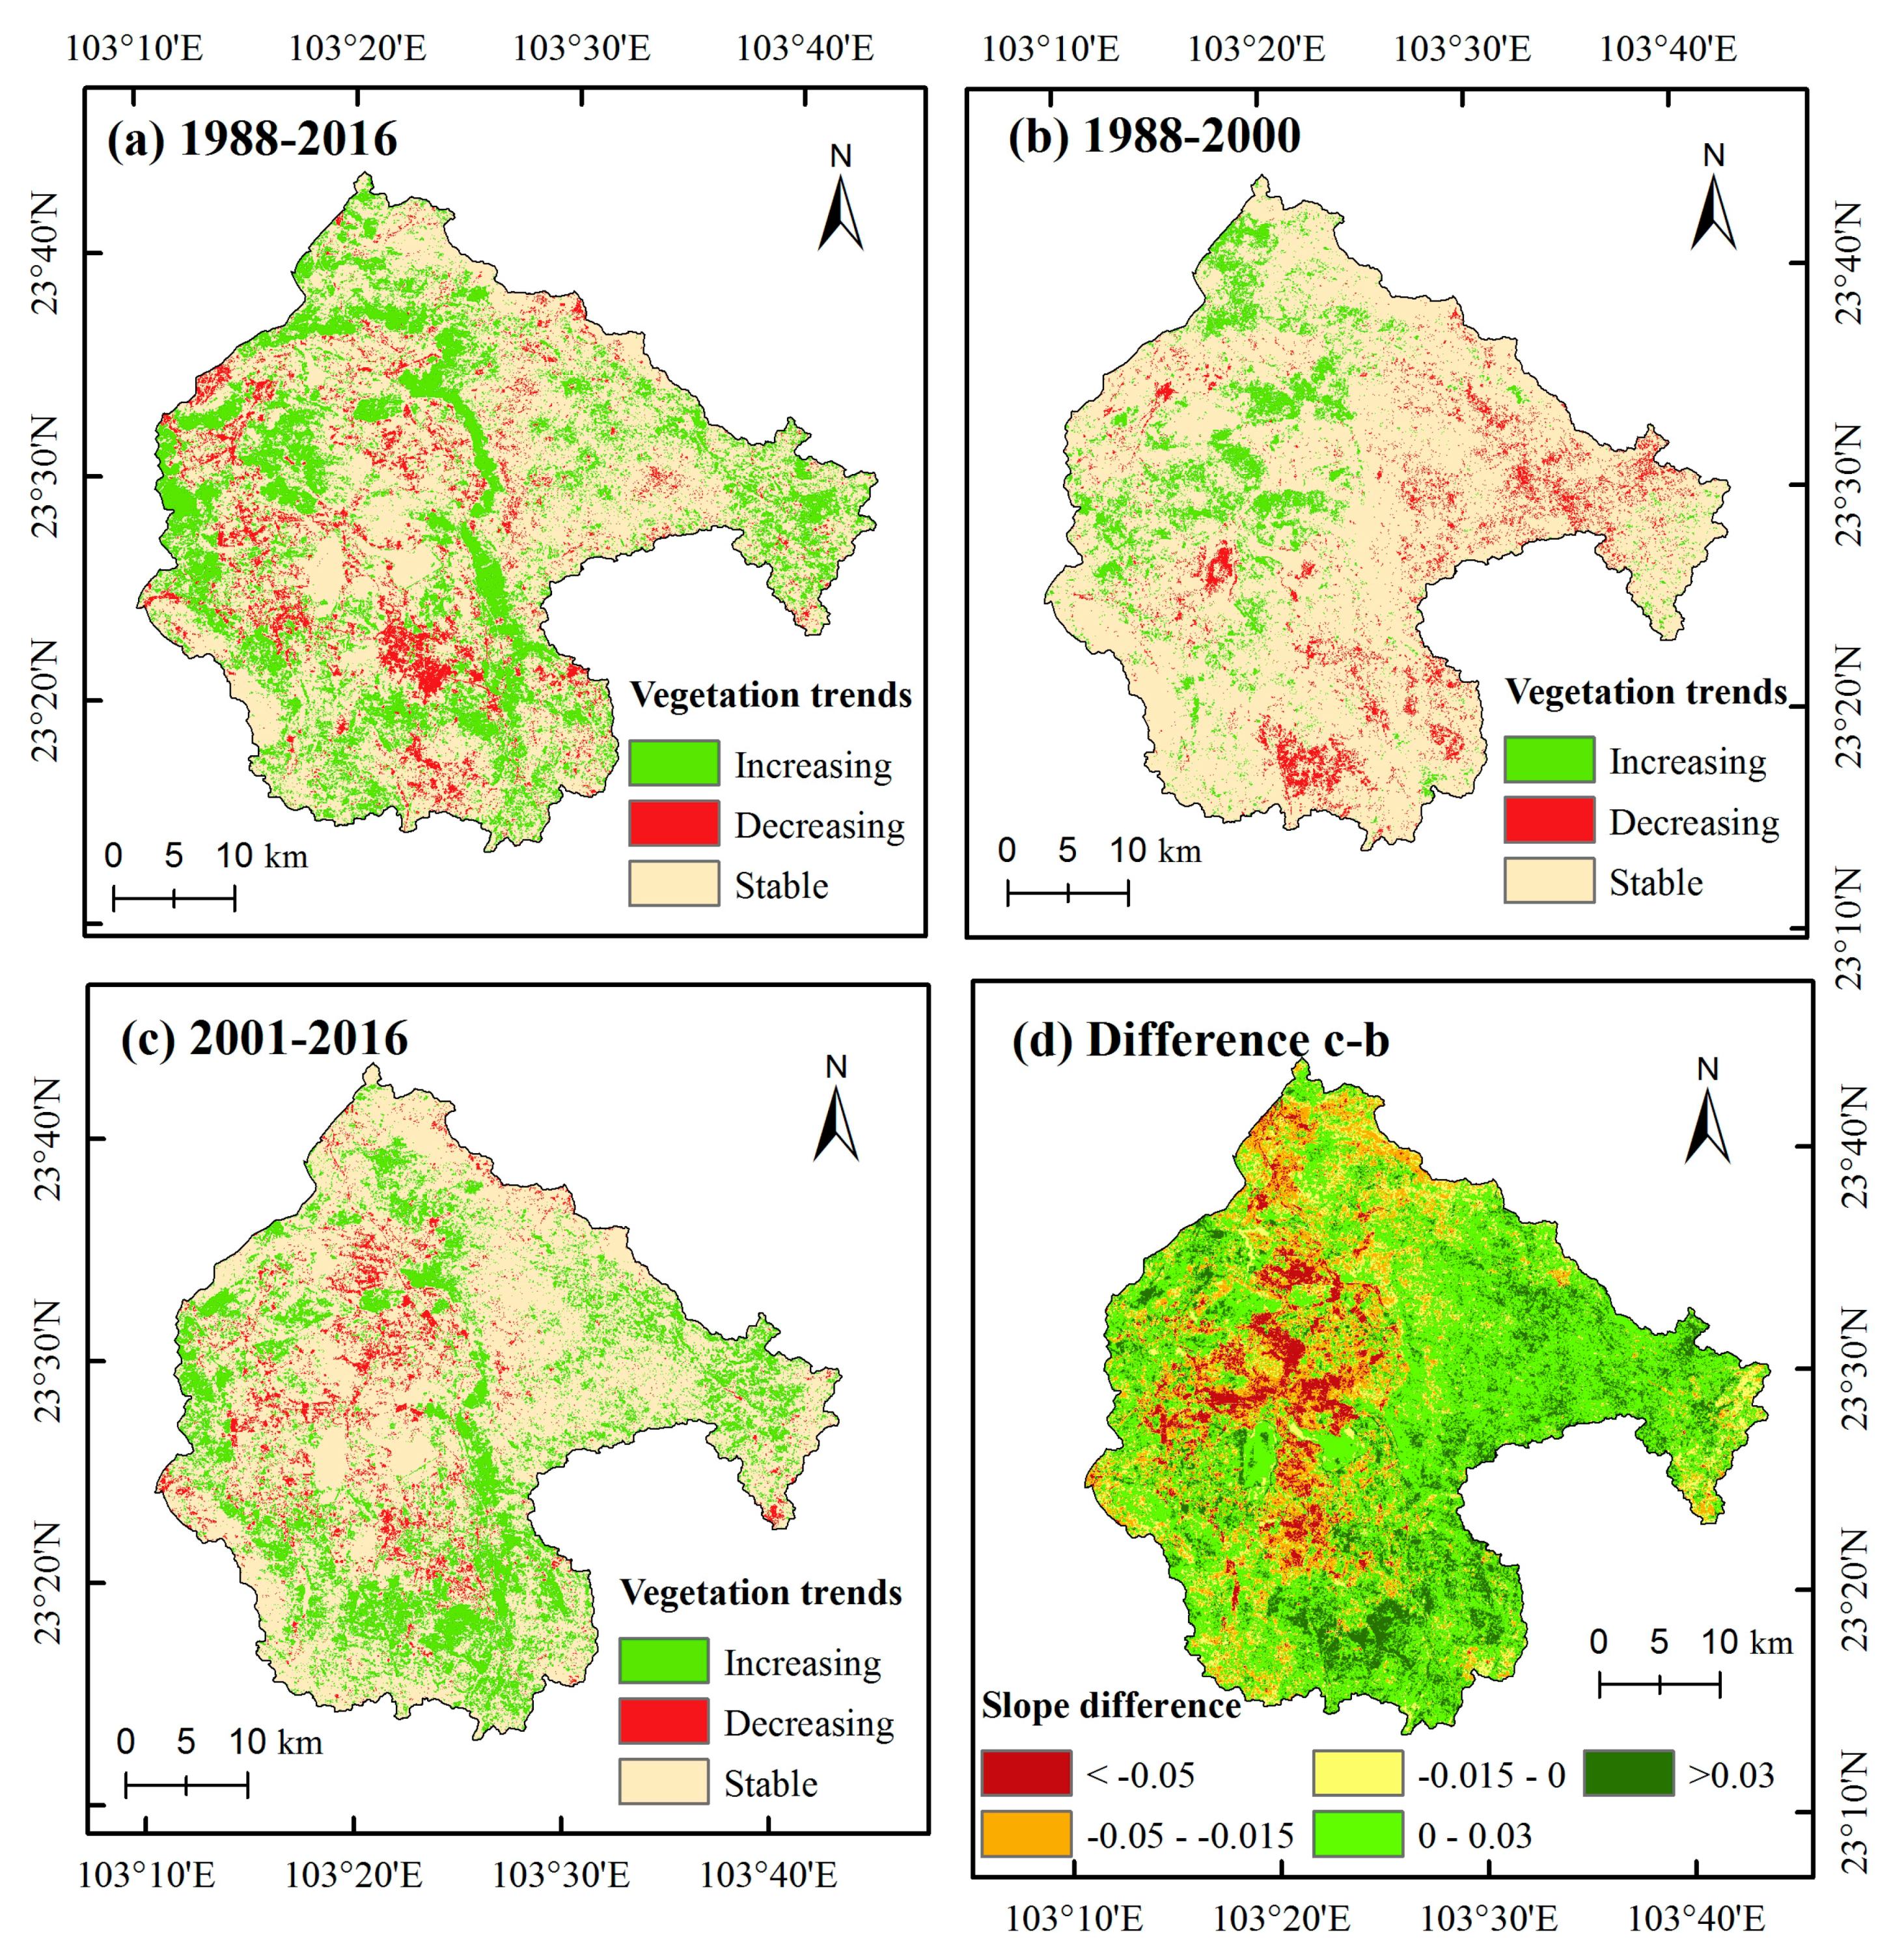
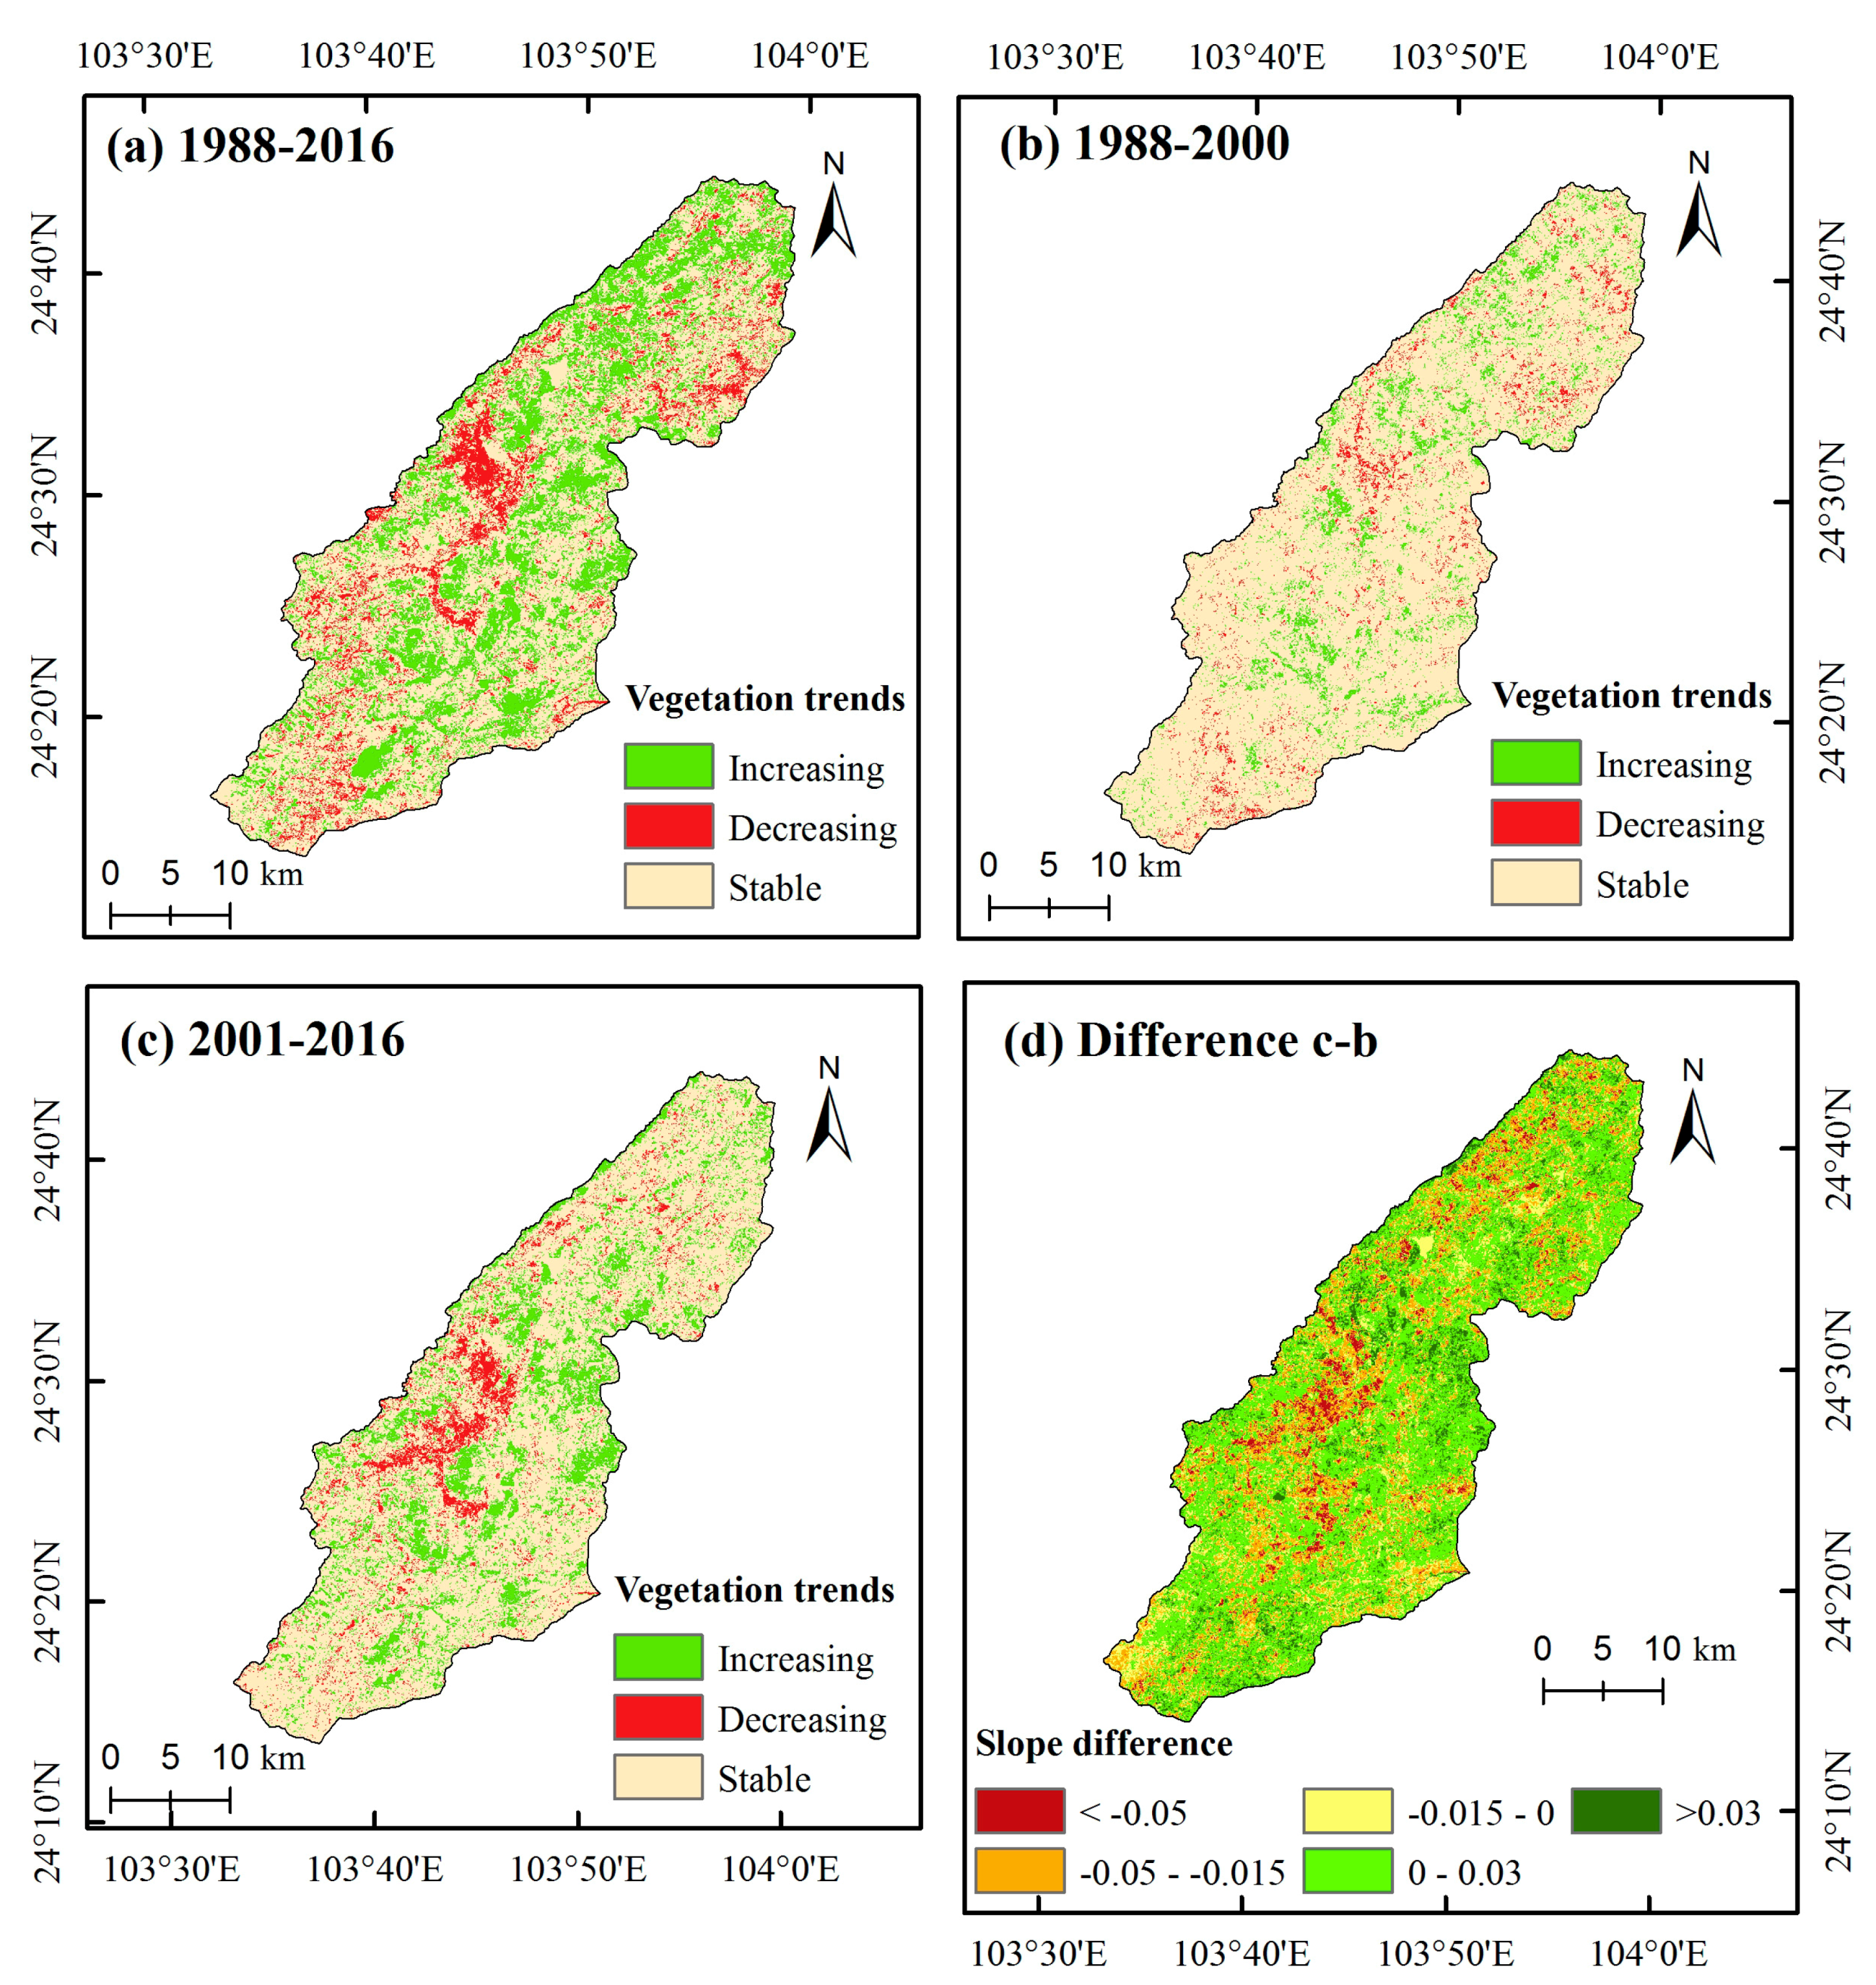
3.2. Spatiotemporal Changes of Annual Growing Season Fractional Vegetation Cover from 1988 to 2016

The average annFVC was 0.5726 in Nandong and 0.5714 in Xiaojiang watershed during 1988-2016, with a high spatial heterogeneity (Figure 4a,d). For both watersheds, the average annFVC during the conservation period (2001–2016) was 0.5869 in Nandong and 0.5836 in Xiaojiang watershed, whereas the average annFVC during the reference period (1988–2000) was 0.5546 in Nandong and 0.5570 in Xiaojiang watershed (Figure 4b,c,e,f). In addition, the spatial pattern of annFVC presented close association with that of land cover types within both watersheds. Specifically, large annFVC values were primarily distributed throughout the mountainous areas dominated by woodland and grassland, while areas with low annFVC values were mainly distributed in basin areas with low elevation whereby built-up land as well as cropland were the dominant cover types.
At the watershed level, the annFVC increased significantly from 0.56 in 1988 to 0.65 in 2016, at a rate of 0.0027 year−1 in Nandong watershed (p < 0.001); a relatively high correlation coefficient (r = 0.60) was calculated during the period 1988-2016 (Figure 5a). The annFVC in Xiaojiang also showed a significant increasing trend, rising from 0.52 to 0.64 over the last 29 years, despite a smaller increase rate and correlation coefficient (slope = 0.0020 year−1, r = 0.50, p = 0.006) (Figure 5b). In Nandong we found an overall insignificant (p = 0.31) increasing trend in annFVC for the reference period and a significant increasing trend for the conservation period with an apparently higher change rate (0.0046 year−1). In contrast, in Xiaojiang the annFVC showed generally insignificant increasing trend over both periods, however, the increase rate (slope = 0.0020 year−1, p = 0.28) during the conservation period was smaller than that of reference period (slope = 0.0034 year−1, p = 0.15). We also found apparent declines in annFVC during some certain short periods despite a generally significant increasing trend over the whole study period. For instance, there was a significant decrease in annFVC from 2010 to 2012 within both watersheds, at the rate of –0.031 year−1 in Nandong and –0.029 year−1 in Xiaojiang watershed. Similarly, sharp declining trends have also been observed during 1992–1993 and 2002–2003, which coincided with the extreme drought weather striking southwest China over these periods [57].
At the pixel scale (30 m), the change trends in annFVC over the past 29 years demonstrated substantial spatial heterogeneity throughout both watersheds as depicted in Figure 6a and Figure 7a. Specifically, for Nandong watershed, a significant increasing trend was found in 25% of the study area (p < 0.05). In contrast, a significant decreasing trend was detected in 8% of all pixels (p < 0.05). Consequently, there were 67% of pixels observed with an insignificant trend (i.e., stable). The contributions of different land types to each of the vegetation change trends in both watersheds are shown in Table 1. Moreover, in the conservation period, more pixels (22%) showed a significant increasing trend in annFVC in contrast to the reference period (9%) (Figure 6b,c). It is noted that trend slope differences between the two periods also presented distinct differences spatially (Figure 6d). Regions characterized with a larger vegetation trend slope (a sign of vegetation growth acceleration) during the conservation period than the reference period covered 58% of the study area. In particular, pixels with the largest slope difference (greater than 0.030 year−1) were primarily located in forests, accounting for 12% of all pixels in Nandong.
In Xiaojiang, 25% of pixels showed a significant increasing trend in annFVC during 1988–2016. Furthermore, a significant decreasing trend was detected in 11% of all pixels. As a consequence, 64% of pixels showed no significant trend in vegetation cover. Likewise, the percentage of pixels with significant increasing trends roughly doubled from 8% prior to 2001 to 17% during the conservation period (Figure 7b,c). In addition, the slope differences between the two periods in Xiaojiang were spatially heterogenous as well (Figure 7d). Regions with a larger vegetation trend slope during the conservation period than the reference period covered 51% of the study area.

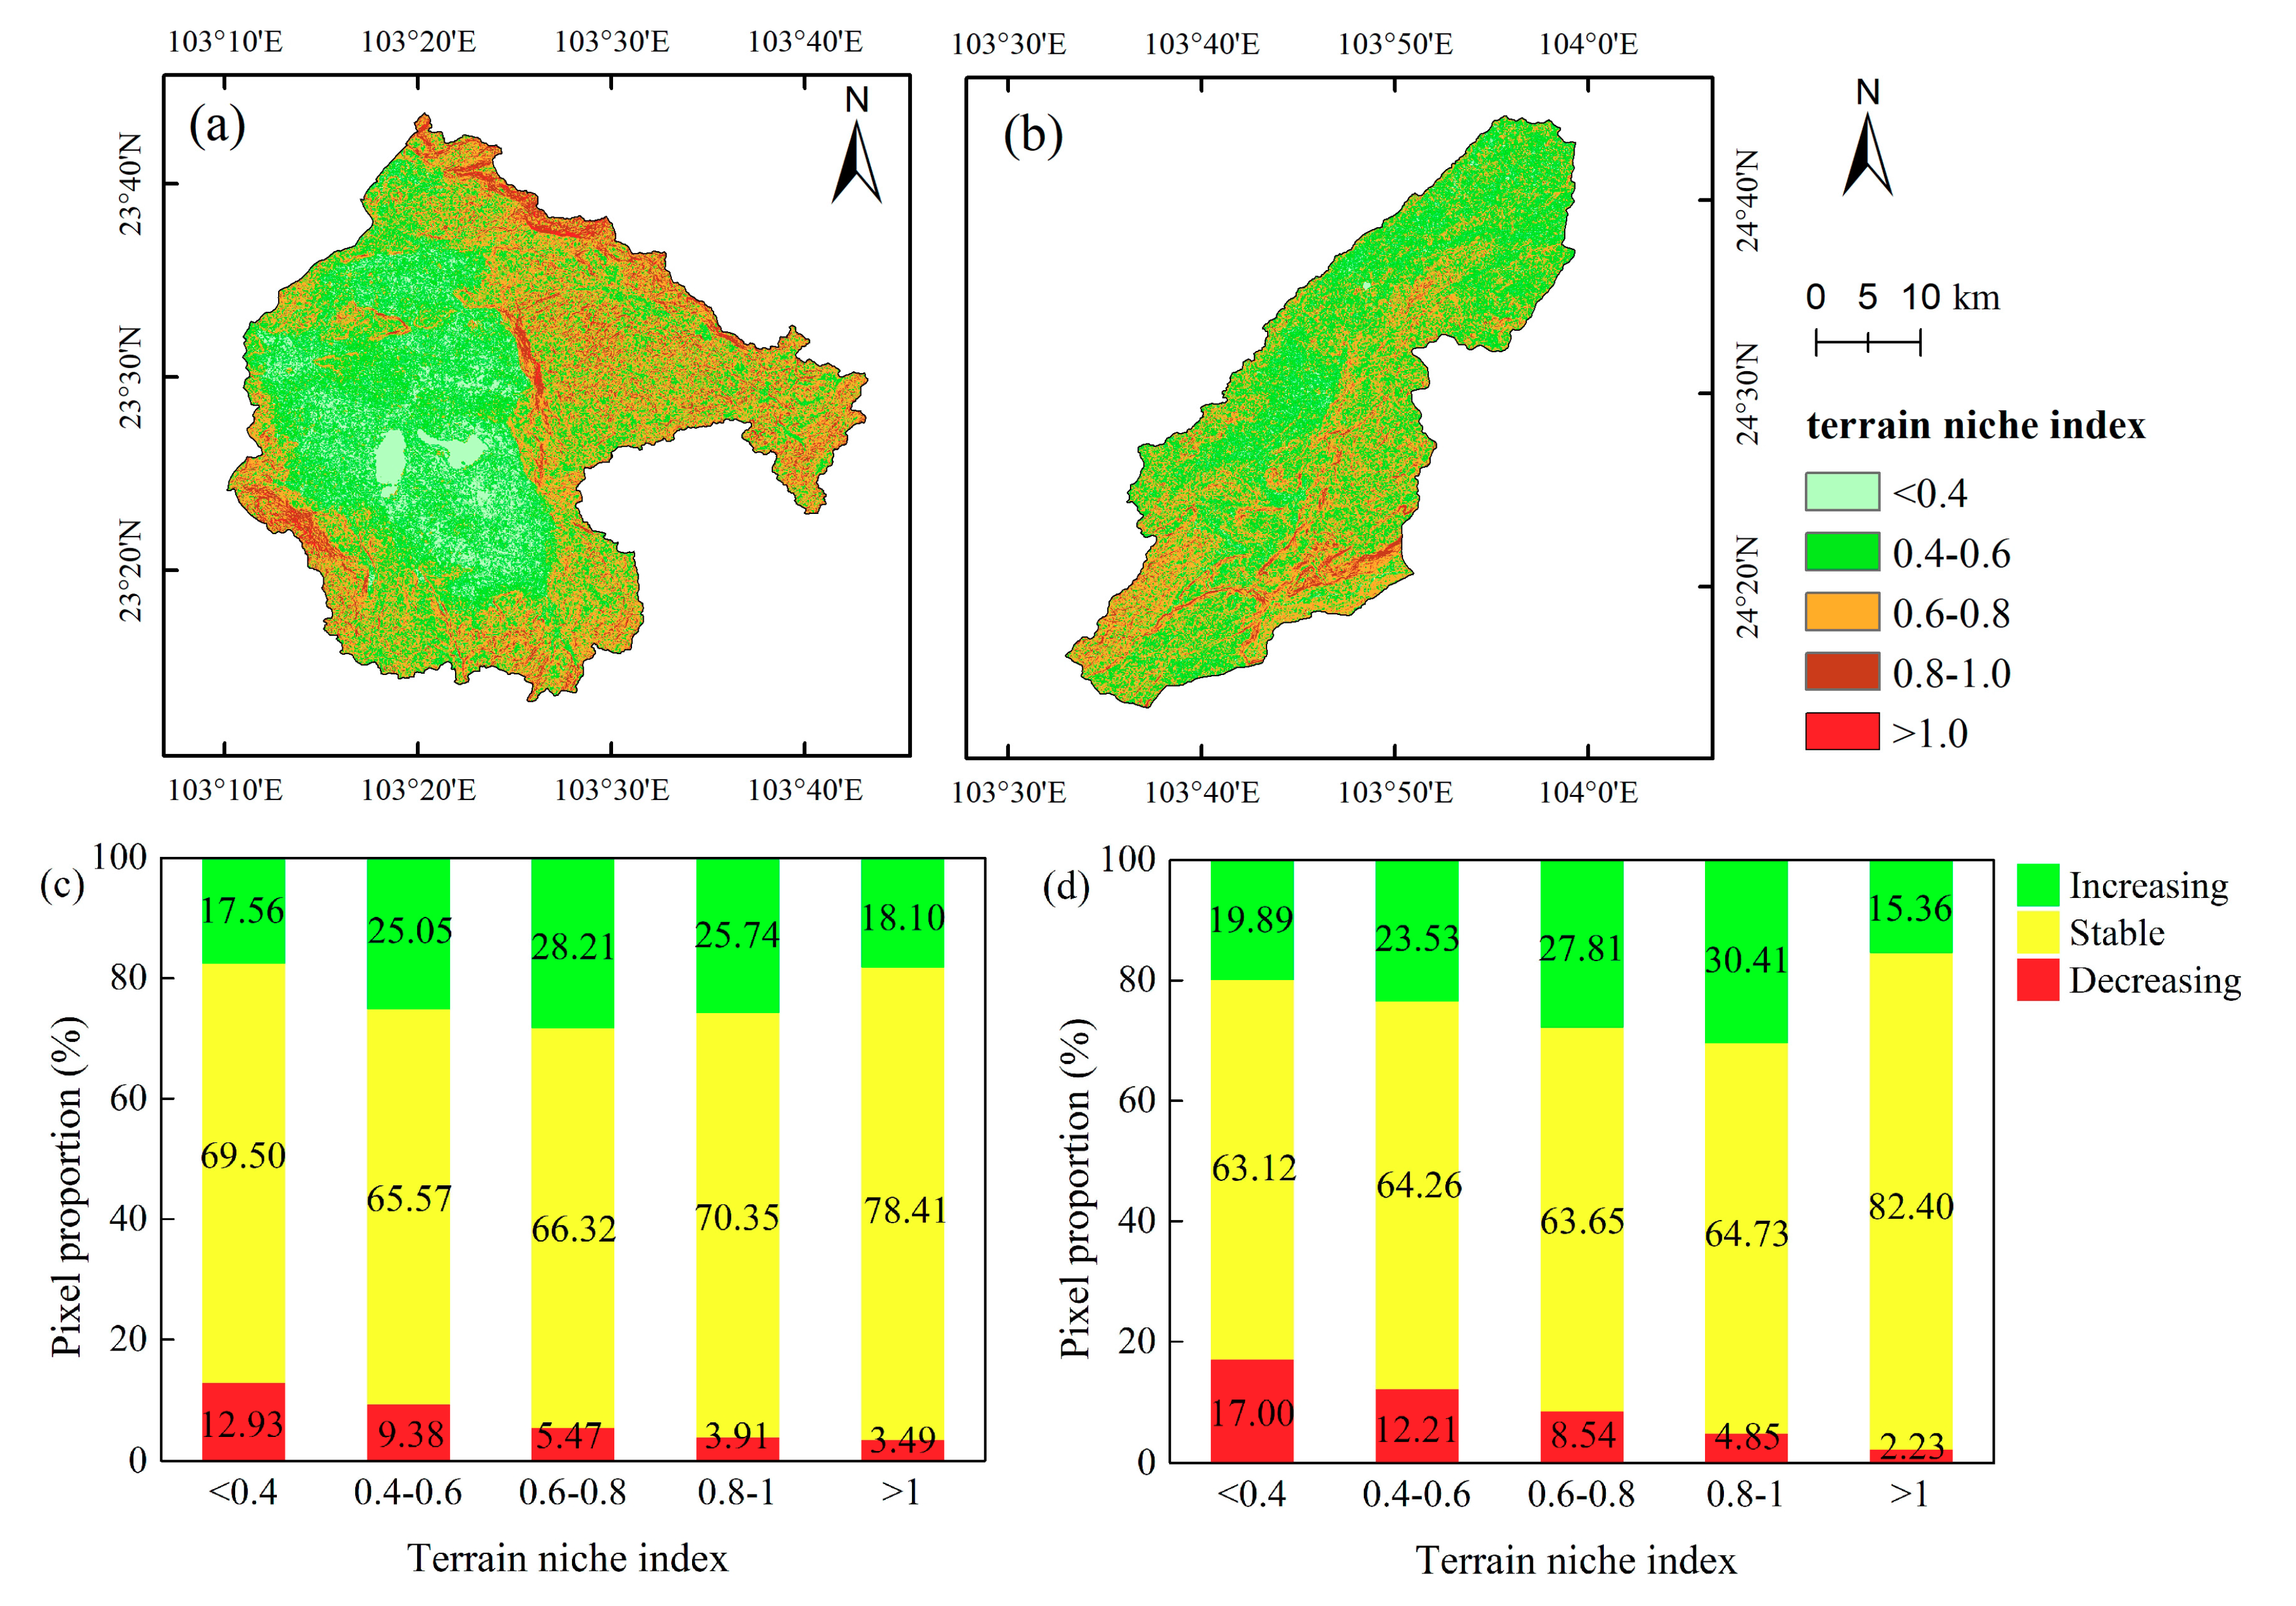
3.3. Response of Vegetation Trends to Topographic Gradients

The terrain niche index (TNI) values within both watersheds showed spatial characteristics of decrease from the mountainous regions to flat basins, which is generally consistent with the spatial distribution of elevation and slope (Figure 8a,b). The TNI layers were overlaid with vegetation trends during 1988–2016 in order to investigate the responses of vegetation change to different terrain gradients, as depicted in Figure 8c,d. For both watersheds, the largest area ratio of vegetation decreasing trends (13% and 17% in Nandong and Xiaojiang, respectively) were identified in regions characterized with a small TNI interval (e.g., between 0 and 0.4), namely low elevation and slope, which were also the areas dominated by anthropogenic influences (e.g., urban and rural residential areas). However, the proportion of pixels that experienced decreasing vegetation cover declines as TNI increases, which might be attributed to reduced human disturbances as the terrain becomes more complex and inaccessible. Conversely, the proportion of pixels that experienced increasing vegetation cover presents a pattern of initial rise followed by a subsequent reduction as TNI increases. The proportion of pixels with stable vegetation cover generally increases as TNI increases, and occupies the dominant position in all TNI intervals, especially in the fifth interval (i.e., TNI > 1).

3.4. Impacts of Lithology on Vegetation Change

As demonstrated in Figure 9a, lithological types have a varying impact on vegetation growth and long-term change. In Nandong, the largest average annFVC (0.67) was found on land with impure carbonate rocks, followed by limestone and dolomite interbedded layer (0.62) and pure limestone (0.60) whereas non-karst rocks had the smallest average annFVC (0.51). Consistent with Nandong, the largest average annFVC (0.65) in Xiaojiang was also found on impure carbonate rocks, followed by non-karst rocks (0.62) and limestone and dolomite interbedded layer (0.54). Additionally, Figure 9b,c showed the proportions of pixels that experienced increasing/decreasing/stable vegetation cover trends under different lithological settings during 1988–2016. Specifically, limestone and dolomite interbedded layer contributed the most to the observed greening trends in both watersheds (29% in Nandong and 28% in Xiaojiang) while non-karst rocks had the largest share of decreasing trends (13% in Nandong and 17% in Xiaojiang). Moreover, the largest share of pixels (68%) presenting stable vegetation trends in Nandong was also found in areas underlain by non-karst rocks, suggesting small interannual fluctuations in vegetation cover in non-karst regions. In contrast, impure carbonate rocks had the largest share (70%) of stable trends in Xiaojiang watershed.

4. Discussion

4.1. Spatiotemporal Variations in Vegetation Greenness

Increased vegetation cover has been confirmed in two of the rocky desertification-stricken karst watersheds in southwest China using nearly three-decade of 30 m resolution satellite observations. Although a growing body of research has previously reached similar conclusions in karst regions of southwest China (Table 2) they were unable to yield a clearer picture of small-scale changes due to the coarse resolution of satellite images being used.
Small-scale variability is important considering the intricately mosaicked landscape, huge relief in topography and the resulting high spatial heterogeneity in karst areas [58], thereby leading to abundant niches for vegetation growth because of the large variation in soil properties [23]. Tong et al. [16] used the climate-NDVI regression model to quantify the human-induced vegetation restoration in southwest China by applying 8-km resolution GIMMS 3g NDVI data set. However, they recognized the coarse spatial resolution may conceal small scale degradation in spite of largely observed greening trends. Despite the significant increase in annFVC, it also presented a decreasing trend in some parts of the regions (Figure 6a and Figure 7a), which is in line with the results of Sun et al. [59] and Zheng et al. [60].
Karst rocky desertification induced by excessive anthropogenic disturbances (i.e., deforestation, unsustainable farming and overgrazing) may be one of the primary reasons responsible for the decline in annFVC [12]. To be specific, in parallel with the recent economic boom and population growth (Figure S4), there has been a steep rise in land requirements for human settlements and production activities in both watersheds (e.g., agricultural farming and industrial production). In this case, a large number of lands have been reclaimed unreasonably and unsustainably, for instance, cultivation on steep slopes [35]. Human beings have long put excessive pressure on the already ecologically fragile karst ecosystem, leading to large-scale land degradation and the appearance of rocky desertification (Figure 1a). Consequently, the state-funded afforestation and conservation projects have been widely carried out in both watersheds since 2001. In order to quantify the differences in vegetation trends before and after implementation of afforestation and conservation efforts, we conducted the Mann–Kendall trend analysis for the periods of 1988–2000 and 2001–2016. Our analysis revealed further intensified increasing trends in annFVC during the conservation period at the pixel level in both watersheds (Figure 6b,c and Figure 7b,c). This is consistent with the study conducted by Liao et al. [61], in which ecosystem health has been largely enhanced in 73% of a karst region in Guangxi province, southwest China during the period of restoration projects. Furthermore, over 50% of pixels exhibited a larger increase rate in the conservation period compared with the reference period (Figure 6d and Figure 7d). Taken together, more pixels presented a significant increasing trend coupled with an accelerating speed when the ecological restoration projects have been fully implemented throughout both watersheds. The similar phenomenon has also been reported by Sun et al. [59], in which a particularly higher increase rate was found in the Loess Plateau after the implementation of the Grain for Green Project.

4.2. Response of Vegetation Change to Topography

Although previous research has investigated the impacts of topography on the vegetation recovery in karst terrain as reported by Helmer et al. [62], the response of vegetation change to topographic gradients under the complex karst geological background has not been well studied in southwest China. Here, we attempted to clarify the underlying mechanisms.
In the present study, we adopted a terrain niche index, or TNI, to quantify the variations in both elevation and slope. Our results showed that regions with TNI value less than 0.4 are the most easily exploited habitats for vegetation growth since these areas have the largest percentage of pixels presenting significant decreasing trends (Figure 8c,d). This is largely because these areas are usually topographically flat basins suitable for human residential use, industrial and transportation activities, thereby resulting in remarkable vegetation degradation locally. Yet, this decreasing trend will be weakened within higher TNI intervals (i.e., higher elevations and larger slopes) due to the increased inaccessibility for human beings. Contrastingly, increasing vegetation trends were enhanced as the TNI increased, with its area ratio peaking when TNI ranged from 0.6 to 0.8 in Nandong (28%) and 0.8 to 1 in Xiaojiang (30%). However, this significant increasing trend was thereafter abated as the TNI increased. This is due principally to the fact that when TNI began to increase, vegetation growth conditions improved because there were less anthropogenic impacts in rough terrain. It is also worth noting that soils are typically slow to form in karst regions under the combined influences of highly soluble carbonate rock types, hydrological systems and climate [14,23]. Consequently, soil cover is generally scarce and soil layers are thin especially in high slope areas [11]. In addition, natural elements essential for plant growth such as N, P and other nutrients are also insufficient in karst environments [63]. Hence, it is easily understood that with the further increase of TNI, the vegetation growth improvement is impeded by limited supplies of soil nutrients under rough terrain conditions. Furthermore, the regions with high elevation and large slope angles are also hotspots for inducing soil erosion under heavy rainfall [64]. Moreover, because steep landscapes are not suitable for water conservation, vegetation in these areas is more vulnerable to droughts [19].

4.3. Response of Vegetation Change to Lithology

Our results showed that impure carbonate rocks had the highest annFVC in both watersheds (Figure 9a), which is because impure rock areas have more silicate mineral content in the rocks in contrast to pure limestone and dolomite, and topsoil layers are comparatively thick, thereby creating better growth environment for improved vegetation cover [11]. Instead, rocky desertification is more likely and frequently to arise in areas where pure limestone and dolomite dominate due to the low soil formation rate especially for limestone [14]. Besides, our findings indicated that limestone and dolomite interbedded layer, or LD, contributed the largest share of vegetation increasing trends coupled with the least share of decreasing trends in both watersheds (Figure 9b,c), implying that the areas where LD dominates are more likely to recover the vegetation community from degraded ecosystems. In contrast, non-karst areas produced the largest share of decreasing trends in annFVC together with the least share of increasing trends, which demonstrated that vegetations in non-karst areas are less resilient relative to karst regions. This is because the non-karst regions are more suitable for the use of cropland and human settlement, which restrains the vegetation from recovering. The similar phenomenon has also been reported by Helmer et al. [62] and [65]. Therefore, special attention should be paid to these regions to prevent further vegetation degradation. Overall, our study contributes to increasing the ability to discern important driving mechanisms of vegetation change in karst regions by investigating the influence of karst lithology on vegetation restoration of degraded karst ecosystems.

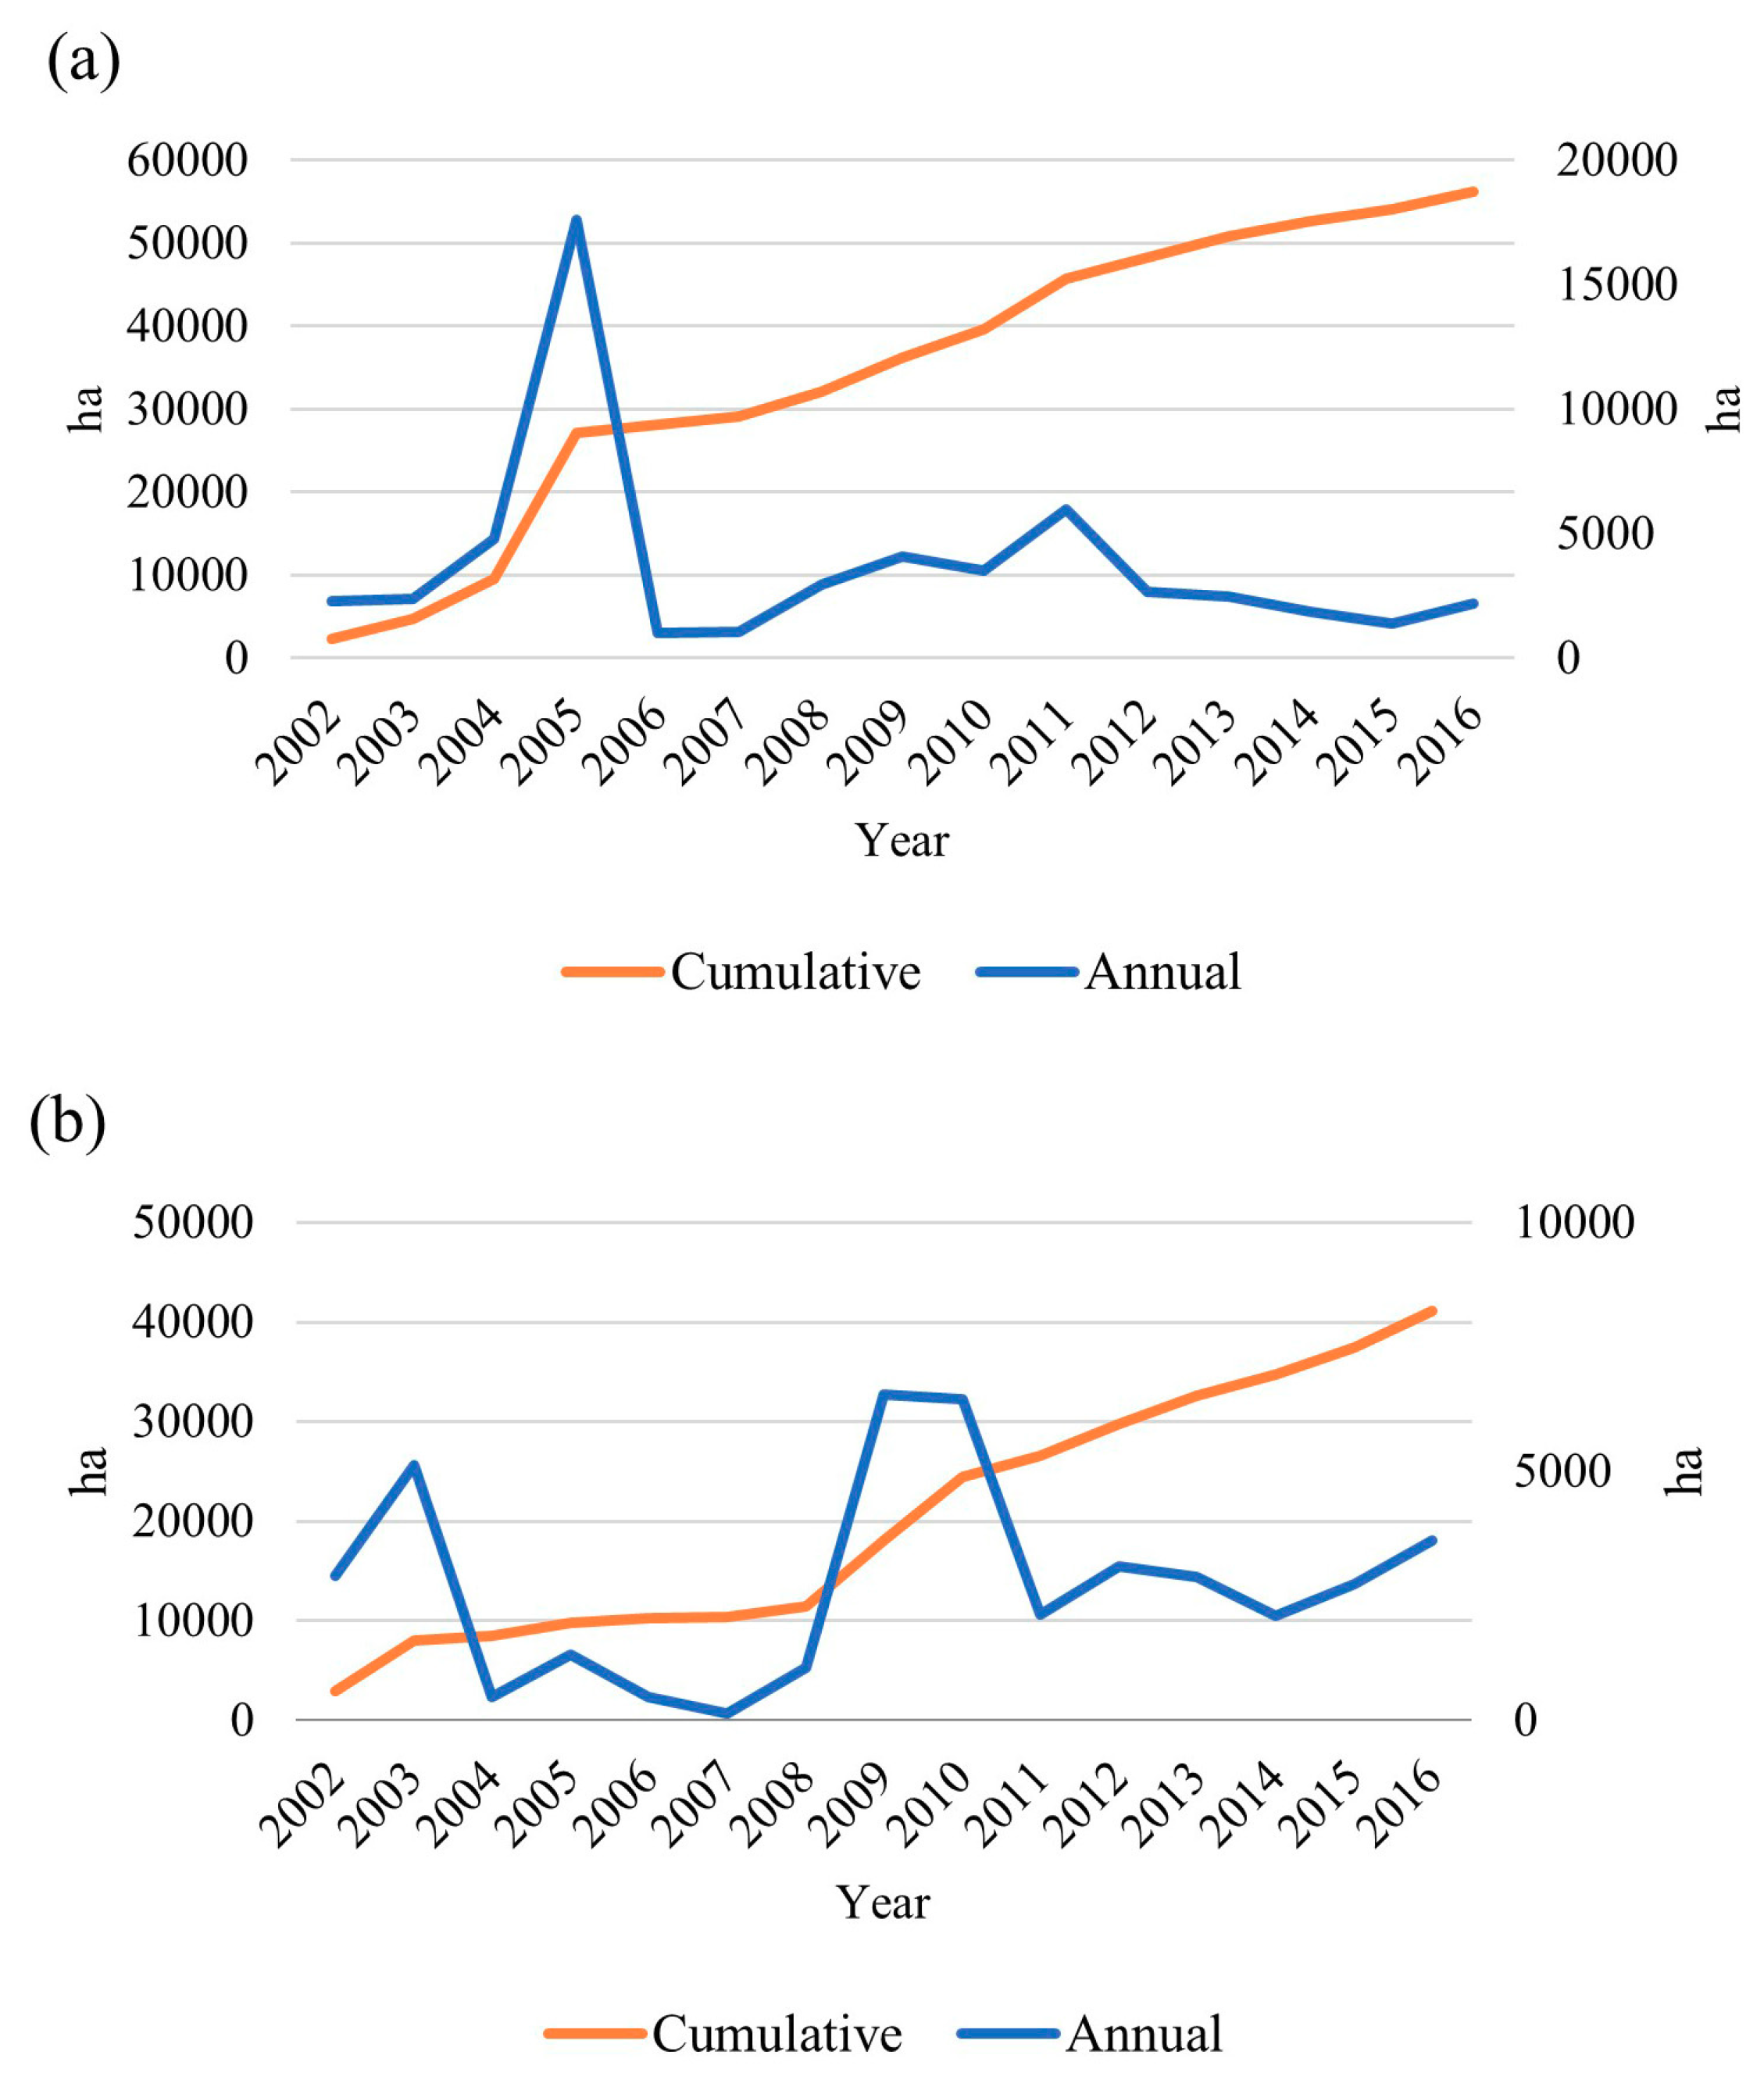
4.4. Effects of Ecological Restoration Activities on Vegetation Recovery

A comprehensive understanding of the mechanisms driving the vegetation change is a first, yet critical, step towards a more accurate prediction of future vegetation change [4]. It is well recognized that there are two primary drivers of vegetation changes [54], namely, climatic factors, which is closely related to vegetation growth and distribution [66], and human-dominated land use change and management [5]. Our results indicated that at the watershed level, there were no significant correlations observed between vegetation change and climatic variables (i.e., temperature and precipitation) in both watersheds (Figure S5). In the meanwhile, at the pixel level, the most parts of both watersheds had no significant relationships between vegetation cover and climatic variables (i.e., temperature and precipitation) as demonstrated by the partial correlation analysis (Figure S6). The result is in accordance with Cai et al. [17], in which the annual average temperature and precipitation only explained 0.9–37% of the annual changes in the NDVI in the southwest China karst area. In the meanwhile, the relationship between precipitation and vegetation cover was even weaker than for temperature in both watersheds, confirming the results of Tong et al. [19]. This is largely because the climatic conditions in karst areas of southwest China are characterized by subtropical monsoon with abundant precipitation together with moderate temperature [67]. Thus, unlike arid and semi-arid areas where rainfall availability is a primary limiting factor that affects vegetation cover [68], vegetation growth is not sensitive to slight changes in precipitation in karst areas. In addition, the karst regions also have the above and below-ground hydrological systems, which causes the surface runoff to flow into the underground water system through crevices, sinkholes and rivers, in spite of rich rainfall during the growing season [23]. As a result, it is indicated that precipitation is unable to be fully used for the purpose of vegetation growth, and it is likely to give rise to drought weather in this region [69]. To compare the responses of vegetation changes to climate variables between the reference period and conservation period, we also conducted separate partial correlation analysis for both periods. Yet, the results showed that statistically insignificant and weaker correlations have been found in more pixels in both periods in relation to the whole period 1988–2016 (Figure S6). Additionally, the relationships between vegetation cover and climatic factors varied spatially [55], which has also been revealed by other studies. For instance, Sun et al. [59] found that temperature was positively correlated to the vegetation cover in the central and southeastern parts of the Loess Plateau whereas a negative relationship between the two variables was also found in the northwestern part of the plateau because of the vegetation degradation caused by climate warming.
Moreover, both watersheds generally presented warmer and drier climatic characteristics, especially after 2001 (Figure S7), which is consistent with other related studies in the southwest karst areas of China. For example, Liu et al. [70] found the annual average temperature has increased in the majority meteorological ground stations in southwest China, at an average increase rate of 0.16 °C per decade. The increasingly warming and drying climate after 2001 is not conducive to vegetation growth as reported by Li et al. [71]. However, vegetation cover exhibited a stronger significant increasing trend during 2001–2016 in contrast to the years prior to 2001 (Figure 6 and Figure 7), suggesting that the improvement in vegetation cover could be largely attributed to other non-climate factors. This is confirmed by the residual analysis in our study, which demonstrated that 70.37% of all pixels in Nandong and 64.67% of pixels in Xiaojiang watershed showed an increasing trend in residuals (Figure 10), indicating that both watersheds were dominated by human-induced vegetation recovery through substantial investments in afforestation and conservation projects starting in 2001 despite unfavorable climate conditions [13]. To be specific, by the end of 2016, a total of 562.73 km2 and 410.78 km2 of afforested areas, primarily located in sloping hills, have been planted with trees in Nandong and Xiaojiang watersheds, respectively (Figure 11). This is supported by the result of Tong et al. [21], which concluded that regions of high conservation efforts correspond to positive trends in vegetation growth in the karst regions of southwest China. Numerous studies have also highlighted the positive impacts of conservation efforts on vegetation restoration in China in recent years. For instance, Viña et al. [72] demonstrated that the Natural Forest Conservation Program (NFCP) exhibited a significant positive relationship with forest recovery in China from 2000 to 2010. Similarly, Wen et al. [73] found that ecological restoration projects exert positive impacts on vegetation greening in the Three Gorges Reservoir Region, China.
Although local farmers will receive economic compensation for planting trees designed for ecosystem services gains [35], the income from grain production and subsidies is much higher than the compensation standard for ecological engineering, leading to the recurrence of deforestation and cultivation in steep slopes in some areas. This could partly explain the decreasing trends in vegetation cover observed in both watersheds (Figure 6 and Figure 7). The primary criterion for selecting tree species is the growth rate of the trees, a limited number of fast-growing species are therefore preferred in reality, leading to vastly increasing monocultural plantations [74]. The artificially planted forests may be unable to provide sufficient biodiversity and ecosystem services in contrast to natural forests, and the monoculture is also susceptible to the risks of pests or fires [75].
Meanwhile, given that the occurrence of extreme weather events tends to be more frequent and intensified [57], extreme droughts are very likely to pose a significant threat hindering the future development of planted trees [76], and may thus mask the effectiveness of the afforestation and conservation projects. Hence, it is necessary to select more drought-resistant plant species for future afforestation activities. Furthermore, in order to avoid threats and damage to the local biodiversity, ecological risk assessment and scientific management are in urgent needs for restoration practitioners [77]. At present, vegetation restoration is still in a primary stage, and is expected to be a long-term process. There is great potential for vegetation restoration in these areas in the future [59].

4.5. Limitations and Future Research Directions

The availability of long time series of Earth Observation data allows for rapid monitoring and mapping of vegetation change at varying temporal and spatial scales [78,79,80]. To our knowledge, the present study is the first to quantitatively assess high-resolution vegetation change in karst regions of southwest China using all available Landsat imagery over nearly three decades. Considering the massive data volume (2,497 Landsat scenes being used in this study), the state-of-art Google Earth Engine platform has been the key to the success of implementation. The efficiency of data processing was enhanced, backed by Google’s powerful cloud-based parallel computation [81]. However, there still exist several limitations that should be addressed in the future study.
First, despite the abundant good-quality Landsat observations (with the clouds and shadows being masked) in large parts of the two watersheds (Figure S2), it is unavoidable that some pixels had relatively fewer good observations (to a minimum of 3–5 valid observations) in a single year, which is due primarily to the cloudy and rainy weather especially over the growing season in the karst regions of southwest China [23]. This however could lead to some uncertainties in vegetation cover estimation. The similar phenomenon has also been reported by Wang et al. [36]. Second, our study mainly quantified the correlations between the annFVC and the simultaneous climatic factors and did not take into account the time-lag effects of climatic factors on vegetation growth [54]. Many recent studies have reported that the impacts of climate change on vegetation can display a time lag [82,83]. Xu et al. [84] revealed the vegetation responses to temperature and precipitation lagged by over two months in southwest China. Therefore, the minimal consideration of the time-lag effects may fail to clarify the actual mechanism of climate-vegetation interactive effects [54], and potentially lead to an increase in uncertainty of the results [85].
Third, it is noticeable that karst landforms are diverse, mainly including Karst Plateau, Peak Cluster Depression, Karst Basin, Karst Trough Valley, Middle-high Hill, Karst Gorge and Peak Forest Plain [16]. Yet, few studies have systematically reported the differences in vegetation restoration and influencing mechanisms among different karst landforms.
Finally, our study employed the annual growing season FVC (annFVC) as a proxy for the indicator quantifying the best vegetation growth status during a single year, whereas the spatial and temporal dynamics of vegetation seasonal changes have not yet been considered.

5. Conclusions

We investigated the spatial and temporal patterns of vegetation change and associated drivers in two typical karst watersheds of southwest China over the past 29 years (1988–2016). Our results indicated that both Nandong and Xiaojiang watersheds exhibited significant increasing trends in annual fractional vegetation cover (annFVC) during 1988-2016, at an increase rate of 0.0027 year−1 and 0.0020 year−1, respectively and the greening trends have been intensifying during the conservation period (2001–2016). Vegetation change is actively sensitive to the variations of topographic gradients and lithological types. The climate in both watersheds has become warmer and drier, especially in recent decades. Yet, climate change has played a minor role in vegetation recovery in both watersheds. Instead, human-induced ecological restoration projects are mainly responsible for the greening trends. Our study provides an applicable framework for the rapid monitoring and mapping of vegetation change in karst regions over a large area at a fine spatial scale.

Supplementary Materials

The following are available online at https://0-www-mdpi-com.brum.beds.ac.uk/2072-4292/11/17/2044/s1, Figure S1: The amount of Landsat scenes collected and processed via the Google Earth Engine platform in Nandong and Xiaojiang watersheds from 1988 to 2016, Figure S2: The spatial distribution of the good-quality Landsat observation numbers at the pixel scale from 1988 to 2016 in: (a) Nandong and (b) Xiaojiang watershed, Figure S3: The spatial distribution of the 29 meteorological ground stations across Yunnan Province, southwest China, Figure S4: The socioeconomic development during 1996-2016 in (a) Nandong and (b) Xiaojiang watersheds, Figure S5: The relationships between annual fractional vegetation cover (annFVC) and spatially averaged annual mean temperature together with annual total precipitation during 1988-2016, Figure S6: The spatial distribution of the relationships between annFVC and temperature and precipitation, and Figure S7: Climate change during the last 29 years in the karst watersheds of Nandong and Xiaojiang watersheds.

Author Contributions

Conceptualization, J.P., L.W. and Z.N.; methodology, J.P., L.W. and Z.N.; formal analysis, J.P., X.W., N.H., J.G., H.T., Y.Y., S.X., Lei W. and Q.Y.; investigation, J.C.; writing—original draft preparation, J.P.; writing—review and editing, J.P., M.K., X.S. and L.W.; funding acquisition, L.W.

Funding

This research was funded by the National Key Research and Development Project under grant number 2016YFC0502501, and the National Natural Science Foundation of China under grant number 41871347.

Acknowledgments

The authors would like to thank Google Earth Engine team to provide free access to the cloud-computing platform. We also thank U.S. Geological Survey for sharing the Landsat dataset.

Conflicts of Interest

The authors declare no conflict of interest.

References

  1. Chen, B.; Xu, G.; Coops, N.C.; Ciais, P.; Innes, J.L.; Wang, G.; Myneni, R.B.; Wang, T.; Krzyzanowski, J.; Li, Q.; et al. Changes in vegetation photosynthetic activity trends across the Asia–Pacific region over the last three decades. Remote Sens. Environ. 2014, 144, 28–41. [Google Scholar] [CrossRef]
  2. Ciais, P.; Reichstein, M.; Viovy, N.; Granier, A.; Ogée, J.; Allard, V.; Aubinet, M.; Buchmann, N.; Bernhofer, C.; Carrara, A.; et al. Europe-wide reduction in primary productivity caused by the heat and drought in 2003. Nature 2005, 437, 529–533. [Google Scholar] [CrossRef] [PubMed]
  3. Zhao, M.; Running, S.W. Drought-induced reduction in global terrestrial net primary production from 2000 through 2009. Science 2010, 329, 940–943. [Google Scholar] [CrossRef] [PubMed]
  4. Zhu, Z.; Piao, S.; Myneni, R.B.; Huang, M.; Zeng, Z.; Canadell, J.G.; Ciais, P.; Sitch, S.; Friedlingstein, P.; Arneth, A.; et al. Greening of the Earth and its drivers. Nat. Clim. Chang. 2016, 6, 791–795. [Google Scholar] [CrossRef]
  5. Chen, C.; Park, T.; Wang, X.; Piao, S.; Xu, B.; Chaturvedi, R.K.; Fuchs, R.; Brovkin, V.; Ciais, P.; Fensholt, R.; et al. China and India lead in greening of the world through land-use management. Nat. Sustain. 2019, 2, 122–129. [Google Scholar] [CrossRef] [PubMed]
  6. Piao, S.; Yin, G.; Tan, J.; Cheng, L.; Huang, M.; Li, Y.; Liu, R.; Mao, J.; Myneni, R.B.; Peng, S.; et al. Detection and attribution of vegetation greening trend in China over the last 30 years. Glob. Chang. Biol. 2015, 21, 1601–1609. [Google Scholar] [CrossRef]
  7. Stow, D.A.; Hope, A.; McGuire, D.; Verbyla, D.; Gamon, J.; Huemmrich, F.; Houston, S.; Racine, C.; Sturm, M.; Tape, K.; et al. Remote sensing of vegetation and land-cover change in Arctic Tundra Ecosystems. Remote Sens. Environ. 2004, 89, 281–308. [Google Scholar] [CrossRef] [Green Version]
  8. Fang, W.; Huang, S.; Huang, Q.; Huang, G.; Wang, H.; Leng, G.; Wang, L.; Guo, Y. Probabilistic assessment of remote sensing-based terrestrial vegetation vulnerability to drought stress of the Loess Plateau in China. Remote Sens. Environ. 2019, 232, 111290. [Google Scholar] [CrossRef]
  9. Li, L.; Zhang, Y.; Liu, L.; Wu, J.; Wang, Z.; Li, S.; Zhang, H.; Zu, J.; Ding, M.; Paudel, B. Spatiotemporal Patterns of Vegetation Greenness Change and Associated Climatic and Anthropogenic Drivers on the Tibetan Plateau during 2000–2015. Remote Sens. 2018, 10, 1525. [Google Scholar] [CrossRef]
  10. Song, Y.; Jin, L.; Wang, H. Vegetation changes along the Qinghai-Tibet Plateau engineering corridor since 2000 induced by climate change and human activities. Remote Sens. 2018, 10, 95. [Google Scholar] [CrossRef]
  11. Jiang, Z.; Lian, Y.; Qin, X. Rocky desertification in Southwest China: Impacts, causes, and restoration. Earth-Sci. Rev. 2014, 132, 1–12. [Google Scholar] [CrossRef]
  12. Pei, J.; Wang, L.; Huang, N.; Geng, J.; Cao, J.; Niu, Z. Analysis of Landsat-8 OLI Imagery for Estimating Exposed Bedrock Fractions in Typical Karst Regions of Southwest China Using a Karst Bare-Rock Index. Remote Sens. 2018, 10, 1321. [Google Scholar] [CrossRef]
  13. Brandt, M.; Yue, Y.; Wigneron, J.P.; Tong, X.; Tian, F.; Jepsen, M.R.; Xiao, X.; Verger, A.; Mialon, A.; Al-Yaari, A.; et al. Satellite-Observed Major Greening and Biomass Increase in South China Karst During Recent Decade. Earth Future 2018, 6, 1017–1028. [Google Scholar] [CrossRef]
  14. Wang, S.J.; Liu, Q.M.; Zhang, D.F. Karst rocky desertification in southwestern China: Geomorphology, landuse, impact and rehabilitation. Land Degrad. Dev. 2004, 15, 115–121. [Google Scholar] [CrossRef]
  15. Yue, Y.; Wang, K.; Liu, B.; Li, R.; Zhang, B.; Chen, H.; Zhang, M. Development of new remote sensing methods for mapping green vegetation and exposed bedrock fractions within heterogeneous landscapes. Int. J. Remote Sens. 2013, 34, 5136–5153. [Google Scholar] [CrossRef]
  16. Tong, X.; Wang, K.; Yue, Y.; Brandt, M.; Liu, B.; Zhang, C.; Liao, C.; Fensholt, R. Quantifying the effectiveness of ecological restoration projects on long-term vegetation dynamics in the karst regions of Southwest China. Int. J. Appl. Earth Obs. Geoinf. 2017, 54, 105–113. [Google Scholar] [CrossRef]
  17. Cai, H.; Yang, X.; Wang, K.; Xiao, L. Is forest restoration in the southwest China Karst promoted mainly by climate change or human-induced factors? Remote Sens. 2014, 6, 9895–9910. [Google Scholar] [CrossRef]
  18. Wang, J.; Wang, K.; Zhang, M.; Zhang, C. Impacts of climate change and human activities on vegetation cover in hilly southern China. Ecol. Eng. 2015, 81, 451–461. [Google Scholar] [CrossRef]
  19. Tong, X.; Wang, K.; Brandt, M.; Yue, Y.; Liao, C.; Fensholt, R. Assessing future vegetation trends and restoration prospects in the karst regions of southwest China. Remote Sens. 2016, 8, 357. [Google Scholar] [CrossRef]
  20. Hou, W.; Gao, J.; Wu, S.; Dai, E. Interannual variations in growing-season NDVI and its correlation with climate variables in the southwestern karst region of China. Remote Sens. 2015, 7, 11105–11124. [Google Scholar] [CrossRef]
  21. Tong, X.; Brandt, M.; Yue, Y.; Horion, S.; Wang, K.; De Keersmaecker, W.; Tian, F.; Schurgers, G.; Xiao, X.; Luo, Y.; et al. Increased vegetation growth and carbon stock in China karst via ecological engineering. Nat. Sustain. 2018, 1, 44–50. [Google Scholar] [CrossRef]
  22. Liu, H.; Zhang, M.; Lin, Z.; Xu, X. Spatial heterogeneity of the relationship between vegetation dynamics and climate change and their driving forces at multiple time scales in Southwest China. Agric. Forest Meteorol. 2018, 256, 10–21. [Google Scholar] [CrossRef]
  23. Zhang, C.; Qi, X.; Wang, K.; Zhang, M.; Yue, Y. The application of geospatial techniques in monitoring karst vegetation recovery in southwest China: A review. Prog. Phys. Geogr. 2017, 41, 450–477. [Google Scholar] [CrossRef]
  24. Wang, S.; Ji, H.; Ouyang, Z.; Zhou, D.; Zhen, L.; Li, T. Preliminary study on weathering and pedogenesis of carbonate rock. Sci. China Ser. D Earth Sci. 1999, 42, 572–581. [Google Scholar] [CrossRef]
  25. Feng, Z.; Wang, S.; Sun, C.; Liu, X. Particle distribution characteristic of red weathering crust in Pingba County, Guizhou and its genetic indication. Acta Mineral. Sin. 2002, 22, 6. [Google Scholar]
  26. Wang, S.J.; Li, R.L.; Sun, C.X.; Zhang, D.F.; Li, F.Q.; Zhou, D.Q.; Xiong, K.N.; Zhou, Z.F. How types of carbonate rock assemblages constrain the distribution of karst rocky desertified land in Guizhou Province, PR China: Phenomena and mechanisms. Land Degrad. Dev. 2004, 15, 123–131. [Google Scholar] [CrossRef]
  27. Woodcock, C.E.; Allen, R.; Anderson, M.; Belward, A.; Bindschadler, R.; Cohen, W.; Gao, F.; Goward, S.N.; Helder, D.; Helmer, E.; et al. Free access to Landsat imagery. Science 2008, 320, 1011. [Google Scholar] [CrossRef]
  28. Wulder, M.A.; Masek, J.G.; Cohen, W.B.; Loveland, T.R.; Woodcock, C.E. Opening the archive: How free data has enabled the science and monitoring promise of Landsat. Remote Sens. Environ. 2012, 122, 2–10. [Google Scholar] [CrossRef]
  29. Qi, X.; Wang, K.; Zhang, C. Effectiveness of ecological restoration projects in a karst region of southwest China assessed using vegetation succession mapping. Ecol. Eng. 2013, 54, 245–253. [Google Scholar] [CrossRef]
  30. Wang, M.; Liang, X.; Wei, X.; Li, X. Landscape pattern analysis on change of fractional vegetation cover between karst and no-karst areas: A case study in Hechi District, Guangxi Zhuang Autonomous Region. Acta Ecol. Sin. 2014, 34, 3435–3443. [Google Scholar] [CrossRef]
  31. Gorelick, N.; Hancher, M.; Dixon, M.; Ilyushchenko, S.; Thau, D.; Moore, R. Google Earth Engine: Planetary-scale geospatial analysis for everyone. Remote Sens. Environ. 2017, 202, 18–27. [Google Scholar] [CrossRef]
  32. Robinson, N.; Allred, B.; Jones, M.; Moreno, A.; Kimball, J.; Naugle, D.; Erickson, T.; Richardson, A. A dynamic Landsat derived normalized difference vegetation index (NDVI) product for the conterminous United States. Remote Sens. 2017, 9, 863. [Google Scholar] [CrossRef]
  33. Hansen, M.C.; Potapov, P.V.; Moore, R.; Hancher, M.; Turubanova, S.; Tyukavina, A.; Thau, D.; Stehman, S.; Goetz, S.; Loveland, T.R.; et al. High-resolution global maps of 21st-century forest cover change. Science 2013, 342, 850–853. [Google Scholar] [CrossRef] [PubMed]
  34. Pekel, J.-F.; Cottam, A.; Gorelick, N.; Belward, A.S. High-resolution mapping of global surface water and its long-term changes. Nature 2016, 540, 418–422. [Google Scholar] [CrossRef] [PubMed]
  35. Delang, C.O.; Yuan, Z. China’s Grain for Green Program; Springer: Heidelberg, Germany, 2015. [Google Scholar] [CrossRef]
  36. Wang, X.; Xiao, X.; Zou, Z.; Chen, B.; Ma, J.; Dong, J.; Doughty, R.B.; Zhong, Q.; Qin, Y.; Dai, S.; et al. Tracking annual changes of coastal tidal flats in China during 1986–2016 through analyses of Landsat images with Google Earth Engine. Remote Sens. Environ. 2018. [Google Scholar] [CrossRef]
  37. Tucker, C.J. Red and photographic infrared linear combinations for monitoring vegetation. Remote Sens. Environ. 1979, 8, 127–150. [Google Scholar] [CrossRef] [Green Version]
  38. Wu, Y.; Tang, G.; Gu, H.; Liu, Y.; Yang, M.; Sun, L. The variation of vegetation greenness and underlying mechanisms in Guangdong province of China during 2001–2013 based on MODIS data. Sci. Total Environ. 2019, 653, 536–546. [Google Scholar] [CrossRef]
  39. Mueller, T.; Dressler, G.; Tucker, C.; Pinzon, J.; Leimgruber, P.; Dubayah, R.; Hurtt, G.; Böhning-Gaese, K.; Fagan, W. Human land-use practices lead to global long-term increases in photosynthetic capacity. Remote Sens. 2014, 6, 5717–5731. [Google Scholar] [CrossRef]
  40. Statistical Bureau of Yunnan Province; Survey Office of the National Bureau of Statistics in Yunnan. Yunnan Statistical Yearbook; China Statistics Press: Beijing, China, 2017.
  41. State Forestry Administration. China Forestry Yearbook; China Forestry Press: Beijing, China, 2017. [Google Scholar]
  42. Gitelson, A.A.; Kaufman, Y.J.; Stark, R.; Rundquist, D. Novel algorithms for remote estimation of vegetation fraction. Remote Sens. Environ. 2002, 80, 76–87. [Google Scholar] [CrossRef] [Green Version]
  43. Zhang, X.; Liao, C.; Li, J.; Sun, Q. Fractional vegetation cover estimation in arid and semi-arid environments using HJ-1 satellite hyperspectral data. Int. J. Appl. Earth Obs. Geoinf. 2013, 21, 506–512. [Google Scholar] [CrossRef]
  44. Jiang, M.; Tian, S.; Zheng, Z.; Zhan, Q.; He, Y. Human activity influences on vegetation cover changes in Beijing, China, from 2000 to 2015. Remote Sens. 2017, 9, 271. [Google Scholar] [CrossRef]
  45. Tong, S.; Zhang, J.; Ha, S.; Lai, Q.; Ma, Q. Dynamics of fractional vegetation coverage and its relationship with climate and human activities in Inner Mongolia, China. Remote Sens. 2016, 8, 776. [Google Scholar] [CrossRef]
  46. Wang, F.; Pan, X.; Gerlein-Safdi, C.; Cao, X.; Wang, S.; Gu, L.; Wang, D.; Lu, Q. Vegetation restoration in N orthern China: A contrasted picture. Land Degrad. Dev. 2019. [Google Scholar] [CrossRef]
  47. Xie, X.; Du, P.; Xia, J.; Luo, J. Spectral indices for estimating exposed carbonate rock fraction in karst areas of southwest China. IEEE Geosci. Remote Sens. Lett. 2015, 12, 1988–1992. [Google Scholar] [CrossRef]
  48. Tian, H.; Li, W.; Wu, M.; Huang, N.; Li, G.; Li, X.; Niu, Z. Dynamic monitoring of the largest freshwater lake in China using a new water index derived from high spatiotemporal resolution Sentinel-1A data. Remote Sens. 2017, 9, 521. [Google Scholar] [CrossRef]
  49. Mann, H.B. Nonparametric tests against trend. Econom. J. Econom. Soc. 1945, 13, 245–259. [Google Scholar] [CrossRef]
  50. Kendall, M.G. Rank Correlation Methods; Griffin: Oxford, UK, 1948. [Google Scholar]
  51. De Jong, R.; de Bruin, S.; de Wit, A.; Schaepman, M.E.; Dent, D.L. Analysis of monotonic greening and browning trends from global NDVI time-series. Remote Sens. Environ. 2011, 115, 692–702. [Google Scholar] [CrossRef] [Green Version]
  52. Yang, L.; Jia, K.; Liang, S.; Liu, M.; Wei, X.; Yao, Y.; Zhang, X.; Liu, D. Spatio-temporal analysis and uncertainty of fractional vegetation cover change over northern China during 2001–2012 based on multiple vegetation data sets. Remote Sens. 2018, 10, 549. [Google Scholar] [CrossRef]
  53. Sen, P.K. Estimates of the regression coefficient based on Kendall’s tau. J. Am. Stat. Assoc. 1968, 63, 1379–1389. [Google Scholar] [CrossRef]
  54. Wu, D.; Zhao, X.; Liang, S.; Zhou, T.; Huang, K.; Tang, B.; Zhao, W. Time-lag effects of global vegetation responses to climate change. Glob. Chang. Biol. 2015, 21, 3520–3531. [Google Scholar] [CrossRef]
  55. Song, Y.; Ma, M. A statistical analysis of the relationship between climatic factors and the Normalized Difference Vegetation Index in China. Int. J. Remote Sens. 2011, 32, 3947–3965. [Google Scholar] [CrossRef]
  56. Yang, Q.; Zhang, H.; Peng, W.; Lan, Y.; Luo, S.; Shao, J.; Chen, D.; Wang, G. Assessing climate impact on forest cover in areas undergoing substantial land cover change using Landsat imagery. Sci. Total Environ. 2019, 659, 732–745. [Google Scholar] [CrossRef] [PubMed]
  57. Long, D.; Shen, Y.; Sun, A.; Hong, Y.; Longuevergne, L.; Yang, Y.; Li, B.; Chen, L. Drought and flood monitoring for a large karst plateau in Southwest China using extended GRACE data. Remote Sens. Environ. 2014, 155, 145–160. [Google Scholar] [CrossRef]
  58. Zhang, M.; Wang, K.; Zhang, C.; Chen, H.; Liu, H.; Yue, Y.; Luffman, I.; Qi, X. Using the radial basis function network model to assess rocky desertification in northwest Guangxi, China. Environ. Earth Sci. 2011, 62, 69–76. [Google Scholar] [CrossRef]
  59. Sun, W.; Song, X.; Mu, X.; Gao, P.; Wang, F.; Zhao, G. Spatiotemporal vegetation cover variations associated with climate change and ecological restoration in the Loess Plateau. Agric. Forest Meteorol. 2015, 209, 87–99. [Google Scholar] [CrossRef]
  60. Zheng, K.; Wei, J.-Z.; Pei, J.-Y.; Cheng, H.; Zhang, X.-L.; Huang, F.-Q.; Li, F.-M.; Ye, J.-S. Impacts of climate change and human activities on grassland vegetation variation in the Chinese Loess Plateau. Sci. Total Environ. 2019, 660, 236–244. [Google Scholar] [CrossRef] [PubMed]
  61. Liao, C.; Yue, Y.; Wang, K.; Fensholt, R.; Tong, X.; Brandt, M. Ecological restoration enhances ecosystem health in the karst regions of southwest China. Ecol. Indic. 2018, 90, 416–425. [Google Scholar] [CrossRef]
  62. Helmer, E.; Brandeis, T.J.; Lugo, A.E.; Kennaway, T. Factors influencing spatial pattern in tropical forest clearance and stand age: Implications for carbon storage and species diversity. J. Geophys. Res. Biogeosci. 2008, 113. [Google Scholar] [CrossRef] [Green Version]
  63. Cao, J.; Yuan, D.; Pan, G. Some soil features in karst ecosystem. Adv. Earth Sci. 2003, 18, 8. [Google Scholar] [CrossRef]
  64. Zhang, D.; Wang, S.; Zhou, D.; Li, R. Intrinsic driving mechanism of land rocky desertification in karst regions of Guizhou Province. Bull. Soil Water Conserv. 2001, 21, 1–5. [Google Scholar]
  65. Helmer, E.; Ruzycki, T.; Wilson, B.; Sherrill, K.; Lefsky, M.; Marcano-Vega, H.; Brandeis, T.; Erickson, H.; Ruefenacht, B. Tropical deforestation and recolonization by exotic and native trees: Spatial patterns of tropical forest biomass, functional groups, and species counts and links to stand age, geoclimate, and sustainability goals. Remote Sens. 2018, 10, 1724. [Google Scholar] [CrossRef]
  66. Liu, S.; Huang, S.; Xie, Y.; Wang, H.; Huang, Q.; Leng, G.; Li, P.; Wang, L. Spatial-temporal changes in vegetation cover in a typical semi-humid and semi-arid region in China: Changing patterns, causes and implications. Ecol. Indic. 2019, 98, 462–475. [Google Scholar] [CrossRef]
  67. Chen, X.; Zhang, Y.; Zhou, Y.; Zhang, Z. Analysis of hydrogeological parameters and numerical modeling groundwater in a karst watershed, southwest China. Carbonates Evaporites 2013, 28, 89–94. [Google Scholar] [CrossRef]
  68. Bai, J.; Shi, H.; Yu, Q.; Xie, Z.; Li, L.; Luo, G.; Jin, N.; Li, J. Satellite-observed vegetation stability in response to changes in climate and total water storage in Central Asia. Sci. Total Environ. 2019, 659, 862–871. [Google Scholar] [CrossRef] [PubMed]
  69. Fan, Z.X.; Bräuning, A.; Thomas, A.; Li, J.B.; Cao, K.F. Spatial and temporal temperature trends on the Yunnan Plateau (Southwest China) during 1961–2004. Int. J. Climatol. 2011, 31, 2078–2090. [Google Scholar] [CrossRef]
  70. Liu, B.; Chen, C.; Lian, Y.; Chen, J.; Chen, X. Long-term change of wet and dry climatic conditions in the southwest karst area of China. Glob. Planet. Chang. 2015, 127, 1–11. [Google Scholar] [CrossRef]
  71. Li, X.; Li, Y.; Chen, A.; Gao, M.; Slette, I.J.; Piao, S. The impact of the 2009/2010 drought on vegetation growth and terrestrial carbon balance in Southwest China. Agric. For. Meteorol. 2019, 269, 239–248. [Google Scholar] [CrossRef]
  72. Viña, A.; McConnell, W.J.; Yang, H.; Xu, Z.; Liu, J. Effects of conservation policy on China’s forest recovery. Sci. Adv. 2016, 2, e1500965. [Google Scholar] [CrossRef]
  73. Wen, Z.; Wu, S.; Chen, J.; Lü, M. NDVI indicated long-term interannual changes in vegetation activities and their responses to climatic and anthropogenic factors in the Three Gorges Reservoir Region, China. Sci. Total Environ. 2017, 574, 947–959. [Google Scholar] [CrossRef]
  74. Hua, F.; Wang, X.; Zheng, X.; Fisher, B.; Wang, L.; Zhu, J.; Tang, Y.; Douglas, W.Y.; Wilcove, D.S. Opportunities for biodiversity gains under the world’s largest reforestation programme. Nat. Commun. 2016, 7, 12717. [Google Scholar] [CrossRef]
  75. Cao, S. Impact of China’s large-scale ecological restoration program on the environment and society in arid and semiarid areas of China: Achievements, problems, synthesis, and applications. Crit. Rev. Environ. Sci. Technol. 2011, 41, 317–335. [Google Scholar] [CrossRef]
  76. Barriopedro, D.; Gouveia, C.M.; Trigo, R.M.; Wang, L. The 2009/10 drought in China: Possible causes and impacts on vegetation. J. Hydrometeorol. 2012, 13, 1251–1267. [Google Scholar] [CrossRef]
  77. Yu, F.-K.; Huang, X.-H.; Yuan, H.; Ye, J.-X.; Yao, P.; Qi, D.-H.; Yang, G.-Y.; Ma, J.-G.; Shao, H.-B.; Xiong, H.-Q. Spatial-temporal vegetation succession in Yao’an County, Yunnan Province, Southwest China during 1976–2014: A case survey based on RS technology for mountains eco-engineering. Ecol. Eng. 2014, 73, 9–16. [Google Scholar] [CrossRef]
  78. Nemani, R.R.; Keeling, C.D.; Hashimoto, H.; Jolly, W.M.; Piper, S.C.; Tucker, C.J.; Myneni, R.B.; Running, S.W. Climate-driven increases in global terrestrial net primary production from 1982 to 1999. Science 2003, 300, 1560–1563. [Google Scholar] [CrossRef] [PubMed]
  79. Song, X.-P.; Hansen, M.C.; Stehman, S.V.; Potapov, P.V.; Tyukavina, A.; Vermote, E.F.; Townshend, J.R. Global land change from 1982 to 2016. Nature 2018, 560, 639–643. [Google Scholar] [CrossRef] [PubMed]
  80. Liu, D.; Yang, L.; Jia, K.; Liang, S.; Xiao, Z.; Wei, X.; Yao, Y.; Xia, M.; Li, Y. Global Fractional Vegetation Cover Estimation Algorithm for VIIRS Reflectance Data Based on Machine Learning Methods. Remote Sens. 2018, 10, 1648. [Google Scholar] [CrossRef]
  81. Tian, H.; Huang, N.; Niu, Z.; Qin, Y.; Pei, J.; Wang, J. Mapping Winter Crops in China with Multi-Source Satellite Imagery and Phenology-Based Algorithm. Remote Sens. 2019, 11, 820. [Google Scholar] [CrossRef]
  82. Saatchi, S.; Asefi-Najafabady, S.; Malhi, Y.; Aragão, L.E.; Anderson, L.O.; Myneni, R.B.; Nemani, R. Persistent effects of a severe drought on Amazonian forest canopy. Proc. Natl. Acad. Sci. USA 2013, 110, 565–570. [Google Scholar] [CrossRef]
  83. Wen, Y.; Liu, X.; Yang, J.; Lin, K.; Du, G. NDVI indicated inter-seasonal non-uniform time-lag responses of terrestrial vegetation growth to daily maximum and minimum temperature. Glob. Planet. Chang. 2019, 177, 27–38. [Google Scholar] [CrossRef]
  84. Xu, G.; Zhang, H.; Chen, B.; Zhang, H.; Innes, J.; Wang, G.; Yan, J.; Zheng, Y.; Zhu, Z.; Myneni, R. Changes in vegetation growth dynamics and relations with climate over China’s landmass from 1982 to 2011. Remote Sens. 2014, 6, 3263–3283. [Google Scholar] [CrossRef]
  85. De Jong, R.; Schaepman, M.E.; Furrer, R.; De Bruin, S.; Verburg, P.H. Spatial relationship between climatologies and changes in global vegetation activity. Glob. Chang. Biol. 2013, 19, 1953–1964. [Google Scholar] [CrossRef] [PubMed]
Figure 1. Study area: (a) An example of karst rocky desertification on hillsides near Xibeile Township, Mengzi city, Yunnan province (photo taken during a field survey in 2018); (b) the location of Yunnan province and Kunming (the provincial capital city), as well as of Nandong and Xiaojiang watersheds; (c) land cover types of the Nandong watershed in 2015; and (d) land cover types of the Xiaojiang watershed in 2015; and (e) lithological types and township/city seats in Nandong watershed; and (f) lithological types and township/county seats in Xiaojiang watershed. Main lithological attributes include PL (pure limestone), LD (limestone and dolomite interbedded layer), IC (impure carbonate rocks), and NK (non-karst rocks).
Remotesensing 11 02044 g001
Figure 2. Workflow of detection and attribution of vegetation greening trends in two typical karst watersheds of Nandong and Xiaojiang in southwest China from 1988 to 2016.
Remotesensing 11 02044 g002
Figure 3. Result of accuracy validation of the sub-pixel model in: (a) Nandong, and (b) Xiaojiang watershed.
Remotesensing 11 02044 g003
Figure 4. Spatial distribution of average annual fractional vegetation cover (annFVC) for different time periods. Top row is the Nandong watershed: (a) Full time series (1988–2016); (b) reference period (1988–2000); and (c) conservation period (2001–2016); and bottom row is Xiaojiang watershed; (d) full time series (1988–2016); (e) reference period (1988–2000); and (f) conservation period (2001–2016).
Remotesensing 11 02044 g004
Figure 5. The temporal trends in annual fractional vegetation cover (annFVC) at the watershed level from 1988 to 2016 (full time series) and during 1988–2000 (reference period), and 2001-2016 (conservation period) in: (a) Nandong, and (b) Xiaojiang watershed. Slopes of the trends during these three periods and their corresponding significance levels are shown. The black solid line represents the regression fit to the annFVC data during 1988–2016, while the red and green lines denote the regression fit during 1988–2000 and 2001–2016, respectively.
Remotesensing 11 02044 g005
Figure 6. The spatial distribution of vegetation trends for different periods in the Nandong watershed: (a) Full time series (1988–2016); (b) reference period (1988–2000); (c) conservation period (2001–2016); and (d) vegetation trend slope difference between the conservation period (2001–2016) and reference period (1988–2000).
Remotesensing 11 02044 g006
Figure 7. The spatial distribution of vegetation trends for different periods in the Xiaojiang watershed: (a) Full time series (1988–2016); (b) reference period (1988–2000); (c) conservation period (2001–2016); and (d) vegetation trend slope difference between the conservation period (2001–2016) and reference period (1988–2000).
Remotesensing 11 02044 g007
Figure 8. The spatial distribution of the terrain niche index (TNI) values in: (a) Nandong; and (b) Xiaojiang watersheds; and the pixel proportion of vegetation cover trends for different terrain niche index (TNI) intervals in; (c) Nandong; and (d) Xiaojiang watersheds.
Remotesensing 11 02044 g008
Figure 9. (a) Comparison of average annFVC under different lithological settings in the karst watersheds of Nandong and Xiaojiang during the study period of 1988–2016; and the pixel proportion of vegetation trends under different lithological attributes in: (b) Nandong; and (c) Xiaojiang watersheds. Main lithological attributes include PL (pure limestone), LD (limestone and dolomite interbedded layer), IC (impure carbonate rocks), and NK (non-karst rocks).
Remotesensing 11 02044 g009
Figure 10. The change trend of human-induced residual of vegetation changes from 1988 to 2016 in: (a) Nandong; and (b) Xiaojiang watersheds.
Remotesensing 11 02044 g010
Figure 11. Annual (right y-axis) and cumulative (left y-axis) areas of government-funded afforestation and conservation efforts from 2002 to 2016 in: (a) Nandong; and (b) Xiaojiang watersheds.
Remotesensing 11 02044 g011
Table 1. Percentages of different land types versus three vegetation change trends.
Nandong WatershedXiaojiang Watershed
Land Use TypesSignificant IncreaseSignificant DecreaseInsignificant TrendsSignificant IncreaseSignificant DecreaseInsignificant Trends
Grassland46.54%20.68%35.56%24.69%13.10%21.18%
Woodland23.97%24.70%28.71%35.26%36.04%38.51%
Cropland26.34%36.48%28.33%38.43%42.03%36.34%
Water body0.82%1.02%3.39%0.40%0.32%0.91%
Built-up land2.33%17.12%4.01%1.22%8.51%3.06%
Total100.00%100.00%100.00%100.00%100.00%100.00%
Table 2. The comparison of contributions between this study and other related studies.
ReferencesStudy AreaStudy PeriodSatellite DataResolutionGreening Drivers
This studyWatershed-scale1988–2016Landsat TM/ETM+/OLI30 mHuman activities
Brandt et al. [13]Regional-scale1999–2017SMOS, SSM/I, WindSat, AMSR-E, SPOT VGT, PROBA-VOver 1 kmHuman activities
Tong et al. [21]Regional-scale1982–2015MODIS, GIMMS-3gOver 0.05°Human activities
Wang et al. [18]Regional-scale2000–2010MODIS250 mClimate change and human activities
Hou et al. [20]Regional-scale1982–2013GIMMS8 kmClimate change
Cai et al. [17]Regional-scale2000–2010MODIS1 kmHuman activities

