Extracting Raft Aquaculture Areas from Remote Sensing Images via an Improved U-Net with a PSE Structure

1
College of Computer Science and Engineering, Shandong University of Science and Technology, Qingdao 266590, China
2
National Marine Environmental Monitoring Center, Dalian 116023, China
*
Author to whom correspondence should be addressed.
Remote Sens. 2019, 11(17), 2053; https://0-doi-org.brum.beds.ac.uk/10.3390/rs11172053
Submission received: 5 August 2019
/
Revised: 28 August 2019
/
Accepted: 30 August 2019
/
Published: 1 September 2019
(This article belongs to the Section Ocean Remote Sensing)
Abstract
:Remote sensing has become a primary technology for monitoring raft aquaculture products. However, due to the complexity of the marine aquaculture environment, the boundaries of the raft aquaculture areas in remote sensing images are often blurred, which will result in ‘adhesion’ phenomenon in the raft aquaculture areas extraction. The fully convolutional network (FCN) based methods have made great progress in the field of remote sensing in recent years. In this paper, we proposed an FCN-based end-to-end raft aquaculture areas extraction model (which is called UPS-Net) to overcome the ‘adhesion’ phenomenon. The UPS-Net contains an improved U-Net and a PSE structure. The improved U-Net can simultaneously capture boundary and contextual information of raft aquaculture areas from remote sensing images. The PSE structure can adaptively fuse the boundary and contextual information to reduce the ‘adhesion’ phenomenon. We selected laver raft aquaculture areas in eastern Lianyungang in China as the research region to verify the effectiveness of our model. The experimental results show that compared with several state-of-the-art models, the proposed UPS-Net model performs better at extracting raft aquaculture areas and can significantly reduce the ‘adhesion’ phenomenon.
1. Introduction
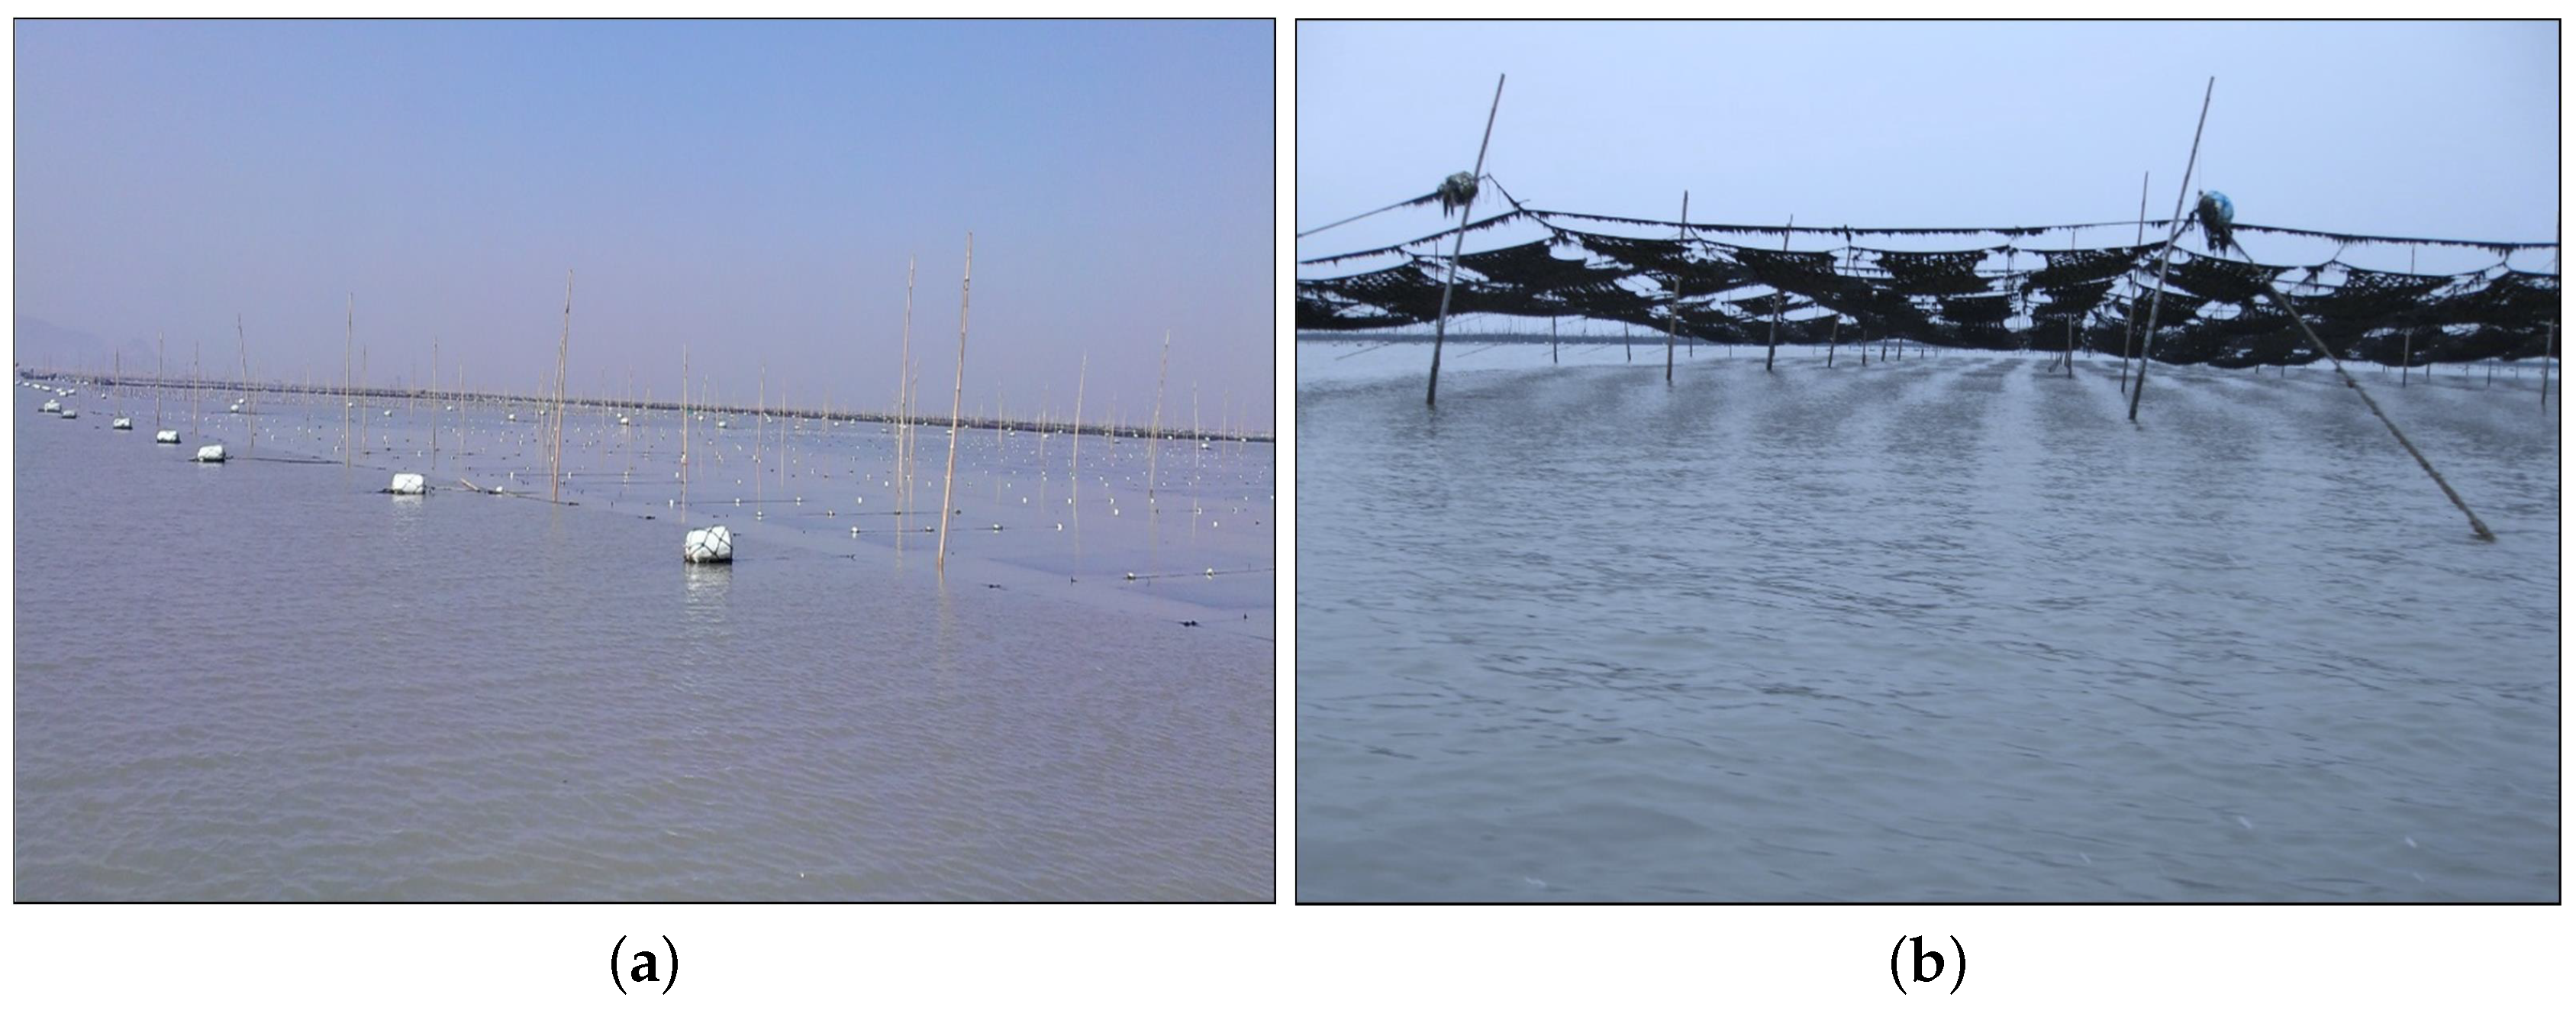
The raft aquaculture is an important intensive aquaculture method. In coastal seas, floating raft racks are constructed of floats, bamboo and ropes, and fixed by piles or anchors on both sides. These racks are used to breed various aquaculture species, as shown in Figure 1. The development of the raft aquaculture industry has produced enormous economic benefits [1,2,3]; however, it has also caused some problems such as illegal aquaculture [4,5]. Moreover, encroachment of marine protected areas and sea lanes has become increasingly common, and has negatively impacted the coastal ecological environment and maritime traffic [6]. Therefore, there is an urgent need for improved monitoring of raft aquaculture areas to ensure the orderly development of the raft aquaculture industry.
Remote sensing technology has many advantages, including wide coverage, real time availability, objectivity, accuracy and so on [7]. Therefore, remote sensing has become a primary technology of environmental and biological monitoring [8,9]. In recent years, researchers have proposed many methods for extracting aquaculture areas based on remote sensing images. Fan et al. proposed a joint sparse representation classification method to extract aquaculture areas from high-resolution SAR images [10]. In their work, wavelet decomposition and gray-level co-occurrence matrix (GLCM) statistic approach were adopted to construct the required texture features. Wang et al. proposed a region-line primitive association framework in aquaculture area extraction based on multiscale feature fusion and spatial rule induction [11]. Hu et al. modified statistical region-merging algorithm for superpixels segmentation and used fuzzy compactness and separation clustering algorithm to recognize raft aquaculture areas from SAR images [12]. However, the parameters of these methods have to be adjusted and analyzed manually [13]. Therefore, the accuracy of raft aquaculture areas extraction is largely dependent on lengthy parameter investigations and professional experience.
In the field of deep learning, the CNN (Convolutional Neural Network), R-CNN (Regions with Convolutional Neural Network features) and FCN (Fully Convolutional Network) models are rapidly developing and evolving respectively for image classification, target detection and semantic segmentation tasks. For examples, Thibaut et al. proposed an end-to-end method to learn a multi-label classifier with partial labels [14]. They introduced a loss function that generalizes the standard binary cross-entropy loss by exploiting label proportion information and significantly improves performance on multi-label classification. Li et al. proposed a Stereo R-CNN model for autonomous driving by exploiting the sparse and dense, semantic and geometry information in stereo imagery [15]. Unlike classification tasks, Stereo R-CNN is used for target detection tasks and it can provide 3D localization metrics of the targets. Chen et al. proposed DeepLabv3+ model and achieved excellent results based on FCN [16]. They applied several parallel atrous depthwise convolutions with different rates to extract the multiscale contextual object information.
Typical CNN were designed primarily for image-level classification tasks. For example, Simonyan et al. evaluated very deep convolutional networks (VGG-16) with small (3 × 3) convolution filters for large scale image classification [17]. However, raft aquaculture areas extraction is a semantic segmentation task, which expects a dense class map that has the same size as the original image [18]. Long et al. proposed FCN trained in an end-to-end manner that performed pixel-to-pixel semantic segmentation and outperformed the state-of-the-art methods at that time [19]. In recent years, some FCN based methods have shown striking improvements on semantic segmentation benchmark tasks. However, after several pooling and upsampling operations, FCN loses a large amount of detailed information. Chen et al. summarized two types of neural networks for image semantic segmentation [16], that is, using encoder-decoder structure [20] and using spatial pyramid pooling (SPP) [16]. The former one is able to obtain sharp object boundaries while the latter one captures rich contextual information by pooling features at different resolution. Using an encoder-decoder structure, U-Net [20] achieved good boundary extraction results on biomedical image segmentation. PSPNet applies several parallel poolings with different rates, which explicitly capture a wide range of information [21]. Kaiming et al. proposed a Mask R-CNN model by adding a branch to Faster R-CNN for predicting an object mask in parallel with the existing branch for bounding box recognition [22], which can be used for semantic segmentation and object bounding box detection.
In recent years, the FCN-based deep learning methods have made great progress in the field of raft aquaculture areas extraction. Yueming et al. introduced a deep-learning Richer Convolutional Features network (RCF) [23] for edge detection of raft aquaculture areas in Sanduao, China [24]. Since the boundaries in the boundary probability map of the RCF are often broken, it is necessary to repair the extracted vector boundary. Shi et al. design a dual-scale homogeneous convolutional neural network (DS-HCN), which combines a small receptive field and a large receptive field to mine the association between multiple targets [13]. DS-HCN achieved a satisfactory performance on aquaculture areas exaction of Dalian, China. However, when extracting other species of seaweed aquaculture areas, it seems that some of the aquaculture areas are stuck together (we named it ‘adhesion’ phenomenon), as shown in Figure 10. We experimented with several typical deep learning models (FCN, U-Net, PSPNet and DeepLabv3+) to extract raft aquaculture areas, and found that the ‘adhesion’ phenomenon also appeared in the result maps.
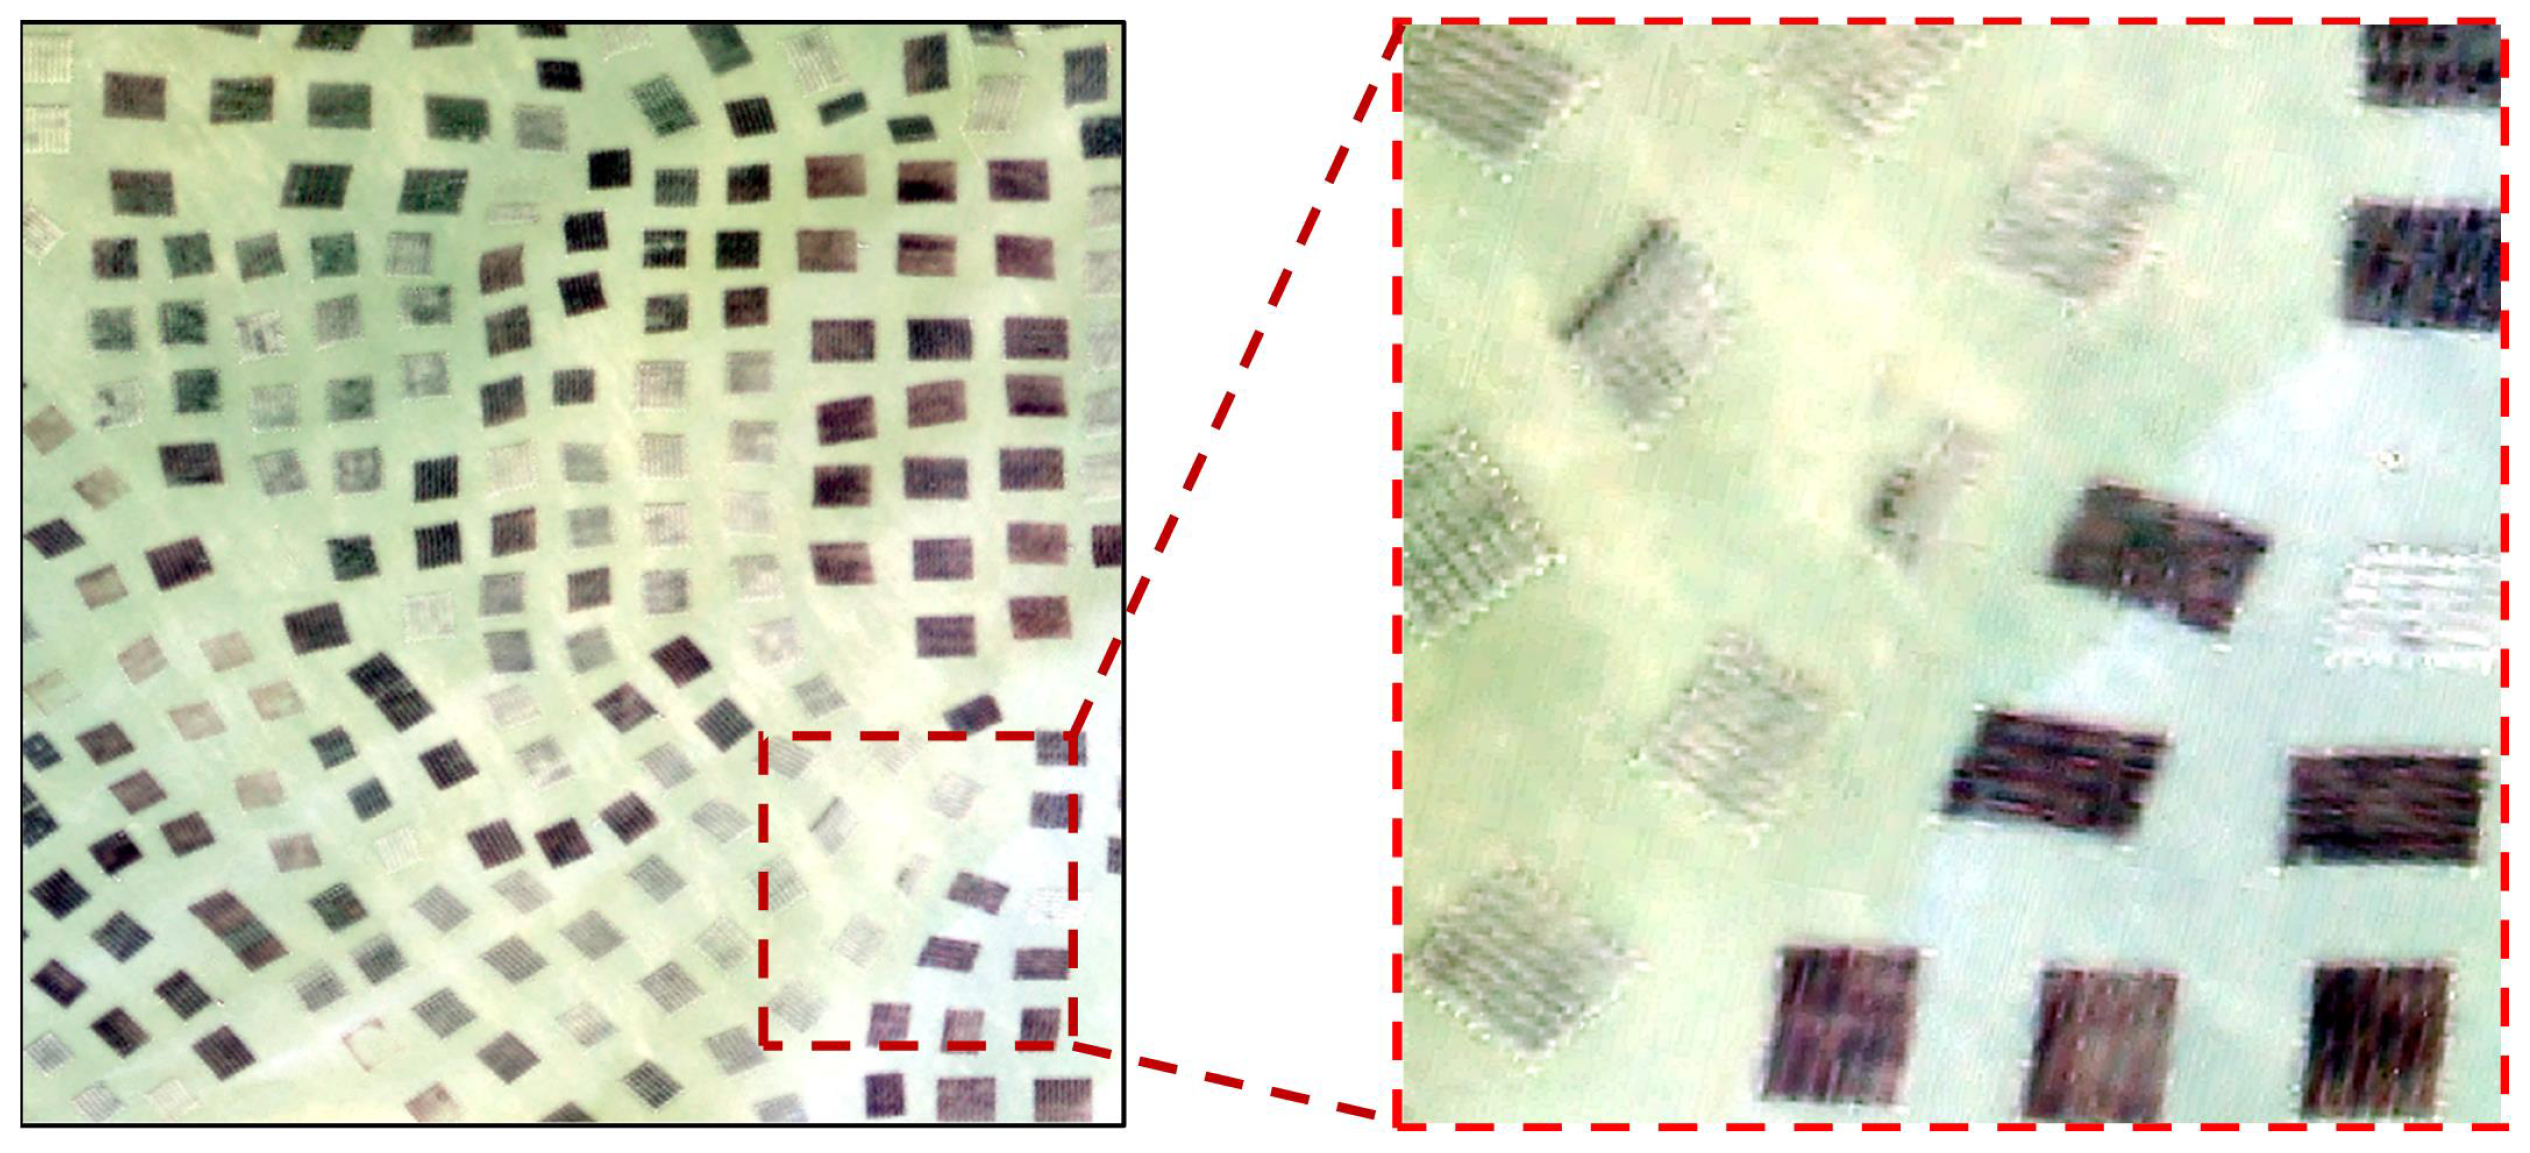
Raft aquaculture areas are characterized by large quantities, dense distribution, complex spectral information and so on, as shown in Figure 2. These characteristics have brought many challenges for the raft aquaculture areas extraction. One of the most difficult challenge in raft aquaculture areas extraction is the ‘adhesion’ phenomenon, which will lead to inaccurate statistics of the number and area of raft aquaculture areas. The ‘adhesion’ phenomenon is usually caused by several reasons. First, the boundaries of the raft aquaculture areas in remote sensing images are often blurred due to the complex marine environment. Second, the spectrum of some raft aquaculture areas is similar to that of the surrounding seawater due to the influence of seaweed growth stage and harvesting status. Therefore, in order to overcome the ‘adhesion’ phenomenon, detailed boundary information is required to prevent boundary-blurring. And context information is required to accurately locate the aquaculture areas, whose spectrum is similar to the surrounding seawater.
Motivated by the encoder-decoder and the SPP structure, we propose a novel FCN-based model (UPS-Net) for raft aquaculture areas extraction. The motivations of this paper include two aspects. First, we want to combine the detailed boundary and contextual information of raft aquaculture areas to overcome the ‘adhesion’ phenomenon in a single model. The improved U-Net is designed to capture multi-scale feature maps. Large-scale feature maps (the output layer of U-Net) are used to provide detailed boundary information, and small-scale feature maps (copy from decoder of the U-Net) are used to provide contextual information. Second, multi-scale feature maps captured from the improved U-Net should have different contributions. More reliable and qualified feature maps should get higher confidence [25]. Therefore, we designed a new PSE structure to adaptively fuse the detailed boundary and contextual information of raft aquaculture areas. The PSE structure combines a pyramid upsampling module and a squeeze-excitation module to fuse multiscale feature maps. The pyramid upsampling module is used to upsample and concatenate the multiscale feature maps firstly. Then, the squeeze-excitation module, following the procedure of Hu et al. [26], exploits the modeling interdependencies between channels. In addition, a depthwise separable convolution is used to reduce the model parameters [27]. The experimental results on raft aquaculture areas dataset demonstrated that UPS-Net achieves better F1-measure scores compared with the state-of-the-art deep learning methods and other raft aquaculture areas extraction method.
In this work, we proposed an improved U-Net with a PSE structure (UPS-Net) for extracting raft aquaculture areas extraction. The main contributions of our work are summarized as follows:
- The improved U-Net is designed to capture multiscale feature maps, which contains detailed boundary and contextual information of raft aquaculture areas.
- The pyramid upsampling module and the squeeze-excitation module were combined for the first time into the PSE structure, which can adaptively fuse the multiscale feature maps.
The remainder of this paper is organized as follows: Section 2 describes the related work, including the structures of FCN, U-Net, the spatial pyramid pooling module and the squeeze-excitation module. In Section 3, we introduce the proposed UPS-net model in detail. Section 4 reports the details of the experimental dataset, the hyperparameter and the experimental results. Finally, a discussion and conclusion are provided in Section 5 and Section 6, respectively.
2. Related Works
In this section, we will give a brief review of the traditional FCN model, U-Net model and spatial pyramid pooling. In addition, a detailed introduction for the Squeeze-excitation module is also given in this section.
2.1. FCN and U-Net
FCN is trained in an end-to-end manner, performing pixel-to-pixel semantic segmentation and object extraction. CNNs are typically used for image-level classification tasks because they all output the probability distribution over different classes [18]. For example, AlexNet outputs a 1000-dimensional vector to represent the probability that an input image belongs to each class [28]. In contrast to typical CNNs, an FCN is a CNN rearchitected to perform semantic segmentation tasks by replacing the fully connected layers with convolutional and upsampling layers, producing an efficient model for end-to-end pixelwise learning. FCNs adds a skip-layer module between layers to fuse semantic information and refine the spatial precision of the prediction [19]. However, FCNs generate coarse segmentation maps due to their large number of pooling and upsampling layers.
U-Net [20] is an FCN-based network suitable for processing gray biomedical images. U-Net yields outstanding performances on biomedical images because it captures detailed boundary information. The U-Net architecture consists of a contracting path and an expanding path [20]. The contracting path alternately uses four groups of convolution and pooling layers to capture multiscale feature maps, while the expanding path alternately uses four groups of convolution and upsampling layers to obtain refined feature maps. Meanwhile, to retain detailed information, the feature maps from the contracting path are copied and concatenated to the corresponding upsampling layers in the expanding path. This U-shaped multi-level fusion structure can retain more boundary information of the target.
2.2. Spatial Pyramid Pooling
To accurately extract the target in semantic segmentation, Zhao et al. found that the current FCN-based model lacks a suitable strategy for utilizing multiscale contextual clues [21]. Therefore, spatial pyramid pooling (SPP) is used in DeepLabv3+ and PSPNet, which fuses multiscale features by controlling the size of the receptive field. In CNNs, the receptive field is defined as the region of the input space at which a particular CNN convolution kernel is looking, and it roughly indicates how well the spatial information is being used [29]. DeepLabv3+ [16] and PSPNet [21] perform SPP in different ways. DeepLabv3+ applies several parallel atrous depthwise convolutions with different rates to explicitly control the filter’s receptive field and capture a wide range of information. Atrous depthwise convolution is a combination of atrous convolution and depthwise separable convolution with fewer parameters [16]. PSPNet applies several parallel poolings with different rates, which also explicitly capture a wide range of information. By exploiting this multiscale contextual information, DeepLabv3+ and PSPNet have achieved outstanding results on natural scene semantic segmentation benchmarks.
2.3. Squeeze-Excitation Module
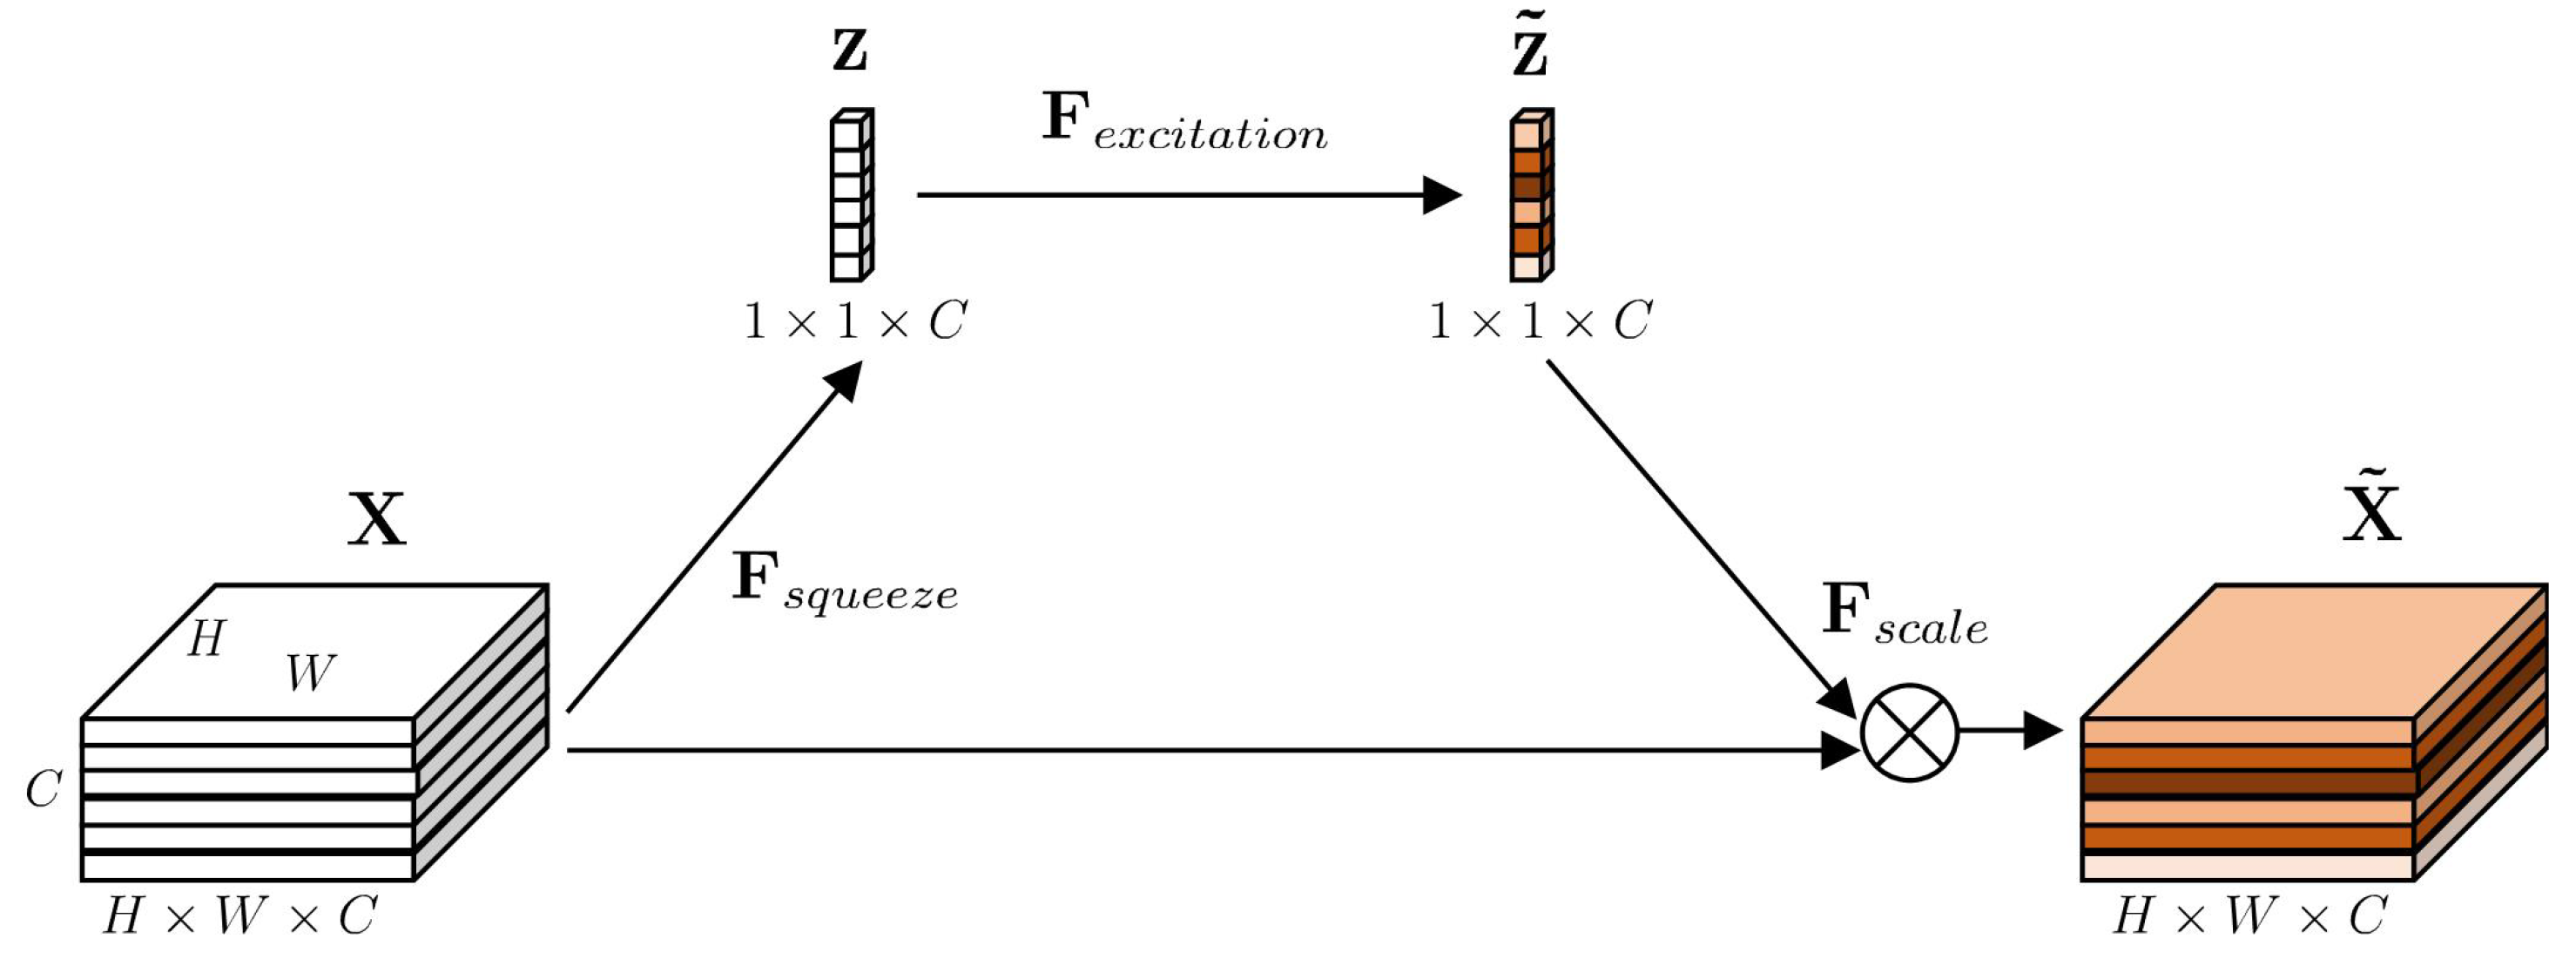
In image classification, considering the relationship between channels, squeeze-excitation module weights feature maps in a channelwise manner by explicitly modeling the interdependencies between channels [26,30,31]. This approach emphasizes informative features and suppresses those that are less informative [26]. The squeeze-excitation module includes both a squeeze operation, , and an excitation operation, . As illustrated in Figure 3, the given feature maps , , where H, W, and C refer to the height, width, and number of channels of the feature maps, respectively, first pass through a squeeze operation (global average pooling [32,33]), which generates , where is the k-th element of , and is the k-th feature map of :
The excitation operation includes two fully connected layers with the parameters , and two activation functions, and it generates as follows:
where refers to the sigmoid activation function, and refers to the ReLU [34] activation function.
At last the operation rescales the given feature maps with :
where refers to channelwise multiplication, and is the k-th feature map of .
3. Methods
In this section, we first introduce the general process for raft aquaculture areas extraction. Then, we describe the proposed UPS-Net in detail, including the improved U-Net and the PSE structure.
3.1. The General Process of Raft Aquaculture Areas Extraction
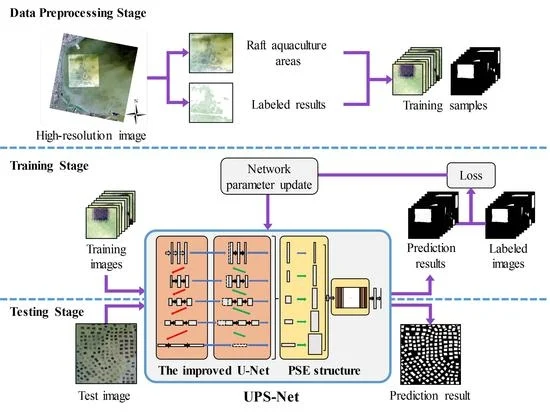
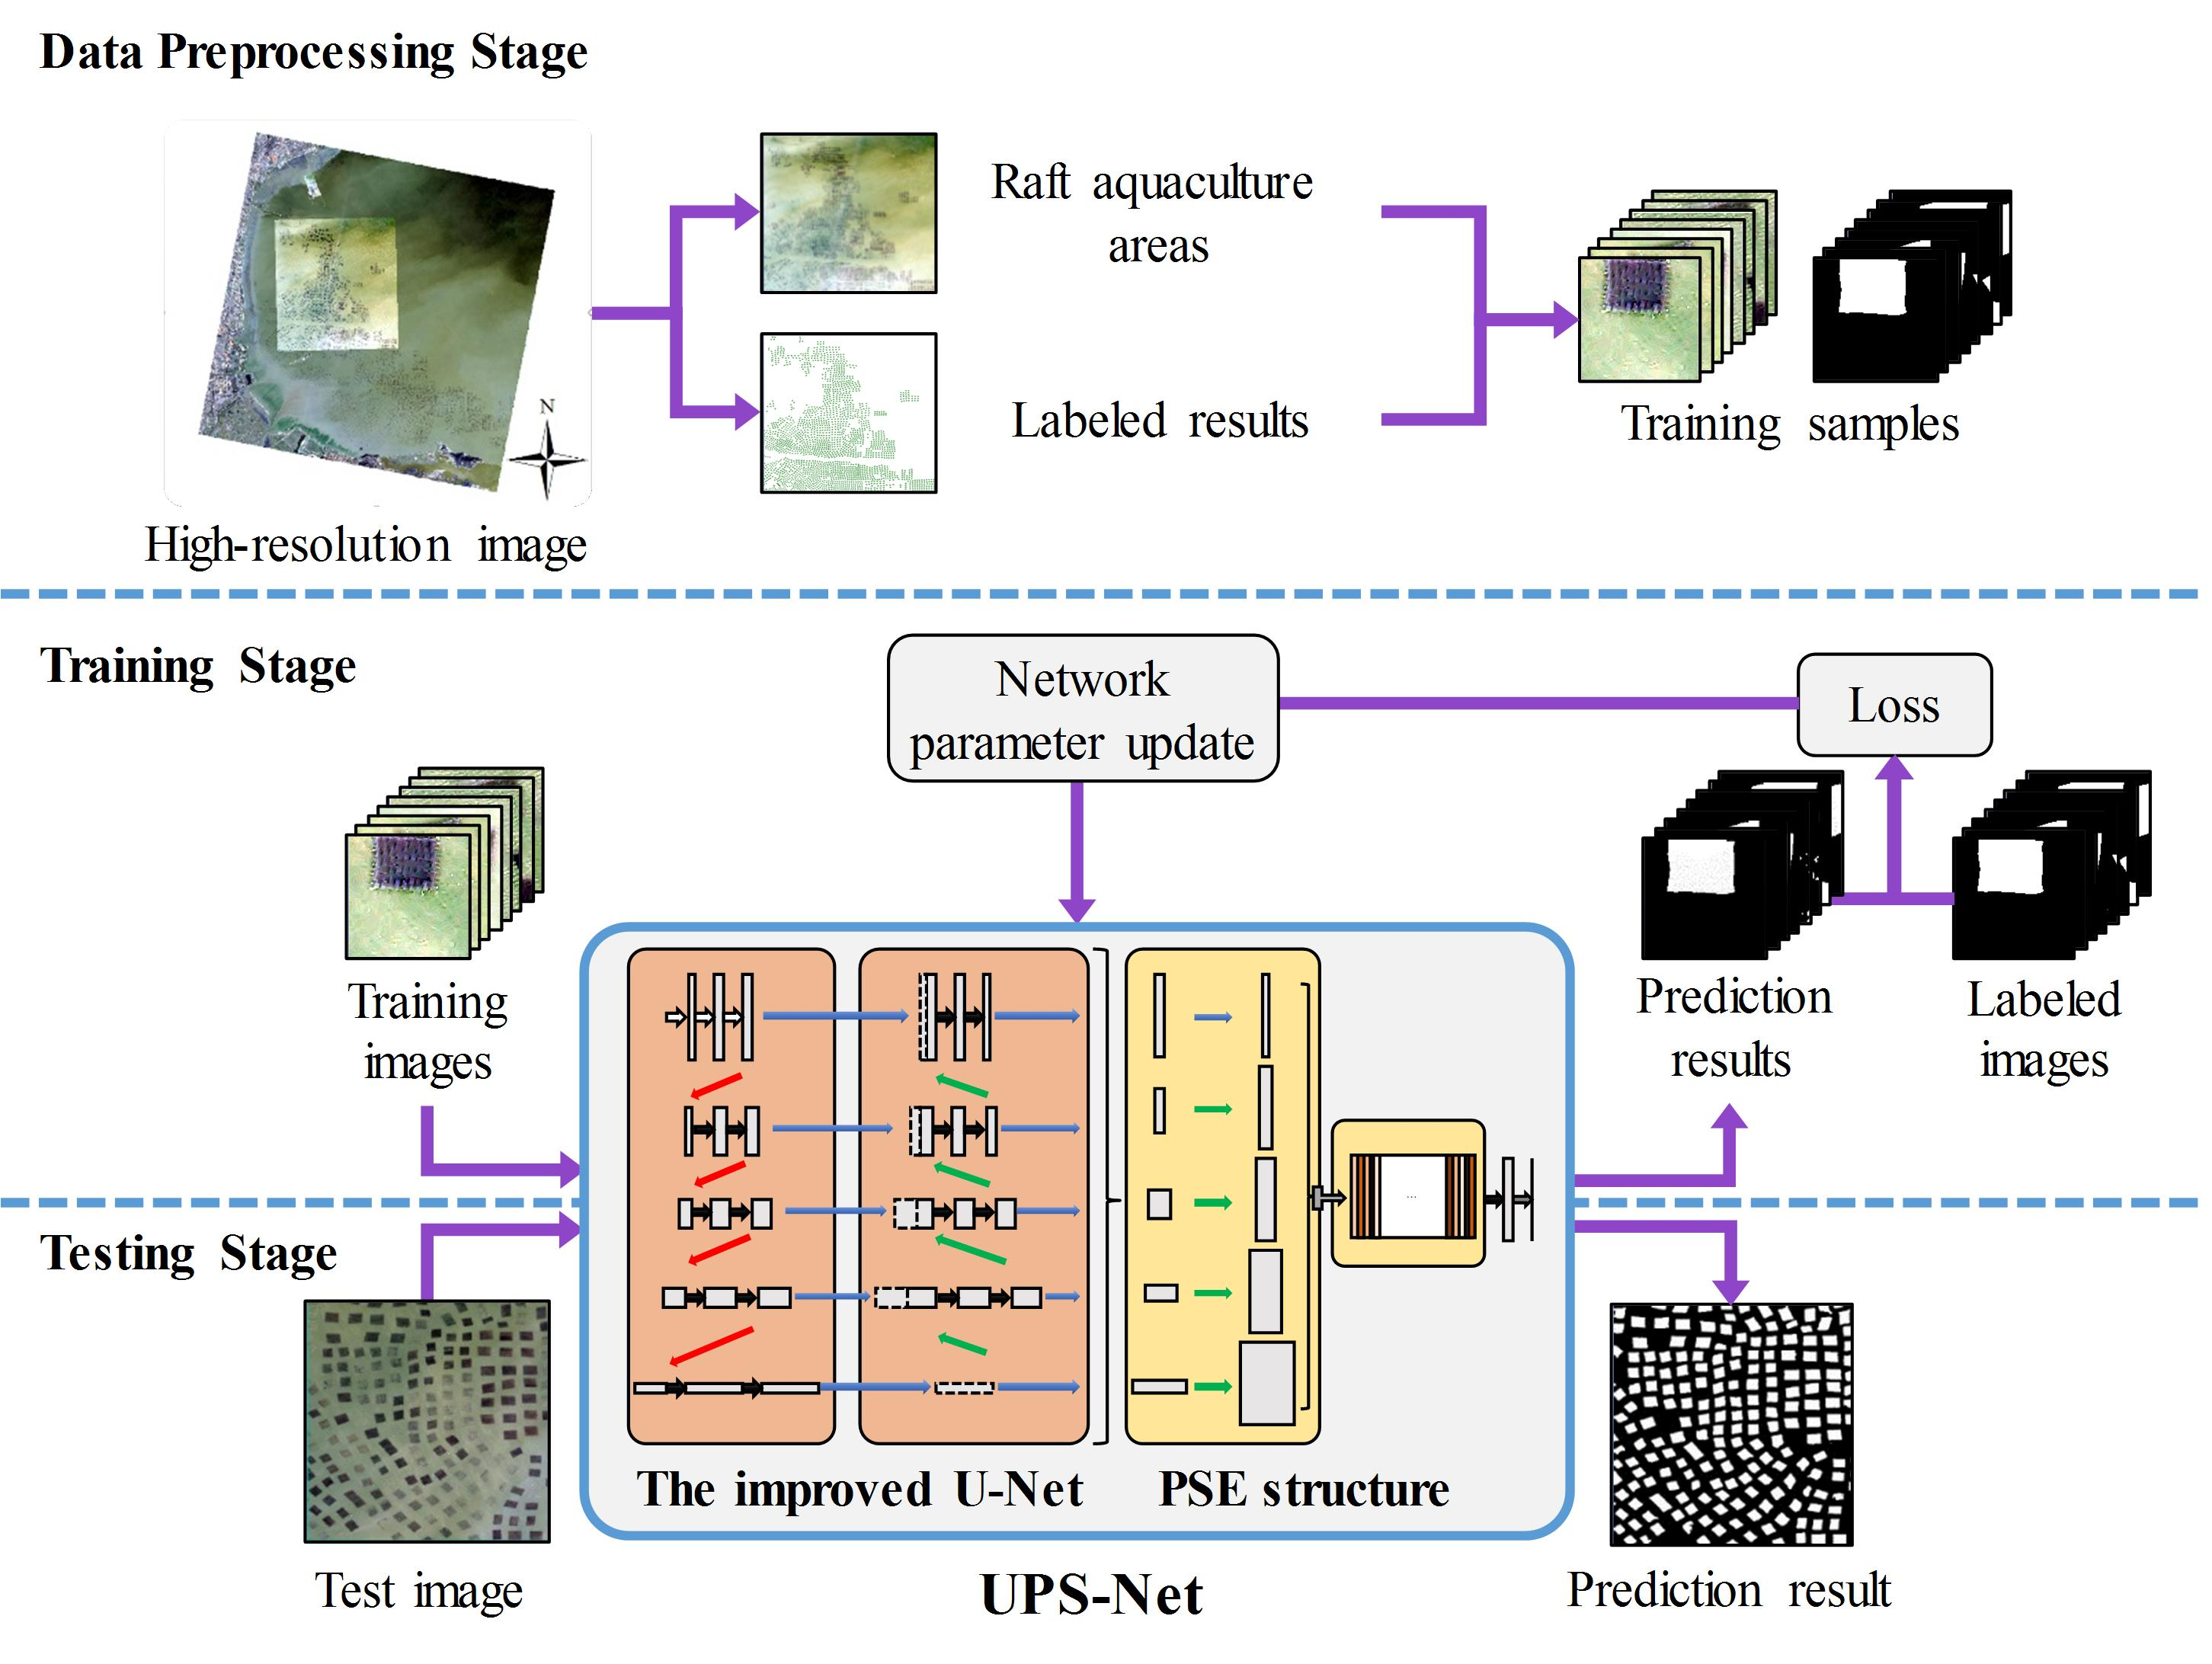
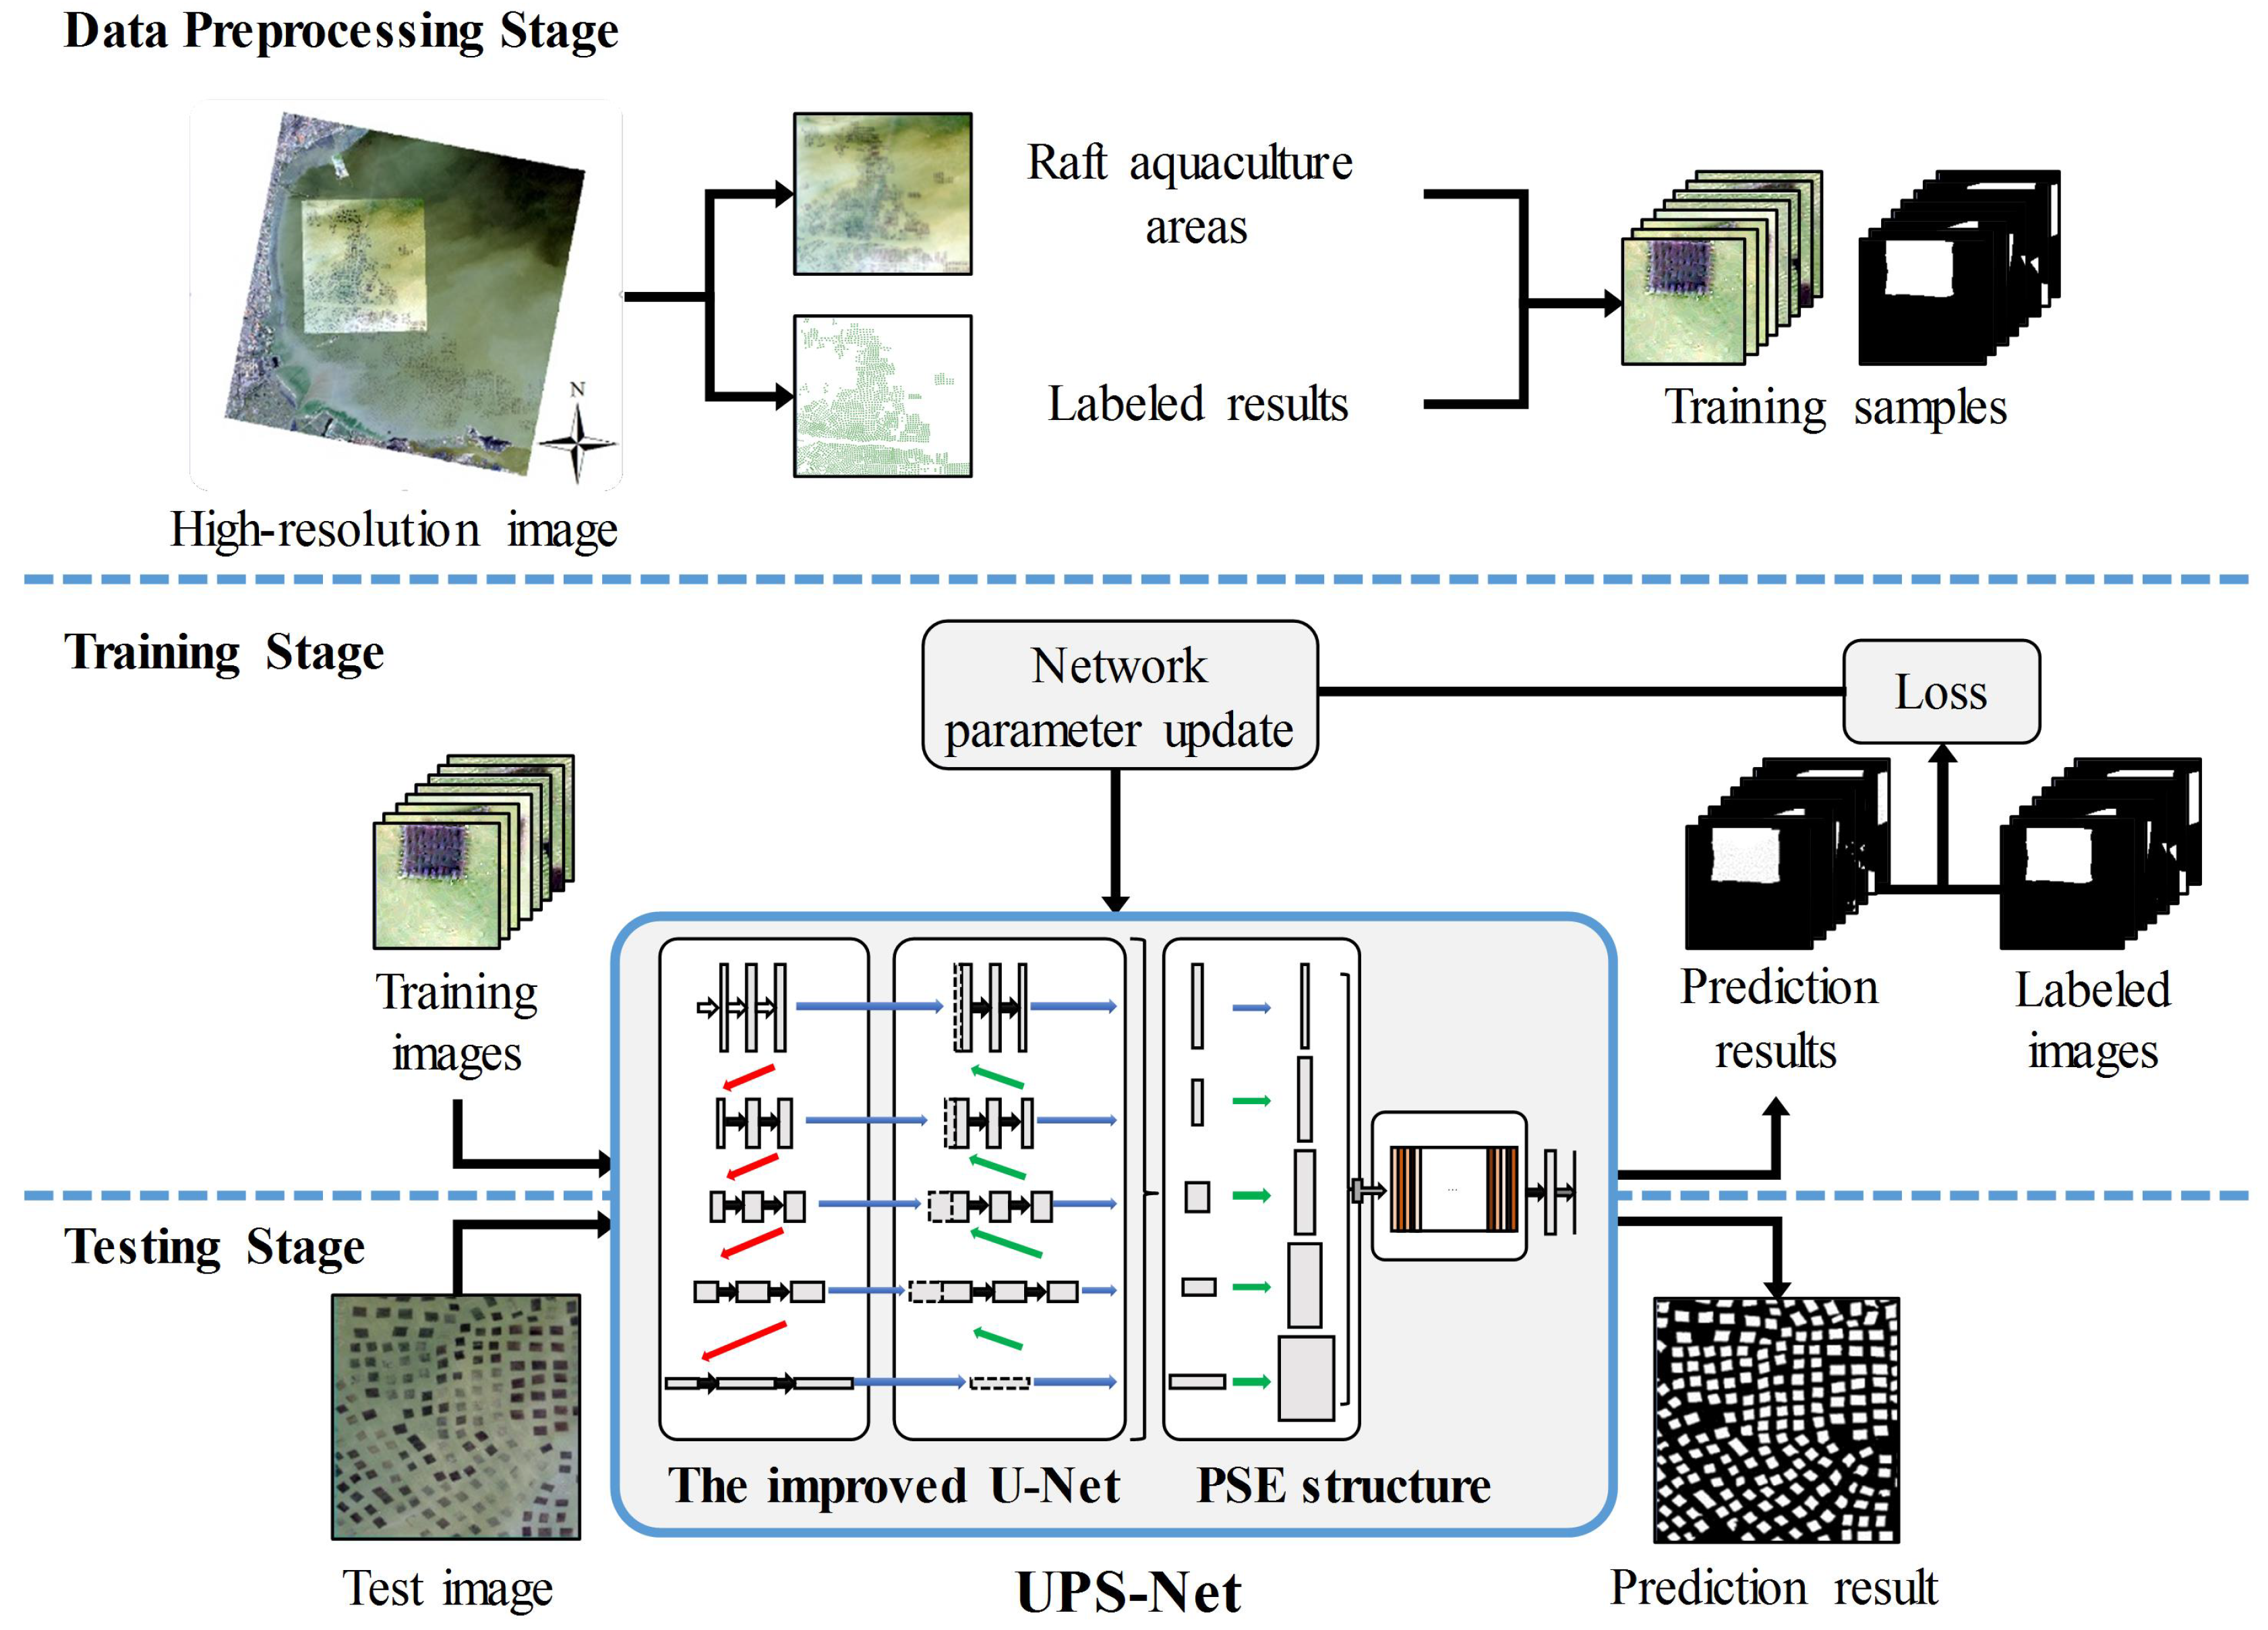
The raft aquaculture areas extraction process includes three stages: a data preprocessing stage, a training stage and a testing stage, as shown in Figure 4. In the remote sensing data preprocessing stage, experts manually draw the extent of each raft aquaculture areas in the study region using ArcGIS software [35]. Then, the manually labeled result is converted to a binary ground truth map, where one represents raft aquaculture areas and zero represents seawater. We cropped the study region image and the ground truth map to generate the training samples, where each patch corresponds to a small truth map. Similarly, we also created validation samples and test samples. In the training stage, the training samples are fed to the proposed UPS-Net model, which is shown in a simplified version of the network in Figure 4. UPS-Net is iteratively optimized using the mini-batch gradient descent algorithm [36]. Iteration is terminated when the loss no longer decreases. In the testing stage, the trained UPS-Net will be applied to the test image to extract the raft aquaculture areas. The general steps of our proposed raft aquaculture areas extraction method are given in Algorithm 1.
| Algorithm 1: Raft aquaculture areas extraction by using the proposed UPS-Net. |
| Input: the high-resolution images I, the parameter k of cross-validation, the iteration m, the initial hyperparameter h, the threshold of loss . 1. Data preprossessing: Input high-resolution images I and label raft aquaculture areas. Convert the labeled results to binary ground truth maps. Crop the images I and ground truth map to make raft aquaculture areas dateset. Split the dataset to generate training set, validation set and test set. Shuffle the training set and validation set randomly and split the dataset into k groups for cross-validation. 2. Training: Build the UPS-Net model and input hyperparameter h. Input training set and validation set of the raft aquaculture areas. while Loss L > do Tune the hyperparameter h. for do Implement forward propagation and extract raft aquaculture areas on training set. Compute loss between the extraction results and the ground truth on training set. Implement backward propagation to get the gradients. Update parameters of the UPS-Net model. end for Implement forward propagation and compute Loss L on validation set. end while 3. Cross-validation: Repeat step 2. Training by using k-fold cross-validation. 4. Testing: Input test set of the raft aquaculture areas. Extract raft aquaculture areas on test set by UPS-Net. |
3.2. The Proposed UPS-Net
The proposed UPS-Net contains an improved U-Net and a PSE structure. In Section 3.2.1, we introduce the improved U-Net, which can simultaneously capture detailed boundary and contextual information of raft aquaculture areas. In Section 3.2.2, we introduce the PSE structure, which can adaptively fuse multiscale feature maps. The complete network structure and detailed configuration of UPS-Net is shown in Table 1.
3.2.1. The Improved U-Net
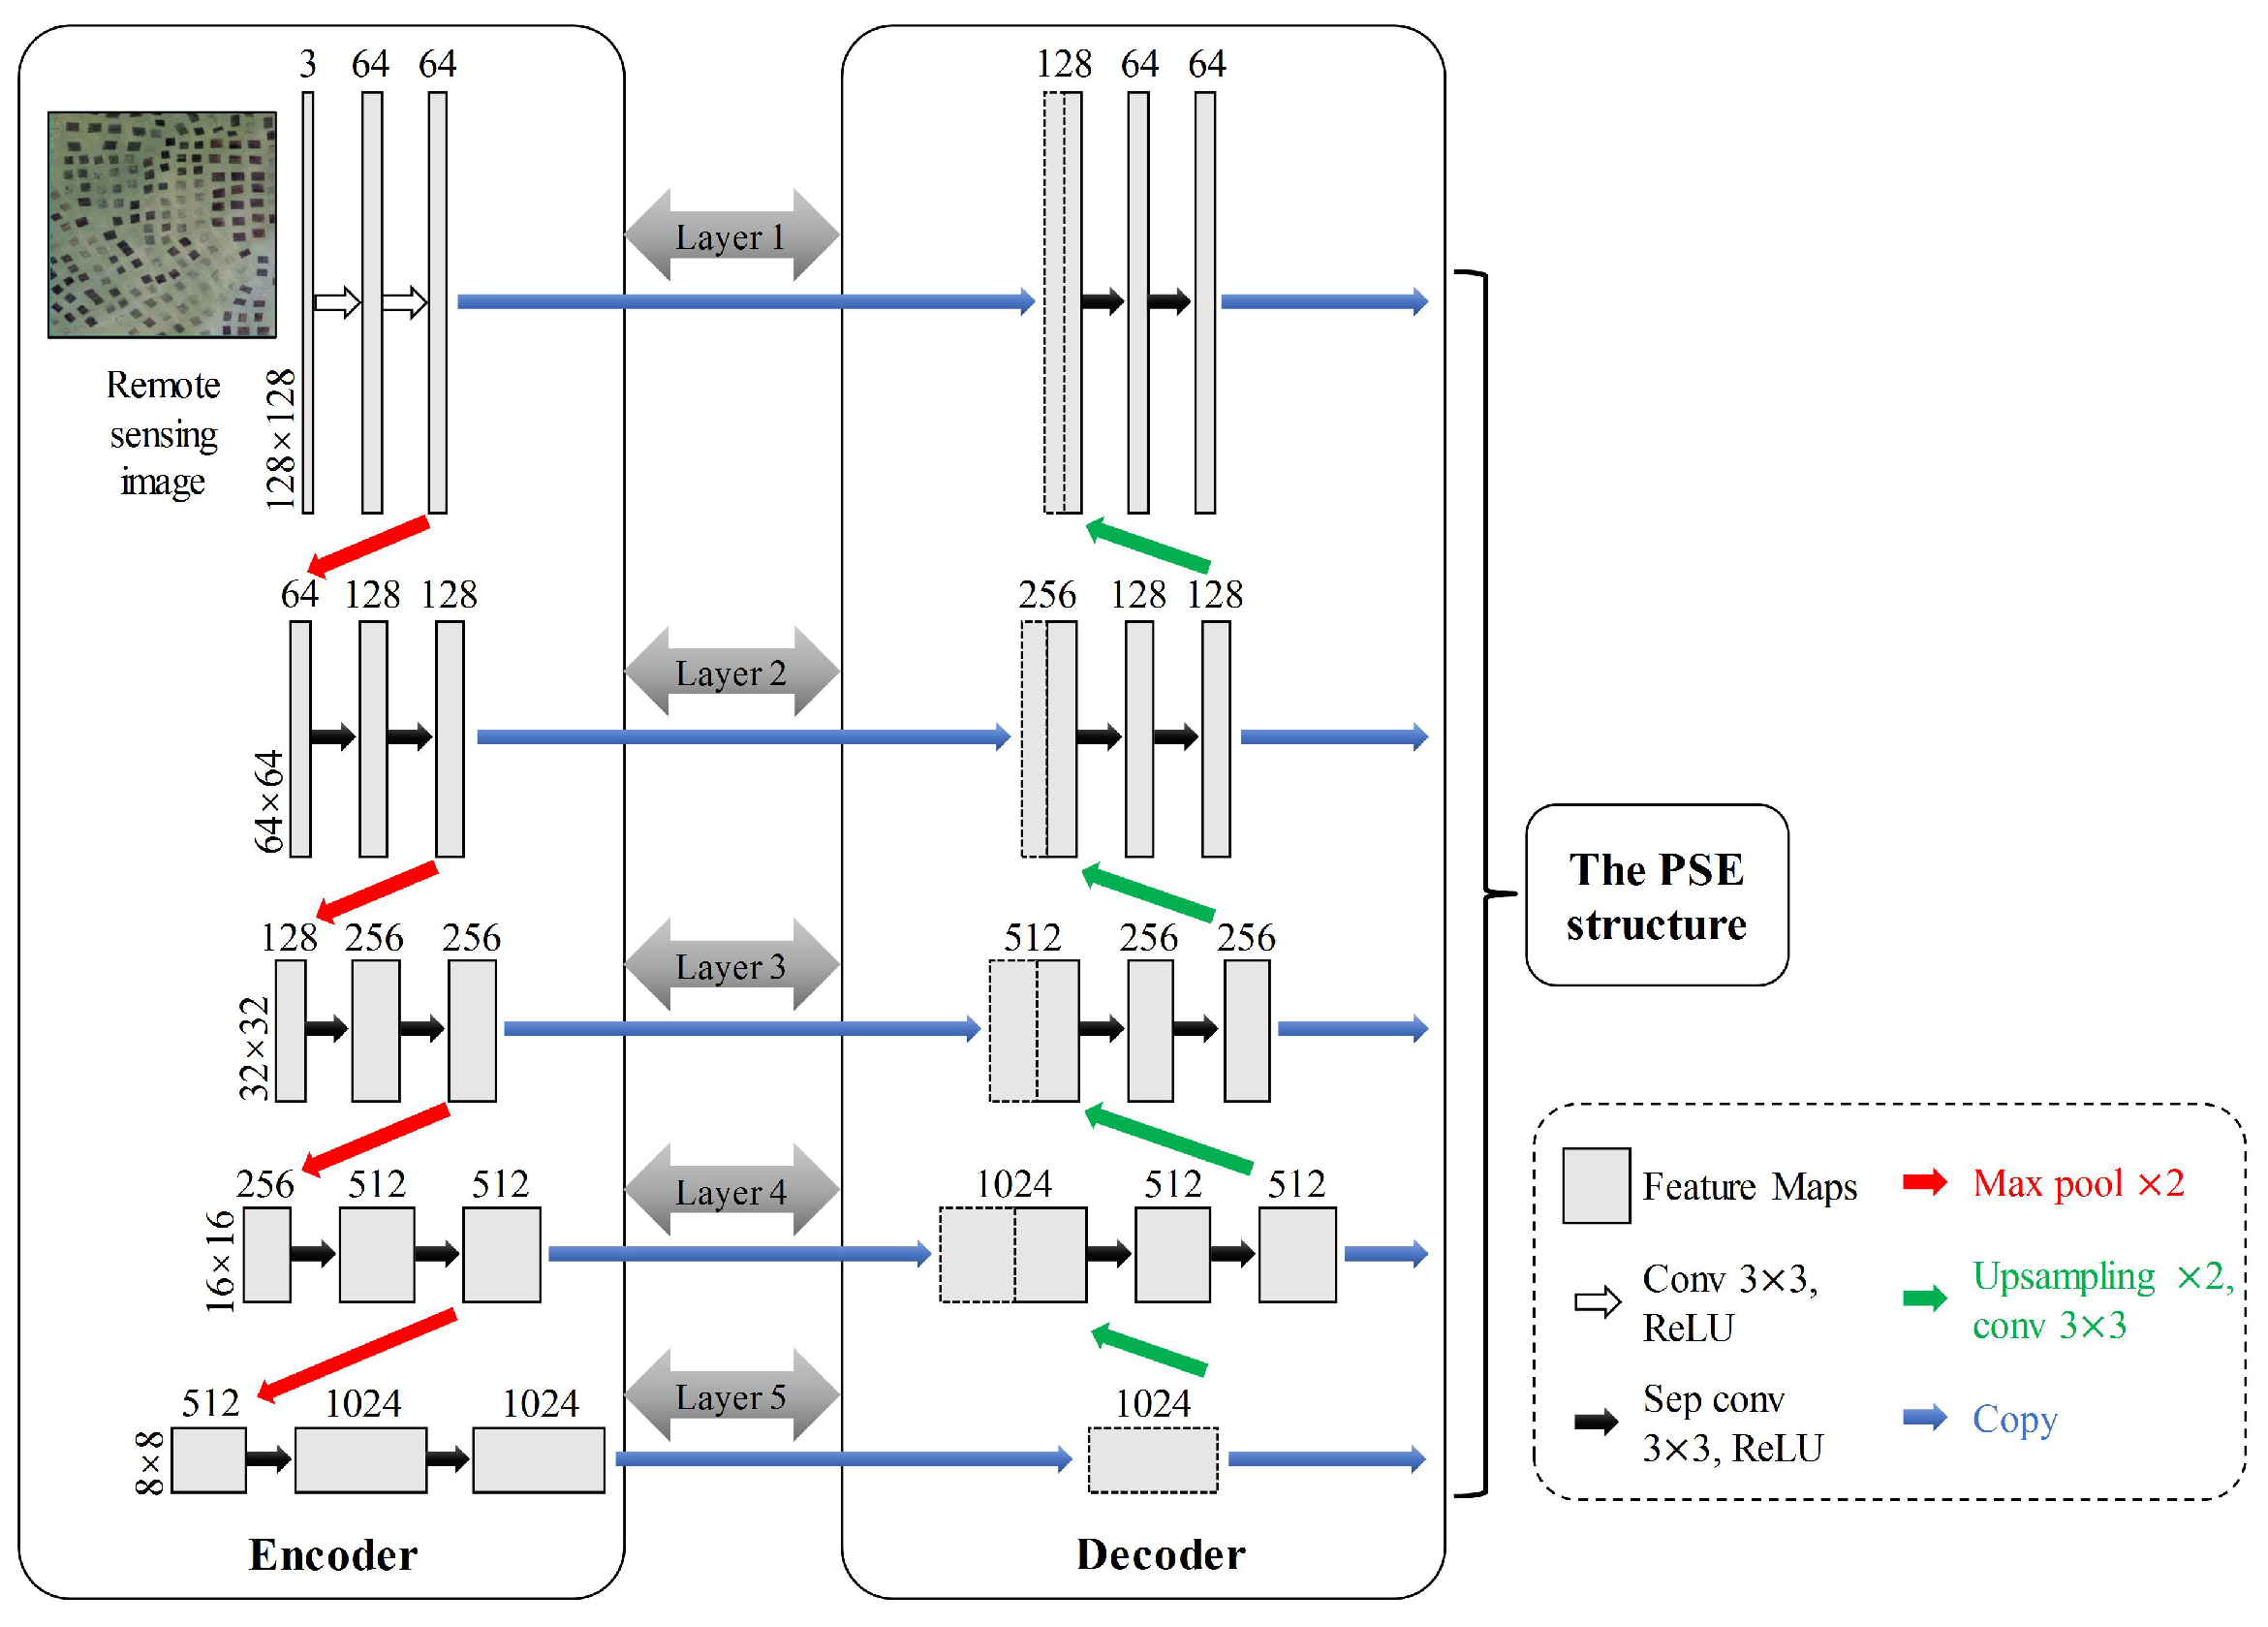
The U-Net [20] is used as the backbone of the model, which contains an encoder and a decoder. We divided U-Net into five layers. The sizes of the feature maps in each layer are , , , , , respectively. At the end of Layer2, Layer3, Layer4 and Layer5 of decoder, we added four copy operations to improve the U-Net. Therefore, the improved U-Net can capture five scales feature maps. Max pooling (rate = 2, as indicated by the red arrow in Figure 5) is used in the encoder to extract deep feature maps of the raft aquaculture. Upsampling (rate = 2, as indicated by the green arrow in Figure 5) is used in the decoder to restore the multiscale feature maps. Finally, the multiscale feature maps obtained by the decoder (the yellow block in Figure 5) are copied to the PSE structure. The depthwise separable convolution is used to reduce the network parameters (as indicated by the black arrow in Figure 5).
3.2.2. The PSE Structure
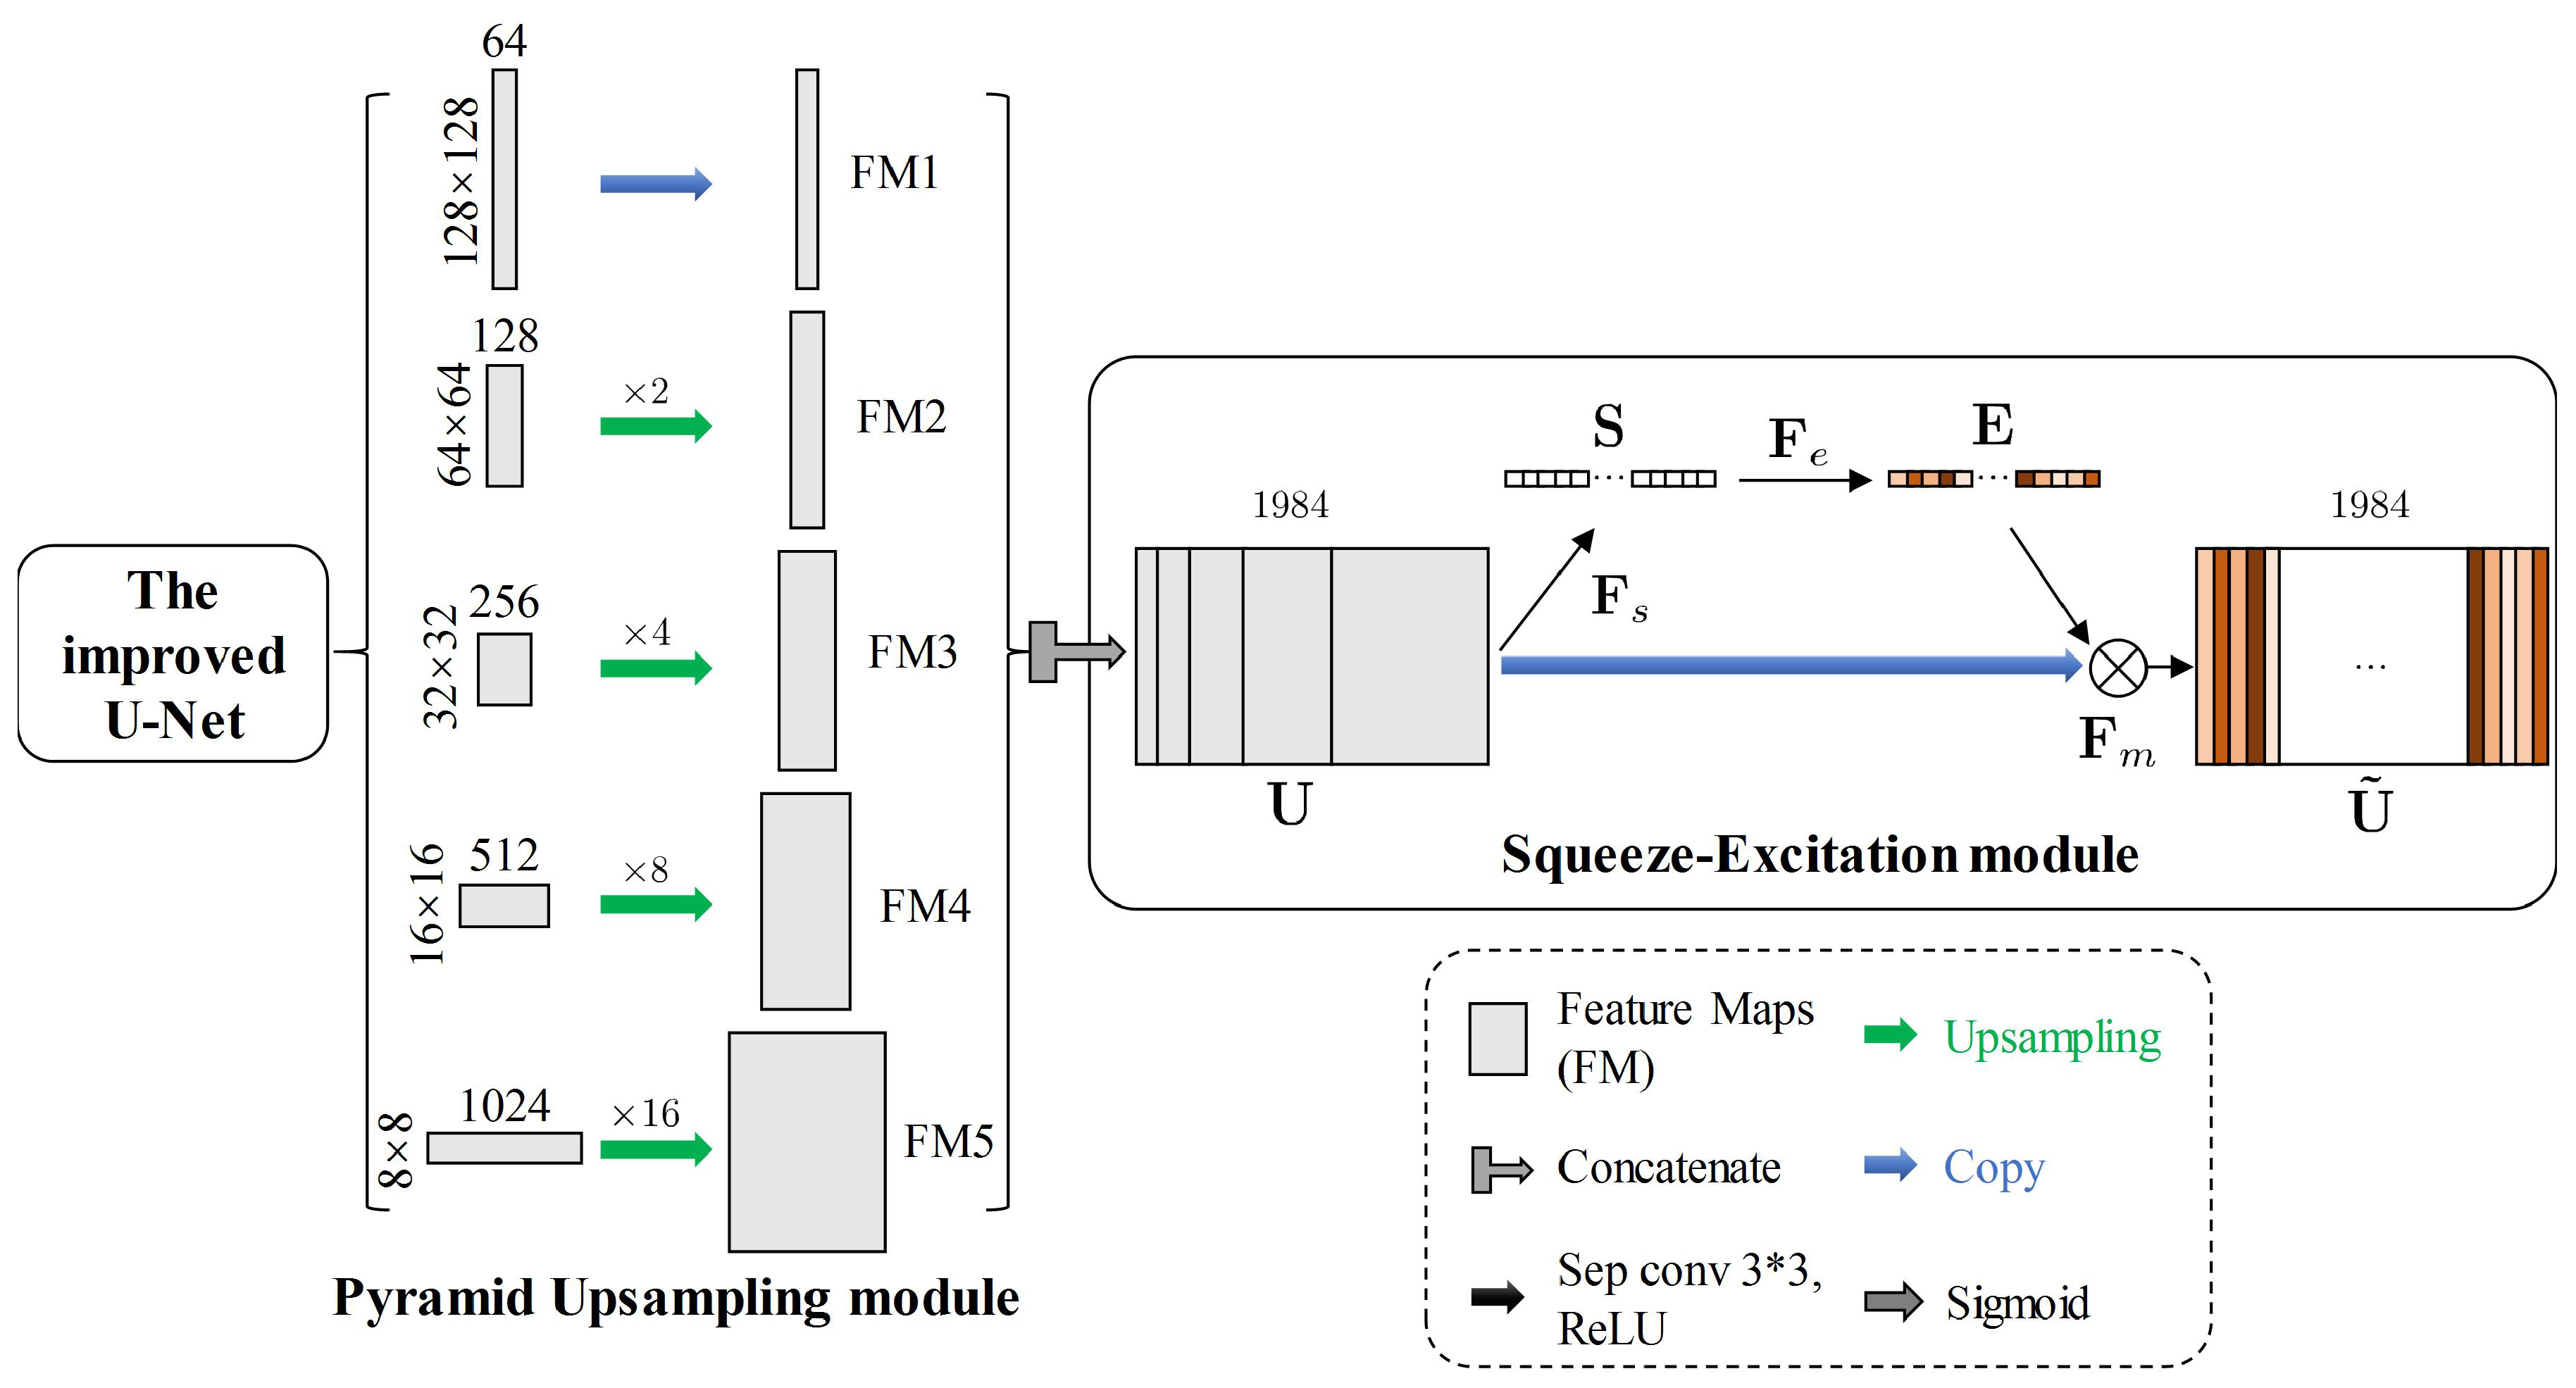
The PSE structure contains a pyramid upsampling module and a squeeze-excitation module (as shown in the yellow blocks in Figure 6). In this paper, we designed a new pyramid upsampling module to fuse the multiscale feature maps from different layers of the improved U-Net. Copy and upsamplings at different rates (rates = 2, 4, 8 and 16) are used to obtain feature maps FM1, FM2, FM3, FM4 and FM5 (as shown in the pyramid upsampling module in Figure 6). The channels of FM1, FM2, FM3, FM4 and FM5 are 64, 128, 256, 512, and 1024, respectively. Then, these feature maps will be copied and concatenated. Thus, the pyramid upsampling module integrates feature maps with different resolutions that contain different scales of raft aquaculture contextual information. Compared with SPP, pyramid upsampling module require fewer numbers of parameters, since pyramid upsampling module contains only upsampling which does not require parameters.
After this simple concatenation, the different channels of the feature maps are reweighted by the squeeze-excitation module to produce robust feature representations. First, the operation (Global Average Pooling) is used to produce a vector (). Second, the operation is a nonlinear transformation applied to learn the channelwise weight vector (), including FC1 (a fully connected layer), a ReLU function, FC2 and a sigmoid function. Finally, the weighted feature matrix is obtained by channelwise multiplication () between matrix and vector , where is the feature matrix concatenated by the pyramid upsampling module, whose size is ().
4. Experiments and Evaluation
In this section, we compare the UPS-Net on the selected dataset with several state-of-the-art methods. The experiment was performed on a laboratory server equipped with an NVIDIA Tesla K80 GPU with 11,440 MB of graphic memory and a CentOS Linux 7.5 operating system. UPS-Net and the other FCN-based methods were trained and tested with Keras [37], using TensorFlow as the backend engine [38].
4.1. Experimental Dataset and Evaluation Metrics
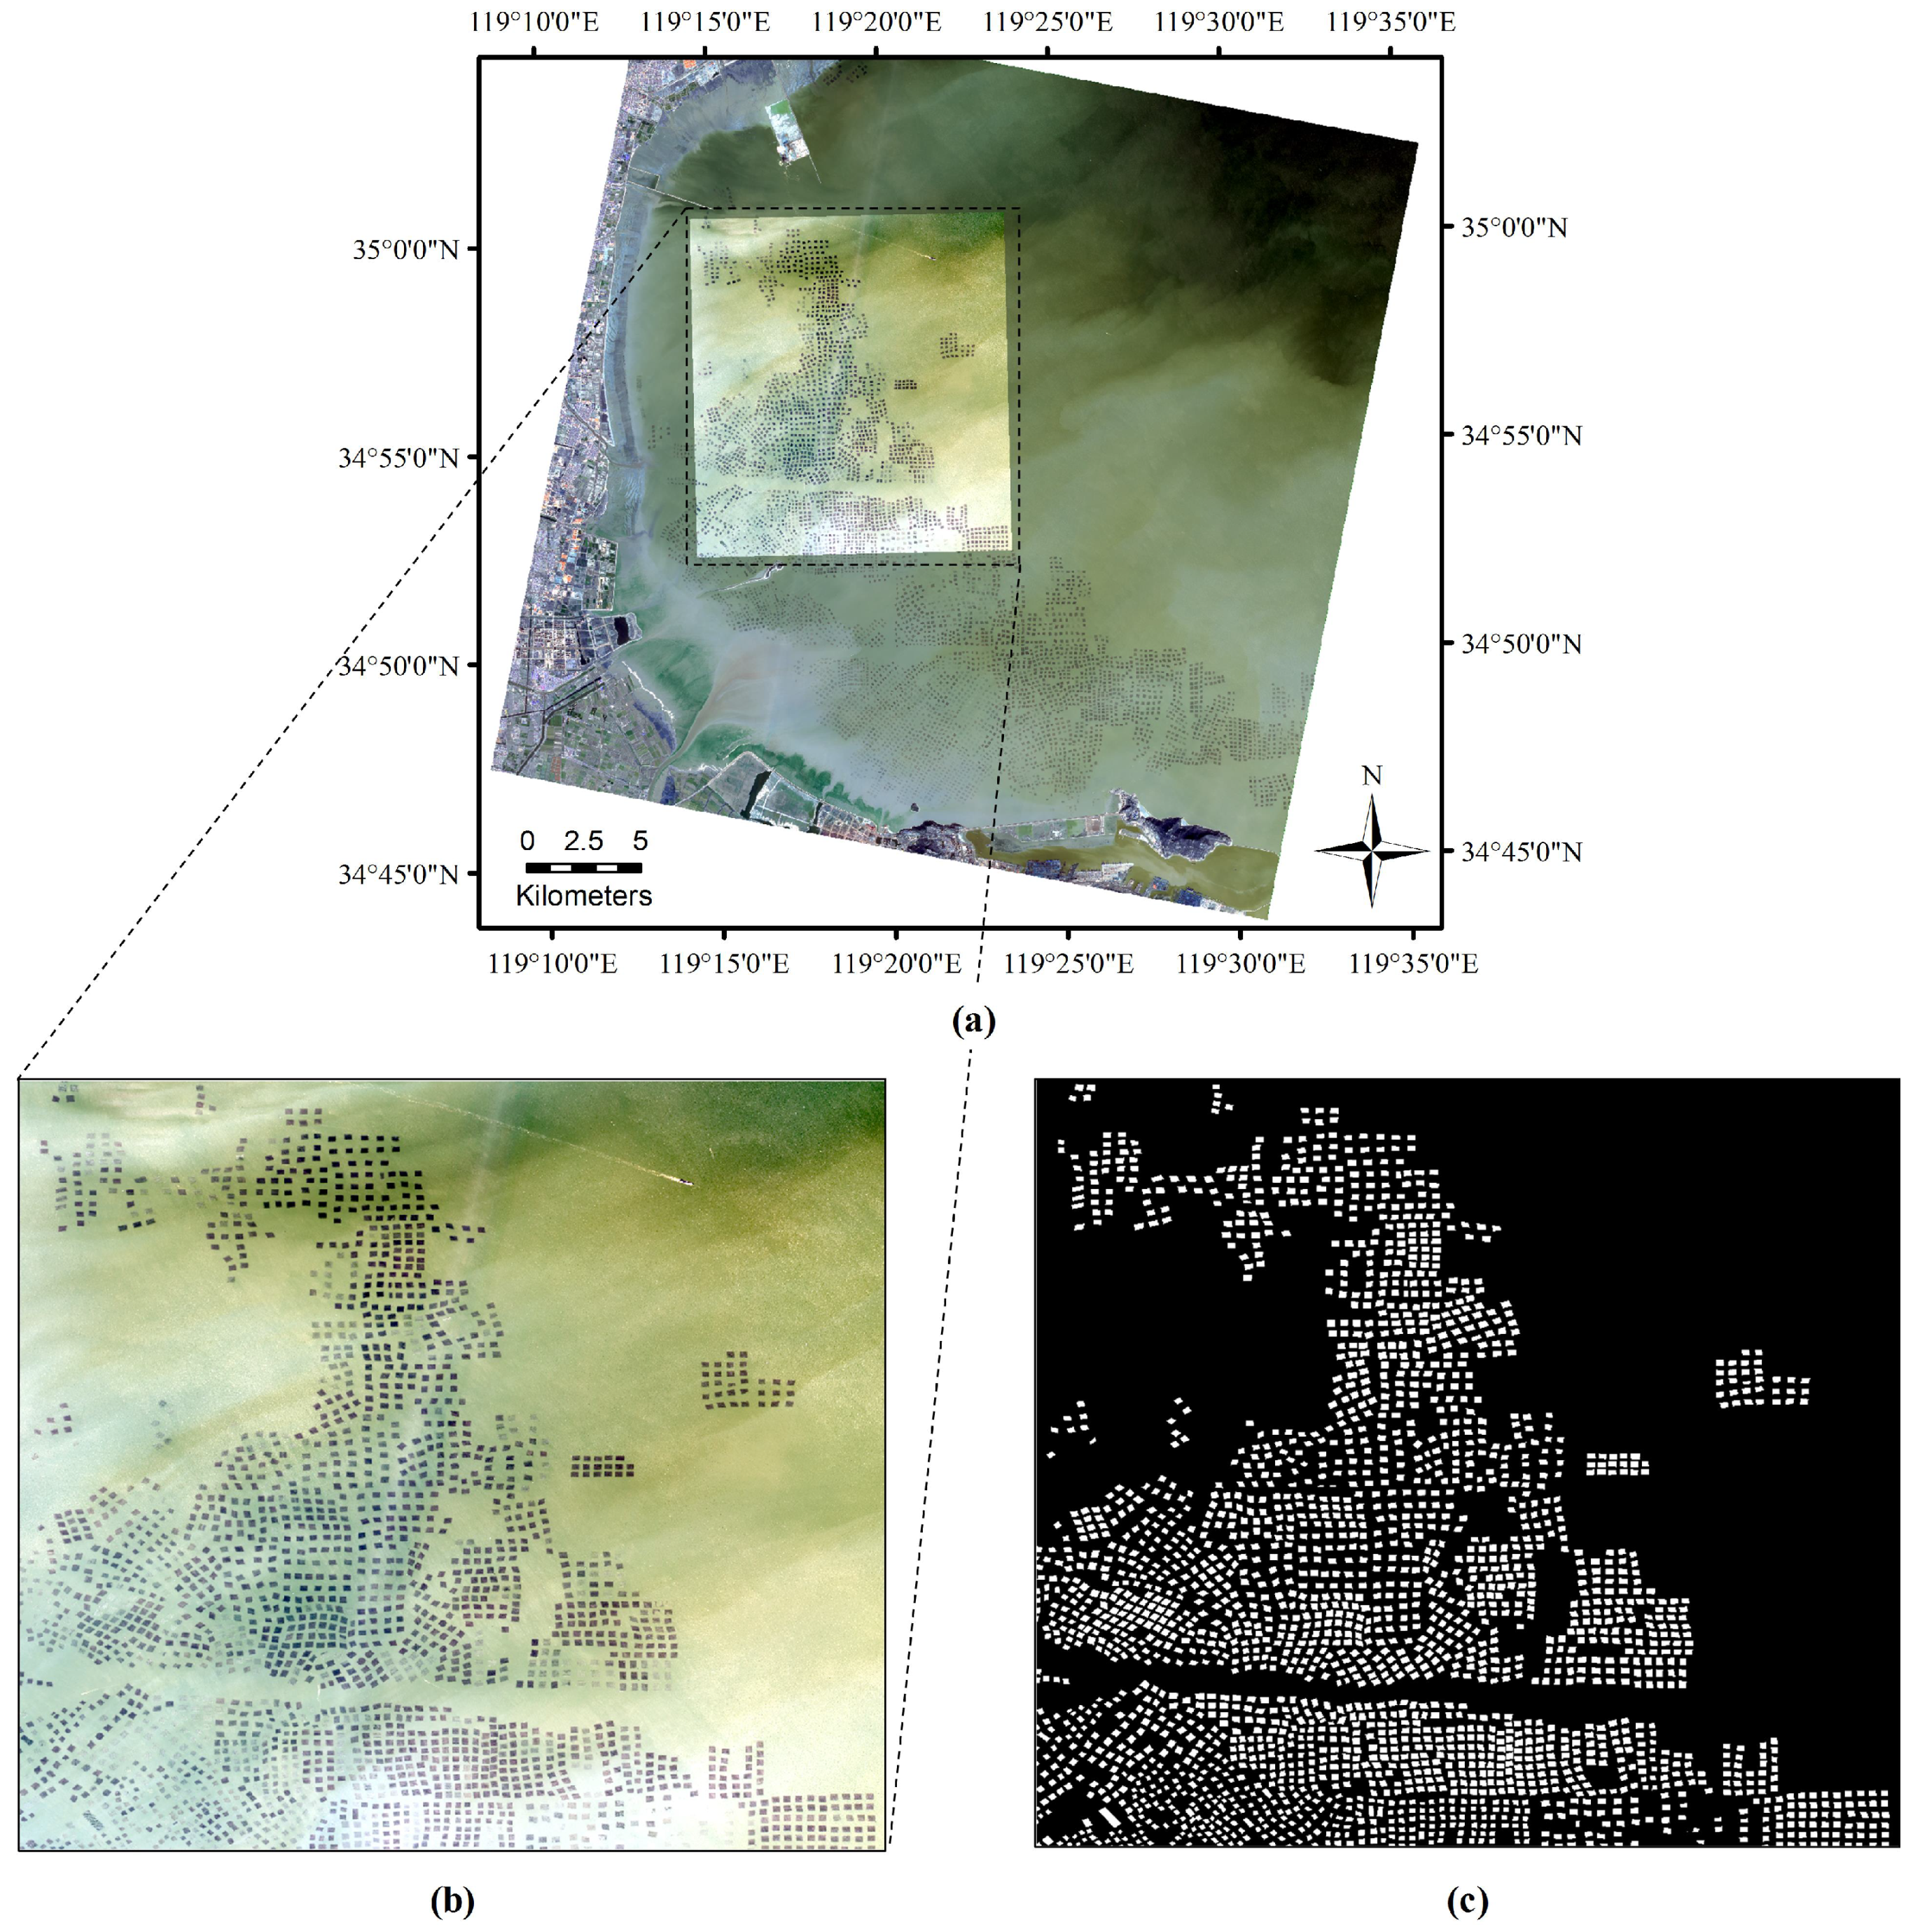
Our raft aquaculture areas extraction method was verified using Gaofen-1 remote sensing image of the offshore area of eastern Lianyungang (see Figure 7a). The image acquisition date was 17 February 2017, and the sensor model was PMS2 (1.8-m spatial resolution after image fusion). The high-resolution experimental image contains more than 2000 raft aquaculture areas. Each raft aquaculture area is labeled manually by visual interpretation. The experimental image and the ground truth map (as shown in Figure 7b,c) are cropped and divided into a training set, a validation set and a test set (as shown in Table 2). The remote sensing images and ground truth maps are cropped into small patches of pixels. The ground truth map is a binary image, with white representing raft aquaculture areas and black representing seawater.
In the ground truth map, the aquaculture areas are regarded as positive samples, and the seawater is regarded as negative samples. In the experiment, we use precision, recall and the F1-measure to evaluate the different models for extracting raft aquaculture areas. Precision and recall are respectively defined as follows:
where TP, FP and FN represent the number of true positives, false positives, and false negatives, respectively. The F1-measure is defined as follows:
4.2. The Process of Hyperparameter Tuning and Setting
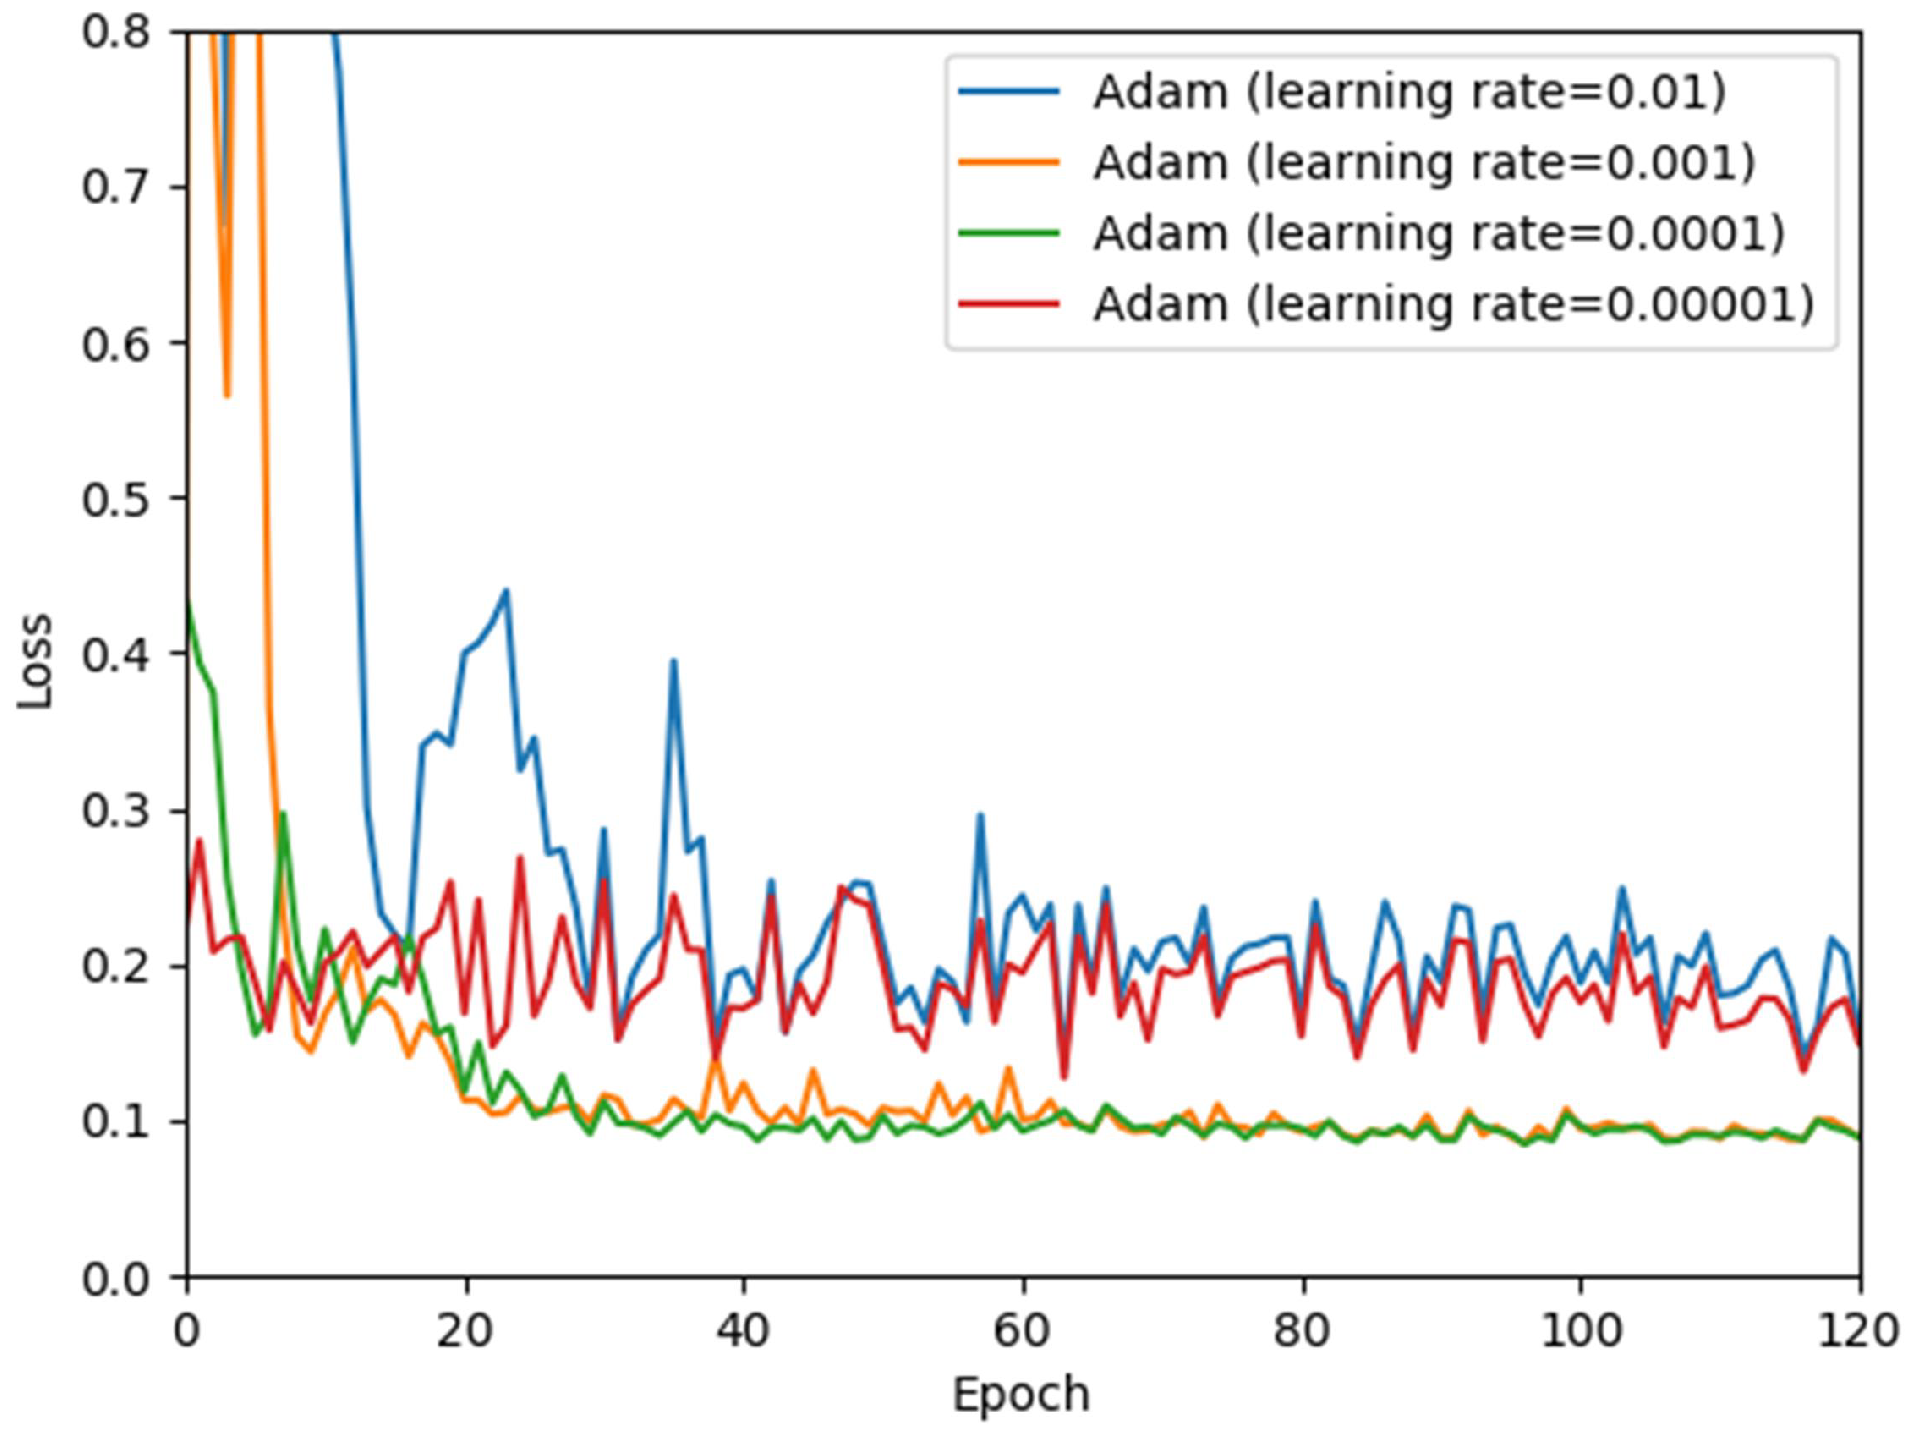
In the experiment, the Adam algorithm [39] was used to minimize the overall loss, which can automatically adjust the learning rate. However, the initial learning rate must be determined in advance. We experimented with various initial learning rates, such as 0.01, 0.001, 0.0001 and 0.00001. Finally, we set initial learning rate to 0.0001, because it can converge faster, as shown in Figure 8. The iteration will be stopped when the loss no longer decreases on the validation set. In this paper, the number of iterations and epochs are 1132 and 40, respectively. The batch size defines the number of training samples that will be propagated through the network in one iteration. In the experiment, we set the number of bath size to 8 and obtained a satisfactory convergence speed and accuracy.
4.3. Experimental Results and Comparison
In order to verify the effectiveness of our proposed raft aquaculture areas extraction method, we compare the UPS-Net on the selected dataset with several state-of-the-art methods, i.e., SVM [40], Mask R-CNN [22], FCN [19], U-Net [20], PSPNet [21], DeepLabv3+ [16] and DS-HCN [13]. The SVM method uses a radial basis kernel function [40] with two important parameters, C and , which were set to 1.8 and 0.34 respectively in the experiment. We modified the input of U-Net from one band to three bands so that it could process high resolution remote sensing images. The backbone of Mask R-CNN, FCN, PSPNet, DeepLabv3+ and DS-HCN are ResNet-50, VGG-19, ResNet-50, Xception and VGG-16, respectively. The architectures of FCN, U-Net, PSPNet, DeepLabv3+ and DS-HCN in the experiment are in strict accordance with the original settings. Further, the robustness of the model was endorsed by five-fold cross-validation experiment. As shown in Table 3, the final result present with mean and standard deviation of precision, recall and F1.
Table 3 provides a detailed comparison of these methods, where we can see that the recall and F1-measure of the proposed UPS-Net are higher than those of the other methods. Compared with deep learning methods, the precision, recall and F1-measure scores of SVM is not so good because it only uses the spectral information of the raft aquaculture areas. The FCN method achieves the highest precision (89.2%), but its recall is lower than that of the other deep learning methods. Mask R-CNN performs semantic segmentation for raft aquaculture areas object and achieves better recall and F1 than FCN. The proposed UPS-Net has a precision of 89.1% and is superior to other methods except the FCN method. The Recall and F1-measure are 88.7% and 89.0%, respectively, which are the highest compared to other methods. In addition, using depthwise separable convolution and pyramid upsampling module can significantly reduce the parameters. As shown in the last column in Table 3, UPS-Net only has 4.6 M parameters, which is several times smaller than other FCN based methods. In terms of the standard deviation, the U-Net performes best and the proposed UPS-Net achieves satisfactory results.
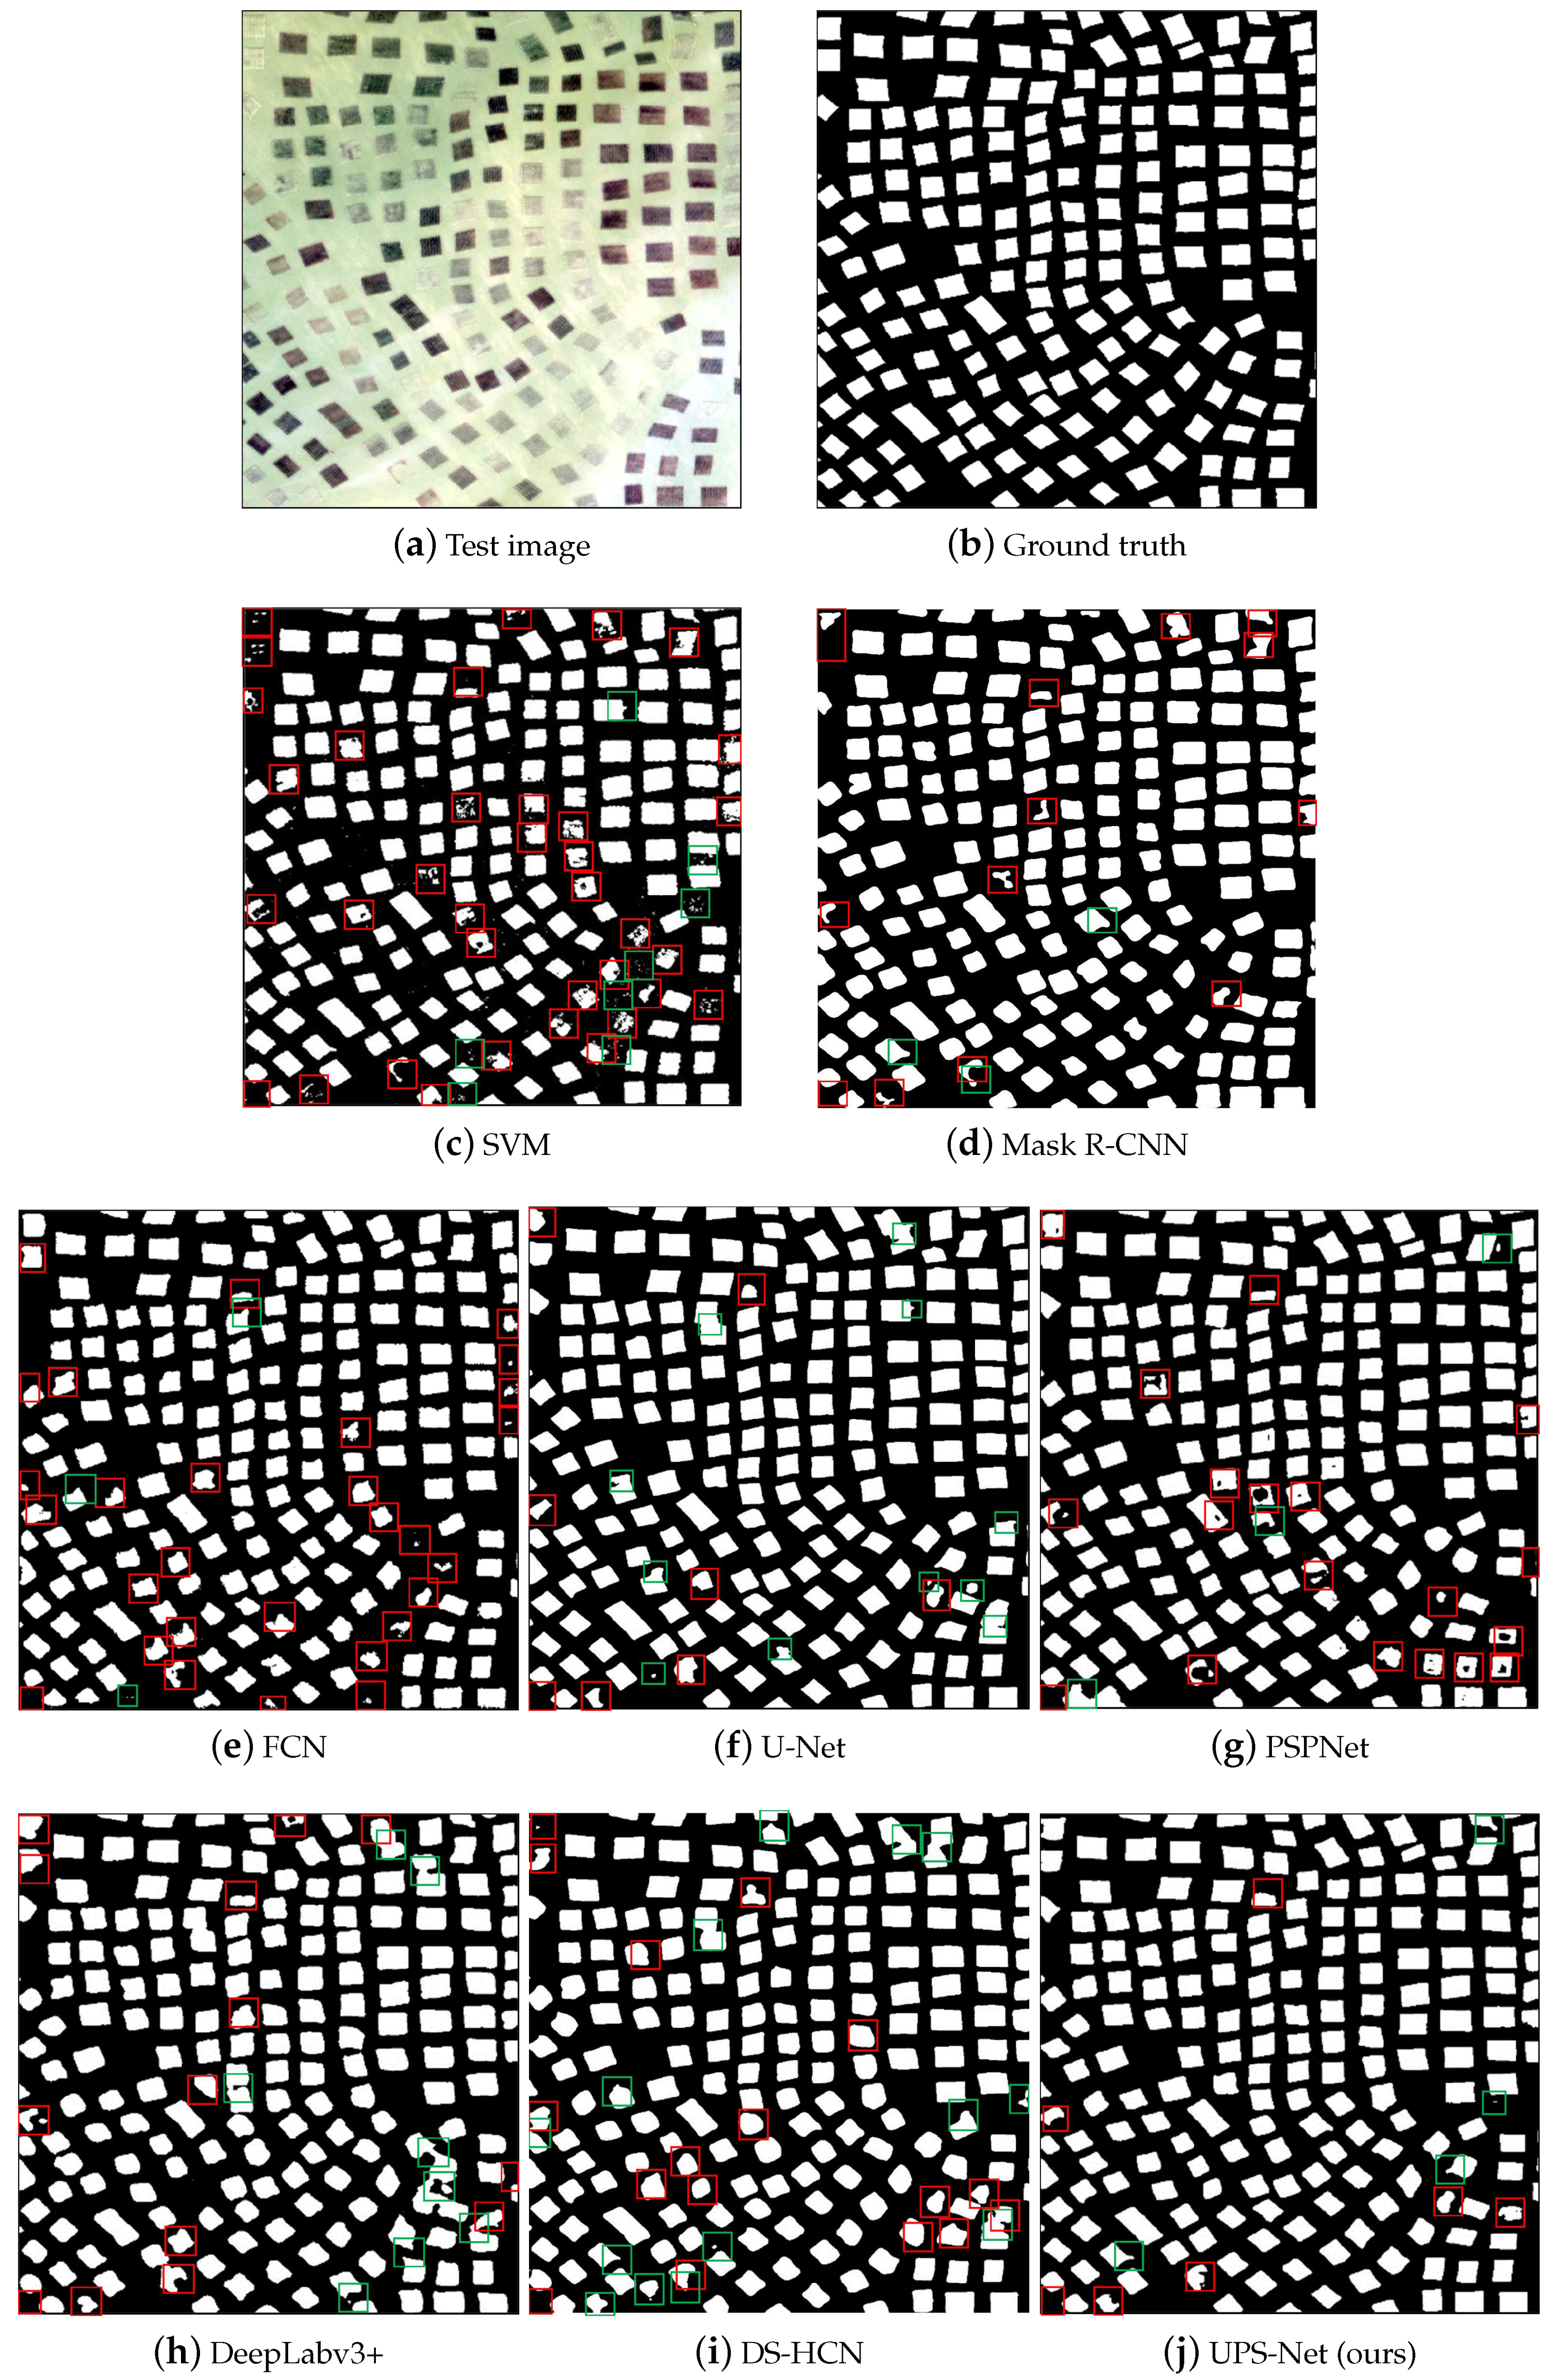
Figure 9 shows the result maps of different methods for extracting raft aquaculture areas, with white representing the extracted raft aquaculture areas and black representing seawater. To discriminate visually among the different methods, we added some annotations to the result maps. In Figure 9c–j, the red rectangles indicate raft aquaculture areas here were misidentified as sea water, and the green rectangles indicate seawater here were misidentified as raft aquaculture areas. The result maps of SVM and FCN contain many raft aquaculture areas that are not fully identified, as shown in the red rectangles. In the result map of Mask R-CNN and PSPNet, the interiors of many raft aquaculture areas are misidentified as seawater, as shown in the red rectangles. In the maps of DeepLabv3+ and DS-HCN, many seawater areas are misidentified as raft aquaculture areas, as shown in the green rectangles. In terms of raft aquaculture areas extraction accuracy and detail preservation, UPS-Net outperforms the other methods.
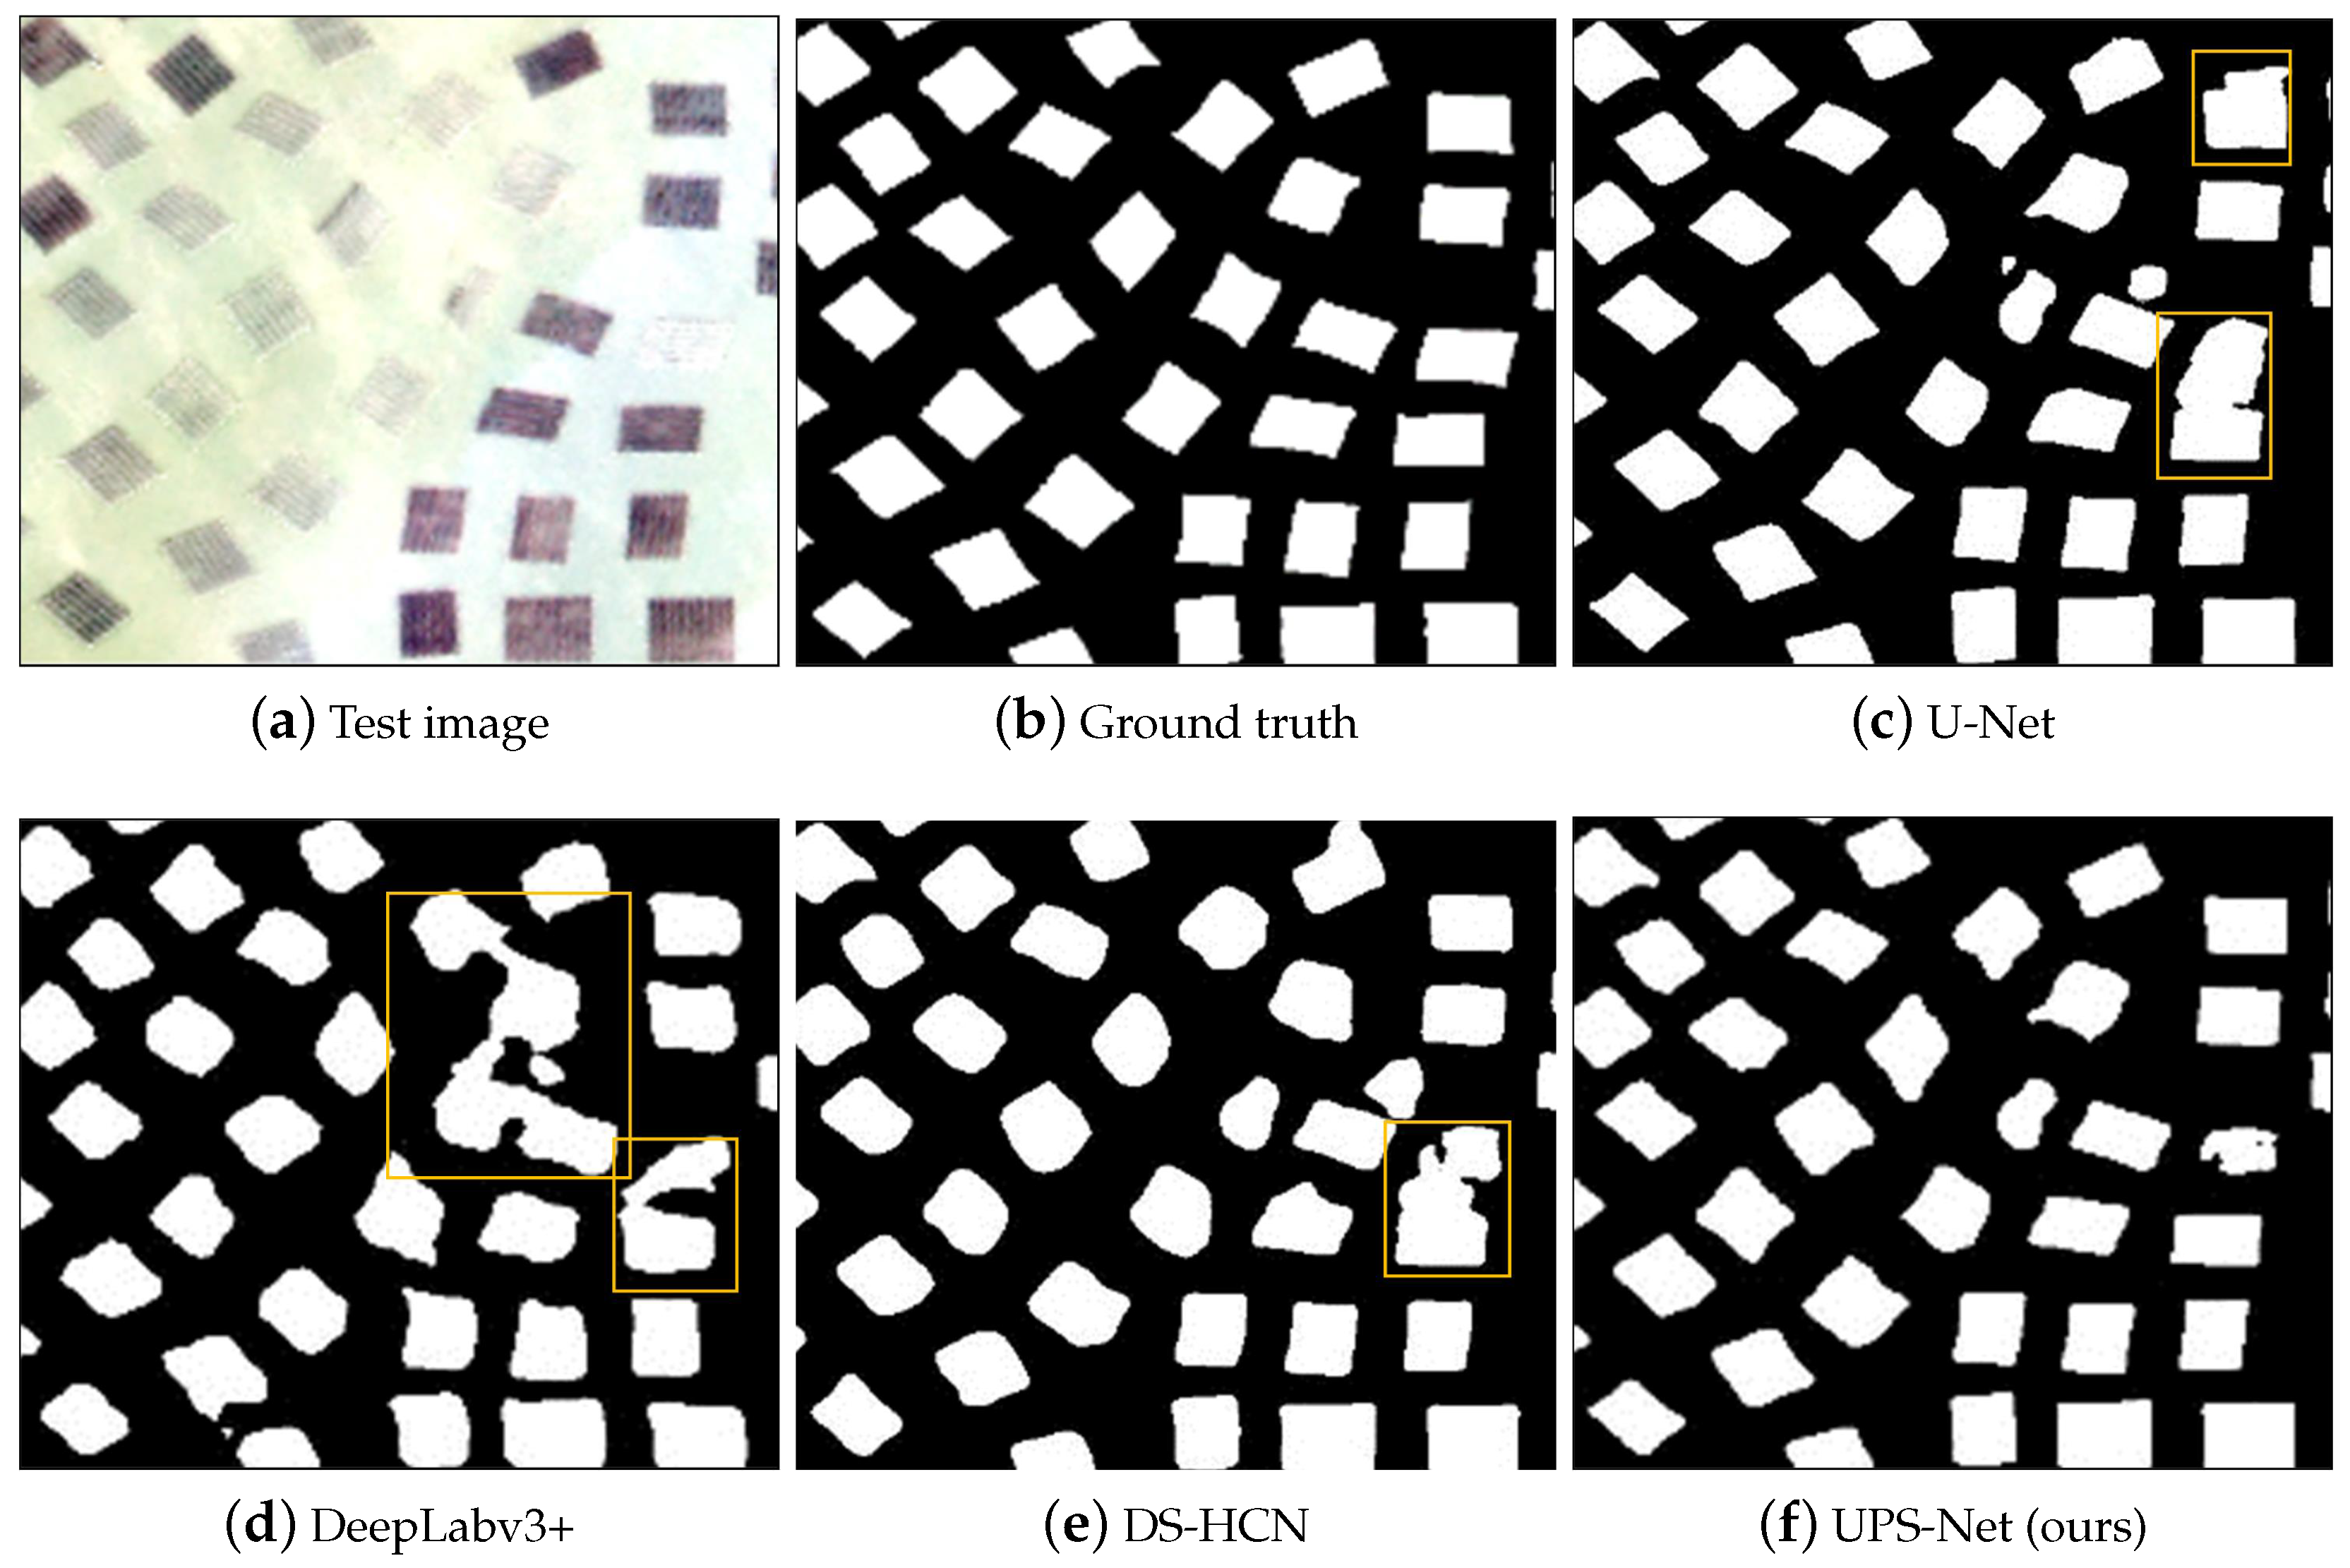
The details of some raft aquaculture areas extraction result maps are given in Figure 10. As shown by the yellow rectangles in Figure 10c–e, the raft aquaculture areas appear to have an ‘adhesion’ phenomenon (some of the raft aquaculture areas are stuck together). This ‘adhesion’ phenomenon mainly occurs in the U-Net, PSPNet, DeepLabv3+ and DS-HCN methods. As shown in Figure 10f, the UPS-Net significantly reduced the ‘adhesion’ phenomenon. However, although the proposed UPS-Net performed satisfactorily on raft aquaculture areas extraction, in some special cases, it did not completely extract aquaculture rafts. For example, the boundaries of the aquaculture area extracted by the proposed UPS-Net look relatively rough, while the boundaries of labeled raft aquaculture areas usually maintain morphological characteristics such as straight lines and right angles [41].
4.4. The Evaluation of the PSE Structure
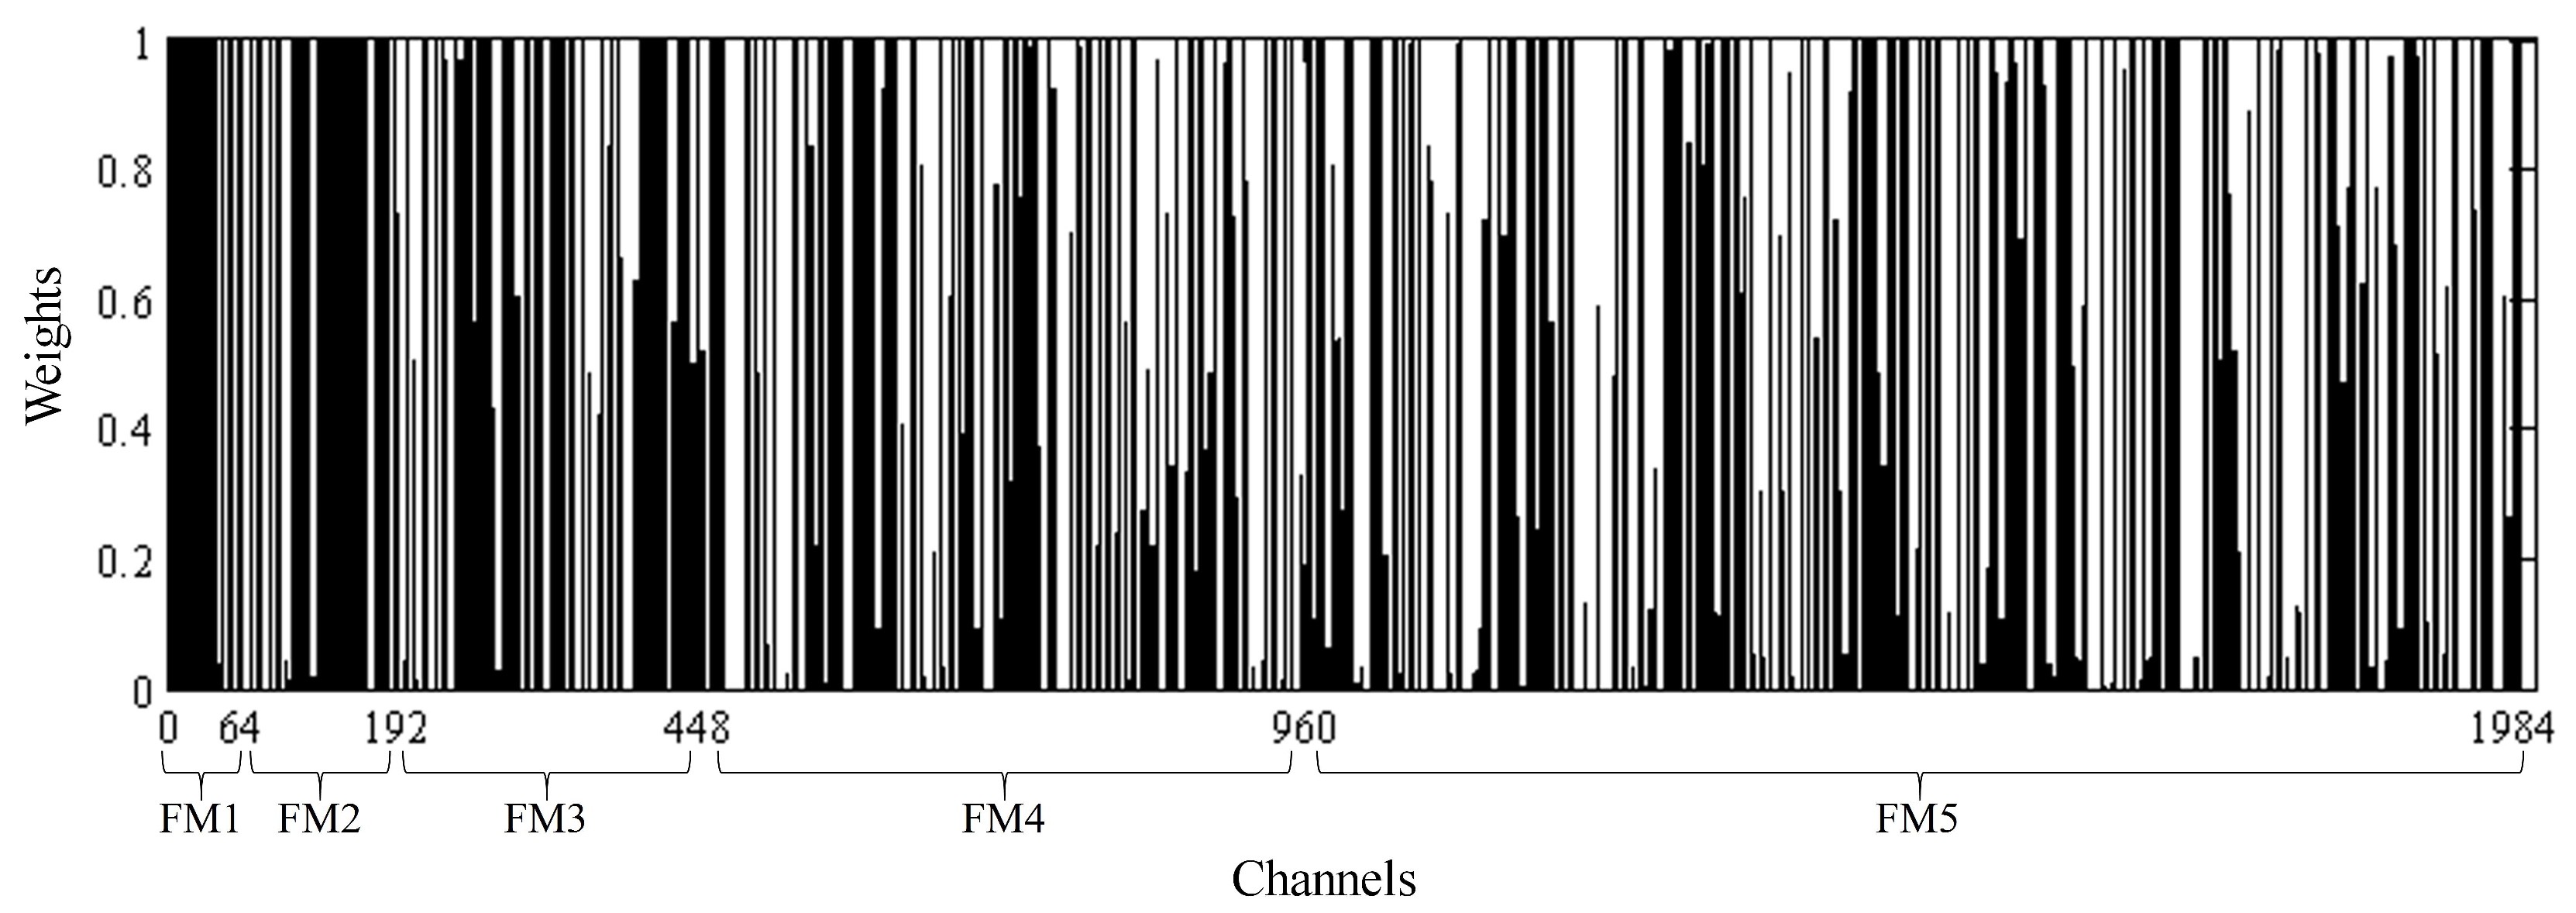
The contextual information is important to semantic segmentation and object extraction [21,42,43]. However, the sizes of raft aquaculture areas are generally not fixed, which makes it difficult to select an appropriate size for extracting multiscale contextual information. Therefore, we designed a PSE structure, which can adaptively utilize these multiscale feature maps. First, the pyramid upsampling module is used to concatenate the multiscale feature maps from the improved U-Net. Then, the squeeze-excitation module learns to use global information to selectively emphasize the informative features and suppress the less useful ones [26]. The visualized the weights of the channels in the squeeze-excitation module are shown in Figure 11. Channels 1–64, 65–192, 193–448, 449–960 and 961–1984 correspond to FM1, FM2, FM3, FM4 and FM5, respectively. As Figure 11 shows, the weights of FM1, FM2 and FM3 are higher than those of FM4 and FM5. Hence, the visualized experiment suggests that the squeeze-excitation module can learn the weight information among the different feature maps.
To further verify the effectiveness of the PSE structure, we designed comparative experiments. We combined different CNNs (U-Net, improved U-Net, PSPNet and DeepLabv3+) with the PSE structure to extract multiscale features. PSPNet and DeepLabv3+, use ResNet50 and Xception as backbones, respectively. The FCN was omitted because it fuses multiscale feature maps by adding skips [19]. Hence, it cannot be combined with the PSE structure. As shown in Table 4, with the PSE structure, the F1-measure of U-Net improves from 87.1% to 88.3%, and the F1-measure of ours improved U-Net increases from 87.3% to 88.8%. With the PSE structure, PSPNet and DeepLabv3+ also have certain performance promotion. From Table 4, we can see that the models with the added PSE structure generally outperform the original models for raft aquaculture areas extraction.
5. Discussion
Raft aquaculture areas are characterized by large quantities, dense distribution, complex spectral information and so on. These factors will lead to the occurrence of ‘adhesion’ phenomenon and inaccurate statistics of the number of raft aquaculture areas. Hence, the goal of this study is to overcome the ‘adhesion’ phenomenon, while improving the classification accuracy of the model.
5.1. Compared with Some Popular FCN-Based Models
The proposed UPS-Net has higher accuracy than do some popular FCN-based models. FCN-based models are convolutionalized version of standard CNNs [18]. They generally use CNNs to obtain the feature maps of the last convolutional layer, and then use up-sampling, feature extraction and feature fusion for semantic segmentation. DeepLabv3+ and PSPNet use spatial pyramid pooling to fuse multiscale contextual features, which increases the accuracy of raft aquaculture areas extraction. However, DeepLabv3+ apply upsampling operations four times, which causes a loss of the detail information and an ‘adhesion’ phenomenon in the result maps of raft aquaculture areas, as shown in Section 4.3, Figure 10. Similarly, in the results of PSPNet, the interiors of many raft aquaculture areas are misidentified. U-Net applies an encoder-decoder structure, which captures detailed boundary information. However, U-Net does not make full use of contextual information, thus ‘adhesion’ phenomenon also appeared in the result maps. In this paper, the proposed UPS-Net is designed to simultaneously capture detailed boundary and multiscale contextual information, which can significantly reduce the ‘adhesion’ phenomenon, and the accuracy is therefore improved.
Moreover, multiple parallel poolings or atrous depthwise convolutions are required in popular FCN-based models such as DeepLabv3+ and PSPNet to obtain multi-scale contextual features, which will increase computation and parameters of these models. In the proposed UPS-Net, multi-scale feature maps of U-Net that were originally discarded are reused and combined by the PSE structure. Coupled with the use of depthwise separable convolution, the amount of parameters of the UPS-Net is significantly reduced. Therefore, the performance of UPS-Net is far superior to other popular FCN-based models.
5.2. Compared with DS-HCN
The proposed UPS-Net has higher adaptability in raft aquaculture areas extraction because it can automatically fuse multiscale feature maps. DS-HCN is also an outstanding FCN-based method to extract raft aquaculture areas, which includes two fixed scales branches [13]. The small-scale branch is a homogeneous convolutional network with a receptive field of . The large-scale branch has a large receptive field. However, the shape and size of laver raft aquaculture areas are not fixed. Therefore, the proposed UPS-Net applies five different branches to extract multiscale contextual feature maps, and a PSE structure is designed to adaptively utilize these different branches (the multiscale feature maps), which achieved better extraction results for the aquaculture area.
6. Conclusions
In this paper, based on the FCN model, we proposed an improved U-Net with a PSE structure (UPS-Net) for raft aquaculture areas extraction from high resolution optical remote sensing images. The proposed UPS-Net has three main advantages. Its first advantage is that the improved U-Net can capture detailed boundary information and multiscale contextual information of raft aquaculture areas. Its second advantage is that the novel PSE structure can adaptively fuse multiscale feature maps. Hence, UPS-Net achieved outstanding performance on the raft aquaculture areas extraction task and reduce the ’adhesion’ phenomenon. Its third advantage is that, by introducing depthwise separable convolution and pyramid upsampling module, UPS-Net requires fewer parameters. Finally, the complex environments in which aquaculture rafts exist should be considered in future raft aquaculture areas extraction research, such as seaweed growth stage, seaweed harvesting status, etc.
Author Contributions
Conceptualization, B.C.; Investigation, B.C.; Methodology, B.C. and D.F.; Resources, J.C.; Software, D.F.; Validation, G.S., Y.L. and J.C.; Writing—original draft, D.F.; Writing—review & editing, B.C., D.F., G.S. and Y.L.
Funding
This work was co-supported by National key R&D Program of China (2017YFC1405600); National Natural Science Foundation of China (NSFC) (41406200).
Acknowledgments
The authors would like to thank all reviewers and editors for their comments on this paper.
Conflicts of Interest
The authors declare no conflict of interest.
Abbreviations
The following abbreviations are used in this manuscript:
| CNN | Convolutional Neural Network |
| FCN | Fully Convolutional Network |
| R-CNN | Regions with Convolutional Neural Network features |
| UPS-Net | Improved U-Net with a PSE structure |
| GLCM | Gray-Level Co-occurrence Matrix |
| SPP | Spatial Pyramid Pooling |
| PSPNet | Pyramid Scene Parsing Network |
| RCF | Richer Convolutional Features network |
| DS-HCN | Dual-Scale Homogeneous Convolutional Neural Network |
| PSE | Pyramid upsampling and Squeeze-Excitation |
| FM | Feature Maps |
| ReLU | Rectified Linear Unit |
| FC | Fully Connected layer |
| TP | True Positives |
| FP | False Positives |
| FN | False Negatives |
| SVM | Support Vector Machine |
References
- Gentry, R.R.; Froehlich, H.E.; Grimm, D.; Kareiva, P.; Parke, M.; Rust, M.; Gaines, S.D.; Halpern, B.S. Mapping the global potential for marine aquaculture. Nat. Ecol. Evol. 2017, 1, 1317. [Google Scholar] [CrossRef] [PubMed]
- FAO. The State of World Fisheries and Aquaculture; FAO: Rome, Italy, 2018. [Google Scholar]
- Bell, F.W. Food from the Sea: The Economics and Politics of Ocean Fisheries; Routledge: New York, NY, USA, 2019. [Google Scholar]
- Yucel-Gier, G.; Eronat, C.; Sayin, E. The Impact of Marine Aquaculture on the Environment; the Importance of Site Selection and Carrying Capacity. Agric. Sci. 2019, 10, 259–266. [Google Scholar] [CrossRef] [Green Version]
- Grigorakis, K.; Rigos, G. Aquaculture effects on environmental and public welfare–the case of Mediterranean mariculture. Chemosphere 2011, 85, 899–919. [Google Scholar] [CrossRef] [PubMed]
- Volpe, J.V.; Gee, J.L.; Ethier, V.A.; Beck, M.; Wilson, A.J.; Stoner, J.M.S. Global Aquaculture Performance Index (GAPI): The first global environmental assessment of marine fish farming. Sustainability 2013, 5, 3976–3991. [Google Scholar] [CrossRef]
- Pham, T.D.; Yokoya, N.; Bui, D.T.; Yoshino, K.; Friess, D.A. Remote Sensing Approaches for Monitoring Mangrove Species, Structure, and Biomass: Opportunities and Challenges. Remote Sens. 2019, 11. [Google Scholar] [CrossRef]
- Aneece, I.; Thenkabail, P. Accuracies Achieved in Classifying Five Leading World Crop Types and their Growth Stages Using Optimal Earth Observing-1 Hyperion Hyperspectral Narrowbands on Google Earth Engine. Remote Sens. 2018, 10. [Google Scholar] [CrossRef]
- Pham, T.D.; Yoshino, K.; Kaida, N. Monitoring mangrove forest changes in cat ba biosphere reserve using ALOS PALSAR imagery and a GIS-based support vector machine algorithm. In Proceedings of the International Conference on Geo-Spatial Technologies and Earth Resources, Hanoi, Vietnam, 5–6 October 2017; Springer: Berlin/Heidelberg, Germany, 2017; pp. 103–118. [Google Scholar]
- Fan, J.C.; Chu, J.L.; Geng, J.; Zhang, F.S. Floating raft aquaculture information automatic extraction based on high resolution SAR images. In Proceedings of the 2015 IEEE International Geoscience and Remote Sensing Symposium (IGARSS), Milan, Italy, 26–31 July 2015; pp. 3898–3901. [Google Scholar]
- Wang, M.; Cui, Q.; Wang, J.; Ming, D.; Lv, G. Raft cultivation area extraction from high resolution remote sensing imagery by fusing multi-scale region-line primitive association features. ISPRS J. Photogramm. Remote. Sens. 2017, 123, 104–113. [Google Scholar] [CrossRef]
- Hu, Y.; Fan, J.; Wang, J. Target recognition of floating raft aquaculture in SAR image based on statistical region merging. In Proceedings of the 2017 Seventh International Conference on Information Science and Technology (ICIST), Da Nang, Vietnam, 16–19 April 2017; pp. 429–432. [Google Scholar]
- Shi, T.; Xu, Q.; Zou, Z.; Shi, Z. Automatic Raft Labeling for Remote Sensing Images via Dual-Scale Homogeneous Convolutional Neural Network. Remote Sens. 2018, 10. [Google Scholar] [CrossRef]
- Durand, T.; Mehrasa, N.; Mori, G. Learning a Deep ConvNet for Multi-label Classification with Partial Labels. In Proceedings of the IEEE Conference on Computer Vision and Pattern Recognition, Long Beach, CA, USA, 16–20 June 2019; pp. 647–657. [Google Scholar]
- Li, P.; Chen, X.; Shen, S. Stereo r-cnn based 3d object detection for autonomous driving. In Proceedings of the IEEE Conference on Computer Vision and Pattern Recognition (CVPR), Long Beach, CA, USA, 16–20 June 2019; pp. 7644–7652. [Google Scholar]
- Chen, L.C.; Zhu, Y.; Papandreou, G.; Schroff, F.; Adam, H. Encoder-decoder with atrous separable convolution for semantic image segmentation. In Proceedings of the European conference on computer vision (ECCV), Munich, Germany, 8–14 September 2018; pp. 801–818. [Google Scholar]
- Simonyan, K.; Zisserman, A. Very deep convolutional networks for large-scale image recognition. arXiv 2014, arXiv:1409.1556. [Google Scholar]
- Fu, G.; Liu, C.; Zhou, R.; Sun, T.; Zhang, Q. Classification for High Resolution Remote Sensing Imagery Using a Fully Convolutional Network. Remote Sens. 2017, 9. [Google Scholar] [CrossRef]
- Long, J.; Shelhamer, E.; Darrell, T. Fully convolutional networks for semantic segmentation. In Proceedings of the IEEE Conference on Computer Vision and Pattern Recognition (CVPR), Boston, MA, USA, 7–12 June 2015; pp. 3431–3440. [Google Scholar]
- Ronneberger, O.; Fischer, P.; Brox, T. U-net: Convolutional networks for biomedical image segmentation. In Proceedings of the International Conference on Medical Image Computing and Computer-Assisted Intervention, Munich, Germany, 5–9 October 2015; Springer: Berlin/Heidelberg, Germany, 2015; pp. 234–241. [Google Scholar]
- Zhao, H.; Shi, J.; Qi, X.; Wang, X.; Jia, J. Pyramid scene parsing network. In Proceedings of the IEEE Conference on Computer Vision and Pattern Recognition (CVPR), Honolulu, HI, USA, 21–26 July 2017; pp. 2881–2890. [Google Scholar]
- He, K.; Gkioxari, G.; Dollar, P.; Girshick, R. Mask R-CNN. IEEE Trans. Pattern Anal. Mach. Intell. 2018. [Google Scholar] [CrossRef] [PubMed]
- Liu, Y.; Cheng, M.M.; Hu, X.; Wang, K.; Bai, X. Richer convolutional features for edge detection. In Proceedings of the IEEE Conference on Computer Vision and Pattern Recognition (CVPR), Honolulu, HI, USA, 21–26 July 2017; pp. 3000–3009. [Google Scholar]
- Yueming, L.; Xiaomei, Y.; Zhihua, W.; Chen, L. Extracting raft aquaculture areas in Sanduao from high-resolution remote sensing images using RCF. Haiyang Xuebao 2019, 41, 119–130. [Google Scholar]
- Pan, B.; Shi, Z.; Xu, X. Hierarchical guidance filtering-based ensemble classification for hyperspectral images. IEEE Trans. Geosci. Remote. Sens. 2017, 55, 4177–4189. [Google Scholar] [CrossRef]
- Hu, J.; Shen, L.; Sun, G. Squeeze-and-excitation networks. In Proceedings of the IEEE Conference on Computer Vision and Pattern Recognition (CVPR), Salt Lake City, UT, USA, 18–22 June 2018; pp. 7132–7141. [Google Scholar]
- Kaiser, L.; Gomez, A.N.; Chollet, F. Depthwise separable convolutions for neural machine translation. arXiv 2017, arXiv:1706.03059. [Google Scholar]
- Krizhevsky, A.; Sutskever, I.; Hinton, G.E. Imagenet classification with deep convolutional neural networks. In Proceedings of the Advances IN Neural Information Processing Systems, Stateline, NV, USA, 5–10 December 2012; pp. 1097–1105. [Google Scholar]
- Hien, D.H.T. A Guide to Receptive Field Arithmetic for Convolutional Neural Networks. Available online: https://medium.com/mlreview/a-guide-to-receptive-field-arithmetic-for-convolutional-neural-networks-e0f514068807/ (accessed on 6 April 2017).
- Roy, A.G.; Navab, N.; Wachinger, C. Concurrent spatial and channel ‘squeeze & excitation’in fully convolutional networks. In Proceedings of the International Conference on Medical Image Computing and Computer-Assisted Intervention, Granada, Spain, 16–20 September 2018; Springer: Berlin/Heidelberg, Germany, 2018; pp. 421–429. [Google Scholar]
- Hu, Y.; Wen, G.; Luo, M.; Dai, D.; Ma, J.; Yu, Z. Competitive inner-imaging squeeze and excitation for residual network. arXiv 2018, arXiv:1807.08920. [Google Scholar]
- Lin, M.; Chen, Q.; Yan, S. Network in network. arXiv 2013, arXiv:1312.4400. [Google Scholar]
- Hsiao, T.Y.; Chang, Y.C.; Chou, H.H.; Chiu, C.T. Filter-based deep-compression with global average pooling for convolutional networks. J. Syst. Archit. 2019, 95, 9–18. [Google Scholar] [CrossRef]
- Nair, V.; Hinton, G.E. Rectified linear units improve restricted boltzmann machines. In Proceedings of the 27th international conference on machine learning (ICML-10), Haifa, Israel, 21–24 June 2010; pp. 807–814. [Google Scholar]
- Law, M.; Collins, A. Getting to Know ArcGIS for Desktop; ESRI Press: Redlands, CA, USA, 2013. [Google Scholar]
- Andrychowicz, M.; Denil, M.; Gomez, S.; Hoffman, M.W.; Pfau, D.; Schaul, T.; Shillingford, B.; De Freitas, N. Learning to learn by gradient descent by gradient descent. In Proceedings of the Advances in Neural Information Processing Systems, Barcelona, Spain, 5–10 December 2016; pp. 3981–3989. [Google Scholar]
- Ketkar, N. Introduction to keras. In Deep Learning with Python; Springer: Berlin/Heidelberg, Germany, 2017; pp. 97–111. [Google Scholar]
- Abadi, M.; Barham, P.; Chen, J.; Chen, Z.; Davis, A.; Dean, J.; Devin, M.; Ghemawat, S.; Irving, G.; Isard, M.; et al. Tensorflow: A system for large-scale machine learning. In Proceedings of the 12th USENIX Symposium on Operating Systems Design and Implementation (OSDI’16), Savannah, GA, USA, 2–4 November 2016; pp. 265–283. [Google Scholar]
- Kingma, D.P.; Ba, J. Adam: A method for stochastic optimization. arXiv 2014, arXiv:1412.6980. [Google Scholar]
- Kuo, B.C.; Ho, H.H.; Li, C.H.; Hung, C.C.; Taur, J.S. A kernel-based feature selection method for SVM with RBF kernel for hyperspectral image classification. IEEE J. Sel. Top. Appl. Earth Obs. Remote. Sens. 2013, 7, 317–326. [Google Scholar]
- Liu, P.; Liu, X.; Liu, M.; Shi, Q.; Yang, J.; Xu, X.; Zhang, Y. Building Footprint Extraction from High-Resolution Images via Spatial Residual Inception Convolutional Neural Network. Remote Sens. 2019, 11. [Google Scholar] [CrossRef]
- Chen, L.C.; Papandreou, G.; Schroff, F.; Adam, H. Rethinking atrous convolution for semantic image segmentation. arXiv 2017, arXiv:1706.05587. [Google Scholar]
- Lin, G.; Milan, A.; Shen, C.; Reid, I. Refinenet: Multi-path refinement networks for high-resolution semantic segmentation. In Proceedings of the IEEE Conference on Computer Vision and Pattern Recognition (CVPR), Honolulu, HI, USA, 21–26 July 2017; pp. 1925–1934. [Google Scholar] [CrossRef]
Figure 1.
Raft aquaculture areas in natural environments: (a) Raft aquaculture species being cultivated in seawater; (b) Raft aquaculture species raised above the seawater surface to kill the green algal and germs on surface of the thallus.
Figure 1.
Raft aquaculture areas in natural environments: (a) Raft aquaculture species being cultivated in seawater; (b) Raft aquaculture species raised above the seawater surface to kill the green algal and germs on surface of the thallus.

Figure 2.
Raft aquaculture areas images: Remote sensing images of laver raft aquaculture areas with 1.8-m spatial resolution. The right image shows the close-up view of the raft aquaculture areas image denoted by red dashed boxes in the left figure.
Figure 2.
Raft aquaculture areas images: Remote sensing images of laver raft aquaculture areas with 1.8-m spatial resolution. The right image shows the close-up view of the raft aquaculture areas image denoted by red dashed boxes in the left figure.

Figure 3.
Squeeze-excitation module.

Figure 4.
The general process of our raft aquaculture areas extraction. The data preprocessing stage, the training stage and the testing stage are illustrated in the upper, middle, and lower parts of the figure, respectively. The UPS-Net model is a simplified version of the network.
Figure 4.
The general process of our raft aquaculture areas extraction. The data preprocessing stage, the training stage and the testing stage are illustrated in the upper, middle, and lower parts of the figure, respectively. The UPS-Net model is a simplified version of the network.

Figure 5.
The improved U-Net. Each gray rectangle represents a multichannel feature map with the channel number at the top of the gray rectangle and the size on the left sides.
Figure 5.
The improved U-Net. Each gray rectangle represents a multichannel feature map with the channel number at the top of the gray rectangle and the size on the left sides.

Figure 6.
The PSE structure, including the pyramid upsampling module and the squeeze-excitation module.
Figure 6.
The PSE structure, including the pyramid upsampling module and the squeeze-excitation module.

Figure 7.
(a) Experimental area; (b) Experimental image; (c) Ground truth map.

Figure 8.
Different learning rate of Adam algorithm on validation set.

Figure 9.
Extraction of raft aquaculture areas on the test image: (a) Test image; (b) Ground truth; (c) SVM; (d) Mask R-CNN; (e) FCN; (f) U-Net; (g) PSPNet; (h) DeepLabv3+; (i) DS-HCN; (j) UPS-Net. The red rectangles indicate raft aquaculture areas here were misrecognized as seawater, and the green rectangles indicate seawater areas here were misrecognized as raft aquaculture areas.

Figure 10.
The ‘adhesion’ phenomenon in the result maps of raft aquaculture areas extraction: (a) Test image; (b) Ground truth; (c) U-Net; (d) DeepLabv3+; (e) DS-HCN; (f) UPS-Net. The yellow rectangles indicate that raft aquaculture areas appeared ‘adhesion’ phenomenon.
Figure 10.
The ‘adhesion’ phenomenon in the result maps of raft aquaculture areas extraction: (a) Test image; (b) Ground truth; (c) U-Net; (d) DeepLabv3+; (e) DS-HCN; (f) UPS-Net. The yellow rectangles indicate that raft aquaculture areas appeared ‘adhesion’ phenomenon.

Figure 11.
Visualization: the weight information of vector from the squeeze-excitation module. The horizontal axis shows channels of the vector . The vertical axis shows weights of the vector .
Figure 11.
Visualization: the weight information of vector from the squeeze-excitation module. The horizontal axis shows channels of the vector . The vertical axis shows weights of the vector .


Table 1.
Complete network structure of UPS-Net. Conv, sepconv and FC refer to convolution, depthwise separable convolution, fully connect, respectively.
Table 1.
Complete network structure of UPS-Net. Conv, sepconv and FC refer to convolution, depthwise separable convolution, fully connect, respectively.
| Module | Layer Name | Kernel Size | Kernel Number | Connect to |
|---|---|---|---|---|
| Encoder | Conv1_1 (Input) | 3 × 3 | 64 | Conv1_2 |
| Conv1_2 | 3 × 3 | 64 | Maxpooling1 & SepConv6_1 | |
| MaxPooling1 | 2 × 2 | - | SepConv2_1 | |
| SepConv2_1 | 3 × 3 | 128 | SepConv2_2 | |
| SepConv2_2 | 3 × 3 | 128 | Maxpooling2 & SepConv7_1 | |
| MaxPooling2 | 2 × 2 | - | SepConv3_1 | |
| SepConv3_1 | 3 × 3 | 256 | SepConv3_2 | |
| SepConv3_2 | 3 × 3 | 256 | Maxpooling3 & SepConv8_1 | |
| MaxPooling3 | 2 × 2 | - | SepConv3_1 | |
| SepConv4_1 | 3 × 3 | 512 | SepConv4_2 | |
| SepConv4_2 | 3 × 3 | 512 | Maxpooling4 & SepConv9_1 | |
| MaxPooling4 | 2 × 2 | - | SepConv5_1 | |
| SepConv5_1 | 3 × 3 | 1024 | SepConv5_2 | |
| SepConv5_2 | 3 × 3 | 1024 | SepConv10_1 | |
| Dncoder | SepConv6_1 | 3 × 3 | 64 | SepConv6_2 |
| SepConv6_2 | 3 × 3 | 64 | UpSampling11_1 | |
| SepConv7_1 | 3 × 3 | 128 | SepConv7_2 | |
| SepConv7_2 | 3 × 3 | 128 | UpPooling7 & UpSampling11_2 | |
| UpSampling7 | 2 × 2 | - | SepConv6_1 | |
| SepConv8_1 | 3 × 3 | 256 | SepConv8_2 | |
| SepConv8_2 | 3 × 3 | 256 | UpPooling8 & UpSampling11_3 | |
| UpSampling8 | 2 × 2 | - | SepConv9_1 | |
| SepConv9_1 | 3 × 3 | 512 | SepConv9_2 | |
| SepConv9_2 | 3 × 3 | 512 | UpPooling9 & UpSampling11_4 | |
| UpSampling9 | 2 × 2 | - | SepConv10_1 | |
| SepConv10_1 | 3 × 3 | 1024 | UpSampling11_5 | |
| Pyramid upsampling module | UpSampling11_1 | 2 × 2 | 64 | Concatenate12 |
| UpSampling11_2 | 2 × 2 | 128 | Concatenate12 | |
| UpSampling11_3 | 2 × 2 | 256 | Concatenate12 | |
| UpSampling11_4 | 2 × 2 | 512 | Concatenate12 | |
| UpSampling11_5 | 2 × 2 | 1024 | Concatenate12 | |
| Squeeze-Excitation module | Concatenate12 | - | - | FC12_1 & Multiplication12 |
| FC12_1 | - | - | sigmoid12 | |
| sigmoid12 | - | - | FC12_1 | |
| FC12_2 | - | - | Multiplication12 | |
| Multiplication12 | - | - | SepConv13_1 | |
| SepConv13_1 | 3 × 3 | 1984 | SepConv13_2 | |
| SepConv13_2 | 3 × 3 | 2 | sigmoid13 | |
| Sigmoid13 | - | - | (Output) |
Table 2.
Training, validation and test set of the experiments.
| The Data Set | Number of Images | Size of Images | |
|---|---|---|---|
| Training set | The experimental images | 2263 | |
| The ground truth map | 2263 | ||
| Validation set | The experimental images | 564 | |
| The ground truth map | 564 | ||
| Test set | The experimental images | 5 | |
| The ground truth map | 5 | ||
Table 3.
Comparison of raft aquaculture areas extraction between SVM, Mask R-CNN, FCN, U-Net, PSPNet, DeepLabv3+, Encoder-Decoder and UPS-Net (average of 5 runs with the standard deviation). The values in bold format are the highest numbers.
Table 3.
Comparison of raft aquaculture areas extraction between SVM, Mask R-CNN, FCN, U-Net, PSPNet, DeepLabv3+, Encoder-Decoder and UPS-Net (average of 5 runs with the standard deviation). The values in bold format are the highest numbers.
| Method | Precision (%) | Recall (%) | F1 (%) | Parameter |
|---|---|---|---|---|
| SVM | 84.6 ± 2.61 | 77.9 ± 1.32 | 81.1 ± 1.93 | |
| Mask R-CNN | 85.9 ± 2.07 | 87.5 ± 2.30 | 86.7 ± 2.15 | 67.3 M |
| FCN | 89.2 ± 2.18 | 79.3 ± 1.40 | 83.6 ± 1.79 | 55.5 M |
| U-Net | 87.5 ± 0.76 | 87.1 ± 0.83 | 87.3 ± 0.80 | 31.0 M |
| PSPNet | 85.5 ± 1.26 | 87.4 ± 2.13 | 86.4 ± 1.70 | 46.7 M |
| DeepLabv3+ | 87.2 ± 3.81 | 86.5 ± 1.77 | 86.8 ± 3.29 | 41.3 M |
| DS-HCN | 87.8 ± 0.84 | 84.7 ± 1.98 | 86.2 ± 1.41 | 11.2 M |
| UPS-Net (ours) | 89.1 ± 1.52 | 88.7 ± 1.17 | 89.0 ± 1.35 | 4.6 M |
Table 4.
Comparison of different FCN-based networks with and without the PSE structure (average of 5 runs with the standard deviation). The values in bold format are the highest numbers.
Table 4.
Comparison of different FCN-based networks with and without the PSE structure (average of 5 runs with the standard deviation). The values in bold format are the highest numbers.
| Method | Precision (%) | Recall (%) | F1 (%) |
|---|---|---|---|
| The improved U-Net | 88.5 ± 1.38 | 86.3 ± 1.61 | 87.4 ± 1.53 |
| UPS-Net (ours) | 89.1 ± 1.52 | 88.7 ± 1.17 | 89.0 ± 1.35 |
| U-Net | 87.6 ± 0.76 | 87.1 ± 0.83 | 87.6 ± 0.80 |
| U-Net + PSE | 87.4 ± 0.88 | 89.0 ± 1.29 | 88.2 ± 1.13 |
| PSPNet | 85.5 ± 1.26 | 87.4 ± 2.13 | 86.4 ± 1.70 |
| PSPNet + PSE | 87.8 ± 1.31 | 87.2 ± 1.93 | 87.6 ± 1.82 |
| DeepLabv3+ | 87.2 ± 3.81 | 86.8 ± 1.77 | 86.9 ± 3.29 |
| DeepLabv3+ + PSE | 87.6 ± 2.25 | 87.5 ± 2.06 | 87.5 ± 1.88 |
© 2019 by the authors. Licensee MDPI, Basel, Switzerland. This article is an open access article distributed under the terms and conditions of the Creative Commons Attribution (CC BY) license (http://creativecommons.org/licenses/by/4.0/).
Share and Cite
MDPI and ACS Style
Cui, B.; Fei, D.; Shao, G.; Lu, Y.; Chu, J. Extracting Raft Aquaculture Areas from Remote Sensing Images via an Improved U-Net with a PSE Structure. Remote Sens. 2019, 11, 2053. https://0-doi-org.brum.beds.ac.uk/10.3390/rs11172053
AMA Style
Cui B, Fei D, Shao G, Lu Y, Chu J. Extracting Raft Aquaculture Areas from Remote Sensing Images via an Improved U-Net with a PSE Structure. Remote Sensing. 2019; 11(17):2053. https://0-doi-org.brum.beds.ac.uk/10.3390/rs11172053
Chicago/Turabian StyleCui, Binge, Dong Fei, Guanghui Shao, Yan Lu, and Jialan Chu. 2019. "Extracting Raft Aquaculture Areas from Remote Sensing Images via an Improved U-Net with a PSE Structure" Remote Sensing 11, no. 17: 2053. https://0-doi-org.brum.beds.ac.uk/10.3390/rs11172053
Note that from the first issue of 2016, this journal uses article numbers instead of page numbers. See further details here.