Article

SAR-to-Optical Image Translation Based on Conditional Generative Adversarial Networks—Optimization, Opportunities and Limits

1
Remote Sensing Technology Institute, German Aerospace Center (DLR), 82234 Wessling, Germany
2
Signal Processing in Earth Observation, Technical University of Munich (TUM), 80333 Munich, Germany
*
Author to whom correspondence should be addressed.
Remote Sens. 2019, 11(17), 2067; https://0-doi-org.brum.beds.ac.uk/10.3390/rs11172067
Submission received: 22 July 2019 / Revised: 23 August 2019 / Accepted: 27 August 2019 / Published: 3 September 2019
(This article belongs to the Special Issue Advances in Remote Sensing Image Fusion)

Abstract

:
Due to its all time capability, synthetic aperture radar (SAR) remote sensing plays an important role in Earth observation. The ability to interpret the data is limited, even for experts, as the human eye is not familiar to the impact of distance-dependent imaging, signal intensities detected in the radar spectrum as well as image characteristics related to speckle or steps of post-processing. This paper is concerned with machine learning for SAR-to-optical image-to-image translation in order to support the interpretation and analysis of original data. A conditional adversarial network is adopted and optimized in order to generate alternative SAR image representations based on the combination of SAR images (starting point) and optical images (reference) for training. Following this strategy, the focus is set on the value of empirical knowledge for initialization, the impact of results on follow-up applications, and the discussion of opportunities/drawbacks related to this application of deep learning. Case study results are shown for high resolution (SAR: TerraSAR-X, optical: ALOS PRISM) and low resolution (Sentinel-1 and -2) data. The properties of the alternative image representation are evaluated based on feedback from experts in SAR remote sensing and the impact on road extraction as an example for follow-up applications. The results provide the basis to explain fundamental limitations affecting the SAR-to-optical image translation idea but also indicate benefits from alternative SAR image representations.

Graphical Abstract

1. Introduction

Synthetic aperture radar (SAR) sensors constitute an important source of information in Earth observation as they allow planning data takes in a reliable manner. The possibility to acquire calibrated signals from a satellite platform and the absence of restrictions related to atmospheric conditions provides important opportunities in the context of, e.g., scene monitoring, situation documentation, or change detection tasks. However, interpreting details in SAR images is a challenging task and pushes experts to their limits. First, SAR imagery inherently contains geometric distortions due to distance dependence along the range axis and signatures related to radar signal wavelengths (mm to cm). In contrast, the human eye is familiar with perspective projections and signals in the visible part of the electromagnetic spectrum. Second, prominent signatures are opportunistic, sparse and often do not correspond to physically existing structures due to signal multiple reflections [1]. Finally, the coherent summation of signal responses from individual scatterers in resolution cells leads to strong intensity fluctuation for surfaces, referred to as the speckle effect (see [2]), e.g., for agricultural fields. Thus, distinguishing structural information in SAR images is difficult, which does not necessarily ease with an increase of spatial resolution.
In consideration of the above points, it can be expected that users of SAR data may wish to use additional means on occasion to facilitate the interpretation of SAR images. This paper follows this idea and investigates the potential of generative deep learning models in the context of SAR image interpretation and the impact of data initialization. The main objective is to find out whether SAR-to-optical image translation is feasible in a well-generalizing manner given the current network architectures and available training data (moderate and high resolution optical and SAR images). SAR images are translated into near-optical representations which is motivated by the familiarity of the human eye to such representations, access to appropriate data sets for training, and possible advantages for follow-up techniques for fusing complementary SAR and optical data.
The authors are aware that there are fundamental limits that cannot be compensated. First, an exhaustive learning of the transition from a single channel SAR image to a multi-channel optical image is expected to be an ill-posed problem, as is the colorization of gray-scale images in classical computer vision [3]. The difficulty of the task is increased by the variability of surface characteristics such as surface standard deviation and correlation length, permittivity, or chemical composition, which contribute to specific wavelength- and temperature-dependent signal responses. Finally, SAR and optical data are acquired with different imaging concepts. Optical data follow perspective projections or push-broom imaging configurations. In contrast, SAR data are acquired with stop-and-go acquisitions along the flight path of the sensor. An example for the difference between SAR and optical images for a scene with buildings, forest and fields is shown in Figure 1. It can be seen that the SAR image emphasizes physical properties of surfaces whereas the optical image provides more structural details. Radar signals are detected with varying spatial distance and post-processed (referred to as SAR focusing) in order to increase the spatial resolution of the images. A compensation of range-dependent image distortion requires prior knowledge about the geometry of scenes, e.g., based on digital surface models [4]. However, this information is not available in the default SAR-to-optical translation task.
Thus, in contrast to related work on SAR-to-optical image-to-image translation (see Section 2), we hypothesize that it is not possible to go the full path from SAR to actual optical data, and that the translation will always end up at a certain point in between. This paper addresses one possible destination point, using an adapted conditional generative adversarial network, taking domain-specific potentials and peculiarities into specific consideration. The discipline of conditional adversarial networks (cGANs) offers promising strategies for generating artificial images and has already successfully been adapted to tasks in multi-sensor remote sensing, e.g., [5,6,7]. Considering the current state-of-the-art, this paper investigates the utilization of an adapted version of the CycleGAN architecture [8] for the SAR-to-optical image translation task and the value of domain knowledge (e.g., initialization, sensor/image characteristics) for improving results. In the context of a case study, benefits and limitations of the SAR image translation method are addressed. Moreover, translation results are evaluated in terms of interpretation support (simplified understanding of original SAR images), despeckling capabilities, feature extraction (example: road detection) compared to state-of-the-art methods as well as the combination of features and context.
The document is structured as follows. Section 2 summarizes related literature and explains the relevance of the reported work. Thereafter, important aspects of interest are introduced in Section 3. The method for image translation is introduced in Section 4, which is followed by the presentation of results for a case study in Section 5. The last part of the paper is focused on evaluating and discussing the image translation results (Section 6). Finally, the conclusion and an outlook to future work are given in Section 7.

2. Related Work

Different strategies for deep learning-based data analysis have entered the field of remote sensing [9]. In the context of SAR image despeckling, the use of convolutional neural networks (CNNs) has already been studied successfully [10]. In the proposed algorithm, which uses a residual net [11], results are comparable to state-of-the-art strategies such as BM3D [12] and NL-SAR [13]. Beyond despeckling, researchers have started to investigate the use of conditional generative adversarial networks (cGANs) for image-to-image translation. As an example, a U-Net architecture extended by spatial Gram matrices computation is used in [14] to enhance the quality of SAR imagery by translating low resolution Sentinel 1 images to high-resolution images similar to Terra-SAR-X data. The spatial Gram matrices produced a better distributed content, with similarities to the real TerraSAR-X patches, but it also generated many fictional elements. In [7], the potential of the translation of SAR into optical images for easing the process of multi-sensor image matching was evaluated based on the well-established pix2pix architecture [15]. The experimental results showed a good performance of the network even without a priori known features. In a similar manner, [5] demonstrated how this form of image-to-image translation can help to ease the coregistration of SAR and optical images for an improvement of the geolocation of optical data. Although the training was experienced to be quite expensive, and although it remains difficult to evaluate artificial, GAN-generated images by standard metrics, visual inspection and comparison to standard similarity measures such as NCC, BRISK and SIFT show the great potential of this approach.
Adding to these pioneering studies, the SAR-GAN network [16] was proposed to translate SAR to optical images to solve the despeckling task and to add color information to the input SAR image. After training the network with samples from Google Maps and generated SAR patches, despeckling performance is comparable to the one achieved when using pix2pix. A similar case is reported in [17], where additional layers that are manually labeled for segmentation (i.e., urban, forest) are added, allowing the system to work with a smaller data set but more discriminative features. Multitemporal SAR imagery can be also beneficial to remove the speckle effect as shown in [18], where a deep residual network is compared with pix2pix. It also shows the advantage of using cGANs with respect to a traditional CNN. Another case of dedicated SAR-optical CNN architecture employing a pseudo-siamese structure is described in [19]. The proposed network aims at the matching of corresponding image patches. As this study showed, the size of the patches played an important role, with larger patch sizes providing better results. A further study based on this architecture feeds the network with hard negative samples [20], where an additional network stage increases the data set and supports the identification of incorrect results. In a second stage, the pseudo-siamese network is applied for the matching of the SAR and optical patches. Also, the recently published SEN1-2 data set has been used for some preliminary experiments regarding SAR-optical image matching, SAR image colorization, and SAR-to-optical image-to-image translation [21].
cGANS have been also applied for filling gaps in optical images. In the case of [6], an architecture based on pix2pix replaces regions covered by clouds. Similarly, a cGAN for cloud removal in multispectral imagery exploiting SAR data as auxiliary information in a fusion manner is described in [22].
All these initial results confirm the potential of cGANs in multi-sensor remote sensing tasks. They are able to reduce the speckle effect, produce smooth textures, fill missing content and represent a feasible direction towards sensor fusion. On the downside, training cGANS is usually difficult due to the computational costs and the visual quality evaluation (objective metrics are not available for stylization tasks). Similarly, the stylization might lead to the loss of relevant image contents and location accuracy, as a result of possible geometric changes. Furthermore, all the mentioned example cases make use of supervised learning, thus requiring large databases of paired imagery. Since this is often difficult to achieve, especially in multi-sensor scenarios, we additionally propose to make use of unsupervised cGAN architectures. Despite some of the expected limitations for the described approach, we want to focus on the possibilities to achieve a high quality representation in the generated images. Hence, we apply different strategies to improve the interpretation of the images while preserving most of the original informative content. Changes in the implementation will be applied to aim for a better result and set an acceptable baseline, comparable to other state of the art approaches.

3. Aspects of Interest

This section summarizes the most relevant aspects addressed by this work. On the one hand, we intend to identify and adapt the most suitable conditional adversarial network for our task. On the other hand, we intend to investigate different aspects in the context of the SAR-to-optical image-to-image translation task:
  • Dynamic range of signal intensity, speckle statistics: SAR images are characterized by the strong variability of signal intensity. Hence, an important question to address is how to handle the high dynamic range of SAR image intensities and the presence of speckle.
  • Freedom/fiction: In contrast to hand-crafted operators for image processing, deep learning-based approaches are difficult to steer. This opens ways to alternative and creative data representations but also to fiction. In terms of data interpretation, the impact is different when looking at full images or local details. Accordingly, it is important to classify the impact of fiction.
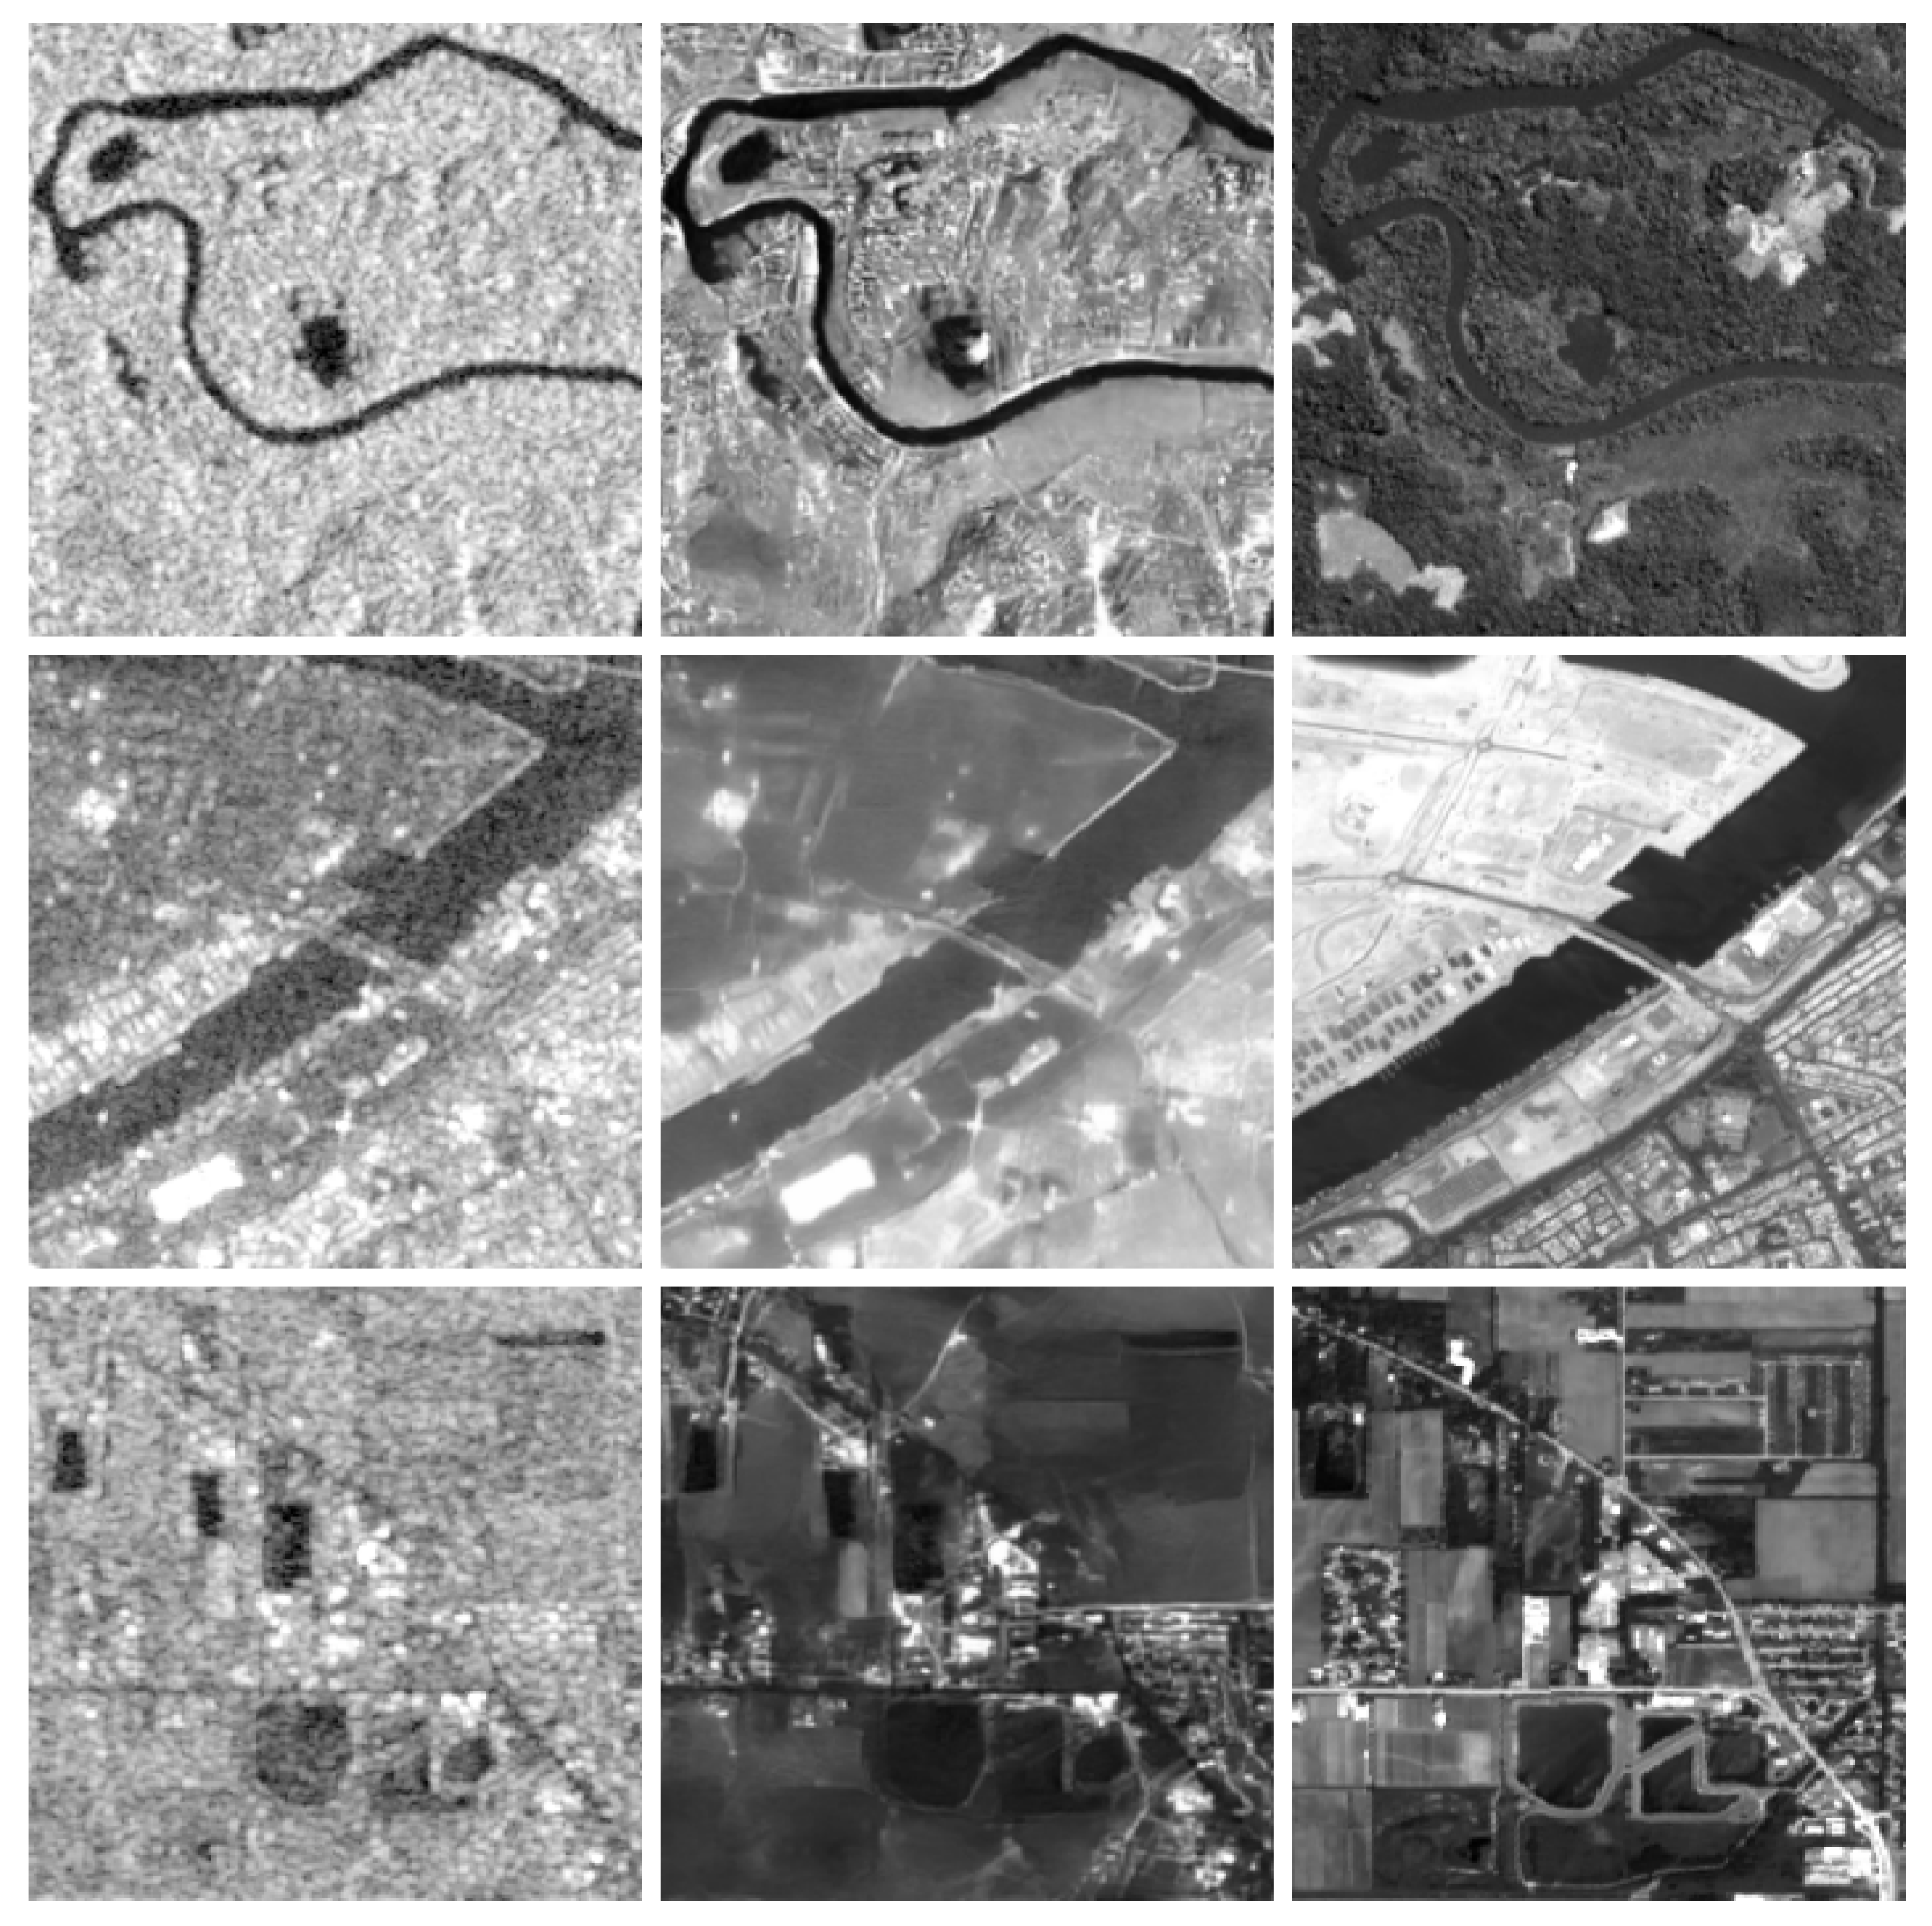
  • Geometry: Areas considered for image translation are characterized by a variable mix of land cover types, e.g., urban, forests, fields, settlements. It is expected that the quality of translation results will not be equal but vary, too.
  • Spatial resolution: Case studies should be conducted for variable spatial resolutions in order to see resulting effects at structural details (e.g., smoothing) and larger scales (e.g., speckle handling).
  • Training: Compared to many machine learning tasks, the amount of accessible training data is limited. Accordingly, it is important to try different training strategies for the translation task.
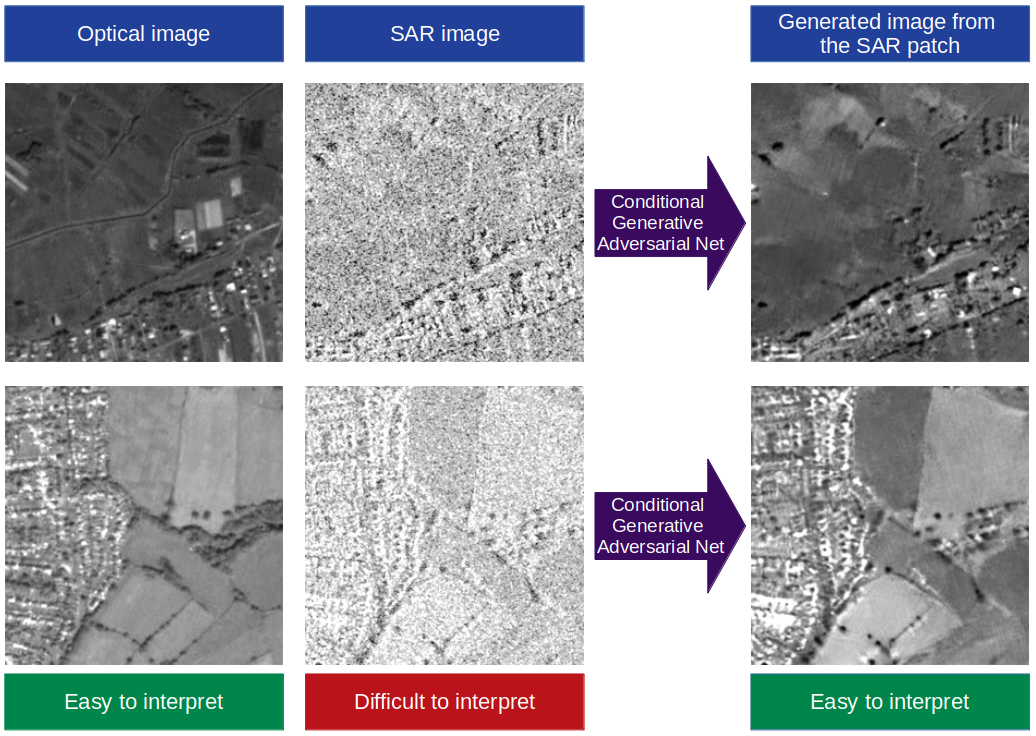
  • Human perception: We follow the idea that cGAN-based approaches can support the interpretation of original SAR images by adding a complementary, artificially generated image. In this context, the focus is on human perception and the transition of speckled image parts.
  • Follow-up applications: Besides visual perception, the properties of cGAN-based results in terms of follow-up applications have to be described. In this work, we have chosen road extraction as use case scenario.

4. Image-to-Image Translation Strategy

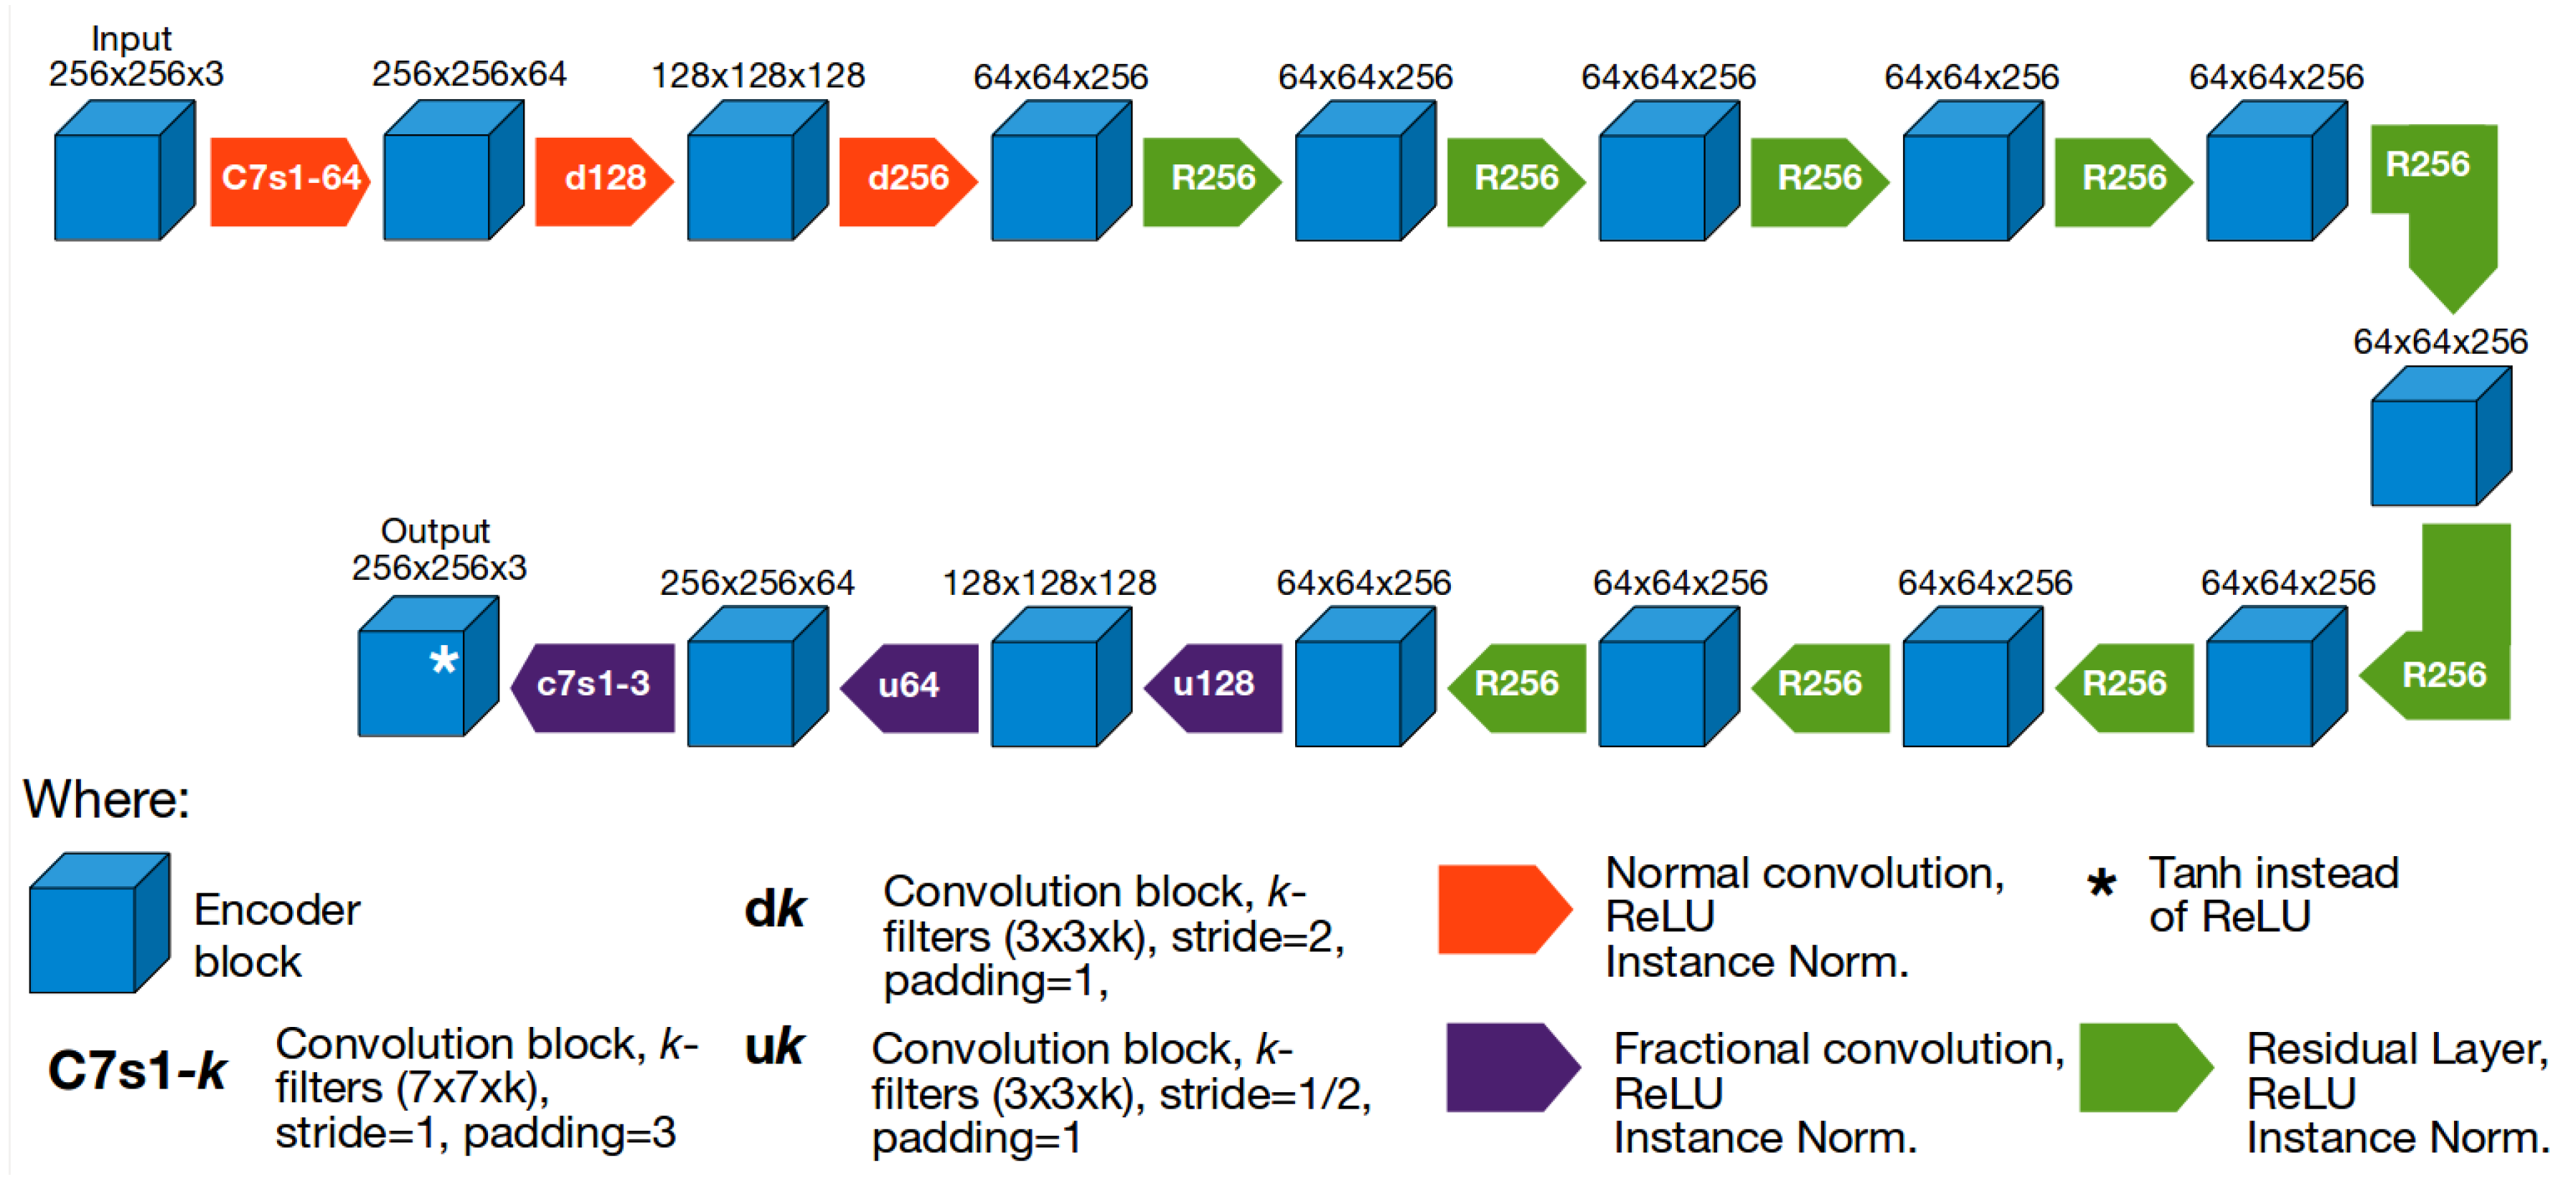
4.1. The CycleGAN Architecture

One can find different alternatives in the literature for tackling image-to-image translation tasks. cGANs are a suitable option due to their properties to generate images based on two references, one for content and one for style. Since SAR is geometrically accurate, we use the rich content information provided but use a stylizing from the optical side, where humans can deduct easier the elements shown in the image. Due to its capability to work with spatially uncoupled image pairs, we choose the CycleGAN [8] for the investigations in this paper.
The selected architecture follows the cGAN principle [23], where two adversarial models are trained simultaneously. On the one hand, the generator (G) aims to produce realistic samples similar to the ones belonging to the original data set (x). On the other hand, the discriminator (D) has to decide whether images belong to x or were obtained from G. G aims to minimize log ( 1 D ( G ( z ) ) ) , while D does it for log D ( x ) . Unlike the GAN principle, where the generator is not conditioned, an image is given as extra information (y) combined with prior input noise p z ( z ) , i.e., images are generated based on conditions imposed by the input. The overall training process aims at optimizing the value function V ( G , D ) :
min G max D V ( D , G ) = E x p data ( x ) [ log D ( x | y ) ] + E z p z ( z ) [ log ( 1 D ( G ( z | y ) ) ) ]
cGANs have been implemented for different tasks, showing a robust design and implementing optimization techniques. They are based on convolutional layers, which reduce the number of parameters in comparison to fully connected (FC) layers. Beyond, residual networks [11], batch normalization [24], instance normalization [25], Adam optimization [26] and initialization algorithms such as Xavier [27] are among the included improvements.
One of the most prominent cGANs is called pix2pix [15]. It uses a U-Net architecture in a 16 layer design for translation. Complementary image pairs with common structural information are required as input, which implies a supervised learning process. Pix2pix considers two loss functions for training, L c G A N (which is the conditional adversarial loss, [23]) and L L 1 (which uses the L1-norm to compare with the objective images). The balance of both weights influences the creation of artifacts and blurriness of the generated images. This design has been already applied in remote sensing [6].
The CycleGAN architecture is partially based on the pix2pix code but works with decoupled image pairs as input, i.e., enabling unsupervised learning. Moreover, the translation is learned in two directions, creating two generators and two discriminators. Hence, an image is processed through both generators whose result is expected to be the same as the input (consistency). CycleGAN then computes three losses, two for both GAN translations and one for the consistency. Since it does not require supervised learning, it assumes there is an underlying relation capable of being learned between the domains. It exploits what is called “cycle consistency”, where if there is a translator G : X Y and a second translator F : Y X , then G and F are inverses of each other and have a bijective mapping. Thence, a consistency loss is added to favor F ( G ( x ) ) x and G ( F ( y ) ) y , apart from the two adversarial losses [28] needed for both learning processes.
Therefore, the full objective is expressed in terms of the generator G, the discriminator D, and the domains X and Y as:
L ( G , F , D X , D Y ) = L G A N ( G , D Y , X , Y ) + L G A N ( F , D X , Y , X ) + λ L c y c ( G , F )
where λ helps to control the weight given to each objective. The architecture of the network, which is shown in Figure 2 is based on the design described in [29] and the discriminator from [15].
A set of training processes was conducted to observe results for each network by using default conditions and a few modifications of the hyperparameters when the generated images were promising. Since CycleGAN is able to handle paired and unpaired data to feed the training process, we compared the results obtained by changing only this hyperparameter in both cases. Unsupervised learning (unpaired data) reached the same quality level as the supervised one, indicating the robustness of the CycleGAN architecture.
In Figure 2, we can observe the internal architecture of CycleGAN as a representative example for a solution based on deep learning. Downsampling steps are applied in the first layers, followed by a set of residual network blocks and an upsampling process at the end to restore the image to its original size. Dimensions for the intermediate blocks are based on the original paper dataset, but changes in the input data resolutions might lead to different values. Convolutions between the blocks remain with the same specifications, although the names for the intermediate labels might not match with the dimensions.

4.2. Optimization Steps

Section 4.1 has introduced the general idea of image translation with alternative networks. However, it is not reasonable to perform SAR image translation with default cGAN networks, since these were designed for different purposes. Moreover, the SAR data have to be prepared as input to the network environment. Starting with basic CycleGAN, several steps of optimization have been conducted to improve the results of SAR image translation.
According to [30], the fine tuning of parameters offers strong opportunities in terms of optimization. However, it would require a huge computational power to reach the respective hyperparameters. Hence, we take into account the tuning of some of them in order to outperform the default conditions. We tuned the leaning rate up to 0.0005, while reducing the number of epochs to 80. We wanted to reduce the training times and preserve a similar performance at the end of the process by increasing the learning rate. The input/output number of channels was set to 1, since both domains are panchromatic, and additional colors can not be learned. An initialization algorithm for the weights reduces the possibility of collapsed and vanished parameters in parts of the training process, we used the implemented Xavier algorithm [27] and the learning mode (which means supervised and unsupervised frameworks) was also analyzed. As both provided a result similar in terms of quality, we stayed with the unsupervised one as it is a remarkable feature of the architecture.
Furthermore, the size of the patches plays an important role. By evaluating different sizes, we observed better results in the 512 × 512 patches than the smaller resolutions. The larger the size, the more appealing was the grayscale distribution. However, larger patches also increase the computation time and represent a challenge to the capabilities of the network that was trained with patches up to 512 × 512 pixels size in [8]. The whole image cannot be processed with the current architecture and if we try to reconstruct the original image from the patches, radiometric differences are significant at the boundaries, since the distribution of the grayscale is computed independently per patch. Increasing the patch size shifts this to a larger scale but does not change the nature of the patch-based approach. We found a good compromise between calculation time and image quality by using a patch size of 512 × 512. This size is also suitable as it fully covers many elements such as roads, lakes, forests and large man made structures, providing more context than smaller resolutions.
Modifying the internal architecture of CycleGAN has an effect on the level of detail of the generated images. Several residual layers [11] is added and compared to the shorter versions until the improvements are not noticeable. More of these layers do not damage the performance but increase substantially the number of parameters and might lead to overfitting. The implemented model consisted of 12 residual blocks (3 additional blocks more than the default case), where a better level of detail is achieved in the generated images, showing that capabilities also for urban patches, that include more information in small sections. Additionally, a 15 layers model was used for comparison, but not significant changes were observed. Hence, no more layers were implemented to avoid overfitting.
We also adapt the intensity values of the images as input for the training process. Optical and SAR imagery have a different nature in terms of radiometry, the original SAR intensities are not suitable as input for the network. Due to the measurement process, most of values captured by SAR are low, while having few outliers in extremely high numbers. This produces images where black regions dominate and just a few points/lines are distinguishable in white. Many significant values are packed into the lowest values of intensity. To adapt this, we use intensity clipping, apply a logarithmic scaling of SAR image intensity in order to derive near-Gaussian distributions and normalize the intensity of the patches belonging to a same image.
In terms of optimizing the appearance of translated SAR images, we aim for different properties. First, we intend to reduce the speckle effect in the images. We expect the architecture to be able to learn the distribution of speckle and set the hyperparameters that achieve a good output quality. Simultaneously, we plan to generate smooth textures for extended homogeneous areas with little content.
One of the most difficult aspects to control in GANs is the creation of objects that follow the style of the desired domain but do not represent properly the ones described in the content image, producing fiction. This might create elements such as houses, roads, forests, etc., in regions where these do not really exist, misleading the interpretation of the users. To reduce this effect, changes in the input data set showed a positive outcome. The pre-processing steps already described improved the images in terms of fiction presence. While the logarithmic adjust applied reduced significantly the fiction, the normalization (by taking the whole image before the pre-processing) vanished most of it. Since this scale had a good performance to identify individual objects (avoiding merged regions), less additional content was produced.
Nonetheless, we also attempt to preserve the main geometric features such as roads, coastal lines or change in crop fields sections. Some boundaries and edges are preferred to stay sharp to define clearly individual objects or significant changes on the ground. As described before, the residual layers added to the architecture help to improve the level of detail. Sharper edges (even for urban areas) and isolation of individual objects were obtained with the additional three layers.
Lastly, it is important to preserve an adequate gray-scale depending on the region (like black for water bodies). Although the choice of gray level of the elements is learned up to a certain limit, we expect some consistency for the real appearance of the objects, like dark colors for water bodies or filling of buildings if the walls are measured. Changes in the input data set facilitate the learning of this property in the network. Steps applied to the input data set (mainly the logarithmic scale transform for SAR) made distinguishable bright objects and generated a better contrast. Logarithmically scaled areas with speckle may represent a source of noise in the generated images. However, such an effect was not observed in the derived images. Two reasons contribute to this finding. Firstly, the additional clipping process reduces significantly the influence of outliers and, secondly, the difficulty for the mapping between the two domains is simplified as a result of having normal distributions for both optical and SAR data.

5. Case Study

5.1. Data for Case Study

The optical imagery used for our test study was obtained from the ALOS PRISM satellite with a spatial resolution of 2.5 m. Overall we utilized 46 images from 13 European cities spread over 7 countries, more specifically from Poland (Kalisz, Rzeszow), England (Bristol, Leeds, Lincoln, London, Portsmouth, Wirral), Germany (Bonn), Portugal (Aveiro), Ireland (Dublin), France (Le Havre) and Bulgaria (Stara Zagora). Complementary to that, SAR imagery was derived from the high resolution sensor TerraSAR-X satellite (see [31] for mission details), captured in stripmap mode. The original spatial resolution of the data is 1.25 m. For the case study, the data was up-sampled to 2.5 m to match the optical data. A brief summary of both data sets can be found in Table 1. All optical and SAR image pairs were aligned in the Urban Atlas project [32] manually and have an overall alignment error of around 3 m. In the following we will refer to this data set as the Urban Atlas data set.
A total of 7437 patches with a size of 512 × 512 pixels were used for training and 1005 for testing. Test and training sets do not share patches and the original files are separated for the sets as explained in Table 2, where the distribution of the 46 files is described regarding the belonging set. The overlap between adjacent patches was 50% to have the maximum number of relatively independent ones. The long available database also helps to reduce any possible overfitting of the network by providing many features in the samples to be learned.
The optical and SAR image patches are spatially aligned to allow both supervised and unsupervised training (spatially corresponding or independent patch pairs). The spatial resolution of the image data is suitable to distinguish individual buildings and to identify boundaries between man-made structures such as bridges or roads. The image data cover urban, semi-urban and rural areas as well as natural sections such as forests or lakes. Semi-urban regions are interesting in terms of object densities and open fields in terms of surface homogeneity. All kinds of land cover were used for training and testing.
An additional data set is used to analyze the performance of image transition on a different resolution level. The SEN1-2 data set is an open access source generated at Technical University of Munich (TUM) [21]. SAR patches are obtained from Sentinel-1 in a vertically polarized (VV) mode with a pixel spacing of 5m in azimuth and 20m in range direction. The optical counterpart was captured by the Sentinel 2 satellite in the RGB bands with less than 1% of cloud coverage as additional selection criterion (see Table 1 for summary).

5.2. Study Set Up

Due to the long training time required by CycleGAN, the number of epochs was reduced from 200 to 80. The comparison of supervised and unsupervised training showed a similar performance. Hence, the results were actually generated under the unsupervised framework, considering the intended flexibility in terms of possible future applications (independent image pairs). The training is conducted with 7437 patch pairs without spatial correspondence. Input and output are set to only 1 channel. The initialization of the parameters is obtained by the Xavier algorithm.
A problem in the colorization was caused by the wide range of SAR image intensities. As a strategy to reduce the impact of intensity outliers, the SAR pixel values are transformed to a logarithmic scale. Thereafter, the lower and upper 2% of intensities are assigned with the minimum and maximum value (clipped to limits). As a result, an adapted intensity distribution similar to a Gaussian function is derived, which represents an expedient balance between low and high pixel values.
About the size of the patches, these are cropped from the original images into 512 × 512 pixels size. The size can be handled by the CycleGAN network and its size covers large regions such as forests, roads, lakes, etc. An overlap of 50% between neighbouring patches was applied.
The trainings were conducted in a CPU included 4 Intel Core 2 Quad CPU Q9450 processors at 2.66 GHz running Ubuntu 16.04. Two GPU models were also used: the NVIDIA GeForce GTX Titan X with 12 GB GDDR5, 7 Gbps memory speed and 1075 MHz clock, and the NVIDIA Titan X with 12 GB G5X buffer. 10 Gbps memory speed and 1531 MHz clock. According to the specific setup, training times varied between 10 and 15 days, depending on the number of layers trained. For the case shown in the results, 12 days were needed for computation.

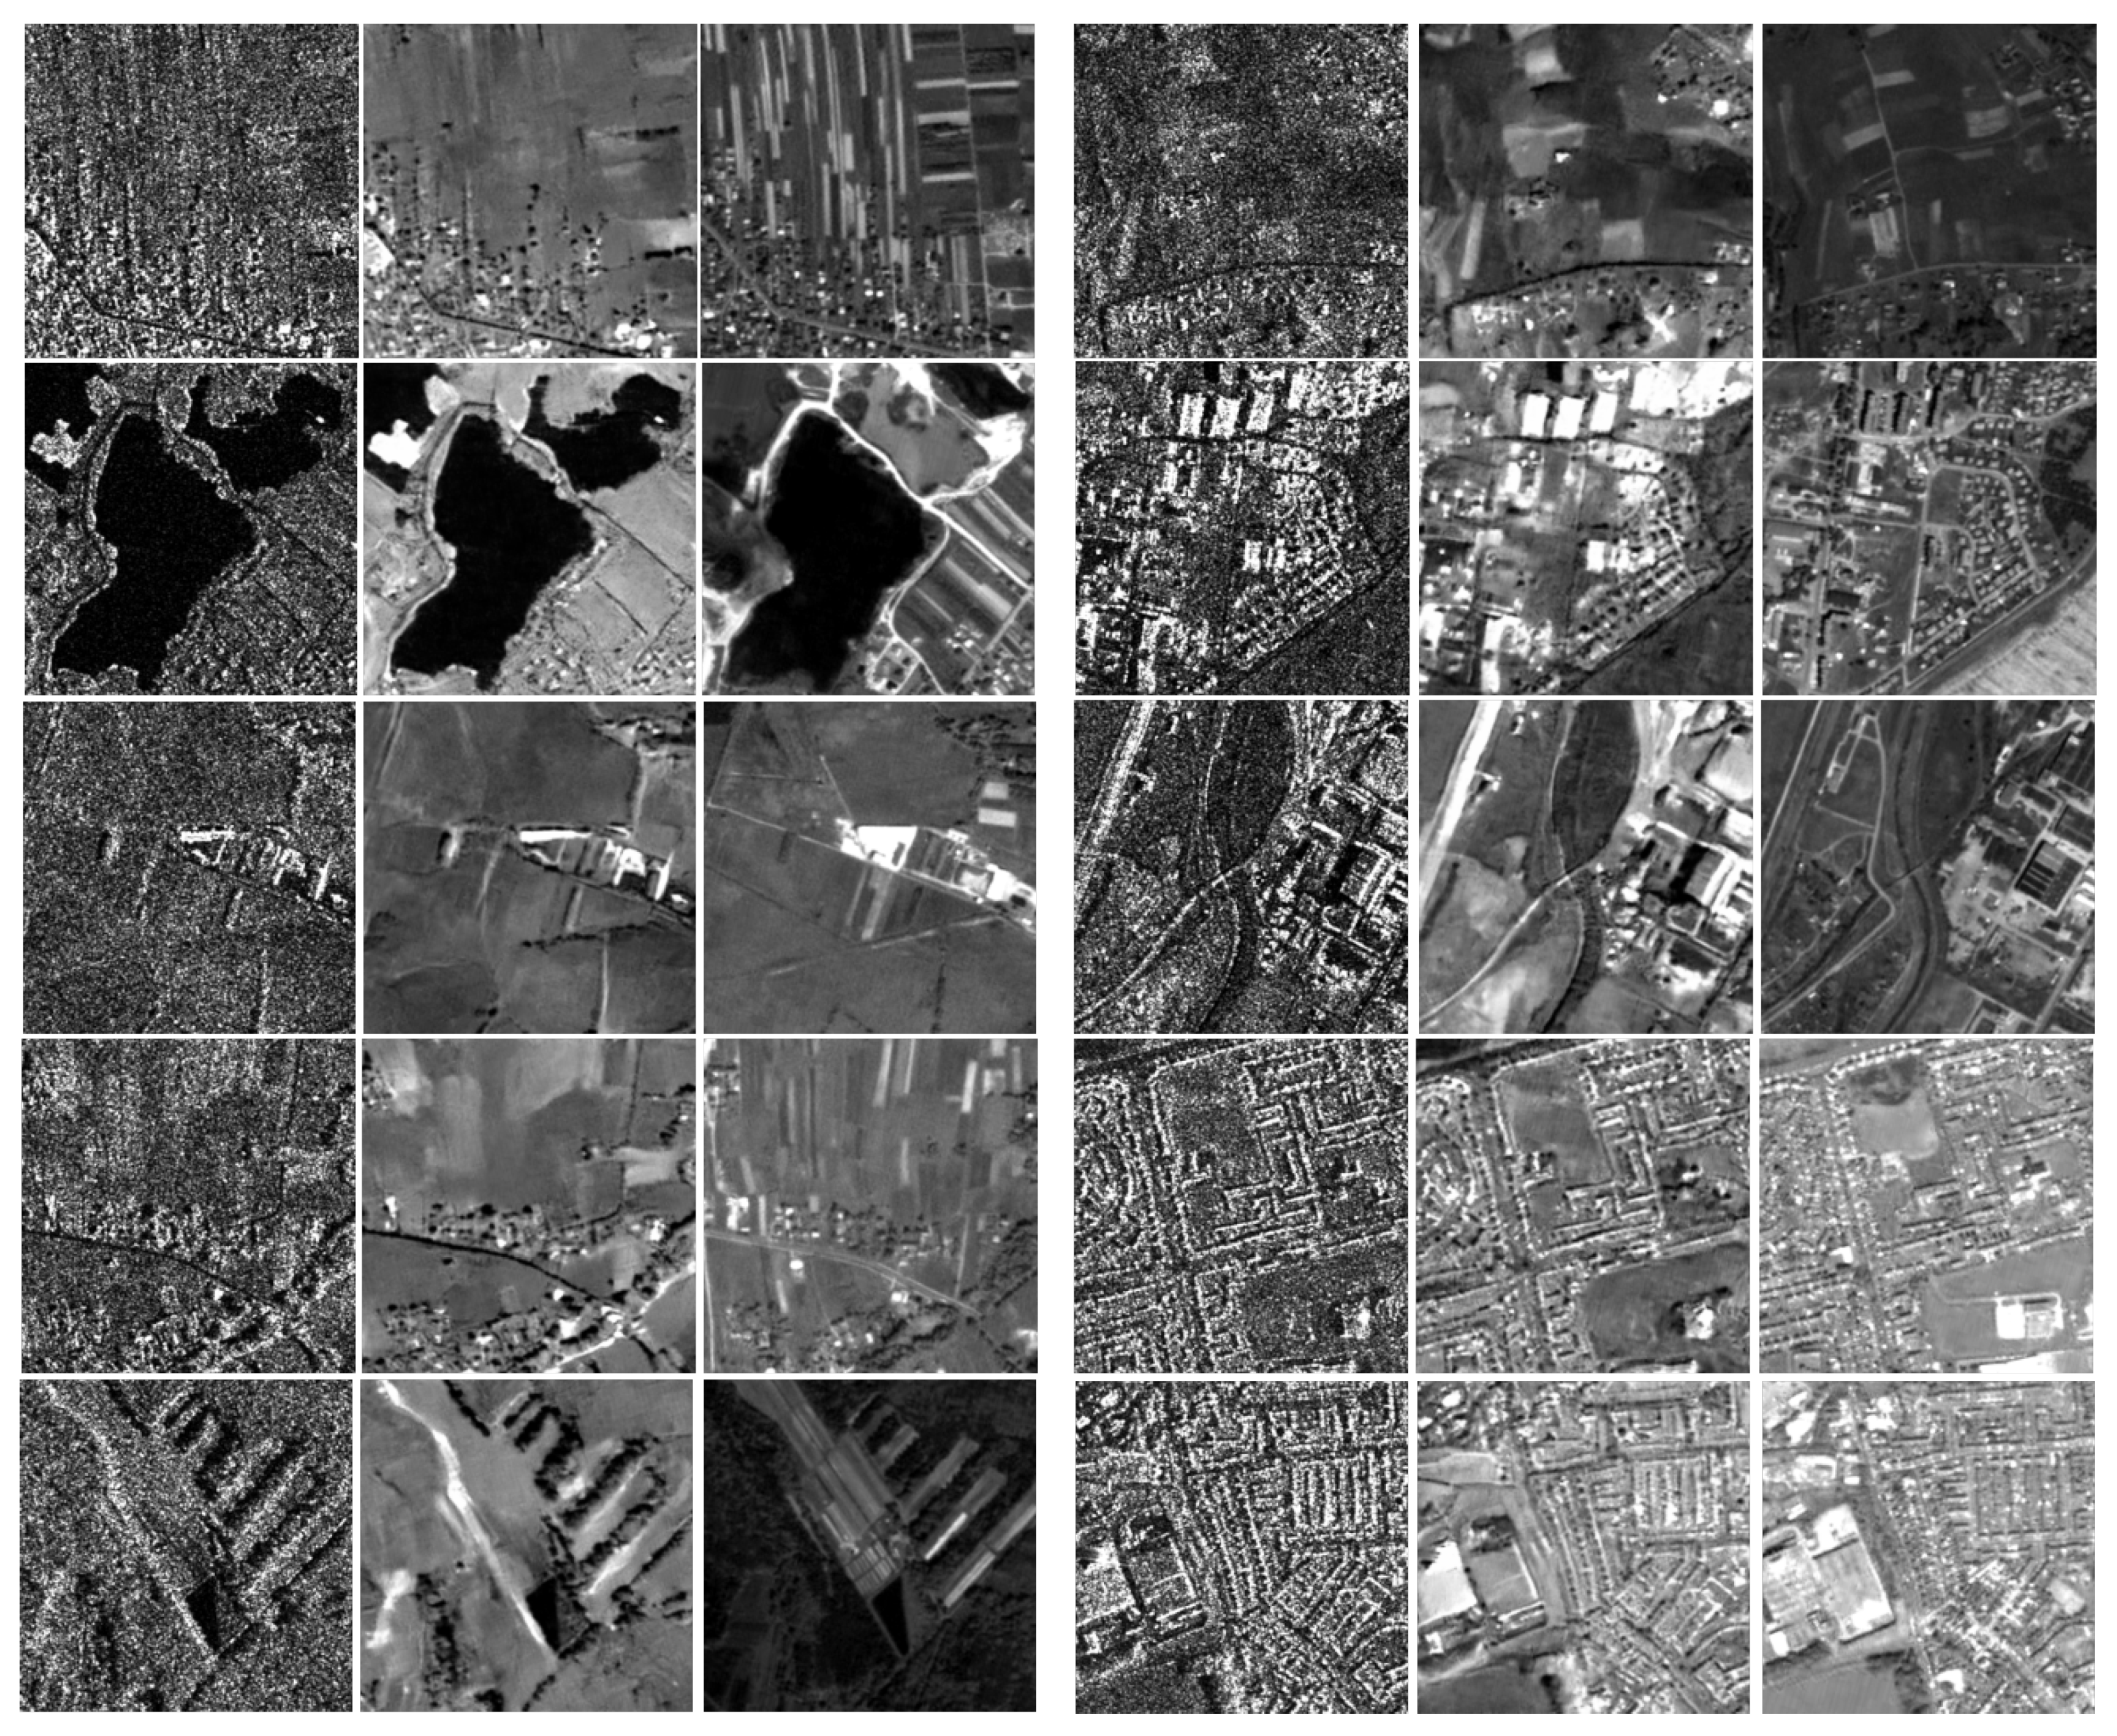
5.3. Results and Comparison

The following results are obtained based on the test patches from the Urban Atlas data set. In Figure 3, we show samples for urban, semi-urban and rural areas generated with the CycleGAN set up described in Section 5.2.
From the obtained patches, we can observe that the SAR images are actually translated into a new domain with features similar to the optical references (sharpness, smoothness, color distribution). Prominent geometric characteristics related to roads, crop fields, man made structures, significant scatterers, etc. are preserved while the granular nature of speckle is eliminated. As examples, this is distinguishable in the first and fourth row on the left of Figure 3 for areas including fields, inhabited regions and a main road. Looking into the details, it can be seen that number of houses changes. Many buildings are mapped into individual blocks as intended but some are merged, others erased and a few more are generated because of the context, but do not represent a building in the real scene (fiction).
In terms of speckle reduction, the performance is better for rural and semi-urban areas, where few man made artifacts are located and the density of the objects is lower. It also works for urban sections although dense areas suffer from content vanishing (see Figure 3, right column, last two rows) due to smoothing and the impact of speckle on the object appearance. This might also create fiction content in the new patches where the presence of speckle is interpreted as a small scatterer like in 1st column, 4th row in Figure 3 where houses are hallucinated by the generator.
Compared to its optical partner, a SAR image contains less structural details and information from a different part of the electromagnetic spectrum, which automatically leads to further limits of image translation. As seen in Figure 3, the inversion of colors in extended areas or water bodies could not be learned. Additionally, the separation of adjacent crop fields is an easy to detect feature in optical imagery but remains not observable in the CycleGAN results, where only some gradients between adjacent fields are present.
In order to derive a better orientation, we compare the CycleGAN results with results generated by a network based on the DRIT [33] architecture and an NL-SAR [13] implementation [34]. Figure 4 presents the results for visual inspection. Compared with DRIT results, we see a similar image characteristics. The distribution of gray values is better for CycleGAN results whereas DRIT produces too many bright blobs. Dense urban areas are favored by DRIT where more individual elements are still distinguishable and less fiction is created. On the contrary, DRIT generates more fiction in semi-urban and rural areas than CycleGAN.
Differences are apparent when comparing the network results with the images generated with the NL-SAR algorithm. In this case, almost all the structural information from the SAR images is preserved, as well as the most dominant scatterers. Keeping more geometric details is appreciated. However, the interpretability of the generated images does not necessarily improve. The NL-SAR algorithm has no freedom to create image content/context and partly introduces disturbing patterns where the networks favor smooth surfaces.
Advantages of the CycleGAN results include the preservation of the main roads and their mostly sharp edges. Connections between roads are translated as well. Also, crop fields are still distinguishable although the gray values might not be similar to the one optical reference. Individual houses are created in a desirable way, having clusters of them in the expected regions, while the number of them often does not correspond to the original SAR image. The main difficulty seems to arise in dense urban regions where buildings have a blurry appearance while the despeckling filters are still effective. Large buildings are also not completely recovered. Walls can be identified, but rooftops and elements around cannot be identified as part of the same structure in many cases.
Besides to the visible aspects discussed above, there is an interesting aspect that should be taken into account. According to the findings published in [35], CycleGAN might not be learning all the information required to reconstruct the images but hide part of it in the higher frequencies of the image. This produces variations between adjacent pixels that are indistinguishable to the naked eye but mimic slightly rough surfaces (instead of the smooth desired result). If we amplify regions assumed to have uniform color, a significant variation is observed. In [35], an adaptive histogram equalization is applied to enhance this variation. In this way, the added high frequency components can be detected if compared to the ground truth. Moreover, since the images are translated by using information in low frequencies, it might be the reason to get rid off part of the speckle effect. Additionally, the distribution of the speckle has an effect on the generated image where experiments with artificial added noise in [35] showed a significant change in the reconstruction. While the generated images are definitely easier for interpretation, the translation method may have a lack of robustness to incorporated noise.
The image translation results for the SEN1-2 data set [21] are shown in Figure 5. These images were only generated to observe the performance of the learned features in a different dataset. Although the interpretability can be mislead due to the big amount of fiction (in comparison to the high-resolution data set), the despeckling performance is convincing again. Interesting effects to observe are the creation of urban elements where a forest is expected (see first row). In the second raw, prominent geometric features are again generated, but the content is almost empty. Dense urban areas are simplified and only a few structures are being produced. The last row has more semantic meaning, roads, semi urban regions and crop fields are translated. It is still far from the optical reference.
It is also important to mention that patches are not only obtained from a different data set, but also another patch size, which might have an influence in the presented results. An additional training process for the network with patches from the same dataset would be required to generate better quality results, although the locations in SEN1-2 have larger variations in content. This leads to different descriptions for man-made structures like houses, bridges, roads and also for elements in nature such as the types of vegetation. While the training might produce a more general model to adapt to different locations, a larger database is needed to handle and learn the variety of elements present in the scenes.

6. Inspection of CycleGAN Results

6.1. Support of Interpretation

There are currently no suitable metrics to evaluate the result in terms of interpretability. Nonetheless, visual inspection provides feedback about the achieved performance of the neural networks in comparison with other approaches. Therefore, we conducted a survey with 12 experts from German Aerospace Center (DLR; members from: Earth Observation Center, Microwaves and Radar Institute) and TU Munich (Signal Processing in Earth Observation group) in order to evaluate the quality of the image translation process. In the survey, participants were presented with 20 samples, where each sample consisted of five image patches: the original SAR image, the corresponding optical image and the three generated images from CycleGAN, DRIT and NL-SAR. The positions of the five images within one sample were random to avoid a bias on the decision. We asked SAR experts and people outside the field of study, which of the generated images they preferred to have a better understanding/interpretation of the original SAR image. The provided samples included urban, semi-urban, rural and nature scenarios to analyze the differences in the obtained content. Samples are generated from the 1005 patches taken for the test set. Altogether, 320 votes were collected with the following result: the CycleGAN-based image was preferred in 177 cases (55.45%), DRIT-based on 86 (26.95%), NL-SAR-based on 54 (16.92%) and two samples were without decision. Regarding the field of expertise of the surveyed people, we separate the group into three categories: SAR experts, optical imagery experts and those who work with both sources. While the CycleGAN was preferred by the three groups individually, the SAR experts selected the NL-SAR result for second place.
It can be said that the CycleGAN-based serves the interpretation of SAR images best while NL-SAR works better for the single task of despeckling. Neural networks in both cases (CycleGAN and DRIT) help to support the human perception in comparison to the original SAR images. Results of both architectures are similar in terms of style (compare Figure 4) but show variations in the gray level distribution, object separability, and the impact of fiction. Details are described better in the NL-SAR case which removes the speckle effect on the images more effectively. However, NL-SAR does not add contextual information to understand the scene topic. As a result, experts preferred CycleGAN areas with weak context (rural, semi-urban, nature) while NL-SAR prevailed in urban areas where structural information is strong in the SAR image.

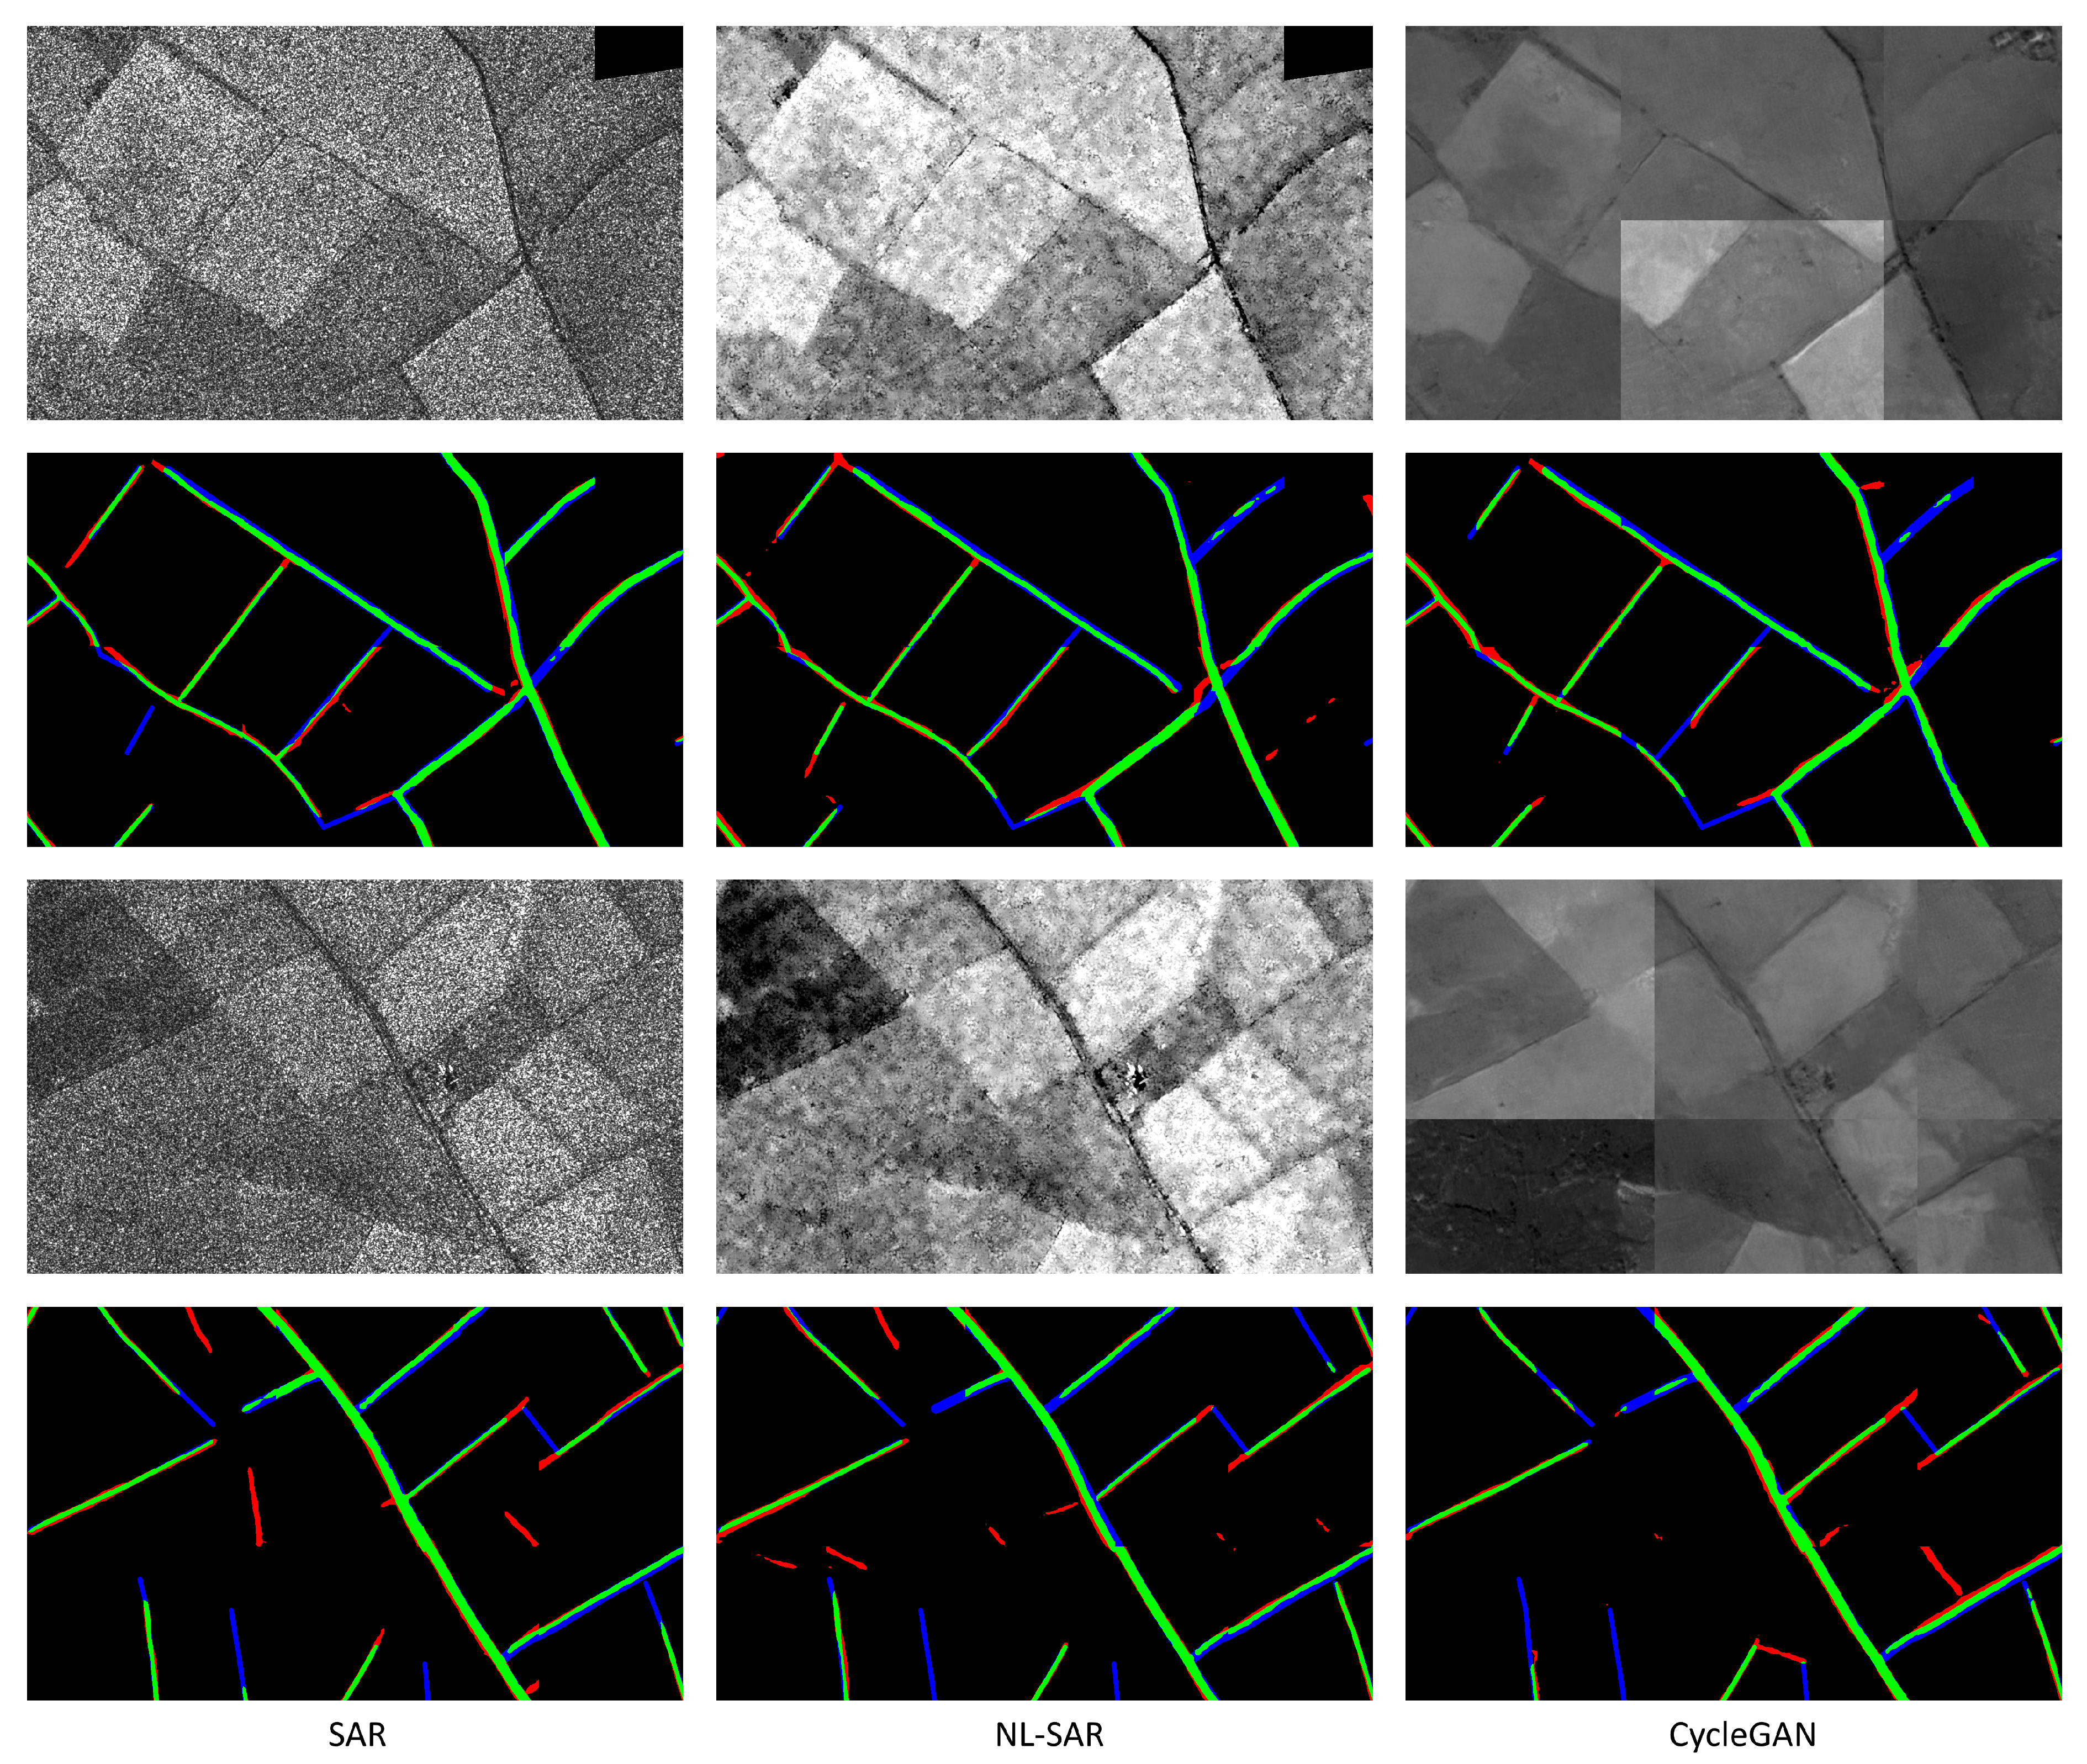
6.2. Extraction of Features

To study the object aspect consistency in images translated from SAR to optical imagery with our CycleGAN, we trained a state-of-the-art Fully-Convolutional neural Network (FCN), DeepLabv3+ [36], on the road extraction data set from [37]. This data set contains two SAR images captured by the TerraSAR-X satellite over the countryside the city of Lincoln, England, at a ground sampling distance of 1 m/px. The training image has a size of 16384 × 12288 px and the test image a size of 4096 × 12288 px. The binary ground truth contains pixel-wise road labels, composed of variable-thickness lines laid over highways, country roads, and dirt paths, as visible in Figure 6 (green and blue pixels together compose the ground truth labels). We processed the original SAR images with a non-local filter on the one hand (SAR-NL), and with our CycleGAN on the other hand. We evaluated the road candidate extraction using the Intersection over Union (IoU), precision and recall as is common practice in the remote sensing community:
I o U ( y , p ) = i N y i p i i N ( y i + p i y i p i )
P r e c i s i o n ( y , p ) = i N y i p i i N p i
R e c a l l ( y , p ) = i N y i p i i N y i
where y i { 0 , 1 } is the binary label for pixel i, 1 for roads and 0 for background, and p i { 0 , 1 } is the road candidate probability thresholded at 0.5 for pixel i, and N is the total number of pixels. The final performance after 50 training epochs is reported in Table 3.
Figure 6 shows the prediction confusion for each data type over two regions of interest. Green pixels are successfully extracted road pixels, while blue and red ones are undetected road pixels and wrong road candidates respectively. All segmentation are satisfyingly complete, in that few road segments were missed, and feature regular, continuous road lanes with smooth borders. Most of the differences between SAR, NL-SAR and CycleGAN results come from missing and superfluous segments, as well as connectivity issues at intersections. In CycleGAN images, shallow edges were visibly smoothed out or even erased during the SAR to optical style transfer, making the road detection more challenging. These observations confirm the findings in [37] that SAR imagery contains critical information that less sharp imagery does not preserve, as is the case with NL filtering and our method. The quantitative results show that training on CycleGAN images does not increase the raw performance of a segmentation network, although the major part of the road objects were successfully extracted. This means that the generated images retained enough of the features from the SAR images so that the object semantics were preserved through the generative process.

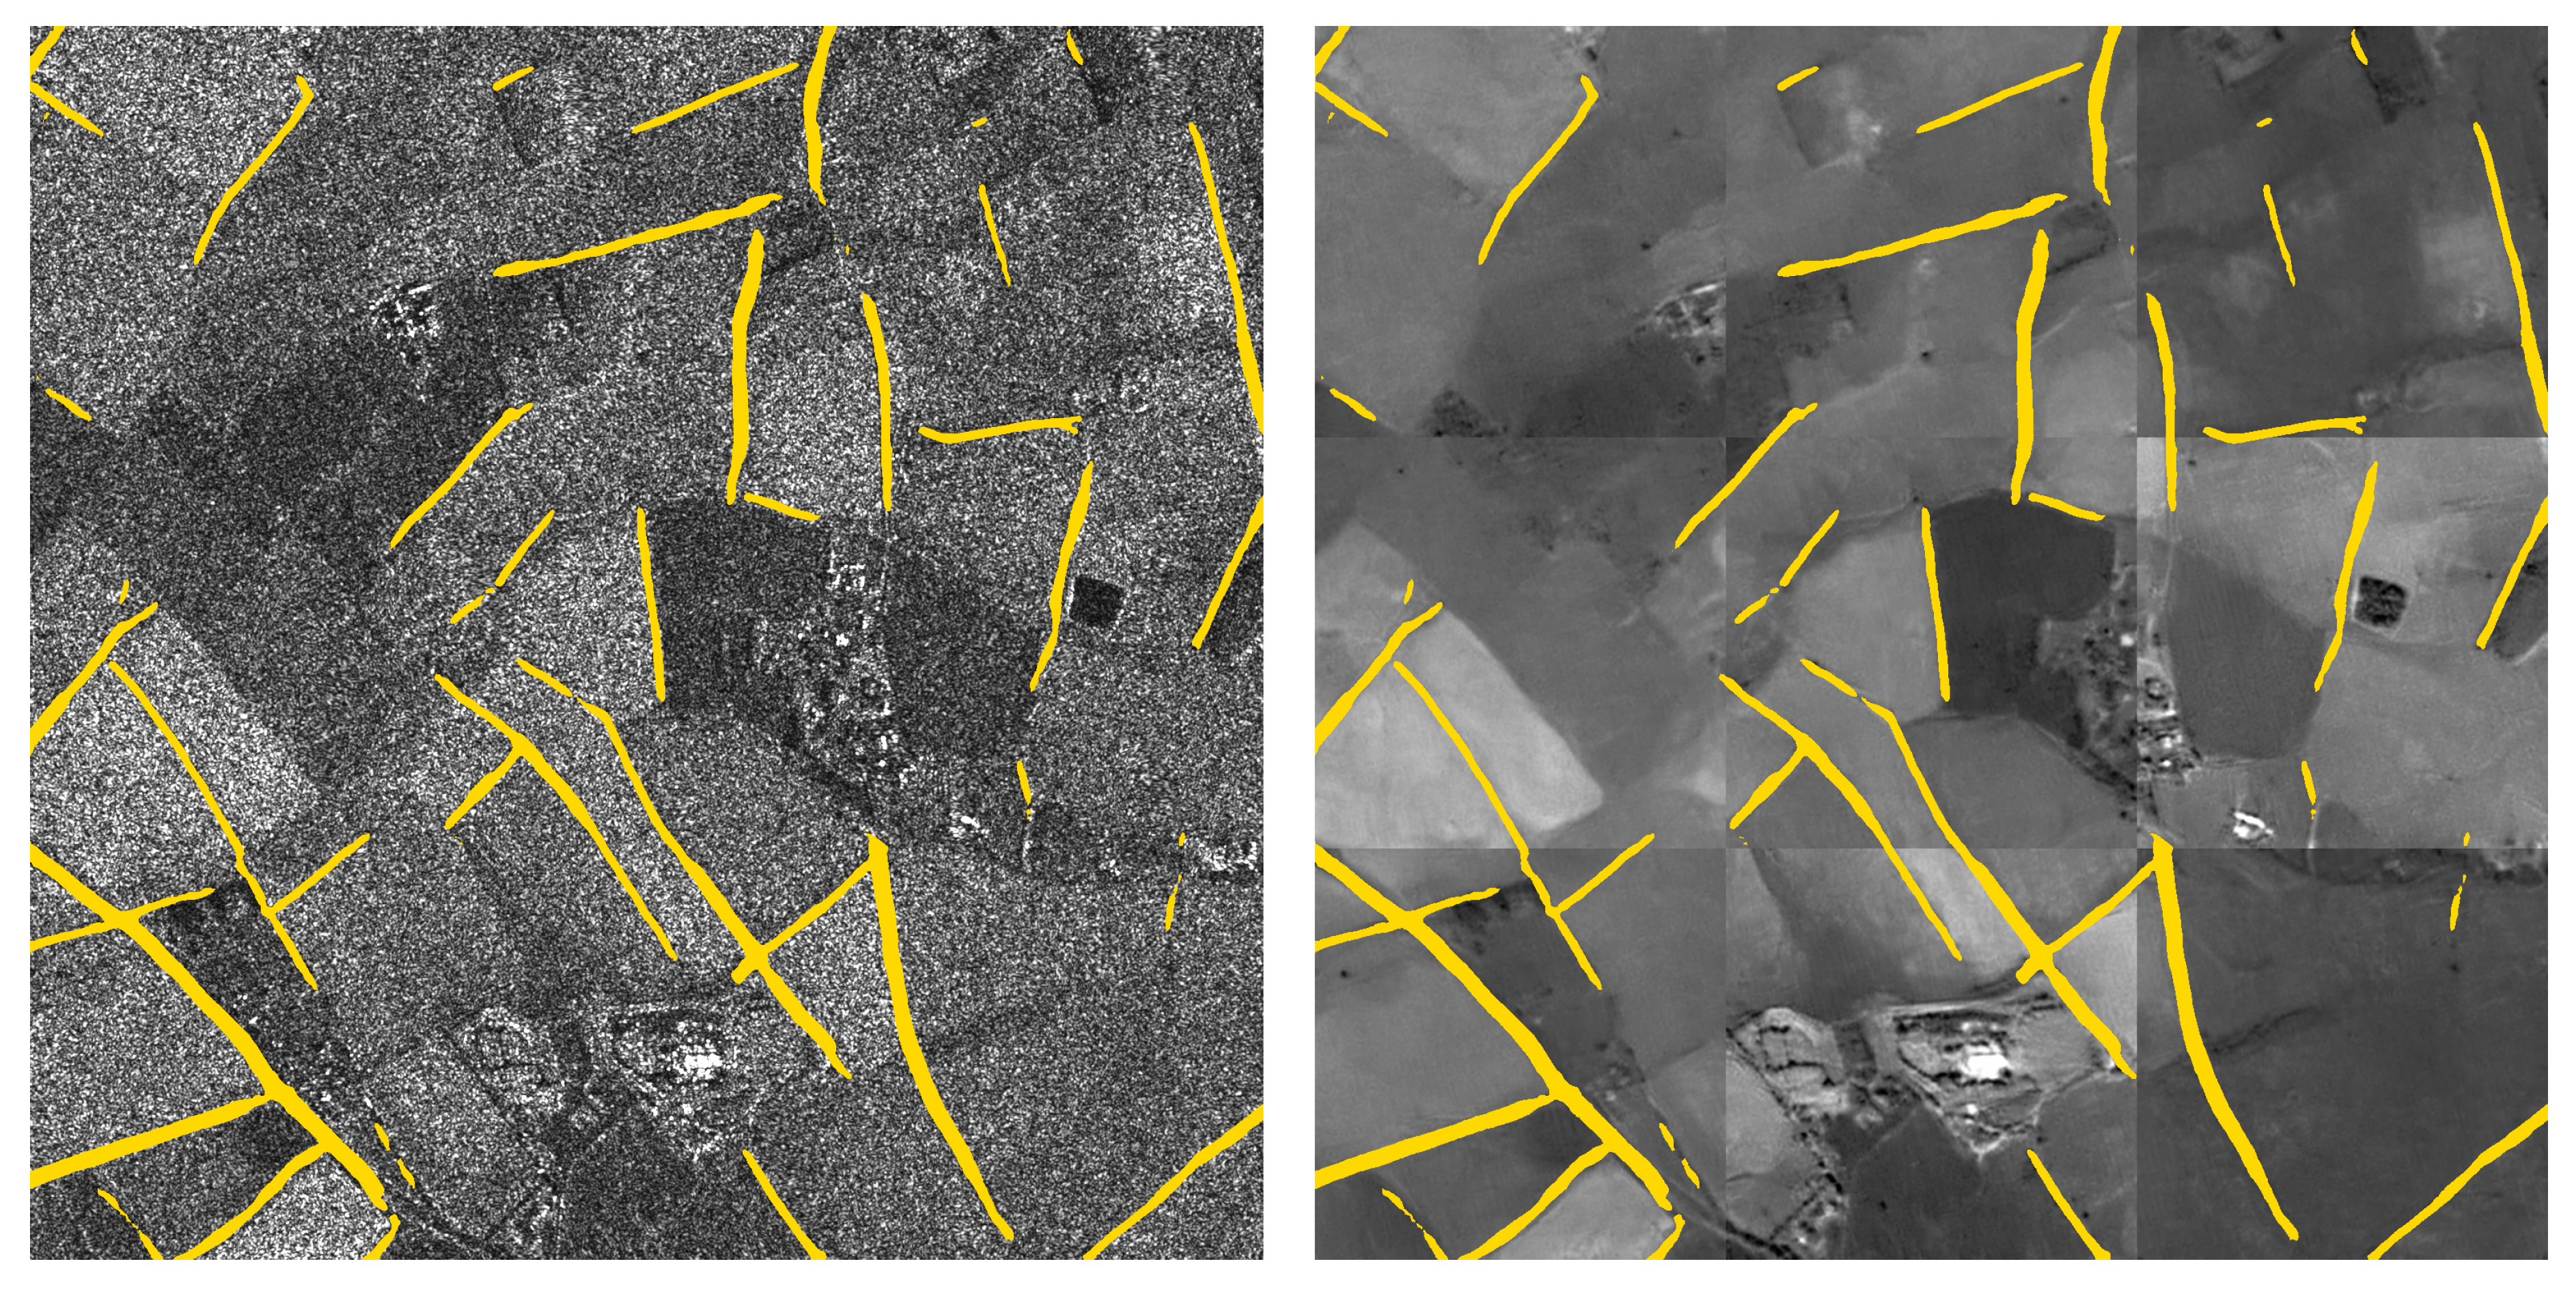
6.3. Combination of Features and Context

Keeping in mind that FCNs perform better on original SAR imagery, we move back to the intention of using the alternative SAR image representation for interpretation support. Our generated images provide useful global context information to help identify ground objects from a human perception perspective. Figure 7 illustrates this idea: road candidates extracted from the original SAR image are superimposed on both the original SAR and CycleGAN-based SAR image representation in order to combine semantic information with the texture context. It can be seen that the CycleGAN-based image adds valuable visual cues (for instance, buildings appear more clearly on CycleGAN images than on SAR) which ease the understanding of features in terms of context (road network in rural scene). Fiction is present in the CycleGAN scene but does not affect the expression of the scene topic. Radiometric changes at patch borders are distinguishable and appear to the patch-based concept of CycleGAN. For discarding this issue the patch size could be extended to the full scene in order to derive radiometric consistency for the CycleGAN result. The radiometric changes would be shifted to the new patch borders, though, not discarding this drawback of CycleGAN.

7. Conclusions and Outlook

Looking at the results of the presented case study and evaluation results, cGANs, and particularly CycleGAN, indicate promising potential towards image translation in remote sensing tasks, specifically for the support of SAR image interpretation. CycleGAN takes advantage of the large data sets acquired by satellite missions and works unsupervised which eases training for future experiments.
Results derived from CycleGAN varied significantly depending on the scene to be translated, i.e., it was better for rural/semi-urban areas and worse for urban areas. Although the network preserves independent crop field blocks, it faces difficulties to isolate buildings and walls in large cities, where these can be blurred or merged into larger elements. Cases were only natural elements are shown such as mountains or water bodies are well preserved with respect to boundaries but the assigned gray values might lead to false conclusions. As with city areas, individual objects in dense regions such as trees in forests are not always generated. Roads and plain man made structures preserve their sharp edges in most cases but the thicker ones sometimes vanish. Notwithstanding, the generated categories (houses, roads, trees) lead to comprehensible representations for the users, allowing understanding of the type of objects located in the scenes. Altogether, CycleGAN unfolds its advantages in the expression of context, not locally.
In terms of strategy optimization, the pre-processing of the data set showed to be valuable to emphasize relevant features in the original data. Clipping removes high and low intensities and helps emphasizing structural information and reducing the impact of fiction in the resulting images. The level of detail and separability of objects were improved by implementing a deeper model of the network, with the additional residual layers. Dense urban areas obtained a superior representation under this model. About the hyperparameter tuning, it was useful in the first steps, where the speckle effect and colorization were addressed. However, the recovery of structural information and large elements required the other optimization strategies to be achieved.
One of the outstanding outcomes of the network was undoubtedly the despeckling of the imagery. The architecture is able to learn the speckle distribution and suppresses its appearance in the generated images. The quality obtained is comparable to other state of the art solutions, as shown with NL-SAR [13], while adding valuable context information (patch topic). Nonetheless, it leads to an excessive smoothing in some scenes and radiometric differences between adjacent patches, which still needs to be better controlled. Experiments for evaluation showed that CycleGAN results ease interpretation and allow adding valuable background information to features extracted from original SAR data (here: road network).
Future work will focus on the integration of new optimization algorithms, loss functions and architectural designs. Apart from that, a more detailed explanation about the influence of numeric transformations applied to the dataset has to be studied to have a better understanding of the pre-processing steps.

Author Contributions

Conceptualization, S.A., N.M. and M.S.; Data curation, M.F.R., N.M. and M.S.; Formal analysis, C.H.; Investigation, M.F.R.; Methodology, M.F.R., S.A. and N.M.; Project administration, S.A. and M.S.; Software, M.F.R. and N.M.; Supervision, S.A., N.M. and M.S.; Validation, C.H.; Writing—original draft, M.F.R., S.A. and C.H.; Writing—review & editing, S.A., N.M. and M.S.

Funding

This research received no external funding

Conflicts of Interest

The authors declare no conflict of interest.

References

  1. Auer, S.; Hinz, S.; Bamler, R. Ray-Tracing Simulation Techniques for Understanding High-Resolution SAR Images. IEEE Trans. Geosci. Remote Sens. 2010, 48, 1445–1456. [Google Scholar] [CrossRef]
  2. Argenti, F.; Lapini, A.; Bianchi, T.; Alparone, L. A tutorial on speckle reduction in synthetic aperture radar images. IEEE Geosci. Remote Sens. Mag. 2013, 1, 6–35. [Google Scholar] [CrossRef]
  3. Zhang, R.; Isola, P.; Efros, A.A. Colorful Image Colorization. In Proceedings of the Computer Vision—ECCV 2016, Amsterdam, The Netherlands, 11–14 October 2016; pp. 649–666. [Google Scholar]
  4. Auer, S.; Hornig, I.; Schmitt, M.; Reinartz, P. Simulation-Based Interpretation and Alignment of High-Resolution Optical and SAR Images. IEEE J. Sel. Top. Appl. Earth Obs. Remote Sens. 2017, 10, 4779–4793. [Google Scholar] [CrossRef] [Green Version]
  5. Merkle, N.; Auer, S.; Müller, R.; Reinartz, P. Exploring the potential of conditional adversarial networks for optical and SAR image matching. IEEE J. Sel. Top. Appl. Earth Obs. Remote Sens. 2018, 11, 1811–1820. [Google Scholar] [CrossRef]
  6. Bermudez, J.; Happ, P.; Oliveira, D.; Feitosa, R. SAR to optical image synthesis for cloud removal with generative adversarial networks. ISPRS Ann. Photogramm. Remote Sens. Spat. Inf. Sci. 2018, IV-1, 5–11. [Google Scholar] [CrossRef]
  7. Merkle, N.; Fischer, P.; Auer, S.; Müller, R. On the Possibility of Conditional Adversarial Networks for Multi-Sensor Image Matching. In Proceedings of the 2017 IEEE International Geoscience and Remote Sensing Symposium (IGARSS), Fort Worth, TX, USA, 23–28 July 2017; pp. 2633–2636. [Google Scholar] [CrossRef]
  8. Zhu, J.; Park, T.; Isola, P.; Efros, A.A. Unpaired Image-to-Image Translation Using Cycle-Consistent Adversarial Networks. In Proceedings of the 2017 IEEE International Conference on Computer Vision (ICCV), Venice, Italy, 22–29 October 2017; pp. 2242–2251. [Google Scholar] [CrossRef]
  9. Zhu, X.X.; Tuia, D.; Mou, L.; Xia, G.S.; Zhang, L.; Xu, F.; Fraundorfer, F. Deep learning in remote sensing: A comprehensive review and list of resources. IEEE Geosci. Remote Sens. Mag. 2017, 5, 8–36. [Google Scholar] [CrossRef]
  10. Chierchia, G.; Cozzolino, D.; Poggi, G.; Verdoliva, L. SAR Image Despeckling Through Convolutional Neural Networks. In Proceedings of the 2017 IEEE International Geoscience and Remote Sensing Symposium (IGARSS), Fort Worth, TX, USA, 23–28 July 2017; pp. 5438–5441. [Google Scholar] [CrossRef]
  11. He, K.; Zhang, X.; Ren, S.; Sun, J. Deep Residual Learning for Image Recognition. In Proceedings of the 2016 IEEE Conference on Computer Vision and Pattern Recognition (CVPR), Las Vegas, NV, USA, 27–30 June 2016; pp. 770–778. [Google Scholar] [CrossRef]
  12. Dabov, K.; Foi, A.; Katkovnik, V.; Egiazarian, K. Image denoising by sparse 3-D transform-domain collaborative filtering. IEEE Trans. Image Process. 2007, 16, 2080–2095. [Google Scholar] [CrossRef] [PubMed]
  13. Deledalle, C.; Denis, L.; Tupin, F.; Reigber, A.; Jäger, M. NL-SAR: A unified nonlocal framework for resolution-preserving (Pol)(In)SAR denoising. IEEE Trans. Geosci. Remote Sens. 2015, 53, 2021–2038. [Google Scholar] [CrossRef]
  14. Ao, D.; Dumitru, C.O.; Schwarz, G.; Datcu, M. Dialectical GAN for SAR image translation: From Sentinel-1 to TerraSAR-X. Remote Sens. 2018, 10, 1597. [Google Scholar] [CrossRef]
  15. Isola, P.; Zhu, J.; Zhou, T.; Efros, A.A. Image-to-Image Translation with Conditional Adversarial Networks. In Proceedings of the 2017 IEEE Conference on Computer Vision and Pattern Recognition (CVPR), Honolulu, HI, USA, 21–26 July 2017; pp. 5967–5976. [Google Scholar] [CrossRef]
  16. Wang, P.; Patel, V.M. Generating High Quality Visible Images from SAR Images Using CNNs. In Proceedings of the 2018 IEEE Radar Conference (RadarConf18), Oklahoma City, OK, USA, 23–27 April 2018; pp. 570–575. [Google Scholar]
  17. Ley, A.; D’Hondt, O.; Valade, S.; Hänsch, R.; Hellwich, O. Exploiting GAN-Based SAR to Optical Image Transcoding for Improved Classification via Deep Learning. In Proceedings of the EUSAR 2018, Aachen, Germany, 4–7 June 2018; pp. 396–401. [Google Scholar]
  18. He, W.; Yokoya, N. Multi-Temporal Sentinel-1 and -2 Data Fusion for Optical Image Simulation. ISPRS Int. J. Geo-Inf. 2018, 7, 389. [Google Scholar] [CrossRef]
  19. Hughes, L.H.; Schmitt, M.; Mou, L.; Wang, Y.; Zhu, X.X. Identifying corresponding patches in SAR and optical images with a pseudo-siamese CNN. IEEE Geosci. Remote Sens. Lett. 2018, 15, 784–788. [Google Scholar] [CrossRef]
  20. Hughes, L.; Schmitt, M.; Zhu, X. Mining hard negative samples for SAR-optical image matching using generative adversarial networks. Remote Sens. 2018, 10, 1152. [Google Scholar] [CrossRef]
  21. Schmitt, M.; Hughes, L.H.; Zhu, X.X. The SEN1-2 dataset for deep learning in SAR-optical data fusion. ISPRS Ann. Photogramm. Remote Sens. Spat. Inf. Sci. 2018, IV-1, 141–146. [Google Scholar] [CrossRef]
  22. Grohnfeldt, C.; Schmitt, M.; Zhu, X. A Conditional Generative Adversarial Network to Fuse SAR and Multispectral Optical Data for Cloud Removal from Sentinel-2 Images. In Proceedings of the IGARSS 2018—2018 IEEE International Geoscience and Remote Sensing Symposium, Valencia, Spain, 22–27 July 2018; pp. 1726–1729. [Google Scholar] [CrossRef]
  23. Mirza, M.; Osindero, S. Conditional generative adversarial nets. arXiv, 2014; arXiv:1411.1784. [Google Scholar]
  24. Ioffe, S.; Szegedy, C. Batch Normalization: Accelerating Deep Network Training By Reducing Internal Covariate Shift. In Proceedings of the 32nd International Conference on International Conference on Machine Learning—Volume 37, Lille, France, 6–11 July 2015; pp. 448–456. [Google Scholar]
  25. Ulyanov, D.; Vedaldi, A.; Lempitsky, V. Instance normalization: The missing ingredient for fast stylization. arXiv, 2016; arXiv:1607.08022. [Google Scholar]
  26. Kingma, D.; Ba, J. Adam: A method for stochastic optimization. arXiv, 2014; arXiv:1412.6980. [Google Scholar]
  27. Glorot, X.; Bengio, Y. Understanding the Difficulty of Training Deep Feedforward Neural Networks. In Proceedings of the Thirteenth International Conference on Artificial Intelligence and Statistics, Sardinia, Italy, 13–15 May 2010; Volume 9, pp. 249–256. [Google Scholar]
  28. Goodfellow, I.; Pouget-Abadie, J.; Mirza, M.; Xu, B.; Warde-Farley, D.; Ozair, S.; Courville, A.; Bengio, Y. Generative Adversarial Nets. In Advances in Neural Information Processing Systems 27; Ghahramani, Z., Welling, M., Cortes, C., Lawrence, N.D., Weinberger, K.Q., Eds.; Curran Associates, Inc.: Nice, France, 2014; pp. 2672–2680. [Google Scholar]
  29. Johnson, J.; Alahi, A.; Fei-Fei, L. Perceptual Losses for Real-Time Style Transfer and Super-Resolution; Computer Vision—ECCV 2016; Leibe, B., Matas, J., Sebe, N., Welling, M., Eds.; Springer International Publishing: Cham, Switzerland, 2016; pp. 694–711. [Google Scholar]
  30. Lucic, M.; Kurach, K.; Michalski, M.; Bousquet, O.; Gelly, S. Are GANs created equal? A large-scale study. In Proceedings of the 32Nd International Conference on Neural Information Processing Systems; Curran Associates Inc.: New York, NY, USA, 2018; pp. 698–707. [Google Scholar]
  31. Pitz, W.; Miller, D. The TerraSAR-X Satellite. TGRS 2010, 48, 615–622. [Google Scholar] [CrossRef]
  32. Schneider, M.; Müller, R.; Krauss, T.; Reinartz, P.; Hörsch, B.; Schmuck, S. Urban Atlas—DLR Processing Chain for Orthorectification of Prism and AVNIR-2 Images and TerraSAR-X as Possible GCP Source. In Proceedings of the 3rd ALOS PI Symposium, Buffalo, NY, USA, 5–7 May 2010; pp. 1–6. [Google Scholar]
  33. Lee, H.; Tseng, H.; Huang, J.; Singh, M.; Yang, M. Diverse Image-to-Image Translation via Disentangled Representations. In Proceedings of the European Conference on Computer Vision, Munich, Germany, 8–14 September 2018. [Google Scholar]
  34. Baier, G.; Zhu, X.X. GPU-based nonlocal filtering for large scale SAR processing. In Proceedings of the 2016 IEEE International Geoscience and Remote Sensing Symposium (IGARSS), Beijing, China, 10–15 July 2016; pp. 7608–7611. [Google Scholar]
  35. Chu, C.; Zhmoginov, A.; Sandler, M. CycleGAN, a master of steganography. arXiv, 2017; arXiv:1712.02950. [Google Scholar]
  36. Chen, L.C.; Zhu, Y.; Papandreou, G.; Schroff, F.; Adam, H. Encoder-Decoder with Atrous Separable Convolution for Semantic Image Segmentation. In Proceedings of the European Conference on Computer Vision (ECCV), Munich, Germany, 8–14 September 2018. [Google Scholar]
  37. Henry, C.; Azimi, S.M.; Merkle, N. Road segmentation in SAR satellite images with deep fully convolutional neural networks. IEEE Geosci. Remote Sens. Lett. 2018, 15, 1867–1871. [Google Scholar] [CrossRef]
Figure 1. Comparison between acquired SAR (left) and optical (right) images.
Remotesensing 11 02067 g001
Figure 2. Architecture of CycleGAN.
Remotesensing 11 02067 g002
Figure 3. Results obtained from the applied network, organized in two blocks. Left: original SAR file, center: images generated with adapted CycleGAN, right: optical image.
Remotesensing 11 02067 g003
Figure 4. Results from the CycleGAN network compared to other approaches. First column: original SAR image, second: CycleGAN result, third: DRIT result, fourth: NL-SAR result [34], last: optical image.
Remotesensing 11 02067 g004
Figure 5. Results from the generator applied to the SEN1-2 data set. Left are the original SAR patches, the middle column shows the generated images by the network and the right are the optical references.
Remotesensing 11 02067 g005
Figure 6. Binary road segmentation results of the DeepLabv3+ models trained on the SAR, NL-SAR and CycleGAN image data sets separately. Rows 1 and 3: image samples. Rows 2 and 4: segmentation confusion, colored as follows: green pixels are true positives, blue are false negatives, and red are false positives.
Remotesensing 11 02067 g006
Figure 7. Overlay of the road candidates detected on SAR (marked yellow) over the SAR image (left) and CycleGAN image (right).
Remotesensing 11 02067 g007
Table 1. Specifications for the optical and SAR acquisition.
ImageryUrban AtlasSEN1-2
OpticalSatellite ALOS PRISM 2.5 m resolutionSatellite Sentinel 2 RGB bands <1% cloud coverage
SARSatellite TerraSAR-X stripmap mode 1.25 m resolutionSatellite Sentinel 1 Vertically polarized 5 m azimuth 20 m range
Table 2. Image distribution in data set.
SetCities (Files per Site, 46 in Total)
TrainingAveiro (2), Bonn (2), Bristol (4), Dublin (2), Kalisz (11), Leeds (3), Le Havre (2), Lincoln (4), London (7)
DevelopmentLondon (2), Portsmouth (2)
TestRzeszow (3), Stara Zagora (1), Wirral (1)
Table 3. Test results of DeepLabv3+ trained for road segmentation on various image types.
ImageryIoUPrecisionRecall
CycleGAN35.63%61.63%45.78%
NL-SAR38.58%63.24%49.72%
SAR40.45%65.08%51.66%

