Article

Integration of Automatic Identification System (AIS) Data and Single-Channel Synthetic Aperture Radar (SAR) Images by SAR-Based Ship Velocity Estimation for Maritime Situational Awareness

Department of Industrial Engineering, University of Naples “Federico II”, Piazzale Tecchio, 80, 80125 Naples, Italy
*
Author to whom correspondence should be addressed.
Remote Sens. 2019, 11(19), 2196; https://0-doi-org.brum.beds.ac.uk/10.3390/rs11192196
Submission received: 23 July 2019 / Revised: 17 September 2019 / Accepted: 17 September 2019 / Published: 20 September 2019
(This article belongs to the Special Issue Remote Sensing for Maritime Safety and Security)

Abstract

:
The synergic utilization of data from different sources, either ground-based or spaceborne, can lead to effective monitoring of maritime activities. To this end, the integration of synthetic aperture radar (SAR) images with data reported by the automatic identification system (AIS) is of high interest. Accurate matching of ships detected in SAR images with AIS data requires compensation of the azimuth offset, which depends on the ship’s velocity. The existing procedures interpolate the route information gathered by AIS to estimate the ship’s velocity at the epoch of the SAR data, to remove the offset. Matching accuracy is limited by interpolation errors and AIS route information unavailability or uncertainties. This paper proposes the use of SAR-based ship velocity estimations to improve the integration of AIS and SAR data. A case study has been analyzed, in which the method has been tested on TerraSAR-X images collected over the Gulf of Naples, Italy. Presented results show that the matching is improved with respect to standard procedures. The proposed method limits the distance between the AIS report and the SAR-based detection to less than 150 m, which is in line with maritime surveillance needs.

Graphical Abstract

1. Introduction

Monitoring human activities at sea and improving the Maritime Situational Awareness (MSA) are topics of major and increasing interest [1,2,3,4,5]. In this ambit, the synergic exploitation of data from ground-based, sea-based, airborne, and spaceborne sensors with data from geographical information systems (GIS) and vessel information repositories can lead to a satisfactory situational understanding [6].
Many systems have been developed to reveal the presence and to individuate the activity of ships. Usually, a distinction is made between cooperative and non-cooperative systems. In the former case, the ships communicate information about themselves [6]. An example is the automatic identification system (AIS), which exploits the identification data and information about the route, that is transmitted by the vessels [7]. In terrestrial AIS, the data are received by a ground station, and hence the coverage is limited to about 50 miles from the coast. In space-based AIS (S-AIS), the signals from ships are collected by satellites, strongly enlarging the coverage performance at the expense of a lower data rate. AIS is widely used since it is based on a not-proprietary protocol, but other collaborative systems exist, such as vessel monitoring systems (VMS) [8]. With reference to non-cooperative systems, optical/infrared cameras and radars are the main sensors for maritime surveillance [6,9,10,11,12,13,14,15,16]. Even if these sensors can be deployed from shore, ship and aircraft, the satellite-based systems show the specific advantages of remote access, global reach, regular update and high volume of collected data [6]. The interest in the potential of space-based optical images for maritime surveillance has dramatically increased recently, owing to the raised number of the optical satellites, especially in the last decade [6]. However, thanks to the capability for data acquisition under all weather and day-and-night conditions, satellite-based radar imagery, usually gathered by synthetic aperture radar (SAR), is becoming increasingly widespread for maritime surveillance.
Ship-related information gathered by both AIS and SAR can strongly improve maritime situational awareness, if these sources are used in synergy. Plenty of experimental results exist concerning the use of the AIS data to validate and/to estimate performance of SAR-based detection algorithms [17]. This means that the false and missed alarm rates are estimated based on the number of ships detected by SAR which are confirmed by AIS. In this contest, AIS is used as a source of reference or ground truth data. A different approach foresees data fusion of AIS and SAR for discriminating collaborative and non-collaborative ships, the latter being detected by SAR but with no AIS report available.
In both performance assessment and data fusion, a crucial role is played by the correct integration of AIS and SAR data. To this extent, the point-to-point type of association is widely used [18]. Namely, two sets of points are constructed: The first includes the centroids of the detected ship pixels in the SAR image and the second contains the ship positions from AIS data. Then, an iterative process based on distance criteria is applied [17], and the minimum distance between the AIS and SAR locations is used to match the data.
Literature results have shown that the quality of AIS-SAR data matching strongly depends on the density of the ships in the area of interest and on the time lag between AIS and SAR data collection. As a general rule, a larger time difference between SAR and AIS data, results in a larger uncertainty in estimated positions [19]. Moreover, a point-to-point association exhibits high accuracy over low ship density areas.
An innovative method for improving the AIS-SAR matching is proposed in the following. It foresees the estimation of ship velocity by suitable SAR-based techniques. As a result, ship positions in SAR images can be estimated with higher accuracy thus achieving a better matching with AIS data.
The paper is organized as follows. Section 2 introduces the AIS data format and illustrates the conventional technique for AIS-SAR data matching. The proposed AIS-SAR matching technique is presented in Section 3 along with two selected approaches for SAR-based velocity estimation. Processed data and main outputs are described in Section 4, whereas Section 5 discusses examples and results.

2. Conventional AIS-SAR Matching Method

2.1. AIS Data Format, Interpretation, and Interpolation

The Chapter V of Regulation 19 of the International Convention for the Safety of Life at Sea (SOLAS) —“Carriage requirements for shipborne navigational systems and equipment” and its revised version adopted since the year 2000 define the AIS requirements for all ships as a function of size, type, and routes [7]. All ships of 300 gross tonnage and upwards engaged on international voyages, cargo ships of 500 gross tonnage and upwards not engaged on international voyages, and all passenger ships irrespective of size must be equipped with AIS and the transponder should be in operation at all times except where international agreements, rules, or standards provide for the protection of navigational information. Three main operations are required for AIS: (a) To provide information automatically to appropriately equipped shore stations, other ships and aircraft, (b) to automatically receive such information from similar ships, and (c) to exchange data with shore-based facilities. The AIS information transmitted by a ship is of three different types:
  • fixed, or static information, which is entered into the AIS on installation and needs to be changed only if the ship changes its name or undergoes a major conversion from one type to another;
  • dynamic information, which, apart from ‘Navigational status’ information, is automatically updated by the onboard sensors connected to the AIS;
  • voyage-related information, which might need to be manually entered and updated during the voyage.
Static and voyage-related data are sent every 6 min or on request, whereas the update rate of dynamic information depends on speed and course alteration, varying from a few seconds for very fast ships to several minutes for slow ships or anchored ships. With reference to AIS-SAR matching, the dynamic information is used, which includes:
  • time stamp in Coordinated Universal Time (UTC);
  • latitude and longitude in degrees;
  • speed over ground in knots;
  • heading in clockwise degrees with respect to North direction.
Despite AIS being an important tool to collect ship traffic information, incorrect and lost AIS data often occur [20]. In this case, AIS can also interfere with maritime regulation, leading to misjudgment about maritime situational awareness. Hence, it is required to check the correctness and integrity of AIS data before using them and, in certain cases, to restore lost AIS data. Actually, different types of inaccurate data can occur [20] and each one requires a customized cleaning rule. As an example, data may show exactly the same positions between successive time stamps even when speed values are larger than 2 knots. Similarly, data may report unrealistic high speeds with respect to marine engine power and navigation rules. Additionally, acceleration or rate of turn may be unlikely with respect to ship design specifications. Finally, it is not uncommon for AIS to report that data are not available. This condition is marked by specific values, i.e., 511 for heading and 1023 for velocity.
Following data screening, i.e., after removal of inaccurate, unavailable, or unreliable information, AIS reports are to be interpolated. The interpolation is required for identifying ship position and route in a given time epoch, that is the epoch of the SAR data take. Many authors have focused their attention on selecting the most suitable technique for AIS data interpolation [8,21,22,23]. Owing to the speed of computation and the capability of processing all the available information, the cubic Hermite spline is typically used. Different strategies are thus implemented according to data availability. If AIS reports relevant to both preceding and subsequent times with respect to the SAR image epoch are available, ship locations are interpolated by the cubic Hermite spline. Linear interpolation is instead used if either velocity or heading is not available or is unreliable. Otherwise, if the AIS data are gathered only before or only after the SAR image epoch, a linear extrapolation is performed starting from the position and route information which is the nearest (in time) to the SAR image epoch. It is worth noting that interpolations and the extrapolations are performed by computing ship coordinates in the horizontal plane centered at the nearest (in time) AIS position to the SAR image epoch.

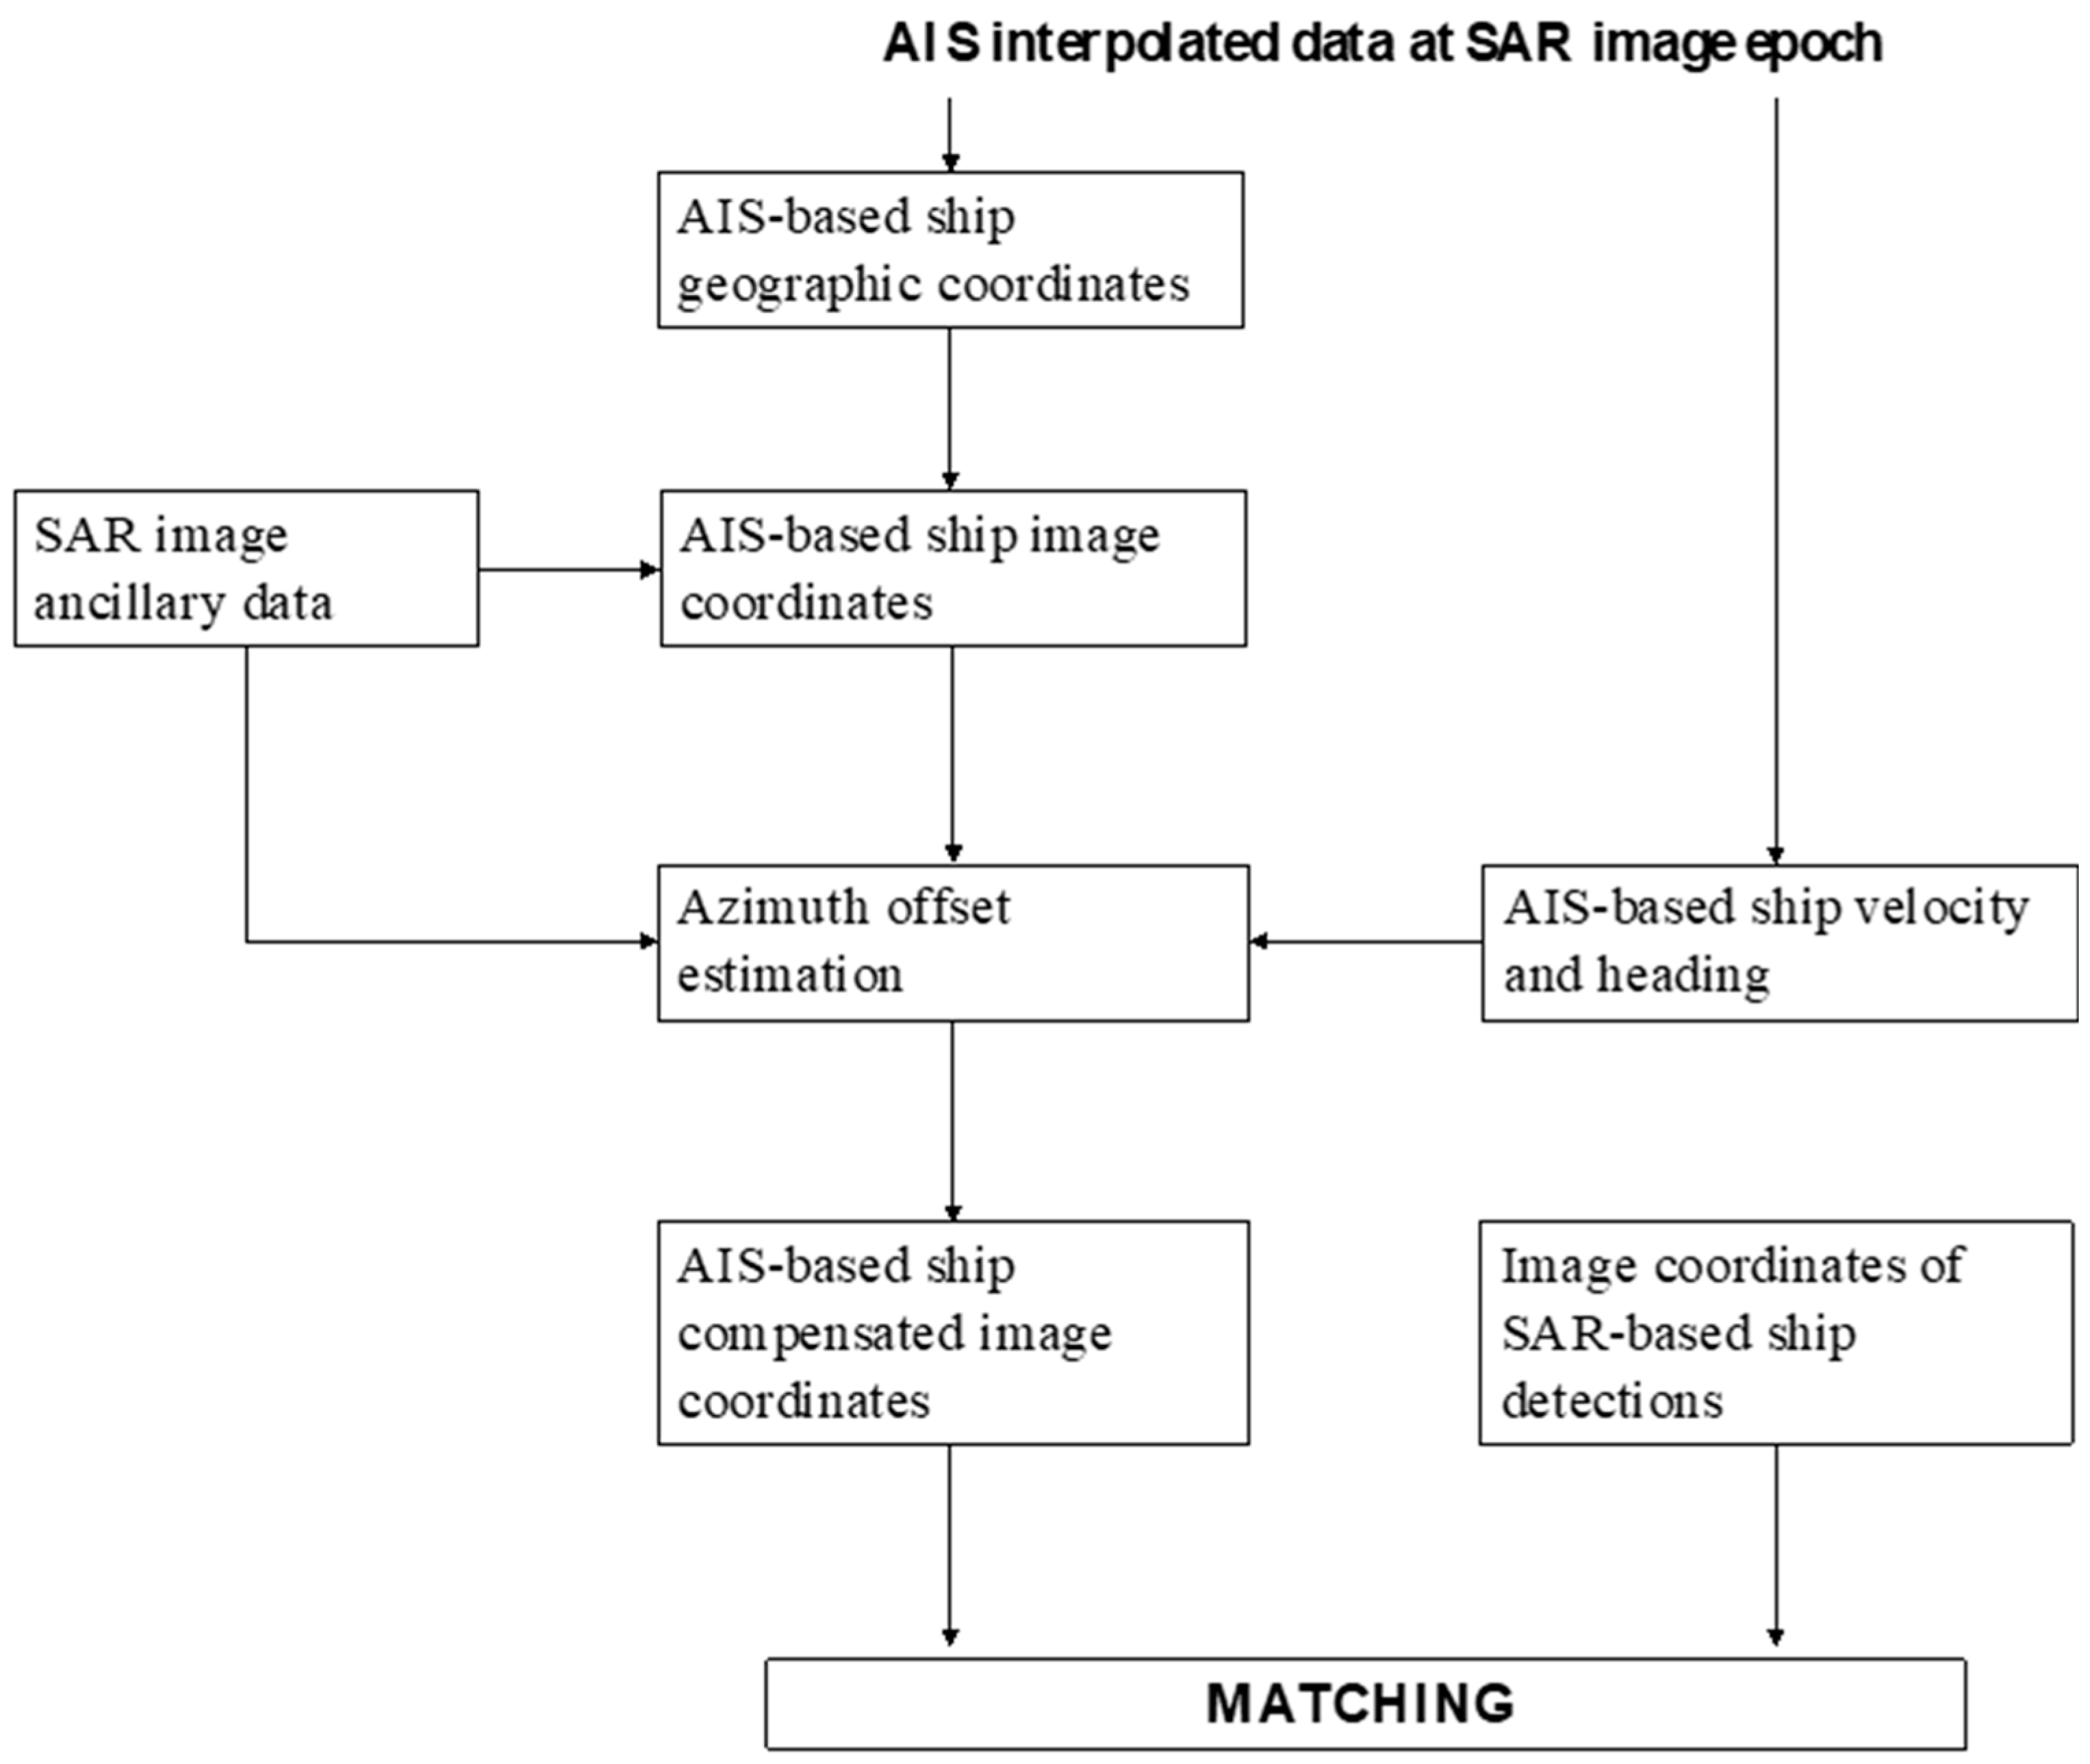
2.2. AIS-Based Matching Technique

SAR images are modified significantly when moving targets are mapped [24,25,26,27,28], since the mechanism of synthetic aperture formation is based on the reconstruction of the Doppler history of the observed targets. The Doppler history depends only on the antenna-target relative motion and, when it is correctly calculated, any target is accurately focused. When a moving target, such as a ship travelling over sea surface, exhibits an unknown motion and it is focused by a so-called standard stationary world matched filter (SWMF), some main effects occur [24]. Specifically, the target is shifted and defocused in azimuth and smeared in range.
All these effects are affected by target velocity and acceleration: The faster the target, the stronger the smearing and the defocusing are. In extreme conditions, residual ship signatures become so weak that they are masked by sea clutter or image noise. Assuming a locally flat Earth, the azimuth offset or displacement, δx, e.g., the difference between the actual moving target location and the imaged one, can be modelled as [29,30]:
δ x = u r · R V
where ur is the radial velocity of the target, i.e., the component of the target velocity along the slant-range direction at the azimuth focusing time (the radial velocity is positive for targets moving away from the antenna), R is the slant range to the target, and V is the platform velocity. As an example, AIS data relative to the ship in Figure 1 show a velocity of about 16 m/s and heading with respect to the North direction of 239° clockwise. Since the azimuth direction of the satellite is 191° clockwise with respect to the North descending orbit and the SAR antenna works in right looking mode, the radial velocity of the target is positive and the ship is wrongly imaged backward in the azimuth direction with respect to its true position ( δ x > 0 ).
The azimuth offset makes AIS-SAR data matching difficult and it must be compensated for, especially in highly congested areas. The common approach for AIS-SAR data matching [17,18,19,31,32] is shown in Figure 2. Positions of vessels in AIS data, interpolated at SAR image epoch, are referred to as AIS-based ship geographic coordinates. They are then converted into SAR image coordinates, i.e., azimuth and range, obtaining the AIS-based ship image coordinates. At this stage, using SAR collection geometry, the interpolated AIS-based ship velocity is projected along the range direction, thus leading to an estimate of u r . This information is processed along with the satellite velocity and the slant range corresponding to AIS-based ship image coordinates, to compensate for the azimuth offset, that is to shift AIS-based ship image coordinates by δ x along the azimuth direction. The result is referred to as AIS-based ship compensated image coordinates, which are then used as the input for matching to SAR-based ship detections. Finally, the minimum distance between AIS and SAR locations is exploited in order to accept a match [17].

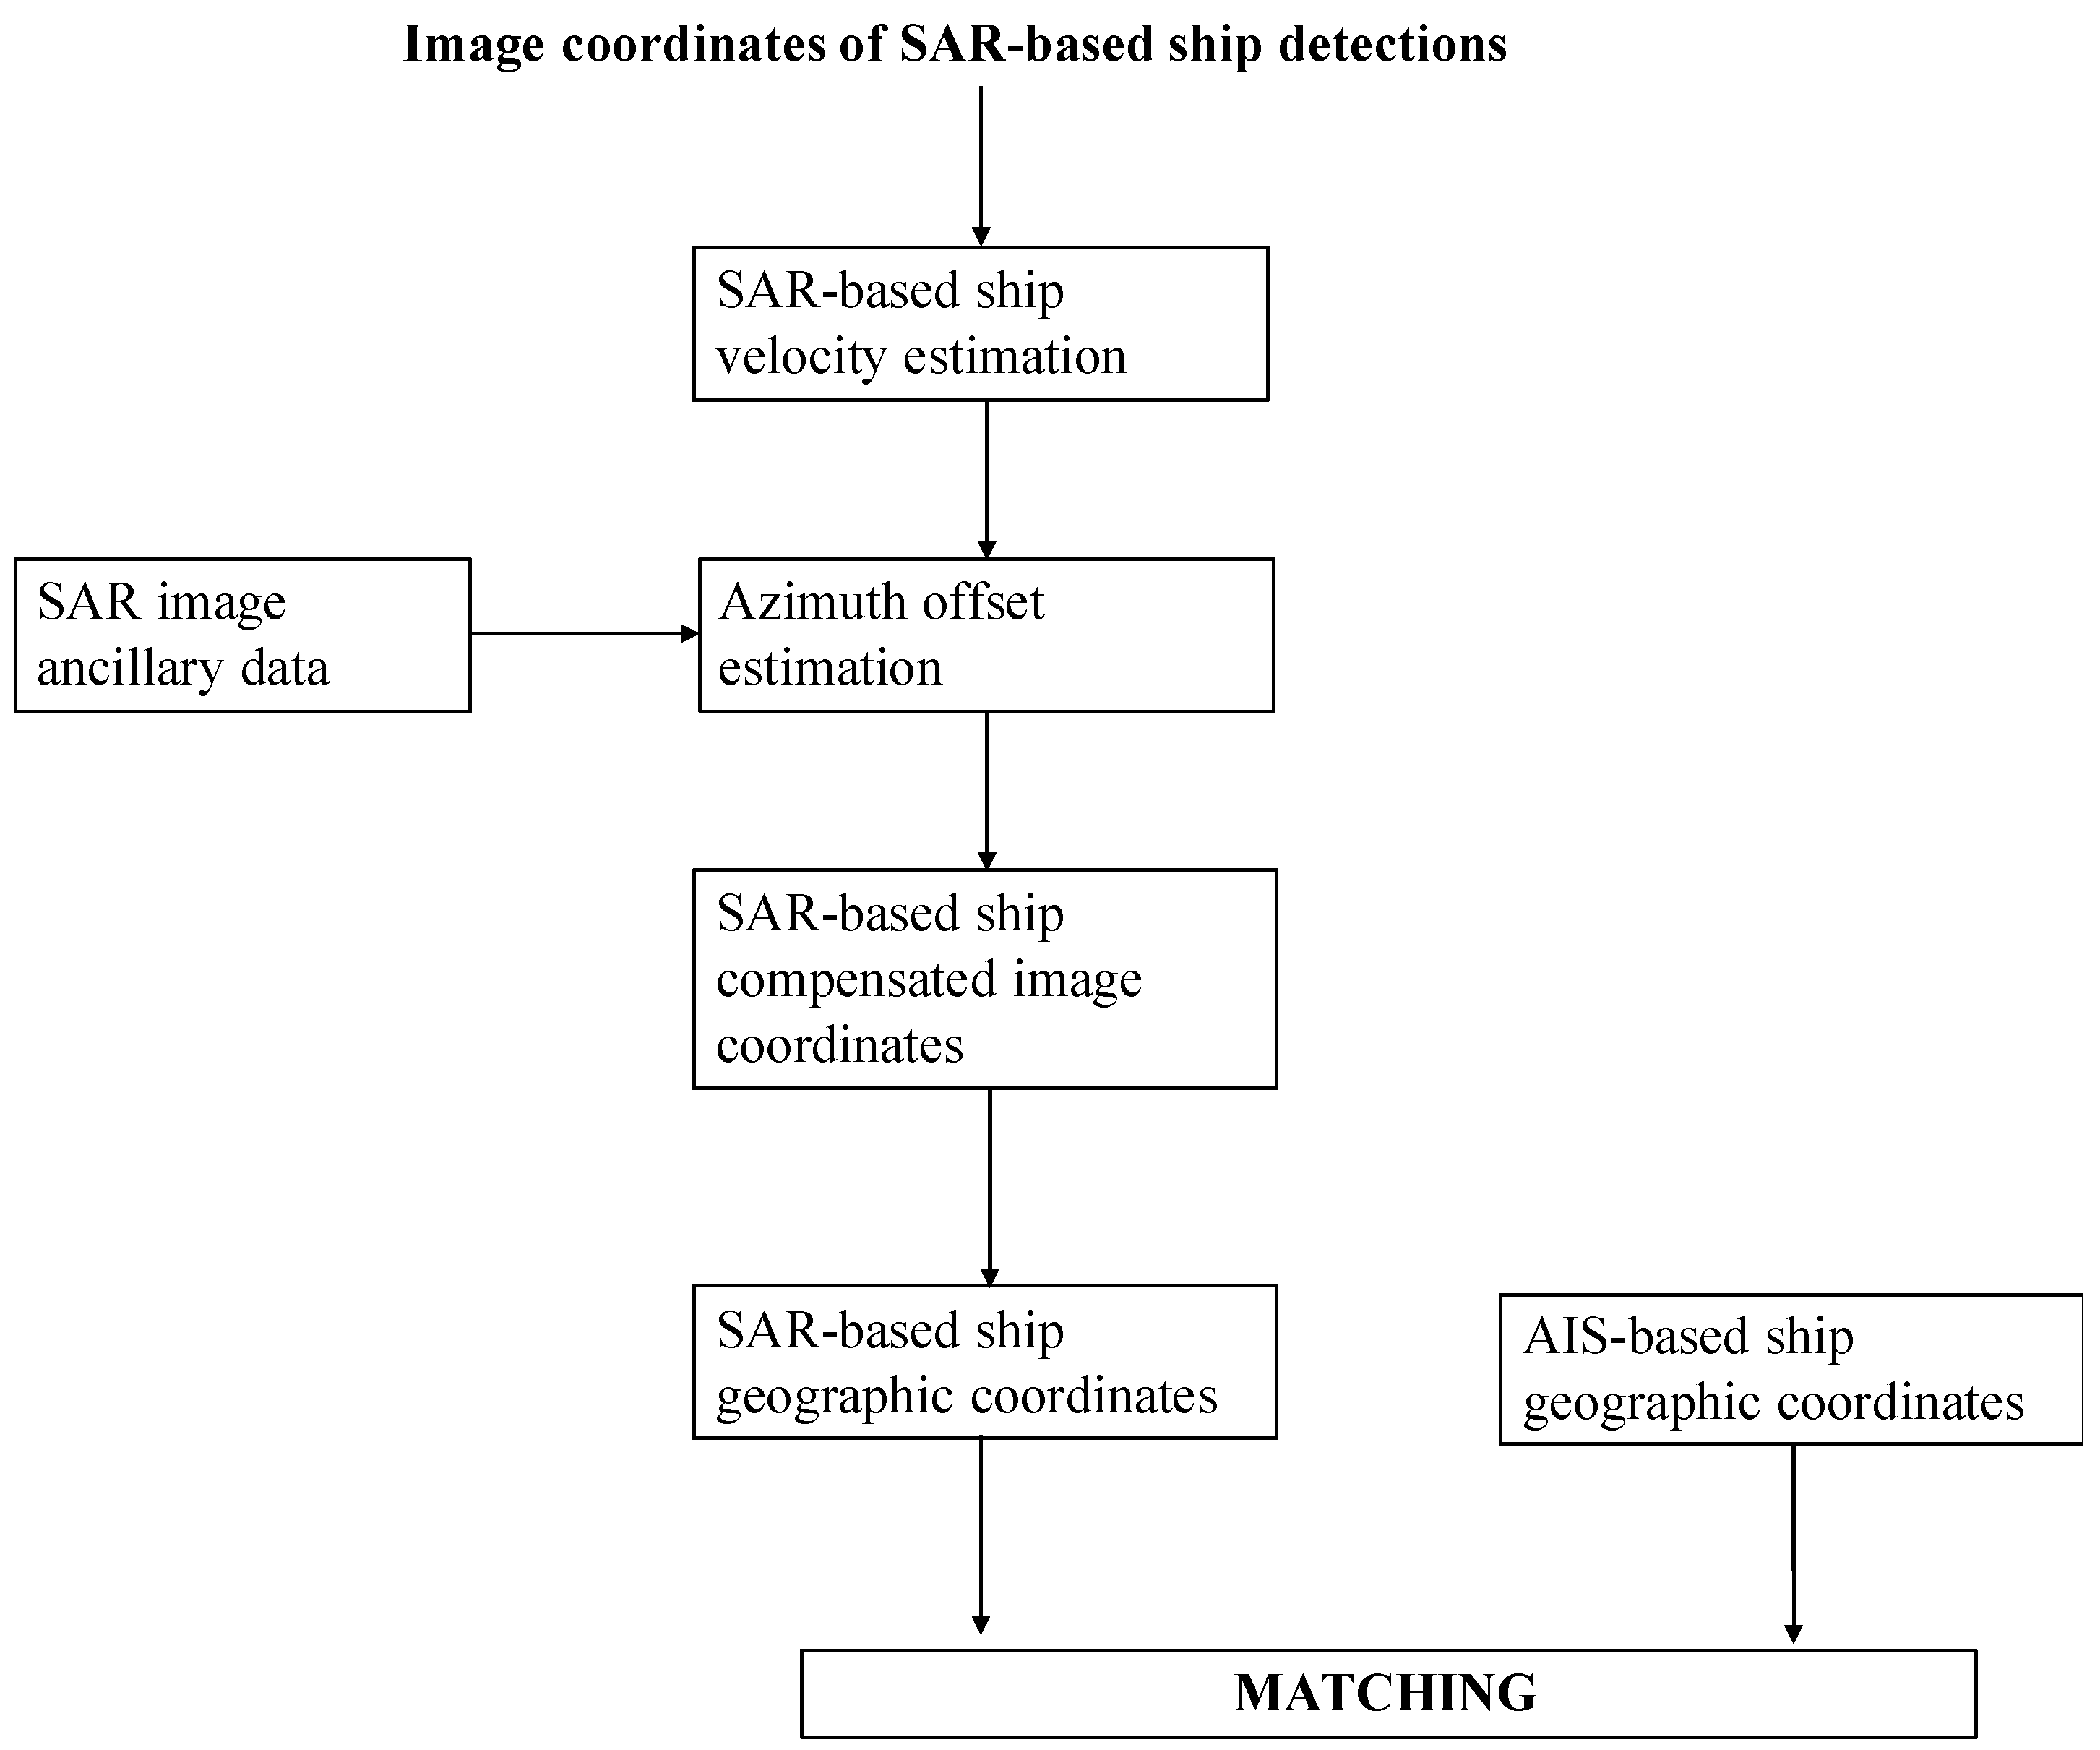
3. Proposed AIS-SAR Matching Method

The limitations of the approach presented in Section 2 depend on AIS data that are not conceived for the computation of an accurate estimate of ship velocity by interpolation. Specifically, speed and heading data, which are part of the dynamic information, are the mere readings of onboard sensors, i.e., the GPS and compass. Neither smoothing nor filtering is applied to these readings. Hence, any error affecting the measures is transferred to the dynamic information and limits the accuracy of the interpolated velocity at the epoch of SAR image collection. In addition, the data rate of the dynamic information is not constant and not sufficiently high to keep velocity interpolation error below an acceptable level. Moreover, data availability is a concern for the method because AIS reports with empty or unrealistic velocity information often occur. The above issues are particularly critical in the case of areas with high maritime traffic, where a very accurate estimate of ship velocity is required to perform a precise removal of the azimuth offset.
To cope with these limitations, a different approach is proposed and tested in this paper, which compensates for the azimuth offset using ship velocity information estimated from SAR data.

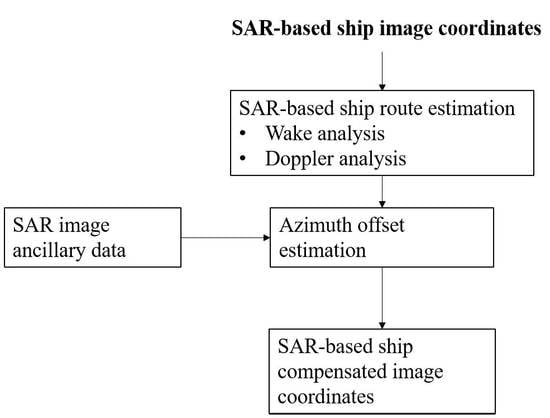
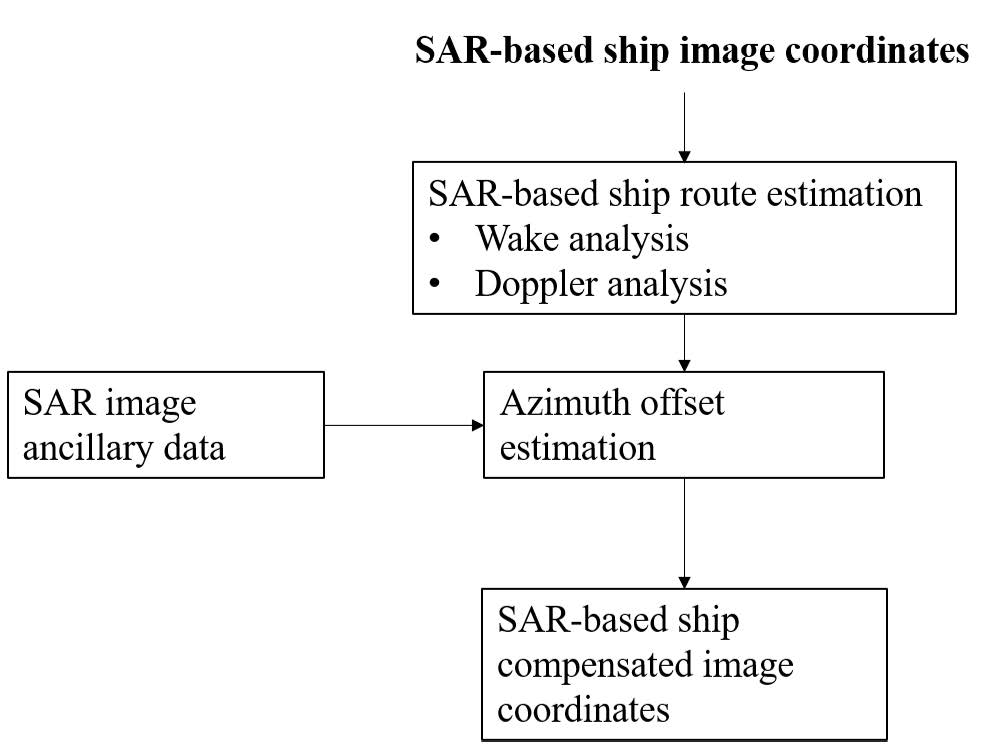
3.1. SAR-Based Matching Technique

The flow chart of the proposed approach is shown in Figure 3. After the detection of candidate ship pixels, the relevant azimuth offset is computed and compensated for. Several techniques can be applied to support this task as discussed in Section 3.2. Following azimuth offset compensation, the true position of ship pixels within the processed SAR image is determined, obtaining the SAR-based ship compensated image coordinates. These can be converted to geographic coordinates and used for comparison to available AIS-based ship geographic coordinates. Data matching is thus performed in the domain of geographic coordinates. This is a further important advantage of the tested approach with respect to the conventional AIS-SAR data matching. Indeed, the latter involves the conversion of AIS ship coordinates from geographic to image coordinates, which can only be performed approximately.
With reference to Figure 3, it is very important to remark that the proposed AIS-SAR matching technique still uses the speed and heading data of the AIS dynamic information, when available. However, these data are only used to compute the AIS-based ship geographic coordinates, that is to interpolate AIS reports to the epoch of SAR data taken by the cubic Hermite spline. No AIS data is used to compensate for the azimuth offset since better performance is expected with SAR-based ship velocity estimation.

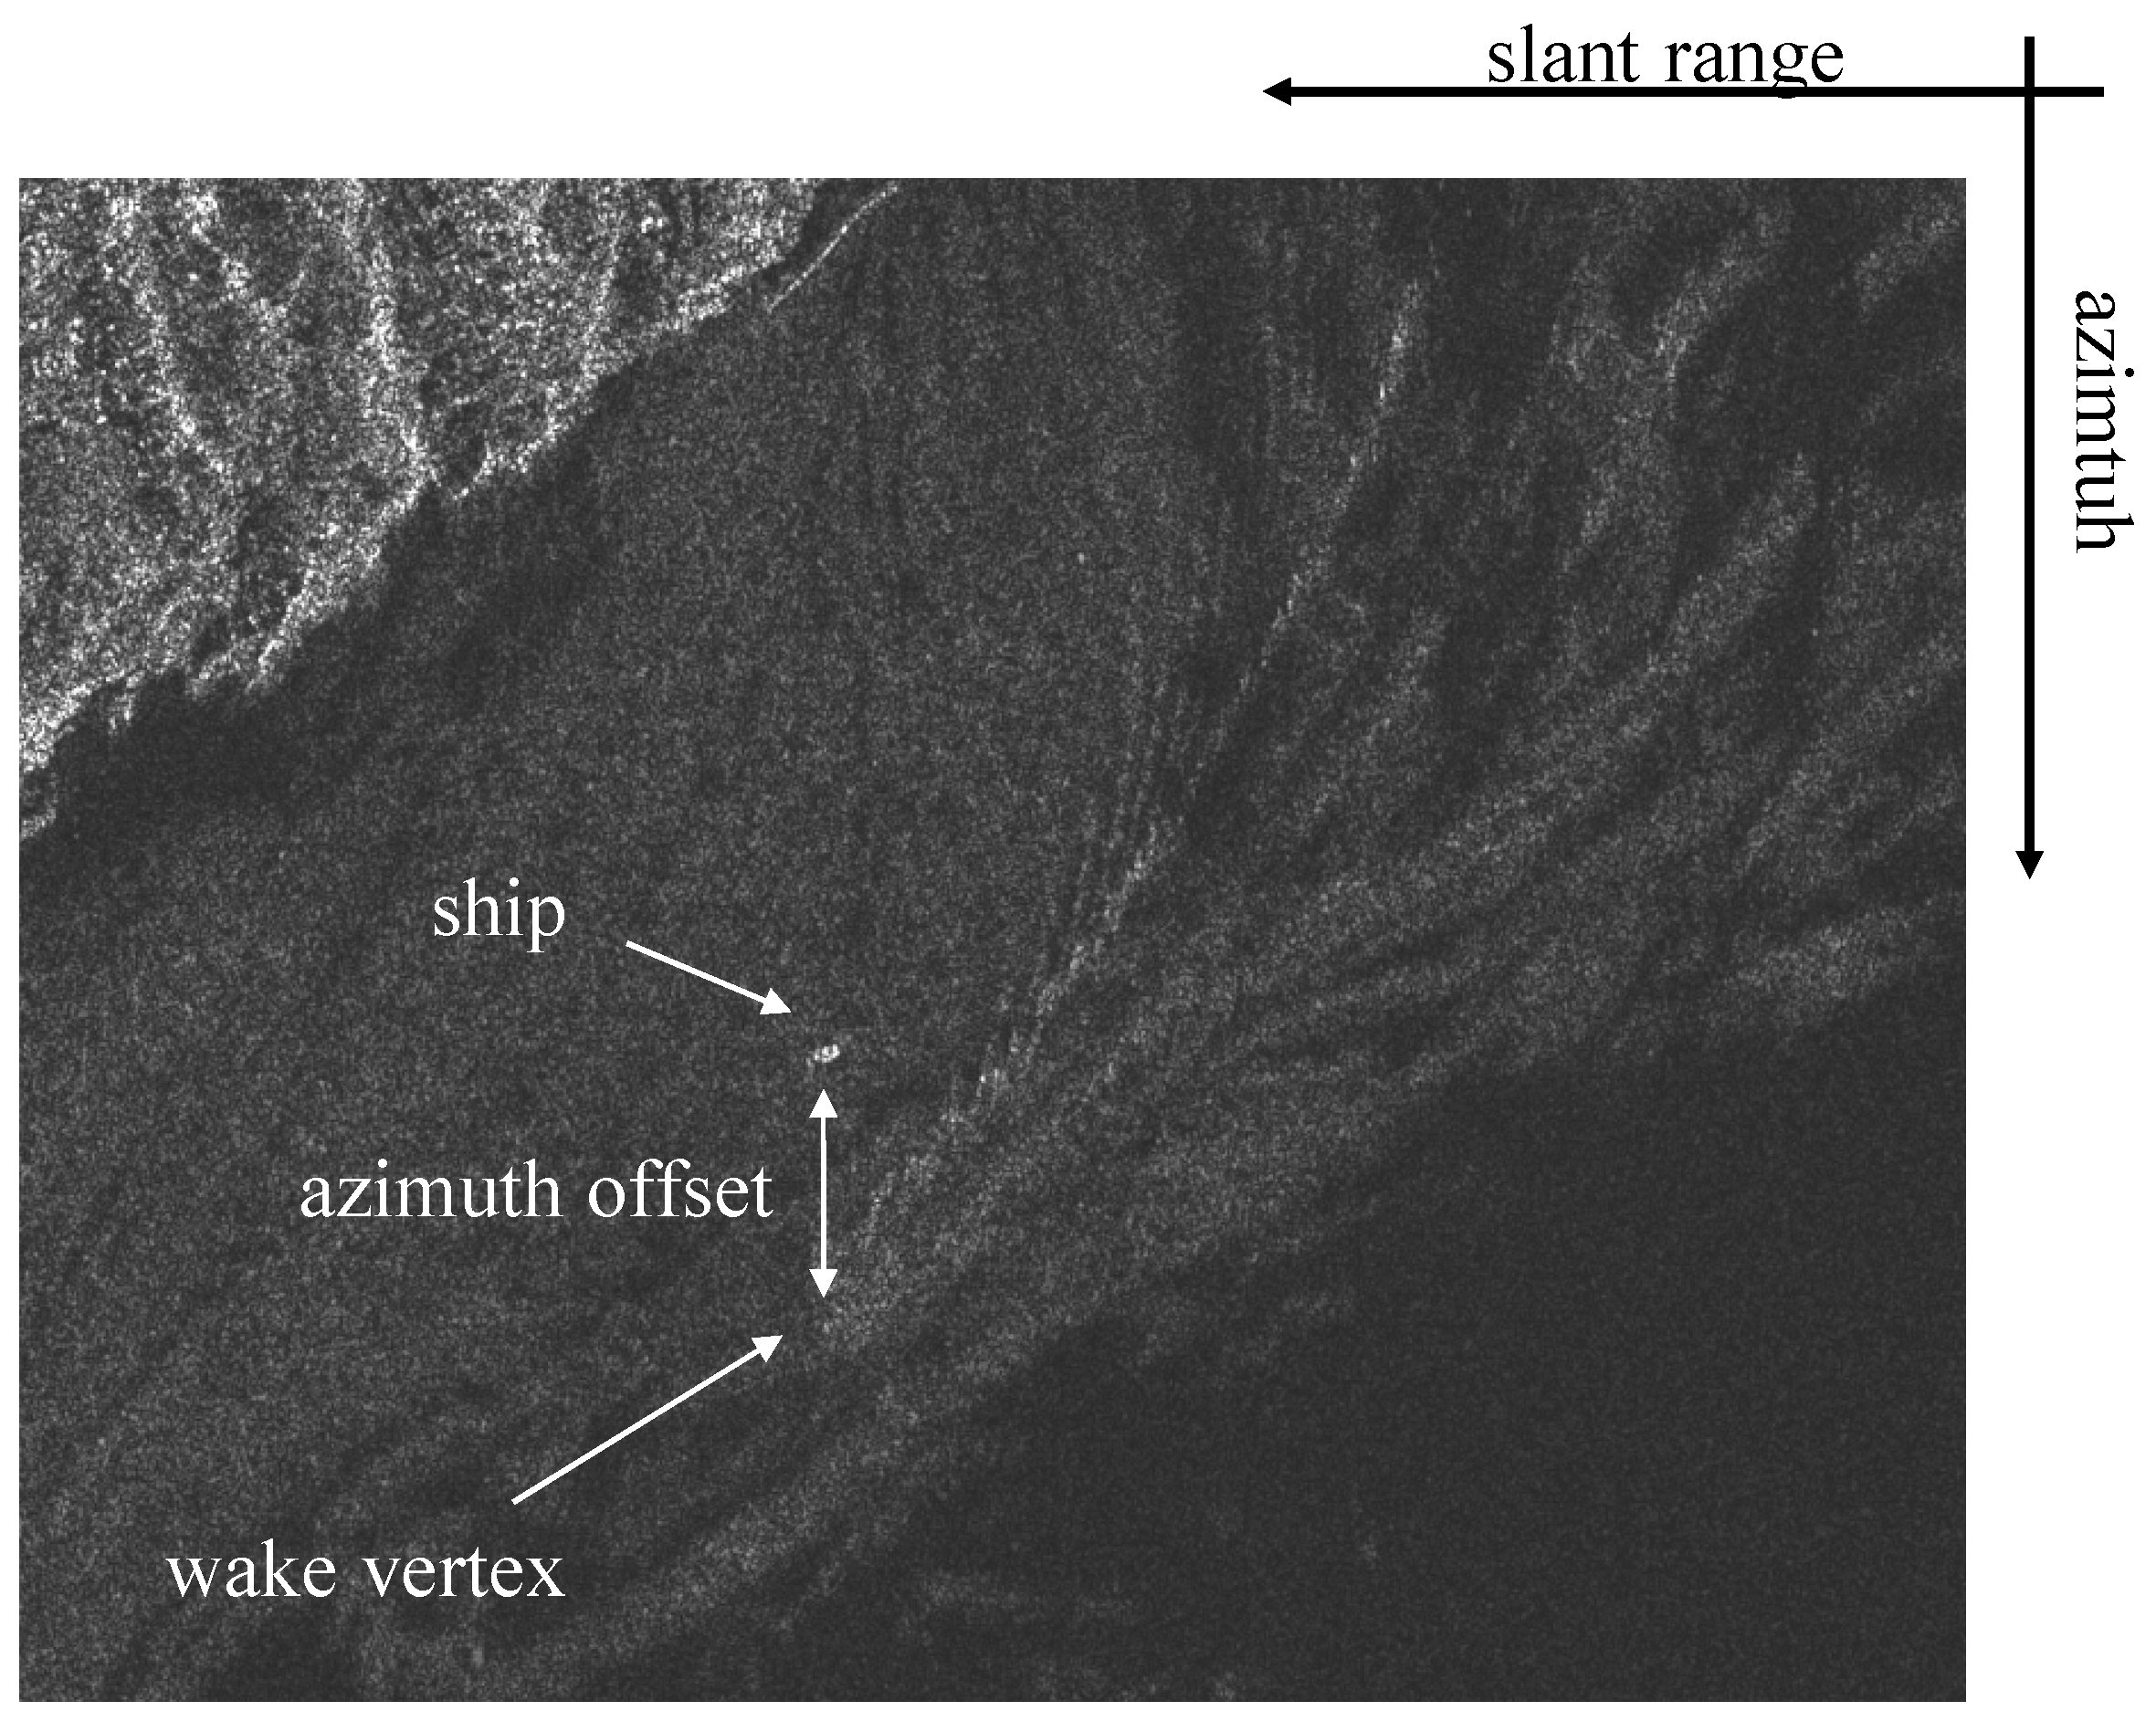
3.2. Ship Velocity Estimation in Single-Channel SAR Data

A key role in the proposed AIS-SAR matching technique is played by the SAR-based computation of the azimuth offset, or, equivalently, by the SAR-based computation of the radial component of ship velocity (see Equation (1)). Interferometric and moving target indication (MTI) SAR [33] have been proposed and tested to calculate the velocity of detected targets in SAR images. However, these techniques require multi-channel or multi-static SAR systems which are currently not available from space [34]. Nonetheless, suitable techniques have been developed that are able to derive the radial velocity even from single-channel SAR images [12,35,36,37,38,39,40,41,42].
Single-channel techniques suffer from some drawbacks when compared to MTI SAR. The applicability is limited by the local conditions, such as wind speed and sea state. In most of the cases [12,35,37,38,39,40,43] a detectable ship signature covering several image pixels is required, whereas other techniques [36,41] need a well-imaged wake pattern, which is an even rarer case and sets specific requirements on SAR image polarization. However, the analysis of the case study presented in this paper will indicate that when a SAR-based estimate of the radial velocity is available, it is worth using it. Indeed, this is not affected by AIS velocity interpolation errors and the availability problems of AIS velocity data.
Among the available techniques, two approaches have been selected and tested in this paper. The approaches rely on very different principles: the first one is based on wake reconstruction and the second one is based on Doppler centroid (DC) analysis. The idea is thus to maximize the number of ships for which a SAR-based velocity estimation can be carried out. Moreover, any other SAR-based velocity estimation technique can be readily integrated in the AIS-SAR matching method of Figure 3.
Concerning ship velocity estimation, ship wake detection and reconstruction have become a field of great interest [36,39,44,45]. The most assessed approaches involve the utilization of the Radon transform [36,39,43,46,47] to convert the bright and dark lines representative of the wake features in SAR imagery into bright/dark dots in the Radon domain. The strategies to detect the bright/dark dots in the Radon domain diversify the proposed techniques. In this paper, the wake reconstruction is carried out as detailed in [39,43,45]. The method enables detection of typical features composing the ship wake: The turbulent wake, which appears as a dark line aligned with the ship longitudinal axis; the narrow-V wakes imaged as two bright linear features surrounding the turbulent wake; and the cusp wakes of the Kelvin pattern, represented by two bright arms making an angle of about 19° with the turbulent wake [36]. Since it is not a rare occurrence [41,44,48] that the narrow-V or cusp wakes are not imaged, the wake reconstruction foresees two steps: The detection phase, in which the candidate positions of all the wake components are identified, and the validation phase, in which the appearance of each feature is confirmed or not by using suitable merit indexes. The detection is carried out by applying the Radon transform to a window centered in the ship position (Figure 4, left). This leads to bright/dark dots in the Radon domain (Figure 4, center top), which are successively identified based on relative angular separation.
In more detail, since the narrow-V wake and the Kelvin cusps should be imaged within 4° and 19° from the turbulent wake [14,36], the ship wake can be only represented by one dark dot (the turbulent wake) with two bright dots within 4° and other two bright dots within 19°. Hence, the method is conceived to search for such arrangements of dots. As an example, the blue dot in the center top image of Figure 4 represents the turbulent wake, whereas the narrow-V and cusp wakes are shown as green and yellow dots, respectively. Then, the application of the inverse Radon transform concludes the detection phase and identifies the candidate wake components (Figure 4, center bottom). Finally, the validity of each identified feature is confirmed by using merit indexes, which measure the brightness of each component with respect to the background. For the wake in Figure 4, this leads to the validation of the turbulent wake and one narrow-V wake (Figure 4, right).
When the wake is reconstructed, the ship heading is obtained by the turbulent wake direction. Therefore, the ship velocity can be estimated by the azimuth displacement (Equation (1)) between the ship position and the wake vertex (red dot in Figure 4, right), where the latter is given by the intersection of the validated wake components. More details about the selection of the bright/dark dots and the definition of the merit indexes can be found in [43]. The method has been tested over X-band and C-band SAR images and the results have shown that the position of the wake vertex is correctly identified in the vast majority of the cases [39,43,45].
The above-presented technique based on the azimuth offset and completed by the merit indexes is a reliable tool for ship velocity estimation. The main limitation is that the technique can be applied when not only a detectable ship signature exists but also the wake can be individuated. This is possible in co-polarized images, i.e., HH and VV, but impracticable on cross-polarized images, where sea clutter is typically much weaker than image noise [49]. In this case a different technique, referred to as DC analysis, can be applied, which processes ship signatures only. The method has been introduced in [40] and it is based on the consideration that the SWMF does not completely suppress the difference between stationary and moving targets, especially in the Doppler domain. The Doppler history of a moving target is characterized by a different Doppler rate and a different DC with respect to the stationary target case. If one neglects Doppler rate variations, the difference of Doppler histories is essentially a DC difference. Moreover, this DC difference is in direct relation to ship radial velocity of the target. With specific reference to Single-Look Complex (SLC) SAR data and assuming the radial velocity positive when the target is moving away from the sensor, the DC difference is
δ f D C = u r λ
where λ is the radar signal wavelength. The possibility to derive the radial velocity using Equation (2) relies on the capability to calculate the DC of the moving target and of the corresponding static target. This can be performed by Doppler spectrum analysis of SLC images. The signature of the detected ship can be isolated, as a box of NA rows and NR columns in the SLC product. Each column of this target box can be interpreted as a sequence sampling the Doppler spectrum of the moving target. Assuming that all the NR sequences are characterized by the same spectrum, NR estimates of the spectrum can be derived. The derived NR spectra are then summed incoherently to generate the final estimate of the moving target spectrum. Incoherent combination is used to achieve noise and interference reduction. The DC estimation can be carried out by applying the clutterlock algorithm to the oversampled spectrum [40] or by polynomial interpolation of Fourier transform coefficients. In this paper the DC has been computed as the frequency corresponding to the maximum of the parabola interpolating the azimuth processed bandwidth of the spectrum [50]. This approach makes the selection of processing boxes easier in the case of high-reflectivity targets. The same procedure is then repeated for two close regions of the image, which represent the Doppler spectrum of the static background. Noise and interference lead to slight differences between the centroids estimated over the introduced background windows. This DC difference is a measure of the expected accuracy of the performed DC estimations. The final estimate of target velocity is obtained applying Equation (2) to both background boxes and then considering the average velocity value. Figure 5 shows an example of DC analysis. The left image shows the selected target box around the detected ship. The size of the target box is 23 × 26 pixels in the azimuth and slant range, respectively. The image also shows the background boxes that are wider, 128 × 128 pixels, square boxes. The top right graph shows the estimated spectra of target and background boxes, respectively. The spectra are then fitted by a parabola, and the relevant maxima are assumed as DC measures. The bottom right graph of Figure 5 shows the fitting parabolas and marks the maxima as vertical lines. Estimated DC of the target is 87.6 Hz, whereas background centroids are 10.0 Hz and 7.2 Hz, respectively. Since the target DC is significantly different from both the background ones, one can conclude that the target box includes a ship, which is moving at about 2.5 m/s radial velocity. The method has been tested on X-band single-channel SAR data [40] showing very good agreement with velocities computed by the azimuth offset method.
Concluding this section, it is important to remark that the joint exploitation of two different approaches for route estimation allows the range of applicability of the proposed AIS-SAR data matching to be extended. Indeed, the wake-based route estimation is applicable when the wake is represented by straight lines. Curved features cannot be processed by Radon transform. The wake-based route estimation is also of limited applicability on cross-polarized images [49]. In this case, DC analysis can be applied. Limitations of DC analysis, instead, deal with the relevant assumptions. Neglecting Doppler rate variations represents a good assumption for slowly moving targets, up to a speed of approximately 10 knots. For faster targets, such an assumption can increase the radial velocity error. Moreover, the imaged ship must be sufficiently large to perform reliable DC estimation. Detected ships covering just a few pixels cannot be processed by DC analysis. This is the case of go-fast ships [51], i.e., high-speed (up to 60 knots) small vessels. However, they can be robustly processed by the wake-based approach, owing to the stable wake features they generate.

4. Case Study and Experimental Results

The proposed SAR-based matching of AIS and SAR data has been tested on four SAR images of the Gulf of Naples, Italy, gathered by the TerraSAR-X satellite (Table 1). Processed products are level-1b StripMap data [52], corresponding to single-look complex images in slant range-azimuth projections. The images are standard dual-polarization products with range and azimuth resolutions of about 1.2 m and 6.6 m, respectively.
The AIS data used in this study were delivered by ExactEarth Ltd. [53]. They are interpolated as detailed in Section 2.1 in order to derive AIS ship geographic coordinates at the SAR image epoch.
Distances, estimated in the local horizontal plane centered in the AIS ship position, are used as quantitative parameters to measure the performance of the achieved AIS-SAR data matching. Specifically, four different distances can be computed (see Figure 6):
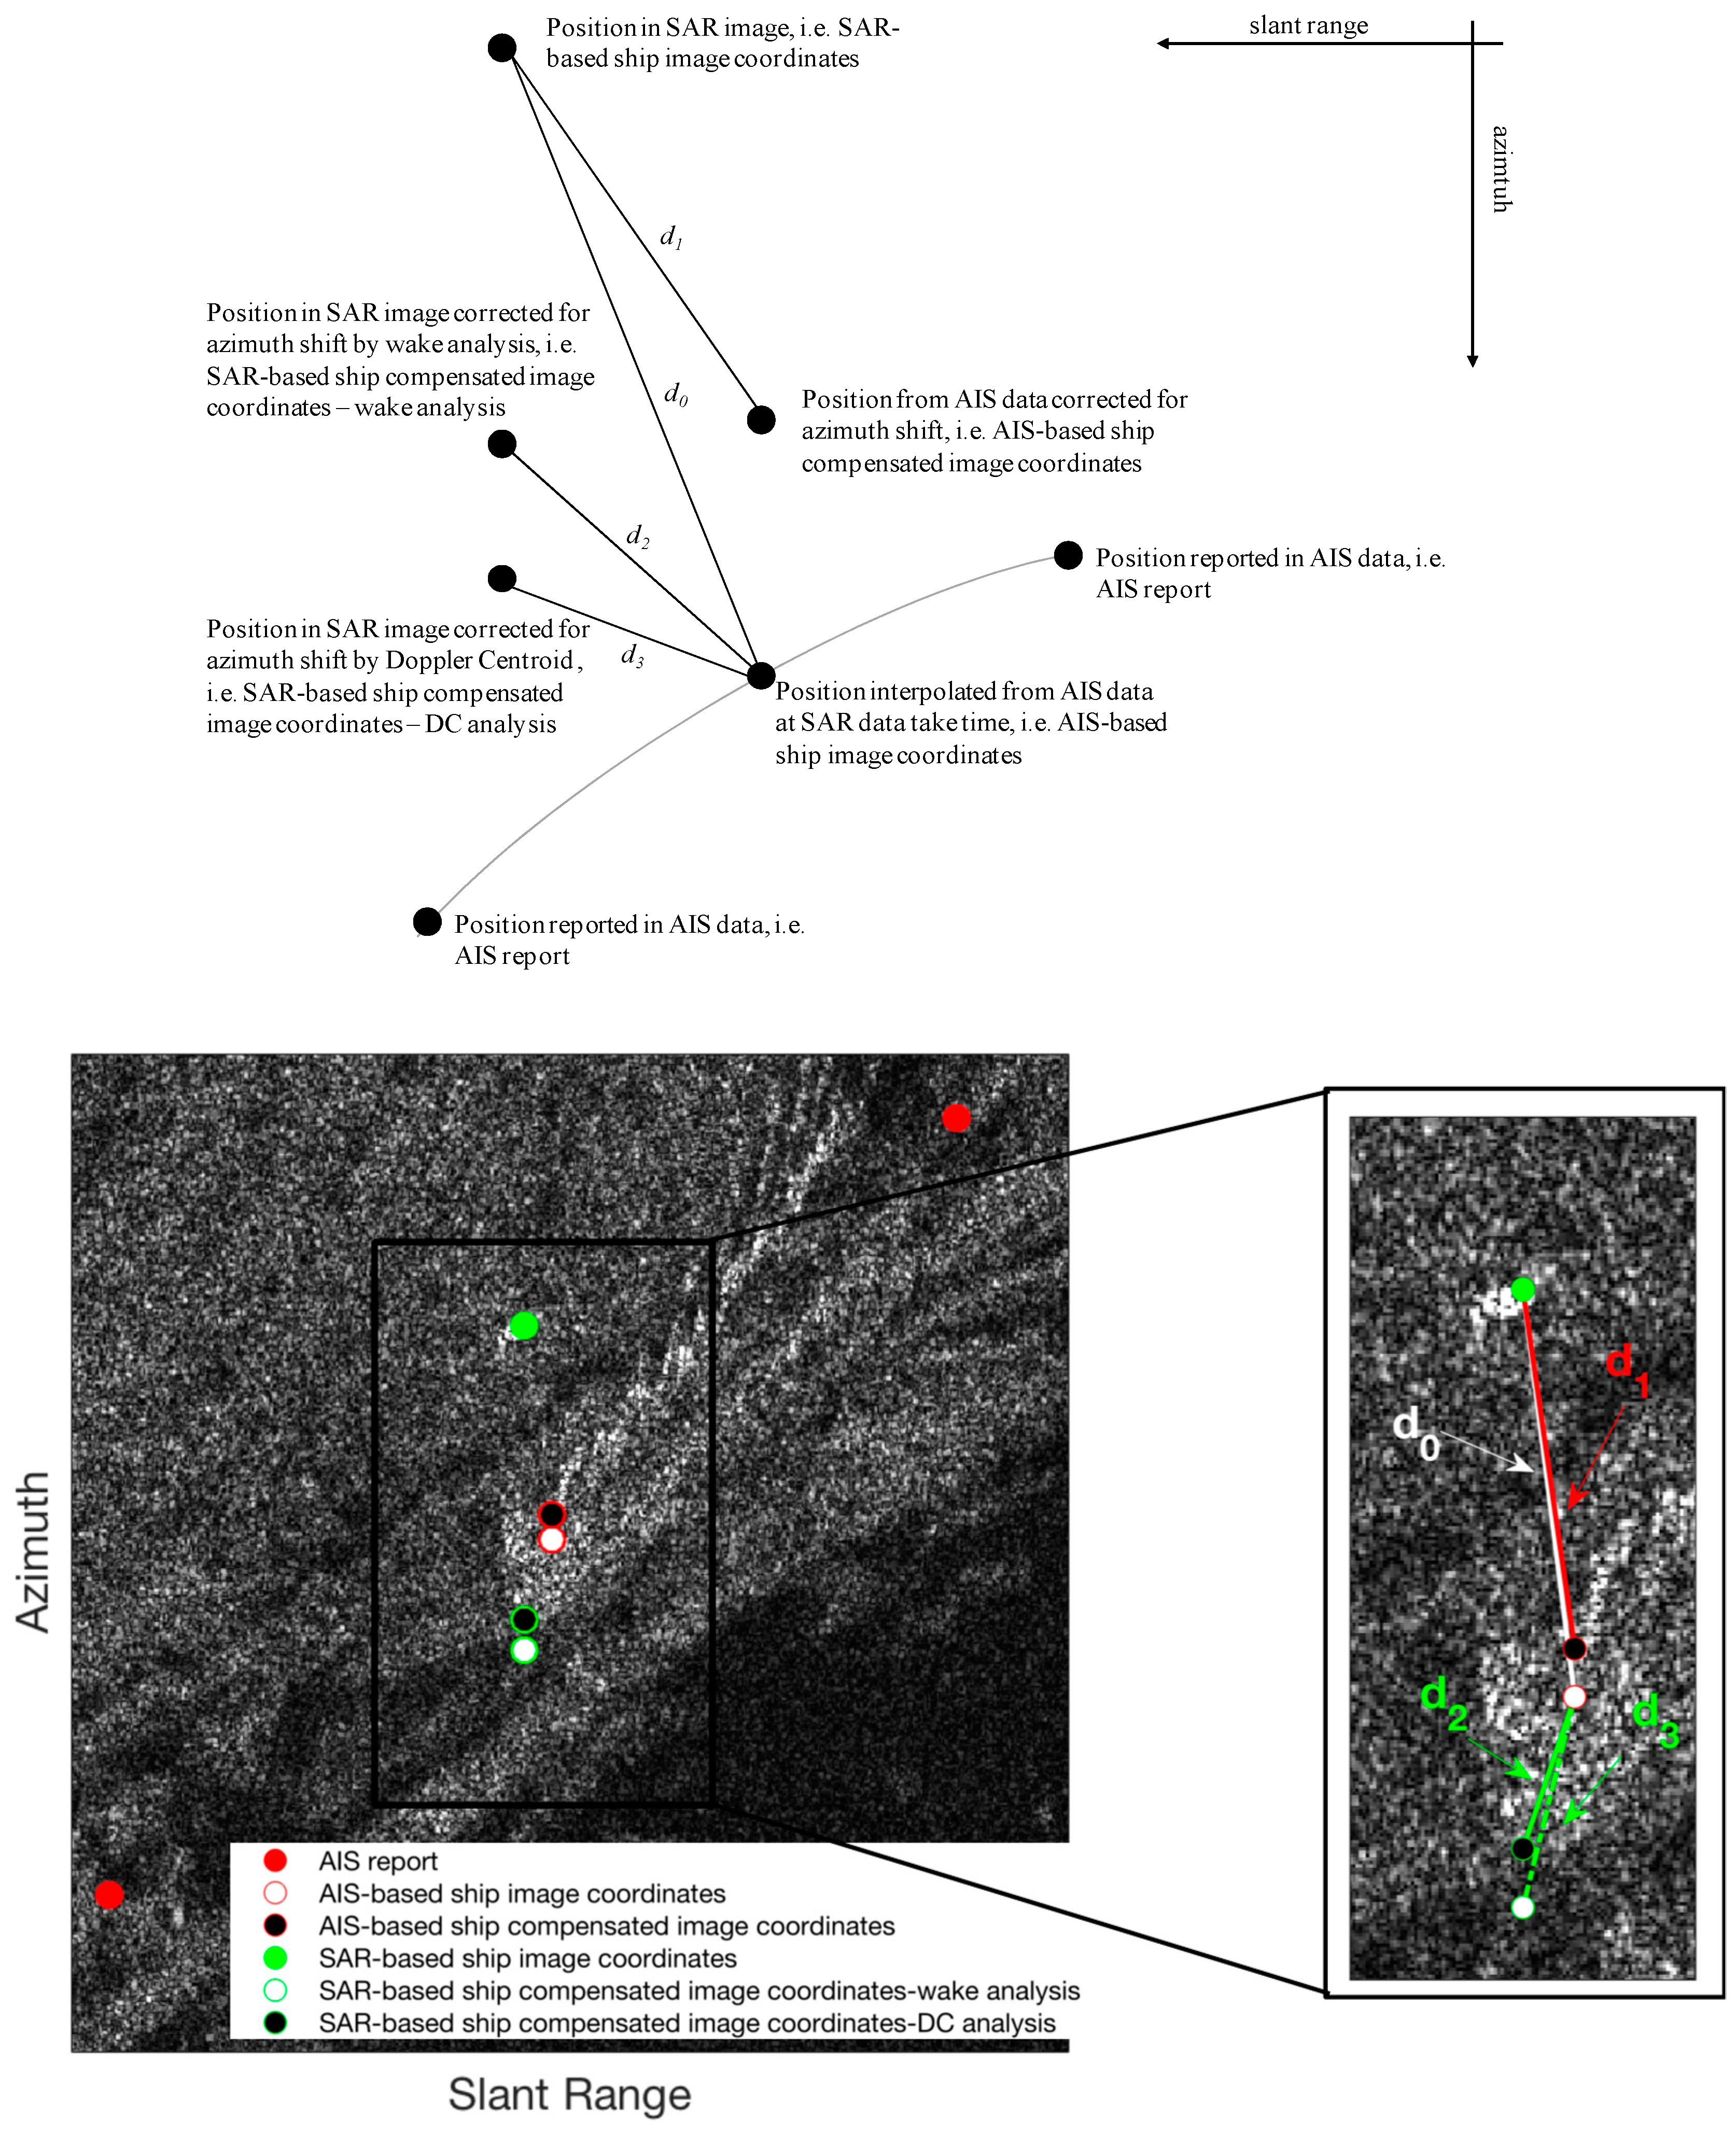
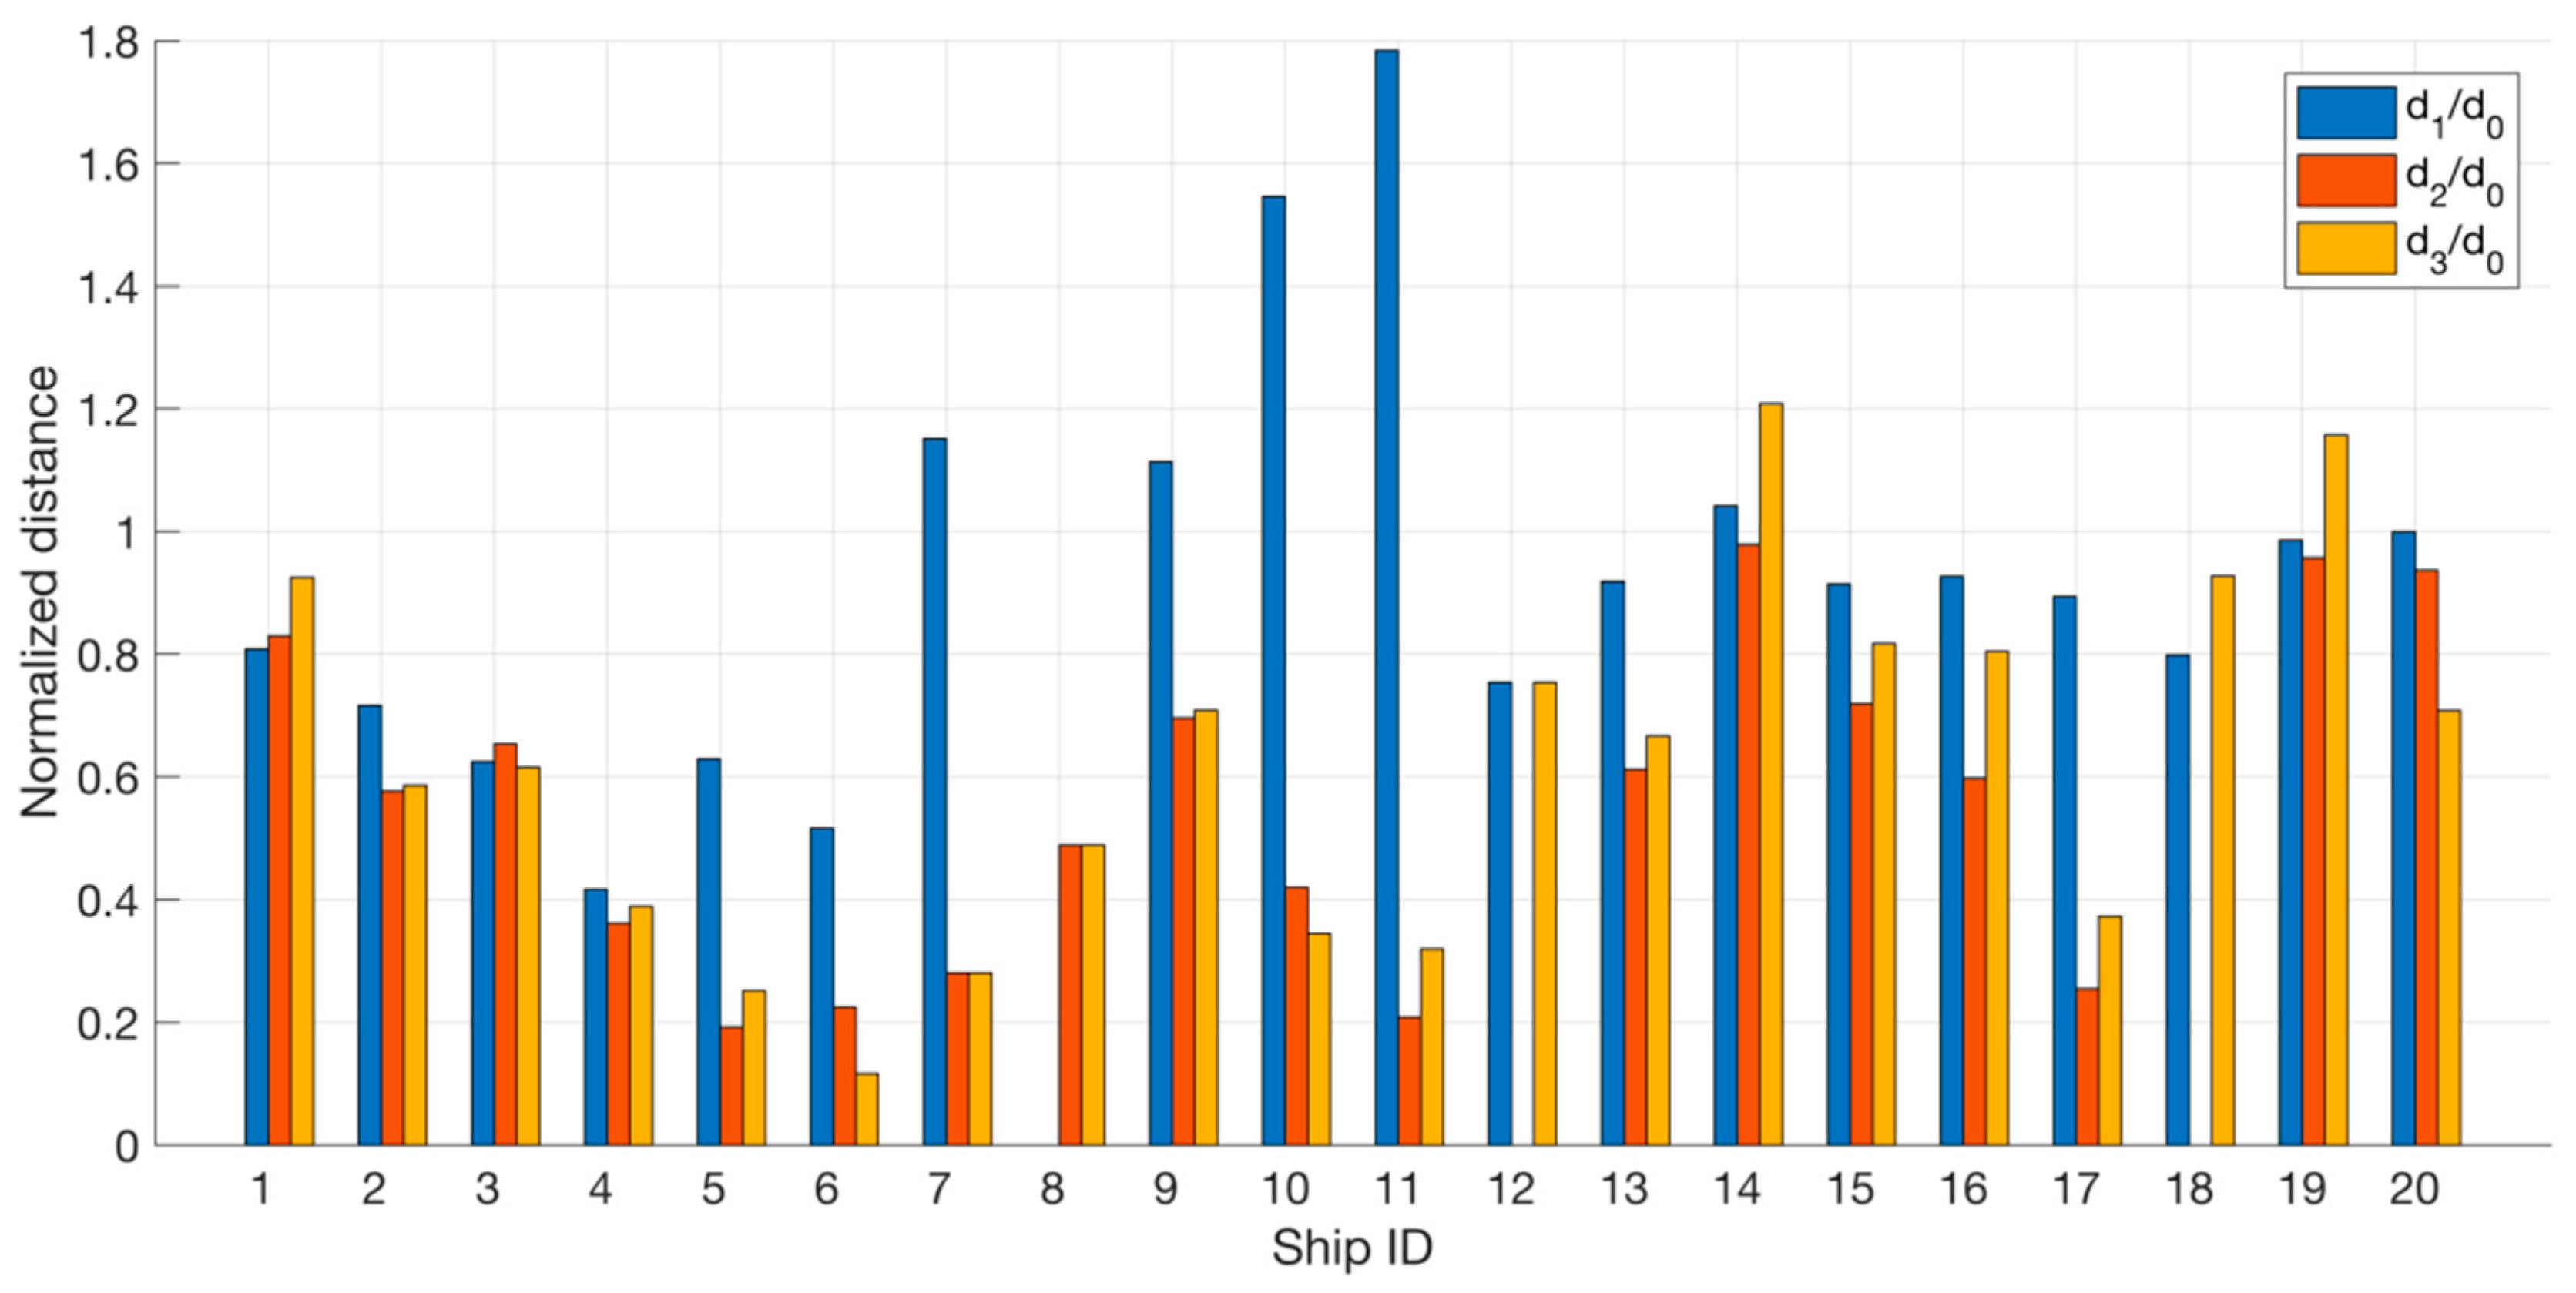
  • d0 is the distance between the ship feature detected in the SAR image and the AIS-based ship geographic coordinates obtained by interpolation at SAR data take time. The distance is representative of the case in which no motion compensation is applied, that is the azimuth offset is ignored.
  • d1 is the distance between the ship feature detected in the SAR image and the AIS-based ship compensated image coordinates converted in the geographical reference frame. The distance is representative of the conventional method for AIS-SAR data matching (Figure 2).
  • d2 is the distance between the ship feature detected in the SAR image, compensated for the azimuth offset by wake-based route estimation, and AIS-based ship geographic coordinates.
  • d3 is the distance between the ship feature detected in the SAR image, compensated for the azimuth offset by DC analysis, and AIS-based ship geographic coordinates.
Hence, d1, d2, and d3 account for azimuth offset and d2 and d3 are representative of the proposed method.
The processed AIS dataset includes about one thousand ships. The goal of the experimental analysis is to show that the proposed AIS-SAR matching method has the potential for improving measurement number and accuracy with respect to the conventional method.
With reference to the increase of possible matchings, only 16% of the ships can be potentially processed by the conventional method. Indeed, the AIS dynamic information for the remaining 84% of the ships shows unavailable velocity (31%), unavailable heading (20%), or more than a 30 min gap between AIS acquisition and the SAR image epoch (34%). Concerning the latter case, it is immediately verifiable that d1 >> d0 if the time gap is longer than 30 min, meaning that velocity interpolation errors are so high that the conventional method is not able to deliver a useful estimate of the azimuth offset. This estimate is instead made available by the proposed method using the selected SAR-based techniques.
As far as the accuracy is concerned, the analysis is conducted considering a case study of 20 ships only, i.e., ships for which: (i) the time gap between AIS and SAR is less than 30 min; (ii) a clearly imaged wake is available; (iii) ship feature is large enough to apply DC analysis. Even if such a condition strongly reduces the total number of ships, the goal is to verify that the improvement of AIS-SAR matching is obtained thanks to SAR-based velocity estimation and it is not an improvement resulting from very poor quality of AIS data in the considered, very congested area, i.e., the Gulf of Naples. Following ship detection, the wake-based analysis for route estimation is applied to VV products, whereas DC analysis is applied to the same areas in the corresponding VH polarized images. In this way, a comparison can also be made, in terms of accuracy, between the conventional method and the proposed one, when different SAR-based techniques are used for estimating the azimuth offset. Figure 7 shows the results of the accuracy analysis, with d1, d2 and d3 normalized with respect to d0. The distance between AIS and SAR location is exploited to evaluate the quality of the processing and the shorter distance ratio is obtained, the better matching is achieved [17].
Concerning the results of Figure 7, it is important to point out that:
-
d1 is computed for 19 ships out of 20 because the heading value of ship #8 at the epoch of image #1 was 511, i.e., not available data;
-
d2 is available for 18 ships out of 20 because even if ship #12 and ship #18 show a distinguishable wake, the wake-based velocity estimation is not allowed for them due to their positions. In fact, the ships are too close to the image border and it is not possible to define a tile of suitable dimensions to run wake-based velocity estimation algorithms.

5. Discussion

The presented results confirm that the quality of AIS-SAR data integration is notably improved when the radial velocity of the ship is derived from SAR data. This is an important advantage with respect to conventional approaches, which interpolate velocity and heading of AIS reports to generate an estimate of the radial component. Indeed, these techniques suffer from major limitations dealing with (i) unavailability of velocity and/or heading information in AIS data, (ii) velocity and/or heading interpolation errors, and (iii) inaccuracies generated by the conversion from geographic to image coordinates.
Table 2 highlights the advantages of SAR-based velocity estimation. In detail, 15 cases out of the 17 wake-based azimuth offset estimation perform better than in the AIS-based one. Similarly, DC analysis gets better results than AIS-based velocity estimation in 16 out of 19 cases. In summary, AIS-SAR data matching is improved in 86% of the tested ships.
It very important to remark that the proposed approach provides a distance between AIS and SAR locations that is always below 150 m, whereas the conventional procedure achieves the same results only for about 60% of the analyzed ships. Furthermore, the percentages of occurrences in which d2 and d3 are shorter than 50 m or 100 m are significantly larger than for AIS-based matching, as listed in Table 2. Hence, it is possible to reduce the size of the region of research when looking for a match to AIS data and, consequently, the disambiguation issues in highly congested sea traffic areas.
Another interesting outcome regards the cases in which correction of the azimuth offset worsens the matching. In fact, the conventional AIS-SAR matching method (Figure 2) fails in 5 out 20 cases, that is d1 is larger than d0 in the 25% of the analyzed cases. Concerning this, one can argue that, since AIS data are not conceived for velocity interpolation, an overestimation of the azimuth offset can occur for high velocity values. In contrast, it never happens that the wake-based motion compensation worsens ship location matching, i.e., d2 is always shorter than d0. Finally, d3 is larger than d0 only in two cases, i.e., ship #14 and #19. However, d0 is relatively small in both cases, e.g., 48 m for ship #14, and the difference between d3 and d0 is just a few meters.
As noted in Section 3, the proposed matching method is applicable as long as a SAR-based velocity estimation can be performed. Actually, the environmental conditions, such as sea state and wind speed, along with radar-related parameters, e.g., polarization and observation geometry, affect the possibility of obtaining a reliable estimate of the ship velocity. With reference to the approaches based on wake reconstruction, the literature [44,54] shows that the wake is more distinguishable when: (a) the ship is larger, (b) the ship is faster, (c) the radar incidence angle is smaller, and (d) the ship is moving along the looking direction of the radar. In addition, the wake features are more detectable when wind speed is moderate (3–7 m/s), even if the visibility of the Kelvin arms is improved for lower wind speeds, since the contrast between cusp waves and background sea surface roughness is higher. However, the turbulent wake is the only wake feature required to compute the azimuth shift. This sets the range of usable wind speeds to 2–10 m/s. Similarly, the sea surface perturbations, due to sea state and wind can spoil the DC accuracy. In both cases, however, robust indicators are used to check if applicability conditions are met: Merit indexes for the wake reconstruction and centroid differences for DC analysis, respectively.

6. Conclusions

AIS data are widely used for performance validation of SAR-based detection techniques and identification of non-collaborative ships. Several AIS-SAR data matching methods have been developed in recent years and the ship velocity and heading values included in the AIS data are typically exploited.
This paper proposed an innovative AIS-SAR data matching method, in which a reliable estimate of ship radial velocity is derived from SAR imaging, even when single-channel acquisitions are the only data available. Velocity information extracted from SAR images support AIS-SAR data matching through compensation of the azimuth shift. Application of suitable SAR-based techniques, such as wake reconstruction and DC analysis, allows the method to deliver route information independently of SAR image polarization and for most ship classes.
The tested technique has shown several advantages: (a) it can be applied when velocity and/or heading are not available in the AIS data, (b) it is not affected by interpolation errors, (c) it does not require the conversion from geographical to pixel coordinates and (d) it is widely applicable, owing to the utilization of different techniques for the estimation of the azimuth offset.
The analysis of the selected case study confirmed that data matching is facilitated by SAR-based azimuth offset estimation, since the residual distance between AIS and SAR ship locations is always smaller than 150 m. The accuracy of this technique is expected to positively contribute to maritime situational awareness, especially in high-traffic waters.

Author Contributions

Conceptualization, A.R.; Methodology, M.D.G., A.R. and A.M; Software, M.D.G. and A.R.; Validation, M.D.G.; Investigation, M.D.G., A.R. and A.M.; Writing—original draft preparation, M.D.G.; Writing—review and editing, A.R. and A.M.; Supervision, A.M.

Funding

This research received no external funding.

Conflicts of Interest

The authors declare no conflict of interest.

References

  1. McIver, R.; Breeze, H.; Devred, E. Satellite remote-sensing observations for definitions of areas for marine conservation: Case study of the Scotian Slope, Eastern Canada. Remote Sens. Environ. 2018, 214, 33–47. [Google Scholar] [CrossRef]
  2. Liu, Y.; Hu, C.; Sun, C.; Zhan, W.; Sun, S.; Xu, B.; Dong, Y. Assessment of offshore oil/gas platform status in the northern Gulf of Mexico using multi-source satellite time-series images. Remote Sens. Environ. 2018, 208, 63–81. [Google Scholar] [CrossRef]
  3. Alpers, W.; Holt, B.; Zeng, K. Oil spill detection by imaging radars: Challenges and pitfalls. Remote Sens. Environ. 2017, 201, 133–147. [Google Scholar] [CrossRef]
  4. Brekke, C.; Solberg, A.H.S. Oil spill detection by satellite remote sensing. Remote Sens. Environ. 2005, 95, 1–13. [Google Scholar] [CrossRef]
  5. Back, M.; Kim, D.; Kim, S.W.; Won, J.S. Two-Dimensional Ship Velocity Estimation Based on KOMPSAT-5 Synthetic Aperture Radar Data. Remote Sens. 2019, 11, 1474. [Google Scholar] [CrossRef]
  6. Kanjir, U.; Greidanus, H.; Oštir, K. Vessel detection and classification from spaceborne optical images: A literature survey. Remote Sens. Environ. 2018, 207, 1–26. [Google Scholar] [CrossRef]
  7. AIS-International Maritime Organization. Available online: http://www.imo.org/en/OurWork/Safety/Navigation/Pages/AIS.aspx (accessed on 17 January 2019).
  8. Shepperson, J.L.; Hintzen, N.T.; Szostek, C.L.; Bell, E.; Murray, L.G.; Kaiser, M.J. A comparison of VMS and AIS data: The effect of data coverage and vessel position recording frequency on estimates of fishing footprints. ICES J. Mar. Sci. 2018, 75, 988–998. [Google Scholar] [CrossRef]
  9. Ouchi, K. Recent Trend and Advance of Synthetic Aperture Radar with Selected Topics. Remote Sens. 2013, 5, 716–807. [Google Scholar] [CrossRef] [Green Version]
  10. Greidanus, H. Satellite imaging for maritime surveillance of the European seas. In Remote Sensing of the European Seas; Springer: Dordrecht, The Netherlands, 2008; ISBN 9781402067716. [Google Scholar]
  11. Crisp, D.J. The State-of-the-Art in Ship Detection in Synthetic Aperture Radar Imagery; DSTO-RR-0272; DSTO Information Sciences Laboratoty: Edinbutgh, Australia, 2004; p. 115. [Google Scholar]
  12. Brusch, S.; Lehner, S.; Fritz, T.; Soccorsi, M.; Soloviev, A.; Van Schie, B. Ship surveillance with TerraSAR-X. IEEE Trans. Geosci. Remote Sens. 2010, 49, 1092–1103. [Google Scholar] [CrossRef]
  13. Zou, Z.; Shi, Z. Ship Detection in Spaceborne Optical Image with SVD Networks. IEEE Trans. Geosci. Remote Sens. 2016, 54, 5832–5845. [Google Scholar] [CrossRef]
  14. Pichel, W.G.; Clemente-Colón, P.; Wackerman, C.C.; Friedman, K.S. Ship and Wake Detection in SAR Marine Users Manual; National Oceanic and Atmospheric Administration: Washington, DC, USA, 2004.
  15. Reggiannini, M.; Bedini, L. Multi-Sensor Satellite Data Processing for Marine Traffic Understanding. Electronics 2019, 8, 152. [Google Scholar] [CrossRef]
  16. Xu, F.; Liu, J.; Sun, M.; Zeng, D.; Wang, X. A Hierarchical Maritime Target Detection Method for Optical Remote Sensing Imagery. Remote Sens. 2017, 9, 280. [Google Scholar] [CrossRef]
  17. Pelich, R.; Longépé, N.; Mercier, G.; Hajduch, G.; Garello, R. AIS-Based Evaluation of Target Detectors and SAR Sensors Characteristics for Maritime Surveillance. IEEE J. Sel. Top. Appl. Earth Obs. Remote Sens. 2015, 8, 3892–3901. [Google Scholar] [CrossRef]
  18. Zou, Z.Z.; Ji, K.F.; Xing, X.W.; Zou, H.X. Effective Association of SAR and AIS Data Using Non-Rigid Point Pattern Matching. IOP Conf. Ser. Earth Environ. Sci. 2014, 17, 012258. [Google Scholar]
  19. Youden, J.; Yue, B. AIS-SAR Data Association Algorithms; Report R-14-111-1213; CCORE: St. John’s, NL, Canada, 2015. [Google Scholar]
  20. Zhang, D.; Li, J.; Wu, Q.; Liu, X.; Chu, X.; He, W. Enhance the AIS data availability by screening and interpolation. In Proceedings of the 4th International Conference on Transportation Information and Safety (ICTIS), Banff, AB, Canada, 8–10 August 2017; pp. 981–986. [Google Scholar]
  21. Hintzen, N.T.; Piet, G.J.; Brunel, T. Improved estimation of trawling tracks using cubic Hermite spline interpolation of position registration data. Fish. Res. 2010, 101, 108–115. [Google Scholar] [CrossRef]
  22. Hu, Q.; Cai, F.; Yang, C.; Shi, C. An Algorithm for Interpolating Ship Motion Vectors. TransNav Int. J. Mar. Navig. Saf. Sea Transp. 2014, 8, 35–40. [Google Scholar] [CrossRef]
  23. Nguyen, V.; Im, N.-K.; Lee, S. The Interpolation Method for the missing AIS Data of Ship. J. Navig. Port. Res. 2015, 39, 377–384. [Google Scholar] [CrossRef] [Green Version]
  24. Raney, R.K. Synthetic Aperture Imaging Radar and Moving Targets. IEEE Trans. Aerosp. Electron. Syst. 1971, 3, 499–505. [Google Scholar] [CrossRef]
  25. Barbarossa, S. Detection and imaging of moving objects with synthetic aperture radar. 1. Optimal detection and parameter estimation theory. IEE Proc. F Radar Signal Process. 1992, 139, 79–88. [Google Scholar] [CrossRef]
  26. Perry, R.P.; DiPietro, R.C.; Fante, R.L. SAR imaging of moving targets. IEEE Trans. Aerosp. Electron. Syst. 1999, 35, 188–200. [Google Scholar] [CrossRef]
  27. Ender, J.H.G. Space-time processing for multichannel synthetic aperture radar. Electron. Commun. Eng. J. 1999, 11, 29–38. [Google Scholar] [CrossRef]
  28. Jao, J.K. Theory of synthetic aperture radar imaging of a moving target. IEEE Trans. Geosci. Remote Sens. 2001, 39, 1984–1992. [Google Scholar] [CrossRef] [Green Version]
  29. Ouchi, K. On the multilook images of moving targets by synthetic aperture radars. IEEE Trans. Antennas Propag. 1985, 33, 823–827. [Google Scholar] [CrossRef]
  30. Ouchi, K.; Iehara, M.; Morimura, K.; Kumano, S.; Takami, I. Nonuniform azimuth image shift observed in the Radarsat images of ships in motion. IEEE Trans. Geosci. Remote Sens. 2002, 40, 2188–2195. [Google Scholar] [CrossRef]
  31. Chaturvedi, S.K.; Yang, C.S.; Ouchi, K.; Shanmugam, P. Ship Recognition by Integration of SAR and AIS. J. Navig. 2012, 65, 323–337. [Google Scholar] [CrossRef]
  32. Mazzarella, F.; Vespe, M.; Santamaria, C. SAR Ship Detection and Self-Reporting Data Fusion Based on Traffic Knowledge. IEEE Geosci. Remote Sens. Lett. 2015, 12, 1685–1689. [Google Scholar] [CrossRef]
  33. Liu, C.; Gierull, C.H. A New Application for PolSAR Imagery in the Field of Moving Target Indication/Ship Detection. IEEE Trans. Geosci. Remote Sens. 2007, 45, 3426–3436. [Google Scholar] [CrossRef]
  34. Gierull, C.H.; Sikaneta, I.; Cerutti-Maori, D. Two-Step Detector for RADARSAT-2’s Experimental GMTI Mode. IEEE Trans. Geosci. Remote Sens. 2013, 51, 436–454. [Google Scholar] [CrossRef]
  35. Tunaley, J.K.E. The estimation of ship velocity from SAR imagery. In Proceedings of the IGARSS 2003, 2003 IEEE International Geoscience and Remote Sensing Symposium, Toulouse, France, 21–25 July 2003; Volume 1, pp. 191–193. [Google Scholar]
  36. Zilman, G.; Zapolski, A.; Marom, M. The speed and beam of a ship from its wake’s SAR images. IEEE Trans. Geosci. Remote Sens. 2004, 42, 2335–2343. [Google Scholar] [CrossRef]
  37. Dragosevic, M.V.; Vachon, P.W. Estimation of Ship Radial Speed by Adaptive Processing of RADARSAT-1 Fine Mode Data. IEEE Geosci. Remote Sens. Lett. 2008, 5, 678–682. [Google Scholar] [CrossRef]
  38. Kirscht, M. Detection and imaging of arbitrarily moving targets with single-channel SAR. IEE Proc. Radar Sonar Navig. 2003, 150, 7–11. [Google Scholar] [CrossRef]
  39. Graziano, M.D.; D’Errico, M.; Rufino, G. Wake component detection in X-band SAR images for ship heading and velocity estimation. Remote Sens. 2016, 8, 498. [Google Scholar] [CrossRef]
  40. Renga, A.; Moccia, A. Use of Doppler Parameters for Ship Velocity Computation in SAR Images. IEEE Trans. Geosci. Remote Sens. 2016, 54, 3995–4011. [Google Scholar] [CrossRef]
  41. Panico, A.; Graziano, M.D.; Renga, A. SAR-Based Vessel Velocity Estimation From Partially Imaged Kelvin Pattern. IEEE Geosci. Remote Sens. Lett. 2017, 14, 2067–2071. [Google Scholar] [CrossRef]
  42. Wang, J.; Liu, X. Velocity estimation of moving targets in SAR imaging. IEEE Trans. Aerosp. Electron. Syst. 2014, 50, 1543–1549. [Google Scholar] [CrossRef]
  43. Graziano, M.D.; D’Errico, M.; Rufino, G. Ship heading and velocity analysis by wake detection in SAR images. Acta Astronaut. 2016, 128, 72–82. [Google Scholar] [CrossRef]
  44. Tings, B.; Pleskachevsky, A.; Velotto, D.; Jacobsen, S. Extension of Ship Wake Detectability Model for Non-Linear Influences of Parameters Using Satellite Based X-Band Synthetic Aperture Radar. Remote Sens. 2019, 11, 563. [Google Scholar] [CrossRef]
  45. Graziano, M.D.; Grasso, M.; D’Errico, M. Performance Analysis of Ship Wake Detection on Sentinel-1 SAR Images. Remote Sens. 2017, 9, 1107. [Google Scholar] [CrossRef]
  46. Copeland, A.C.; Ravichandran, G.; Trivedi, M.M. Localized Radon Transform-Based Detection of Ship Wakes in SAR Images. IEEE Trans. Geosci. Remote Sens. 1995, 33, 35–45. [Google Scholar] [CrossRef]
  47. Rey, M.T.; Tunaley, J.K.; Folinsbee, J.T.; Jahans, P.A.; Dixon, J.A.; Vant, M.R. Application of Radon Transform Techniques to Wake Detection in Seasat-A SAR Images. IEEE Trans. Geosci. Remote Sens. 1990, 28, 553–560. [Google Scholar] [CrossRef]
  48. Lyden, J.D.; Hammond, R.R.; Lyzenga, D.R.; Shuchman, R.A. Synthetic aperture radar imaging of surface ship wakes. J. Geophys. Res. Ocean. 1988, 93, 12293–12303. [Google Scholar] [CrossRef]
  49. Yeremy, M.; Campbell, J.W.M.; Mattar, K.; Potter, T. Ocean Surveillance with Polarimetric SAR. Can. J. Remote Sens. 2001, 27, 328–344. [Google Scholar] [CrossRef]
  50. Rossi, C.; Runge, H.; Breit, H.; Fritz, T. Surface current retrieval from TerraSAR-X data using Doppler measurements. In Proceedings of the 2010 IEEE International Geoscience and Remote Sensing Symposium, Honolulu, HI, USA, 25–30 July 2010; pp. 3055–3058. [Google Scholar]
  51. Tunaley, J.K.E. Wakes from Go-Fast and Small Planing Boats; London Research and Development Corporation: Ottawa, ON, Canada, 2014. [Google Scholar]
  52. Airbus. TerraSAR-X Image Product Guide; 2015; Available online: https://www.intelligence-airbusds.com (accessed on 4 September 2019).
  53. ExactEarth. Available online: https://www.exactearth.com (accessed on 9 Jaunuary 2018).
  54. Tings, B.; Velotto, D. Comparison of ship wake detectability on C-band and X-band SAR. Int. J. Remote Sens. 2018, 39, 4451–4468. [Google Scholar] [CrossRef] [Green Version]
Figure 1. Example of a ship imaged by TerraSAR-X satellite over the Gulf of Naples (3 August 2012). The ship shows a negative azimuth offset with respect to its wake vertex (true ship position).
Remotesensing 11 02196 g001
Figure 2. Flow-chart of conventional automatic identification system (AIS)-synthetic aperture radar (SAR) matching approach exploiting AIS-based ship route information [17].
Remotesensing 11 02196 g002
Figure 3. Flow-chart of the proposed AIS-SAR matching approach exploiting SAR-based ship velocity estimation.
Remotesensing 11 02196 g003
Figure 4. Ship velocity estimation technique based on the azimuth offset between wake vertex and ship position.
Remotesensing 11 02196 g004
Figure 5. Ship velocity estimation procedure based on the Doppler centroid (DC) analysis: (left) selected target and background boxes, (top right) spectra resulting from incoherent summation, and (bottom right) fitted spectra with computed centroids as vertical lines.
Remotesensing 11 02196 g005
Figure 6. SAR-based and AIS-based ship positions in SAR image domain. Pictorial view of positions and distances (top), application example on ship of Figure 1 (bottom).
Remotesensing 11 02196 g006
Figure 7. Comparison between AIS-based and SAR-based data matching.
Remotesensing 11 02196 g007
Table 1. SAR Data Set (StripMap Mode).
Image #1Image #2Image #3Image #4
Acquisition Date5 June 201429 June 201310 July 20133 August 2012
Acquisition Hour (UTC)5:20:145:20:105:20:115:20:06
PolarizationVH/VV
PassDescend.
Incidence Angle (°)22
Ship ID1 to 89 to 1213 to 1617 to 20
Range Spacing (m)1.2
Azimuth Spacing (m)2.4
Wind speed (m/s) *2.43.132.6
* On-line source for wind speed values: www.mareografico.it.
Table 2. Distances between AIS and SAR locations (Ship #12 and #18 are excluded since the wake-based azimuth offset estimation cannot be applied in these cases).
Distances<50 m<100 m<150 mMean Value (Standard Deviation) in Meters
d111%44%61%164 (157)
d244%78%100%67 (34)
d339%72%100%73 (37)

