Using Long-Term SAR Backscatter Data to Monitor Post-Fire Vegetation Recovery in Tundra Environment


1
State Key Laboratory of Geodesy and Earth’s Dynamics, Institute of Geodesy and Geophysics, Chinese Academy of Sciences, Wuhan 430077, China
2
Earth Science System Programme, The Chinese University of Hong Kong, Hong Kong 999077, China
3
Guangdong Provincial Key Laboratory of Geodynamics and Geohazards, School of Earth Sciences and Engineering, Sun Yat-Sen University, Guangzhou 510275, China
4
Southern Marine Science and Engineering Guangdong Laboratory (Zhuhai), Zhuhai 519000, China
5
Canada Centre for Mapping and Earth Observation, Natural Resources Canada, Ottawa, ON K1A 0E4, Canada
*
Author to whom correspondence should be addressed.
Remote Sens. 2019, 11(19), 2230; https://0-doi-org.brum.beds.ac.uk/10.3390/rs11192230
Submission received: 24 August 2019
/
Revised: 18 September 2019
/
Accepted: 21 September 2019
/
Published: 25 September 2019
(This article belongs to the Special Issue Advances in Remote Sensing of Post-fire Environmental Damage and Recovery Dynamics)
Abstract
:Wildfires could have a strong impact on tundra environment by combusting surface vegetation and soil organic matter. For surface vegetation, many years are required to recover to pre-fire level. In this paper, by using C-band (VV/HV polarization) and L-band (HH polarization) synthetic aperture radar (SAR) images acquired before and after fire from 2002 to 2016, we investigated vegetation change affected by the Anaktuvuk River Fire in Arctic tundra environment. Compared to the unburned areas, C- and L-band SAR backscatter coefficients increased by up to 5.5 and 4.4 dB in the severely burned areas after the fire. Then past 5 years following the fire, the C-band SAR backscatter differences decreased to pre-fire level between the burned and unburned areas, suggesting that vegetation coverage in burned sites had recovered to the unburned level. This duration is longer than the 3-year recovery suggested by optical-based Normalized Difference Vegetation Index (NDVI) observations. While for the L-band SAR backscatter after 10-year recovery, about 2 dB higher was still found in the severely burned area, compared to the unburned area. The increased roughness of the surface is probably the reason for such sustained differences. Our analysis implies that long records of space-borne SAR backscatter can monitor post-fire vegetation recovery in Arctic tundra environment and complement optical observations.
1. Introduction
Climate change is occurring rapidly at high latitudes, where surface air temperature has increased at twice the rate of the rest of the globe in the past several decades [1,2,3]. Such warming has resulted in pronounced environmental changes in the Arctic [4,5,6]. During that period, it has caused a dramatic increase in the frequency of large wildfires in boreal and tundra regions [7,8,9]. Wildfires strongly affect ecosystem in tundra environments, such as carbon balance of tundra [10,11], land surface albedo [12], active layer thickness change [13], vegetation shifts [14], permafrost thaw and thermokarst development [13,15], and even wildlife habits [16].
By burning surface vegetation and soil organic matter, fire can rapidly transfer large stocks of aboveground biomass and below-ground soil carbon to the atmosphere and change the ecosystem carbon balance in the short-term. Additionally, the surface albedo balance is also changed by burning some, or all, of the insulating layer of moss and soil organic matter, which shields the underlying permafrost from warm summer temperatures [12]. Then the active layer of burned zone is destabilized in summer, which may cause decomposition of deeper soil carbon stored below ground and results in additional carbon transfer to the atmosphere in the long-term after the initial combustion [17,18,19]. Thermokarst development induced by fire may accelerate the above process and results in carbon transfer to the atmosphere and to the tundra gully as dissolved organic carbon [20,21]. Since soil carbon underlain by permafrost in the Arctic is nearly twice the total amount of carbon as is in the atmosphere [22,23], increased fire frequency and severity in Arctic tundra could act as positive feedback to global climate warming [24].
Wildfire regimes could exert landscape-scale controls on vegetation structure and composition [25]. Wildfire also directly affects seedling recruitment success and migration [26]. Fire may alter vegetation successional trajectory and prepare seedbeds for shrub or tree invasion. Therefore, increased fire frequency and severity in Arctic tundra is expected to facilitate both shrub expansion and tree migration [25,27]. Wildfires also consume caribou forage lichens and exert strong effects on post-fire lichen recovery for decades [28]. Such a change in successional trajectory could alter the structure of the vegetation and ecosystem functions, the ecosystem may undergo a regime shift into an alternate state, and ecosystem services may be degraded [29].
Thus, information on post-fire vegetation regrowth in tundra is of great interest for scientists and land managers dealing with environmental issues (e.g., carbon budget, climate impact, ecosystem services). For monitoring post-fire vegetation recovery in expansive and remote tundra area, satellite remote sensors could be suitable tools to conduct the temporal analysis, since they are suitable to continuously collect data for long-term monitoring and temporal analysis in a large area. Tanase et al. [30] suggest that the suitability of remote sensing data is determined by two factors: (a) sensitivity to the changes in radiometric response due to the development of vegetation and (b) the spatial resolution of satellite imagery, which provides the ability to identify the features of the response patterns.
Normalized Difference Vegetation Index (NDVI) images derived from optical satellite observations have been most frequently used measurements for monitoring, analyzing, and mapping vegetation changes in time and space. However, NDVI is more sensitive to changes in leaf area than to changes in structure and overall biomass. The relationship between NDVI and leaf area index (LAI) varies both seasonally and inter-annually. Furthermore, NDVI saturates at high values of LAI [31]. This implies that NDVI is only sensitive to vegetation development in the first few years after fire disturbance. In a study on arctic tundra fires recovery by NDVI, Barrett et al., [14] showed that NDVI quickly recovered to the range of pre-fire level in 3 years.
Imaging radars may have the potential to complement traditional optical data in mapping vegetation recovery in the terms of vegetation structure [32,33,34,35,36,37,38,39], because the radar backscattered signal is highly sensitive to structural properties of the vegetation. In addition, radar sensors have all-weather, and day and night observing capability (independent of solar radiation). Furthermore, as long as more than 25 years’ archives of spaceborne synthetic aperture radar (SAR) data and planned future SAR missions, as well as global coverage, provide potential to monitor post-fire vegetation recovery in Arctic tundra.
The radar backscatter from vegetation is the result of complex interactions between microwave electromagnetic energy and the ground and vegetation scattering components in a resolution cell. The intensity of backscatter from vegetation depends on several factors: (1) the amount and geometric properties of vegetation on site, (2) surface dielectric and roughness properties, and (3) radar frequency, polarization, and look direction [40,41,42]. Generally, due to the penetration capability, short wavelengths of 2–6 cm, such as X-band mostly interact with leaves/needles, twigs, and small branches, and C-band mostly interacts with leaves and small secondary branches [43]. In contrast, long wavelengths of approximately 24 cm, such as L-band, radar waves interact mostly with primary branches, tree trunks, and even underground surface [41]. There is an approximately linear response of backscatter to increasing forest biomass reaching saturation as a function of forest type and structure [42]. Therefore, radar backscatter is expected to change before and after a fire, as the fire removes most of the vegetation components and may leave the ground or tree trunks exposed. Specifically, the backscatter increases with burn severity for L-band at HH polarized (SAR data acquired under wet condition) [44], and for X- and C-bands at HH and VV polarizations, while the backscatter decreases with burn severity for all frequency at cross-polarization [45]. The backscatter increases with incidence angle at co-polarization and decreases with incidence angle at cross-polarization in burned sites [45]. For example, using C-band SAR (HV polarization), previous studies show 3–6 dB increase in backscatter coefficients between fire scars and adjacent undisturbed forest and seasonal changes in backscatter coefficients in a burned forest [30,43].
Although SAR data usage for forest recovery after wildfires is well studied, it is limited used for tundra vegetation recovery. Using L-band HV data, it is estimated that approximately 40–50 years are required for the recovery of forest structure after disturbance [30]. The effects of wildfire on tundra vegetation are poorly studied by using SAR data. As post-fire vegetation regrowth in tundra environment was mostly investigated by fieldwork periodically [8,16,25,46], or projection based on post-fire soil biota [26], remotely sensed data are rarely used [14]. Using nearly two-decades ERS-1/2 C-band dataset (VV polarization), Jenkins et al. [47] demonstrated the capability of SAR backscatter in detection and monitoring of fire disturbance in the Alaska tundra. The study suggested that there was a 3-dB backscatter coefficient increase between burned and unburned area, and also four to five years of landscape recovery was observed by SAR backscatters.
The objective of this study is to monitor post-fire vegetation recovery in Arctic tundra environment by using long-term SAR backscatter data. In this study, we not only use C-band dataset but also L-band dataset. Compared to NDVI information, radar backscatter information provides new insights on vegetation recovery regarding the structure and density [30,48].
2. Materials and Methods
2.1. Study Area
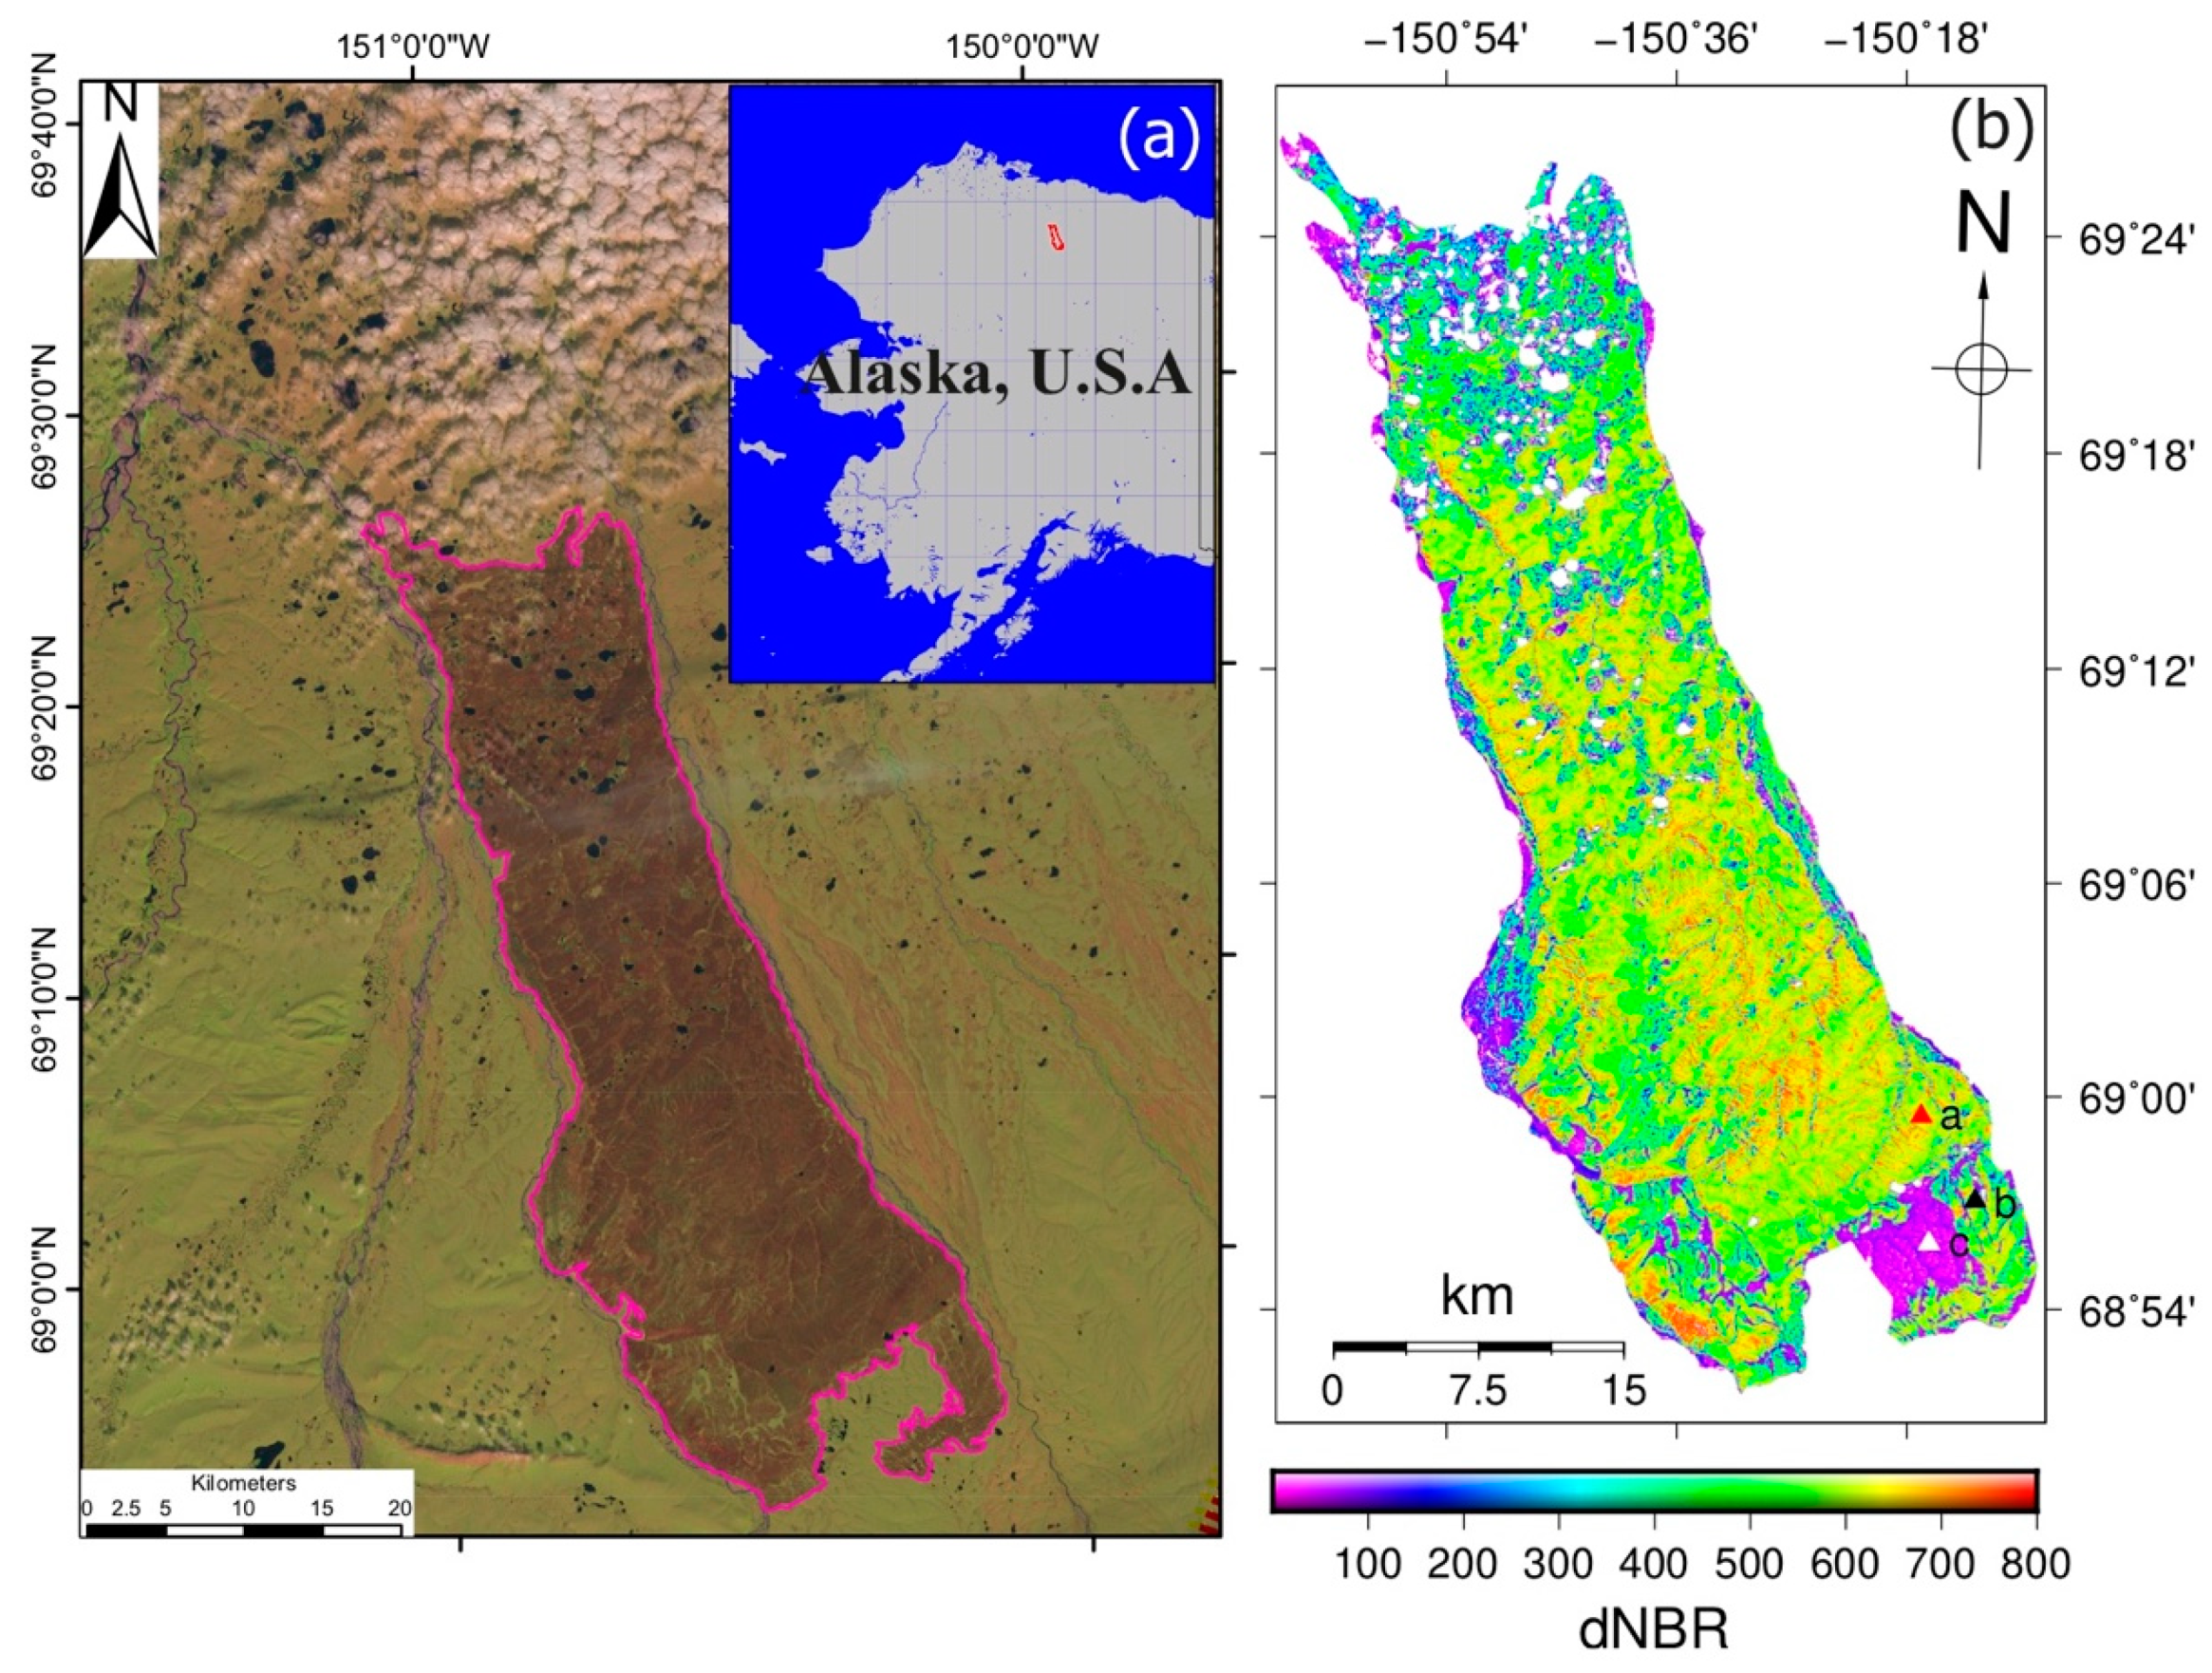
The Anaktuvuk River Fire (ARF) burned 1039 km2 of Arctic tundra on the North Slope of the Brooks Range in the late summer and early fall of 2007. Figure 1a shows the fire perimeters obtained from the Alaska Interagency Coordination Center Large Fire Database [49]. This fire has an order of magnitude larger than the average fire size in the historic record for the North Slope [16]. The ARF resulted in the release of approximately kg of carbon to the atmosphere, an amount similar in magnitude to the annual net carbon sinks for the entire Arctic tundra biome averaged over the last quarter of the twentieth century [10]. The fire occurred primarily in the Arctic Foothills physiographic province of the North Slope, where the ecosystem is described as upland, shrubby tussock tundra. The climate in the central North Slope is cold in winter (−25 °C mean high in January) and relatively cool in summer (20 °C mean high in July, vegetation growing season). The mean annual temperature and precipitation of this study area are −10 °C and 30 cm, respectively [10,16].
Figure 1b shows differenced Normalized Burn Ratio (dNBR) calculated from a pair of pre-fire Landsat Enhanced Thematic Mapper-plus (ETM+) image acquired on 30 June 1999, and post-fire Landsat Thematic Mapper (TM) image acquired on 14 June 2008 [50]. The dNBR values indicate burn severity within the fire boundary: 11% of the area did not burn (dNBR < 300), while within the burned area, approximately 47% of the ARF burned at high severity (dNBR > 600) and 35% and 18% at moderate to low severity (300 < dNBR < 600) [16]. Three sites located in severely and moderately burned, and unburned area were chosen to examine the SAR backscatter change before and after fire (Figure 1b). These three sites were placed less than 7 km away to each other and had similar pre-fire vegetation features [51].
Prior to the fire, 54% of the burned area was classified as upland moist acidic tundra (soil pH < 5.5), 15% as moist nonacidic tundra (soil pH > 5.5), and 30% as shrubland [16]. The vegetation in the burned area is dominated by the tussock-forming sedges [50]. The dominant shrub types include willow, dwarf birch, Labrador tea, blueberry, and prostrate shrubs lowbush cranberry, bearberry, and crowberry [16].
2.2. Remote Sensing Data
We only used SAR amplitude images acquired by C-band from the European Remote Sensing-2 (ERS-2) and RADARSAT-2 (RS-2) satellites, L-band from Advanced Land Observing Satellite-1/2 (ALOS-1/2) Phased Array-type L-band SAR (PALSAR) sensors. To compare the difference of SAR amplitude before and after the fire, these images were acquired from 2002 to 2017, with different incidence angles and polarization modes (Table 1). The ERS-2 and ALOS-1 PALSAR datasets contain images acquired before and after the fire, and the RS-2 and ALOS-2 PALSAR datasets spanned nearly 10 years after the fire. ERS-2, RS-2, and ALOS-1 PALSAR Level-1.5 Geo-referenced amplitude SAR images used in this study were provided by the Alaska Satellite Facility (ASF) [52].
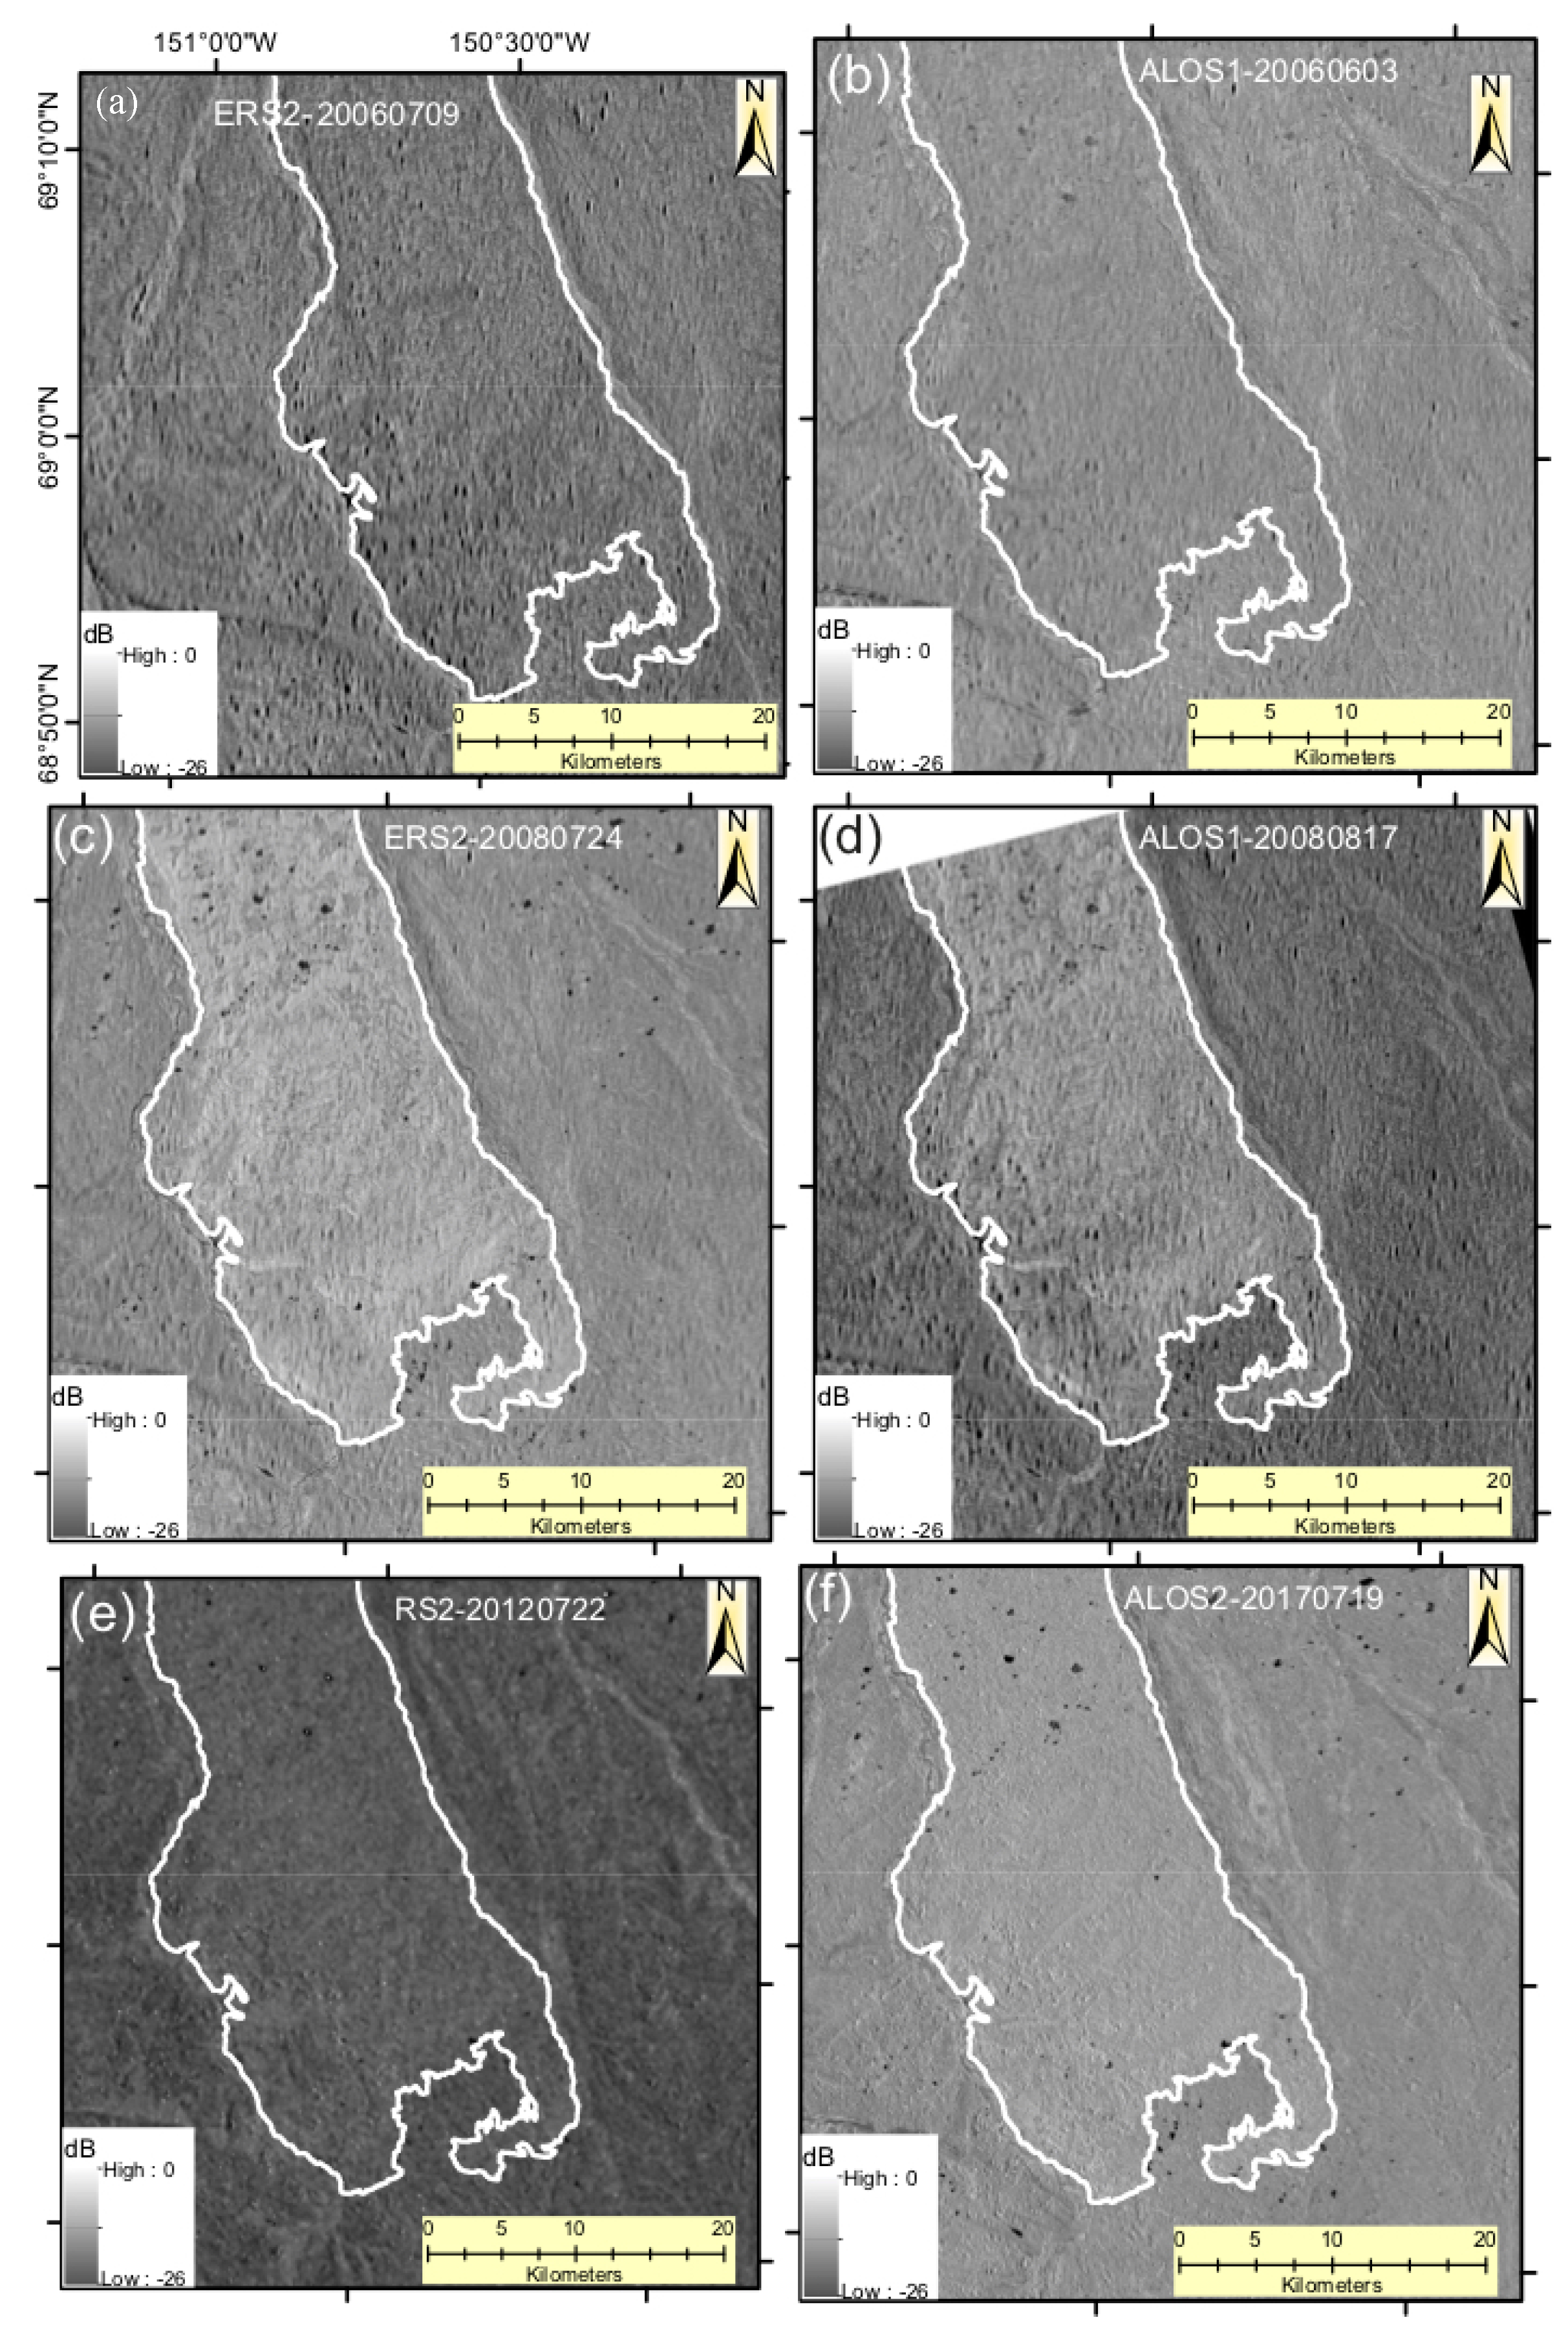
All SAR images were firstly radiometrically calibrated and then radiometric variability associated with topography corrected using a Digital Elevation Model (DEM). Next, speckle noise was reduced by using a 3 × 3 window Lee filter. Finally, all SAR images were geocoded to WGS-84 projection. The ERS-2 and ALOS-1 images were processed by the MapReady package (v3.1.24) [53]. The RS-2 and ALOS-2 were processed by the Sentinel Application Platform (SNAP, v5.0). The resulting images were calibrated to sigma nought (, backscatter coefficient) format. A 30 m ASTER DEM was used for radiometric terrain correction caused by local terrain variability in both MapReady and SNAP. Figure 2 shows a series of SAR backscatter coefficient images in both C- and L-bands that spanned the period of before and after the fire. Before the fire, there was no difference in backscatter between the burned and unburned areas (visually represented by brightness in Figure 2a,b). An obviously brighter (increased backscatter) fire scars can be observed in the burned area in 2008 in both the C- and L-band SAR images (Figure 2c,d). Moreover, fire scars become lighter five years after the area burned in C-band (Figure 2e) and after 10 years in L-band SAR (Figure 2f).
Due to the inherent speckle noise caused by the nature of the SAR systems, a single pixel of SAR data should not be used to directly relate to field variable. Instead, a group of pixels in azimuth and range direction (called multi-looking process) are usually averaged to mitigate speckle noise. In this study, for all C- and L-band data, a mean of approximately 150 m × 150 m (e.g., 3 × 3 and 12 × 12 looks in both azimuth and range direction for RS-2 and ALOS-1 based on the spatial resolution) area centered on the unburned, moderately burned, and severely burned sites are chosen as the control, moderate, and severe burn sites, respectively (see their locations in Figure 1b). Five-year (2002–2007) pre-fire data were used to compare with 6-year (2008–2010, 2014–2017) post-fire data.
To aid the interpretation of changes of SAR backscatters, NDVI of the whole fire zone and soil moisture collected from the severely burned, moderately burned, and unburned zones are used as ancillary information. We used the NDVI products generated from the Moderate Resolution Imaging Spectroradiometer (MODIS) and distributed by the Land Processes Distributed Active Archive Center (LP DACC) of NASA/USGS [54]. More specifically, the MOD13 Q1 products obtained during growing seasons (June, July, and August) from 2002 to 2016 were used. The accuracy of this product is now within ±0.025, and the derived NDVI accuracy is within ±0.025 [55]. We chose these days because mid-July is close to the end of the growing season. The MOD13 Q1 product is a global product with a spatial resolution of 250 m and a temporal interval of 16 days.
2.3. SAR Backscattering Mechanisms before and after a Fire
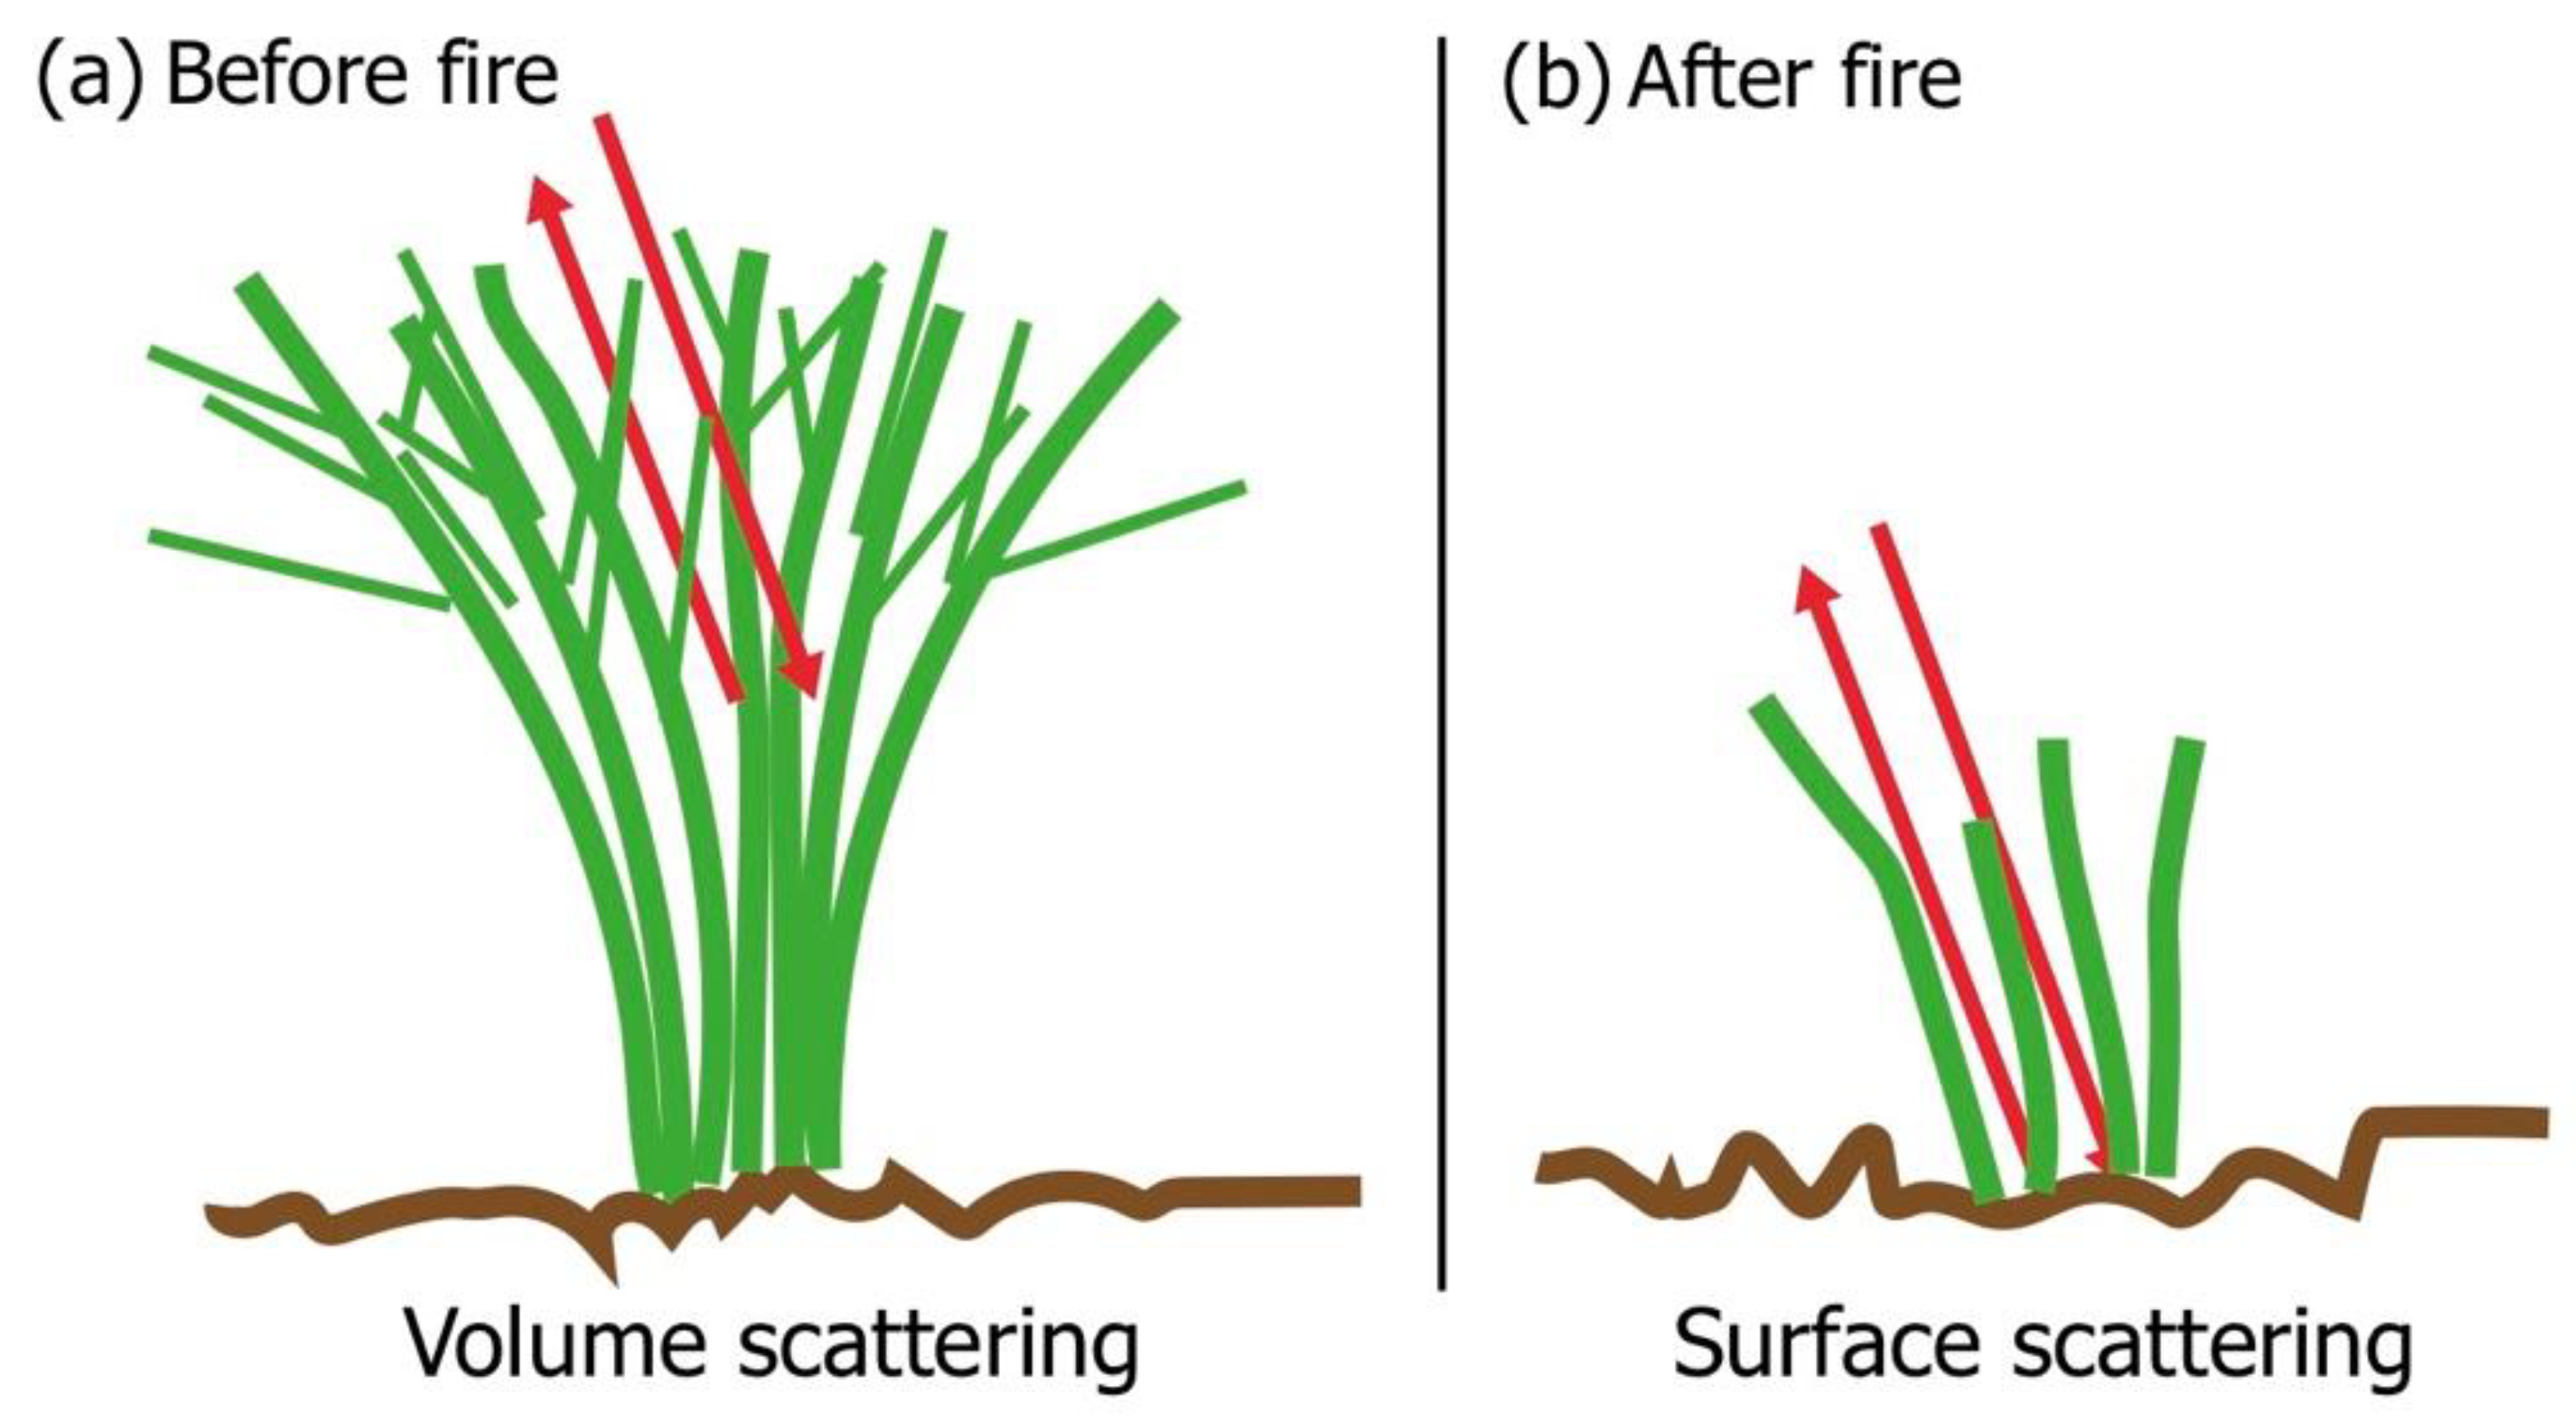
In order to evaluate the sensitivity of radar backscatter to the post-fire vegetation regrowth, it is important to identify the dominant scattering mechanisms before and after a fire. Figure 3 illustrates the dominant backscatter scattering mechanisms in tundra environment, including pre-fire volume scattering (Figure 3a) and post-fire surface scattering (Figure 3b) [43]. Before a fire, the C-/L-band radar waves interact with the canopy of the tussock-forming sedges, in this case, most of the C-/L-band radar backscatter originates from the volume scattering with the canopy layer (Figure 3a). Thus, the backscatter is more sensitive to canopy changes than the changes of ground moisture and roughness. After a fire, the vegetation and/or part of organic soil are burned, leaving the ground exposed. In this case, radar waves primarily interact with the ground surface (Figure 3b). In such case of surface scattering, the backscatter strongly depends on the roughness and soil moisture content of the ground. In a few years after a fire, the radar waves interact more and more with newly regenerated vegetation. Then the effects of soil moisture and roughness on backscatter gradually diminish because of the attenuation due to the growing vegetation. Once the vegetation density and structure reach the pre-fire level, the volume scattering becomes the dominant mechanism again (Figure 3a).
3. Results
3.1. NDVI Changes
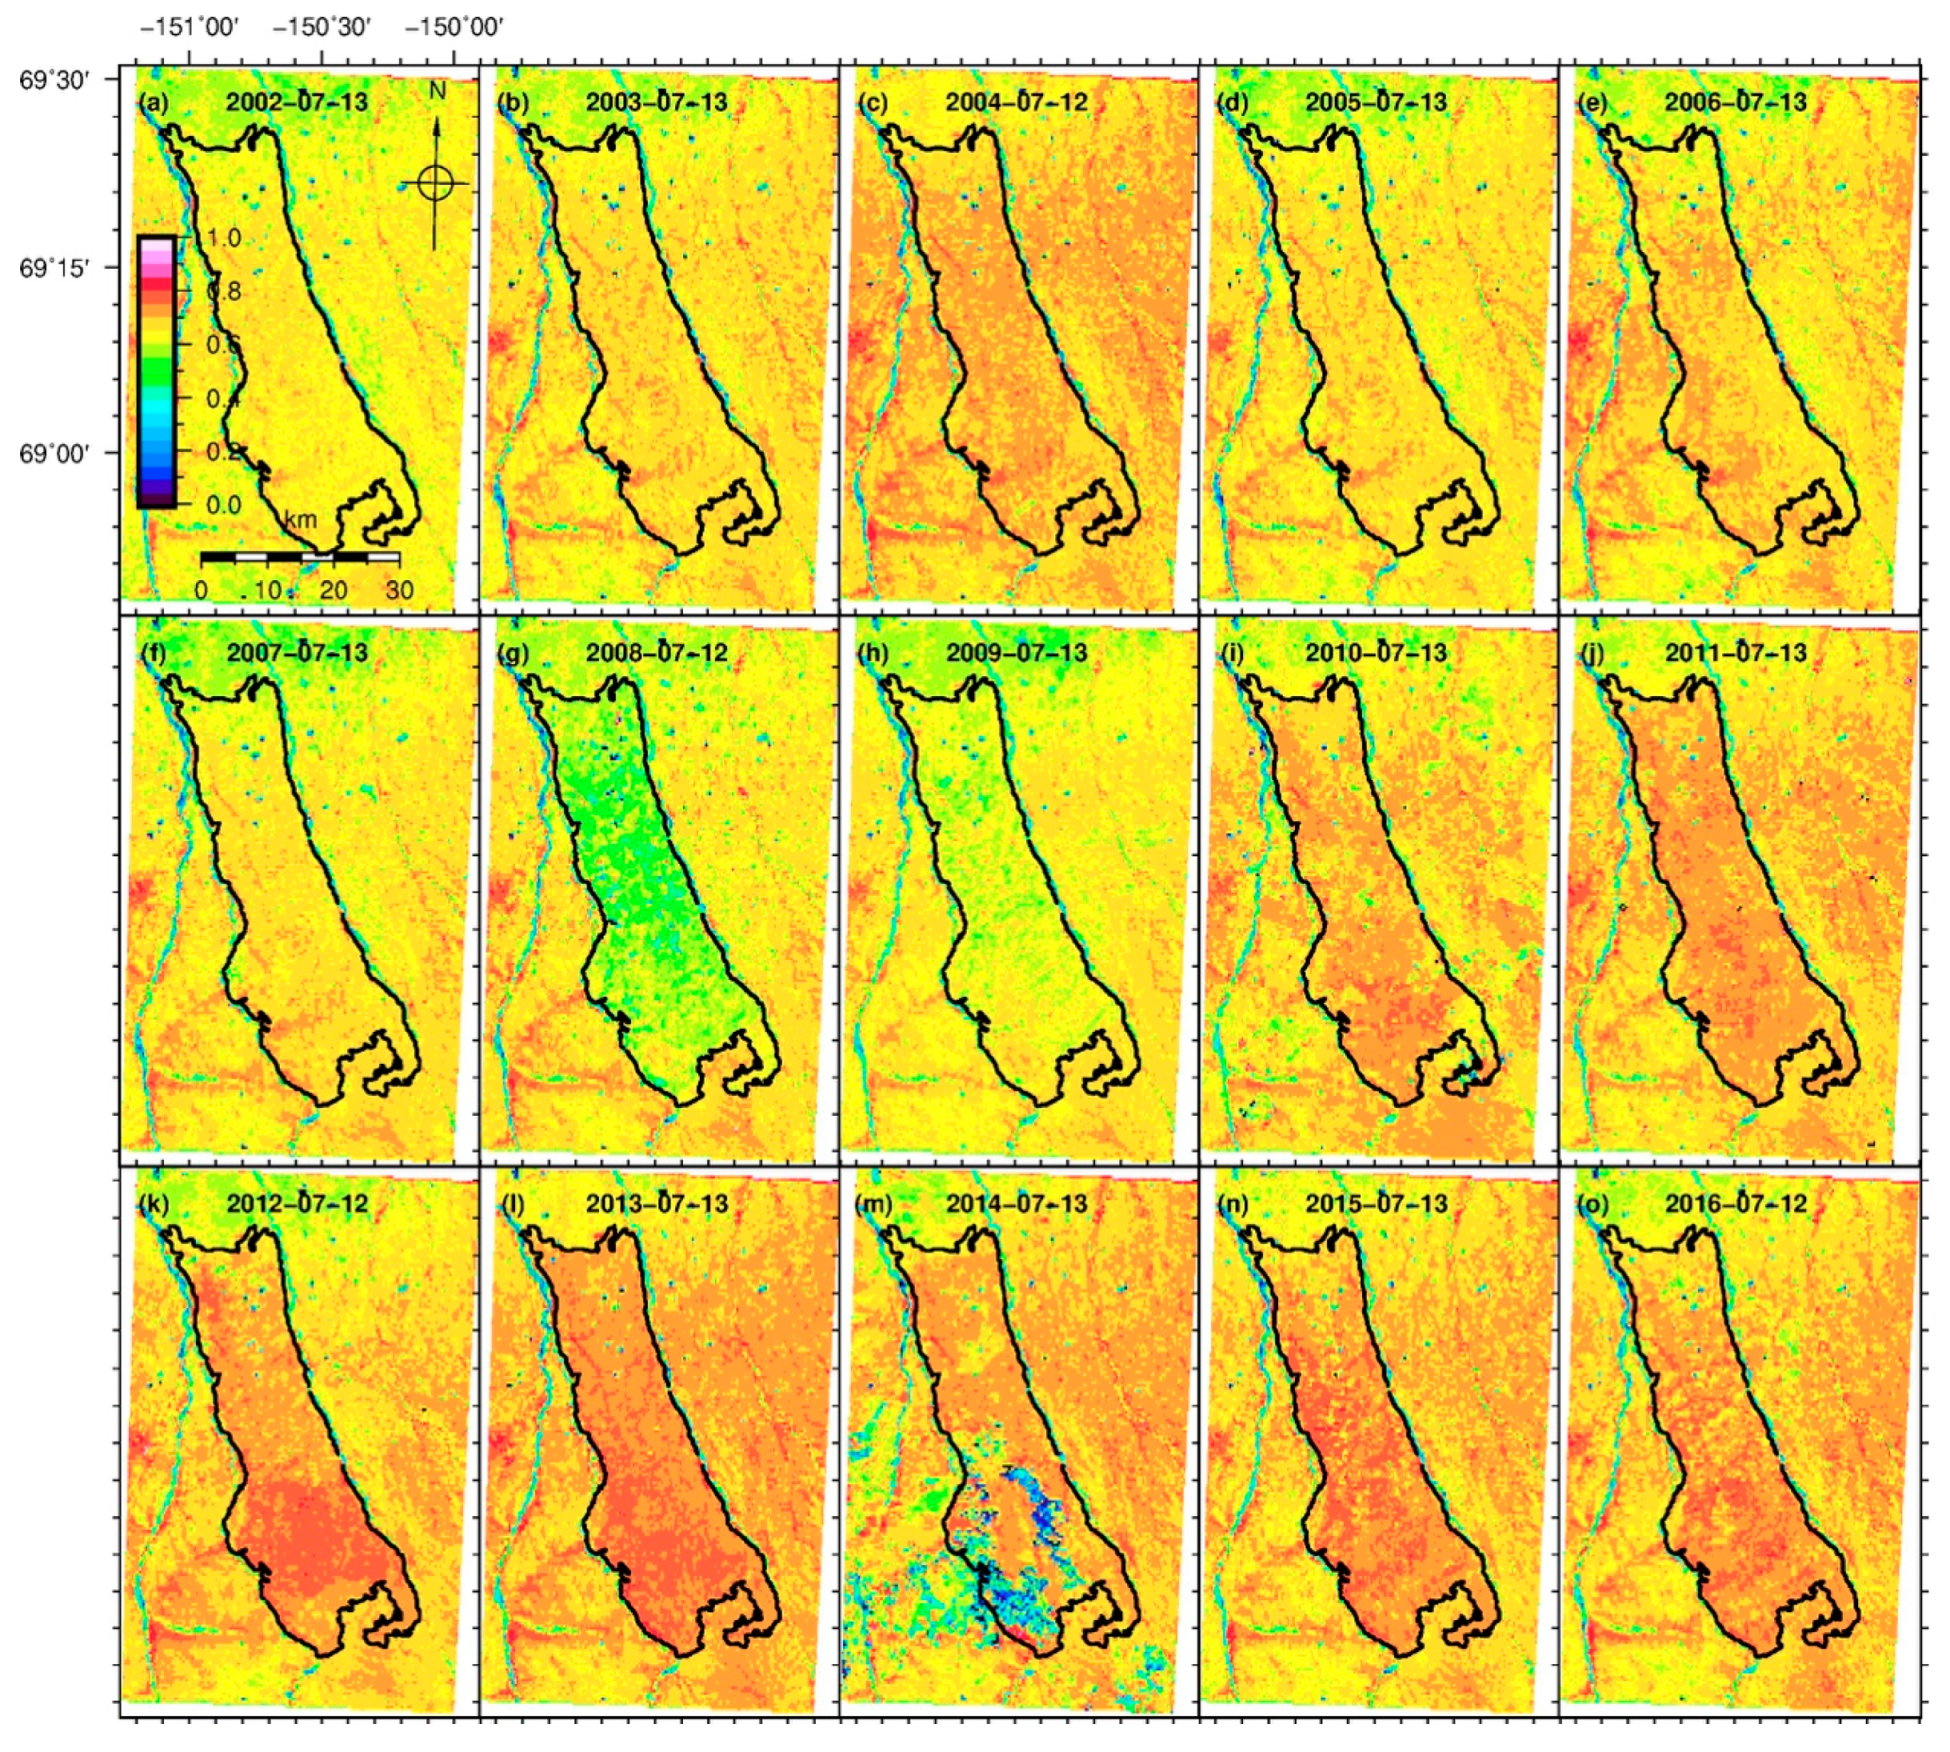
Figure 4 shows the NDVI on 12 or 13 July between 2002 and 2016. Generally, sparse vegetation may result in moderate NDVI values (approximately 0.2–0.5). High NDVI values (approximately 0.6–0.9) correspond to dense vegetation. A clear decrease of surface greenness can be observed following the ARF in 2007 (Figure 4g), and the greenness quickly recovered by 3 years after the fire (Figure 4i).
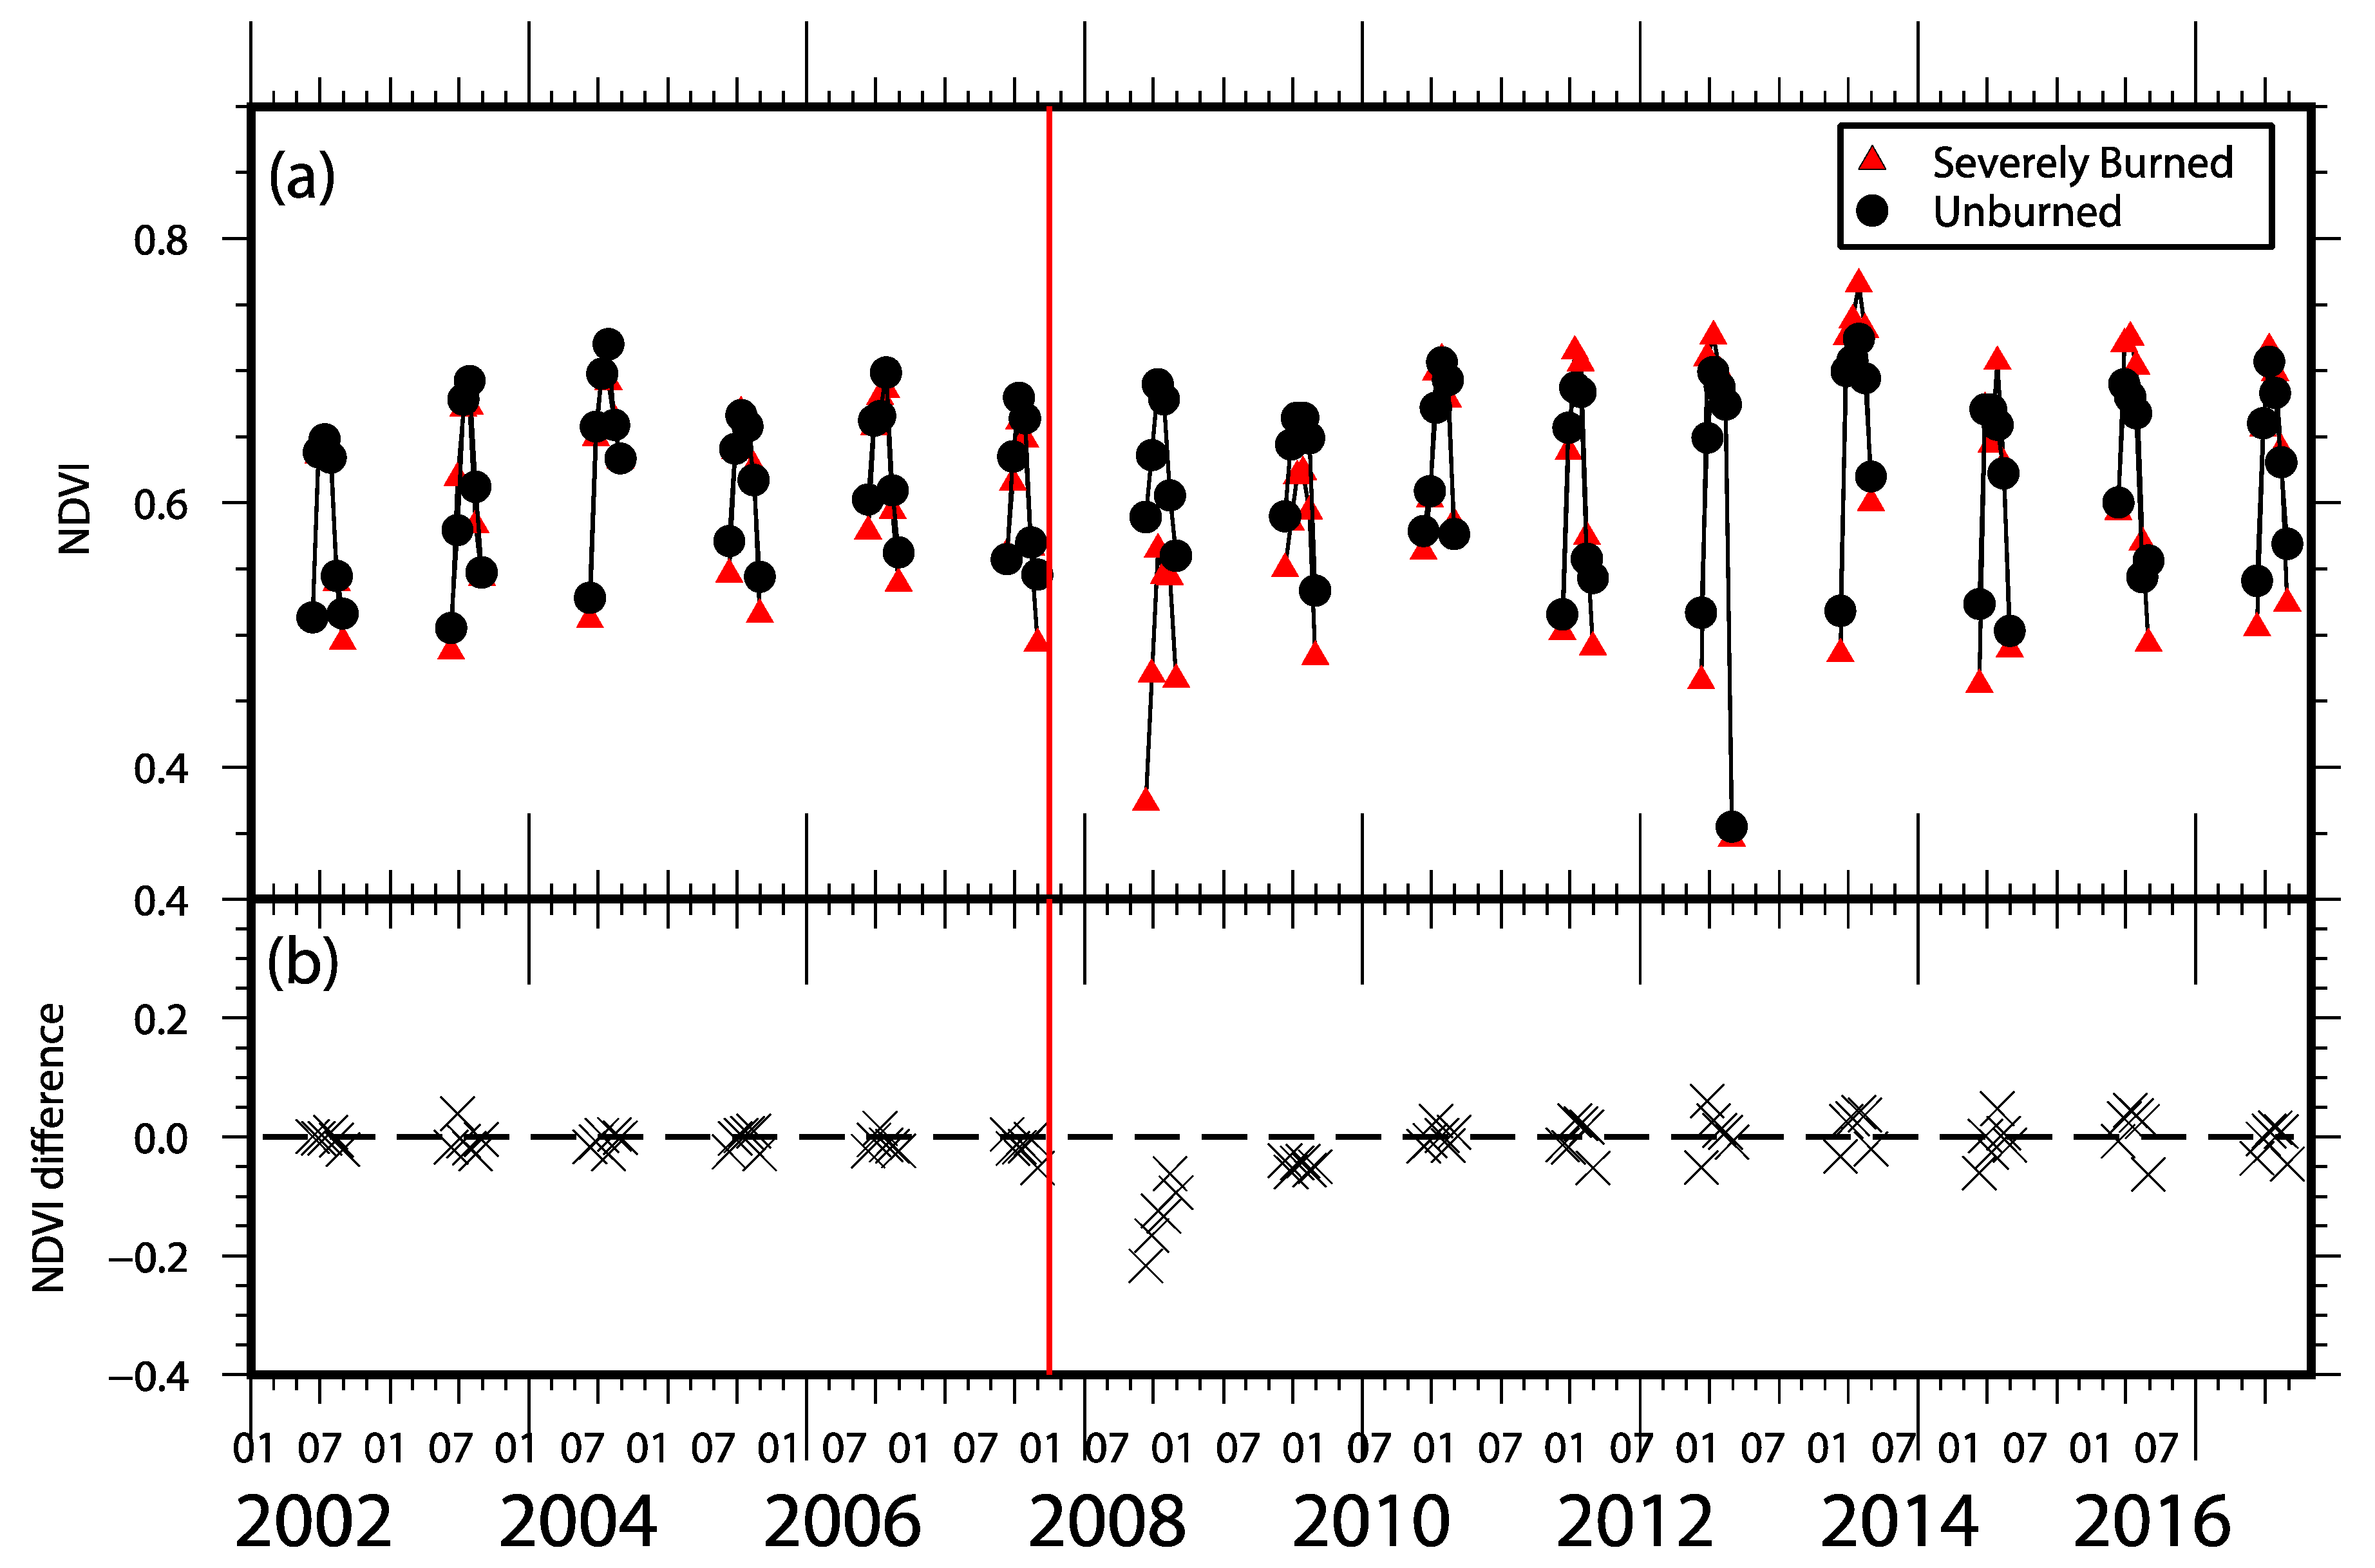
Figure 5 presents a quantitative analysis of NDVI changes at the severely burned and unburned sites. Each site presents an area of approximately 1.25 km × 1.25 km. At both sites, NDVI showed a clear growing pattern (between 0.5 and 0.7) and reached the highest value in mid-July or early August (Figure 5a). The pre-fire NDVI values were similar at both sites. After the fire, an obvious reduction of NDVI can be observed at the burned site in 2008 (Figure 5a), and the difference between the severely burned and unburned sites was up to 0.2 (Figure 5b). Then a quick recovery occurred in the subsequent 3 years. The post-fire NDVI difference reached zero again from 2010 onward.
3.2. SAR Backscatter Changes
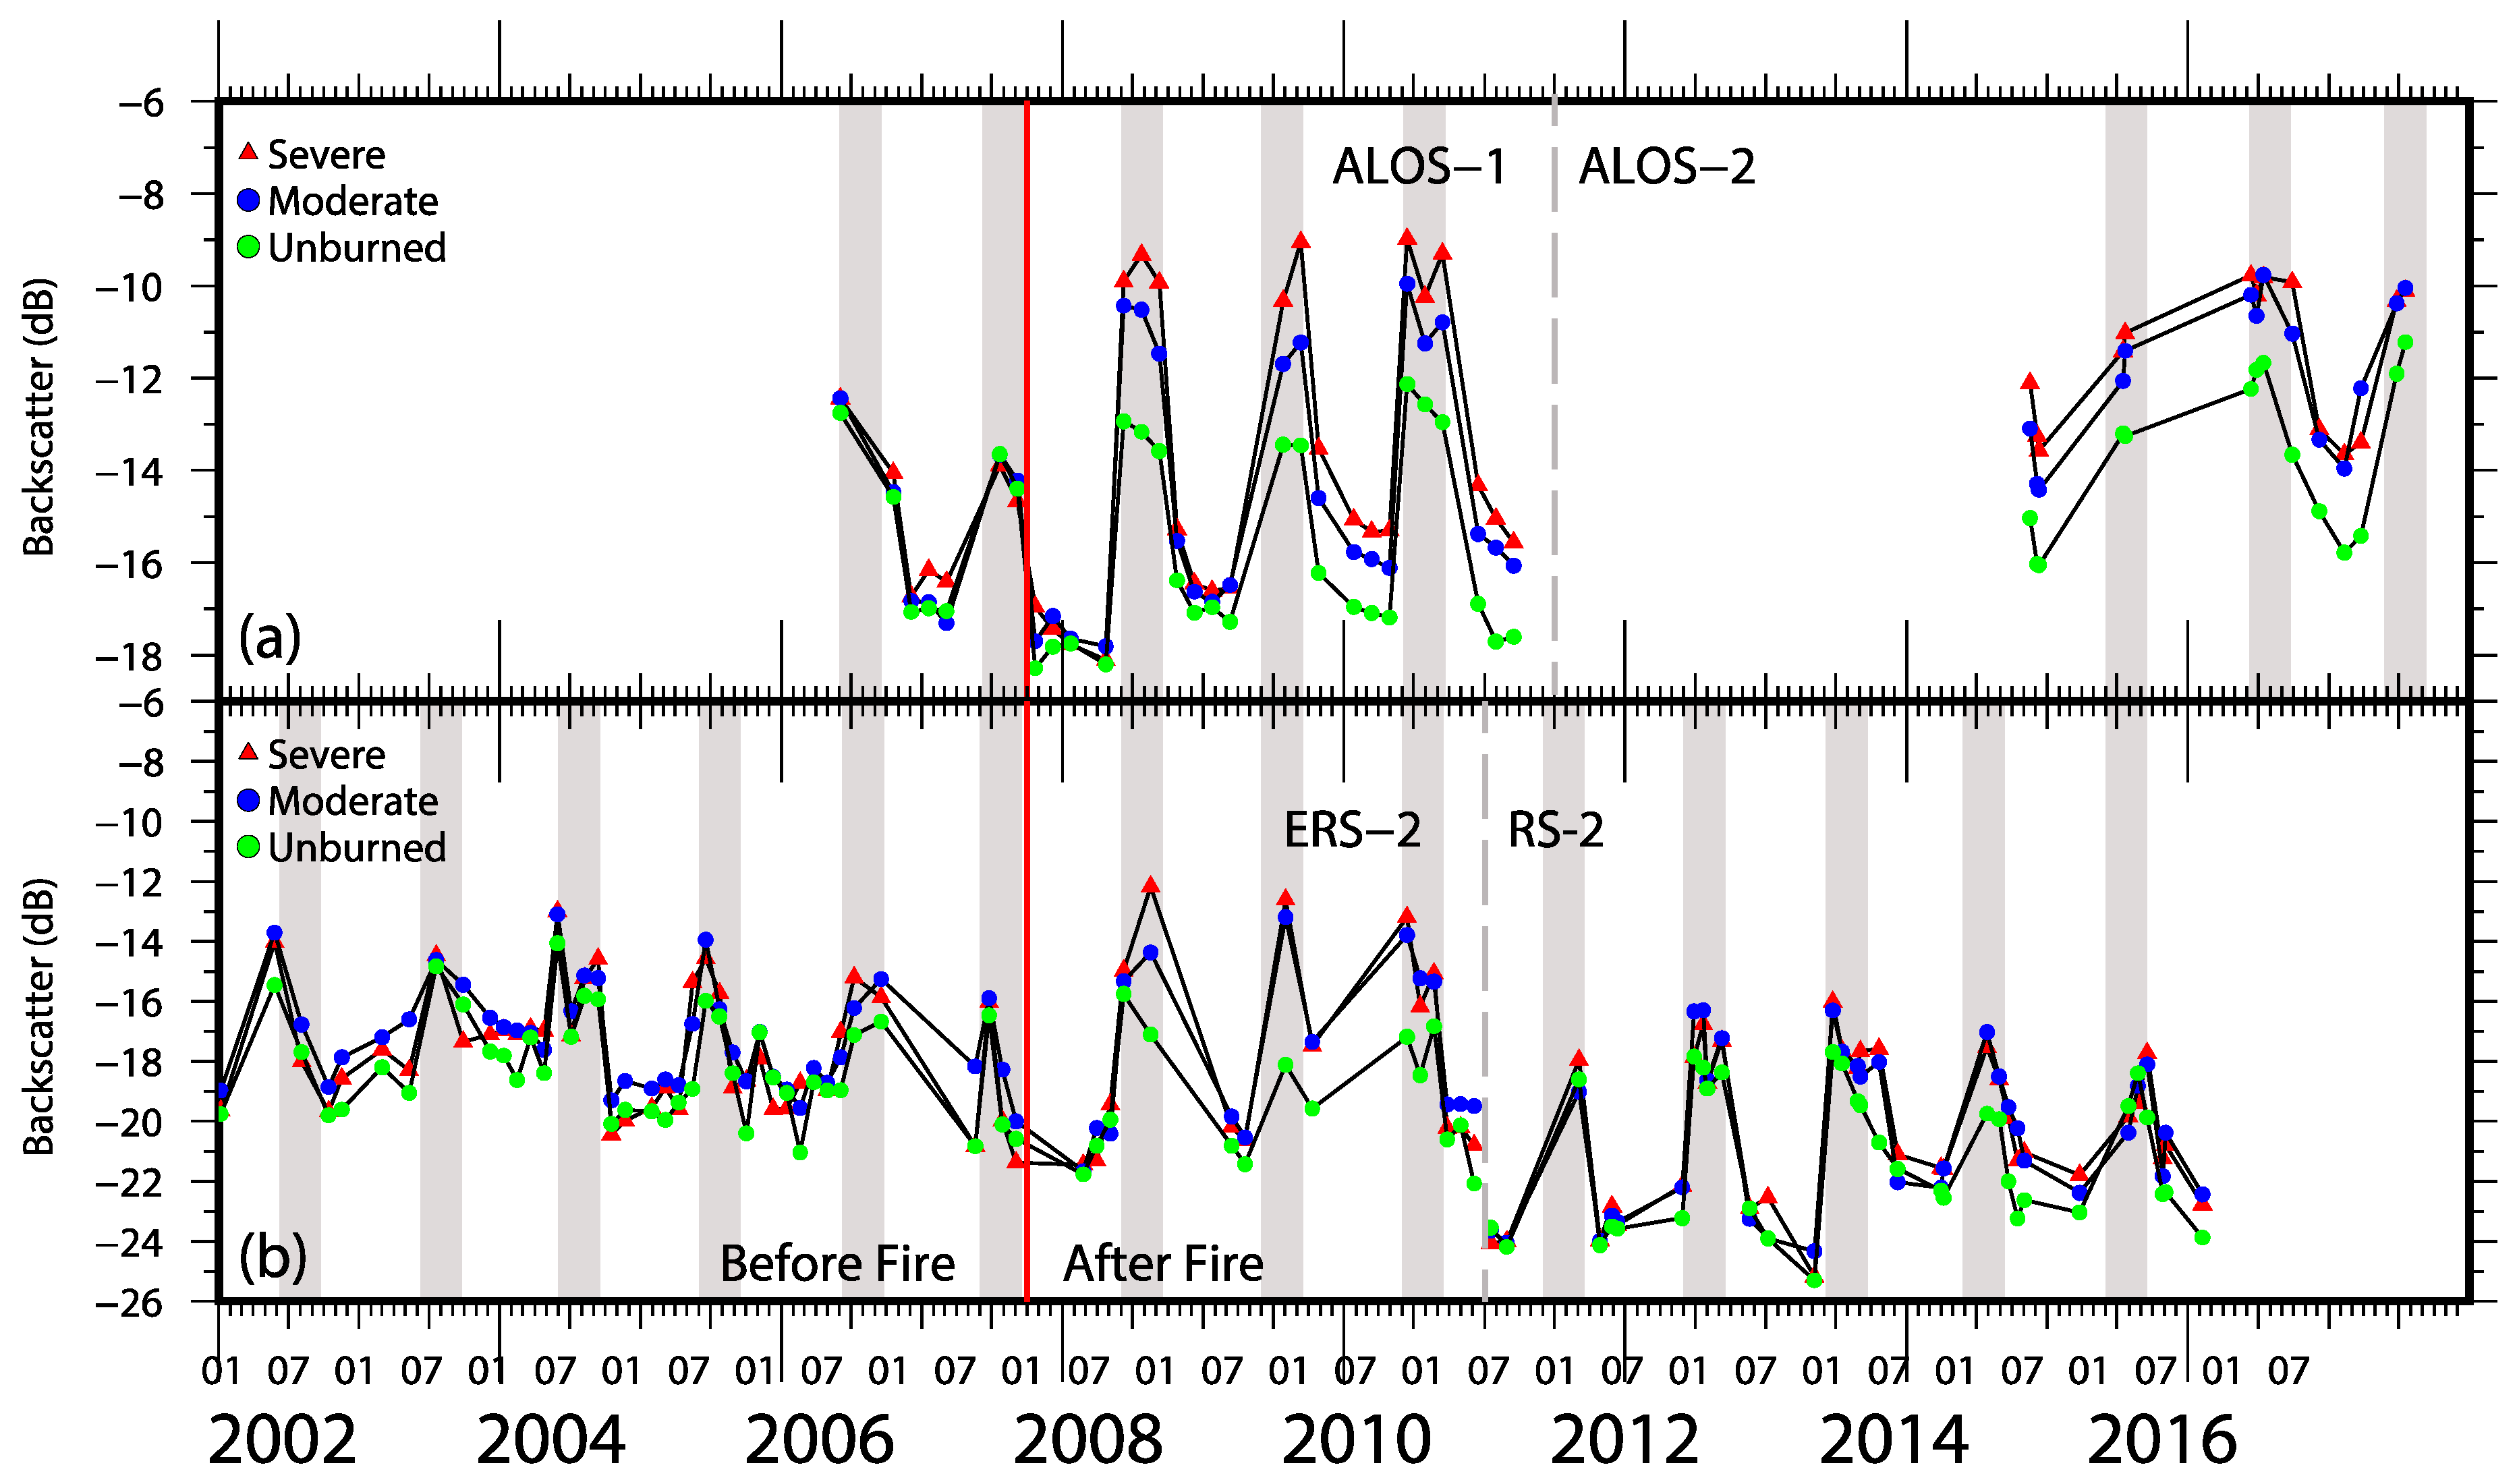
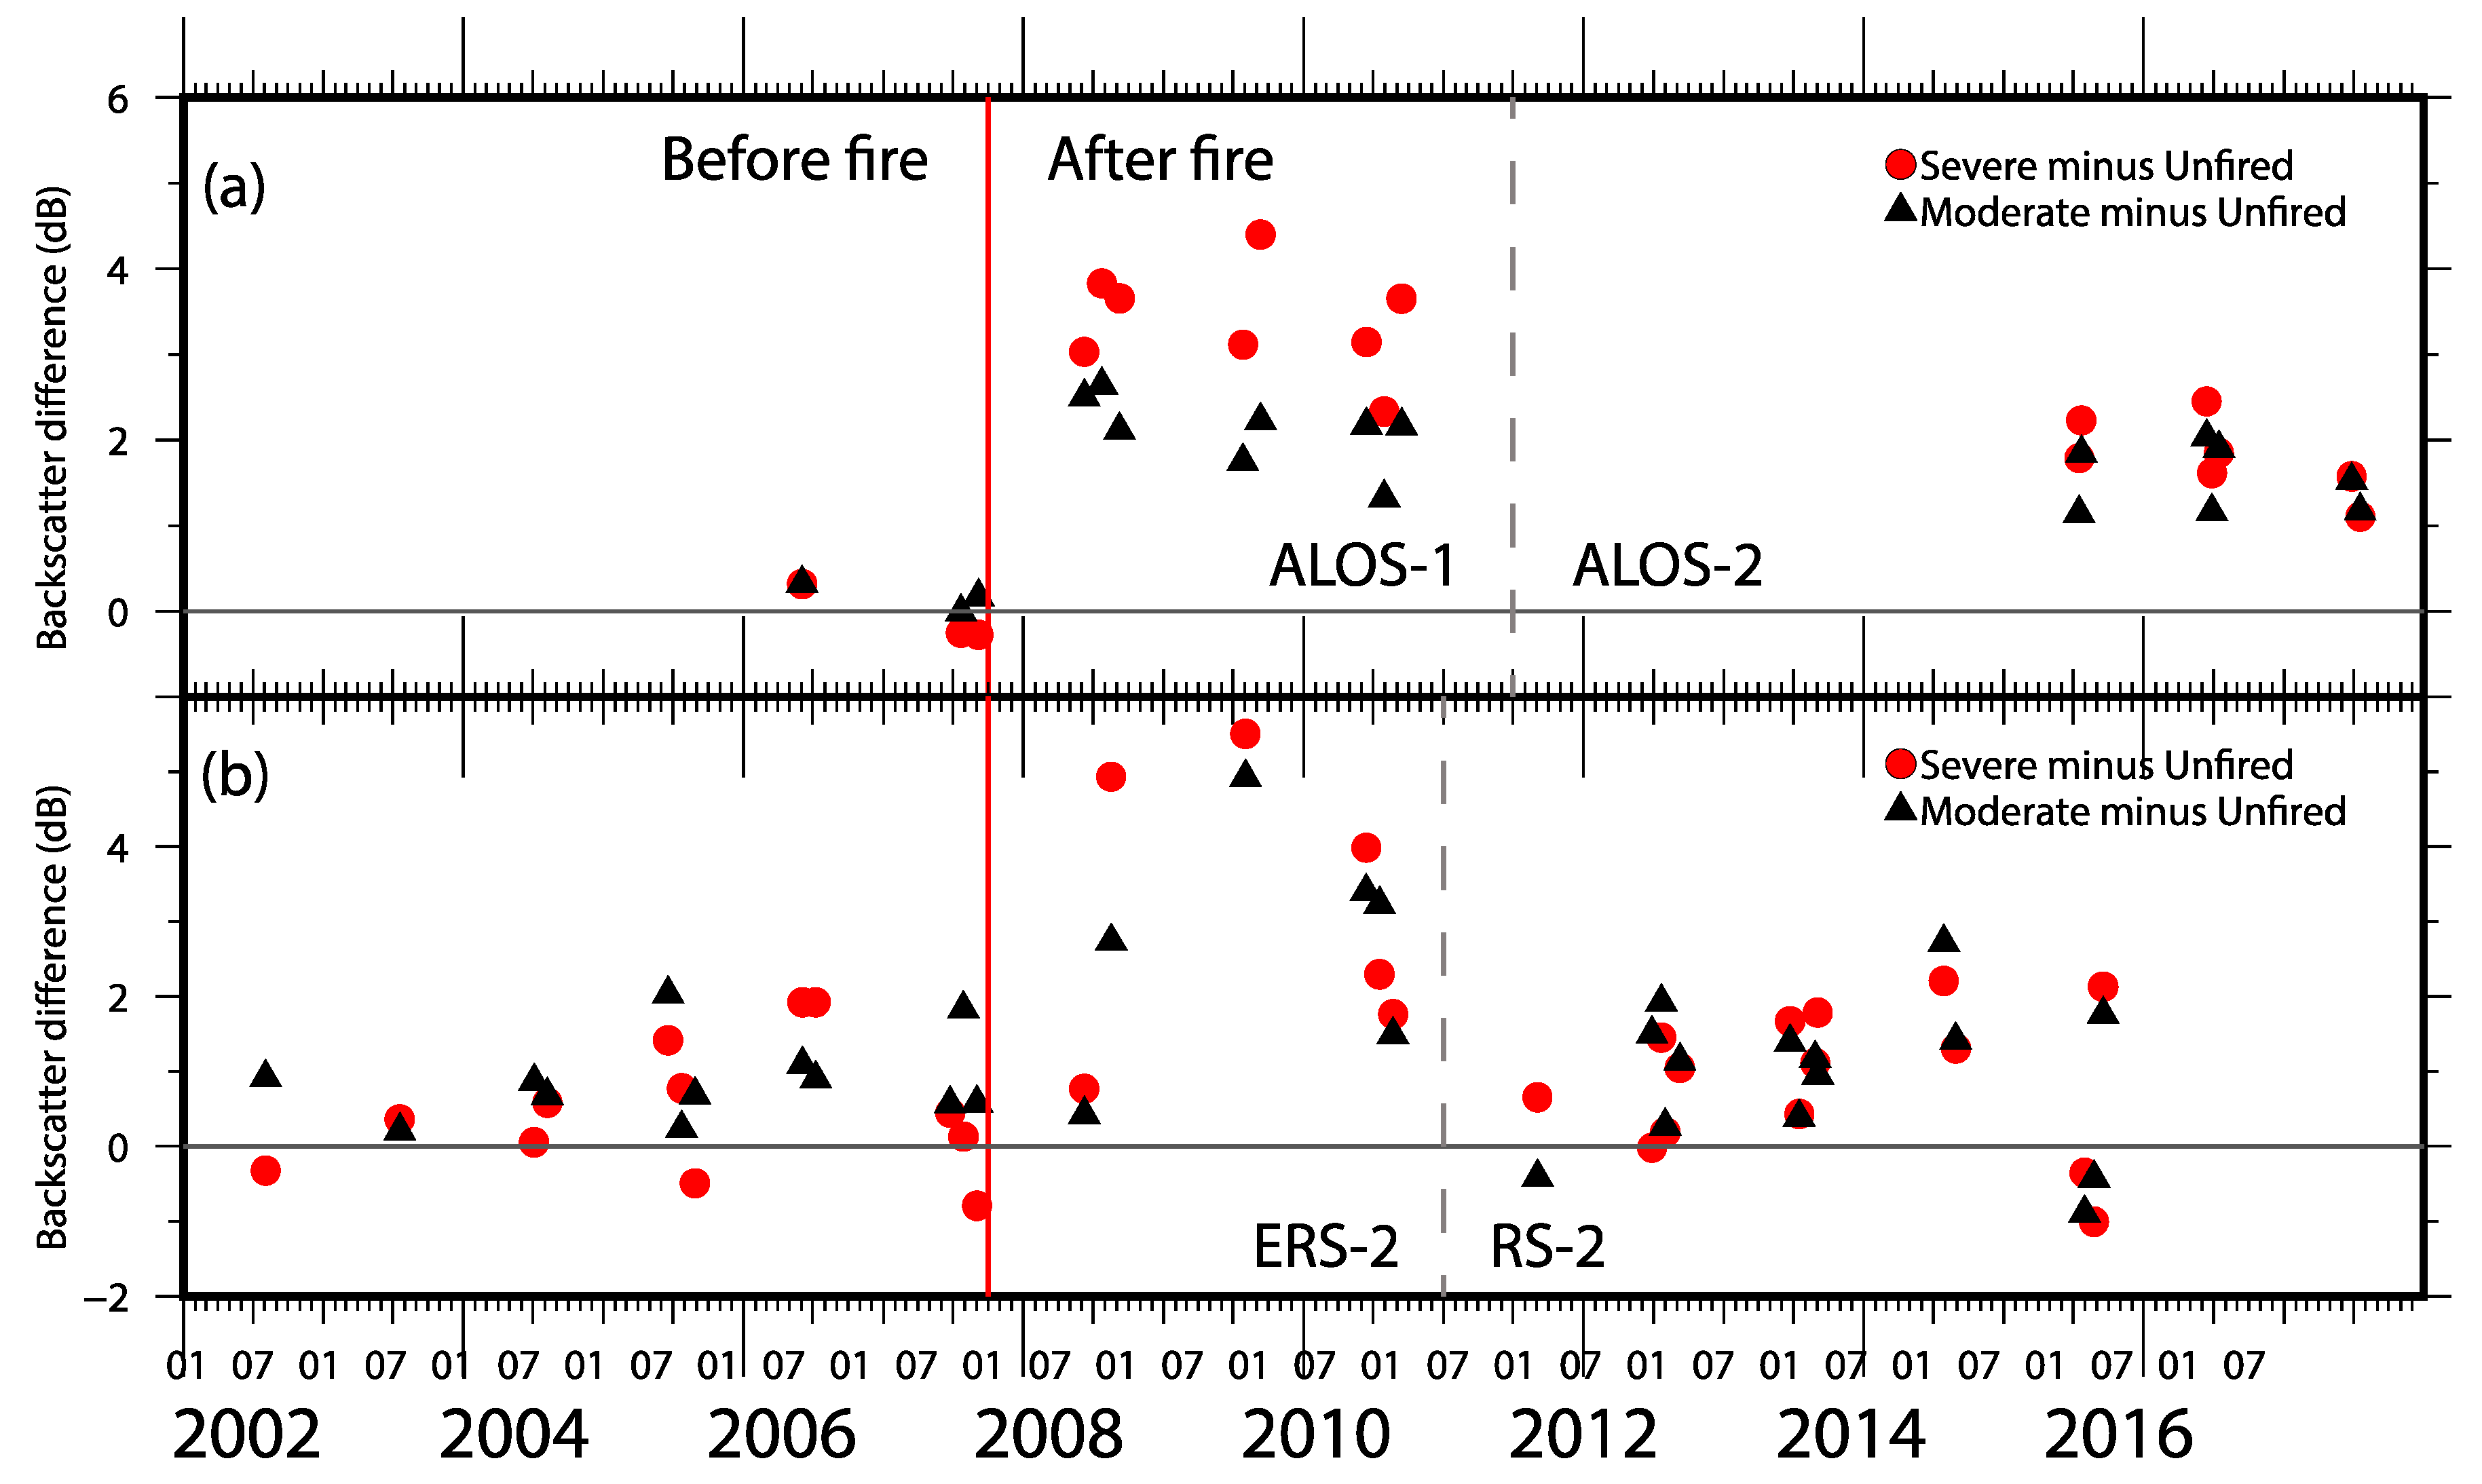
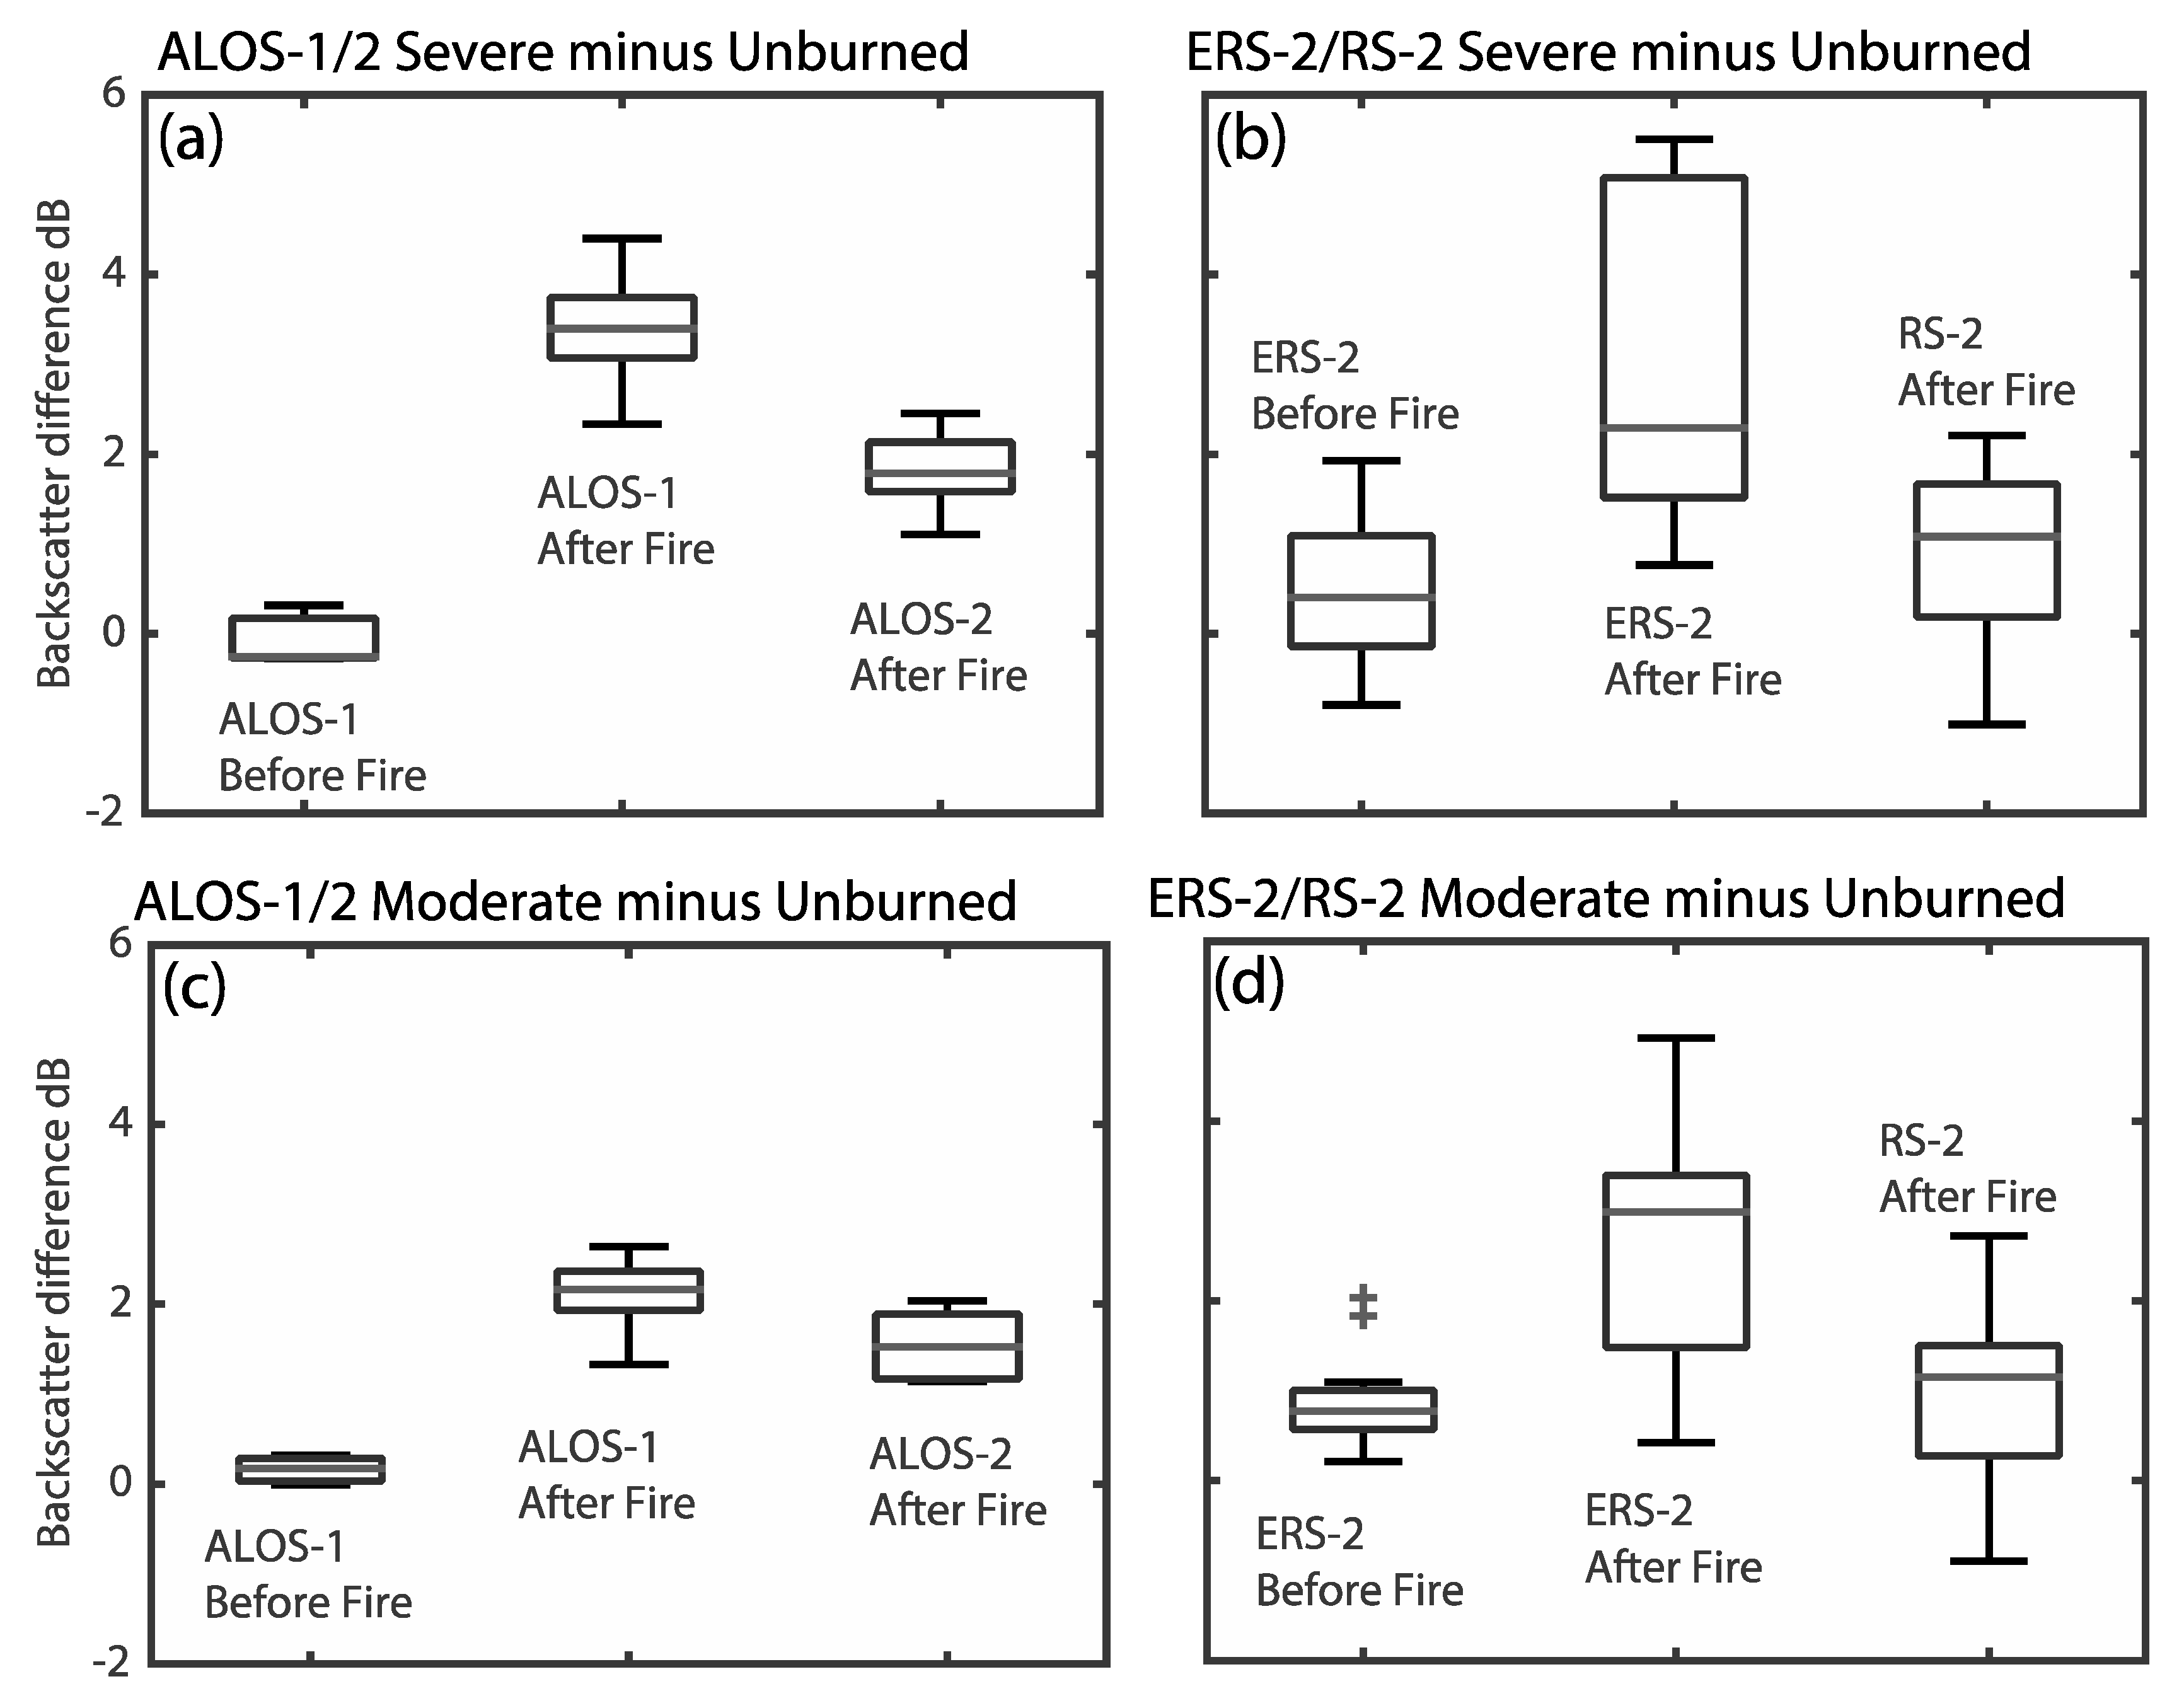
In Figure 6, we present plots of mean SAR backscatter pre- and post-fire trend. Figure 7 shows C- and L-band backscatter difference (only in growing season) between burned and unburned, and its corresponding statistics analysis is plotted in Figure 8. Similar annual and inter-annual temporal trend can be observed for all sites and bands. The backscatter coefficient changes seasonally from −18 dB to −9 dB for L-band (Figure 7a) and from −25 dB to −12 dB for C-band (Figure 7b).
We observe the following temporal characteristics of backscatter changes before the fire. Firstly, the temporal trend characteristics of severely and moderately burned sites are very similar to those of the unburned site for both C- and L-bands (Figure 6). Secondly, in the growing seasons before the fire, most of the C- and L-band backscatter coefficients at the severely and moderately burned sites showed little dynamics: close to 0 dB variation for L-band and <1 dB for C-band (Figure 7 and Figure 8). Thirdly, the backscatter coefficients from both C- and L-band showed strong seasonal changes, increased in summer and decreased in winter. This is mainly caused by seasonal changes in vegetation, soil moisture, and soil freeze/thaw status. In the fall, the soil and vegetation freeze and the leaves fall from deciduous shrubs, reducing the soil moisture and overall backscattering, which causes backscatter to decrease. During the summer, the trend of soil and vegetation changes reverses, resulting in increasing the soil moisture and over backscattering, causing backscatter increase in summer. Combining the above three points, these suggest that the backscatter is mainly from the similar vegetation canopy property in the summer.
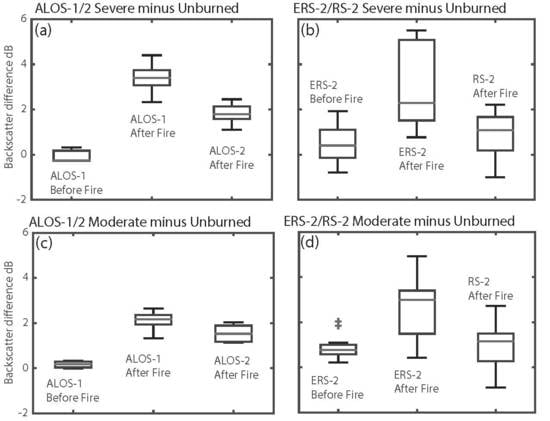
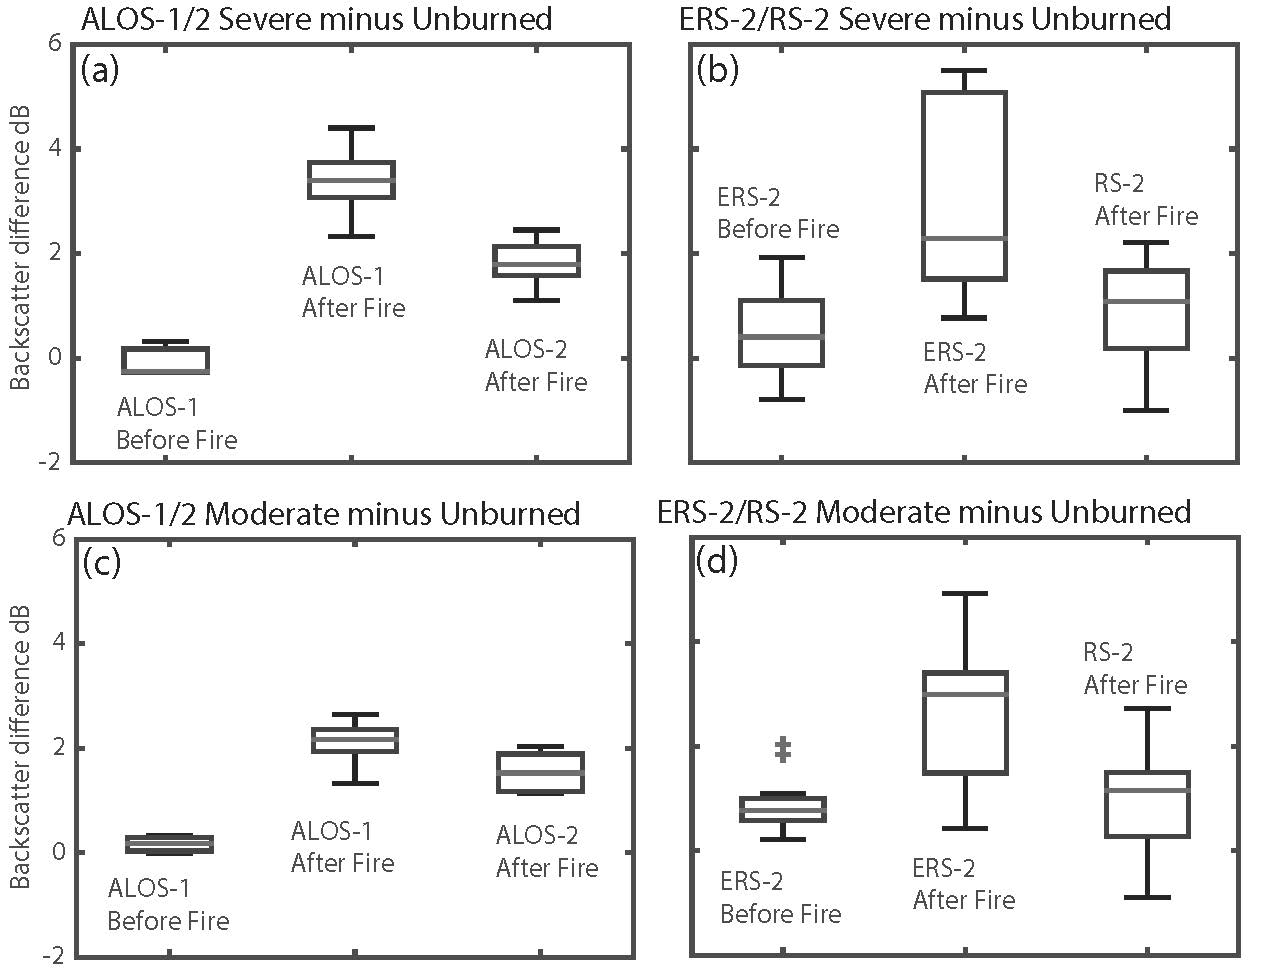
We observe the following temporal characteristics of backscatter coefficient changes after fire. Firstly, comparing to backscatter coefficient value in growing season before fire, a clear increase in backscatter coefficient value occurred in growing season after fire for both C- and L-band between 2008 and 2010 (Figure 7 and Figure 8). During the growing season, the mean backscatter coefficient differences between severely burned and unburned site is nearly 3 dB (with maximum of 5.5 dB) and 1 dB (with maximum of 2 dB) for ERS-2 and RS-2 C-band, respectively; nearly 3 dB (with maximum of 4.4 dB) and 2 dB (with maximum of 2.5 dB) for ALOS-1 and ALOS-2 L band, respectively. The differences between moderately burned and unburned site were relatively lower for both C- and L-bands. Secondly, different change patterns for C- and L-bands can be observed between 2008 and 2016. C-band backscatter coefficient in growing season decreased from 2008 to 2010 (Figure 7b). Furthermore, a clear drop of backscatter values can be found from ERS-2 records to RS-2 records. This decline is contributed by polarization mode (HH to HV) and incidence angle (23 degree to 27 degree) change after the fire. However, there was no decreasing trend after 2012 (Figure 7b), and three sites present almost similar temporal change pattern after 2012 (Figure 6b). This suggests that after 5-year regrowth, radar waves from the severely and moderately burned sites interacted with similar vegetation canopy level as unburned site again.
For L-band, there was no decreasing trend of backscatter coefficient in severely and moderately burned sites between 2008 and 2010 during the growing season (Figure 6a and Figure 7a). This suggests the vegetation in the severely and moderately burned sites did not recover to the similar state as in unburned site in 2010. The radar signal is primarily contributed by the roughness and soil moisture content of the ground in this stage. However, a slow decreasing trend can be observed between 2008 and 2016, and about 2 dB difference between unburned and moderately/severely sites still can be found in 2016 (Figure 7a and Figure 8a,c). This is mainly because the radar signal interacts with the regenerated vegetation canopy, and the effects of roughness and soil moisture on backscatter gradually diminished. We should note that there is 1.2 degrees (at mid swath) difference in the incidence angle between ALOS-1 and ALOS-2 SAR acquisitions. Since they are in the same HH polarization modes, the different observation angle could have limited influence on SAR backscatter values after the fire.
4. Discussion
4.1. Inconsistency between NDVI Trend and Field Observations
In the ARF burned area, the NDVI changes suggest approximately 3 years of vegetation recovery. Barrett et al. [14] reported a similar 3-year NDVI recovery after another tundra fire on the western North Slope of Alaska. However, field investigations over three years after the ARF found the vegetation cover in the burned areas was still sparser than in the unburned areas (35–50% cover for graminoid and 33–42% cover for shrubs). Moreover, field investigations found that the most significant change in vegetation species in the burned areas was graminoid, whose cover increased from 11% in 2008 to 45% in 2010 [16]. Shrub cover also increased in the burned areas, but slowly, from 4% to 11% for deciduous shrubs, and from 4% to 13% for ericaceous shrubs [16]. These field data suggest that the vegetation did not return to pre-fire level after three years of recovery, which contradicts the NDVI observations.
4.2. SAR Backscatter before and after the Fire
The change of surface components due to fire causes SAR backscatter coefficient change. Our results show that the backscatter value of severe burn area increased up to 5.5 dB and 4.4 dB after the fire for C- and L-band, respectively. Similar backscatter coefficient differences are also found in different Alaska tundra fire sites using ERS-1 C-band dataset [47]. Over the three years of recovery, the L-band backscatter coefficient showed less change than the C-band (Figure 7 and Figure 8). One possible reason is that regenerated vegetation is not dense as pre-fire. L-band radar waves can penetrate these newly regrown land cover, backscatter mainly still depends on roughness and soil moisture of the ground. While C-band backscatter from severely and moderately burned sites indicate a slow decrease trend with the regrowth of vegetation, but it does not return to the same level as the pre-fire level. C-band radar waves interact with new regenerated vegetation, resulting in reduction of the effect of roughness and soil moisture on the backscatter. Combining C- and L-band backscatter different changes over the three years of recovery, we could infer that: (1) the vegetation recovery did not return to the pre-fire status in vegetation structure and density; (2) C-band is more sensitive than L-band to the vegetation recovery in tundra environment.
After nearly 10 years of vegetation regrowth, the backscatter from RS-2 C-band and ALOS-2 L-band showed different change pattern. The C-band backscatter coefficient of all the sites showed almost the same changing pattern after 2011. This implies that the C-band radar waves returned from three sites interacts with a similar surface property after 2011. In other words, the vegetation property in severe burn and moderate burn had recovered to a similar level as in unburned site in 2012. The L-band backscatter from the severe burn and moderate burn sites was still about 2 dB higher than that from the unburned site. Using multitemporal airborne Light Detection and Ranging (LiDAR) dataset acquired in 2009 and 2014, Jones et al. [15] found surface roughness increased in burned area caused by thermokarst development. Therefore, the soil moisture and increased roughness probably contribute to the higher backscatter value in severely and moderately burned sites for ALOS-2 L-band. As L-band has stronger penetration capability, ground roughness and moisture have stronger effects on the returned radar signal than C-band. Combining these observations, we are able to infer that it takes 5 years for vegetation in the burned area to recover to a similar level as unburned site. We note that Jenkins et al. (2014) also suggested that 4–5 years are required for landscape recovery in tundra environment.
4.3. Limitations of SAR Data
However, compositions or new species vegetation recovered after the fire are unable to differentiate by SAR data. Fieldwork is necessary to investigate the vegetation compositions or shifts. A severe burn is able to facilitate colonization by new species when there is strong combustion of the pre-fire seedbed and high plant propagates. A 17-year study of post-fire vegetation recovery in Arctic tundra shows that there is abundance of graminoid species and an absence of Betulanana [14]. With an increase in fire activity and the conditions that contribute to increased fire severity, fire-related shifts in vegetation type will become more common [14]. Therefore, combining SAR imagery and ground observations could be an effective way to investigate the post-fire vegetation recovery in Arctic tundra environment.
5. Conclusions
Post-fire vegetation recovery in Arctic tundra environment is important to the balance of tundra ecosystem, such as carbon storage, active layer thickness, and vegetation composition. Effective measurements are required to monitoring the post-fire vegetation regrowth. In this paper, we investigate the potential of C- and L-band SAR backscatter for monitoring post-fire vegetation recovery after the 2007 Anaktuvuk River fire. We found that vegetation in burned area has probably returned to the pre-fire level after 5-year recovery, and C-band is more suitable to monitor such recovery process. The ground soil moisture is a major component of the total backscatter power for both C- and L-bands after fire. Yet, SAR data alone cannot quantify the vegetation composition and shifts, and additional field observations are required toward a thorough understanding of the composition.
Author Contributions
Conceptualization, Z.Z. and L.L.; data curation, Z.Z.; formal analysis, Z.Z. and L.L.; funding acquisition, L.L. and L.J.; investigation, Z.Z. and L.L.; methodology, Z.Z.; project administration, L.L. and L.J.; resources, L.L., W.F. and S.V.S.; supervision, L.L.; validation, Z.Z.; visualization, Z.Z.; writing—original draft, Z.Z.; writing—review and editing, L.L., L.J., and W.F.
Funding
This work is supported by the Strategic Priority Research Program of the Chinese Academy of Sciences (Grant No. XDA19070104), the National Natural Science Foundation of China (Grant No. 41804017), the Key Research Program of Frontier Sciences, CAS (QYZDB-SSW-DQC027 and QYZDJ-SSW-DQC042), the National Key R & D Program of China (2017YFA0603103), the Hong Kong Research Grants Council Grants CUHK14300815, and CUHK Direct Grant for Research 4053206.
Acknowledgments
We thank Benjamin Jones for providing the dNBR data and the Canadian Space Agency for providing the RS-2 ScanSAR Wide images.
Conflicts of Interest
The authors declare no conflict of interest.
References
- Hinzman, L.D.; Bettez, N.D.; Bolton, W.R.; Chapin, F.S.; Dyurgerov, M.B.; Fastie, C.L.; Griffith, B.; Hollister, R.D.; Hope, A.; Huntington, H.P.; et al. Evidence and implications of recent climate change in northern alaska and other arctic regions. Clim. Chang. 2005, 72, 251–298. [Google Scholar]
- Vavrus, S.J.; Holland, M.M.; Jahn, A.; Bailey, D.A.; Blazey, B.A. Twenty-first-century arctic climate change in ccsm4. J. Clim. 2012, 25, 2696–2710. [Google Scholar]
- ACIA. Impacts of a warming arctic-arctic climate impact assessment. In Impacts of a Warming Arctic-Arctic Climate Impact Assessment, by Arctic Climate Impact Assessment; Cambridge University Press: Cambridge, UK, 2004; Volume 1, p. 144. ISBN 0521617782. [Google Scholar]
- Schuur, E.A.G.; Bockheim, J.; Canadell, J.G.; Euskirchen, E.; Field, C.B.; Goryachkin, S.V.; Hagemann, S.; Kuhry, P.; Lafleur, P.M.; Lee, H.; et al. Vulnerability of permafrost carbon to climate change: Implications for the global carbon cycle. BioScience 2008, 58, 701–714. [Google Scholar]
- Phoenix, G.K.; Bjerke, J.W. Arctic browning: Extreme events and trends reversing arctic greening. Glob. Chang. Biol. 2016, 22, 2960–2962. [Google Scholar] [PubMed]
- Hu, F.S.; Higuera, P.E.; Walsh, J.E.; Chapman, W.L.; Duffy, P.A.; Brubaker, L.B.; Chipman, M.L. Tundra burning in alaska: Linkages to climatic change and sea ice retreat. J. Geophys. Res. Biogeosci. 2010, 115, G04002. [Google Scholar]
- Kasischke, E.S.; Turetsky, M.R. Recent changes in the fire regime across the north american boreal region—Spatial and temporal patterns of burning across canada and alaska. Geophys. Res. Lett. 2006, 33, L09703. [Google Scholar]
- Bret-Harte, M.S.; Mack, M.C.; Shaver, G.R.; Huebner, D.C.; Johnston, M.; Mojica, C.A.; Pizano, C.; Reiskind, J.A. The response of arctic vegetation and soils following an unusually severe tundra fire. Philos. Trans. R. Soc. B Biol. Sci. 2013, 368, 20120490. [Google Scholar]
- Jones, B.M.; Breen, A.L.; Gaglioti, B.V.; Mann, D.H.; Rocha, A.V.; Grosse, G.; Arp, C.D.; Kunz, M.L.; Walker, D.A. Identification of unrecognized tundra fire events on the north slope of alaska. J. Geophys. Res. Biogeosci. 2013, 118, 1334–1344. [Google Scholar]
- Mack, M.C.; Bret-Harte, M.S.; Hollingsworth, T.N.; Jandt, R.R.; Schuur, E.A.G.; Shaver, G.R.; Verbyla, D.L. Carbon loss from an unprecedented arctic tundra wildfire. Nature 2011, 475, 489–492. [Google Scholar]
- Jiang, Y.; Rastetter, E.B.; Shaver, G.R.; Rocha, A.V.; Zhuang, Q.; Kwiatkowski, B.L. Modeling long-term changes in tundra carbon balance following wildfire, climate change, and potential nutrient addition. Ecol. Appl. 2017, 27, 105–117. [Google Scholar]
- French, N.H.F.; Whitley, M.A.; Jenkins, L.K. Fire disturbance effects on land surface albedo in alaskan tundra. J. Geophys. Res. Biogeosci. 2016, 121, 841–854. [Google Scholar]
- Liu, L.; Jafarov, E.E.; Schaefer, K.M.; Jones, B.M.; Zebker, H.A.; Williams, C.A.; Rogan, J.; Zhang, T. Insar detects increase in surface subsidence caused by an arctic tundra fire. Geophys. Res. Lett. 2014, 41, 3906–3913. [Google Scholar]
- Barrett, K.; Rocha, A.V.; van de Weg, M.J.; Shaver, G. Vegetation shifts observed in arctic tundra 17 years after fire. Remote Sens. Lett. 2012, 3, 729–736. [Google Scholar] [Green Version]
- Jones, B.M.; Grosse, G.; Arp, C.D.; Miller, E.; Liu, L.; Hayes, D.J.; Larsen, C.F. Recent arctic tundra fire initiates widespread thermokarst development. Sci. Rep. 2015, 5, 15865. [Google Scholar] [PubMed]
- Jandt, R.R.; Miller, E.A.; Yokel, D.A.; Bret-Harte, M.S. Findings of Anaktuvuk River Fire Recovery Study; US Bureau of Land Management: Fairbanks, AK, USA, 2012.
- Rocha, A.V.; Loranty, M.M.; Higuera, P.E.; Mack, M.C.; Hu, F.S.; Jones, B.M.; Breen, A.L.; Rastetter, E.B.; Goetz, S.J.; Shaver, G.R. The footprint of alaskan tundra fires during the past half-century: Implications for surface properties and radiative forcing. Environ. Res. Lett. 2012, 7, 044039. [Google Scholar]
- De Baets, S.; van de Weg, M.J.; Lewis, R.; Steinberg, N.; Meersmans, J.; Quine, T.A.; Shaver, G.R.; Hartley, I.P. Investigating the controls on soil organic matter decomposition in tussock tundra soil and permafrost after fire. Soil Biol. Biochem. 2016, 99, 108–116. [Google Scholar]
- Hu, F.S.; Higuera, P.E.; Duffy, P.; Chipman, M.L.; Rocha, A.V.; Young, A.M.; Kelly, R.; Dietze, M.C. Arctic tundra fires: Natural variability and responses to climate change. Front. Ecol. Environ. 2015, 13, 369–377. [Google Scholar]
- Jolivel, M.; Allard, M. Thermokarst and export of sediment and organic carbon in the sheldrake river watershed, nunavik, canada. J. Geophys. Res. Earth Surf. 2013, 118, 1729–1745. [Google Scholar]
- Natali, S.; Schuur, T.; Mauritz, M.; Schade, J.; Celis, G.; Crummer, G.; Johnston, C.; Krapek, J.; Pegoraro, E.; Salmon, V.; et al. Permafrost thaw and soil moisture drive co2 and ch4 release from upland tundra. J. Geophys. Res. Biogeosci. 2015, 120, 525–537. [Google Scholar]
- Hugelius, G.; Strauss, J.; Zubrzycki, S.; Harden, J.W.; Schuur, E.A.G.; Ping, C.L.; Schirrmeister, L.; Grosse, G.; Michaelson, G.J.; Koven, C.D.; et al. Estimated stocks of circumpolar permafrost carbon with quantified uncertainty ranges and identified data gaps. Biogeosciences 2014, 11, 6573–6593. [Google Scholar] [Green Version]
- Tarnocai, C.; Canadell, J.G.; Schuur, E.A.G.; Kuhry, P.; Mazhitova, G.; Zimov, S. Soil organic carbon pools in the northern circumpolar permafrost region. Glob. Biogeochem. Cycles 2009, 23, GB2023. [Google Scholar]
- Zimov, S.A.; Davydov, S.P.; Zimova, G.M.; Davydova, A.I.; Schuur, E.A.G.; Dutta, K.; Chapin, F.S. Permafrost carbon: Stock and decomposability of a globally significant carbon pool. Geophys. Res. Lett. 2006, 33, L20502. [Google Scholar]
- Racine, C.; Jandt, R.; Meyers, C.; Dennis, J. Tundra fire and vegetation change along a hillslope on the seward peninsula, alaska, U.S.A. Arct. Antarct. Alp. Res. 2004, 36, 1–10. [Google Scholar]
- Hewitt, R.E.; Hollingsworth, T.N.; Stuart Chapin, F., III; Lee Taylor, D. Fire-severity effects on plant–fungal interactions after a novel tundra wildfire disturbance: Implications for arctic shrub and tree migration. BMC Ecol. 2016, 16, 25. [Google Scholar]
- Pearson, R.G.; Phillips, S.J.; Loranty, M.M.; Beck, P.S.A.; Damoulas, T.; Knight, S.J.; Goetz, S.J. Shifts in arctic vegetation and associated feedbacks under climate change. Nat. Clim. Chang. 2013, 3, 673–677. [Google Scholar]
- Joly, K.; Jandt, R.R.; Klein, D.R. Decrease of lichens in arctic ecosystems: The role of wildfire, caribou, reindeer, competition and climate in north-western alaska. Polar Res. 2009, 28, 433–442. [Google Scholar]
- Folke, C.; Carpenter, S.; Walker, B.; Scheffer, M.; Elmqvist, T.; Gunderson, L.; Holling, C.S. Regime shifts, resilience, and biodiversity in ecosystem management. Annu. Rev. Ecol. Evol. Syst. 2004, 35, 557–581. [Google Scholar]
- Tanase, M.; de la Riva, J.; Santoro, M.; Pérez-Cabello, F.; Kasischke, E. Sensitivity of sar data to post-fire forest regrowth in mediterranean and boreal forests. Remote Sens. Environ. 2011, 115, 2075–2085. [Google Scholar]
- Wang, Q.; Adiku, S.; Tenhunen, J.; Granier, A. On the relationship of ndvi with leaf area index in a deciduous forest site. Remote Sens. Environ. 2005, 94, 244–255. [Google Scholar]
- Bourgeau-Chavez, L.L.; Harrell, P.A.; Kasischke, E.S.; French, N.H.F. The detection and mapping of alaskan wildfires using a spaceborne imaging radar system. Int. J. Remote Sens. 1997, 18, 355–373. [Google Scholar]
- Bourgeau-Chavez, L.L.; Garwood, G.; Riordan, K.; Cella, B.; Alden, S.; Kwart, M.; Murphy, K. Improving the prediction of wildfire potential in boreal alaska with satellite imaging radar. Polar Rec. 2007, 43, 321–330. [Google Scholar]
- French, N.H.F.; Bourgeau-Chavez, L.L.; Wang, Y.; Kasischke, E.S. Initial observations of radarsat imagery at fire-disturbed sites in interior alaska. Remote Sens. Environ. 1999, 68, 89–94. [Google Scholar]
- Harrell, P.A.; Bourgeau-Chavez, L.L.; Kasischke, E.S.; French, N.H.F.; Christensen, N.L., Jr. Sensitivity of ers-1 and jers-1 radar data to biomass and stand structure in alaskan boreal forest. Remote Sens. Environ. 1995, 54, 247–260. [Google Scholar]
- Kasischke, E.S.; Bourgeau-Chavez, L.L.; Christensen, N.L., Jr.; Haney, E. Observations on the sensitivity of ers-1 sar image intensity to changes in aboveground biomass in young loblolly pine forests. Remote Sens. 1994, 15, 3–16. [Google Scholar]
- Way, J.; Paris, J.; Kasischke, E.; Slaughter, C.; Viereck, L.; Christensen, N.; Dobson, M.C.; Ulaby, F.; Richards, J.; Milne, A. The effect of changing environmental conditions on microwave signatures of forest ecosystems: Preliminary results of the march 1988 alaskan aircraft sar experiment. Int. J. Remote Sens. 1990, 11, 1119–1144. [Google Scholar]
- Kasischke, E.S.; Bourgeau-Chavez, L.L.; Johnstone, J.F. Assessing spatial and temporal variations in surface soil moisture in fire-disturbed black spruce forests in interior alaska using spaceborne synthetic aperture radar imagery—Implications for post-fire tree recruitment. Remote Sens. Environ. 2007, 108, 42–58. [Google Scholar]
- Minchella, A.; Del Frate, F.; Capogna, F.; Anselmi, S.; Manes, F. Use of multitemporal sar data for monitoring vegetation recovery of mediterranean burned areas. Remote Sens. Environ. 2009, 113, 588–597. [Google Scholar]
- Zebker, H.A.; Villasenor, J. Decorrelation in interferometric radar echoes. Geosci. Remote Sens. IEEE Trans. 1992, 30, 950–959. [Google Scholar] [Green Version]
- Imhoff, M.L. Radar Backscatter/Biomass Saturation: Observations and Implications for Global Biomass Assessment. In Proceedings of the IGARSS’93—IEEE International Geoscience and Remote Sensing Symposium, Tokyo, Japan, 18–21 August 1993; IEEE: Piscataway, NJ, USA, 1993; pp. 43–45. [Google Scholar]
- Dobson, M.C.; Ulaby, F.T.; LeToan, T.; Beaudoin, A.; Kasischke, E.S.; Christensen, N. Dependence of radar backscatter on coniferous forest biomass. Geosci. Remote Sens. IEEE Trans. 1992, 30, 412–415. [Google Scholar]
- Smith, G.; Dammert, P.B.; Askne, J. Decorrelation mechanisms in c-band sar interferometry over boreal forest. In Proceedings of the Satellite Remote Sensing Iii, Taormina, Italy, 17 December 1996; pp. 300–310. [Google Scholar]
- Tanase, M.; Santoro, M.; Riva, J.D.L.; Kasischke, E.; Korets, M.A. L-band sar backscatter prospects for burn severity estimation in boreal forests. In Proceedings of the Esa Living Planet Symposium, Bergen, Norway, 28 June–2 July 2010. [Google Scholar]
- Tanase, M.A.; Santoro, M.; Riva, J.D.L.; rez-Cabello, F.P.; Toan, T.L. Sensitivity of x-, c-, and l-band sar backscatter to burn severity in mediterranean pine forests. IEEE Trans. Geosci. Remote Sens. 2010, 48, 3663–3675. [Google Scholar]
- Racine, C.H.; Johnson, L.A.; Viereck, L.A. Patterns of vegetation recovery after tundra fires in northwestern alaska, U.S.A. Arct. Alp. Res. 1987, 19, 461–469. [Google Scholar]
- Jenkins, K.L.; Bourgeau-Chavez, L.L.; French, H.N.; Loboda, V.T.; Thelen, J.B. Development of methods for detection and monitoring of fire disturbance in the alaskan tundra using a two-decade long record of synthetic aperture radar satellite images. Remote Sens. 2014, 6, 6347–6364. [Google Scholar]
- Luckman, A.; Baker, J.; Honzák, M.; Lucas, R. Tropical forest biomass density estimation using jers-1 sar: Seasonal variation, confidence limits, and application to image mosaics. Remote Sens. Environ. 1998, 63, 126–139. [Google Scholar]
- AICC. Fire History in Alaska. Available online: https://fire.ak.blm.gov/predsvcs/maps.php (accessed on 7 December 2016).
- Jones, B.M.; Kolden, C.A.; Jandt, R.; Abatzoglou, J.T.; Urban, F.; Arp, C.D. Fire behavior, weather, and burn severity of the 2007 anaktuvuk river tundra fire, north slope, alaska. Arct. Antarct. Alp. Res. 2009, 41, 309–316. [Google Scholar]
- Rocha, A.V.; Shaver, G.R. Burn severity influences postfire co2 exchange in arctic tundra. Ecol. Appl. 2011, 21, 477–489. [Google Scholar] [PubMed]
- ASF. Vertx: The Alaska Satellite Facility’s Data Portal for Remotely Sensed Imagery of the Earth. Available online: https://vertex.daac.asf.alaska.edu (accessed on 1 June 2016).
- ASF. Mapready. Available online: https://www.asf.alaska.edu/data-tools/mapready/ (accessed on 1 June 2016).
- NASA. Earth Data. Available online: https://search.earthdata.nasa.gov (accessed on 20 November 2016).
- NASA. Mod13q1v006. Available online: https://lpdaac.usgs.gov/products/mod13q1v006/ (accessed on 1 August 2017).
Figure 1.
The location and burn severity of the Anaktuvuk River Fire (ARF). (a) the False-color Landsat-5 image acquired on 17 July 2008, the pink polygon is the fire boundary and the red polygon of upper left map shows the location of the fire area in Alaska. (b) differenced Normalized Burn Ratio (dNBR) within the burn scar [50]. The red, black, and white triangles (labeled as ‘a’, ‘b’, and ‘c’) mark the locations of severely and moderately burned, and unburned sites to be examined in our analysis, respectively.

Figure 2.
Images of backscatter coefficient that span before and after the fire. The white polygon marks the fire boundary. (a,b) present the images acquired from ERS2 and ALOS-1 before the fire. (c–f) present the post-fire images acquired from ERS2, ALOS-1, RS-2, and ALOS-2, respectively.
Figure 2.
Images of backscatter coefficient that span before and after the fire. The white polygon marks the fire boundary. (a,b) present the images acquired from ERS2 and ALOS-1 before the fire. (c–f) present the post-fire images acquired from ERS2, ALOS-1, RS-2, and ALOS-2, respectively.

Figure 3.
Dominant radar backscattering mechanisms in tundra environment. (a) volume scattering within tussock-forming sedges before a fire, (b) surface scattering from rougher ground after a fire.
Figure 3.
Dominant radar backscattering mechanisms in tundra environment. (a) volume scattering within tussock-forming sedges before a fire, (b) surface scattering from rougher ground after a fire.

Figure 4.
Maps of Normalized Difference Vegetation Index (NDVI) from July 2002 to July 2016. The black polygon in each figure marks the fire boundary. Note that the NDVI image on 13 July 2014 is contaminated by cloud cover.
Figure 4.
Maps of Normalized Difference Vegetation Index (NDVI) from July 2002 to July 2016. The black polygon in each figure marks the fire boundary. Note that the NDVI image on 13 July 2014 is contaminated by cloud cover.

Figure 5.
Time series of NDVI at the severely burned and unburned sites (a) and their differences (b) severely burned minus unburned. The vertical red line marks the end of the ARF.
Figure 5.
Time series of NDVI at the severely burned and unburned sites (a) and their differences (b) severely burned minus unburned. The vertical red line marks the end of the ARF.

Figure 6.
Time series of backscatter coefficients at the severely and moderately burned and unburned sites. (a) for ALOS-1 and ALOS-2, (b) for ERS-2 and RS-2. The red vertical line marks the end of the fire. The gray bars denote the growing seasons (June, July, August). The gray dashed lines separate ALOS-1 and ALOS-2 in (a), ERS-2 and RS-2 in (b).

Figure 7.
Time series of backscatter difference between burned and unburned sites. (a) for ALOS-1 and ALOS-2, (b) for ERS-2 and RS-2.
Figure 7.
Time series of backscatter difference between burned and unburned sites. (a) for ALOS-1 and ALOS-2, (b) for ERS-2 and RS-2.

Figure 8.
Statistical summary of the backscatter differences. For each box, the central line is the median, the upper and lower edges of the box are the 25th and 75th percentiles, the whiskers represent the minimum and maximum values, and the plus symbols mark the outliers. (a,b) present ALOS-1/2 and ERS-2/RS-2 backscatter difference between severe and unburned area, (c,d) present the ALOS-1/2 and ERS-2/RS-2 backscatter difference between moderate and unburned area.


Table 1.
List of synthetic aperture radar (SAR) images used in this study. Note: the resolution is equal in range and azimuth direction.
Table 1.
List of synthetic aperture radar (SAR) images used in this study. Note: the resolution is equal in range and azimuth direction.
| Satellite | ERS-2 | RADARSAT-2 | ALOS-1 | ALOS-2 |
|---|---|---|---|---|
| Band/Wavelength | C/5.6 cm | C/5.6 cm | L/23.6 cm | L/23.6 cm |
| Number of images | 52 | 34 | 30 | 14 |
| Acquisition period (DD/MM/YYYY) | 06/01/2002–31/10/2010 | 17/01/2011–08/02/2016 | 03/06/2006–17/03/2010 | 17/11/2014–19/07/2017 |
| Incidence angle (degree) | 23.0 | 27.0 | 38.0 | 36.8 |
| Polarization | VV | HV | HH | HH |
| Resolution (m) | 12.5 | 50.0 | 12.5 | 6.25 |
© 2019 by the authors. Licensee MDPI, Basel, Switzerland. This article is an open access article distributed under the terms and conditions of the Creative Commons Attribution (CC BY) license (http://creativecommons.org/licenses/by/4.0/).
Share and Cite
MDPI and ACS Style
Zhou, Z.; Liu, L.; Jiang, L.; Feng, W.; Samsonov, S.V. Using Long-Term SAR Backscatter Data to Monitor Post-Fire Vegetation Recovery in Tundra Environment. Remote Sens. 2019, 11, 2230. https://0-doi-org.brum.beds.ac.uk/10.3390/rs11192230
AMA Style
Zhou Z, Liu L, Jiang L, Feng W, Samsonov SV. Using Long-Term SAR Backscatter Data to Monitor Post-Fire Vegetation Recovery in Tundra Environment. Remote Sensing. 2019; 11(19):2230. https://0-doi-org.brum.beds.ac.uk/10.3390/rs11192230
Chicago/Turabian StyleZhou, Zhiwei, Lin Liu, Liming Jiang, Wanpeng Feng, and Sergey V. Samsonov. 2019. "Using Long-Term SAR Backscatter Data to Monitor Post-Fire Vegetation Recovery in Tundra Environment" Remote Sensing 11, no. 19: 2230. https://0-doi-org.brum.beds.ac.uk/10.3390/rs11192230
Note that from the first issue of 2016, this journal uses article numbers instead of page numbers. See further details here.