Article

3D Coseismic Deformation Field and Source Parameters of the 2017 Iran-Iraq Mw7.3 Earthquake Inferred from DInSAR and MAI Measurements

1
Sichuan Highway Planning, Survey, Design and Research Institue Ltd, Chengdu 610041, China
2
Department of Remote Sensing and Geospatial Information Engineering, Southwest Jiaotong University, Chengdu 610031, China
3
State-Province Joint Engineering Laboratory of Spatial Information Technology of High-Speed Rail Safety, Southwest Jiaotong University, Chengdu 610031, China
4
Sichuang Energy Wind Power Development CO., LTD, Chengdu 610041, China
*
Author to whom correspondence should be addressed.
Remote Sens. 2019, 11(19), 2248; https://0-doi-org.brum.beds.ac.uk/10.3390/rs11192248
Submission received: 24 August 2019 / Revised: 15 September 2019 / Accepted: 25 September 2019 / Published: 27 September 2019

Abstract

:
The coseismic slip on the main fault related to the 2017 Iran-Iraq Mw7.3 earthquake has been investigated by previous studies using DInSAR (differential interferometric synthetic aperture radar) ground deformation measurements. However, DInSAR observation is not sensitive to the ground deformation in the along-track (AT) direction. Therefore, only the one-dimensional (1D) DInSAR coseismic deformation field measurements, derived in the LOS (line-of-sight) direction of radar, was applied in source parameters estimation. To further improve the accuracy of the fault slip inversion, the 3D (three-dimensional) coseismic deformation fields were reconstructed in the first place, by a combined use of the DInSAR and MAI (multiple aperture InSAR) measurements. Subsequently, the LOS and 3D deformation data sets were used as the constraint respectively, to perform a two-step inversion scheme to find an optimal geometry and slip distribution on the main fault. The comparative analysis indicated that the 3D coseismic deformation data sets improved the inversion-accuracy by 30%. Besides, the fault invention results revealed a deep dislocation on a NNW trending fault (the strike is 352.63°) extending about 60 km, along the fault dips 14.76° to the ENE. The estimated seismic moment is 8.44 × 10¹⁹ Nm (Mw7.3), which is close to the solution provided by USGS (United States Geological Survey). The slip distributed at the depth between 12 and 18 km, and the peak slip of 6.53 m appears at the depth of 14.5 km left near the epicenter. Considering the geological structure in the earthquake region and fault source-parameters, it comes to a preliminary conclusion that the ZMFF (the Zagros Mountain Front fault) should be responsible for the earthquake. In general, this paper demonstrated the superiority of using the 3D coseismic deformation fields on source parameters estimation.

1. Introduction

The 2017 Mw7.3 Iran–Iraq Earthquake occurred in a region where the pattern of major plate convergence is well constrained (Figure 1). Although some studies and institutions (USGS (United States Geological Survey), GCMT (Global Centroid Moment Tensor), CENC (China Earthquake Networks Center)) published some source parameters [1,2,3,4,5,6,7], the variable slip on the main fault related with this earthquake is still uncertain. In order to accurately derive the variable slip on main fault, this present conducted detailed fault inversion using the 3D coseismic deformation fields reconstructed by a combined use of the DInSAR and Multiple Aperture InSAR (MAI) measurements, based on both the ascending and descending SAR images obtained by L-band ALOS-2 and C-band Sentinel-1A sensors respectively.
Nowadays, the geodetic data of GPS and DInSAR have been extensively used in earthquake fault inversion. Although coseismic GPS data is good at providing 3D surface displacements at individual observation locations, labor power, and material resources cost is great. Meanwhile, the spatial density of GPS sites is limited. In recent years, the DInSAR method is developing with continually launching of new SAR satellites. Because it has a few significant advantages [8], such as high resolution, shorter revisit interval, wider coverage, etc., that is widely applied in fault slip inversion at present. However, the DInSAR observation is only sensitive to displacements in the line-of-sight (LOS) direction of radar. Therefore, only one component of the surface displacement vector was brought in the fault slip inversion. As a result, uncertainties of fault source parameters arose from data resources and data incompleteness, and the accuracy of source parameters estimation is restricted.
To overcome the limitation, the Multiple Aperture InSAR (MAI) measurements was widely used to provide valuable information about azimuthal surface displacements [8,9,10,11,12]. Considering the heading angle of the ascending- and descending-pass direction is varying, totally four different displacements vectors can be observed by combing the DInSAR and MAI measurements. As a result, the 3D deformation fields can be reconstructed [13,14,15,16,17,18,19,20,21] to provide accurate data for fault slip inversion and increase the inversion efficiency.
The previous study [22] measured the AT (along-track) deformation of the earthquake by the Azimuth Pixel Offset (AZO) and MAI method, respectively. The comparison results of two methods show that the MAI method is better at observing the AT (Along Track) deformation. At the same time, the 3D deformation fields of the earthquake were reconstructed by combing the DInSAR and MAI method [22]. But the low frequency (e.g., L-band SAR) is more sensitive to ionosphere [23,24,25], so it was necessary to remove the relative azimuth shift caused by ionosphere to obtain better deformation fields.
In this paper, the SAR data sets of ALOS-2 and Sentinel-1a are used firstly to derive the deformation fields around the epicenter. During the procedures, we used the Precise Orbit Ephemerides for all images acquired and applied the range split-spectrum method [26,27] to estimate the differential ionospheric phase, and then mitigate the relative azimuth shift caused by ionosphere in the MAI interferogram. The accuracy of the 3D coseismic deformation fields was promoted. Then this paper focus on testing the effect of using the 3D coseismic deformation fields on fault slip inversion. In addition, the fault slip inversion will be implemented by the constrain of the LOS and 3D coseismic deformation fields, respectively. In the end, comparative analysis was performed to evaluated the results. The results demonstrate the advantage of 3D coseismic deformation fields in fault slip inversion. It should be pointed out that such method is applied for the 2017 Iraq Mw7.3 earthquake, for the first time.

2. Study Area and Data

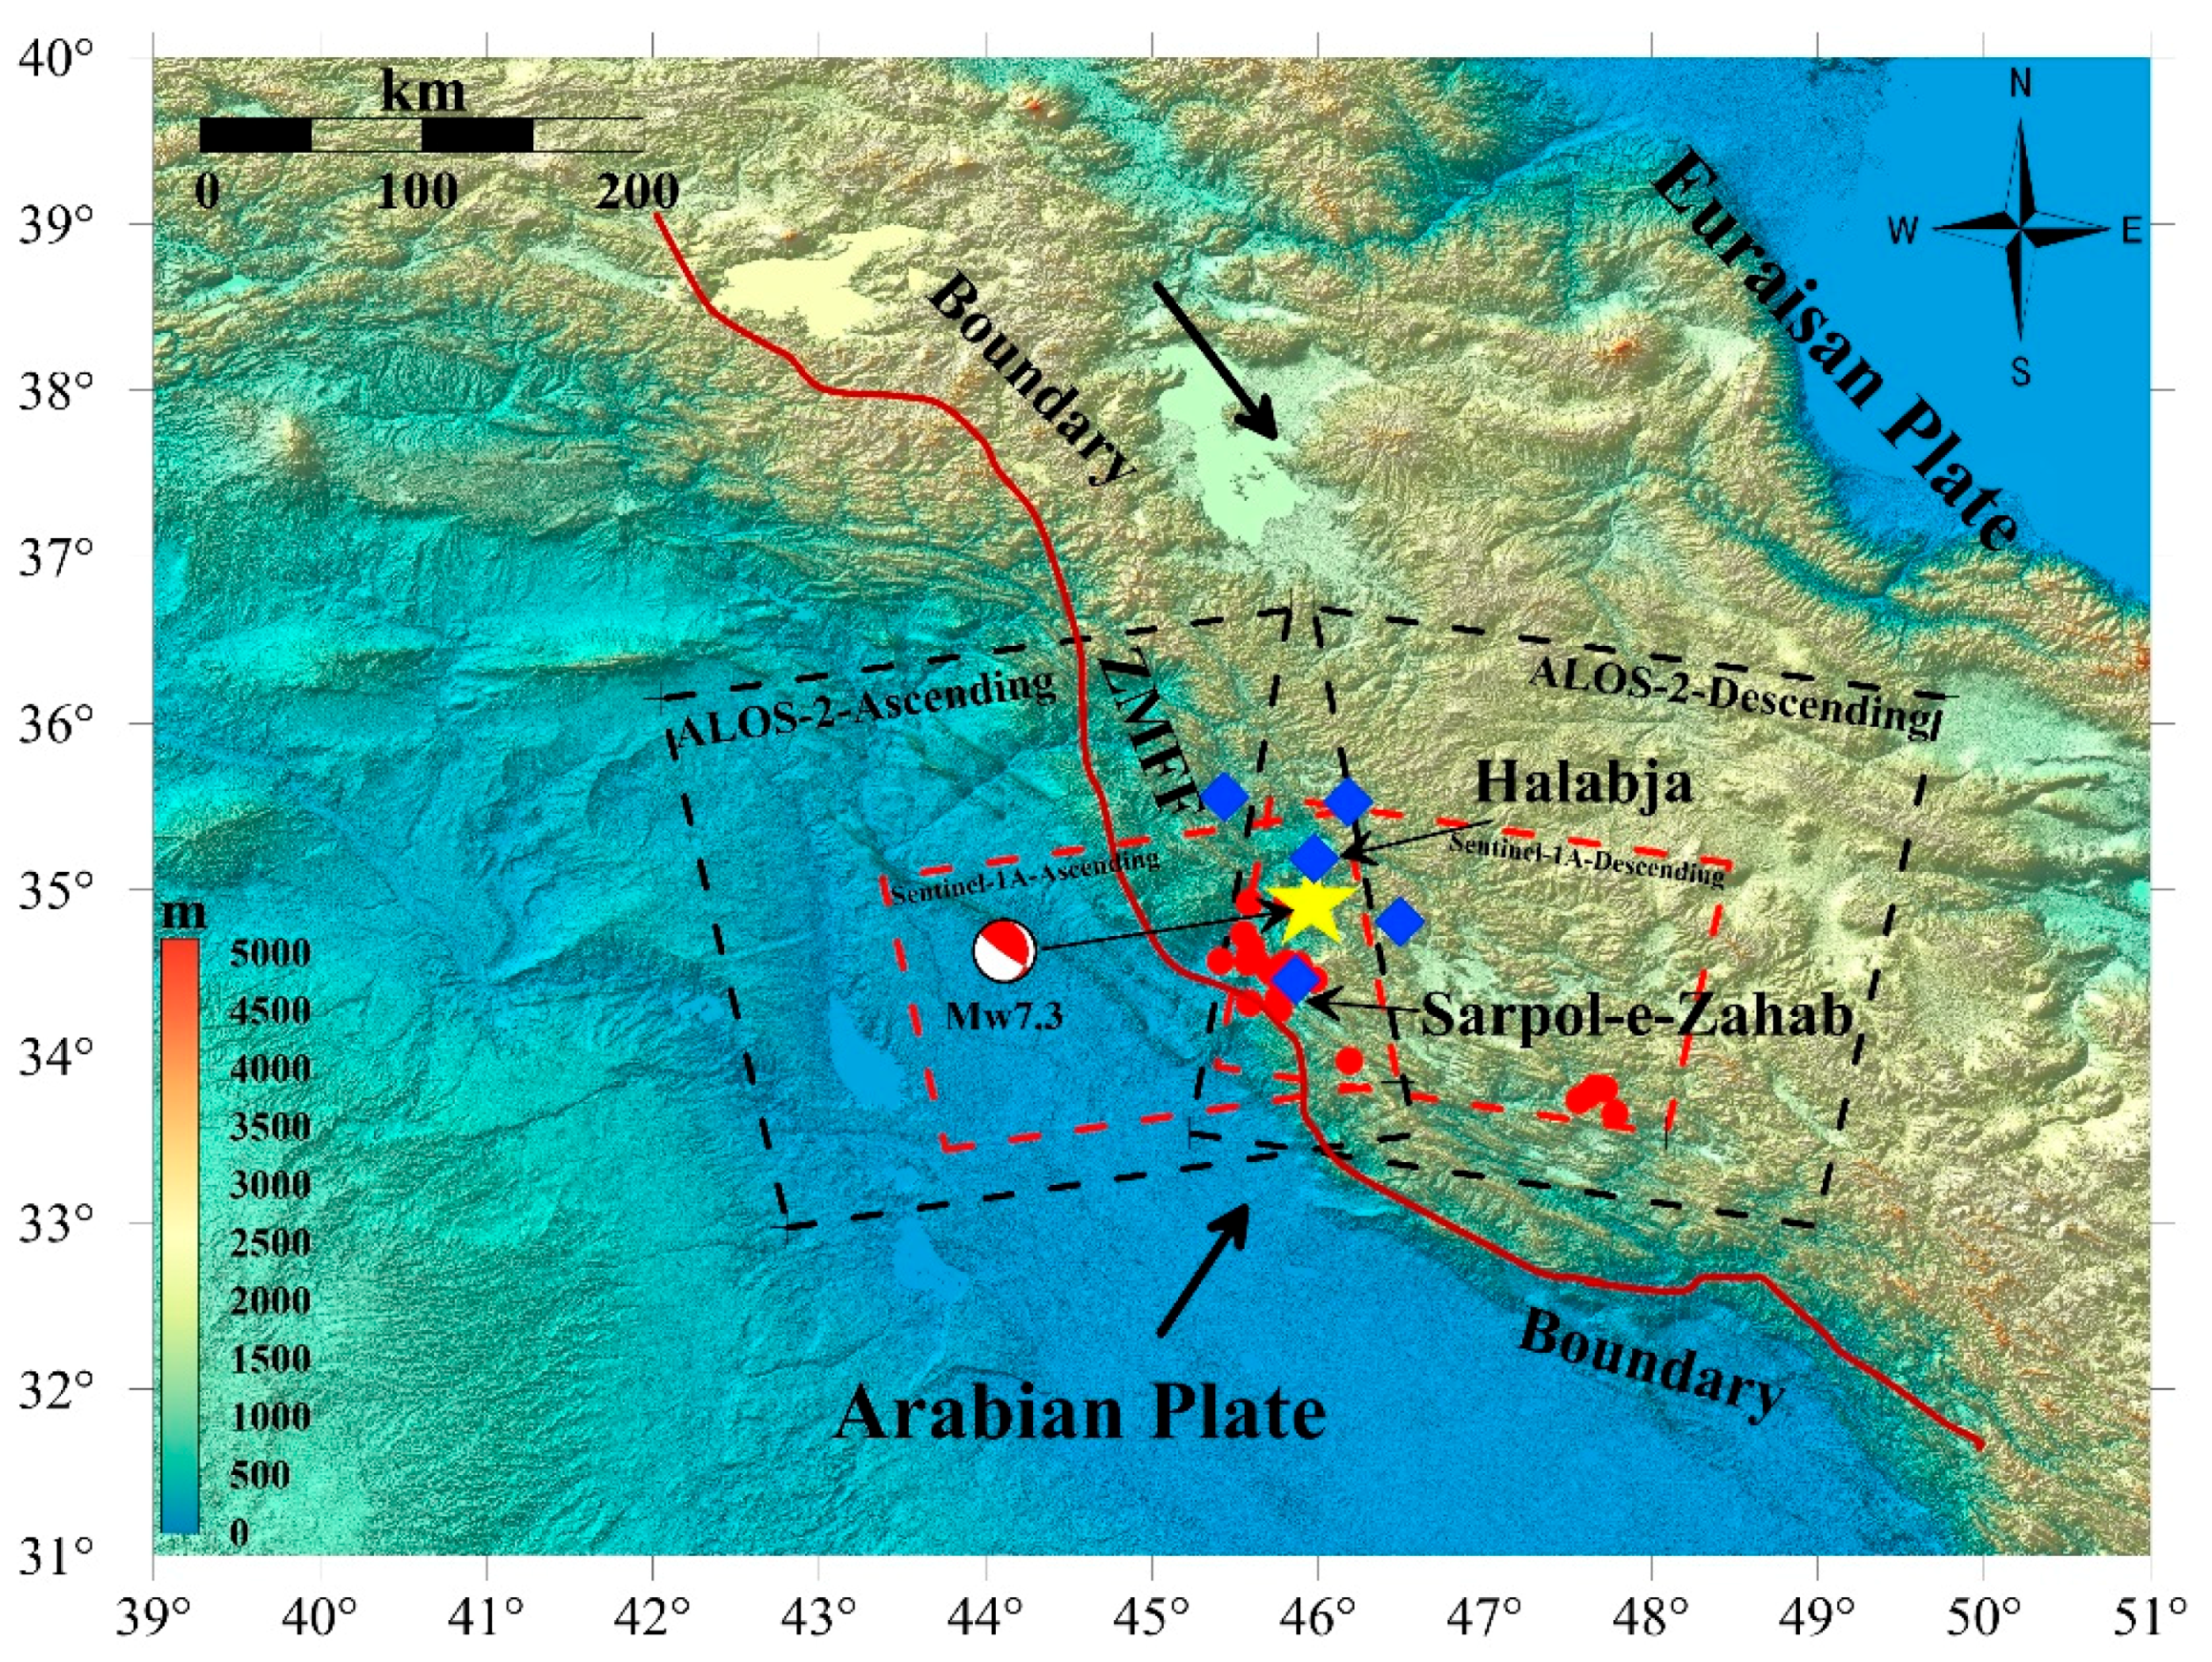
2.1. Backgroud of the Study Area

The 2017 Mw7.3 Iran–Iraq earthquake stuck the Iraq-Iran border region on November 12, 2017 with an epicentral of [45.9°E, 34.93°N], 50 km north east of Sarpol Zahab city based on the earthquake report from the USGS (the United States Geological Survey). Figure 1 shows the tectonic in this region, the continental collision between Arabia and Eurasian plate is the driving force. The oblique convergence between the Arabia and Eurasia plates activate through a combination of strike-slip (~5 mm/y in the central part of the Talesh Mountains) and thrust faulting (~2 mm/y–6 mm/y in the northern and southern parts of the mountains), respectively [28,29]. Geologically, the earthquake’s epicenter was located near the Zagros Mountain Front Fault (ZMFF) where the Zagros Mountains have been uplifting since the Late Eocene by the driving force. As a result, this earthquake was triggered and characterized by thrust motion.
This earthquake event has already been studied several times by using different data sets, resulting in different fault models [1,2,3,4,5,6,7]. These studies indicate that this earthquake was a shallow-slip thrusting event with a small amount of right-lateral strike slip. The major fault parameters including strike, dip, and rake are similar. But the maximum slip is quite different. Based on the deformation fields obtained by the data sets of ALOS-2, Kobayashi and Barnhart indicated that the maximum slip is approximately 5 m [1,5]. Taymaz [2] indicated that the maximum slip is approximately 6.9 m based on Sentinel-1A interferometric pairs and teleseismic P- and SH- body-waveforms data. Wang indicated that the maximum slip is about 7 m while Feng indicated the maximum slip is 6 m (3,7).

2.2. Data

Figure 1 shows shaded relief map of study area and image coverage, etc. The four interferometric pairs we selected for this study, include two pairs of L-band (radar wavelength of 23.6 cm) ALOS-2 images and two pairs of C-band (radar wavelength of 5.6 cm) Sentinel-1A images (see Figure 1). Table 1 lists the acquisition date of each SAR image and the perpendicular baseline (B), temporal baseline (BT) and orbit types of each interferometric pair. The ALOS-2 ScanSAR mode images were collected along both the ascending and descending orbit at a radar incidence angle of 39° in HH polarization and generated with a pixel spacing of 19.02 m in slant range and 25.9 m in azimuth (i.e., along track). Each image scene covers an area of about 350 km by 350 km in azimuth and range, respectively.
Meanwhile, the Senitnel-1A IW mode images were collected along both the ascending and descending orbits at radar incidence angle of 39.5° in VV polarization and generated with a pixel spacing of 5 m in slant range and 20 m in azimuth. Each image scene covers an area of about 250 km by 170 km in range and azimuth, respectively. The heading angles of the ALOS-2 and sentinel-1A ascending orbits are 347° and 344° (measured clockwise from the north), respectively; and the heading angles of the descending orbits are 195° and 193° (measured from the north), respectively.
Around the epicenter, the vegetation coverage is low. At the same time, the temporal and spatial baselines are small enough (see Table 1), thus the coherence is high enough. The DInSAR and MAI methods will be processed effectively to reconstruct the 3D coseismic deformation caused by the earthquake. In ALOS-2 ScanSAR mode, SAR antenna cyclically points to several subswaths with different look angles. In each cycle, the SAR system collects a group of echoes for each subswath. The group of echoes is called a burst. By repeating this cycle over several subswaths, a wide-swath image can be acquired [30]. The earthquake region was fully imaged by a burst. So, considering the efficiencies, only one burst of ALOS-2 images and whole Sentinel-1A images were used, actually.

3. Methodology

3.1. Geodetic Data Sets

In order to provide accurate data for fault inversion, we use two result sets. Four DInSAR results provide spatially dense LOS deformation field along both the ascending and descending imaging direction. Two DInSAR results and two MAI results based on ALOS-2 interferometric pairs will be combined to reconstruct the 3D coseismic deformation-field.

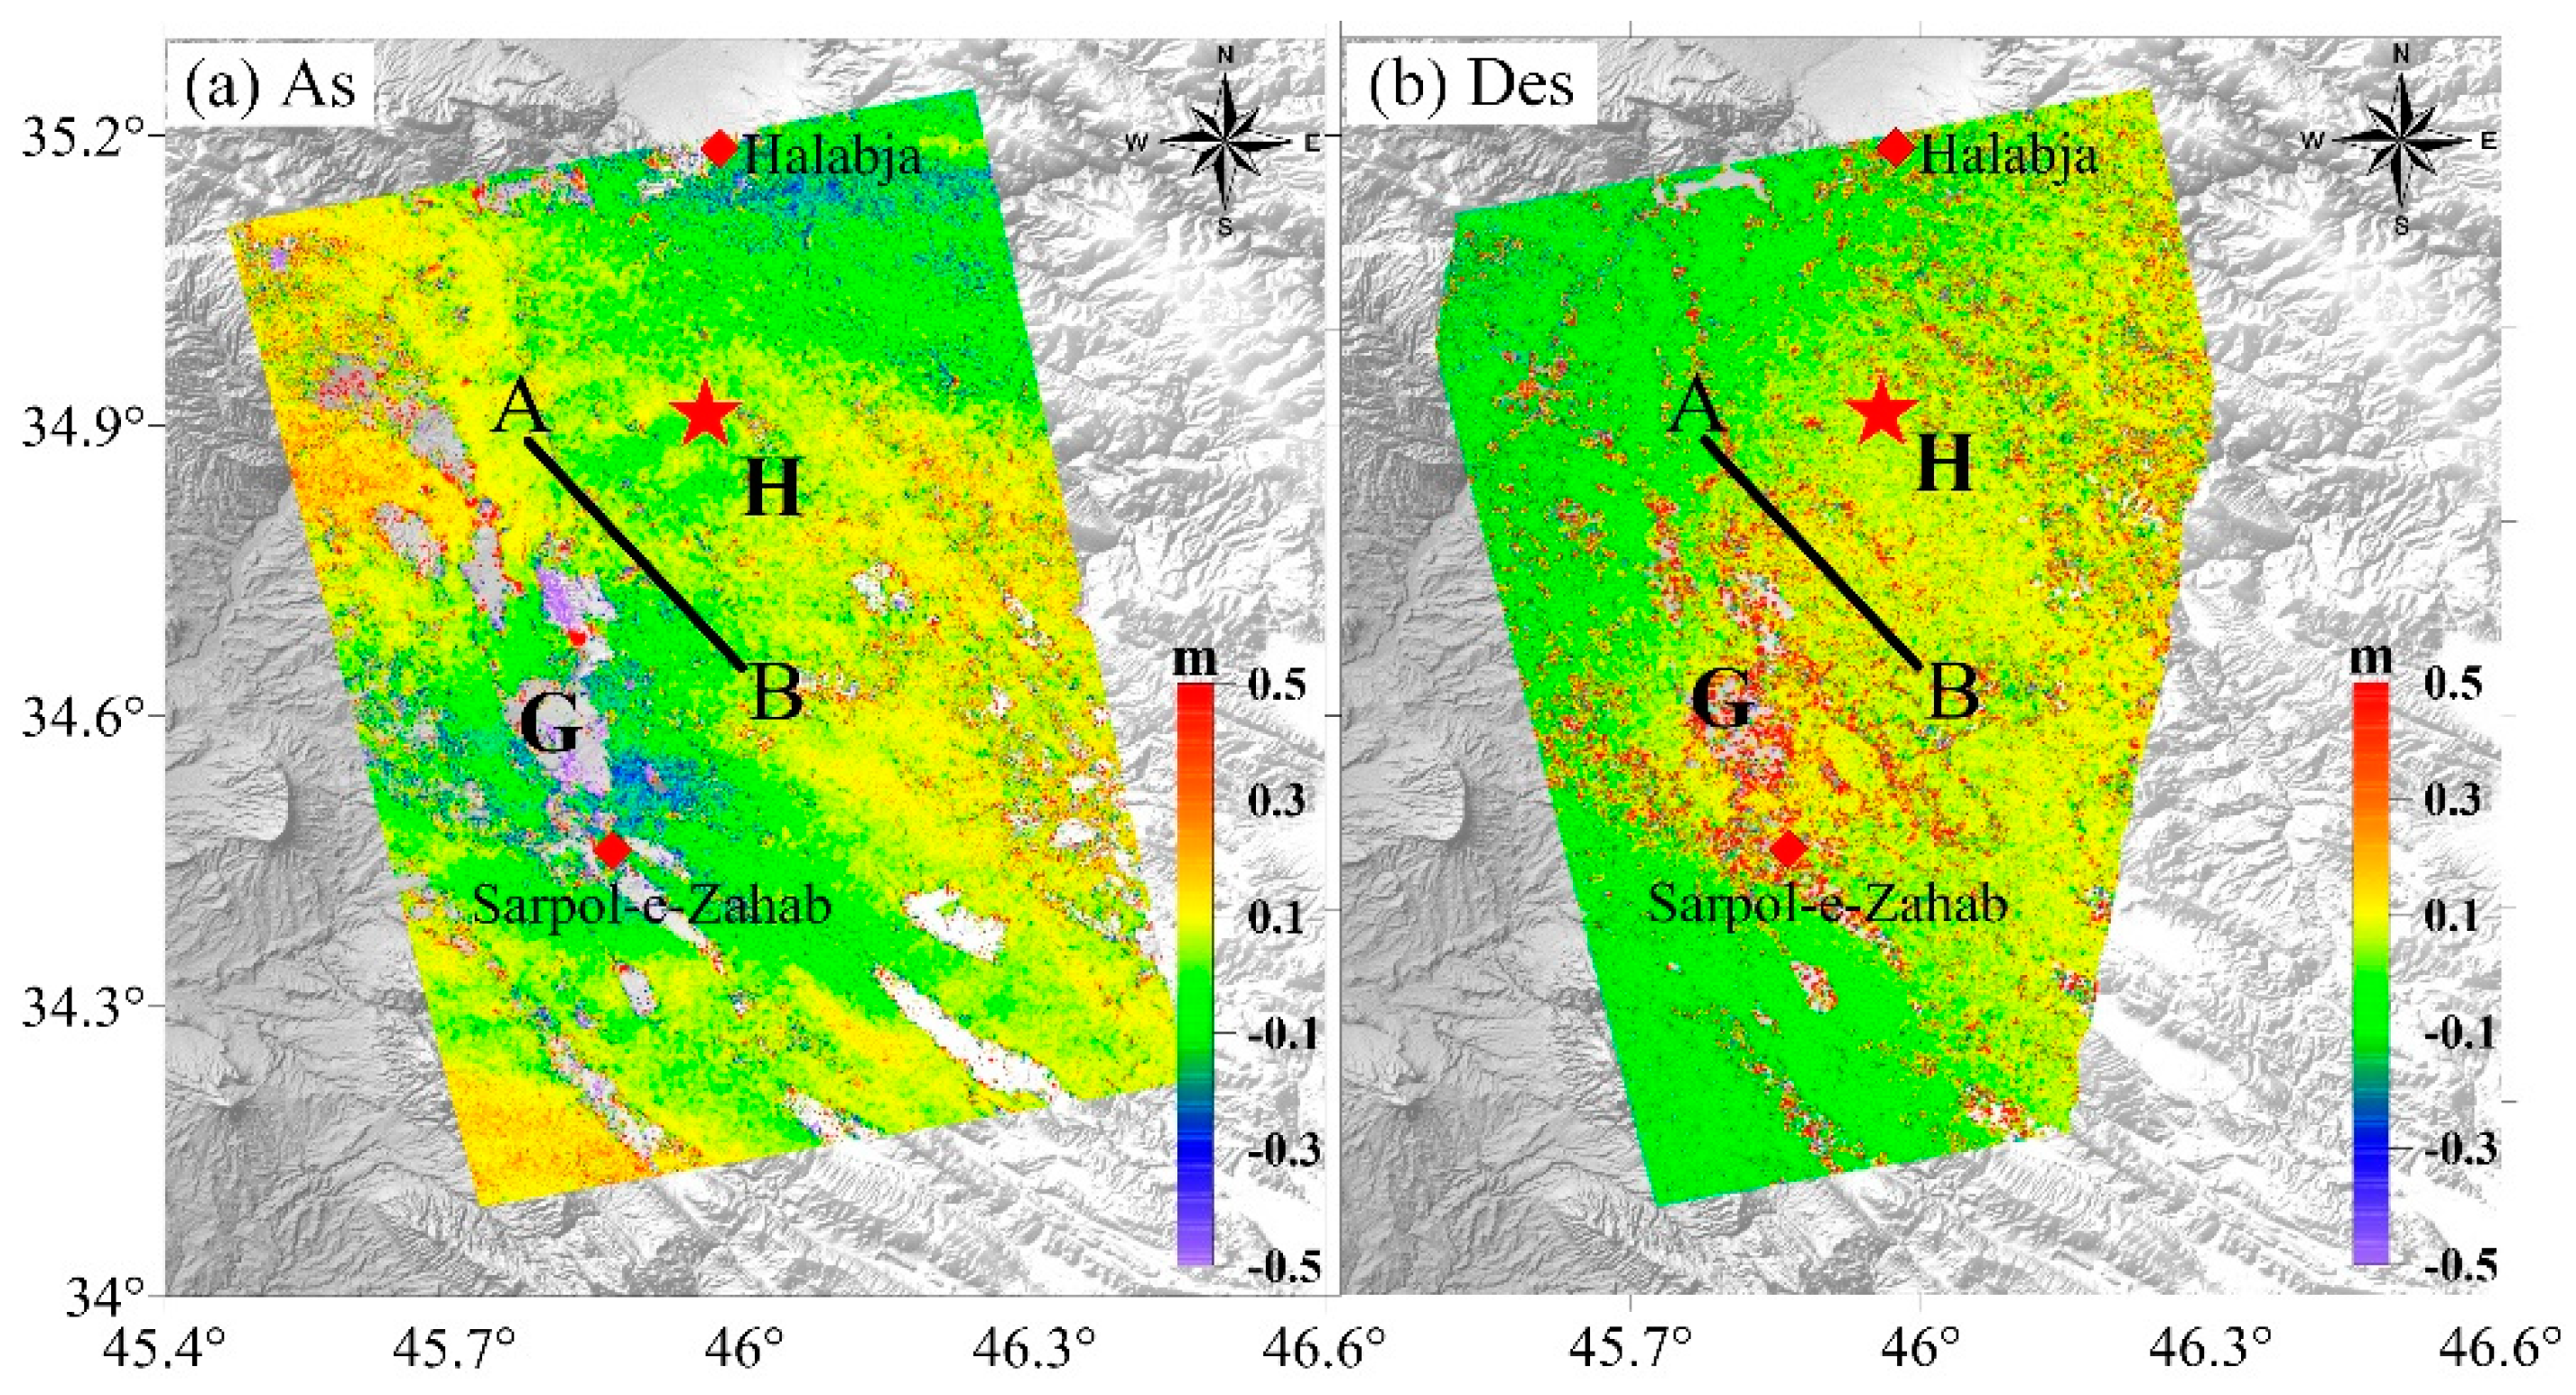
3.2. Extraction of the LOS and Azimuth Coseismic Deformation Field

The previous study [22] used the conventional DInSAR method based on four images pairs of ALOS-2 and Sentinel-1A to extract the LOS deformation field. The same procedures were performed step by step. We used the Precise Orbit Ephemerides for all images acquired. A digital elevation model (DEM) derived from the Shuttle Radar Topography Mission (SRTM) with 3 arcsec resolution [31] was used to remove the topographic effects from interferograms. The DEM data of the study area is depicted as a shaded relief map in Figure 1. In order to reduce the influence of noise, the method of Goldstein [32] is used to filter interferograms. Then, for avoiding the accuracy loss caused by orbit error and correcting the orbit and phase shift, refinement and re-flattening is processed by selecting enough and high coherence reference points, which distribute uniformly and far from the deformation field in the interferograms. And phase unwrapping was processed by the minimum-cost flow (MCF) method [33]. In addition, we performed the range split-spectrum method to ALOS-2 ScanSAR interferogram to estimate the differential ionospheric phase [30].
Figure 2 shows the LOS coseismic deformation fields measured by the DInSAR method based on four interferometric pairs. It has two clear deformation lobes (here refers to lobe G and H) which divided by an NNW trending bound (see black line AB in Figure 2). As the Figure 2a,c shows, the maximum value of uplift in lobe G and subsidence in lobe H are approximately 100 cm and −30 cm, respectively; and Figure 2b,d shows the maximum value of uplift in lobe G and subsidence in lobe H are approximately 50 cm and −50 cm, respectively.
To extract the AT (along-track) deformation fields, we performed the conventional MAI method based on two interferometric pairs of ALOS-2 (only one burst will be used). The achieved accuracy of the AT deformation is approximately 8 cm with coherence of 0.6. Around the epicenter, the coherence is high enough. Furthermore, the coherence can be further enhanced by multilooking and filtering processes. It is suitable to use this method to measure the AT deformation of this earthquake.
Four SLC images, composed of both forward- and backward-looing SLC images from master and slave SAR data of ALOS-2, were generated by controlling the Doppler Centroids and processing bandwidth (PBW) for sub-aperture images according to the MAI processor [9,10,11,12]. The conventional MAI processing for the SLC data includes azimuth common-band filtering between the master and slave SLC images and beam-splitting for the purpose of dividing forward- and backward-looking spectrum. During the MAI processing, we apply thirteen-looks and two-looks in the azimuth and range directions, respectively, to reduce the phase noise in the interferograms. The band-width of common band filtering is 482.39 Hz and 731.23 Hz, two forward-looking and two backward-looking images were separated out from interferometric pairs of ALOS-2, firstly. Subsequently, both forward- and backward-looking interferograms were generated independently. Finally, MAI interferograms were obtained through dual-interferometry between forward- and backward-looking interferograms. In particular, we used the estimated differential ionospheric phase to mitigate the relative azimuth shift caused by ionosphere in the MAI interferogram. The AT deformation measured by the MAI can be defined by the following equation [30]:
Δ x = Φ M A I v g 2 π n K a T C
where Δx is the AT deformation, ΦMAI is the phase of the MAI interferogram, vg is the velocity of the beam footprint on the ground, Ka is the azimuth frequency modulation (FM) rate, TC is the burst cycle length, and n is the difference of burst numbers.
Figure 3 shows the AT deformation maps. (a) and (b) are the MAI results based on ascending and descending images, respectively. The displacements of ascending and descending are a little different, because the projected thrust motion vectors along the ascending and descending azimuth direction are different. Figure 3 indicates that the AT deformation is concentrated in the lobe G, and the measured maximum surface displacement is approximately 50 cm away from the SAR sensor. It reflects the earthquake has some thin features of strike slip.

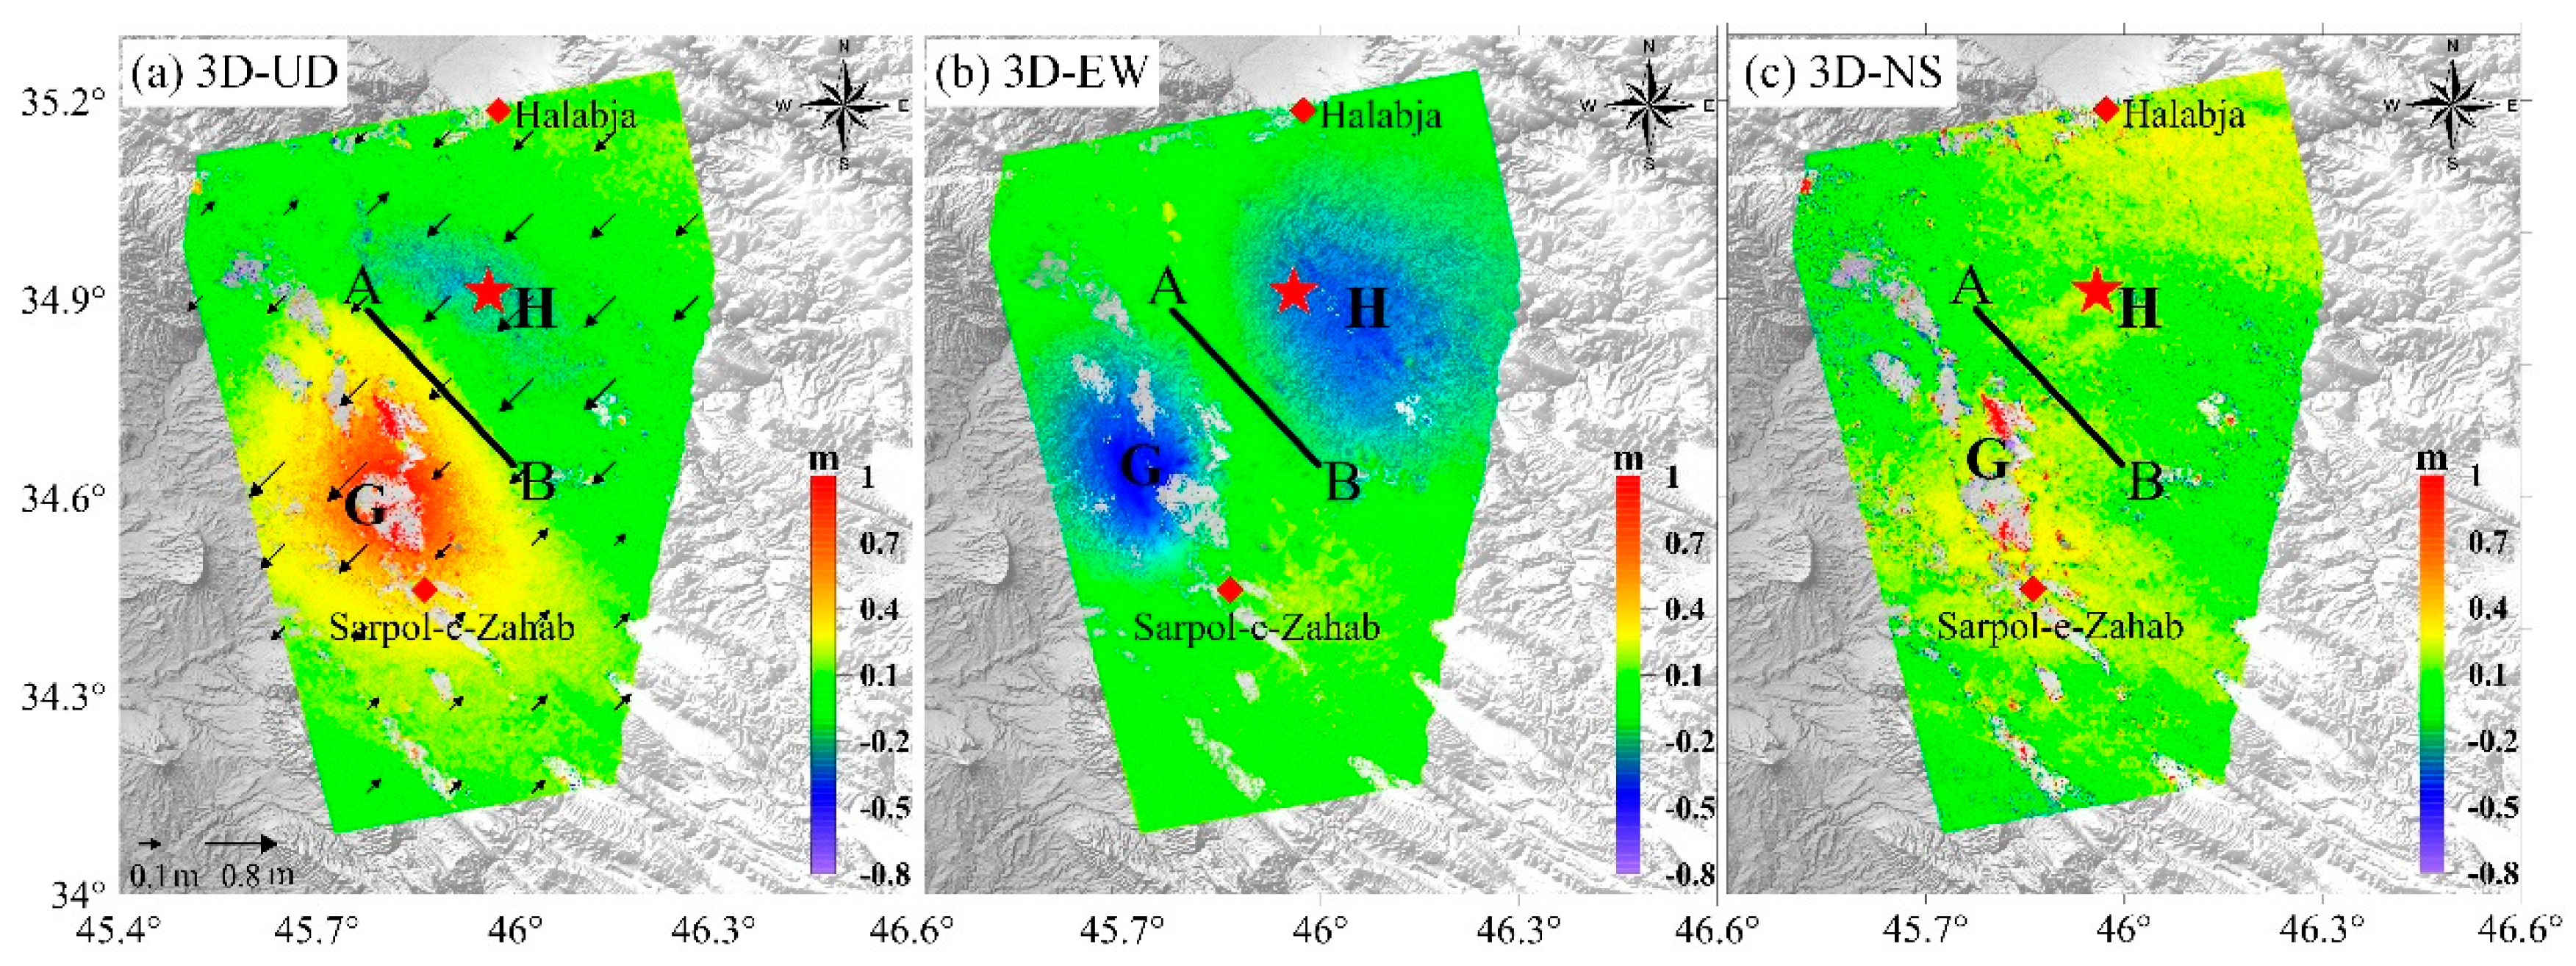
3.3. Reconstruction of 3D Coseismic Deformation Fields

This paper reconstructed 3D coseismic deformation fields by integrating LOS and MAI azimuth deformation data sets. The retrieval of the east–west (E–W) (De), north–south (N–S) (Dn), up–down (U–D) (Du) components of the surface deformation followed methods described in previous studies [13,14,15,16,17,18,19,20,21,22]. Figure 4 shows the 3D coseismic displacements maps.
The deformation field covers an area of about 60 × 70 km2 with two clear deformation lobes which divided by the trending bound AB mentioned in Section 3.1.
The heading and length of the arrows indicate the direction and magnitude of the horizontal motion, respectively. The U–D component map (Figure 4a) shows somewhat similar displacement patterns with the LOS deformation maps (Figure 2) because vertical motion has dominant during the earthquake. Uplift appears in the lobe G, while subsidence appears in the lobe H. The maximum uplift and subsidence values are 100 cm and –50 cm, respectively, thus reaching up to a relative offset of 150 cm in the vertical direction. It can be confirmed that the U–D components are the most violent, and the westward motion plays a major role in the horizontal motion. The vectors reflect the characteristics of a pure thrust fault. The E–W component map (Figure 4b) clearly shows a pushing effect of plates. Both the maximum displacement in lobe G and H is approximately 50 cm toward the west. The earthquake demonstrated dominantly vertical and westward motion along a thrust fault, but it also encompassed movement in the lobe G of the N–S component map (Figure 4c), the maximum displacement in N–S direction is approximately 70 cm. The city of Sarpol-e-Zahab is located at the region that had mixed motion in the horizontal and vertical directions, so it suffered the highest intensity (the intensity is VIII) and destructions (about 12,000 buildings collapse). At the same time, the surface ruptures confirmed by Kobayashi [1] distributed in the uplift region mostly.

3.4. Subsampling and Weighting of Data

The LOS and 3D data as shown in Figure 2 and Figure 4 consist of million data points. As the displacement field is varying smoothly, we can subsample the data with a factor of 4 and a quadtree algorithm to obtain reasonable number of data points and good spatial representation of the LOS and 3D displacements [34]. The numbers of remaining data points for four LOS deformation fields are 1261, 959, 1552, 1184, respectively. Meanwhile the numbers of remaining data points for EW, NS, and U–D directions are 1012, 1124, and 869, respectively. Despite dramatic reduction in quantity, this down-sampled observations well retain the major features of the original interferograms.
We weight the data based on standard deviation of their deformation data [35]. The standard deviation can be calculated by Equation (2),
σ = ( Σ N ( u ( i , j ) m u ( i , j ) ) 2 N 1 )
where u(i, j) is the observed displacement of one point, mu(i, j) is the mean value of displacements of all points, N is the number of points. After calculation, the weight factors for four subsampled LOS data sets are 0.31, 0.24, 0.2, and 0.25; the weight factors for EW, NS, and U–D directions are 0.45, 0.15, 0.4.

4. Results and Discussion

With the using of the LOS and 3D deformation data sets, we aim to demonstrate the effect of using the 3D coseismic deformation fields on fault slip inversion. For the 2017 Iraq Mw7.3 earthquake, based on the LOS and 3D deformation data sets, respectively, we first assumed simple uniform-slip fault and used a nonlinear optimization approach to find the optimum model parameters. Subsequently, we compared our results with the published parameters [1,7] to confirm the main fault. Finally, we took the obtained fault geometry and inverted the fault variable slip using a linear approach.

4.1. Nonlinear Optimization

Based on the assumption of homogeneous elastic half-space, the geodetic data can be associated with a shear dislocation model that contains a set of fault source parameters. The Okada model is widely applied into the inversion of the main fault source parameters [36,37,38,39,40,41,42,43]. The fault source parameters can be derived by minimizing the discrepancies between the observed and simulated surface displacements. We set different objective functions to search optimum fault source parameters, including fault length, width, strike, dip, rake, slip, and depth.
When LOS deformation data sets were applied to inversion, the objective function can be expressed by Equation (3)
costfunction = i = 1 k ( 1 N i j = 1 N i ( u i f i ( t ) σ i ) 2 a i i = 1 k a i )
where k is the number of data sets; i is the index, j is the number i data sets’ index; αi is the weight factor of number I data sets; Ni is the counts of observation of number i data sets; ui, fi(t) and σi are observed deformation; simulated deformation and corresponding RMS the of number i data sets.
When the 3D deformation data sets were applied to inversion, the objective function can be defined as Equation (4) [20],
H = [ u 3 d G 3 d ( t ) s ] T × Σ u u 1 × [ u 3 d G 3 d ( t ) s ]
where u3d = [Du, Dn, De] denotes the 3D motion vector; G3d(t) = [Gu, Gn, Ge]T denotes the Green’s functions that describe how slip across rectangular dislocation causes displacement at the ground surface [36,37]; t represents a set of the fault geometric parameters; s represents a set of the slips of all the fault patches; G3d(t)∙s denotes the simulated deformation at a ground point; Σuu is the variance–covariance matrix describing the quality of the highly spatially correlated observation data, which can be determined by using an exponential covariance function [20].
Based on the objective functions, we searched the optimum fault source parameters in intervals provided by the GCMT (Global Centroid Moment Tensor), using the Levenberg–Marquardt algorithm which added damping factor [30]. We set the initial damping factor as 0.06. Table 2 shows the fault geometric parameters of our experiments and other studies [1,2]
It can be seen that our two results are quite similar with each other and closing to the published fault geometric parameters [1,2]. The strike is approximately 353°, close to NNW. The dip is approximately 15°, thus the fault slip has thrust property. The rake is approximately 138°, thus the fault slip has dextral property.

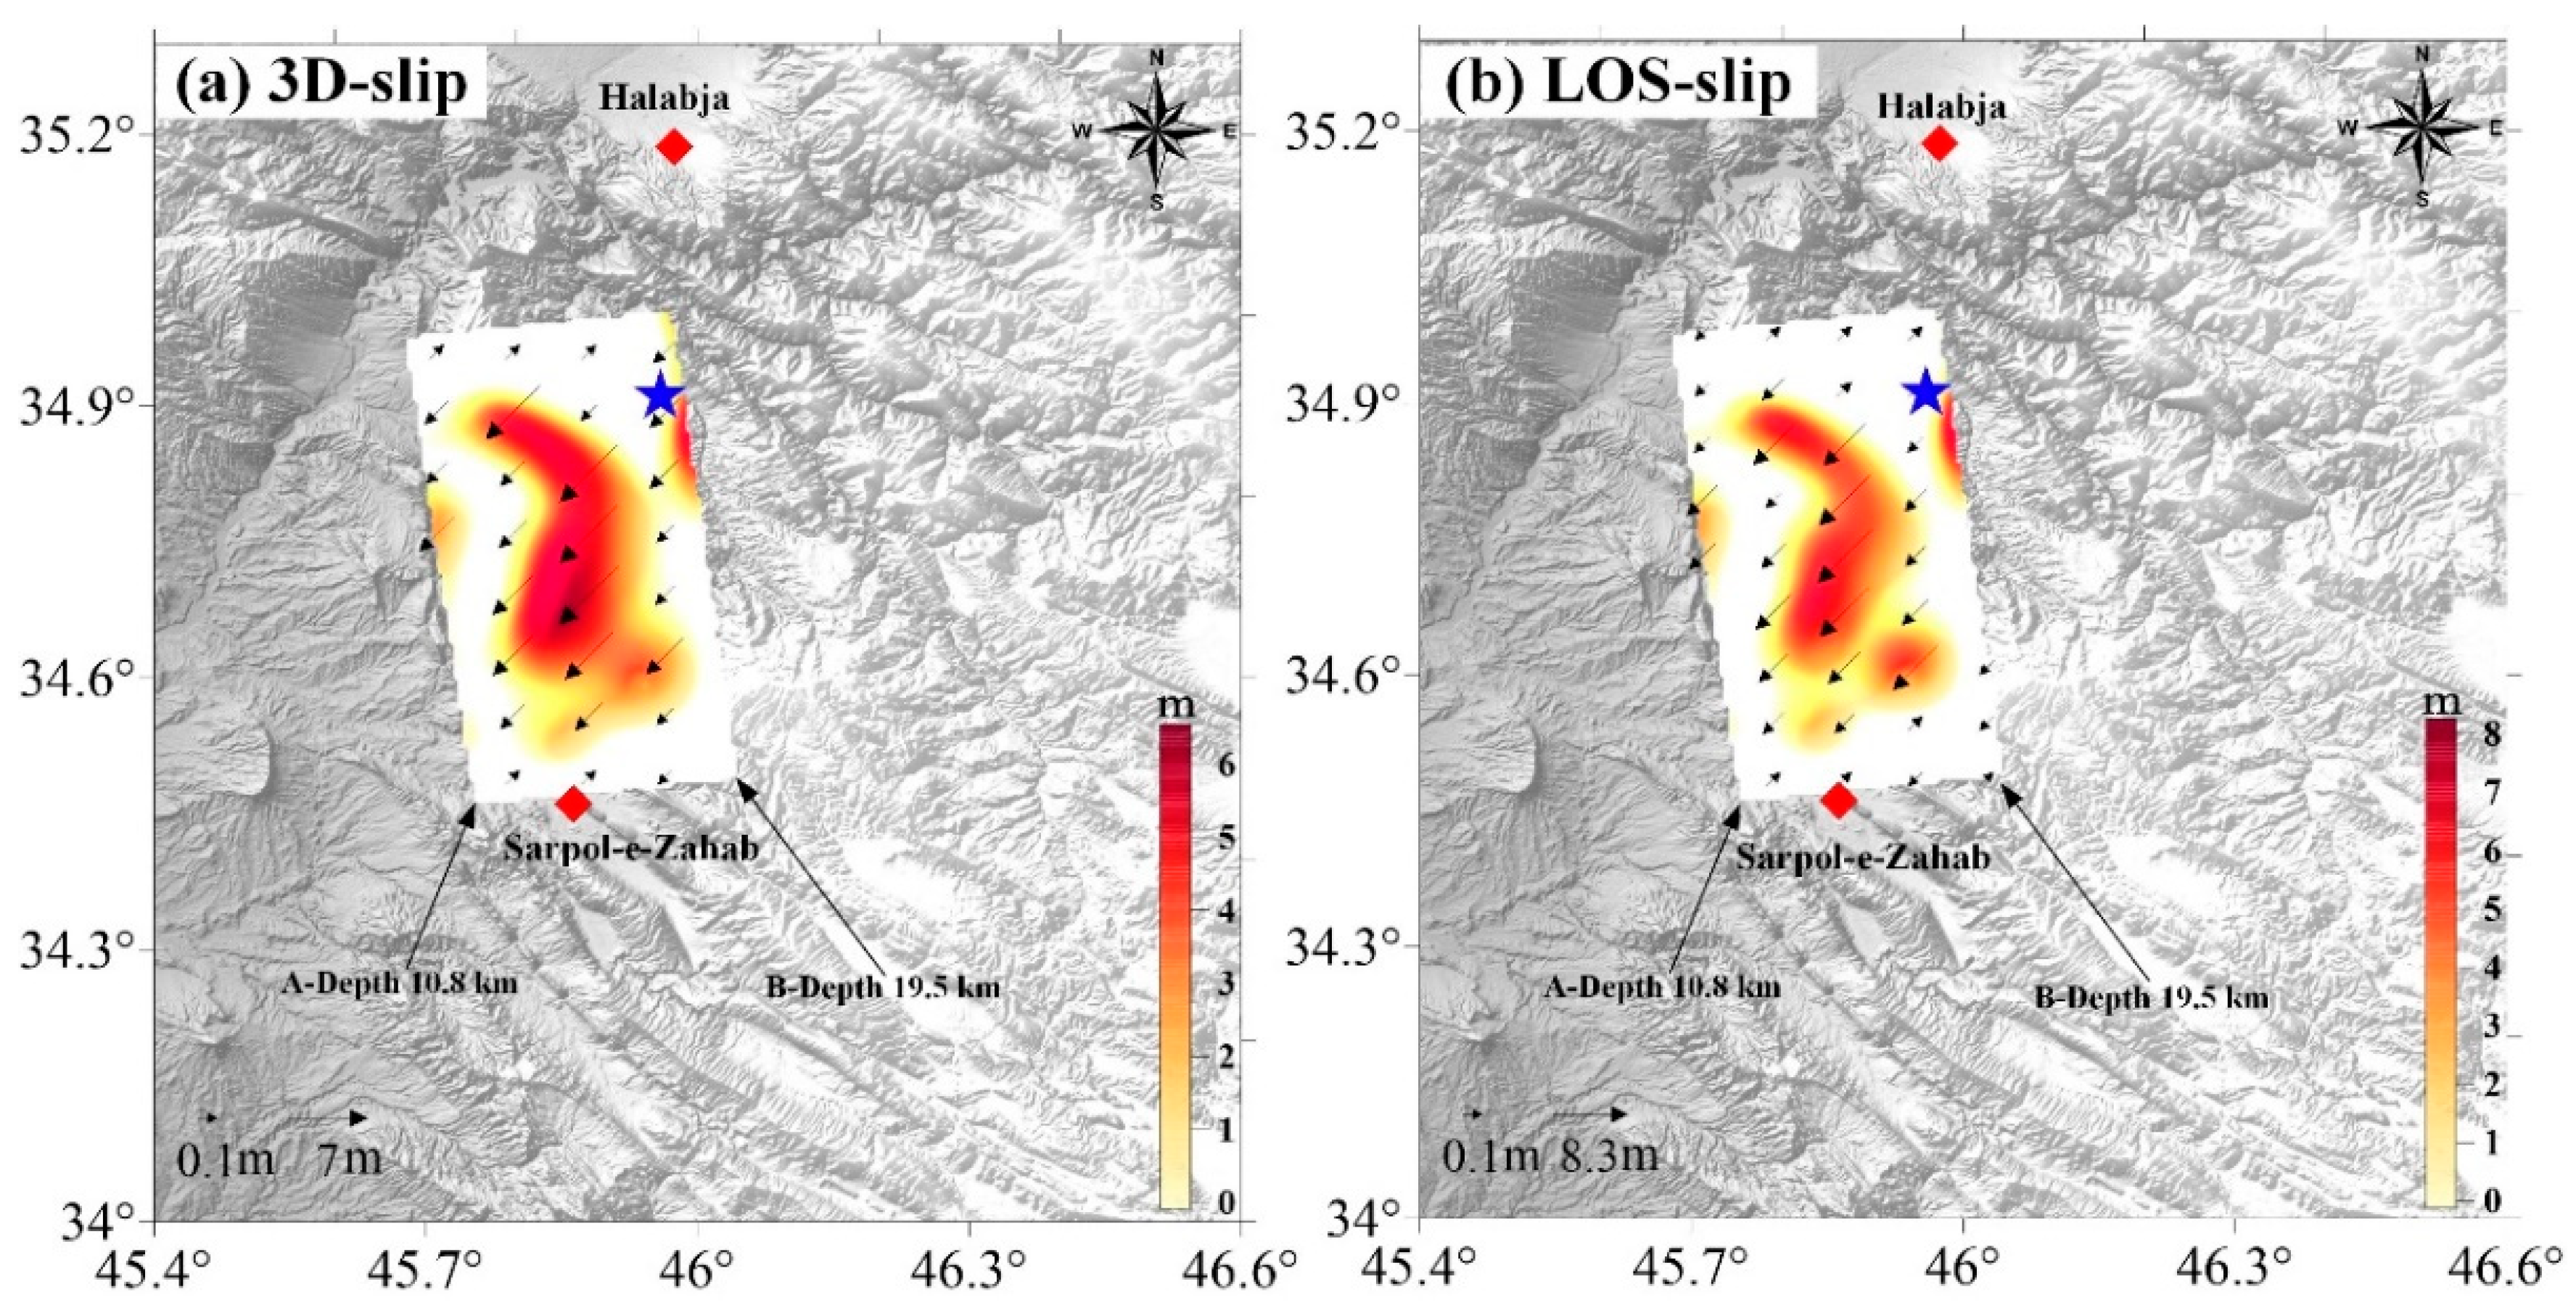
4.2. Variable Slip Inversion

Assuming uniform slip on fault planes is a simplification since the heterogeneity in fault displacement and rake is observed on all scales of fault [44]. The fault slip is variable. Therefore, based on the results of the nonlinear inversion, we extend the fault length and width to 60 km and 30 km, then divide it into the multiple patches of 1.5 km by 1.5 km, thus having 800 fault patches. Based on the Okada model, the Green functions were calculated, which contains the predicted LOS and three direction changes at each location in the displacement data set produced by unit slip on each fault patch (linear inversion). Thus having Equation (4),
[ u 0 0 ] = [ G 1 G 2 κ L 1 0 0 κ L 2 ] [ s 1 s 2 ] + ε
where u is the observed deformation; G1 and G2 are the Green’s function relating the surface deformation to the strike-slip and dip-slip, respectively; L1 and L2 are the Laplace smoothing constraint matrix of strike-slip and dip-slip, respectively; κ is the smoothing factor; s1 and s2 are strike-slip and dip-slip; ε is the error of observation and model building.
The Laplacian operator was used to smooth the slip solution, and its effect was controlled by the smoothing factor κ, which also controls a constraint of zero on the side and lower edges of the fault plane [44]. We fixed the rake at the value derived from the uniform slip model, and use the Fast Non-Negative Least Square (FNNLS) algorithm [45] to solve Equation (4). The amount of slip S = (s12 + s22)1/2. Figure 5a,b shows the main fault slip distribution based on the 3D and LOS deformation data sets. Figure 5a shows that the slip distributes at depths between 12 and 18 km, the peak slip with value of 6.53 m appears at depth of 14.5 km; Figure 5b shows that the slip distributes at depths between 12 and 18 km too. After comparing, we can find that the slip distribution of Figure 5a is more concentrated, more reasonable and having finer details than Figure 5b, thus the constraining by the 3D deformation data sets is more successful than the constraining by the LOS deformation data sets.
Figure 6 indicates that fault has weak dextral slip motion and strongly thrust motion. Most of the slip distribute in south area of epicenter. The depth of the fault top-left corner is 10.8 km. The city Sarpol-e-Zahab locates at the fault boundary almost, that’s why it suffered the highest intensity and destructions. The geologic structure background mentioned in Section 2 accounts for these characteristics of fault slip, precisely.

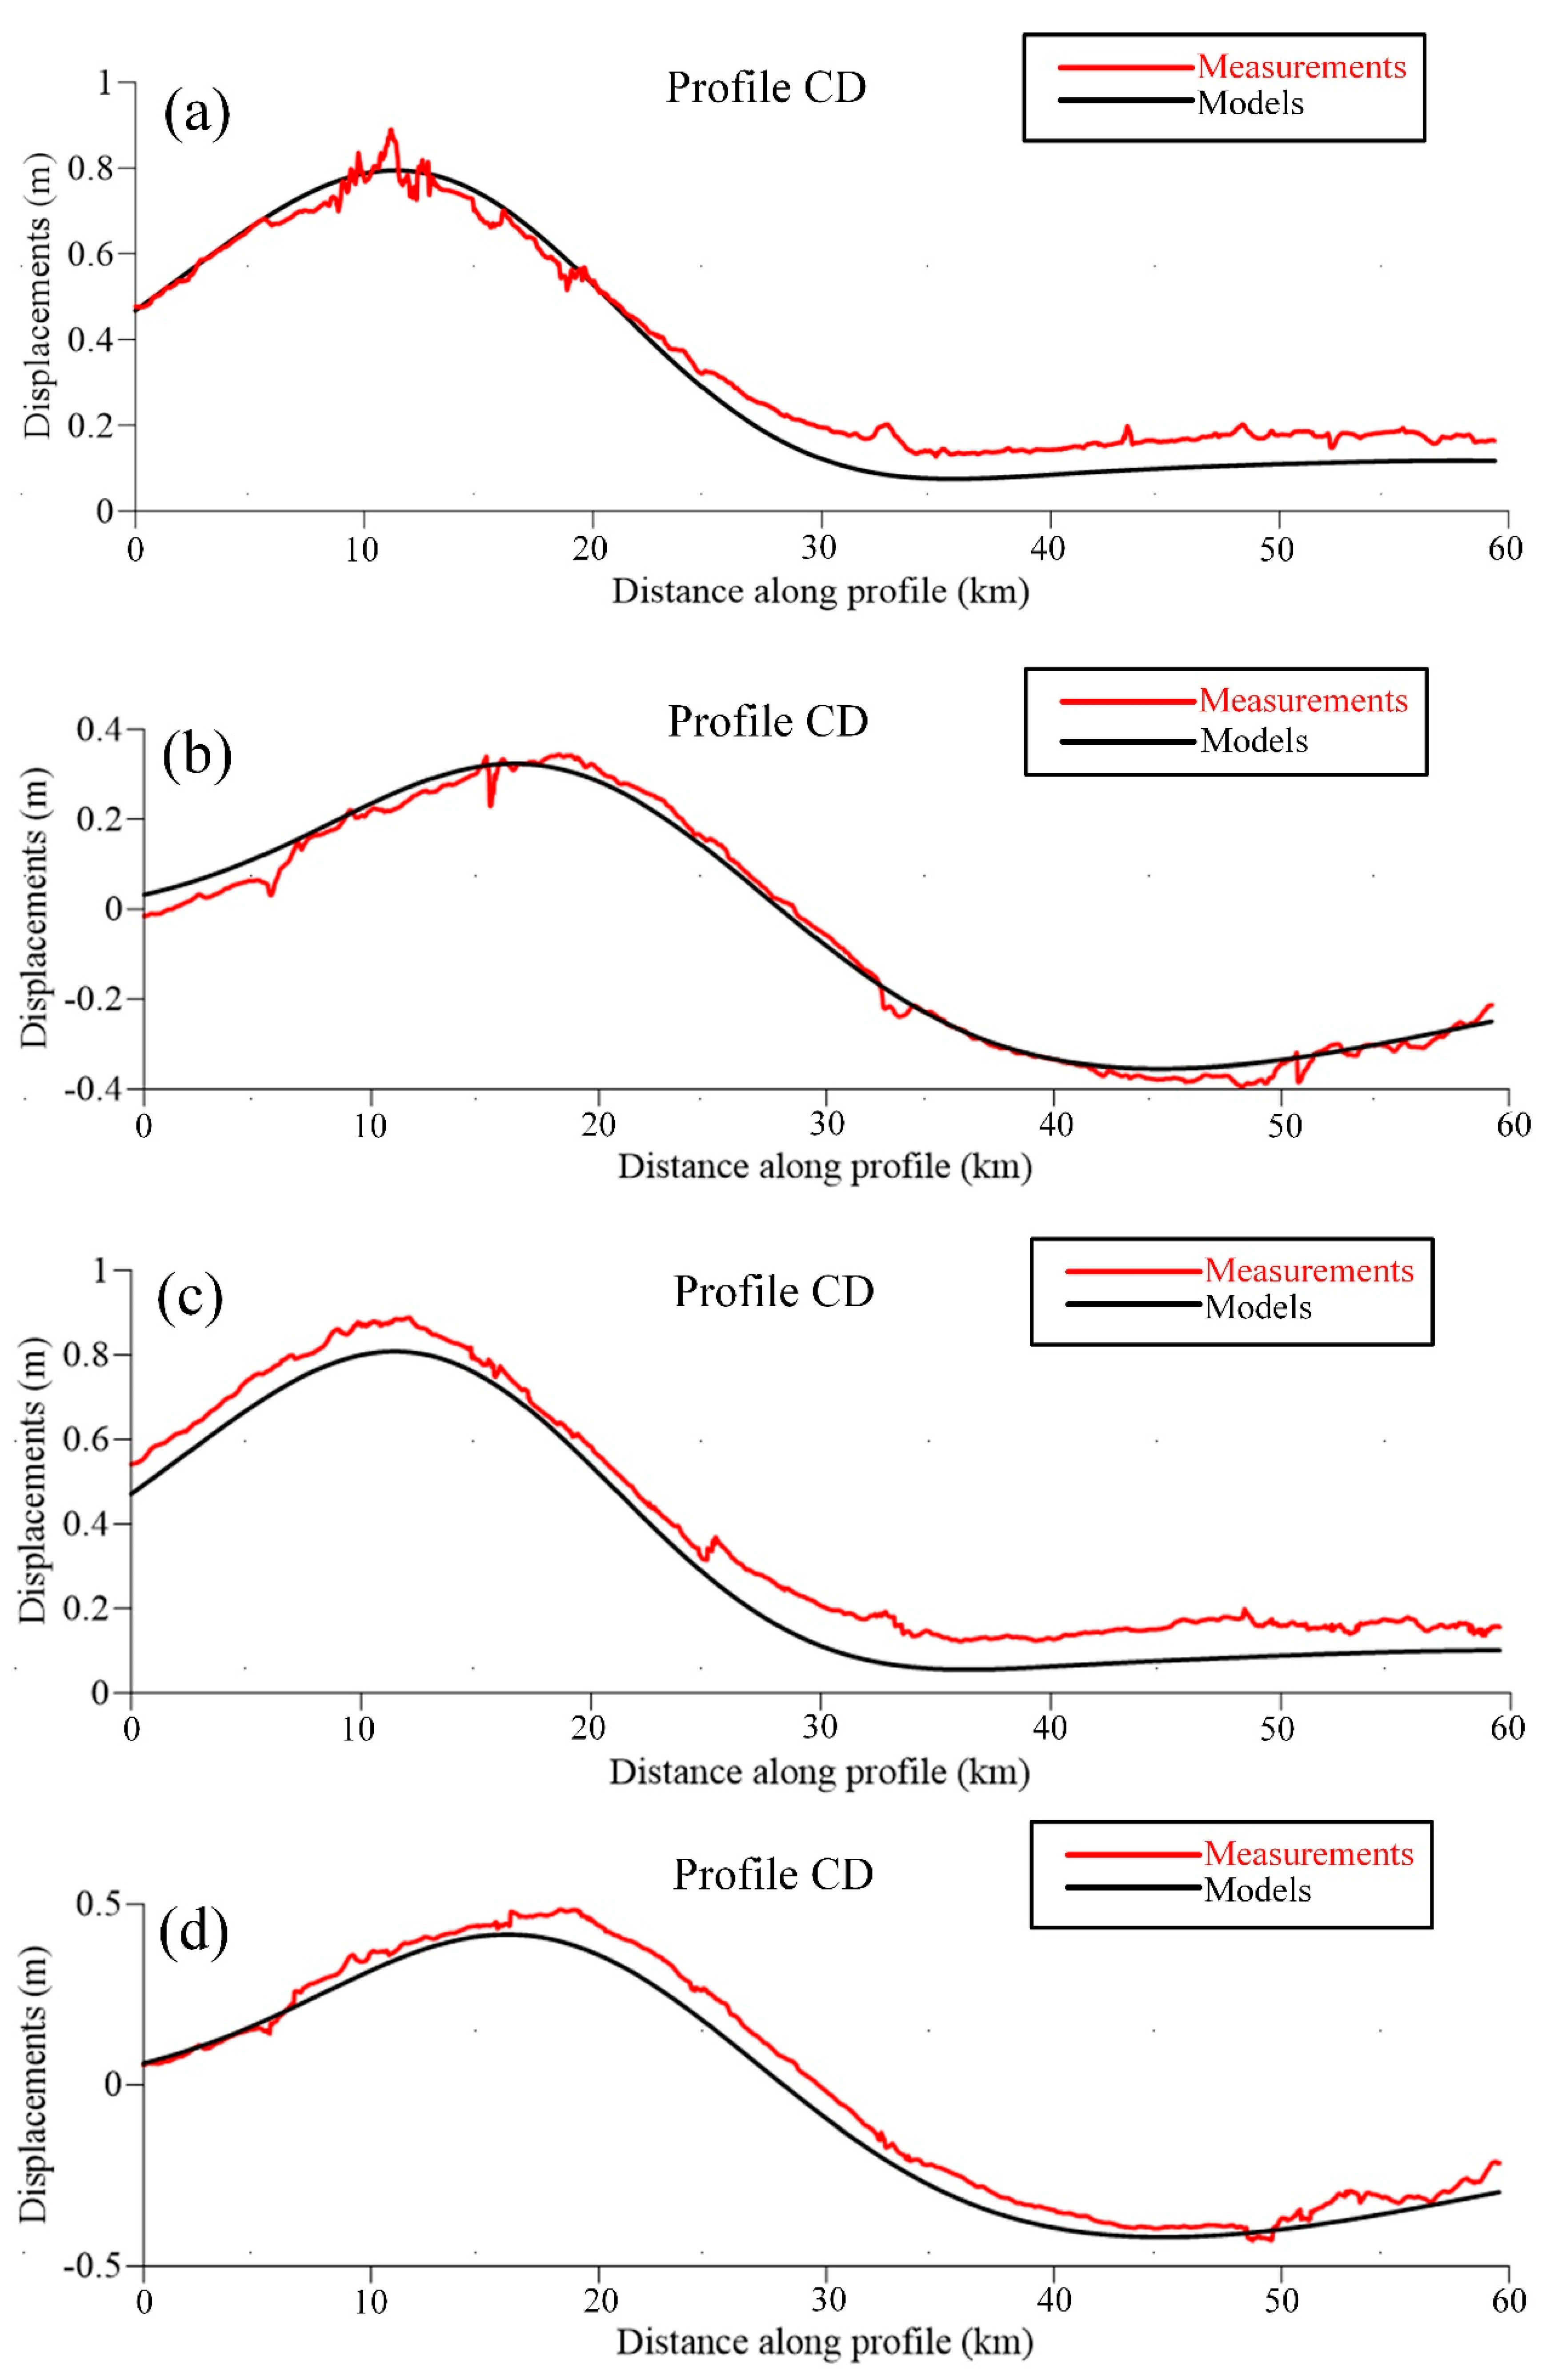
4.3. Comparison and Evaluation of Results

For further comparison and evaluation, we simulate the ascending and descending LOS deformation maps to calculate the residuals by our fault geometric parameters and slip based on Okada model. The 3D simulated deformation components were all projected to the LOS direction and the common area was cut for convenient comparison.
Figure 7 shows the measurements, models and residuals maps. The characteristics of simulated LOS deformation maps are well matched with the real LOS deformation maps, no matter based on the fault parameters and slip inversed from the LOS data sets or 3D data sets. The area where residuals exist of Figure 7c,f is smaller than the area of Figure 7i,l. The obvious residuals appear in the near field of Figure 7i,l.
For further comparison, we derive the profile CD on deformation maps. Figure 8 shows the displacements along the profile CD. Figure 8 shows the displacements along the profile CD. Regard smoothness and tendency of curve as a comparison-reference. It is clear that the profiles in Figure 8a,b are in agreement mostly, while the profiles in Figure 8c,d are in disagreement relatively. The differences exist due to the fault parameters inversed based on the 3D and LOS coseismic deformation data sets.
Figure 9 shows the residual distribution histograms. According to the Figure 9, the standard deviation (Std) of residuals in Figure 7c,f are 2.4 cm and 2.9 cm, respectively. The standard deviation of residuals in Figure 7i,l are 3.5 cm and 4.2 cm, respectively. The morphological characteristics of curves in Figure 9a,b are slimmer and higher than the curves in Figure 9c,d.
The comparative analysis indicated that the residuals of inversion based on the 3D data sets are controlled better. We regard the Std as the comparative standard. Thus, the fault inversion using the 3D data sets improved nearly 30% relatively the use of the LOS data sets. These results are within a reasonable range as defined by other studies [1,7], but our analysis is unique due to the reconstruction of constrained 3D surface movements and the derivation of the fault’s optimal focal plane. These results support existing seismological interpretations and contribute to a better understanding of the main fault’s behavior.

5. Conclusions

This paper combined DInSAR and MAI observations to reconstruct the 3D coseismic deformation associated with the 2017 Iraq Mw7.3 earthquake. From the 3D coseismic deformation filed, it can be found that the maximum coseismic displacements in U–D, N–S, and E–W direction are 100 cm, 50 cm, and 100 cm, respectively. The U–D components are the most violent, and the westward motion plays a major role in the horizontal motion. With the 3D displacements derived from the DInSAR and MAI measurements, it can be concluded that the Iraq earthquake predominantly resulted in reverse slip with small dextral slip component. Furthermore, fault inversions were performed based on the 3D and LOS coseismic deformation data sets, respectively. After comparison, we find that the 3D coseismic deformation data sets improved the inversions’ accuracy by 30%. Our results reveal a deep dislocation on an NNW trending fault (the strike is 352.63°) extending about 60 km, along the fault dips 14.76° to the ENE. The estimated seismic moment is 8.44 × 10¹⁹ Nm (Mw7.3), which is close to the solution provided by USGS (United States Geological Survey). The slip distributed at the depth between 12 and 18 km, and the peak slip of 6.53 appears at the depth of 14.5 km left near the epicenter. Further comparative analysis indicated that the inferred geodetic results derived from this study can be considered as the optimized results due the use of 3D displacements.
Considering the geological structure in the earthquake region, locations of aftershocks and fault source-parameters, it comes to a preliminary conclusion that the ZMFF (the Zagros Mountain Front fault) is responsible for the earthquake. In total, this paper demonstrates the superiority of using the 3D coseismic deformation fields on fault inversion.

Author Contributions

Z.W. completed the algorithm implementation, validation and prepared the manuscript. R.Z. proposed the basic idea and carefully revised the manuscript. Y.L. provided constructive suggestions on modifying the manuscript.

Funding

This work was jointly supported by the National Key Research and Development Program of China (No. 2017YFB0502700), the National Natural Science Foundation of China (No. 41474003, No. 41601503), and the Fundamental Research Funds for the Central Universities (No. 2682016CX087, No. 2682016CY19).

Conflicts of Interest

The authors declare no conflict of interest.

Abbreviations

AT (along-track); DInSAR (differential interferometric synthetic aperture radar); 3D (three-dimensional); MAI (multiple aperture InSAR); USGS (United States Geological Survey); GCMT (Global Centroid Moment Tensor); CENC (China Earthquake Networks Center).

References

  1. Kobayashi, T.; Morishita, Y.; Yarai, H.; Fujiwara, S. InSAR-derived Crustal Deformation and Reverse Fault Motion of the 2017 Iran-Iraq Earthquake in the Northwestern Part of the Zagros Orogenic Belt. Bull. Geospat. Inf. Auth. Jpn. 2019, 66, 2. [Google Scholar]
  2. Taymaz, T.; Nilfouroushan, F.; Yolsal-Çevikbilen, S.; Eken, T. Co-seismic Crustal Deformation of the 12 November 2017 Mw 7.4 Sar-Pol-Zahab (Iran) Earthquake: Integration of analysis based on DInSAR and seismological observations. In Proceedings of the EGU General Assembly, Vienna, Austria, 4–13 April 2018; Volume 20. [Google Scholar]
  3. Feng, W.; Samsonov, S.; Almeida, R.; Yassaghi, A.; Li, J.; Qiu, Q.; Li, P.; Zheng, W. Geodetic constraints of the 2017 Mw7.3 Sarpol Zahab, Iran earthquake and its implications on the structure and mechanics of the north-west Zagros thrust-fold belt. Geophys. Res. Lett. 2018, 45, 6853–6861. [Google Scholar] [CrossRef]
  4. Gunce, H.B.; San, B.T. Measuring Earthquake-Induced Deformation in the South of Halabjah (Sarpol-e-Zahab) Using Sentinel-1 Data on 12 November 2017. In Proceedings of the Multidisciplinary Digital Publishing Institute Proceedings, 22 March–5 April 2018; Volume 2. [Google Scholar]
  5. Barnhart, W.D.; Brengman, C.M.J.; Li, S.; Peterson, K.E. Ramp-flat basement structures of the Zagros Mountains inferred from co-seismic slip and afterslip of the 2017 M w 7.3 Darbandikhan, Iran/Iraq earthquake. Earth Planet. Sci. Lett. 2018, 496, 96–107. [Google Scholar] [CrossRef]
  6. Tavani, S.; Parente, M.; Puzone, F.; Corradetti, A.; Gharabeigli, G.; Valinejad, M.; Morsalnejad, D.; Mazzoli, S. The seismogenic fault system of the 2017 M w 7.3 Iran–Iraq earthquake: Constraints from surface and subsurface data, cross-section balancing, and restoration. Solid Earth 2018, 9, 821. [Google Scholar] [CrossRef]
  7. Wang, W.; He, J.; Hao, J.; Yao, Z. Preliminary result for the rupture process of Nov. 13, 2017, Mw7. 3 earthquake at Iran-Iraq border. Earth Planet. Phys. 2018, 2, 82–83. [Google Scholar] [CrossRef]
  8. Dai, K.R. Integration of New Generation SAR Data for Extracting the Earth’s Surface Topography and Displacement: Methodology and Modeling. Ph.D. Thesis, South West Jiaotong University, Chengdu, China, 2017. [Google Scholar]
  9. Bechor, N.B.D.; Zebker, H.A. Measuring two-dimensional movements using a single InSAR pair. Geophys. Res. Lett. 2006, 33. [Google Scholar] [CrossRef] [Green Version]
  10. Jung, H.S.; Won, J.S.; Kim, S.W. An Improvement of the Performance of Multiple-Aperture SAR Interferometry (MAI). IEEE Trans. Geosci. Remote Sens. 2009, 47, 2859–2869. [Google Scholar] [CrossRef]
  11. Jung, H.S.; Yun, S.H.; Jo, M.J. An Improvement of Multiple-Aperture SAR Interferometry Performance in the Presence of Complex and Large Line-of-Sight Deformation. IEEE J. Sel. Top. Appl. Earth Obs. Remote Sens. 2015, 8, 1743–1752. [Google Scholar] [CrossRef]
  12. Hu, J.; Li, Z.W.; Zhang, L.; Ding, X.; Zhu, J.; Sun, Q.; Ding, W. Correcting ionospheric effects and monitoring two-dimensional displacement fields with multiple-aperture InSAR technology with application to the Yushu earthquake. Sci. China Earth Sci. 2012, 55, 1961–1971. [Google Scholar] [CrossRef]
  13. Fialko, Y.; Simons, M.; Agnew, D. The complete (3-D) surface displacement field in the epicentral area of the 1999 M W 7.1 Hector Mine Earthquake, California, from space geodetic observations. Geophys. Res. Lett. 2001, 28, 3063–3066. [Google Scholar] [CrossRef]
  14. Fialko, Y.; Sandwell, D.; Simons, M.; Rosen, P. Three-dimensional deformation caused by the Bam, Iran, earthquake and the origin of shallow slip deficit. Nature 2005, 435, 295. [Google Scholar] [PubMed]
  15. Wang, X.W.; Liu, G.X.; Zhang, R.; Yu, B.; Li, T. Extracting 3D Deformation Field by integration of Multiple Aperture Interferometry and Conventional synthetic aperture radar Interferometry. J. Geod. Geodyn. 2014, 34, 127–134. [Google Scholar]
  16. Wang, H.; Ge, L.; Xu, C.; Du, Z. 3-D coseismic displacement field of the 2005 Kashmir earthquake inferred from satellite radar imagery. Earth Planets Space 2007, 59, 343–349. [Google Scholar] [CrossRef] [Green Version]
  17. Hu, J.; Wang, Q.J.; Li, Z.W.; Xie, R.A.; Zhang, X.Q.; Sun, Q. Retrieving three-dimensional coseismic displacements of the 2008 Gaize, Tibet earthquake from multi-path interferometric phase analysis. Nat. Hazards 2014, 73, 1311–1322. [Google Scholar] [CrossRef]
  18. Hu, J.; Li, Z.W.; Ding, X.L.; Zhu, J.J.; Zhang, L.; Sun, Q. 3D coseismic Displacement of 2010 Darfield, New Zealand earthquake estimated from multi-aperture InSAR and D-InSAR measurements. J. Geod. 2012, 86, 1029–1041. [Google Scholar] [CrossRef]
  19. Elliott, J.R.; Jolivet, R.; González, P.J.; Avouac, J.-P.; Hollingsworth, J.; Searle, M.P.; Stevens, V.L. Himalayan megathrust geometry and relation to topography revealed by the Gorkha earthquake. Nat. Geosci. 2016, 9, 174. [Google Scholar] [CrossRef]
  20. Wang, X.W. Ionospheric Error Correction and Three-Dimensional Coseimic Deformation Estimation and Fault Slip Inversion with InSAR AND MAI. Ph.D. Thesis, South West Jiaotong University, Chengdu, China, 2017. [Google Scholar]
  21. Wright, T.J.; Parsons, B.E.; Lu, Z. Toward mapping surface deformation in three dimensions using insar. Geophys. Res. Lett. 2004, 31, 169–178. [Google Scholar] [CrossRef]
  22. Wang, Z.; Zhang, R.; Wang, X.; Liu, G. Retrieving Three-Dimensional Co-Seismic Deformation of the 2017 Mw7.3 Iraq Earthquake by Multi-Sensor SAR Images. Remote Sens. 2018, 10, 857. [Google Scholar] [CrossRef]
  23. Meyer, F.; Bamler, R.; Jakowski, N.; Fritz, T. The Potential of Low-Frequency SAR Systems for Mapping Ionospheric TEC Distributions. IEEE Geosci. Remote Sens. Lett. 2006, 3, 560–564. [Google Scholar] [CrossRef]
  24. Meyer, F.J. Performance Requirements for Ionospheric Correction of Low-Frequency SAR Data. IEEE Trans. Geosci. Remote Sens. 2011, 49, 3694–3702. [Google Scholar] [CrossRef]
  25. Liu, Z.; Jung, H.S.; Lu, Z. Joint Correction of Ionosphere Noise and Orbital Error in L-Band SAR Interferometry of Interseismic Deformation in Southern California. IEEE Trans. Geosci. Remote Sens. 2014, 52, 3421–3427. [Google Scholar] [CrossRef]
  26. Rosen, P.A.; Hensley, S.; Chen, C. Measurement and mitigation of the ionosphere in L-band Interferometric SAR data. In Proceedings of the 2010 IEEE Radar Conference, Washington, DC, USA, 10–14 May 2010; pp. 1459–1463. [Google Scholar]
  27. Brcic, R.; Parizzi, A.; Eineder, M.; Bamler, R.; Meyer, F. Estimation and compensation of ionospheric delay for SAR interferometry. In Proceedings of the 2010 IEEE International Geoscience and Remote Sensing Symposium, Honolulu, HI, USA, 25–30 July 2010; pp. 2908–2911. [Google Scholar]
  28. Vernant, P.; Nilforoushan, F.; Hatzfeld, D.; Abbassi, M.R.; Vigny, C.; Masson, F.; Nankali, H.; Martinod, J.; Ashtiani, A.; Bayer, R.; et al. Present-day crustal deformation and plate kinematics in the Middle East constrained by GPS measurements in Iran and northern Oman. Geophys. J. Int. 2004, 157, 381–398. [Google Scholar] [CrossRef] [Green Version]
  29. Madanipour, S.; Ehlers, T.A.; Yassaghi, A.; Rezaeian, M.; Enkelmann, E.; Bahroudi, A. Synchronous deformation on orogenic plateau margins: Insights from the Arabia–Eurasia collision. Tectonophysics 2013, 608, 440–451. [Google Scholar] [CrossRef]
  30. Liang, C.; Fielding, E.J. Measuring azimuth deformation with L-band ALOS-2 ScanSAR interferometry. IEEE Trans. Geosci. Remote Sens. 2017, 55, 2725–2738. [Google Scholar] [CrossRef]
  31. Farr, T.G.; Rosen, P.A.; Caro, E.; Crippen, R.; Duren, R.; Hensley, S.; Kobrick, M.; Paller, M.; Rodriguez, E.; Roth, L.; et al. The Shuttle Radar Topography Mission. Rev. Geophys. 2007, 45. [Google Scholar] [CrossRef] [Green Version]
  32. Goldstein, R.M.; Werner, C.L. Radar interferogram filtering for geophysical applications. Geophys. Res. Lett. 1998, 25, 4035–4038. [Google Scholar] [CrossRef] [Green Version]
  33. Eineder, M.; Hubig, M.; Milcke, B. Unwrapping large interferograms using the minimum cost flow algorithm, Geoscience and Remote Sensing Symposium Proceedings, 1998. In Proceedings of the 1998 IEEE International Geoscience and Remote Sensing, Seattle, WA, USA, 6–10 July 1998; Volume 1. [Google Scholar]
  34. Jónsson, S.; Zebker, H.; Segall, P.; Amelung, F. Fault Slip Distribution of the 1999 Mw 7.1 Hector Mine, California, Earthquake, Estimated from Satellite Radar and GPS Measurements. Bull. Seismol. Soc. Am. 2002, 92, 1377–1389. [Google Scholar] [CrossRef]
  35. Lee, C.W.; Lu, Z.; Jung, H.S. Simulation of time-series surface deformation to validate a multi-interferogram InSAR processing technique. Int. J. Remote Sens. 2012, 33, 7075–7087. [Google Scholar] [CrossRef]
  36. Okada, Y. Surface deformation due to shear and tensile faults in a half-space. Bull. Seismol. Soc. Am. 1985, 75, 1135–1154. [Google Scholar]
  37. Okada, Y. Internal deformation due to shear and tensile faults in a half-space. Bull. Seismol. Soc. Am. 1992, 82, 1018–1040. [Google Scholar]
  38. Furuya, M.; Takada, Y.; Aoki, Y. PALSAR InSAR Observation and Modeling of Crustal Deformation Due to the 2007 Chuetsu-Oki Earthquake in Niigata, Japan. In International Association of Geodesy Symposia, Proceedings of the Gravity, Geoid and Earth Observation, Crete, Greece, 23–27 June 2008; Springer: Berlin/Heidelberg, Geramny, 2010; pp. 679–687. [Google Scholar]
  39. Béjar-Pizarro, M.; Carrizo, D.; Socquet, A.; Armijo, R.; Barrientos, S.; Bondoux, F.; Bonvalot, S.; Campos, J.; Comte, D.; de Chabalier, J.B.; et al. Asperities and barriers on the seismogenic zone in North Chile: State-of-the-art after the 2007 Mw 7.7 Tocopilla earthquake inferred by GPS and InSAR data. Geophys. J. Int. 2010, 183, 390–406. [Google Scholar] [CrossRef]
  40. Atzori, S.; Hunstad, I.; Chini, M.; Salvi, S.; Tolomei, C.; Bignami, C.; Stramondo, S.; Trasatti, E.; Antonioli, A.; Boschi, E. Finite fault inversion of DInSAR coseismic displacement of the 2009 L’Aquila earthquake (central Italy). Geophys. Res. Lett. 2009, 36. [Google Scholar] [CrossRef]
  41. Li, Z.; Elliott, J.R.; Feng, W.; Jackson, J.A.; Parsons, B.E.; Walters, R.J. The 2010 MW 6.8 Yushu (Qinghai, China) earthquake: Constraints provided by InSAR and body wave seismology. J. Geophys. Res. Solid Earth 2011, 116. [Google Scholar] [CrossRef]
  42. Wang, X.W.; Liu, G.X.; Yu, B.; Dai, K.; Zhang, R.; Chen, Q.; Li, Z. 3D coseismic deformations and source parameters of the 2010 Yushu earthquake (China) inferred from DInSAR and multiple-aperture InSAR measurements. Remote Sens. Environ. 2014, 152, 174–189. [Google Scholar] [CrossRef]
  43. Marquardt, D.W. An Algorithm for Least-Squares Estimation of Nonlinear Parameters. J. Soc. Ind. Appl. Math. 1963, 11, 431–441. [Google Scholar] [CrossRef]
  44. Mai, P.M.; Beroza, G.C. A spatial random field model to characterize complexity in earthquake slip. J. Geophys. Res. Solid Earth 2002, 107. [Google Scholar] [CrossRef]
  45. Bro, R.; de Jong, S. A fast non-negativity-constrained least squares algorithm. J. Chemom. 1997, 11, 393–401. [Google Scholar] [CrossRef]
Figure 1. Shaded relief map of study area and image coverage. The yellow star indicates the epicenter of the mainshock (Mw 7.3). The red dots show the aftershocks with magnitude higher than Mw4.0 before 17 November 2017. The blue solid squares indicate the five cities with intensity reaching up to VI or higher. The black and red rectangles mark the coverage of SAR images. The dark red line represents the boundary between the Iraq and Iran.
Remotesensing 11 02248 g001
Figure 2. The coseismic deformation maps in the LOS directions. (a,b) obtained from ALOS-2 DInSAR processing. (c,d) obtained from Sentinel-1a DInSAR processing. The red star represents the epicenter of the mainshock; The red solid squares represent the city Halabja and Sarpol-e-Zahab. The black line AB is the deformation bound.
Remotesensing 11 02248 g002
Figure 3. The along track deformation maps derived from MAI (multiple aperture InSAR) processing. (a,b) derived from ascending and descending ALOS-2 MAI processing, respectively. The red star represents the epicenter of the mainshock; The red solid squares represent the city Halabja and Sarpol-e-Zahab. The black line AB is the deformation bound.
Remotesensing 11 02248 g003
Figure 4. The 3D coseismic displacements maps. (ac) represent the deformation maps in up–down, east–west, and north–south directions. The red star represents the epicenter of the mainshock. The red solid squares represent the city Halabja and Sarpol-e-Zahab. The black line AB is the deformation bound in Figure 2. The arrows in (a) are the horizontal motion vectors including EW and N–S displacements vectors.
Remotesensing 11 02248 g004
Figure 5. The main fault slip distribution. (a,b) are obtained by variable slip inversion based on the 3D deformation data sets and the line-of-sight (LOS) deformation data sets, respectively.
Remotesensing 11 02248 g005
Figure 6. Schematic view of the source mechanism. (a,b) are source mechanism based on the 3D deformation data sets and the line-of-sight (LOS) deformation data sets, respectively. The blue star represents the epicenter of the mainshock. The red solid squares represent the city Halabja and Sarpol-e-Zahab. The arrows in (a,b) are the slip vectors.
Remotesensing 11 02248 g006
Figure 7. The measurements, models and residuals maps. (af) derived from the 3D coseismic deformation data sets. (gl) derived from the LOS coseismic deformation data sets. The black line is the profile CD.
Remotesensing 11 02248 g007
Figure 8. The displacements along the profile CD. (a,b) correspond the profile CD in Figure 7a,b and Figure 7d,e, respectively. (c,d) correspond the profile CD in Figure 7g,h and Figure 7j,k, respectively.
Remotesensing 11 02248 g008
Figure 9. The residual distribution histograms. (a,b) correspond the residual in Figure 7c,f, respectively. (c,d) correspond the resiudal in Figure 7i,l, respectively.
Remotesensing 11 02248 g009
Table 1. The parameters of selected SAR images.
SAR SensorMaster ImageSlave ImageObservation ModeB (m)BT (days)Orbit
ALOS-22016080920171114ScanSAR−70 m462Ascending
2017100420171115ScanSAR+160 m42Descending
Sentinel-1A2017111120171123IW Tops mode−33.6 m12Ascending
2017110720171119IW Tops mode15.312Descending
Table 2. Fault geometric parameters from nonlinear optimizations assuming uniform slip (this study and earlier publications).
Institution/IndividualLongitude (°)Latitude (°)Moment Magnitude MwStrike (°)Dip (°)Rake (°)Depth (km)
GCMT45.8434.837.43511114017.86
USGS [2]45.9634.917.33511613719
CSI45.7934.937.83431012825
Taymaz [1]7.43581614919±2
Experiment A45.8634.747.3352.6514.44139.2918.52
Experiment B45.8634.737.3352.6314.76137.114.17
a Denotes the “Experiment A” and “Experiment B” represents the results based on the LOS and 3D deformation data sets, respectively.

