Article

Wildfires on the Mongolian Plateau: Identifying Drivers and Spatial Distributions to Predict Wildfire Probability

1
Key Laboratory of Geographical Processes and Ecological Security in Changbai Mountains, Ministry of Education, School of Geographical Sciences, Northeast Normal University, Changchun 130024, China
2
Urban Remote Sensing Application Innovation Center, School of Geographical Sciences, Northeast Normal University, Changchun 130024, China
*
Author to whom correspondence should be addressed.
Remote Sens. 2019, 11(20), 2361; https://0-doi-org.brum.beds.ac.uk/10.3390/rs11202361
Submission received: 11 July 2019 / Revised: 23 August 2019 / Accepted: 11 October 2019 / Published: 11 October 2019
(This article belongs to the Special Issue Remote Sensing and Image Processing for Fire Science and Management)

Abstract

:
With climate change, significant fluctuations in wildfires have been observed on the Mongolian Plateau. The ability to predict the distribution of wildfires in the context of climate change plays a critical role in wildfire management and ecosystem maintenance. In this paper, Ripley’s K function and a Random Forest (RF) model were applied to analyse the spatial patterns and main influencing factors affecting the occurrence of wildfire on the Mongolian Plateau. The results showed that the wildfires were mainly clustered in space due to the combination of influencing factors. The distance scale is less than 1/2 of the length of the Mongolian Plateau; that is, it does not experience boundary effects in the study area and it meets the requirements of Ripley’s K function. Among the driving factors, the fraction of vegetation coverage (FVC), land use degree (La), elevation, precipitation (pre), wet day frequency (wet), and maximum temperature (tmx) had the greatest influences, while the aspect had the lowest influence. The likelihood of fire was mainly concentrated in the northern, eastern, and southern parts of the Mongolian Plateau and in the border area between the Inner Mongolia Autonomous Region (Inner Mongolia) and Mongolian People’s Republic (Mongolia), and wildfires did not occur or occurred less frequently in the hinterland area. The fitting results of the RF model showed a prediction accuracy exceeding 90%, which indicates that the model has a high ability to predict wildfire occurrences on the Mongolian Plateau. This study can provide a reference for predictions and decision-making related to wildfires on the Mongolian Plateau.

1. Introduction

Wildfires are a type of natural hazard that is affected by many environmental factors and the interactions between those factors [1]. Wildfires play a macro-control role in the self-renewal and succession of ecosystems over large scale spatial and temporal ranges. The fire occurrence cycle affects changes in the geochemical cycle and the speed and stage of community succession [2]. Under global warming, the global climate has become abnormal in recent decades, and aridification has increased in the middle and high latitudes [3]. Specifically, high-temperatures, low-temperature freezing damage, uneven precipitation, continuous droughts in the spring and summer and other abnormal climatic phenomena are increasing [4]. As a result, the fire frequency and the duration of disturbances are increasing [5]. These changes affect the material cycles, energy flows, and information transmission of ecosystems. The spatial distribution pattern of fire occurrences has an important effect on the spatial distribution and balance of the fuel productivity, landscape characteristics, and land use patterns [6]. Moreover, fires can burn large areas within a short time, destroying the ecosystem structure and function, reducing the grade of vegetation products, dramatically changing the environment, and even threatening people’s lives and property and national ecological resources [7]. Therefore, the study of the spatial distribution patterns and influencing factors of wildfires is helpful for revealing the natural causes of fire occurrences and their impacts on various ecological processes.
A common approach when analysing the influencing factors of wildfires is the use of a traditional method that can be used to predict wildfire occurrences with respect to different variables. The traditional method is powerful in terms of its prediction power, but it is limited by the assumptions of normality and linear relationships [8]. In recent years, the Random Forest (RF) model has been widely applied in the field of ecology and exhibits a high prediction accuracy [9]. A few scholars have applied RF models to forest fire prediction, and those models have shown good predictive power [10]. Compared with traditional methods, machine learning algorithms can overcome subjective factors and are widely used in various research fields [11]. The commonly used machine learning algorithms include artificial neural networks, support vector machines and classification and regression trees. However, the above machine learning methods also have some shortcomings. Artificial neural networks have the disadvantages of difficulty in determining the initial weights and a slow convergence speed. Classification and regression trees are sensitive to data noise and training sample errors. How the selection of the kernel functions of support vector machines affects the classification accuracy remains uncertain [12]. These shortcomings affect the accuracies of the researches results. By contrast, RF is a non-parametric machine learning ensemble algorithm that has a strong anti-noise ability and low sensitivity to outliers and can effectively overcome the over fitting phenomenon [13]. Based on these advantages, RF has achieved high classification accuracy in research, and it is gradually becoming widely used in the remote sensing image classification field [14].
The Mongolian Plateau is the main region of temperate grassland in Eurasia and is an area where fires are extremely active [15]. Some research results in this area show that the fire occurrence in parts of the Mongolian Plateau is dominated by climatic factors such as precipitation, humidity, temperature and wind speed [16]. In the context of global warming, wildfire prevention is facing a severe challenge [17,18]. The occurrence of a single wildfire may be regarded as a random event, but the occurrence and distribution of wildfires on the landscape and even at the regional scale are not completely random; rather, they present certain spatial and temporal distribution characteristics [19]. Traditional wildfire occurrence information is mainly derived from statistical data; it is difficult to cover large areas because data collection is difficult, and quantifying the data space is challenging. Around the year 2000, the rapid development of remote sensing technology began to greatly improve the accuracy of large-scale and sudden wildfire monitoring. Burned area data are widely available in near-real time by remote sensing. We select the Moderate Resolution Imaging Spectroradiometer (MODIS) burned area product MCD64A1 data to study wildfires on the Mongolian Plateau and accomplish the following objectives: (1) identify the spatial distribution of wildfires on the Mongolian Plateau, (2) understand the comprehensive influencing factors affecting fire occurrence, and (3) produce spatially explicit statistical models and a map predicting patterns of wildfires on the Mongolian Plateau based on various driving factors.

2. Materials and Methods
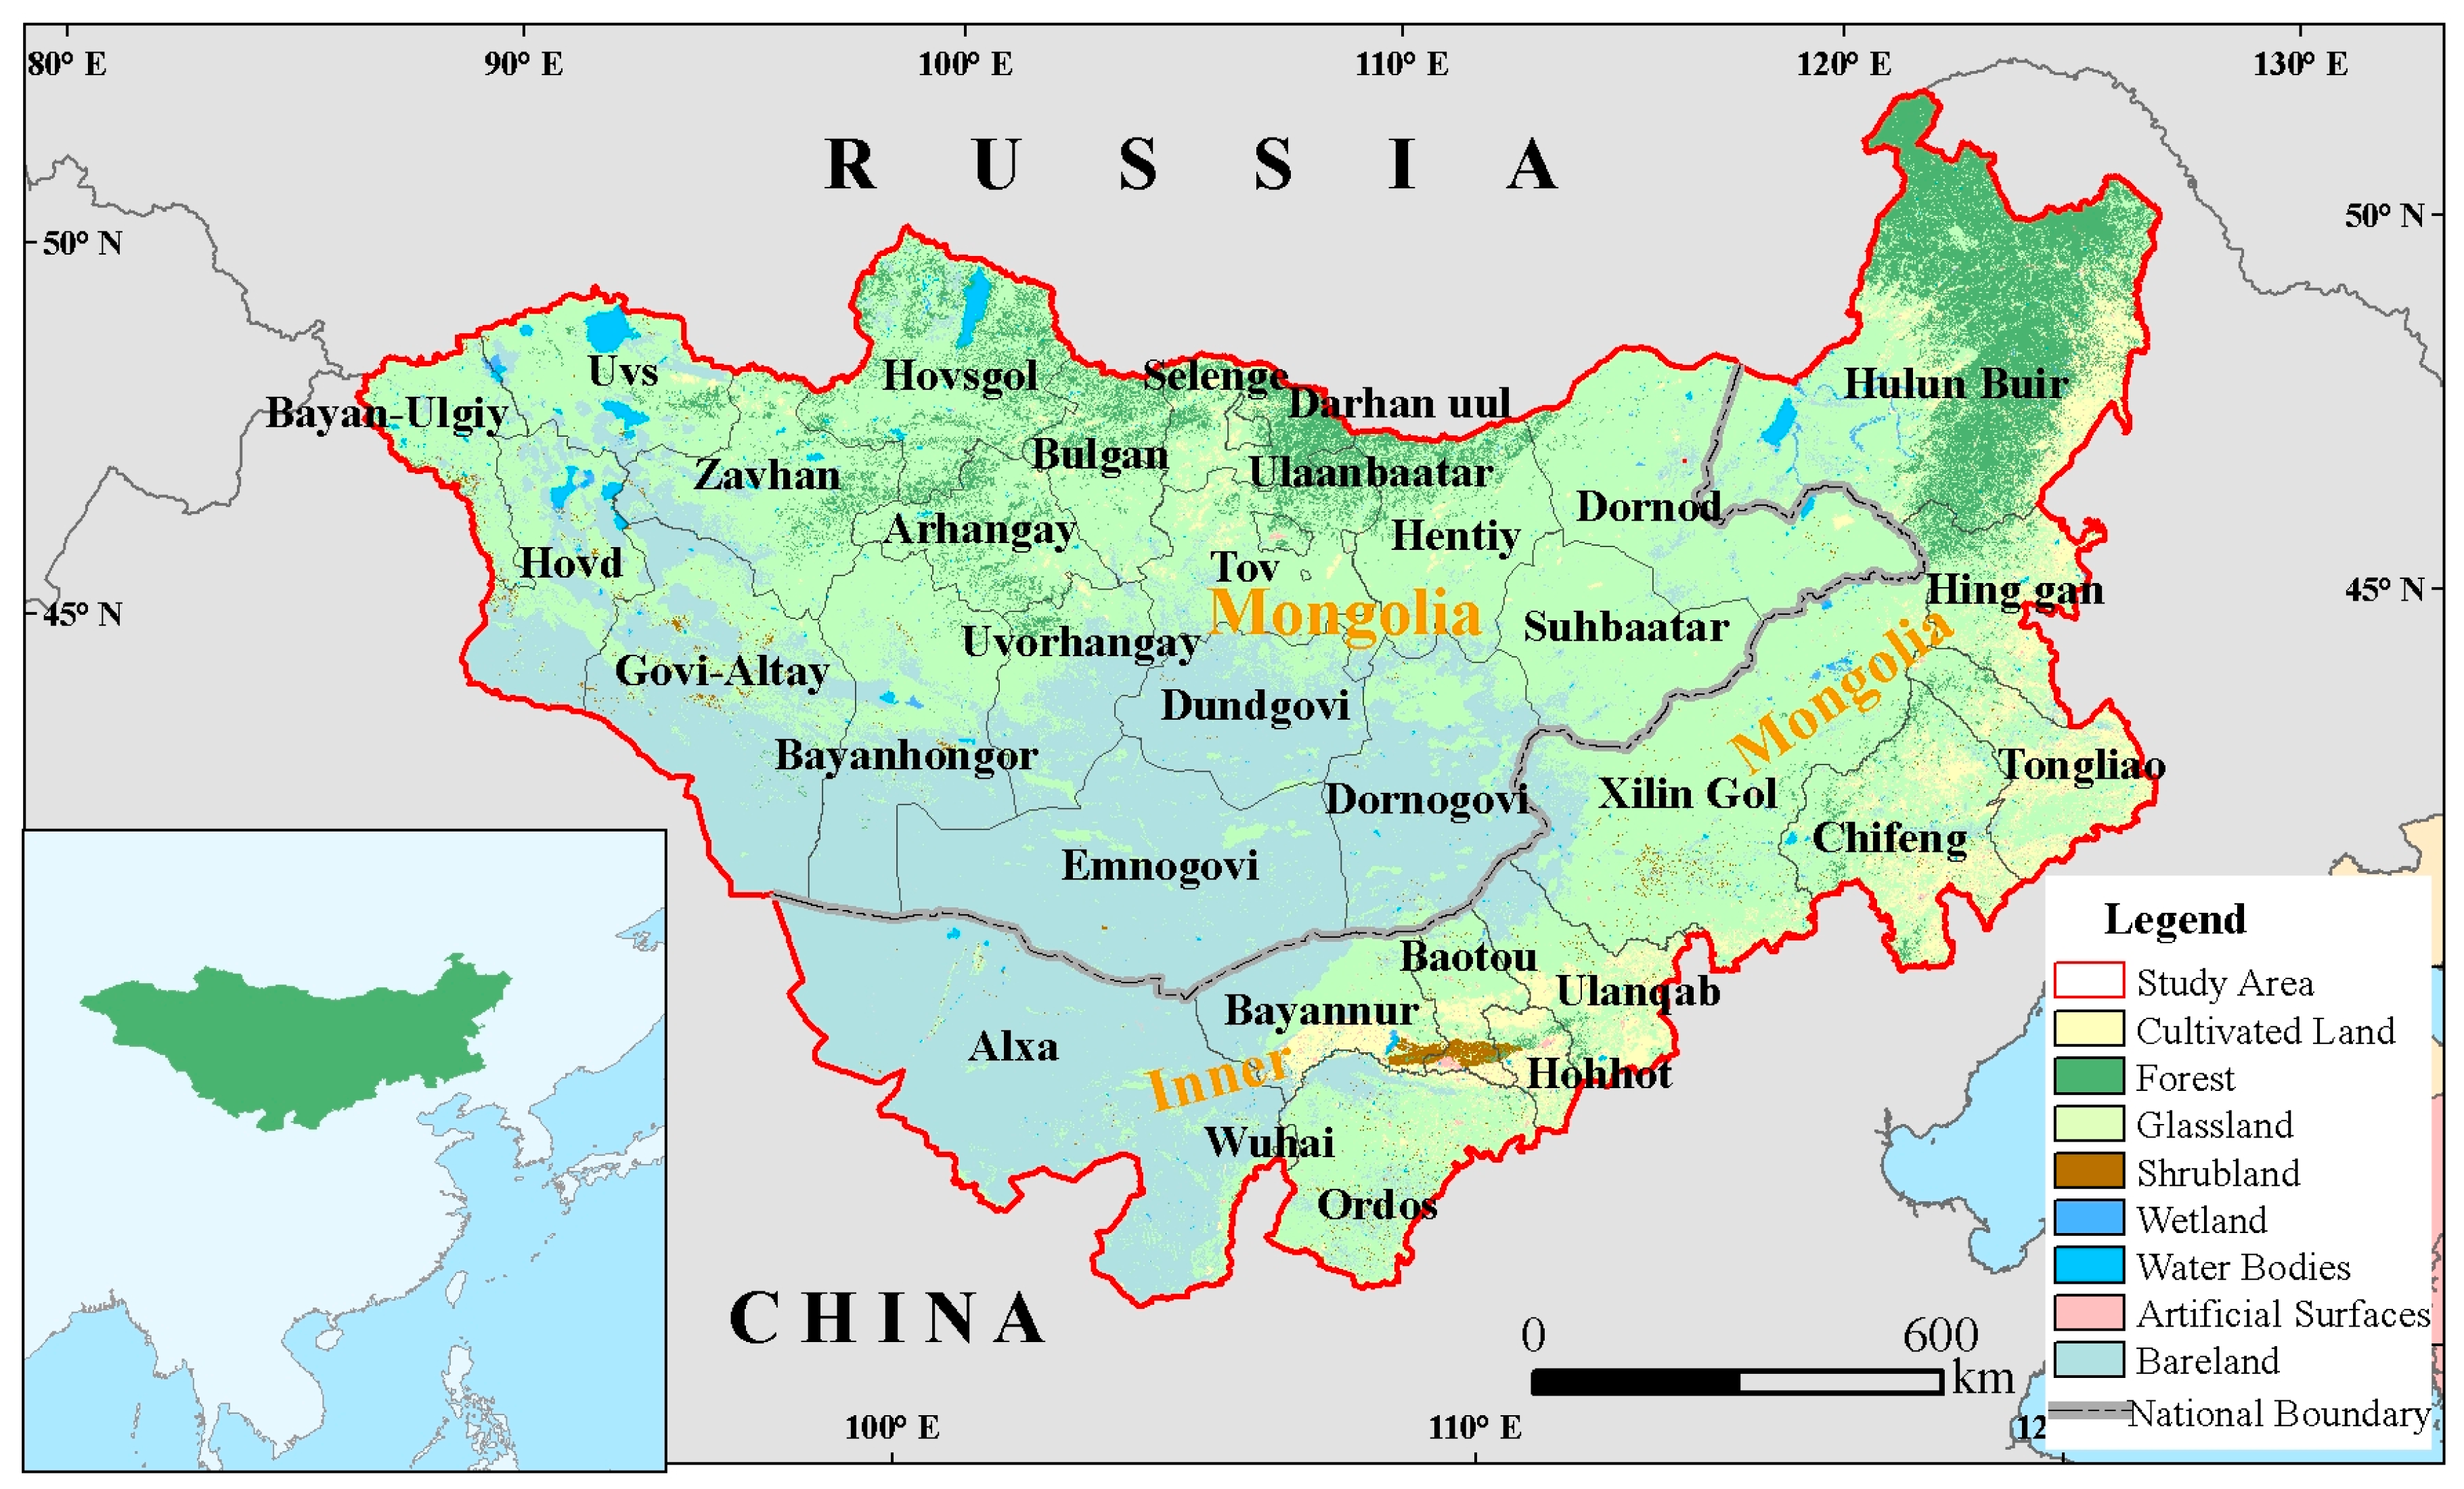
2.1. Study Area

The Mongolian Plateau is located in the central part of Eurasia, and it includes all of Mongolia, southern Siberia in Russia and northern China [15]. This paper selects the main part of the Central Mongolian Plateau (the scope is 87°–126°04′E, 37°22′–53°20′N), i.e., the Inner Mongolia Autonomous Region (Inner Mongolia) and Mongolian People’s Republic (Mongolia) as the research area (Figure 1); The total area of the whole region is 2.74 × 10⁶ km2 [20]. The study area has a temperate continental climate, experiencing low and uneven precipitation. The winter is long and cold, with an average monthly winter temperature of −10 °C in the south to −38 °C in the north. The summer is warm and short, and the average monthly summer temperature ranges from 16 to 27 °C. Influenced by the topography and oceanic weather system, the precipitation ranges from 50 mm in the west to 700 mm in the east.

2.2. Data and Variables Selected

2.2.1. Wildfire Data

The burned area product MCD64A1 used in this study is derived from MODIS. The MCD64A1 is a monthly Level 3 gridded 500 m product. The original data from MCD64A1 includes 5 types of information comprising the burn date, burn date uncertainty, quality assessment, first day, and last day [21,22,23]. We used the burn date layer data; the detailed classification information is shown in Table 1. Data on wildfires on the Mongolian Plateau from 2001 to 2018 were included. When the RF was established, 75% of the data were used as training data, and 25% were used as test data.

2.2.2. Land Cover Data

The MODIS land cover product (MCD12Q1) defines 17 types of land cover based on the International Geosphere-Biosphere Program (IGBP) global vegetation classification. This article uses the dataset to complete the following two tasks. First, we used MCD12Q1 to calculate the land use degree (LA), indicating the impact of human activities on wildfire [24]. The LA mainly reflects the land use condition. In addition, the LA reflects the degree of human utilization of land to a certain extent. In this paper, a quantitative comprehensive weight index was selected to explain the land use degree in various ecosystem. Second, the data were used to remove urban land, rural residential land, snow, and water bodies from the wildfire analysis. The meaning of each class is shown in Table 2.

2.2.3. Climate Data

Climatic Research Unit (CRU) grid data based on monthly observations at meteorological stations across the world’s land areas were used in combination with existing climatology to obtain absolute monthly values [25]. The dataset includes climate variables such as the diurnal temperature range (dtr), frost day frequency (frs), potential evapotranspiration (pet), precipitation (pre), daily mean temperature (tmp), monthly average daily minimum/maximum temperature (tmn/tmx), relative humidity (rhm), sunshine duration (ssh), vapor pressure (vap), wet day frequency (wet) and wind speed (wnd). In this paper, the CRU4.01 dataset variables are selected, the time coverage is the years 2000–2016, and the spatial resolution is 0.5° × 0.5°.

2.2.4. Vegetation Cover

The fraction of vegetation coverage (FVC) is usually defined as the percentage of the vertical projected area of vegetation (including leaves, stems, and branches) on the ground as a percentage of the total area [26]. The FVC is an important parameter not only for describing vegetation cover but also for reflecting vegetation growth on the ground [27]. It is also the most important and sensitive index for monitoring grassland degradation. In this paper, we use the pixel binary model to invert the vegetation coverage. The calculation formula is as follows:
FVC   =   ( NDVI NDVI soil ) / ( NDVI veg NDVI soil )
where NDVIsoil is the pixel value of bare soil or vegetation free areas and NDVIveg is the pixel value of pure vegetation. For most types of bare soil surfaces, the theoretical NDVIsoil value should be close to 0. Because of differences in the atmospheric influence and surface temperature, humidity, roughness and soil type, its value will change over time and space. In this paper, we chose empirical values of NDVIveg = 0.70 and NDVIsoil = 0.05, that is, when the NDVI pixel value was greater than 0.70, the FVC value was 1; and when the NDVI value was less than 0.05, the FVC value was 0 [26].

2.2.5. Topography

The elevation spatial resolution is 90 m. The influence of the terrain on the occurrence of wildfire is expressed by calculating the elevation, slope and aspect information of the study area. Details of the driving factors are presented in Table 3.

2.3. Methods

2.3.1. Spatial Distribution Analysis

Ripley’s K function has become one of the most effective methods for studying the spatial distribution pattern of point features. In this study, Ripley’s K function was used to analyse the spatial aggregation characteristics of wildfires on the Mongolian Plateau using ArcGIS. When applying Ripley’s K function, it is assumed that the fire points in the study area have an even spatial distribution [28]. In addition, the application variable k(d) expresses the ratio between the average number of sample fire points in the range of distance d and the sample fire point density in the study area:
k ( d )   =   A i = 1 n j = 1 n w ij n 2
where n is the total number of fire points; w is defined as the distance, which is the distance between all fire points i and fire point j in the range of d distance; and A is the area of the study area.
Ripley’s K function determines whether the spatial pattern of the actual observed fire points is agglomerated, divergent, or evenly distributed depending on the index L(d) and Δ ( d ) :
L ( d )   =   Δ ( d ) n
when L ( d )   <   Δ ( d ) , the spatial distribution pattern of the fire points appears as a diffuse distribution; when it is larger than Δ ( d ) , it appears as an aggregated distribution.

2.3.2. Land Use Degree

The LA reflects the degree of land development. The driving factors behind land use and land cover change mainly derive from human activities. Therefore, the quantitative LA can more clearly indicate the impact of human activities [29]. When calculating the LA, croplands are classified as cultivated land; barren is classified as unused land; and urban land and rural residential land are classified as artificial surfaces. The detailed classification information is shown in Table 4. To explore the influence of land use on wildfires, this paper introduces the land use degree index LA. The specific formula is as follows:
LA   =   100   ×   i = 1 n ( A i   ×   C i )   LA   ( 100 ,   400 )
where Ai is the i type land use level index, Ci is the percentage of land use at the i level in the study area, and n is the number of land use classifications. According to the above criteria of land use indicators, the allocation table of land use classification indicators in the study area was obtained. Table 4 shows the classification index for land use.

2.3.3. RF Model

The RF model improves the prediction accuracy of the model by aggregating a large number of classification regression trees, which can be used to solve classification and regression problems [30]. The sample dataset of each tree is generated by bootstrap resampling technology. The out-of-bag (OOB) method is used to test the goodness of fit of the model [31]. The bootstrap resampling technique is used to extract k sample datasets from the original dataset. The sample size of each sample dataset is the same as that of the original dataset. Then, k classification trees are established for the k sample datasets, and k classification results are obtained; finally, the final RF classification results are obtained by voting on the k classification results separately.
Assuming that the original data contain m variables, a number of random variables are randomly selected at each node of each classification tree. When applying the RF to data fitting and prediction, it is necessary to parameterize the number of trees (ntree), the mtry (mtry < m) of each partitioning node and the minimum number of observations (nodesize) on the final node, in which mtry and ntree are the two most important custom parameters. When mtry = m is a better choice [32]. As long as the value of ntree is large enough, the total error rate of the model tends toward a stable upper bound to ensure the convergence of the RF. Therefore, this paper sets the value of mtry to m and that of ntree to 3000.
This paper uses RStudio to run the RF model. RF takes the minimum out-of-bag error (errOOB) as the principle by which to select the feature variables of the model and ranks the feature variables with the importance score. The specific methods are as follows. For the variable Xi, the errOOBt of each tree t is calculated, and then, when the sequences of all other variables remains unchanged, the sequence order of the Xi values of the variables in the errOOB data is changed, and the errOO B t of errOOB is recalculated. Finally, the increase in errOOB is calculated when the errOOB data sequence changes. The formula for calculating the importance score of variable Xi is:
VI ( X i ) =   1 ntree ( errOOB t   errOOB t )

2.3.4. Test RF Model

The receiver operating characteristic (ROC) curve can be used to verify the accuracy of the RF results [2]. The ROC curve calculates a series of sensitivity and specificity values by setting several different critical values for continuous variables. The sensitivity is then used as an ordinate and the specificity as an abscissa to draw curves. The area under the curve (AUC) is an evaluation index used to evaluate the accuracy of the model prediction. As the AUC becomes larger, the model has a better fitting effect. An AUC of 0.5–0.7 indicates a poor fit, 0.7–0.9 indicates a moderate fit, and above 0.9 indicates a very good fit of the model [33].
The Yueden index was used to estimate the cut-off point, which is the threshold for the determination of the prediction accuracy of the RF [34]. It is calculated based on the sensitivity and specificity of the ROC. If the predicted likelihood of the model is larger than the cut-off point, a wildfire has occurred. Otherwise, the case is registered as having no wildfire.

2.3.5. Mapping the Probability of Wildfire Occurrences

Finally, a map of the wildfire occurrence probability was obtained using RStudio based on the RF model using the full dataset.

3. Results

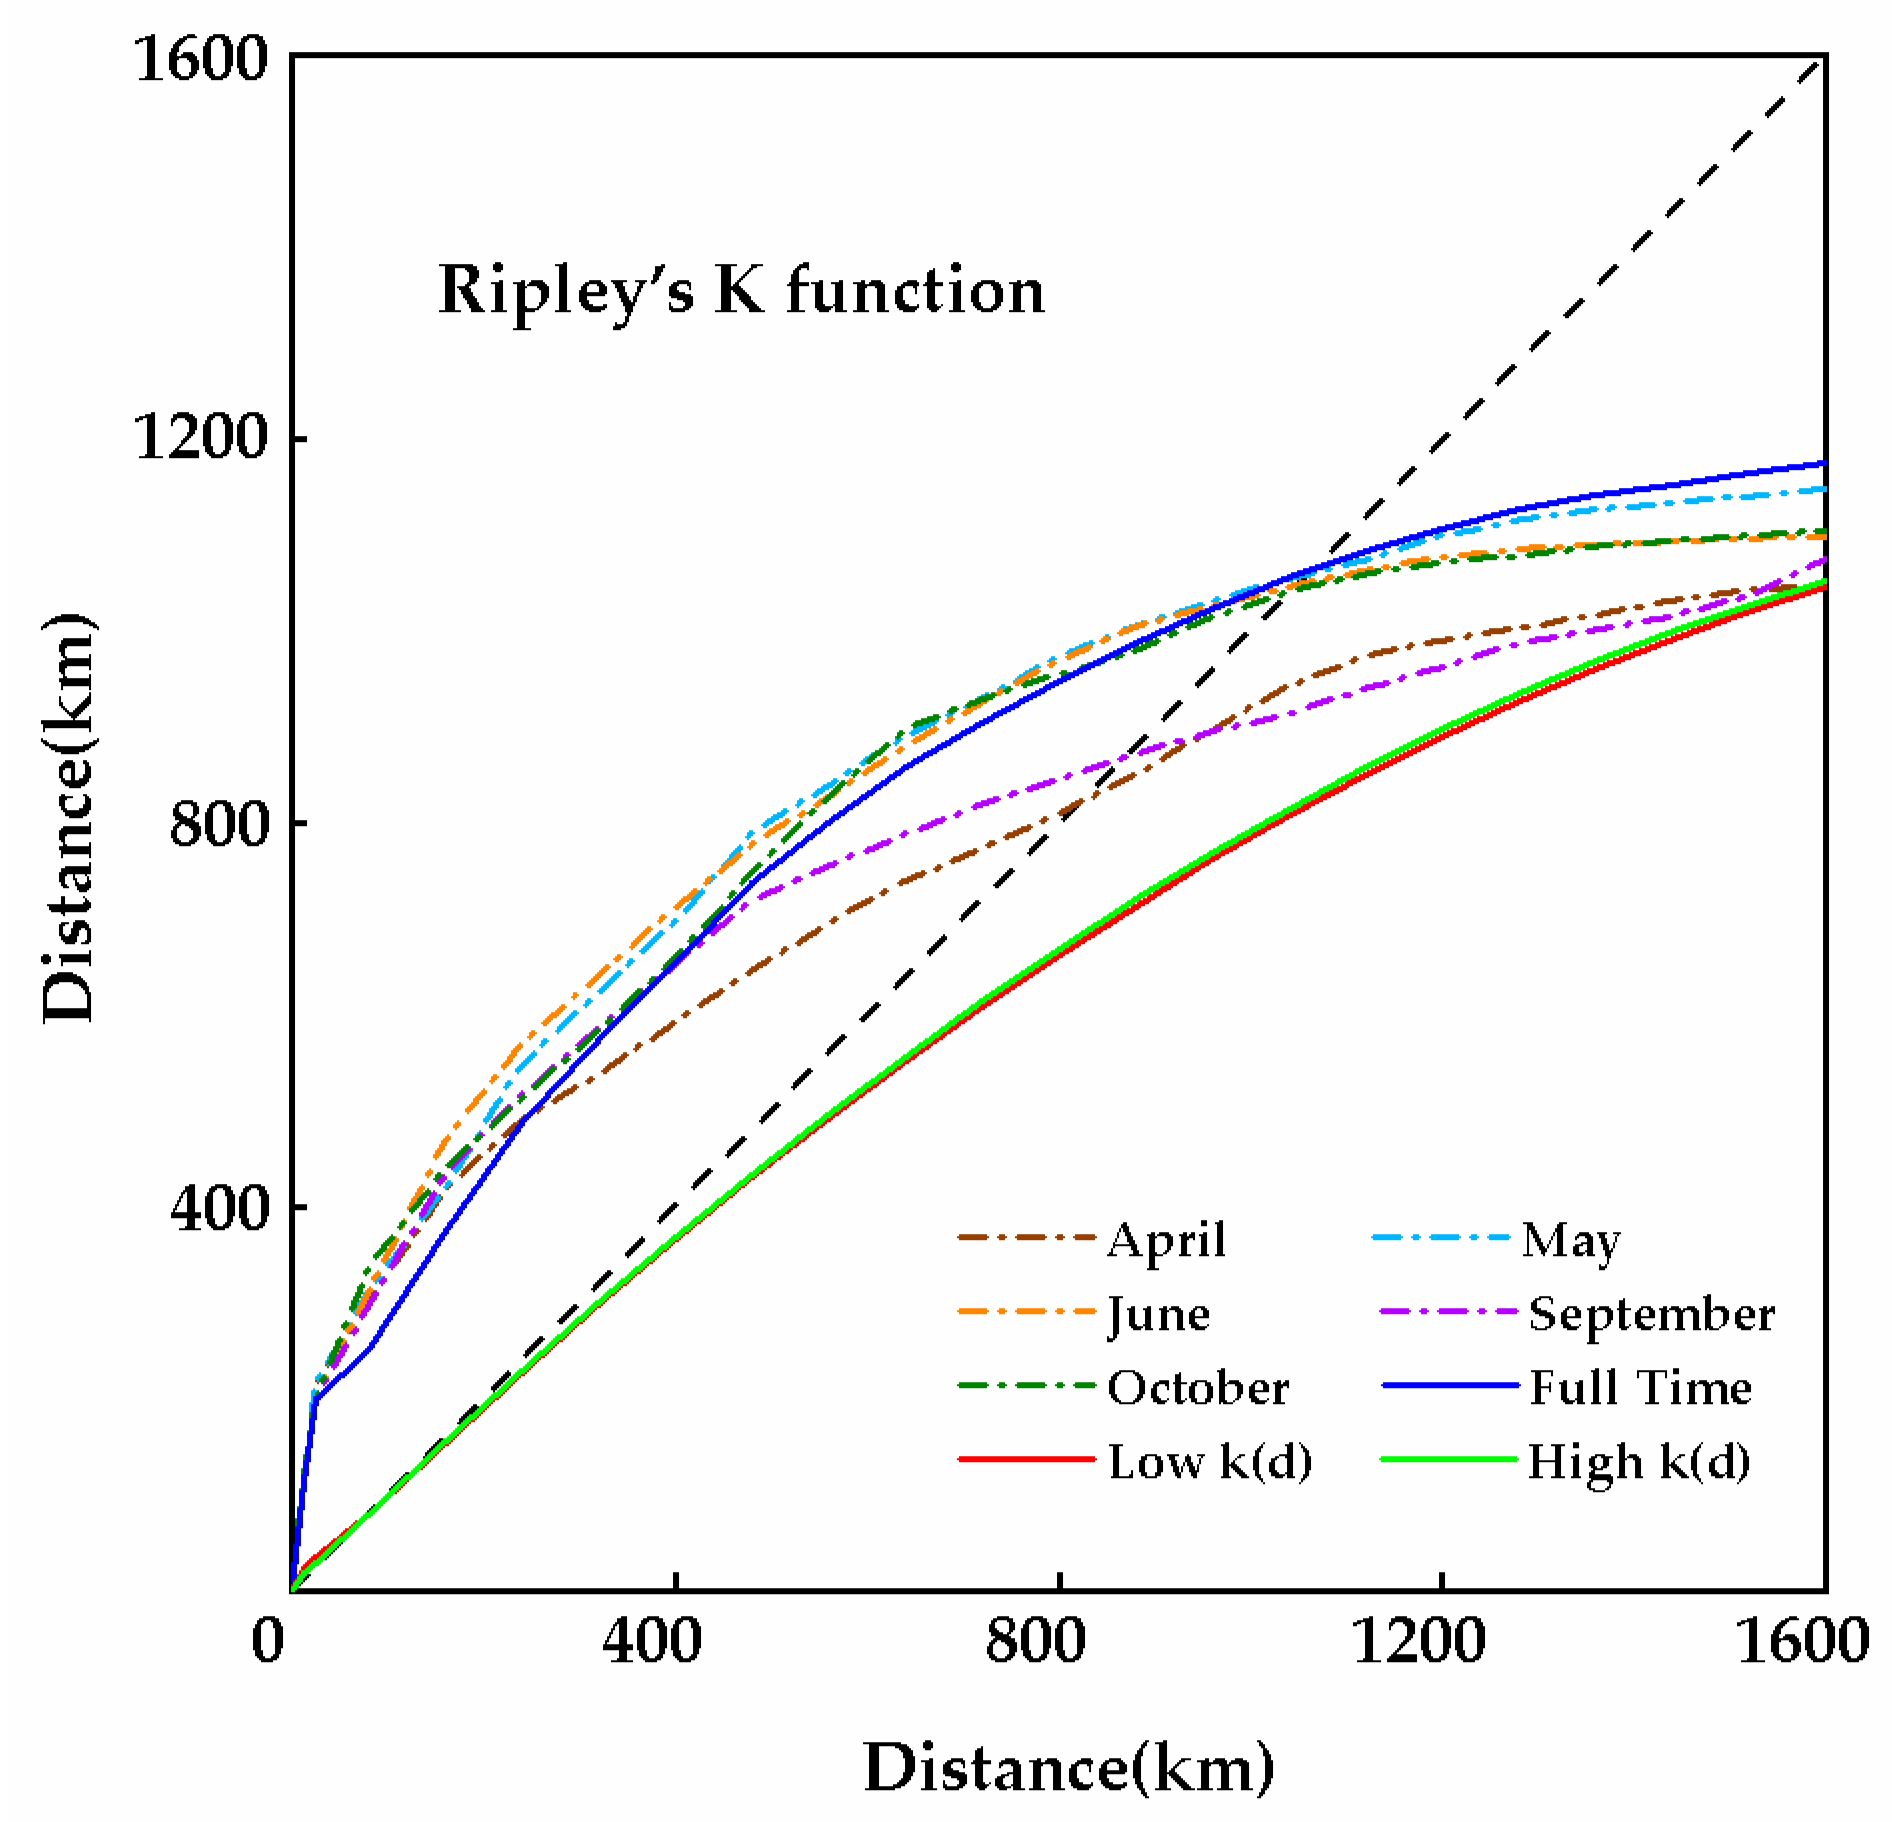
3.1. Spatial Pattern of Wildfires on the Mongolian Plateau

Figure 2 shows the spatial distribution of wildfires in the fire risk period (April, May, June, September, October, and the full fire risk period). The theoretical value is lower than the observed value within 1150 km. The result indicates that the wildfires are aggregated within 1150 km. Otherwise, the wildfires are not clustered. The statistical result shows that the observed value is greater than the upper limit of the 99% confidence level, and thus the aggregation distribution is significant. The distribution of wildfires in the fire risk period is an aggregated distribution within 1150 km. From the distance of aggregation, the aggregation intensity in May is the largest, followed by those in June, September and October, and the smallest is in April.

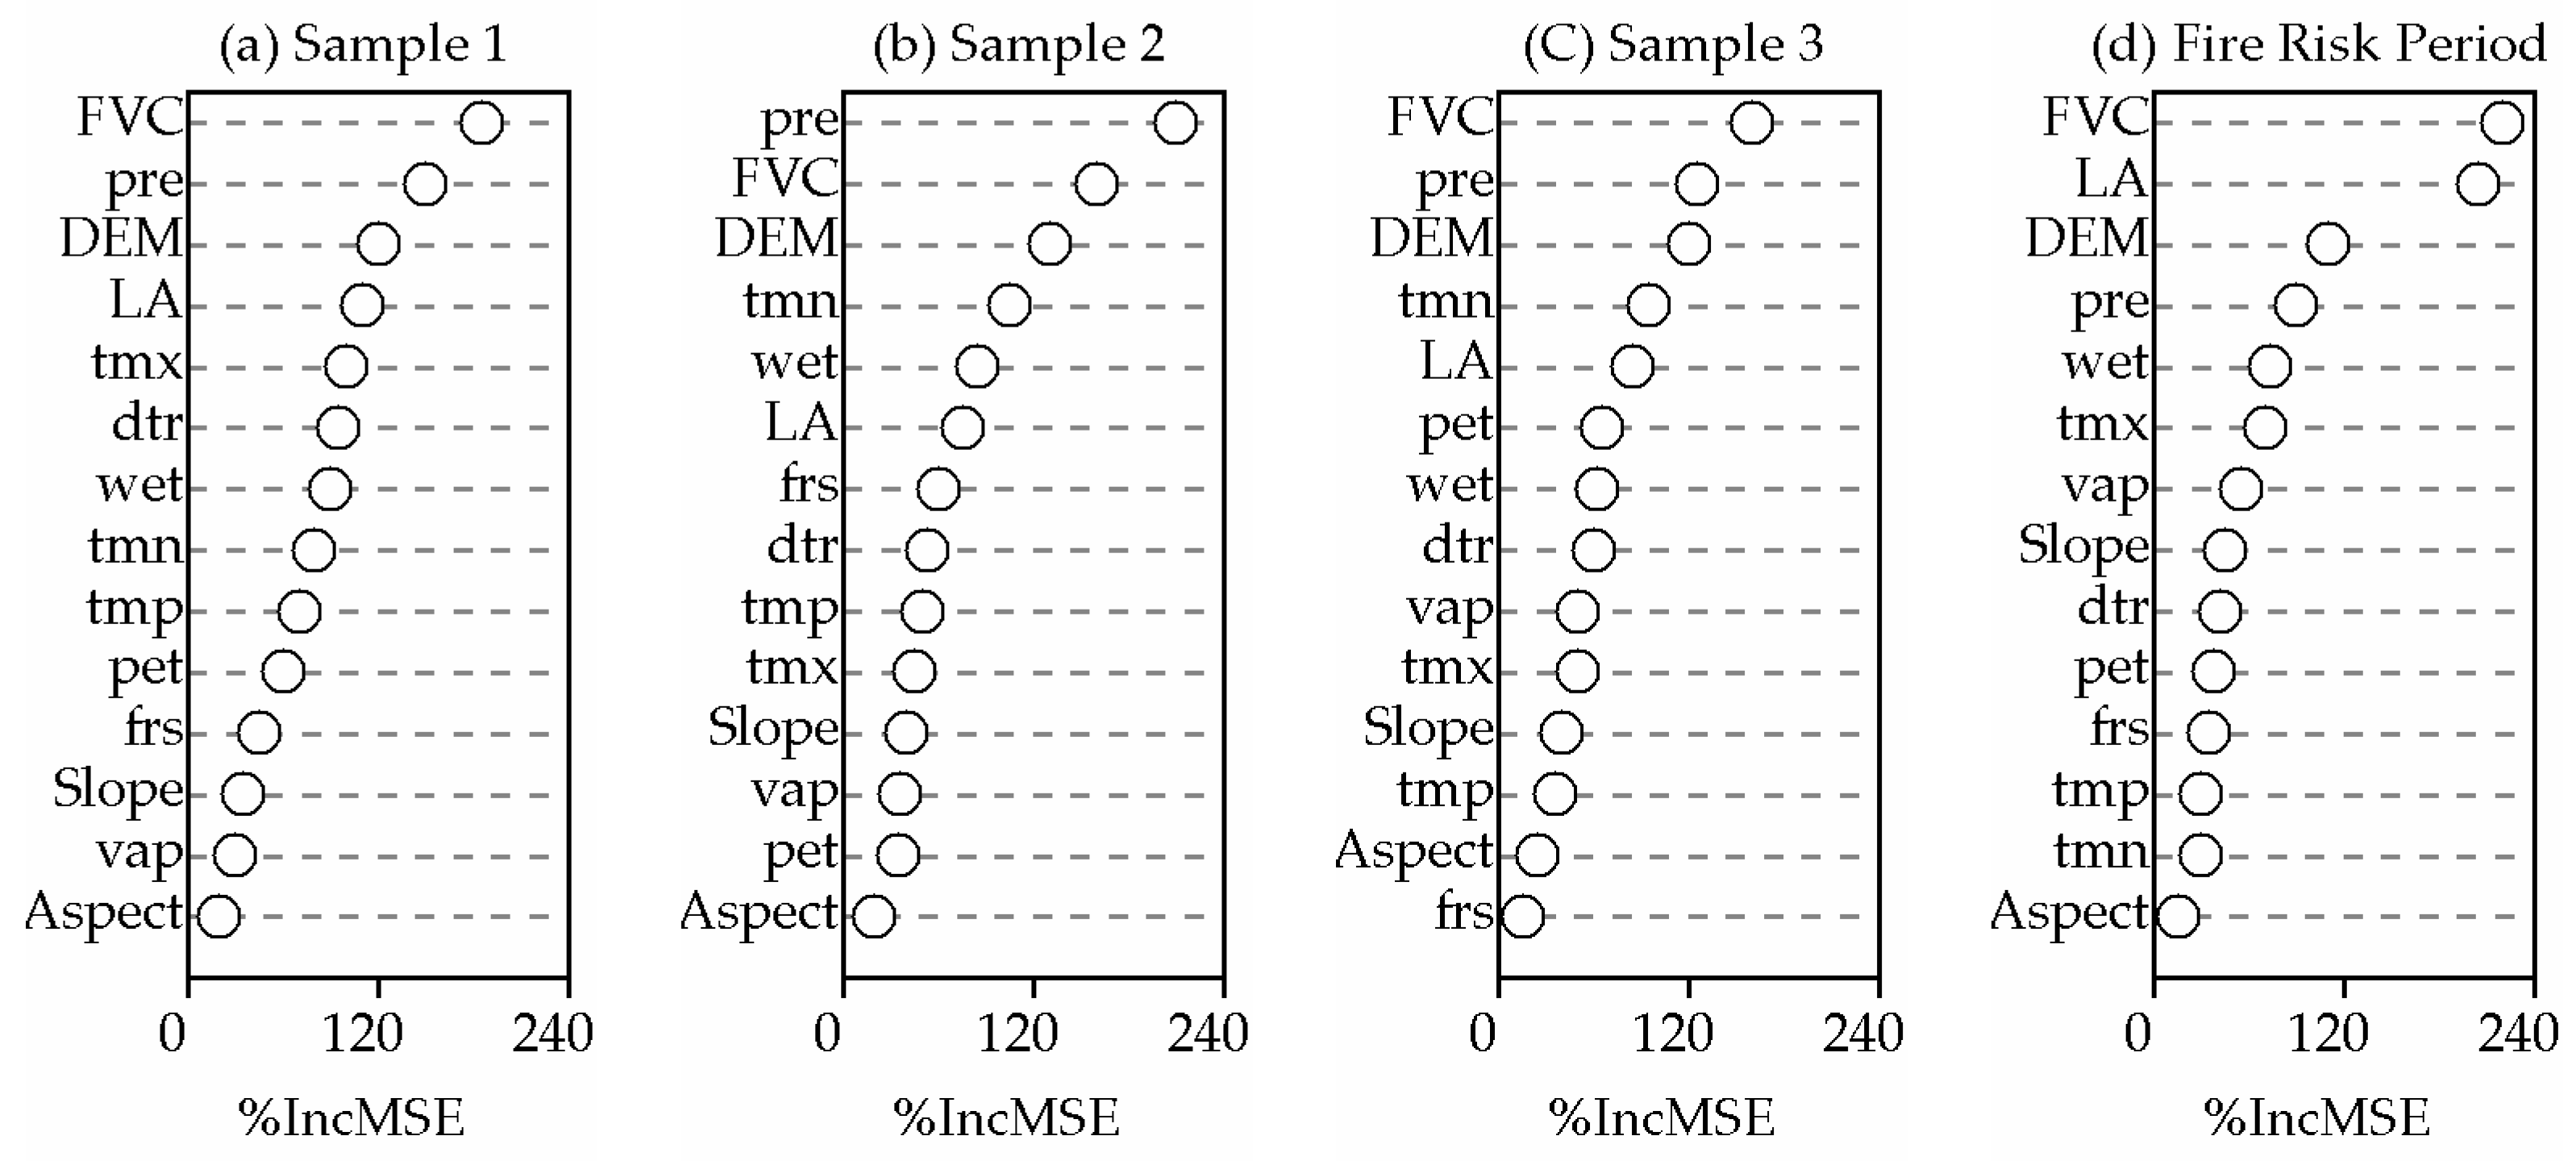
3.2. Selection and Ranking of Characteristic Variables

RF is an ensemble learning technique consisting of a combination of many classification trees, where each tree is generated by bootstrap samples in this study. The original wildfire data (2001–2018) were randomly divided into training (75%) and validation (25%) samples. Different sets of samples from the dataset are obtained by repeated partitioning five times. In this paper, after using the RF model to select the model variables from the three training sample datasets and the full sample dataset, the importance of the fire impact factors is ranked according to the mean decrease accuracy value. The variable ranking results (Figure 3) for the whole fire risk period indicated that the fraction of vegetation coverage (FVC), land use degree (LA), elevation, precipitation (pre), wet day frequency (wet), and maximum temperature (tmx) accounted for the greatest contributions among the factors affecting the wildfire occurrence on the Mongolian Plateau, while the aspect accounted for the lowest contribution. The contribution rates of the diurnal temperature range (dtr), slope, vapour pressure (vap), minimum temperature (tmn), potential evapotranspiration (pet), and frost day frequency (frs) were similar and presented small differences.

3.3. Test RF Model

The ROC curve analysis method was used to test the fitting superiority of the RF model. Table 5 shows the ROC curves of the complete dataset and the three samples. It can be seen from the table that the AUC values of the whole dataset and the three sample wildfires are all between (0.9, 1]. The RF model thus fits all samples very well, and the significance level of all samples is less than 0.001. Thus, it has statistical significance. The result shows that the RF model can be applied for the prediction of wildfires on the Mongolian Plateau.

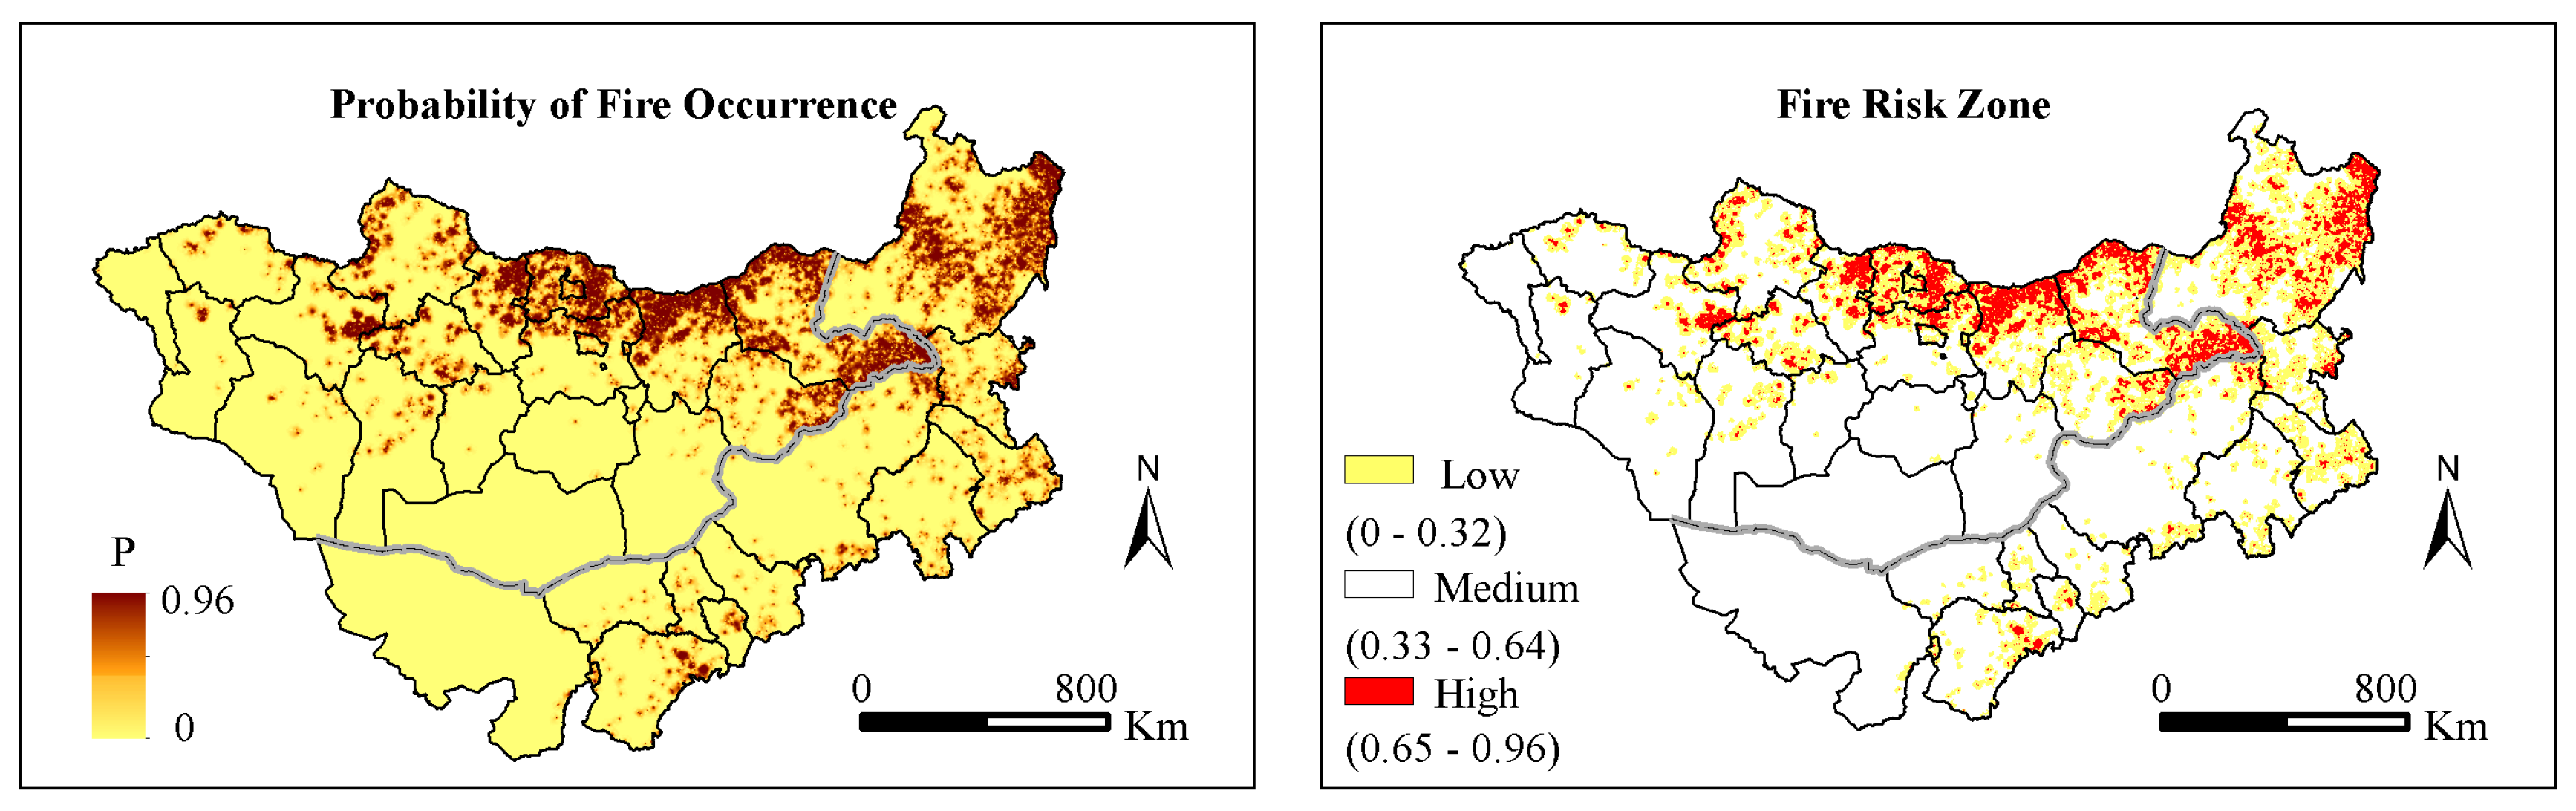
3.4. Spatial Distribution of Wildfire Probability

In this paper, 75% of the wildfire data (2001–2018) were used as training data for the RF model to obtain the fire likelihood distribution. The distribution of the wildfire likelihood on the Mongolian Plateau (Figure 4) shows that wildfires in the study area are not randomly distributed and follow certain spatial distribution rules. There are more wildfires in the northern, eastern and southern parts of the Mongolian Plateau and in the border area between Inner Mongolia and Mongolia, and wildfires do not occur or occur with less frequency in the hinterland area. The wildfire risk zones on the Mongolian mostly occur in the east and north but seldom occur in the south and west. There are four main areas in multiple zones: the meadow grassland at the junction of the eastern part and Inner Mongolia, a forest-grassland transition zone in the northern part, a grassland in the southern part, and a typical grassland in the central part of Suhbaatar province. Wildfires occur less frequently in the transition zone between the typical grassland and the desert grassland in the western part. In Inner Mongolia, the wildfire risk zone shows a striped pattern from the northeast to southwest. The fire occurrence zone mainly includes the following areas: Hulun Buir, Tongliao, Hing gan League, the junction of Chifeng city and the Xilin Gol League, and the Ordos Grassland.

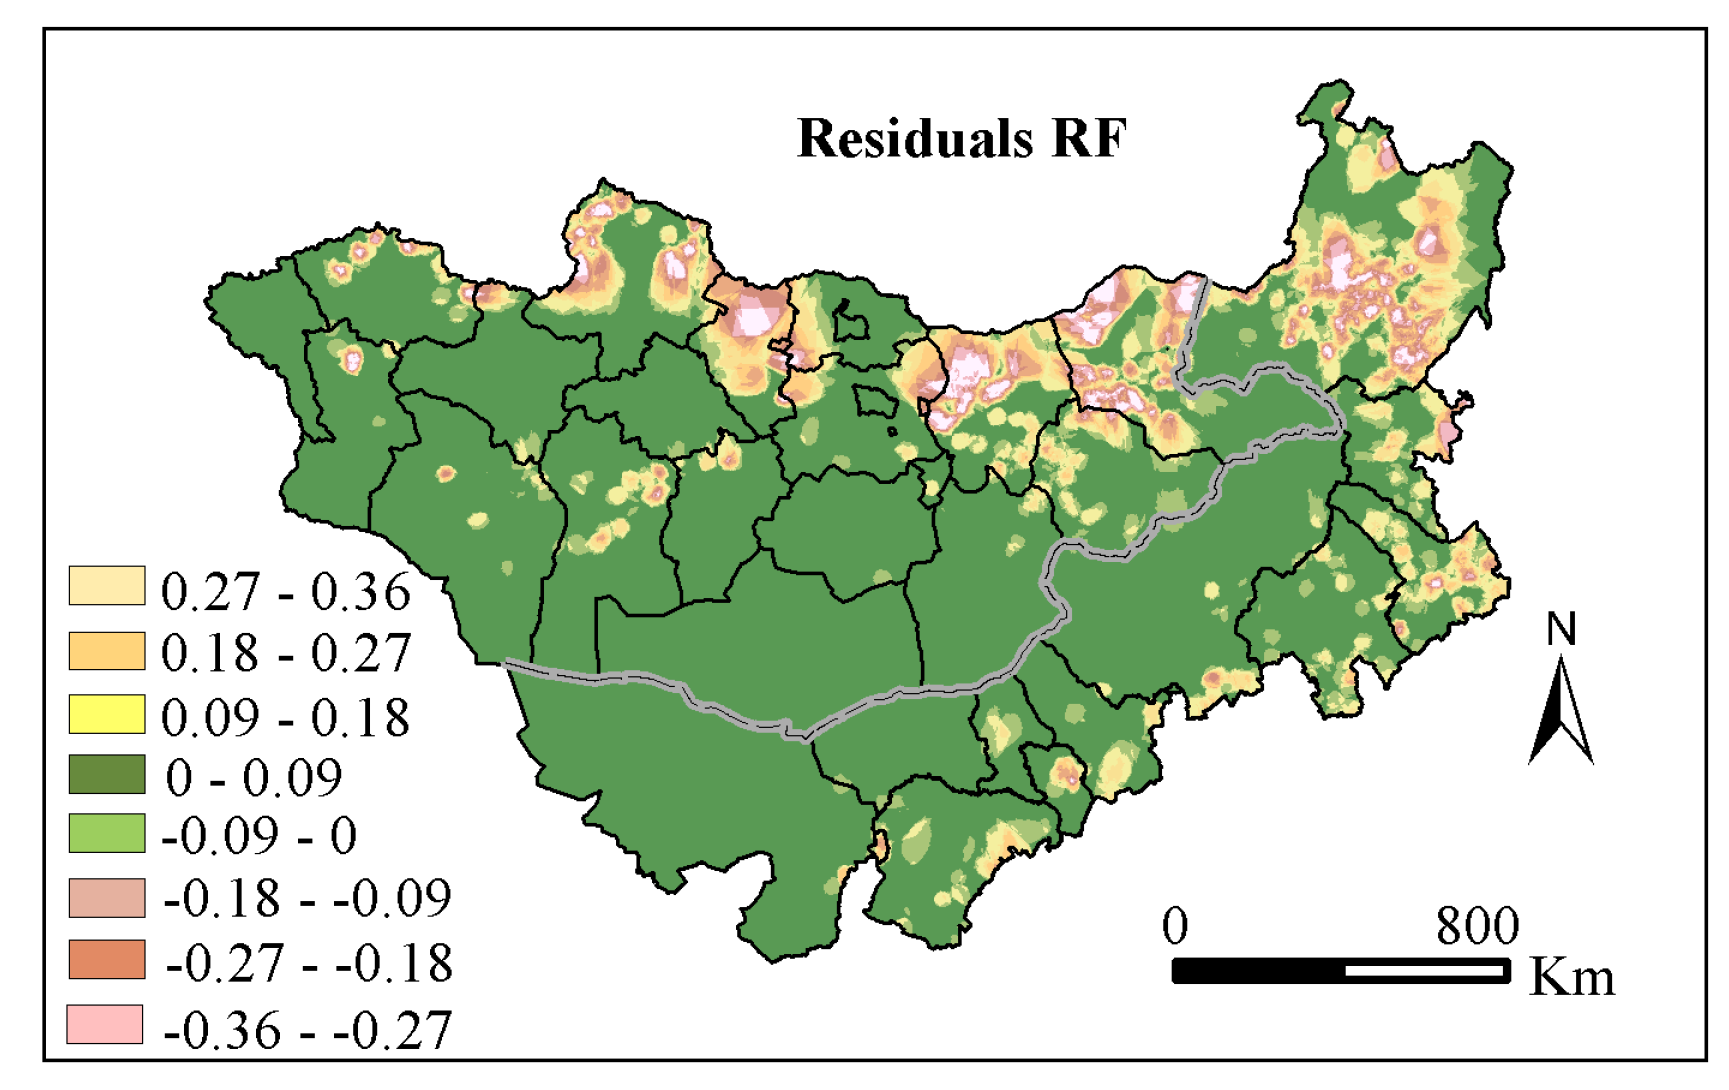
3.5. Spatial Distribution of Residual in RF Model

We also conducted residual analysis (wildfire (0/1)–wildfire probability) based on the full dataset. Figure 5 indicates that the RF model had the best fit (i.e., smaller residuals across the Mongolian Plateau). The positive (under prediction) and negative (over prediction) residuals of the RF model were smaller residuals across the Mongolian Plateau. The under predictions were mainly located in the middle and southern part of the study area, while the over predictions were located in the northern and northeastern part of the Mongolian Plateau.

4. Discussion

When Ripley’s K function is used to calculate the fire risk period distribution pattern on the Mongolian Plateau and the scale is less than 1150 km, the wildfires are clustered. This distance scale is less than 1/2 the length of the Mongolian Plateau; that is, it does not exceed the boundary effects in the study area and meets the requirements of Ripley’s K function. Therefore, the result of the wildfire aggregation distribution pattern in the study area is credible. In northeast Inner Mongolia, the fire risk periods of wildfires are distributed in a cluster pattern; among them, the aggregated distribution patterns in January, December, and July are not significant, and those for the rest of the months are significant [35]. The spatial distribution is similar to the results of our study.
The RF model was used to analyse the driving factors of fire occurrence, and the results showed that the contribution rates of the FVC, LA, elevation, pre, wet, and tmx were the largest, while the influence of the aspect was the smallest. The results of this study showed that the FVC is the material basis for the occurrence of wildfires. The occurrence and development of wildfires is closely related to the characteristics, quantity, and spatiotemporal distribution of the FVC. The FVC changes with different seasons and within different time periods of the same season [26]. Meteorological factors mainly affect the occurrence of wildfire on a large scale [5,31], e.g., high temperatures and sunshine duration are variables that either alone or together can contribute to increased potential evaporation from fuels and decreased moisture of wildfire fuel, leading to an increased possibility of wildfire occurrence [34]. High precipitation and relative humidity contribute to fuel moisture, which in turn decreases the probability of wildfires [36]. Topographic factors have an indirect impact on the occurrence and spread of wildfires by affecting microclimates in local areas. Studies have shown that the topography has a certain impact on the occurrence of wildfires, and wildfires occur more frequently especially in arid sunny slopes, on ridges and in low altitude areas [37]. In this paper, the elevation has a greater impact than do the slope or aspect.
In addition to the above natural factors, human factors and differences between the two administrative regions also play important roles. In recent decades, the lifestyle of the herdsmen in Inner Mongolia has gradually changed from nomadism to settlement. The number of live stock has been recklessly increased to pursue economic benefits, which has caused the vegetation to exceed its threshold carrying capacity. Thus, the land degradation is very serious [38]. In Mongolia, herdsman still maintain a nomadic life. Continuous migration and recycling of the ecosystem allow for a sufficient recovery period, which mitigates degradation, and the inhibitory effect on fire is weaker [39]. Moreover, human activity and landscape destruction in areas with higher populations also reduce the area subjected to fire. In Inner Mongolia, strict control measures and efforts to fight fires in the region have been strongly suppressed. In addition, human and financial constraints have a negative effect on fire mitigation and fire-fighting, and management measures in Mongolia are relatively underdeveloped [40]. Herdsmen take a natural approach towards wildfire. Therefore, the occurrence of wildfire is close to the natural level observed in the ecosystem. The differences in wildfire characteristics between Inner Mongolia and Mongolia indicate that in Inner Mongolia human activities have become an important factor affecting wildfire behaviours.
The likelihood distribution of wildfires on the Mongolian Plateau shows that wildfires are mainly concentrated in the border areas of Inner Mongolia and Mongolia, the northern part of Mongolia, and the northeastern and central parts of Inner Mongolia. In the northern and eastern areas of the Mongolian Plateau, due to the good meteorological and vegetation conditions, the species regeneration and biomass increase rapidly after burning [41]. The fuels reaccumulate in a short time and cause wildfire. Therefore, the northern and eastern areas have the highest probability of wildfires. Because of the serious desertification and less litter fuel, it is difficult for wildfires to occur and spread in desert areas, and the probability of fire occurrence is the lowest in these areas [42,43,44]. On the other hand, the contribution rate of human factors in some areas with a high probability of wildfire occurrence is also higher. For example, in the eastern part of Inner Mongolia, there is more cultivated land; in the spring and autumn, farmers burn straw infrequently to increase the probability of wildfires [29].
This study continuation the theory and techniques of wildfire event research and advance the research of risk and risk chains by enabling decision-makers to determine the probability of wildfire in the next year according to the driving factors or fire risk zone and to plan for disaster prevention. However, the Mongolian Plateau is composed a variety of land use types, which are influenced by various factors (in addition to the driving factors considered in this paper), and lead to uncertain wildfire driving factors. Moreover, because part of the data in the study area cannot be obtained, the driving factors cannot be comprehensively analysed and the satellite data cannot be verified. Therefore, to further explore the spatial distribution mechanism of wildfire occurrence, we need to further consider the impacts of specific factors on wildfire occurrence. For example, the moisture content of combustibles is an important factor to determine whether combustibles can ignite and burn. The flammability of combustibles increases with the decrease in the moisture content. The moisture content of grassland combustibles is constantly changing under the influence of rainfall, snow and air humidity. Among the human activity factors, the population size, age structure, industrial structure, and farming methods all influence fire occurrence. There is a certain relationship between these driving factors and fire occurrence, which makes fire occurrence more complex. Selecting appropriate research scales in later studies and studying the specific driving factors affecting fire occurrence is one of the most important methods by which to reveal the law of fire occurrence. The relationship between the parameters of wildfires and their influencing factors varies with the regional scale chosen. Therefore, future research should focus on how to establish a clear relationship between wildfires and their influencing factors. This approach would lay the foundation for further predicting the occurrence of wildfires under future climate change.

5. Conclusions

The distribution of wildfires in the fire risk period is an aggregated distribution within 1150 km. The aggregation intensity in May is the largest, followed by those in June, September and October, and the smallest is in April. The contribution rates of various influencing factors and the probability of fire occurrence on the Mongolian Plateau were analysed using an RF model, and the results indicated that the FVC, LA, elevation, pre, wet and tmx had the largest contribution rates, while aspect had the lowest contribution rate. The areas with the highest wildfire probabilities were mainly concentrated in the northern, eastern and southern parts of the Mongolian Plateau and in the border area between Inner Mongolia and Mongolia, but wildfires do not occur or occur less frequently in the hinterland area. The wildfire risk zones on the Mongolian mostly occur in the east and north and seldom occur in the south and west. In Inner Mongolia, the wildfire risk zone shows a striped pattern from the northeast to southwest. The RF model fits all the samples very well. The positive and negative residuals of the RF model were smaller across the Mongolian Plateau. Maps depicting the probability of wildfire occurrence identify fire prone zones on the Mongolian Plateau, where more fire prevention resources such as fire towers and inspection stations should be allocated.

Author Contributions

All authors contributed meaningfully to this study. Conceptualization, H.Z.; Methodology, W.R.; Software, G.D., H.L., H.Y.; Validation, X.G.; Formal Analysis, W.R.; Data Curation, J.Z.; Writing—Original Draft Preparation, W.R.; Writing—Review & Editing, H.Z.; Supervision, J.Z.

Funding

This work was supported by the National Natural Science Foundation of China (Grant number 41871330, 41571489, 41461102, 41771450, 41601438), Inner Mongolia Autonomous Region Science and Technology Program Funding Project (201502113), the Fundamental Research Funds for the Central Universities (Grant No. 2412019BJ001) and the Foundation of the Education Department of Jilin Province in the 13th Five-Year project (Grant No. JJKH20190282KJ).

Conflicts of Interest

The authors declare no conflict of interest.

References

  1. Stephens, S.L.; Agee, J.K.; Fulé, P.Z.; North, M.P.; Romme, W.H.; Swetnam, T.W.; Turner, M.G. Managing Forests and Fire in Changing Climates. Science 2013, 342, 41–42. [Google Scholar] [CrossRef]
  2. Sun, R.; Krueger, S.K.; Jenkins, M.A.; Zulauf, M.A.; Charney, J.J. The importance of fire-atmosphere coupling and boundary-layer turbulence to wildfire spread. Int. J. Wildland Fire 2009, 18, 50. [Google Scholar] [CrossRef]
  3. Hu, Y.; Wang, S.; Song, X.; Wang, J. Precipitation changes in the mid-latitudes of the Chinese mainland during 1960–2014. J. Arid Land 2017, 9, 924–937. [Google Scholar] [CrossRef]
  4. Yu, Y.; Pi, Y.; Yu, X.; Ta, Z.; Sun, L.; Disse, M.; Zeng, F.; Li, Y.; Chen, X.; Yu, R. Climate change, water resources and sustainable development in the arid and semi-arid lands of Central Asia in the past 30 years. J. Arid Land 2019, 11, 1–14. [Google Scholar] [CrossRef]
  5. Liu, M.; Zhao, J.; Guo, X.; Zhang, Z.; Tan, G.; Yang, J. Study on Climate and Grassland Fire in HulunBuir, Inner Mongolia Autonomous Region, China. Sensors 2017, 17, 616. [Google Scholar] [CrossRef] [PubMed]
  6. Kontoes, C.; Keramitsoglou, I.; Papoutsis, I.; Sifakis, N.; Xofis, P. National Scale Operational Mapping of Burnt Areas as a Tool for the Better Understanding of Contemporary Wildfire Patterns and Regimes. Sensors 2013, 13, 11146–11166. [Google Scholar] [CrossRef] [Green Version]
  7. Ying, H.; Shan, Y.; Zhang, H.; Yuan, T.; Rihan, W.; Deng, G. The Effect of Snow Depth on Spring Wildfires on the Hulunbuir from 2001–2018 Based on MODIS. Remote Sens. 2019, 11, 321. [Google Scholar] [CrossRef]
  8. Cao, X.; Cui, X.; Yue, M.; Chen, J.; Tanikawa, H.; Ye, Y. Evaluation of wildfire propagation susceptibility in grasslands using burned areas and multivariate logistic regression. Int. J. Remote Sens. 2013, 34, 6679–6700. [Google Scholar] [CrossRef]
  9. Yue, J.; Feng, H.; Yang, G.; Li, Z. A Comparison of Regression Techniques for Estimation of Above-Ground Winter Wheat Biomass Using Near-Surface Spectroscopy. Remote Sens. 2018, 10, 66. [Google Scholar] [CrossRef]
  10. Guo, F.; Wang, G.; Su, Z.; Liang, H.; Wang, W.; Lin, F.; Liu, A. What drives forest fire in Fujian, China? Evidence from logistic regression and Random Forests. Int. J. Wildland Fire 2016, 25, 505. [Google Scholar] [CrossRef]
  11. Pierce, A.D.; Farris, C.A.; Taylor, A.H. Use of random forests for modeling and mapping forest canopy fuels for fire behavior analysis in Lassen Volcanic National Park, California, USA. For. Ecol. Manag. 2012, 279, 77–89. [Google Scholar] [CrossRef]
  12. Liu, Y.; Li, F.; Yu, X.; Yuan, J.; Zhou, D. Assessing the Credit Risk of Corporate Bonds Based on Factor Analysis and Logistic Regress Analysis Techniques: Evidence from New Energy Enterprises in China. Sustainability 2018, 10, 1457. [Google Scholar] [CrossRef]
  13. Cutler, D.R.; Edwards, T.C.; Beard, K.H.; Cutler, A.; Hess, K.T.; Gibson, J.; Lawler, J.J. RANDOM FORESTS FOR CLASSIFICATION IN ECOLOGY. Ecology 2007, 88, 2783–2792. [Google Scholar] [CrossRef] [PubMed]
  14. Kim, O.; Kang, D.-J. Fire detection system using random forest classification for image sequences of complex background. Opt. Eng. 2013, 52, 067202. [Google Scholar] [CrossRef]
  15. Na, L.; Zhang, J.; Bao, Y.; Bao, Y.; Na, R.; Tong, S.; Si, A. Himawari-8 Satellite Based Dynamic Monitoring of Grassland Fire in China-Mongolia Border Regions. Sensors 2018, 18, 276. [Google Scholar] [CrossRef] [PubMed]
  16. Bao, G.; Qin, Z.; Bao, Y.; Zhou, Y.; Li, W.; Sanjjav, A. NDVI-Based Long-Term Vegetation Dynamics and Its Response to Climatic Change in the Mongolian Plateau. Remote Sens. 2014, 6, 8337–8358. [Google Scholar] [CrossRef] [Green Version]
  17. Alonso-Canas, I.; Chuvieco, E. Global burned area mapping from ENVISAT-MERIS and MODIS active fire data. Remote Sens. Environ. 2015, 163, 140–152. [Google Scholar] [CrossRef]
  18. Hantson, S.; Padilla, M.; Corti, D.; Chuvieco, E. Strengths and weaknesses of MODIS hotspots to characterize global fire occurrence. Remote Sens. Environ. 2013, 131, 152–159. [Google Scholar] [CrossRef]
  19. Nogueira, J.; Ruffault, J.; Chuvieco, E.; Mouillot, F. Can We Go Beyond Burned Area in the Assessment of Global Remote Sensing Products with Fire Patch Metrics? Remote Sens. 2016, 9, 7. [Google Scholar] [CrossRef]
  20. Dong, Y.; Yan, H.; Wang, N.; Huang, M.; Hu, Y. Automatic Identification of Shrub-Encroached Grassland in the Mongolian Plateau Based on UAS Remote Sensing. Remote Sens. 2019, 11, 1623. [Google Scholar] [CrossRef]
  21. Giglio, L.; Schroeder, W.; Justice, C.O. The collection 6 MODIS active fire detection algorithm and fire products. Remote Sens. Environ. 2016, 178, 31–41. [Google Scholar] [CrossRef] [PubMed] [Green Version]
  22. Le Hégarat-Mascle, S.; Ottlé, C.; Guérin, C. Land cover change detection at coarse spatial scales based on iterative estimation and previous state information. Remote Sens. Environ. 2005, 95, 464–479. [Google Scholar] [CrossRef]
  23. Harris, I.; Jones, P.D.; Osborn, T.J.; Lister, D.H. Updated high-resolution grids of monthly climatic observations-the CRU TS3.10 Dataset: UPDATED HIGH-RESOLUTION GRIDS OF MONTHLY CLIMATIC OBSERVATIONS. Int. J. Climatol. 2014, 34, 623–642. [Google Scholar] [CrossRef]
  24. Wen, J.; Lai, X.; Shi, X.; Pan, X. Numerical simulations of fractional vegetation coverage influences on the convective environment over the source region of the Yellow River. Meteorol. Atmospheric Phys. 2013, 120, 1–10. [Google Scholar] [CrossRef]
  25. Haase, P. Spatial pattern analysis in ecology based on Ripley’s K-function: Introduction and methods of edge correction. J. Veg. Sci. 1995, 6, 575–582. [Google Scholar] [CrossRef]
  26. Li, Y.; Zhao, J.; Guo, X.; Zhang, Z.; Tan, G.; Yang, J. The Influence of Land Use on the Grassland Fire Occurrence in the Northeastern Inner Mongolia Autonomous Region, China. Sensors 2017, 17, 437. [Google Scholar] [CrossRef]
  27. Wang, Y.; Xia, S.T.; Tang, Q.; Wu, J.; Zhu, X. A Novel Consistent Random Forest Framework: Bernoulli Random Forests. IEEE Trans. Neural Netw. Learn. Syst. 2018, 29, 3510–3523. [Google Scholar] [CrossRef]
  28. Berhane, T.; Lane, C.; Wu, Q.; Autrey, B.; Anenkhonov, O.; Chepinoga, V.; Liu, H. Decision-Tree, Rule-Based, and Random Forest Classification of High-Resolution Multispectral Imagery for Wetland Mapping and Inventory. Remote Sens. 2018, 10, 580. [Google Scholar] [CrossRef]
  29. Guo, F.; Innes, J.L.; Wang, G.; Ma, X.; Sun, L.; Hu, H.; Su, Z. Historic distribution and driving factors of human-caused fires in the Chinese boreal forest between 1972 and 2005. J. Plant Ecol. 2015, 8, 480–490. [Google Scholar] [CrossRef]
  30. Cho, H.; Matthews, G.J.; Harel, O. Confidence Intervals for the Area Under the Receiver Operating Characteristic Curve in the Presence of Ignorable Missing Data: Confidence Intervals for AUC with Missing Data. Int. Stat. Rev. 2018, 87, 152–177. [Google Scholar] [CrossRef]
  31. Guo, F.; Su, Z.; Wang, G.; Sun, L.; Lin, F.; Liu, A. Wildfire ignition in the forests of southeast China: Identifying drivers and spatial distribution to predict wildfire likelihood. Appl. Geogr. 2016, 66, 12–21. [Google Scholar] [CrossRef]
  32. Zhang, Z.; Feng, Z.; Zhang, H.; Zhao, J.; Yu, S.; Du, W. Spatial distribution of grassland fires at the regional scale based on the MODIS active fire products. Int. J. Wildland Fire 2017, 26, 209. [Google Scholar] [CrossRef] [Green Version]
  33. Mu, X.; Song, W.; Gao, Z.; McVicar, T.R.; Donohue, R.J.; Yan, G. Fractional vegetation cover estimation by using multi-angle vegetation index. Remote Sens. Environ. 2018, 216, 44–56. [Google Scholar] [CrossRef]
  34. Cramer, W.; Bondeau, A.; Woodward, F.I.; Prentice, I.C.; Betts, R.A.; Brovkin, V.; Cox, P.M.; Fisher, V.; Foley, J.A.; Friend, A.D.; et al. Global response of terrestrial ecosystem structure and function to CO2 and climate change: results from six dynamic global vegetation models. Glob. Change Biol. 2001, 7, 357–373. [Google Scholar] [CrossRef]
  35. Vargas, R.; Collins, S.L.; Thomey, M.L.; Johnson, J.E.; Brown, R.F.; Natvig, D.O.; Friggens, M.T. Precipitation variability and fire influence the temporal dynamics of soil CO2 efflux in an arid grassland. Glob. Chang. Biol. 2012, 18, 1401–1411. [Google Scholar] [CrossRef]
  36. Barlow, J.; Peres, C.A.; Lagan, B.O.; Haugaasen, T. Large tree mortality and the decline of forest biomass following Amazonian wildfires: Biomass decline following Amazonian fires. Ecol. Lett. 2002, 6, 6–8. [Google Scholar] [CrossRef]
  37. Ganteaume, A.; Long-Fournel, M. Driving factors of fire density can spatially vary at the local scale in south-eastern France. Int. J. Wildland Fire 2015, 24, 650. [Google Scholar] [CrossRef]
  38. Li, Z.; Wu, W.; Liu, X.; Fath, B.D.; Sun, H.; Liu, X.; Xiao, X.; Cao, J. Land use/cover change and regional climate change in an arid grassland ecosystem of Inner Mongolia, China. Ecol. Model. 2017, 353, 86–94. [Google Scholar] [CrossRef]
  39. Liu, X.; Zhang, J.; Cai, W.; Bao, Y. Estimating the insurance rates for loss of annual production of grass herbage associated with natural disasters in China. Rangel. J. 2015, 37, 139. [Google Scholar] [CrossRef]
  40. Tong, S.; Lai, Q.; Zhang, J.; Bao, Y.; Lusi, A.; Ma, Q.; Li, X.; Zhang, F. Spatiotemporal drought variability on the Mongolian Plateau from 1980–2014 based on the SPEI-PM, intensity analysis and Hurst exponent. Sci. Total Environ. 2018, 615, 1557–1565. [Google Scholar] [CrossRef]
  41. Gao, Q.; Schwartz, M.W.; Zhu, W.; Wan, Y.; Qin, X.; Ma, X.; Liu, S.; Williamson, M.A.; Peters, C.B.; Li, Y. Changes in Global Grassland Productivity during 1982 to 2011 Attributable to Climatic Factors. Remote Sens. 2016, 8, 384. [Google Scholar] [CrossRef]
  42. Tong, S.; Zhang, J.; Bao, Y.; Lai, Q.; Lian, X.; Li, N.; Bao, Y. Analyzing vegetation dynamic trend on the Mongolian Plateau based on the Hurst exponent and influencing factors from 1982–2013. J. Geogr. Sci. 2018, 28, 595–610. [Google Scholar] [CrossRef]
  43. Bao, G.; Liu, Y.; Liu, N.; Linderholm, H.W. Drought variability in eastern Mongolian Plateau and its linkages to the large-scale climate forcing. Clim. Dyn. 2015, 44, 717–733. [Google Scholar] [CrossRef]
  44. Liu, H.; Cui, H.; Pott, R.; Speier, M. Vegetation of the woodland-steppe transition at the southeastern edge of the Inner Mongolian Plateau. J. Veg. Sci. 2000, 11, 525–532. [Google Scholar] [CrossRef]
Figure 1. The location of the Mongolian Plateau and land cover.
Remotesensing 11 02361 g001
Figure 2. Spatial distribution of wildfire on the Mongolian Plateau.
Remotesensing 11 02361 g002
Figure 3. Variable importance measures from RF sub-samples (ac) and complete dataset (d) based on mean decrease accuracy (%IncMSE), which quantifies the importance of a variable by measuring the change in the prediction accuracy when the values of the variable are randomly permuted compared with the original observations. The abbreviated variable names are the same as in Table 3.
Remotesensing 11 02361 g003
Figure 4. Probability of fire occurrence and fire risk zone on the Mongolian Plateau.
Remotesensing 11 02361 g004
Figure 5. Spatial distribution of residual in RF models.
Remotesensing 11 02361 g005
Table 1. MCD64A1 fire mask pixel classes.
ClassMeaning
−2Water
−1Unmapped due to insufficient data
0Unburned land
1–366Ordinal day of burn
Table 2. Land cover types of the Mongolian Plateau extracted from MCD12Q1.
ClassMeaningClassMeaning
1Evergreen Needleleaf Forest10Grassland
3Deciduous Needleleaf Forest11Permanent Wetlands
4Deciduous Broadleaf Forest12Croplands
5Mixed Forest13Urban Land, Rural Residential Land
7Open Shrublands14Cropland/Natural Vegetation Mosaic
8Woody Savannas15Snow, Water
9Savannas16Barren
Table 3. Predictor variables included in wildfire model development for the study area.
Variable TypeVariable NameCodeSource
Wildfirewildfirewildfirehttps://ladsweb.eosdis.nasa.gov/
Land coverland use degreeLAhttps://earthdata.nasa.gov
Climaticdiurnal temperature rangedtrhttps://crudata.uea.ac.uk/cru/
frost day frequencyfrs
potential evapotranspirationpet
precipitationpre
daily mean temperaturetmp
monthly average minimum temperaturetmn
monthly average maximum temperaturetmx
vapor pressurevap
wet day frequencywet
Vegetationfraction of vegetation coverageFVChttps://earthdata.nasa.gov
Topographicelevationelevationhttp://www.gscloud.cn
slopeslope
aspectaspect
Table 4. Classification index of land use.
Classifications of LALand Use/Land CoverClassification
Unused landBarren 1
Grassland forest and waterForest/grassland/water2
Cultivated landCroplands3
Artificial surfaceUrban land, rural residential land4
Table 5. AUC and significance level of the RF model.
Complete DatasetSample 1Sample 2Sample 3
AUC0.9510.9480.9500.949
p-value<0.001<0.001<0.001<0.001

