Technical Note

Estimating Pasture Biomass and Canopy Height in Brazilian Savanna Using UAV Photogrammetry

1
Faculty of Veterinary Medicine and Animal Science, Federal University of Mato Grosso do Sul, Avenida Senador Filinto Muller 2443, Campo Grande 79074-960, MS, Brazil
2
Faculty of Engineering, Architecture and Urbanism and Geography, Federal University of Mato Grosso do Sul, Av. Costa e Silva, s/n, Campo Grande 79070-900, MS, Brazil
3
Faculty of Computer Science, Federal University of Mato Grosso do Sul, Av. Costa e Silva, s/n, Campo Grande 79070-900, MS, Brazil
4
Department of Forest Engineering, Santa Catarina State University (UDESC), Lages SC 88520-000, Brazil
5
Department of Geography and Environmental Management and Department of Systems Design Engineering, University of Waterloo, Waterloo, ON N2L 3G1, Canada
*
Author to whom correspondence should be addressed.
Remote Sens. 2019, 11(20), 2447; https://0-doi-org.brum.beds.ac.uk/10.3390/rs11202447
Submission received: 11 September 2019 / Revised: 4 October 2019 / Accepted: 9 October 2019 / Published: 22 October 2019
(This article belongs to the Section Remote Sensing in Agriculture and Vegetation)

Abstract

:
The Brazilian territory contains approximately 160 million hectares of pastures, and it is necessary to develop techniques to automate their management and increase their production. This technical note has two objectives: First, to estimate the canopy height using unmanned aerial vehicle (UAV) photogrammetry; second, to propose an equation for the estimation of biomass of Brazilian savanna (Cerrado) pastures based on UAV canopy height. Four experimental units of Panicum maximum cv. BRS Tamani were evaluated. Herbage mass sampling, height measurements, and UAV image collection were simultaneously performed. The UAVs were flown at a height of 50 m, and images were generated with a mean ground sample distance (GSD) of approximately 1.55 cm. The forage canopy height estimated by UAVs was calculated as the difference between the digital surface model (DSM) and the digital terrain model (DTM). The R2 between ruler height and UAV height was 0.80; between biomass (kg ha−1 GB—green biomass) and ruler height, 0.81; and between biomass (kg ha−1 GB) and UAV height, 0.74. UAV photogrammetry proved to be a potential technique to estimate height and biomass in Brazilian Panicum maximum cv. BRS Tamani pastures located in the endangered Brazilian savanna (Cerrado) biome.

1. Introduction

The Brazilian territory contains nearly 160 million hectares of pastures which are located mainly in the North, Southeast, and Center-West regions [1]. One of the main activities developed in the country is livestock farming. The Brazilian cattle herd consists of approximately 226 million head [2], a large portion of which is reared on pasture [3], thus warranting efforts to optimize pasture management. Therefore, determining biomass availability is an essential step in the adequate planning of pasture exploitation, since biomass-estimation strategies are aimed at defining the stocking rate of grazing systems, herbage growth, nutritional value, and defoliation regimes based on grazing activity and stocking methods [4].
Biomass measuring is described as an evaluation, the objective of which is to quantify the dry matter present above ground level per unit area [5]. Though thus involves simple techniques that can be performed in small areas, manual measurements require time and extensive labor. For this reason, research involving automated and non-destructive measuring approaches is still necessary [6].
Unmanned aerial vehicles (UAVs) are an adapted platform due to the diversity of sensors that allows them to be set up and flown to collect aerial images with high temporal and spatial resolution. Advances in precision, cost–benefit values, and the miniaturization of technologies such as computer processors and the global navigation satellite system (GNSS) has made the UAV a versatile platform, resulting in a tool capable of performing well in a wide range of applications [7,8], including soybean yield estimation, plant maturity prediction [9], and wheat plant density estimation [10].
Previous studies have shown the potential of UAVs for estimating the biomass of typical agricultural crops in Germany [11,12]; evaluating the applicability of images to model the height of eggplant, tomato, and cabbage plantations in India [13]; detecting weeds within rows in sunflower and cotton plantations in Spain; the monitoring of pastures [14]; the modeling of canopy height and biomass [15]; the estimation of biomass in temperate pastures in China [16]; the investigation of the utility of images acquired using UAVs to predict traces of vegetation in pastures [17]; the classification of species in mixed pasture in Canada [18]; and the estimation of biomass during the growth of the plants based on the residual heights of plants of crop surface models (CSM) [19].
Bendig [12] found a higher correlation between biomass and crop height when estimated by UAVs compared to spectral indices (estimated from the ratio between spectral bands). Moeckel [13] concluded that the manual measurement of plant height can be replaced by measurements obtained by UAV photogrammetry. Castro [20] reported that their used algorithm was able to identify each individual plant in their images, including weeds, and it was also able to accurately estimate plant height based on a digital surface model (DSM).
The previously mentioned studies were developed on different crops. In view of the scarcity of scientific data using UAVs to estimate height and biomass in Brazilian pastures, the present study investigates the use of UAV photogrammetry to estimate the pasture height and biomass of Panicum maximum cv. Tamani grass in the Brazilian state of Mato Grosso do Sul, Brazil. The adequate management of pastures enables the optimization of their uses and consequently contributes to significant environmental preservation, thus reducing pressure over forest remnants. There are several biomes in the Mato Grosso do Sul state, including Pantanal, which is considered by UNESCO (United Nations Educational, Scientific and Cultural Organization) to be one of the world heritage sites.
The study area is located in the Upper Paraguay Basin (UPB) that encompasses Pantanal, which is in the Brazilian savanna (Cerrado), and every environmental change in this area impacts on Pantanal. The main UPB rivers rise in the Cerrado and go towards the Pantanal. The intensive exploitation of the Cerrado by livestock and agriculture activities favors the occurrence of erosive processes. The use of soil conservation techniques and the management of the pastures contribute to the sustainability of the ecosystem.

2. Material and Methods

An experiment with Panicum maximum cv. BRS Tamani grass was undertaken at Fazenda Escola at the Federal University of Mato Grosso do Sul (Section 2.1). Herbage mass sampling, height measurements, and image capturing (using UAVs) were simultaneously performed and are described in Section 2.2 and Section 2.3. After being collected on the field, the images were processed (Section 2.3). Lastly, regression and correlation analyses were performed to evaluate the results (Section 2.4).

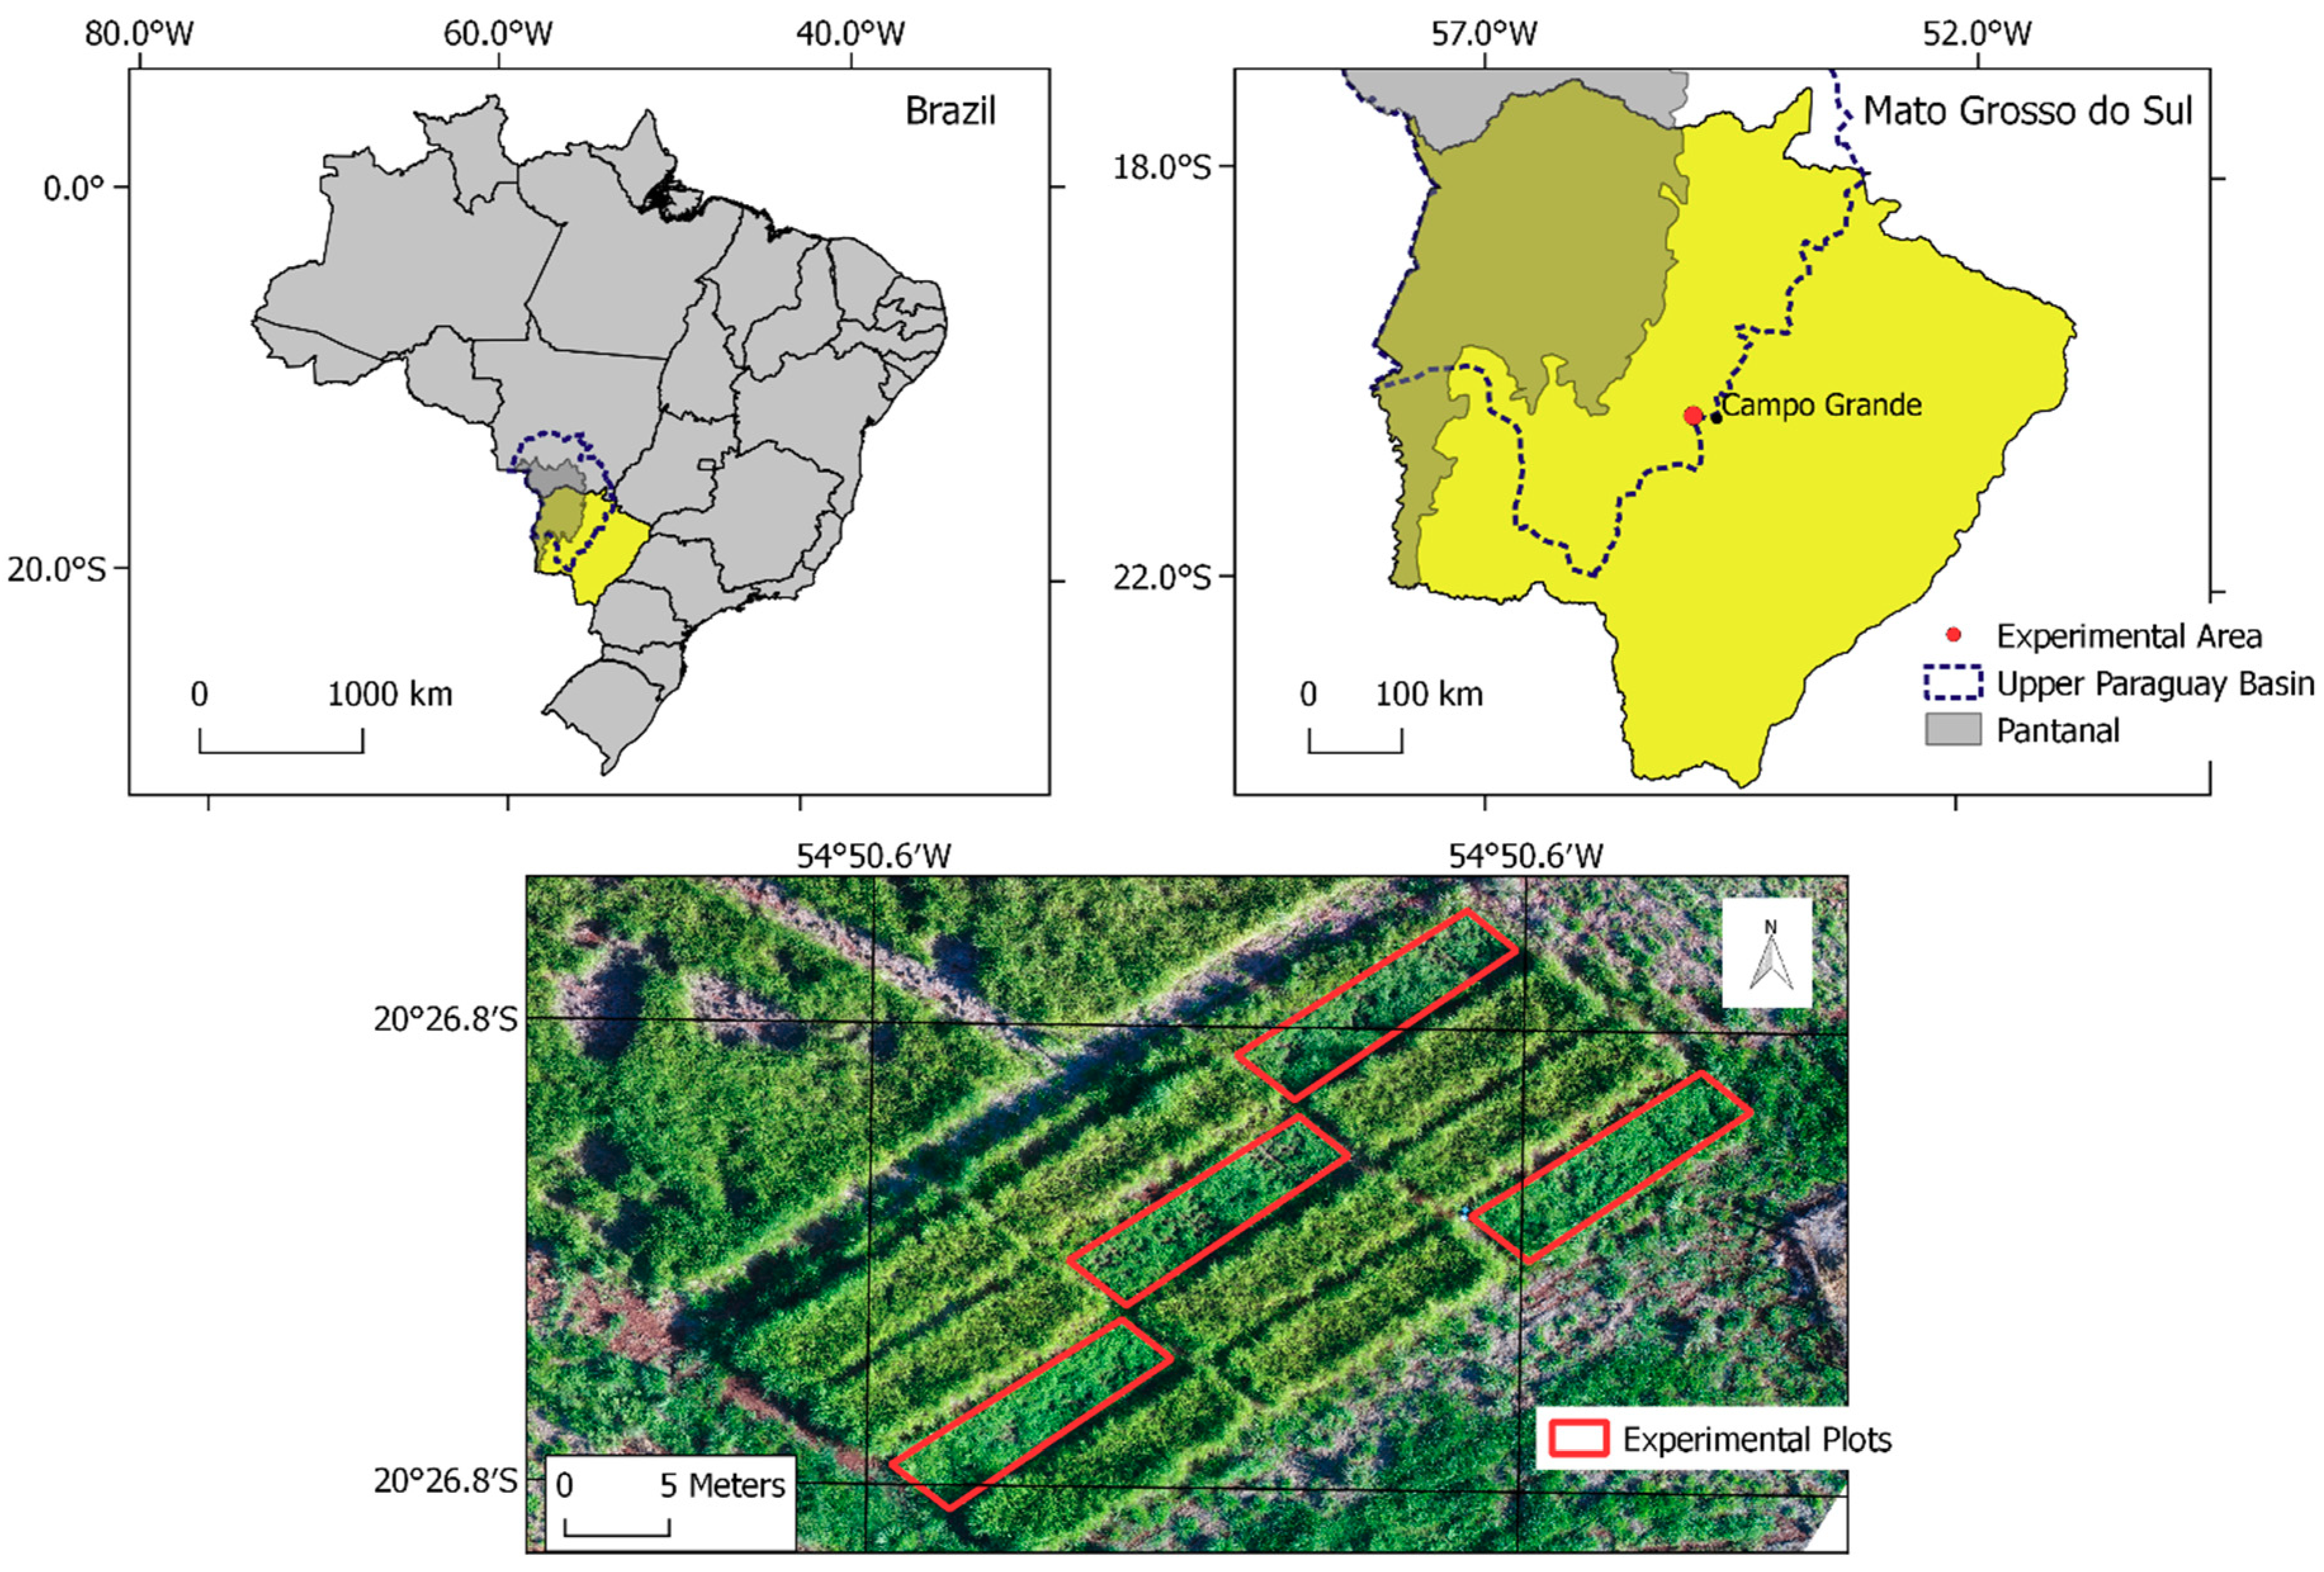
2.1. Experimental Area

The experiment was conducted in the forage section (Figure 1) at Fazenda Escola, in the municipality of Terenos—Mato Grosso do Sul (MS), Brazil (latitude 20°26′34.31″S, longitude 54°50′27.86″W, altitude 530.7 m) (Figure 1). Before the implementation of the experiment, the samples of soil were collected from the 0–20 cm layer to determine fertility (Table 1). Dolomitic limestone was applied at the rate of 1.2 t ha−1 (total relative neutralizing power (TRNP) = 80%). Before planting, the area was fertilized with 100 kg ha−1 of P2O5, 100 kg ha−1 of N (in the form of urea), and 60 kg ha−1 of K2O. The Panicum maximum cv. BRS Tamani grass was planted in November 2015.
Cultivar BRS Tamani was implemented in four 3 × 12 m2 experimental plots, which were subdivided into 3 × 3 m subplots, totaling 9 m2 for each harvest age (21, 35, 49 and 63 days).

2.2. Biomass Sampling and Height

All the biomass present in the experimental units was quantified through harvesting at the height of 10 cm above the ground. Plant height was monitored at the time of harvest (21, 35, 49 and 63 day harvest intervals) (Table 2). In each experimental unit, measurements were taken at five representative points at the average height of the curvature of the upper leaves around the ruler, which was graduated in centimeters. Sampling (n = 66) took place on the same day the UAV was flown.

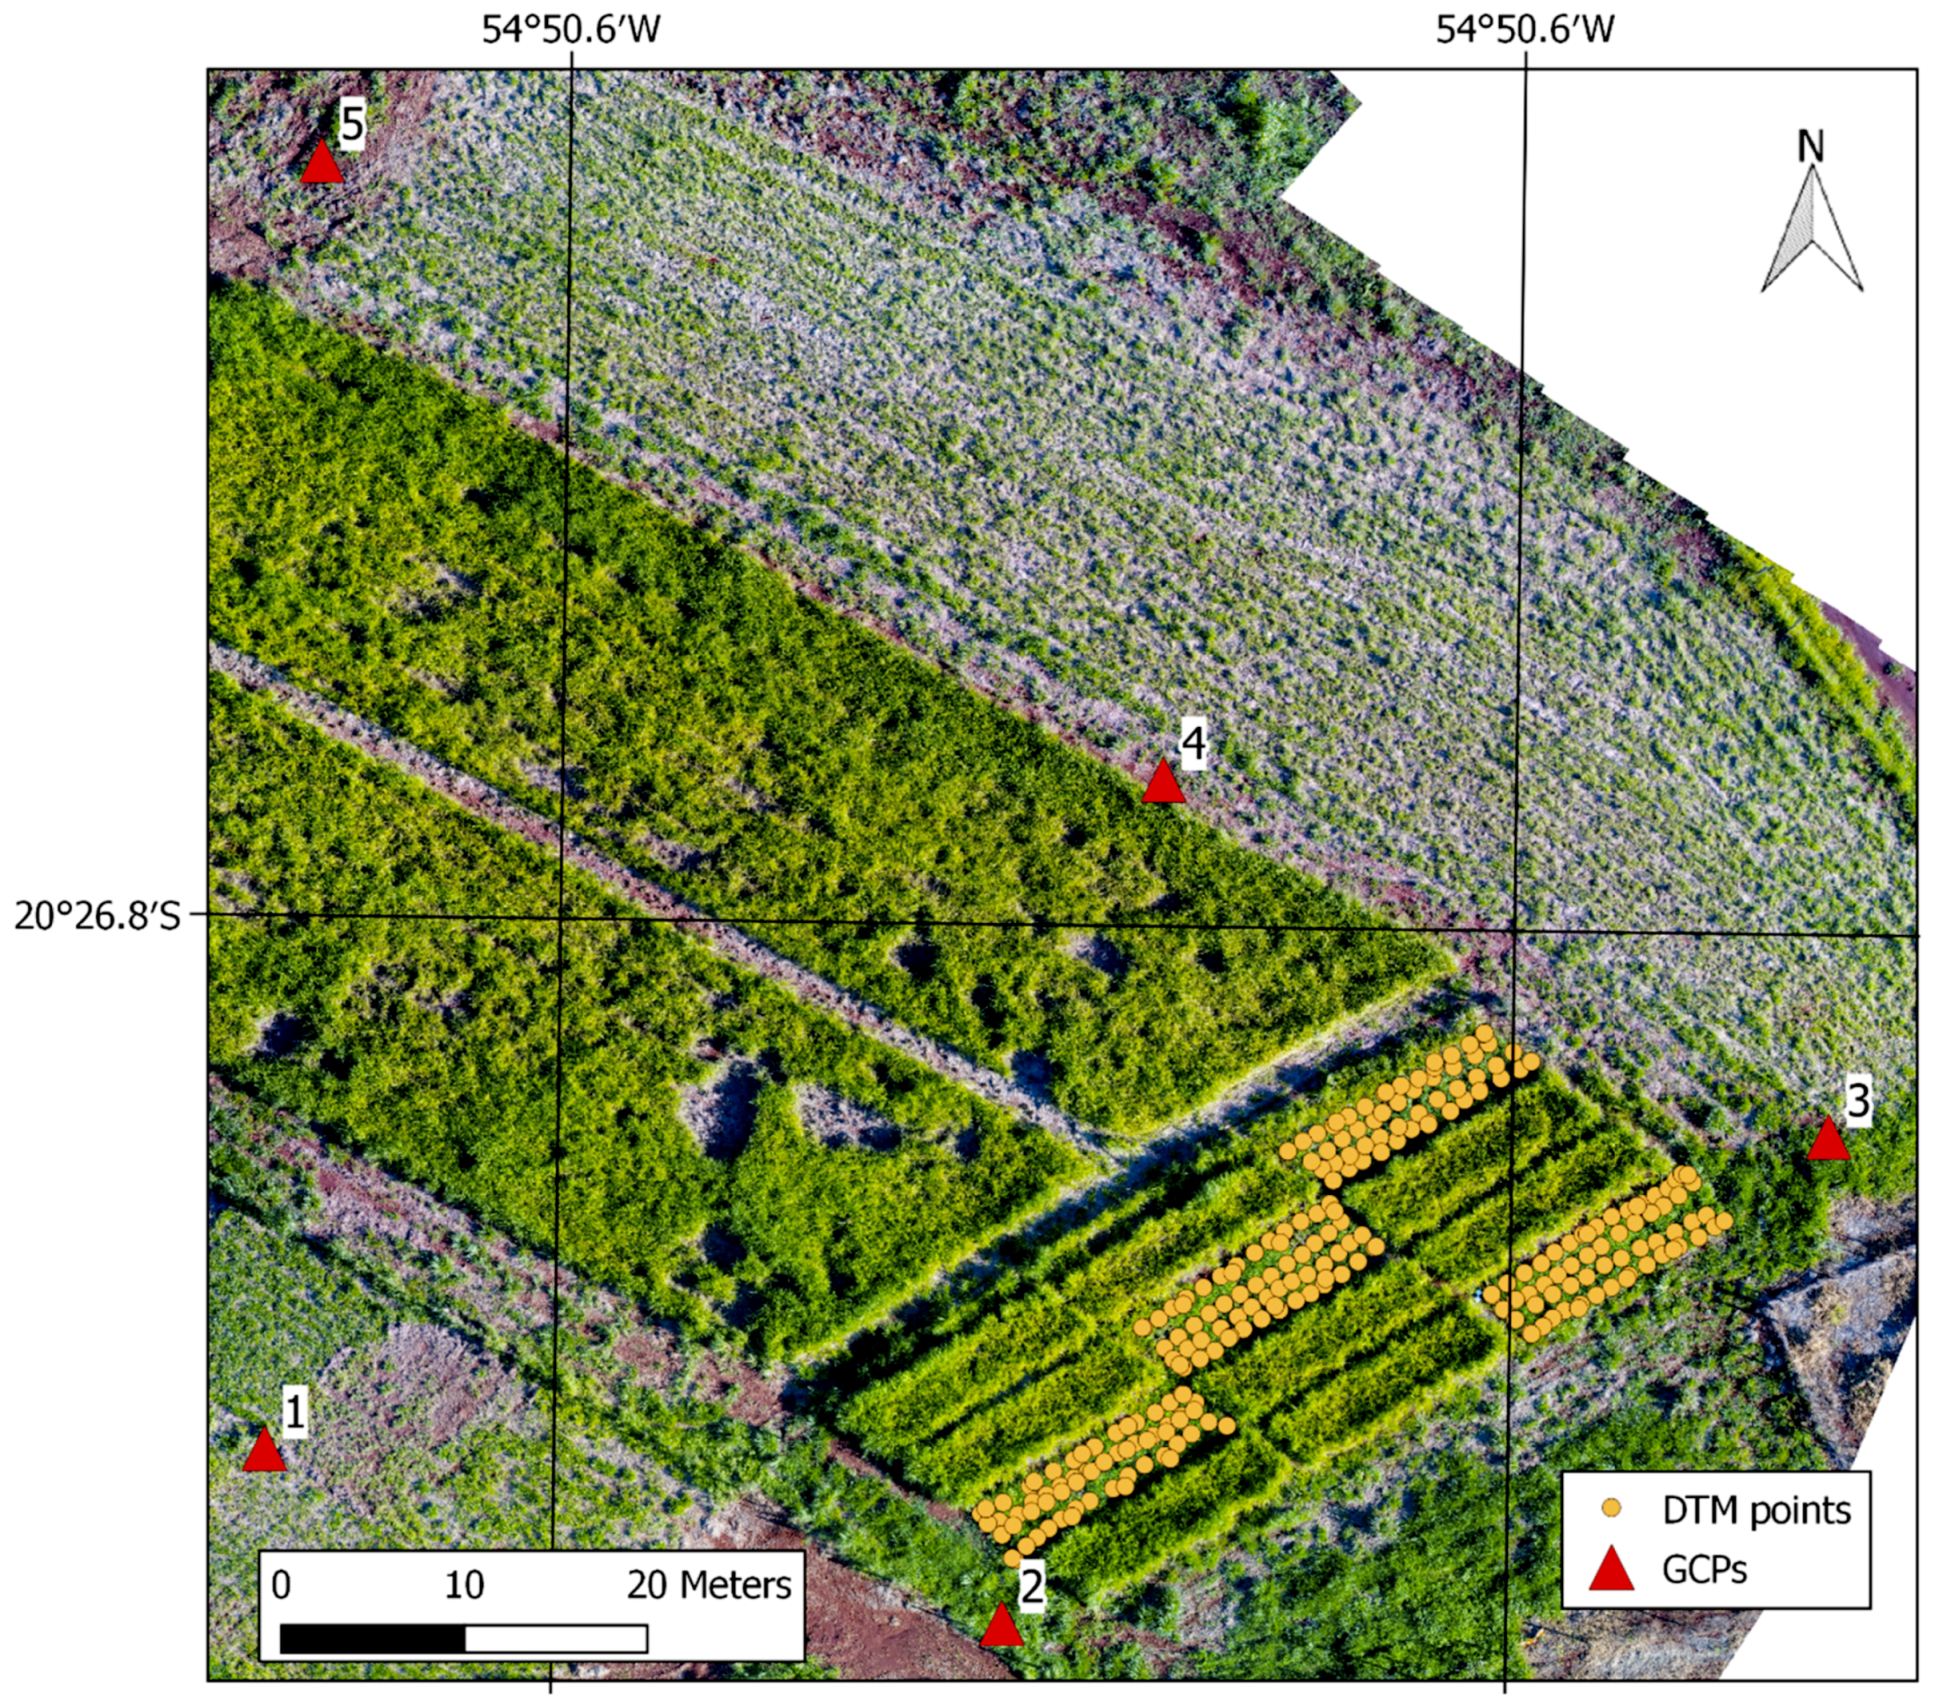
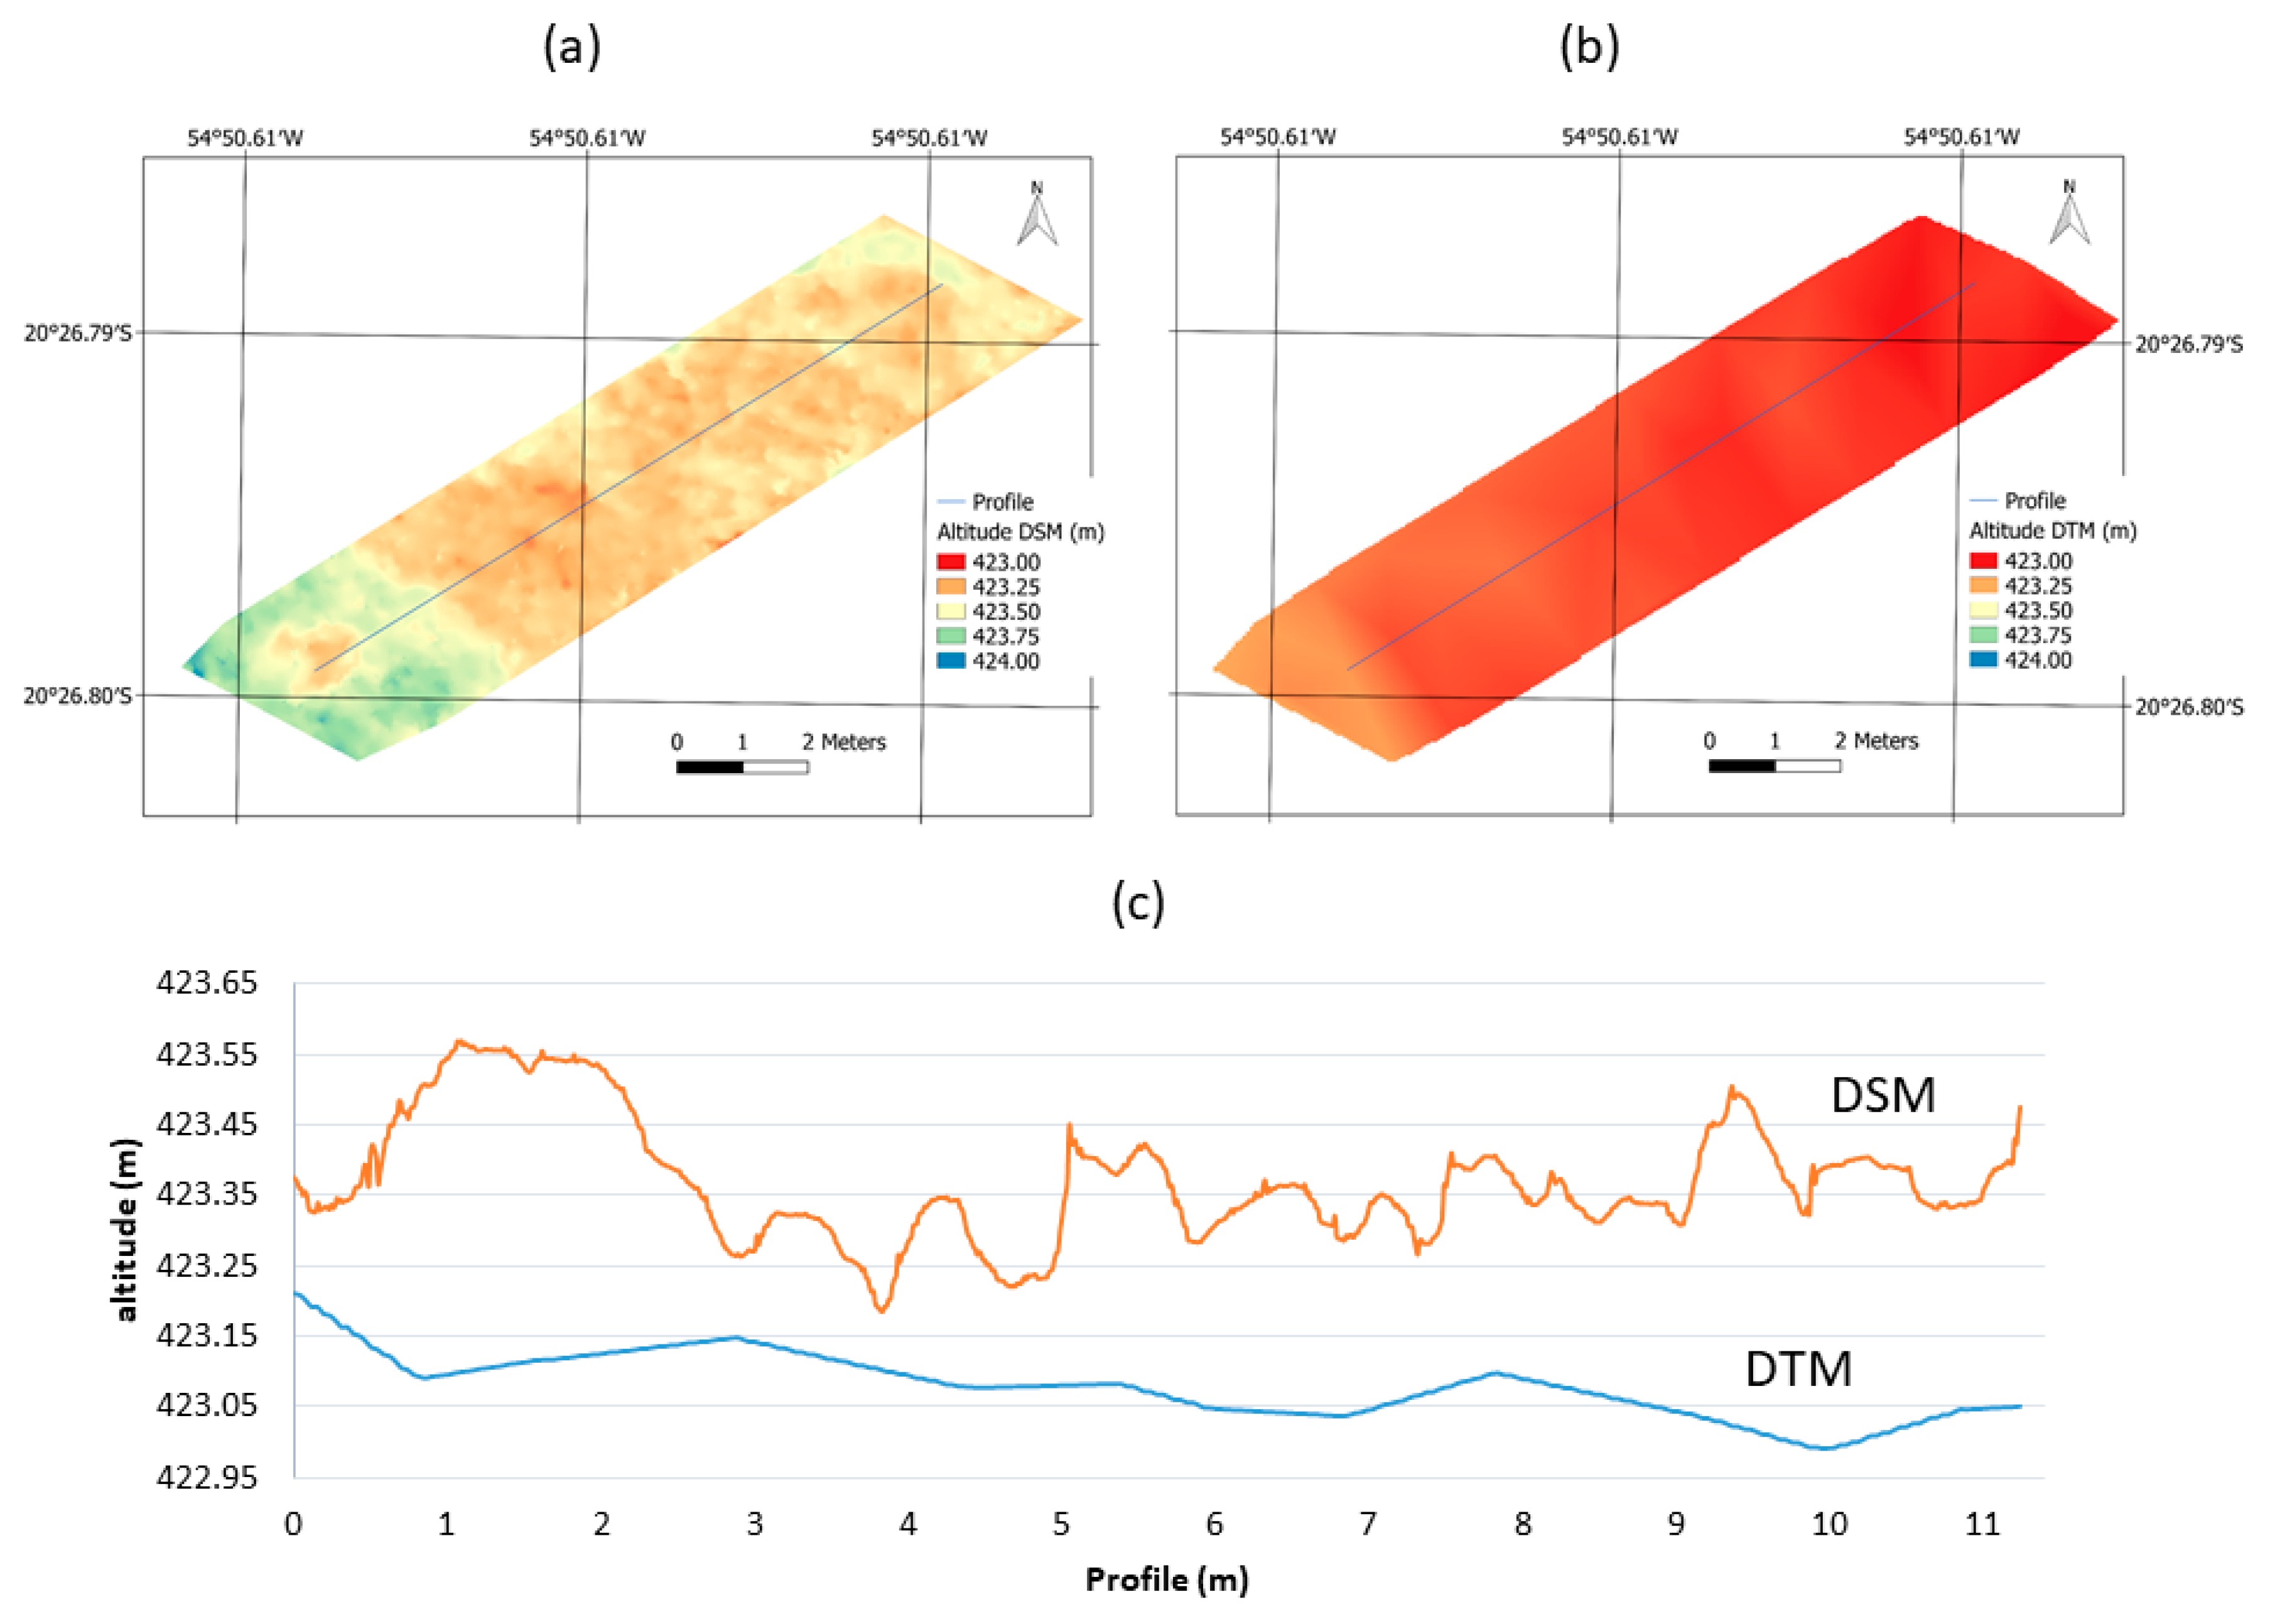
2.3. Image Collection and Processing

RGB (Red, Green and Blue) images were collected by a Phantom 4 advanced (ADV) UAV. The UAV was flown before the biomass harvest and the height measurement. The camera has a 20-megapixel complementary metal-oxide semiconductor (CMOS), and each battery lasts 30 min at most.
The image processing was performed using Pix4D commercial software. This software can be used for interior and exterior parameter optimization, point clouds, and orthophotos generation. Several studies have assessed Pix4D, e.g., for the generation of surface models [21,22] and the estimation of plant height [23], as well as for the presentation of its basic concepts [24,25]. UAV photogrammetric software use computer vision methods, such as structure-from-motion (SfM) [26] and multi-view stereo (MVS) [27].
SfM enables the simultaneous estimation of interior and exterior orientation parameters and the coordinates of a sparse point cloud using images with overlap [25,28]. The scale invariant feature transform (SIFT) [29] method and its variants, in general, are used for image correspondence [25]. After that, the sparse point cloud is densified using MVS algorithms.
For the SfM method, five targets of approximately 50 × 50 cm were distributed in the experimental area. A previous study [30] showed the importance of ground control point (GCP) distribution for improving planimetry and altimetry accuracies. Therefore, five GCPs were used, as it was a small flat area. The target coordinates were estimated using a GS15 GNSS real-time kinematic (RTK) receiver of the LEICA VIVA GNSS GS15 line with a 3D precision of 5 mm. To assess the SfM method, the leave-one-out method, in which all the points were once considered check-points, was applied [31] (see Table 3).
The UAV was flown at a height of 50 m upon approval by the Department of Airspace Control (DECEA), which is responsible for the Brazilian airspace. Images were captured with longitudinal and lateral overlaps of 80% and 60%, respectively, and with a ground sample distance (GSD) of approximately 1.55 cm. The analysis of Table 3 shows that an accuracy of around 1 GSD was achieved in the X and Y coordinates, as well as 2.5 GSD in altimetry (Z).
To estimate pasture biomass and height with the UAV, the digital terrain model (DTM) was generated using at least 30 points per experimental plot surveyed using RTK (Figure 2) with the triangular irregular network (TIN) method. The digital surface model (DSM) (Figure 3a) was generated by applying the SfM and MVS methods in Pix4D software, with points over the pasture. Pasture height was calculated from the difference between the DSM and the DTM (Figure 3c).

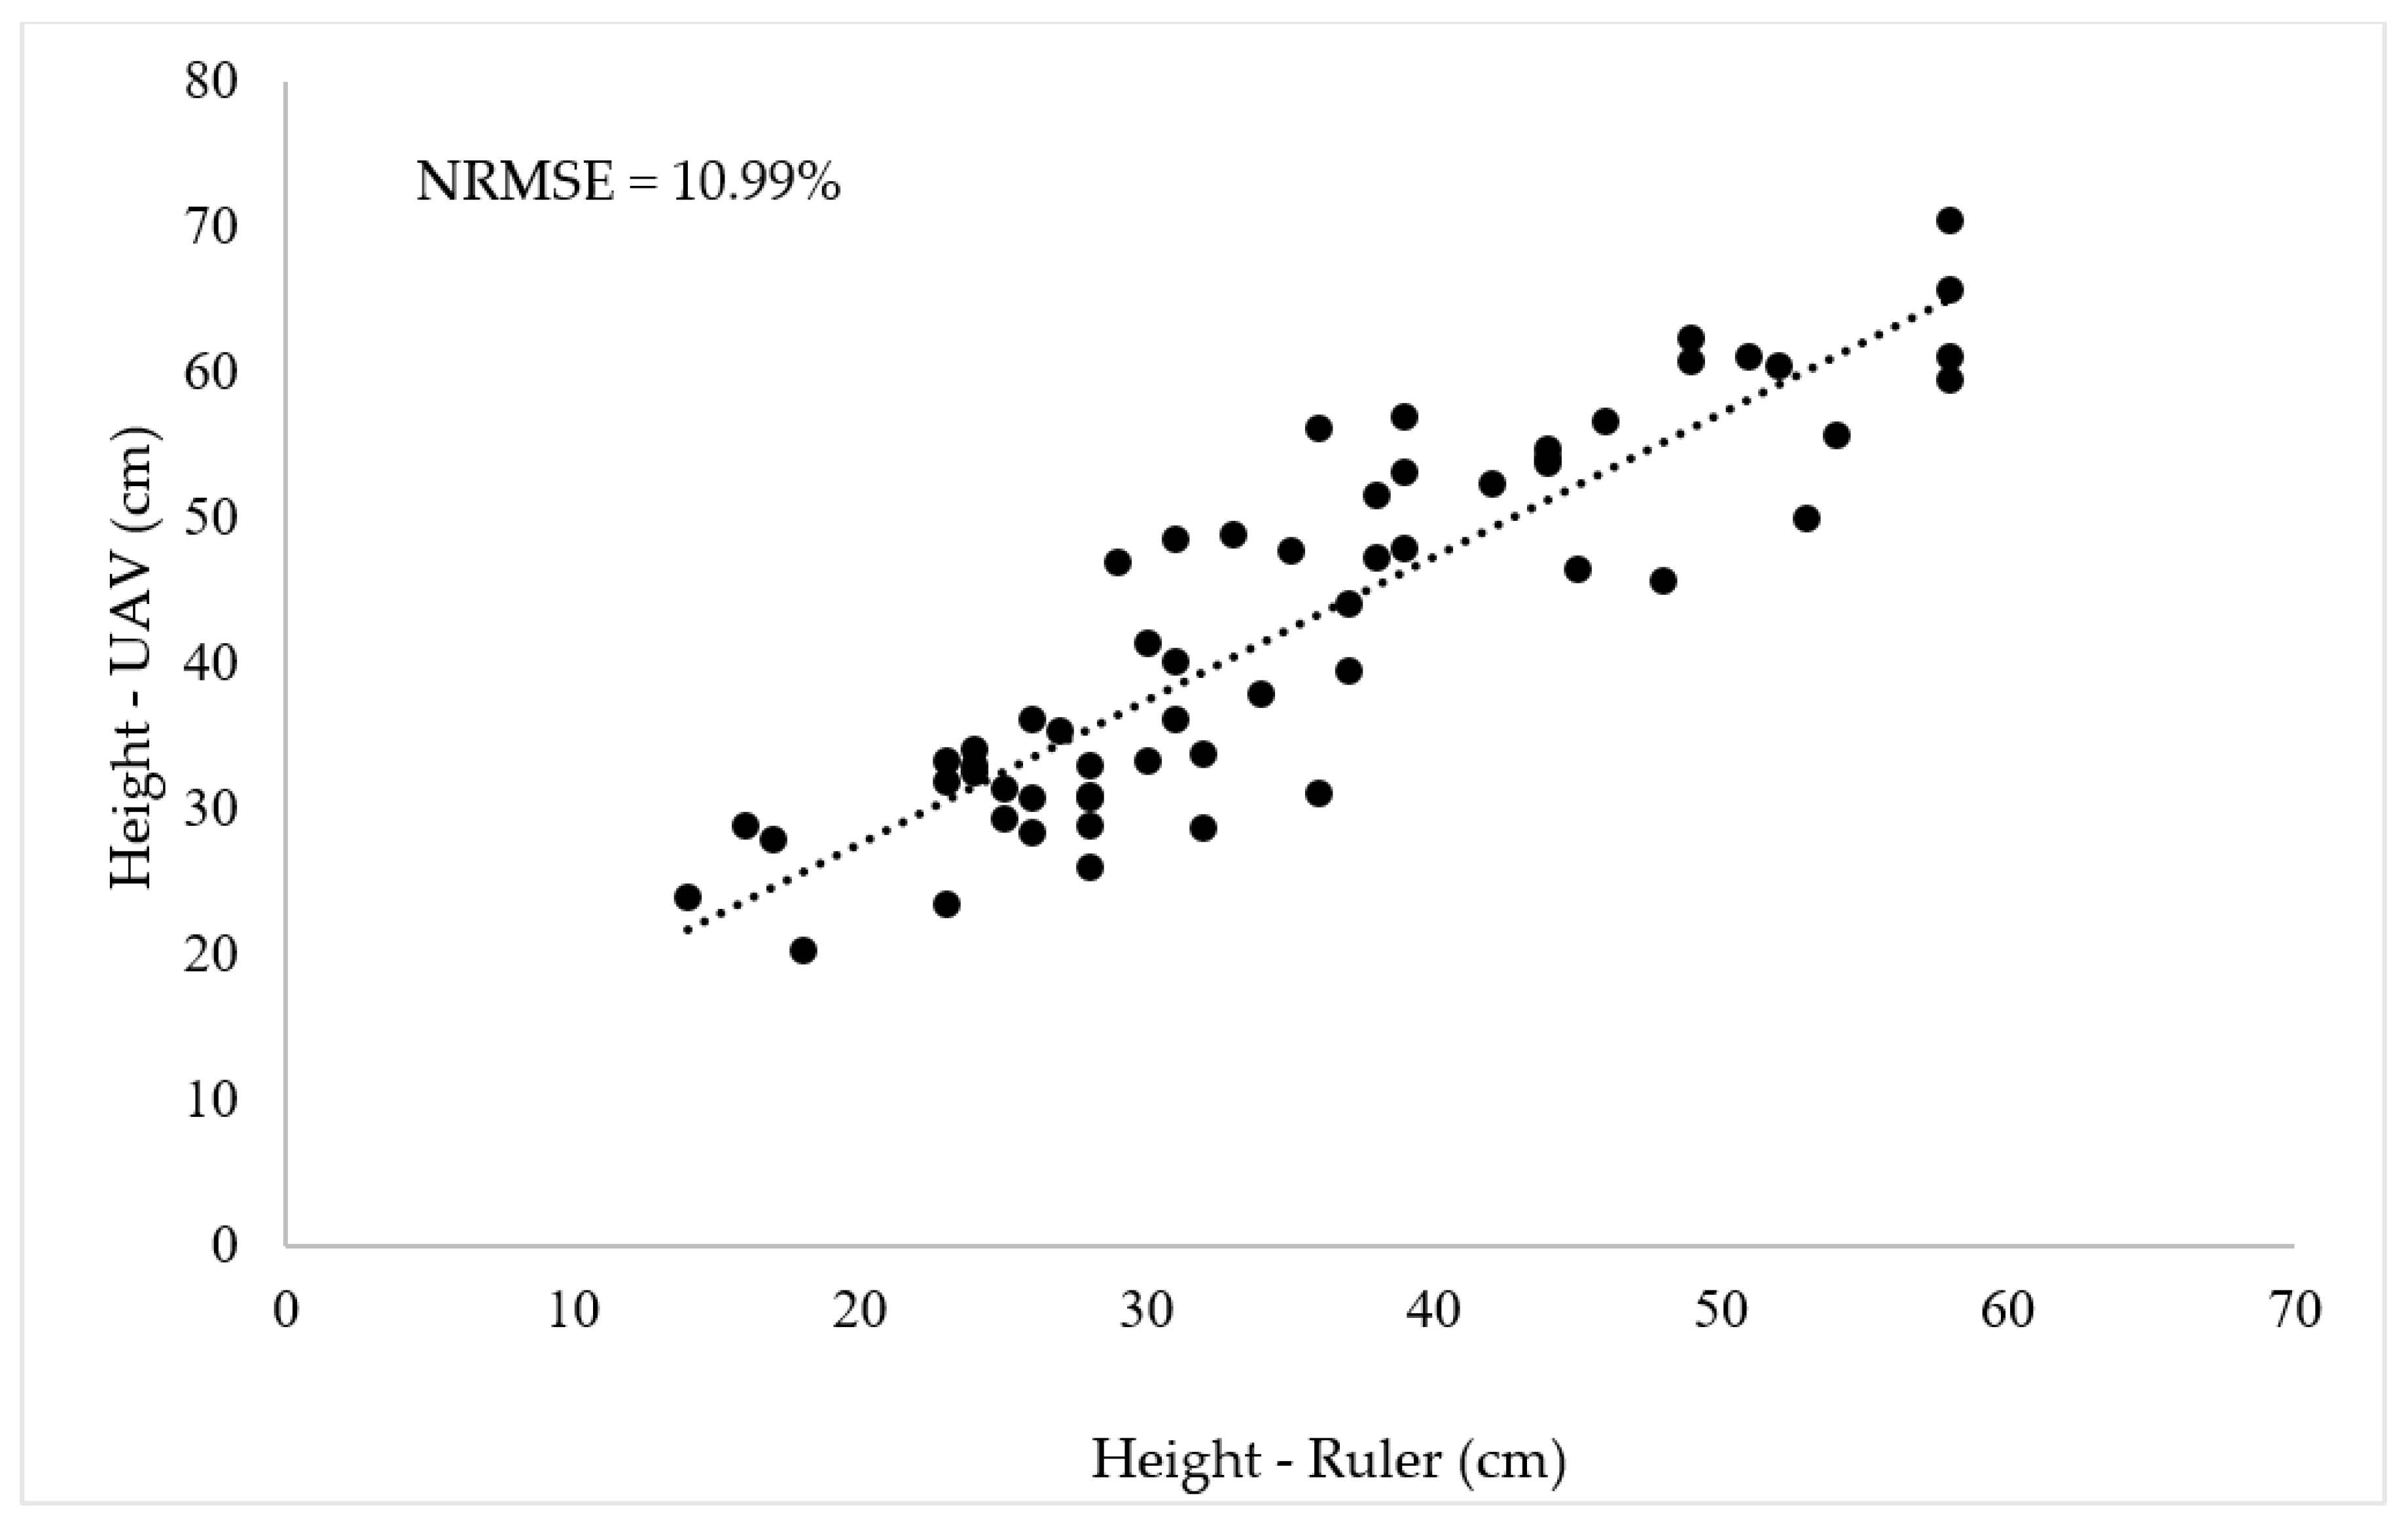
2.4. Statistical Analysis

In order to estimate accuracy, the normalized root mean square error (NRMSE) was estimated using the leave-one-out method [31]. In this method, the linear equation parameters were estimated without one point. After that, the discrepancy at this point was estimated. The NRMSE (%) was estimated by considering 66 discrepancies (n = 66) in the points left out.
Correlation and regression analyses were performed considering n equal to 66. The average canopy height per experimental unit, obtained by the UAV, was evaluated in comparison to the average canopy height, which was obtained from measurements taken using a ruler in the field. The result is presented in a scatter plot along with a linear regression equation.
To estimate herbage mass, linear regression equations were derived from the canopy height obtained by the UAV vs. green biomass and evaluated by their coefficient of determination (R2).

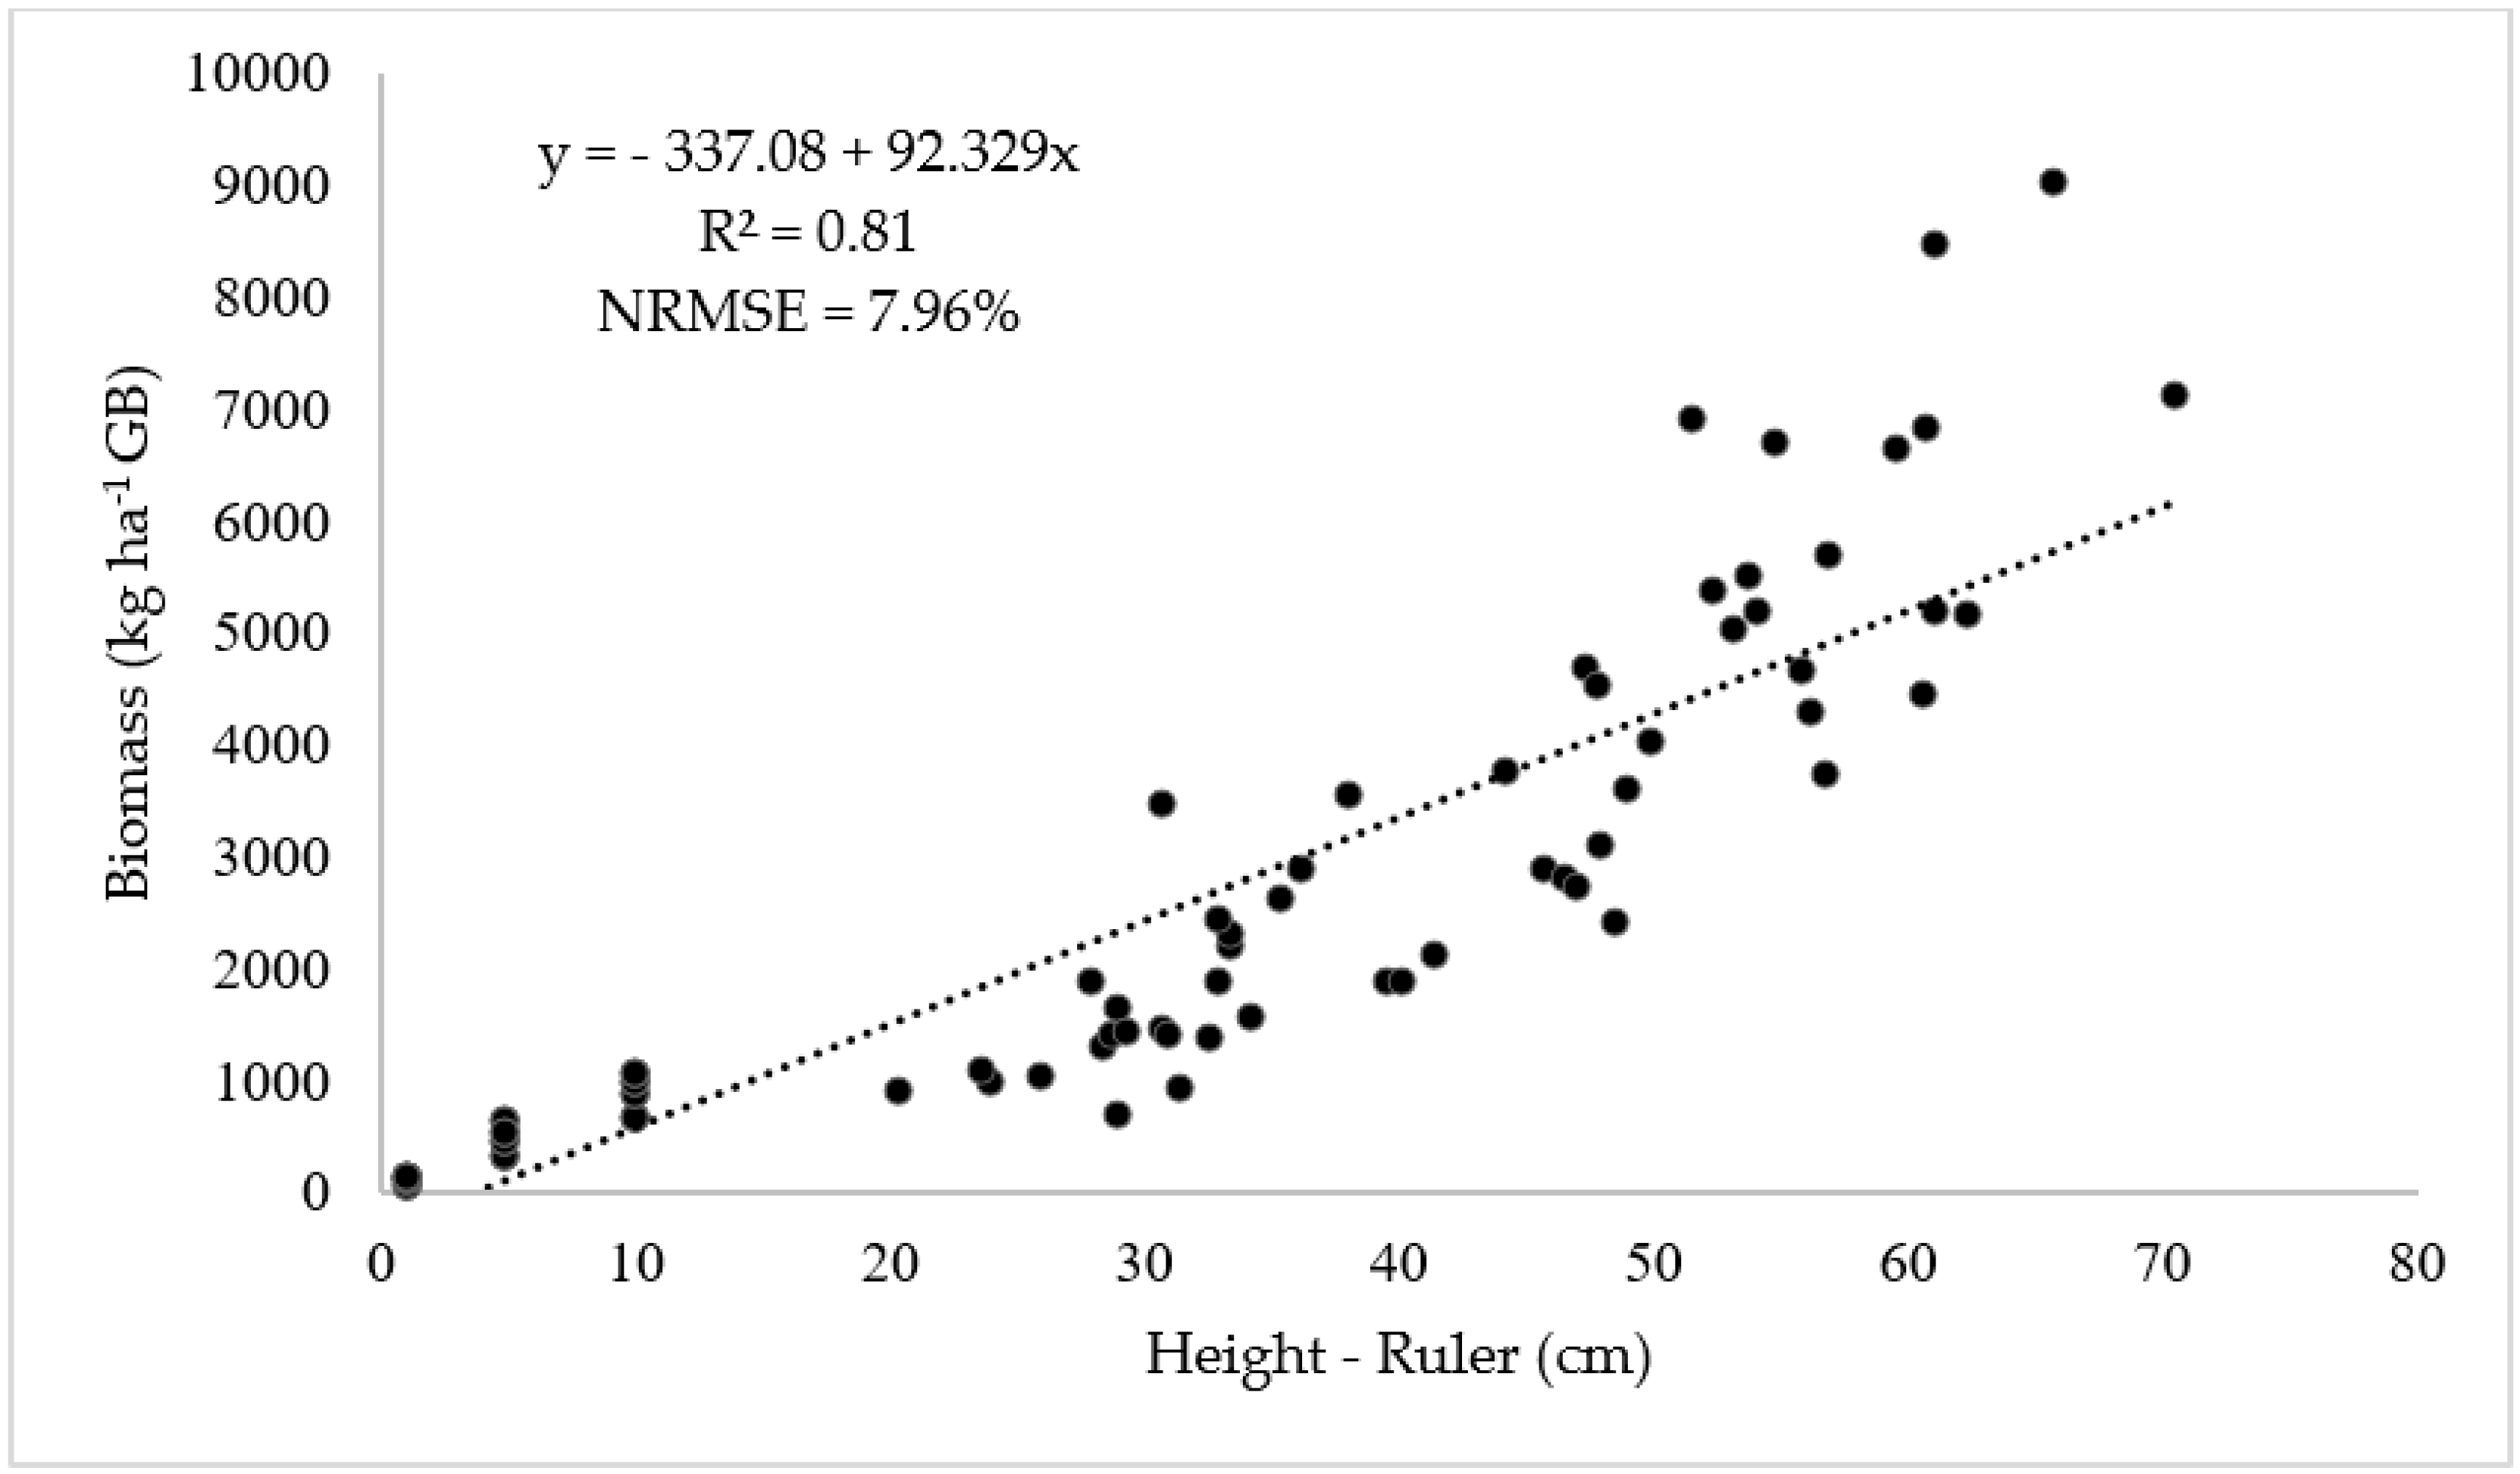
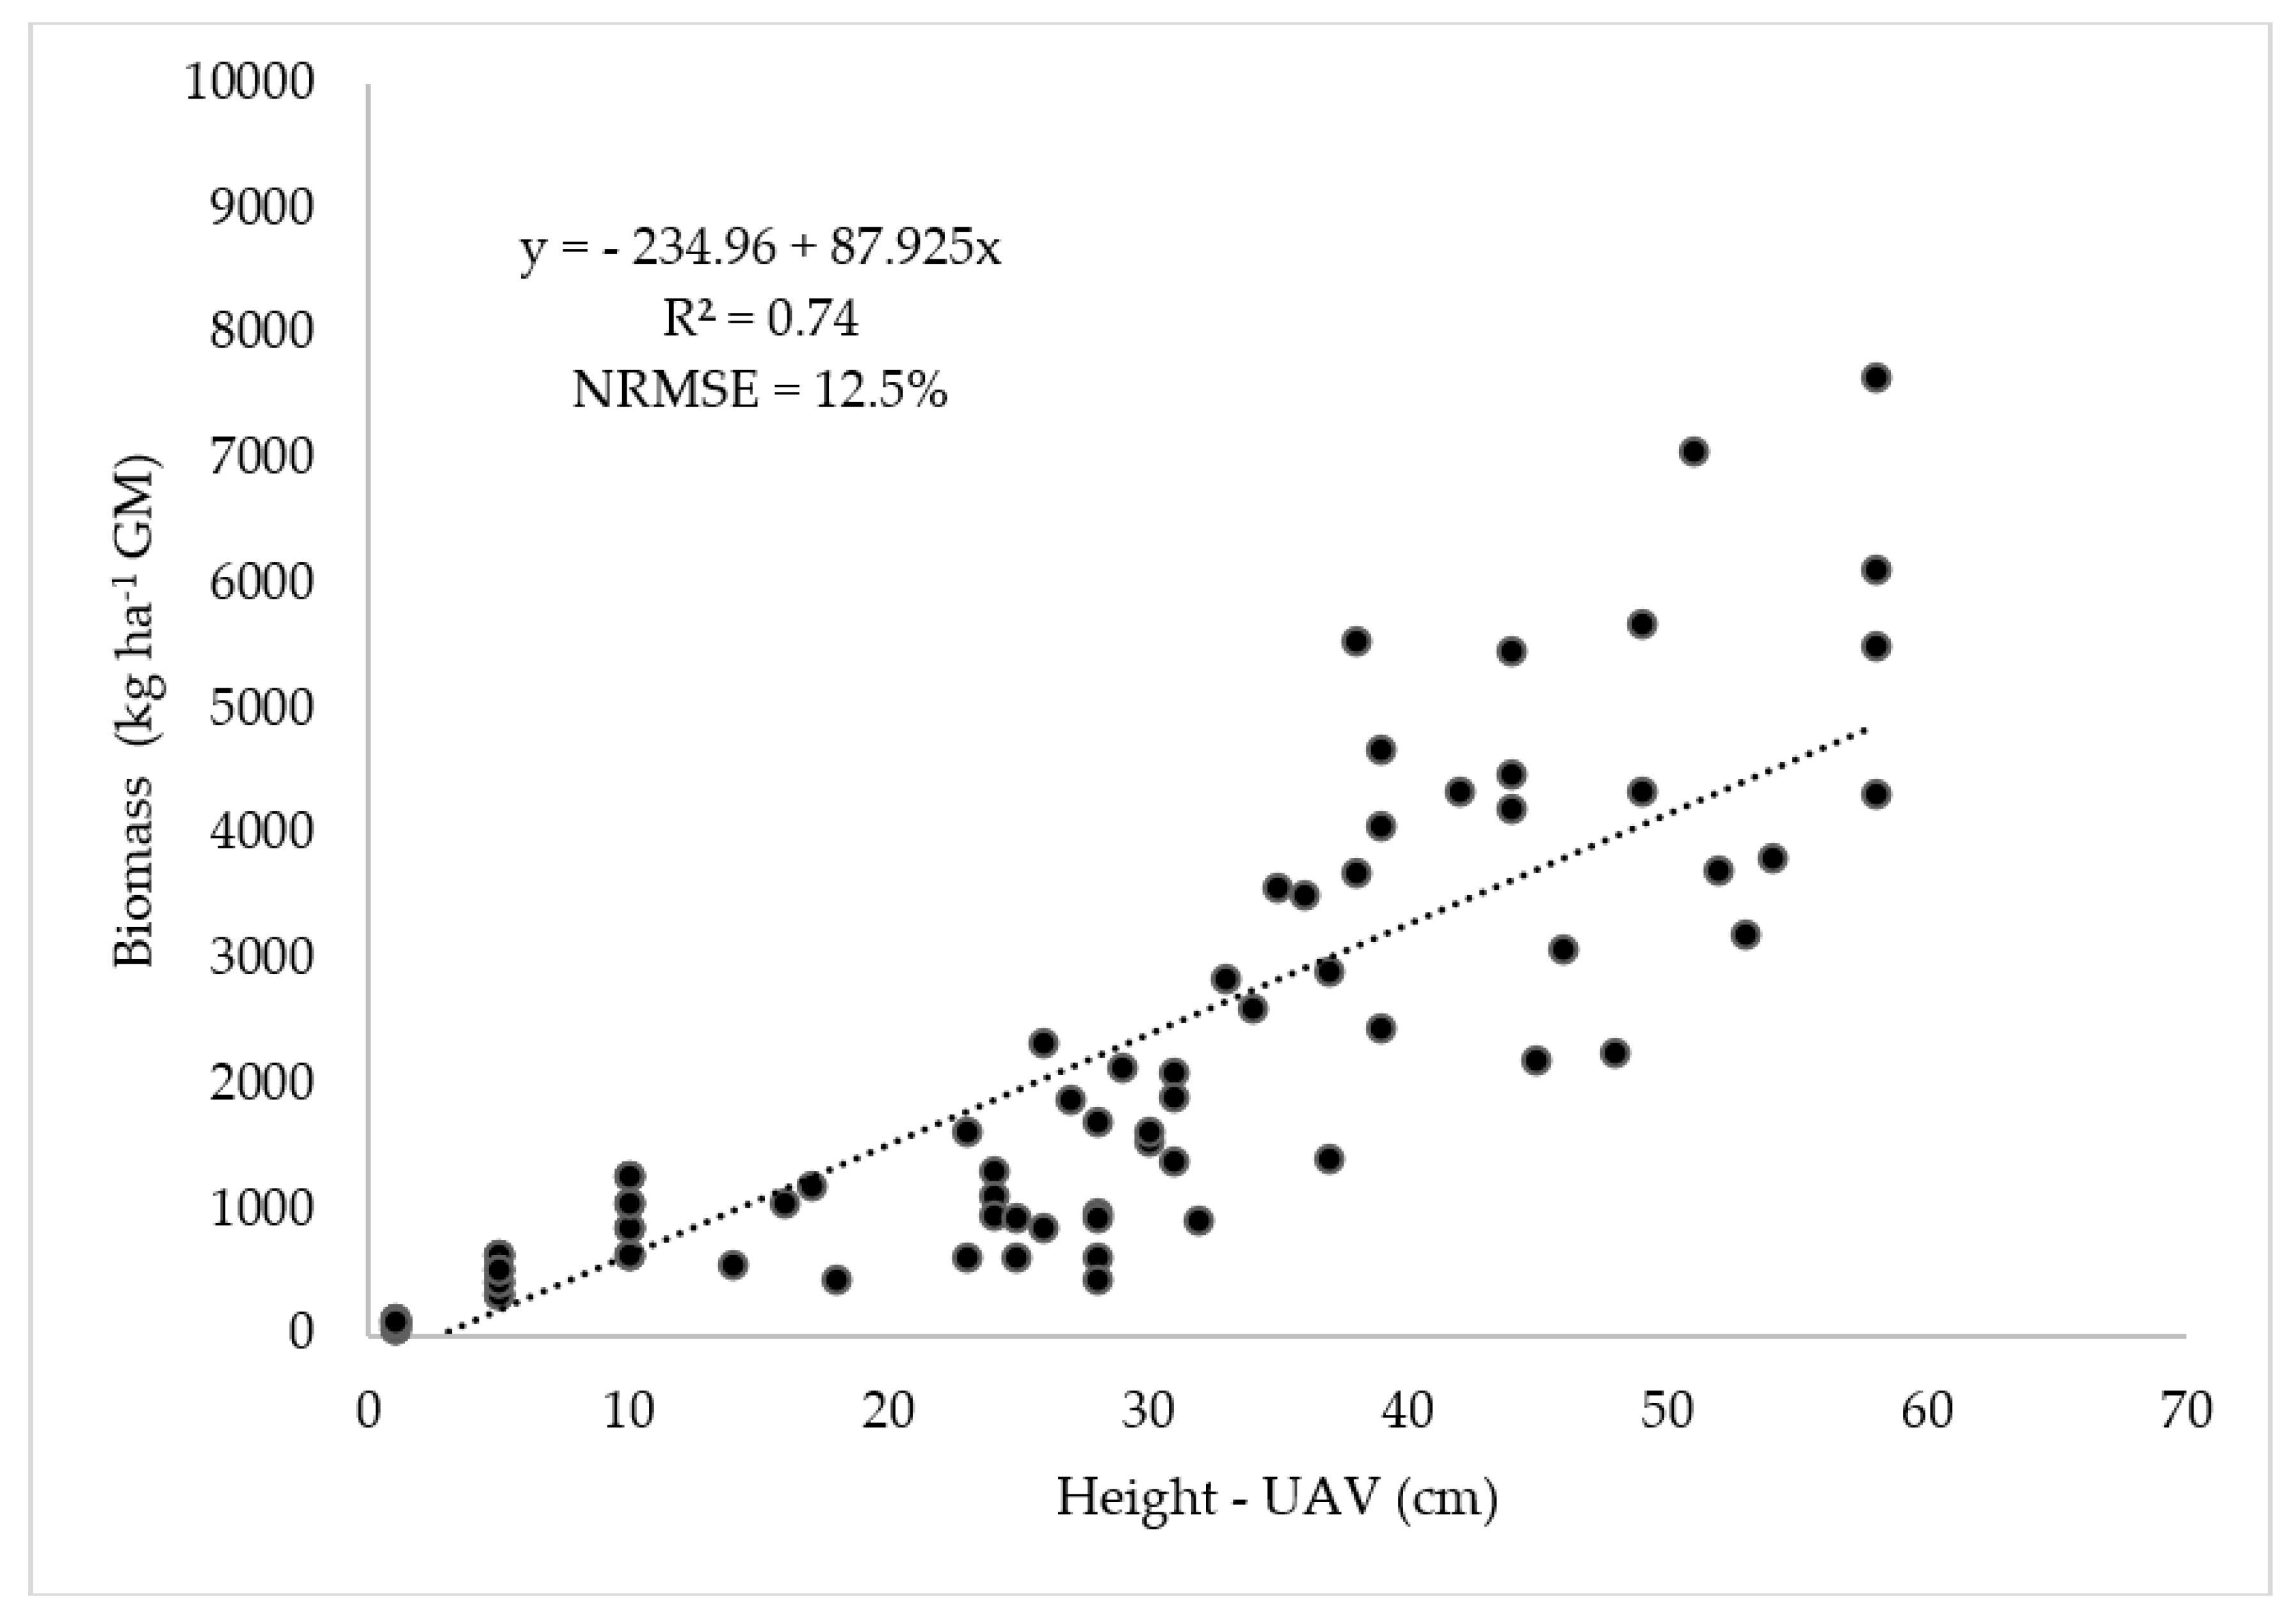
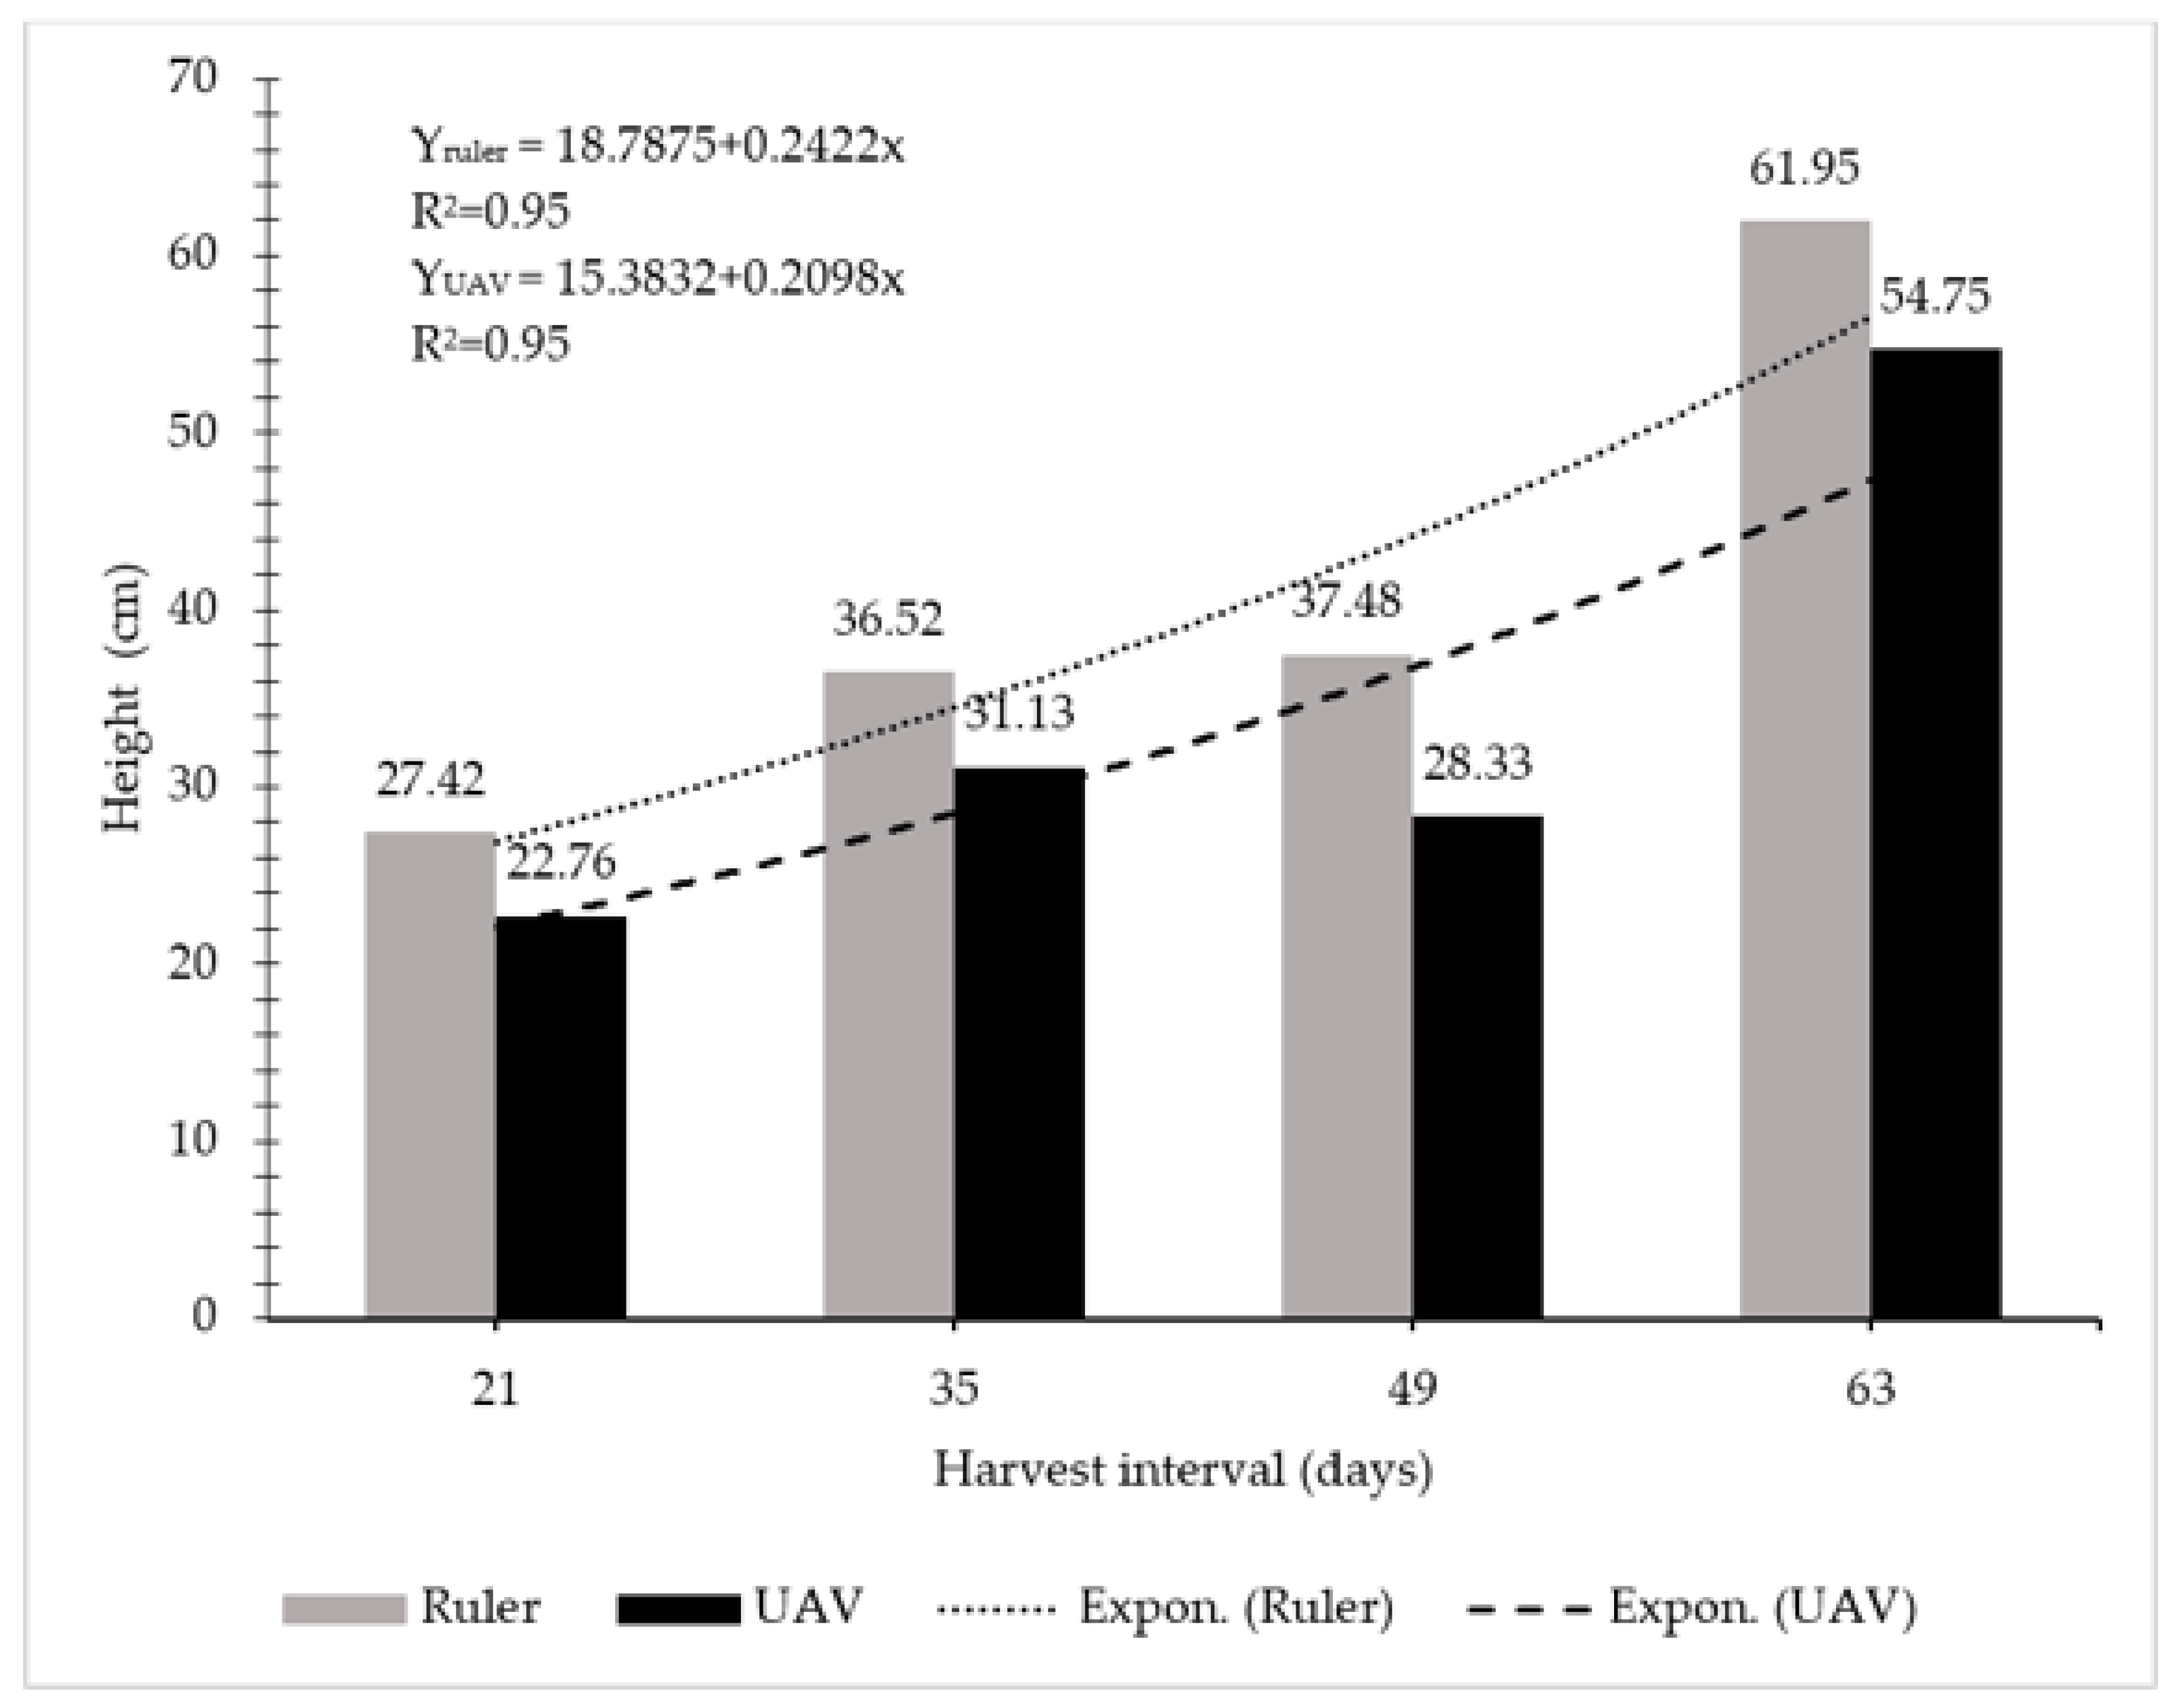
3. Results and Discussion

The NRMSE estimated using the leave-one-out method was around 10.99% when considering the height measured with the ruler and by the UAV (Figure 3). There was a correlation between the height measured with the ruler and by the UAV (correlation coefficient (CC) = 0.89). The difference between the heights derived from UAV images and those measured by the ruler was approximately 8 cm, as can be observed in the regression equation shown in Figure 4. As the regrowth age advanced, this difference decreased. This can be explained by the fact that UAVs capture images from the total plot area, which may include uncovered soil areas. According to Geipel [32], a DSM may underestimate height in heterogeneous fields where soil spots are apparent, which might have occurred at the earlier ages due to a lower height and, consequently, a lower leaf area index.
The CC between the height measured with the ruler and the biomass (Figure 5) was 0.90, indicating that these measurements were correlated. The NRMSE, when considering the height measured with the ruler and the biomass, was around 7.96%.
The NRMSE was around 12.5% when considering the height measured by the UAV and herbage mass. There was a correlation between the height measured by the UAV and herbage mass (CC = 0.86) (Figure 6). Each additional centimeter in the height measured by the UAV represented an increase of approximately 88 kg ha−1 in green biomass for each experimental plot, i.e., herbage mass increased proportionally to the canopy height when measured by the UAV. This observation corroborates the reports of Terra Lopes [33] and Casagrande [34], who observed higher herbage allowances at greater heights.
According to the regression models, the determination coefficients for the biomass estimated by the UAV and the ruler were 0.74 and 0.81, respectively. These values are higher than the 0.72 and 0.71 found by Bendig [11], who estimated the biomass of barley using a DTM and a DSM from RGB images obtained with a UAV. This corroborates the findings of Ehlert [35] and Zhang and Grift [36], who stated that there is a very close relationship between biomass and height.
Each regrowth day corresponded to a 0.2422 m increase in height when measured by the ruler and 0.2098 m when calculated by the UAV (Figure 7). A similar regrowth trend was observed by Maranhão [37] and Ansah [38] that assessed the productive and structural characteristics of different cultivars submitted to different cutting intervals.
As regrowth age advanced, herbage mass also increased. Biomass increased by 50.93 kg ha−1 GB (green biomass) with every regrowth day when estimated by the ruler and by 43.96 kg GB when the UAV was used (Figure 8). Increases in biomass were also found by Oliveira [39], Costa [40], Rodrigues [41], and Geleti and Tolera [42], who evaluated the forage yield in different cultivars and cutting intervals.
Due to the scarcity of studies regarding the use of UAVs to estimate biomass in Brazilian pastures, the present study investigated the use of UAV photogrammetry for this purpose in the Brazilian state of Mato Grosso do Sul, Brazil. In general, the obtained accuracy is consistent with what literature has obtained for other cultures in different areas of the world. The proposed equation for biomass was generated for a specific pasture by considering specific soil and conditions. The same soil type is very common in Brazil, and the same climate conditions occurs in many areas of the country. Consequently, it is possible to generalize the equation for certain regions in Brazil.

4. Conclusions

In this study, we examined the use of UAV photogrammetry to estimate biomass based on canopy height obtained with a digital elevation model and a digital surface model in Brazilian pastures. Firstly, we demonstrated that the applied technique is highly adequate for estimating canopy height.
Canopy height can be modeled with a high precision at different regrowth ages using high-resolution images obtained with a UAV (R2 = 0.80). The DSMs cover more details than measurements taken with a ruler, which gives a lower average canopy height per experimental unit.
The coefficients of determination (R2 = 0.74) and correlation (0.80) show that the canopy height obtained from images taken with a UAV is an adequate indicator for the estimation of herbage mass.
In order to provide an efficient management of the Brazilian pastures, the assessed technique should be performed considering a fixed-wing UAV. Such approaches enable the imaging of larger areas when compared to a multirotor UAV, which was used in the present work.

Author Contributions

Conceptualization, J.M.J. and A.D.; methodology, J.B., J.M.J. and T.A.; software, J.B., B.O., M.S., G.S.F., E.M. and H.S.; validation, J.B., L.Í., J.M.J., E.M., V.L. and W.G.; formal analysis, J.B., L.Í., V.L. and A.D.; investigation, J.B. and A.D.; resources, J.M.J. and A.D.; data curation, J.B., E.G., G.S.F., M.S., E.M. and B.O.; writing—original draft preparation, J.B.; writing—review and editing, J.M.J.,V.L., T.A., L.Í., J.L. and A.D.; supervision, J.M.J., J.L., and A.D.; project administration, J.M.J. and A.D.; funding acquisition, J.M.J., L.Í. and A.D.

Funding

This research was supported by UFMS, CAPES/Print (p: 88881.311850/2018-01), CNPq (p. 312038/2018-6, p. 433783/2018-4, and p. 313887/2018-7) and Fundect (p. 59/300.066/2015). VL is supported by FAPESC (2017TR1762). This study was financed in part by the Coordenação de Aperfeiçoamento de Pessoal de Nível Superior – Brasil (CAPES) – Finance Code 001.

Acknowledgments

The authors acknowledge NVIDIA corporation for the donation of a Titan X and a Titan V.

Conflicts of Interest

The authors declare no conflict of interest.

References

  1. IBGE 2006 Censo Agropecuário. Instituto Brasileiro de Geografia e Estatística. Available online: https://www.ibge.gov.br/estatisticas-novoportal/economicas/agricultura-epecuaria/9827censo-agropecuario.html?=&t=resultados (accessed on 16 May 2018).
  2. USDA. 2018.Livestock and Poultry: World Markets and Trade. Foreign Agricultural Service. 2018. Available online: https://apps.fas.usda.gov/psdonline/circulars/livestock_poultry.pdf (accessed on 16 May 2018).
  3. Ferraz, J.B.S.; Felício, P.E.D. Production systems—An example from Brazil. Meat Sci. 2010, 84, 238–243. [Google Scholar] [CrossRef] [PubMed]
  4. Rouquette, F.M., Jr. Invited Review: The roles of forage management, forage quality, and forage allowance in grazing research. Prof. Anim. Sci. 2016, 32, 10–18. [Google Scholar] [CrossRef]
  5. Hodgson, J. Nomenclature and definitions in grazing studies. Grass Forage Sci. 1979, 34, 11–17. [Google Scholar] [CrossRef]
  6. Yang, H.; Wang, L.; Xiang, L.; Wu, Q.; Jiang, H. Automatic Non-Destructive Growth Measuremen Leafy Vagetables Based on Kinect. Sensors 2018, 18, 806. [Google Scholar] [CrossRef]
  7. Salamí, E.; Barrado, C.; Pastor, E. UAV Fligtht Experiments Applied to the Remote Sensing of Vegetated Areas. Remote Sens. 2014, 6, 11051–11081. [Google Scholar] [CrossRef]
  8. López, J.J.; Mulero-Pázmány, M. Drones for Conservation in Protected Areas: Present and Future. Drones 2019, 3, 10. [Google Scholar] [CrossRef]
  9. Yu, N.; Li, L.; Schmitz, N.; Tian, L.F.; Greenberg, J.A.; Diers, B.W. Development of methods to improve soybean yield estimation and predict plant maturity with an unmanned aerial vehicle based platform. Remote Sens. Environ. 2016, 187, 91–101. [Google Scholar] [CrossRef]
  10. Liu, S.; Baret, F.; Andrieu, B.; Burger, P.; Hemmerlé, M. Estimation of Wheat Plant Density at Early Stages Using High Resolution Imagery. Front. Plant. Sci. 2017, 8, 739. [Google Scholar] [CrossRef] [Green Version]
  11. Bendig, J.; Bolten, A.; Bennertz, S.; Broscheit, J.; Eichfuss, S.; Bareth, G. Estimating Biomass of Barley Using Crop Surface Models (CSMs) Derived from UAV-Based RGB Imaging. Remote Sens. 2014, 6, 10395–10412. [Google Scholar] [CrossRef] [Green Version]
  12. Bendig, J.; Yu, K.; Aasen, H.; Bolten, A.; Bennertz, S.; Broscheit, J.; Gnyp, N.L.; Bareth, G. Combining UAV-based plant height from crop surface models, visible, and near infrared vegetation indices for biomass monitoring in barley. Int. J. Appl. Earth Obs. Geoinf. 2015, 39, 79–87. [Google Scholar] [CrossRef]
  13. Moeckel, T.; Dayananda, S.; Nidamanuri, R.R.; Nautiyal, S.; Hanumaiah, N.; Buerkert, A.; Wachendorf, M. Estimation of Vegetable Crop Parameter by Multi-temporal UAV-Borne Images. Remote Sens. 2018, 10, 805. [Google Scholar] [CrossRef]
  14. Hardin, P.J.; Jackson, M.W. An Unmanned Aerial Vehicle for Rangeland and Protography. Rangel. Ecol. Manag. 2005, 58, 439–442. [Google Scholar] [CrossRef]
  15. Wang, D.; Xin, X.; Shao, Q.; Brolly, M.; Zhu, Z.; Chen, J. Modeling Aboveground Biomass in Hulumber Grassland Ecosystem by Using Unmanned Aerial Vehicle Discrete Lidar. Sensors 2017, 17, 180. [Google Scholar] [CrossRef] [PubMed]
  16. Jin, Y.; Yang, X.; Qiu, J.; Li, J.; Gao, T.; Wu, Q.; Zhao, F.; Ma, H.; Yu, H.; Xu, B. Remote Sensing-Based Biomass Estimation and Its Spatio-Temporal Variations in Temperate Grassland, Northern China. Remote Sens. 2014, 6, 1496–1513. [Google Scholar] [CrossRef] [Green Version]
  17. Capolupo, A.; Kooistra, L.; Berendonk, C.; Boccia, L.; Suomalainen, J. Estimating Plant Traits of Grasslands from UAV-Acquired Hyperspectral Images: A Comparison of Statistical Approaches. Int. J. Geo Inf. 2015, 4, 2792–2820. [Google Scholar] [CrossRef]
  18. Lu, B.; He, Y. Species classification using Unmanned Aerial Vehicle (UAV)-acquired high spatial resolution imagery in a heterogeneous grassland. ISPRS J. Photogram. Remote Sens. 2017, 128, 73–85. [Google Scholar] [CrossRef]
  19. Brocks, S.; Bareth, G. Estimating Barley Biomass with Crop Surface Models. Remote Sens. 2018, 10, 268. [Google Scholar] [CrossRef]
  20. Castro, A.I.; Sánchez, J.T.; Peña, J.M.; Jiménez-Brenes, F.M.; Csillik, O.; López-Granados, F. An Automatic Random Forest-OBIA Algorithm for Early Weed Mapping between and within Crop Rows. Remote Sens. 2018, 10, 285. [Google Scholar] [CrossRef]
  21. Leitão, J.P.; Moy de Vitry, M.; Scheidegger, A.; Rieckermann, J. Assessing the quality of digital elevation models obtained from mini unmanned aerial vehicles for overland flow modelling in urban areas. Hydrol. Earth Syst. Sci. 2016, 20, 1637–1653. [Google Scholar] [CrossRef] [Green Version]
  22. Nesbit, P.R.; Hugenholtz, C.H. Enhancing UAV–SfM 3D Model Accuracy in High-Relief Landscapes by Incorporating Oblique Images. Remote Sens. 2019, 11, 239. [Google Scholar] [CrossRef]
  23. Malambo, L.; Popescu, S.C.; Murray, S.C.; Putman, E.; Pugh, N.A.; Horne, D.W.; Richardson, G.; Sheridan, R.; Rooney, W.L.; Avant, R. Multitemporal field-based plant height estimation using 3D point clouds generated from small unmanned aerial systems high-resolution imagery. Int. J. Appl. Earth Obs. Geoinf. 2018, 64, 31–42. [Google Scholar] [CrossRef]
  24. Strecha, C. Pix4D-Error Estimation. White Paper 2014, 1, 1–3. [Google Scholar]
  25. Remondino, F.; Nocerino, E.; Toschi, I.; Menna, F. A critical review of automated photogrammetric processing of large datasets. Int. Arch. Photogram. Remote Sens. Spat. Inf. Sci. 2017, 42, 591–599. [Google Scholar] [CrossRef]
  26. Ullman, S. The interpretation of structure from motion. Proc. R. Soc. Lond. B Biol. Sci. 1979, 203, 405–426. [Google Scholar] [PubMed]
  27. Seitz, S.M.; Curless, B.; Diebel, J.; Scharstein, D.; Szeliski, R. A Comparison and Evaluation of Multi-View Stereo Reconstruction Algorithms. In Proceedings of the 2006 IEEE Computer Society Conference on Computer Vision and Pattern Recognition (CVPR’06), New York, NY, USA, 17–22 June 2006; pp. 519–528. [Google Scholar] [CrossRef]
  28. Micheletti, N.; Chandler, J.H.; Lane, S.N. Structure from motion (SFM) photogrammetry. In Geomorphological Techniques (Online Edition); Clarke, L.E., Nield, J.M., Eds.; British Society for Geomorphology: London, UK, 2015. [Google Scholar]
  29. Lowe, D.G. Object recognition from local scale-invariant features. In Proceedings of the International Conference on Computer Vision, Corfu, Greece, 20–27 September 1999; Volume 2, pp. 1150–1157. [Google Scholar]
  30. Martínez-carricondo, P.; Agüera-vega, F.; Carvajal-ramírez, F.; Mesas-carrascosa, F.; García-ferrer, A.; Pérez-porras, F. Assessment of UAV-photogrammetric mapping accuracy based on variation of ground control points. Int. J. Appl. Earth Obs. Geoinf. 2018, 72, 1–10. [Google Scholar] [CrossRef]
  31. Florinsk, I.V. Computation of the third-order partial derivatives from a digital elevation model. Int. J. Geogr. Inf. Sci. 2009, 23, 213–231. [Google Scholar] [CrossRef]
  32. Geipel, J.; Link, J.; Claupein, W. Combined spectral and spatial modeling of corn yield based on aerial images and crop surface models acquired with an unmanned aircraft system. Remote Sens. 2014, 6, 10335–10355. [Google Scholar] [CrossRef]
  33. Terra Lopes, M.L.; Carvalho, P.C.F.; Anghinoni, I.; Santos, D.T.; Aguinaga, A.A.Q.; Flores, J.P.C.; Moraes, A. Sistema de integração lavoura-pecuária: Efeito do manejo da altura em pastagem de aveia preta e azevém anual sobre o rendimento da cultura da soja o da altura em pastagem de aveia preta e azevém anual. Ciência Rural 2009, 39, 1499–1506. [Google Scholar] [CrossRef]
  34. Casagrande, D.R.; Ruggieri, A.C.; Jamusckiewicz, E.R.; Gomide, J.A.; Reis, R.A.; Valente, A.L.S. Características morfogênicas e estruturais do capim-maramdu manejado sob pastejo intermitente com diferentes ofertas de forragem. Revista Brasileira de Zootecnia 2010, 39, 2108–2115. [Google Scholar] [CrossRef]
  35. Ehlert, D.; Adamek, R.; Horn, H. Laser rangefinder-based measuring of crop biomass under field conditions. Prec. Agric. 2009, 10, 395–408. [Google Scholar] [CrossRef]
  36. Zhang, L.; Grift, T.E. A LIDAR-based crop height measurement system for Miscanthus giganteus. Comput. Electron. Agric. 2012, 85, 70–76. [Google Scholar] [CrossRef]
  37. Maranhão, C.M.A.; Bonomo, P.; Pires, A.J.V.; Costa, A.C.P.R.; Martins, G.C.F.; Cardoso, E.O. Características produtivas do capim-braquiária submetido a intervalos de cortes e adubação nitrogenada durante três estações. Acta Sci. Anim. Sci. 2010, 32, 375–384. [Google Scholar] [CrossRef]
  38. Ansah, T.; Osafo, E.L.K.; Hansen, H.H. Herbage yield and chemical composition of four varieties of Napier (Pennisetum purpureum) grass harvested at three different days after planting. Agric. Biol. J. N. Am. 2010, 5, 923–929. [Google Scholar] [CrossRef]
  39. Oliveira, M.A.; Pereira, O.G.; Garcia, R.; Obeid, J.A.; Cecon, P.R.; Moraes, S.A.; Silveira, P.R. Rendimento e Valor Nutritivo do Capim-Tifton 85 (Cynodon spp.) em Diferentes Idades de Rebrota. Revista Brasileira de Zootecnia 2000, 29, 1949–1960. [Google Scholar]
  40. Costa, N.L.; Paulinoi, V.T.; Townsendi, C.R.; Magalhães, J.A.; Oliveira, J.R.C. Desempenho agronômico de genótipos de Brachiaria brizantha em diferentes idades de corte em Porto Velho, Rondônia, Brasil (Agronomic performance of Brachiaria Brizantha genotypes in Porto Velho, Rondônia, Brazil). Revista Electrónica de Veterinária 2007, 8, 1–5. [Google Scholar]
  41. Rodrigues, M.M.; Oliveira, M.E.; Moura, R.L.; Rufino, M.O.A.; Silva, W.K.A.; Nascimento, M.P.S.C.B. Forage intake and behavior of goats on Tanzania-grass pasture at two regrowth ages. Acta Scientiarum. Anim. Sci. 2013, 35, 37–41. [Google Scholar] [CrossRef]
  42. Geleti, D.; Tolera, A. Effect of age of regrowth on yield and herbage quality of Panicum coloratum under sub humid climatic conditions of Ethiopia. Afr. J. Agric. 2013, 8, 5841–5844. [Google Scholar] [CrossRef]
Figure 1. Localization of Fazenda Escola (study area) and experimental plots.
Remotesensing 11 02447 g001
Figure 2. Distribution of digital terrain model (DTM) points and ground control points (GCPs), both collected with real-time kinematics (RTK).
Remotesensing 11 02447 g002
Figure 3. Generated models of the study area. (a) Digital surface model (DSM); (b) DTM generated using a Global Navigation Satellite System (GNSS) RTK receiver; and (c) elevation profile.
Remotesensing 11 02447 g003
Figure 4. Relationship between the height estimated by the UAV and that measured with the ruler.
Remotesensing 11 02447 g004
Figure 5. Relationship between biomass and height measured with the ruler.
Remotesensing 11 02447 g005
Figure 6. Relationship between the height estimated by the UAV and herbage mass.
Remotesensing 11 02447 g006
Figure 7. Height measured by the ruler and by the UAV at different harvest intervals.
Remotesensing 11 02447 g007
Figure 8. Biomass estimated by the ruler and by the UAV at different harvest intervals.
Remotesensing 11 02447 g008
Table 1. Chemical characteristics of soil samples from the experimental area.
pH (CaCl2)pH (H2O)PKCaMgCa + MgAlH + AlCECMO
g dm−3
V (%)
cmol dm−3
5.315.910.040.207.351.208.550.005.1813.9335.3462.81
Table 2. Days in which field measurements and unmanned aerial vehicle (UAV) flights were carried out.
Harvest Intervals
21 Days35 Days 49 Days 63 Days
1st cut30/10/1713/11/1729/11/1712/12/17
2nd cut17/11/1717/12/1715/01/1809/02/18
3rd cut12/12/1722/01/1805/03/18-
4th cut01/01/1826/02/18--
5th cut22/01/1802/04/18--
6th cut09/02/18---
7th cut05/03/18---
Table 3. The leave-one-out method applied to assess the structure-from-motion (SfM) accuracy.
Check Point (Id)Error X (m)Error Y (m)Error Z (m)
1−0.0265−0.0300−0.0363
20.00660.02290.0312
3−0.0336−0.0041−0.0445
40.01510.0038−0.0386
50.01920.00390.0565
Mean−0.0038−0.0007−0.0063
Sigma0.02100.01310.0402
RMSE0.02220.01720.0423

