1. Introduction
A study of transient UV atmospheric emission has been performed with a new space instrument TUS (Tracking Ultraviolet Setup), an imaging detector equipped with a large-area mirror-concentrator (≈2 m) and 256 photo multipliers in the mirror focal plane. The detector was accommodated on board the Lomonosov satellite (an international designation MVL 300, or 2016-026A). It was launched on 28 April 2016, on a polar sun-synchronous orbit with an inclination of 97.3, a period of ∼94 min, and a height around 500 km. An instantaneous field of view of the instrument at the ground level was ∼80 km × 80 km. TUS operated in orbit till December 2017.
The main goal of the TUS detector was a search for ultra-high-energy cosmic ray (UHECR) particles with energies above 50 EeV, a limit set by the Greizen–Zatsepin–Kuzmin (GZK) effect, see the earlier papers on the project [
1,
2,
3,
4]. An UHECR primary particle initiates a cascade of nuclear interactions in the atmosphere called an extensive air shower (EAS). An EAS can be detected as a track in the atmosphere with its ultraviolet (UV) radiation in the near-visible wavelength band of 300–400 nm. The TUS electronic trigger was designed to select UHECR transient tracks [
5] and the first candidates for UHECR events were found and analyzed [
6,
7].
The TUS experiment marks an important step in the development of the technique of detecting of UHECR EAS UV radiation which will be employed in the forthcoming much more advanced multi-purpose instruments like KLYPVE [
8] and JEM-EUSO [
9].
Together with this main task, the TUS detector was able to select and register other UV transient events in the atmosphere, which are the subject of the present paper. TUS had several modes of operation with different temporal resolutions, which allowed measuring events in wide time scales: from an EAS with a duration of a hundred microseconds and the time resolution of 0.8 s up to the duration of 1.7 s and the time resolution of 6.6 ms for meteors and transient events. In earlier experiments, data on transient events were taken with video cameras of aperture of ∼1–10 cm. The TUS instrument was able to detect signals orders of magnitude less bright due to the large optical aperture.
In previous experiments with video cameras having temporal resolution of about 10–100 milliseconds, so called transient luminous events (TLEs), with a high luminosity were observed with visual light, see data from the ISUAL instrument [
10]. The origin of the majority of TLEs was proved to be related to a thunderstorm activity and parent lightning discharges.
Interesting results on TLEs were obtained by near-UV detectors in the series of MSU satellites with non-imaging techniques Universitetsky-Tatiana [
11], Universitetsky-Tatiana-2 [
12,
13] and Vernov [
14] satellites. Sensitivity of UV detectors was much higher than of video cameras and UV transients of much lower luminosity were measured. These detectors are a single pixel detectors (Hamamatsu R1463 photomultiplier tubes (PMTs) were used as a UV sensor) and do not have spatial resolution. The effective area of the PMT cathode, which is open for detecting of photons, is 0.4 cm
. Overall field of view (FOV) of the detectors is ∼
which corresponds to the radius of circle on the Earth’s surface ∼150 km. Therefore, the main information on measured events was recorded in a form of temporal profiles of intensity of UV radiation at wavelengths 300–400 nm. Thus it was difficult to classify correctly the types of atmospheric events. Detectors measured events in a wide range of luminosity which contain ordinary lightning discharges, upper atmospheric TLEs, intra cloud luminous processes like initial breakdowns and intra cloud discharges, unusual far-from-thunderstorm UV flashes [
15]. It was found out that faint and short TLEs have a “harder” distribution on photon number and less correlation between position of TLE and position of lightning (thunderstorm). A series of flashes not above clouds and far from thunderstorms were found [
13].
The TUS detector provided additional information on the types, temporal and spatial structure of TLEs and other atmospheric phenomena in a wide range of duration, see below.
2. Materials and Methods
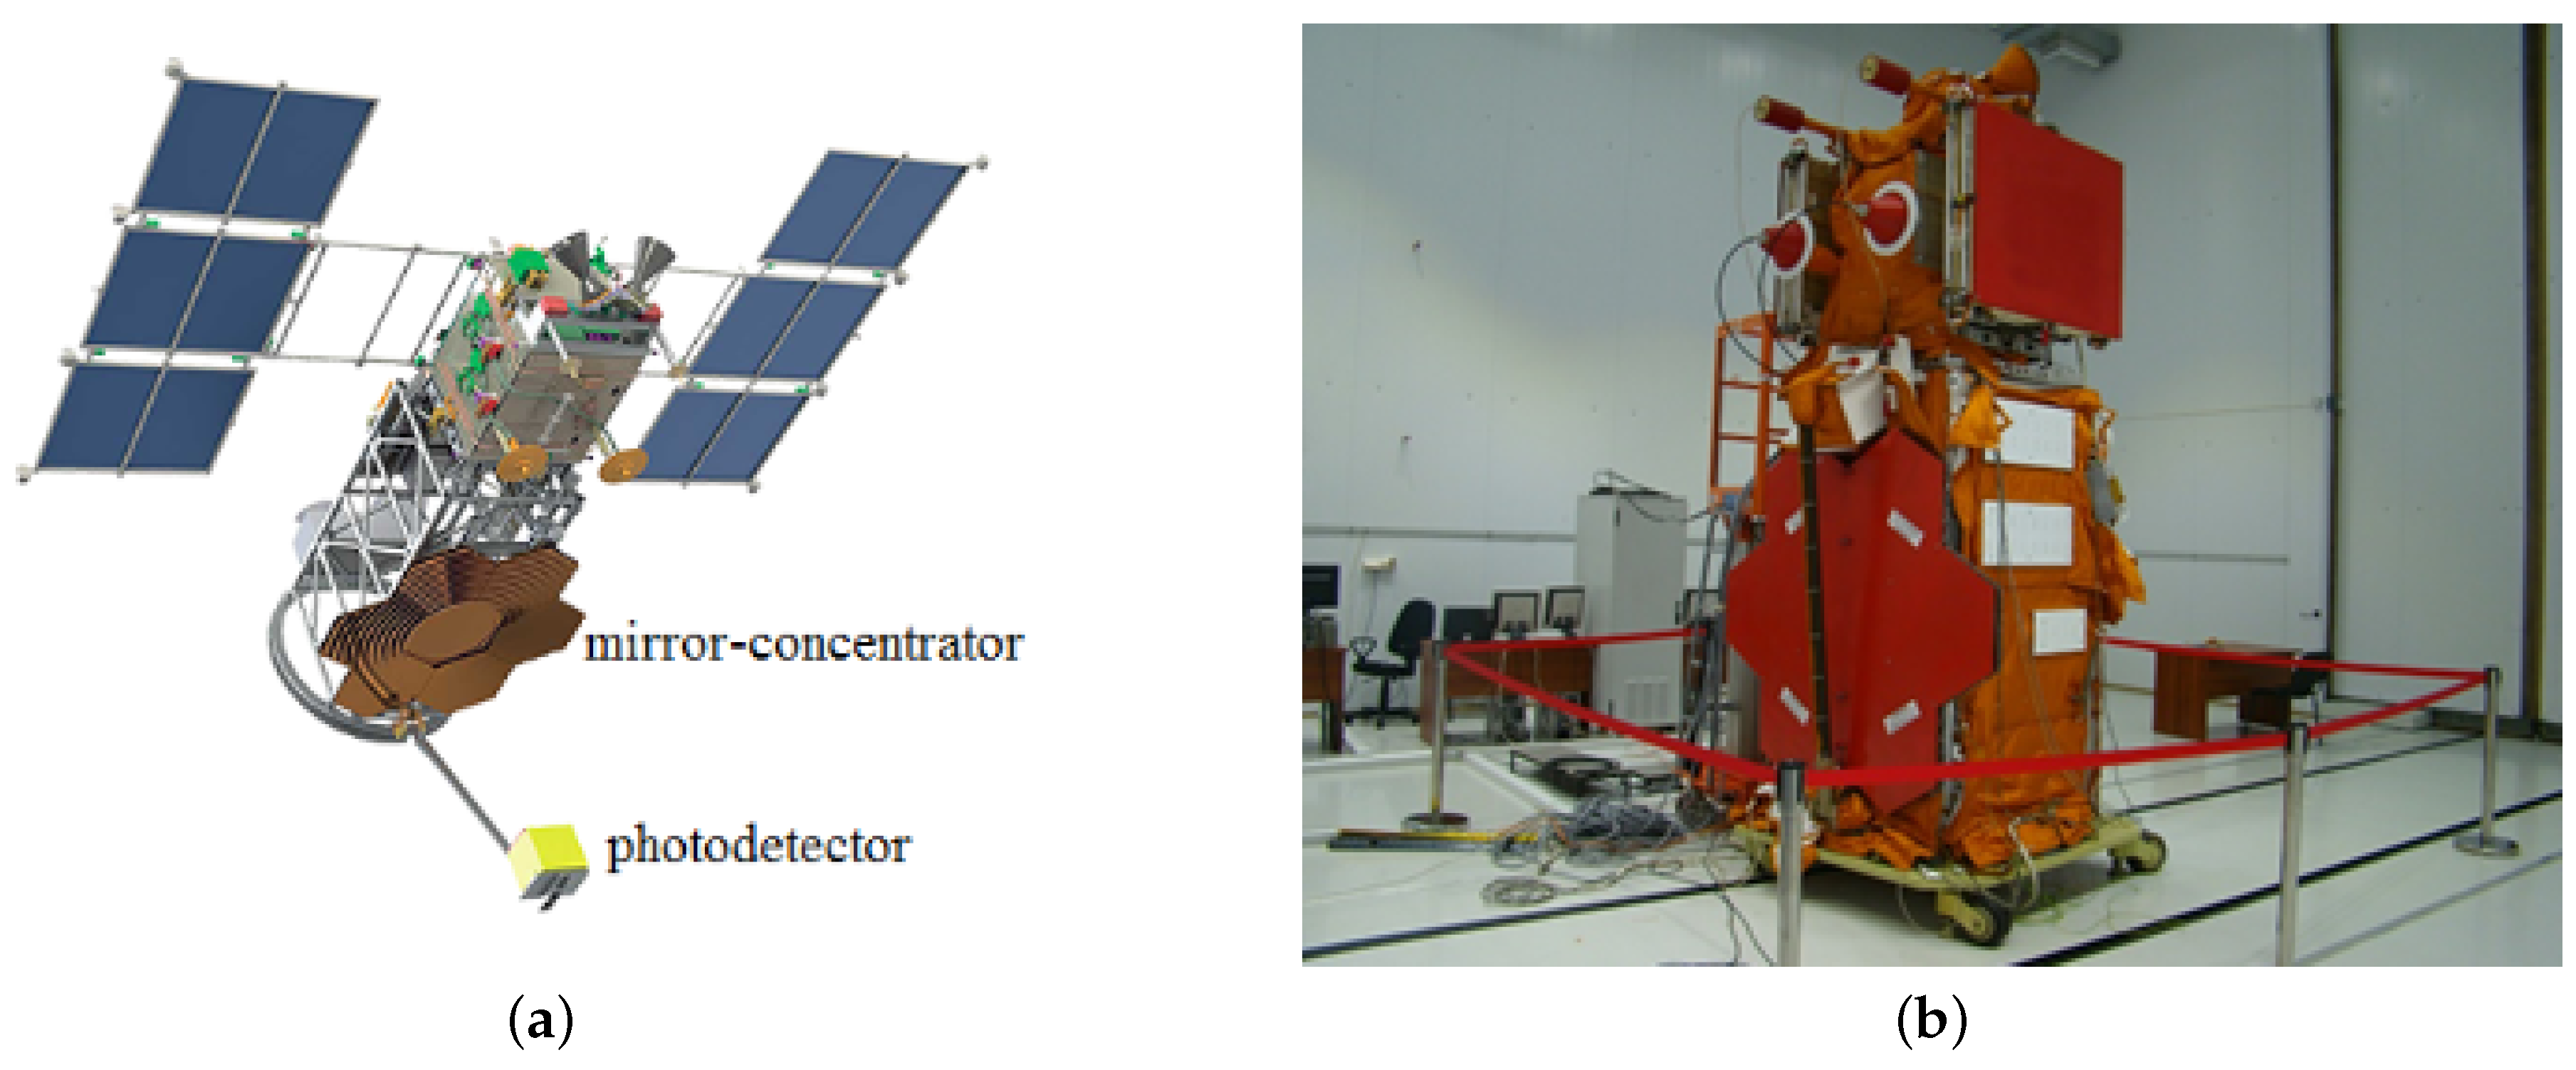
The TUS detector is shown in
Figure 1. It consists of two main parts: a parabolic mirror-concentrator of the Fresnel type with area of about 2 m
with a focal distance of 1.5 m and a square-shaped 256-pixel photodetector in the focal plane of the mirror.
Pixels of the TUS photodetector are PMTs Hamamatsu R1463 with a multialkali cathode of the 13 mm diameter. The pixel wavelength band is limited by a UV filter cutting the band at upper wavelength of 400 nm and by low PMT quantum efficiency at wavelengths lower than 300 nm (%). An average quantum efficiency in the UV band (300–400 nm) is 20%. It should be also mentioned that at wavelengths less than 315 nm radiation generated below 60 km will not be measured by a space-based detector due to absorption by the ozone layer.
Light guides with a square entrance aperture (
) and a circular output were attached to each PMT to fill the detector’s FOV uniformly. A UV filter of 13 mm in diameter and 2.5 mm thickness was placed in front of each PMT. The pixels were grouped in 16 identical photodetector modules. Each module had its own digital data processing system based on a Xilinx field-programmable gate array (FPGA) for the first-level trigger, and a high voltage power supply, controlled by the FPGA. The central processor board was employed to collect information from all modules, to control their operation, and to implement the second-level trigger. The field of view of one pixel equals 10 mrad, which results in space resolution ∼5 km at the ground level. It was found that the focusing part of the mirror area is accompanied by a diffuse mirror scattering part with its fraction ∼40% of the total mirror area. This diffuse scattering part is important in observation of events near the FOV of the focusing part of the optical system (see
Section 4 below).
The UV intensity of the atmospheric background glow was measured by Tatiana satellites for various regions of the Earth and various phases of the Moon [
13,
16,
17] and was taken into account in the TUS experiment preparation.
It was a-priori known (and confirmed by the Tatiana experiments) that the Moon UV light scattered in the atmosphere will be the main source of background illumination during the TUS operation at the night side of the Earth. An important result of the observation was a higher intensity of the Moon UV light in presence of clouds in the instrument FOV, roughly twice larger than from the cloudless atmosphere. At moonless nights, the background intensity is constant at scales of thousands kilometers above oceans and increases at some specific regions like aurora regions and urban areas. This feature and a low UV noise at moonless nights make operation of TUS much safer at moonless nights and outside of the mentioned regions.
The TUS electronics can operate in four modes intended for detecting various transient phenomena in the atmosphere at different time scales with different time sampling. In the EAS mode, TUS is aimed to select and register events produced by extreme-energy cosmic rays and has a time sampling of 0.8
s [
18]. This mode is also efficient in measurements of the shortest and the most common types of TLEs—elves [
19,
20]. Two other trigger modes have a time sampling of 25.6
s and 0.4 ms (TLE-1 and TLE-2 modes). They were introduced for studying TLEs slower than elves: sprites, blue jets, gigantic jets, etc. The fourth, a so-called “meteor mode” has the time sampling of 6.6 ms for detecting micro-meteors, space debris and thunderstorm activity at a longer time scale (up to ∼1.7 s).
To measure the signal, a 10-bit ADC code is used, which polls each PMT every 0.8 s. Therefore, the measurement range in the EAS mode is from 0 to 1023 ADC codes, which corresponds to signal amplitude from 0 to 2 V. In other modes, a digital integration of the signal is used (a sum of ADC codes is calculated during the time sample of the mode) followed by averaging not to exceed the 15-bit value of the number. Thus, the maximum ADC code in the TLE-1, TLE-2 and meteor modes equals 32767.
The TUS exposure for various modes of triggering was different. It is shown in
Table 1. The number of events measured only during the night side of orbits is presented. The time of operation is approximate. Most of the time was dedicated to the EAS mode to achieve maximum exposure for UHECR measurements. Only a few faint flashes were registered during three days of operation in the TLE-1 mode, and this mode was not used anymore. The meteor mode was found to be useful for a relative calibration of pixels and for this reason it was used for longer time compared to TLE-1 and TLE-2. The majority (∼80%) of events registered by TUS have noise-like wave forms with ADC counts of all pixel PMTs fluctuating around some average values, which are close to each other after rescaling according to the individual PMT gains. The trigger is caused by random fluctuations of the background.
A number of events (∼2000) represents very short and powerful pulses that occurred simultaneously in several neighboring channels of the photodetector (instant track-like flashes). It was shown that this is an effect of recording of low-energy (from a few hundred MeV to several GeV) cosmic particles that produce an optical signal in the glass parts of the detector (the light filters and input windows of the PMTs) [
21]. The latitudinal distribution of these events shows an increase in the number of events with latitude. These events represented 14% of events measured during first months of TUS operation and were excluded from the latest data due to on-boards software modification.
Many events related to thunderstorm activity were measured in all modes. In the EAS mode they represent a so-called monotonous flashes—monotonously increasing in comparatively slow rise time (100
s). These events account for 4% of the total. Among them, a special class of events was selected due to their peculiar spatio-temporal development: elves. Number of these events is only 25 in the whole TUS database. The variety of these events are discussed in
Section 4.1 and
Section 4.2Finally, a dozen of unusual bright UV flashes far from thunderstorm regions were found. Usually they occur above oceans and have a peculiar temporal structure: sharp powerful peak with slower afterglow with movement over the TUS FOV. Examples of these events are described in
Section 4.3.
3. Phenomenology of Transient Luminous Events and Transient Atmospheric Events According to Previous Measurements
The first observation of TLE in the upper atmosphere was done in 1990 [
22] and numerous experiments have been performed since then with the help of various instruments based at the ground, mountains, airplanes, and satellites, see the reviews [
10,
23,
24,
25,
26]. According to [
27], there are at least six types of upper atmospheric phenomena: elves, sprites, halos, blue gets, blue starters, and gigantic jets. An elve is a ring expanding across the lower ionosphere (altitudes of about 80–100 km) in less than one millisecond and reaching the horizontal size of 200–300 km. A sprite appears at 60–90 km altitude and has a complex spatial structure with tens of kilometers downward. Usually, sprites occur simultaneously with a halo, a brief diffusive glow above the sprite. Blue jets and blue starters are the lowest transients propagating upward from the cloud tops and having a vertical extent of 10–20 km. Gigantic jets are the rarest phenomena, which propagate all the way from clouds to the ionosphere.
It was discovered by shooting TLEs with cameras in the visible light range that in most cases an event in the upper atmosphere is accompanied by a lightning strike below it. Elves were explained as a lightning electromagnetic pulse (EMP) crossing the D-layer of the ionosphere [
28]. Sprites were also observed by cameras. One of the most informative pictures was obtained by a high-speed camera (the frame period of 0.2 ms) by [
29]. It showed a sprite starting to radiate high in the atmosphere at about the D-layer of the ionosphere. An EMP of a lightning strike accelerates free electrons existing in the ionosphere. In this first stage, the TLE glow develops upward similar to the EMP. At the next stage, an electric field in the upper atmosphere between the ground and the ionosphere plays a significant role. This field is a result of a lightning cloud-ground strike canceling the electric field between the ground and clouds changing it to a field between the ground and the ionosphere. The new field is longer in time (tens of milliseconds), it exists until the neighbor-clouds electricity restores the general electric field in the thunderstorm. A slower discharge is being developed downward, below the ionosphere. In some extreme cases, a sprite becomes a gigantic transient like the one-shot by [
30]. In their work not only very bright TLE was proved to exist but also the ability of one lightning to generate several TLEs was demonstrated.
Observation of TLEs by video cameras gathered a basic knowledge about the development of transients, which helps to interpret data obtained with simpler detectors like the Detector of UV radiation (DUV) on board of the MSU micro-satellites [
31]. Data from DUV are temporal profiles (waveforms) of a UV signal from transients obtained by a photomultiplier with the field of view of
in the nadir direction. DUV waveforms measured onboard the MSU satellites were interpreted in terms of TLE characteristics observed by cameras. Short pulses (less than 1 ms) were considered as elves and longer pulses (tens milliseconds) were assumed to be sprites. Distribution of all registered events in the Earth map demonstrated a strong correlation with the lightning map: most of the events were registered above continents in equatorial regions of the Earth [
13,
15]. Data on the ratio of measured TLE photon intensity in UV and red-IR bands obtained in Tatiana-2 and Vernov experiments [
12,
13,
17,
32] witness in favor of the transient origin of registered events, not lightning strikes.
For triggering DUV by TLE, the signal amplitudes in time bins (1 ms in Tatiana-2 experiment and 0.5 ms in the Vernov experiment) were analyzed. A simple threshold trigger for TLEs was implemented in these detectors: the maximum of the signal value in a time sample during should exceed a pre-defined threshold. In both experiments, the sum of the signal in a waveform of 128 ms was a measure of the transient number of photons. The photon number radiated in the atmosphere
was calculated from the signal sum taking into account the quantum efficiency of the PMT and the distance to the atmosphere assuming isotropic radiation of TLE [
13,
15,
32]. The observed distribution of short transients (
ms) with respect to
was found harder (the power-law differential exponent
for
) compared to the distribution of longer transients (the exponent
for
). It was also shown that weaker TLE are not so much concentrated to equatorial latitudes above continents as lightning strikes and brighter TLE.
Unexpectedly, long series of TLEs (up to several minutes of continuous measurements along the satellite trajectory, i.e., in thousands of kilometers) were registered in large thunderstorm regions. The average rate of lightning strikes for thunderstorm regions available from the LIS data [
33] is much lower than the observed one. Assuming the lightning origin of TLE one needs to explain the series of TLEs as physically meaningful fluctuations of the lightning strike rate in a specific thunderstorm area. This interpretation has an experimental problem: many transients in the series were observed over cloudless areas. A similar contradiction was observed in a more general analysis of the correlation between lightning strikes, clouds, and TLEs: equal numbers of TLEs in cloudy and cloudless areas of the atmosphere were observed [
13,
17] while lightning strikes strongly correlate with clouds.
Another interesting observation was detecting transient UV events far from the location of lightning strikes detected by the worldwide lightning location network (WWLLN) and Vaisala Global Lightning Dataset (Vaisala GLD360) [
34].
It is important to note that observations from space allow one to observe various types of events ranging from a slow atmospheric glow including aurora lights to very fast flashes in thunderstorm regions. This gives a unique opportunity to study global conditions of UV radiation of the Earth over the whole globe.
4. Results and Discussion
It is clear from the previous sections that TUS had additional possibilities for registering TLEs compared to the earlier experiments. In particular, TUS was able to measure elves in its fastest mode of operation. Elves manifest themselves as a bright arc moving across the focal plane, which allows one to easily distinguish them from air showers that should form linear tracks. Studying of elves with TUS is especially interesting since these TLEs have never been studied with an imaging orbital detector with a microsecond-scale time resolution in the nadir direction.
TLEs of other types, as well as aurora lights and meteors, were observed by TUS in its slower modes. A number of unusual bright events with a sharp rise of the signal front were also recorded. Some of those events occurred far from thunderstorms and do not have an appropriate explanation yet. Below, the phenomenology of various types of events measured by the TUS detector during ∼1 year of its operation in space is presented.
4.1. EAS Operation Mode Elve Measurements
Elves are the most frequent type of TLEs with a global rate near 50 events per minute [
35]. Having exposure of 800 h in the EAS mode and FOV of 6400 km
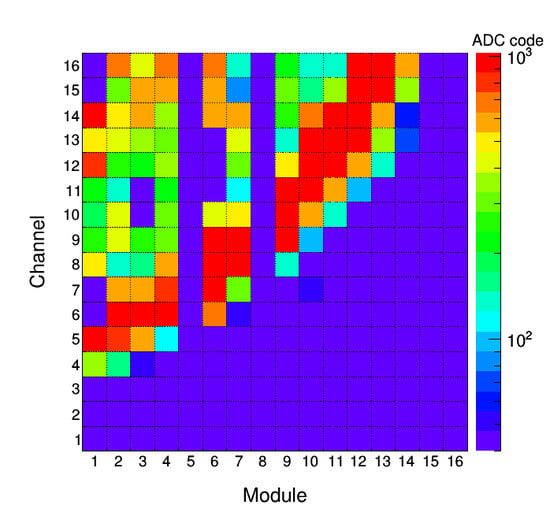
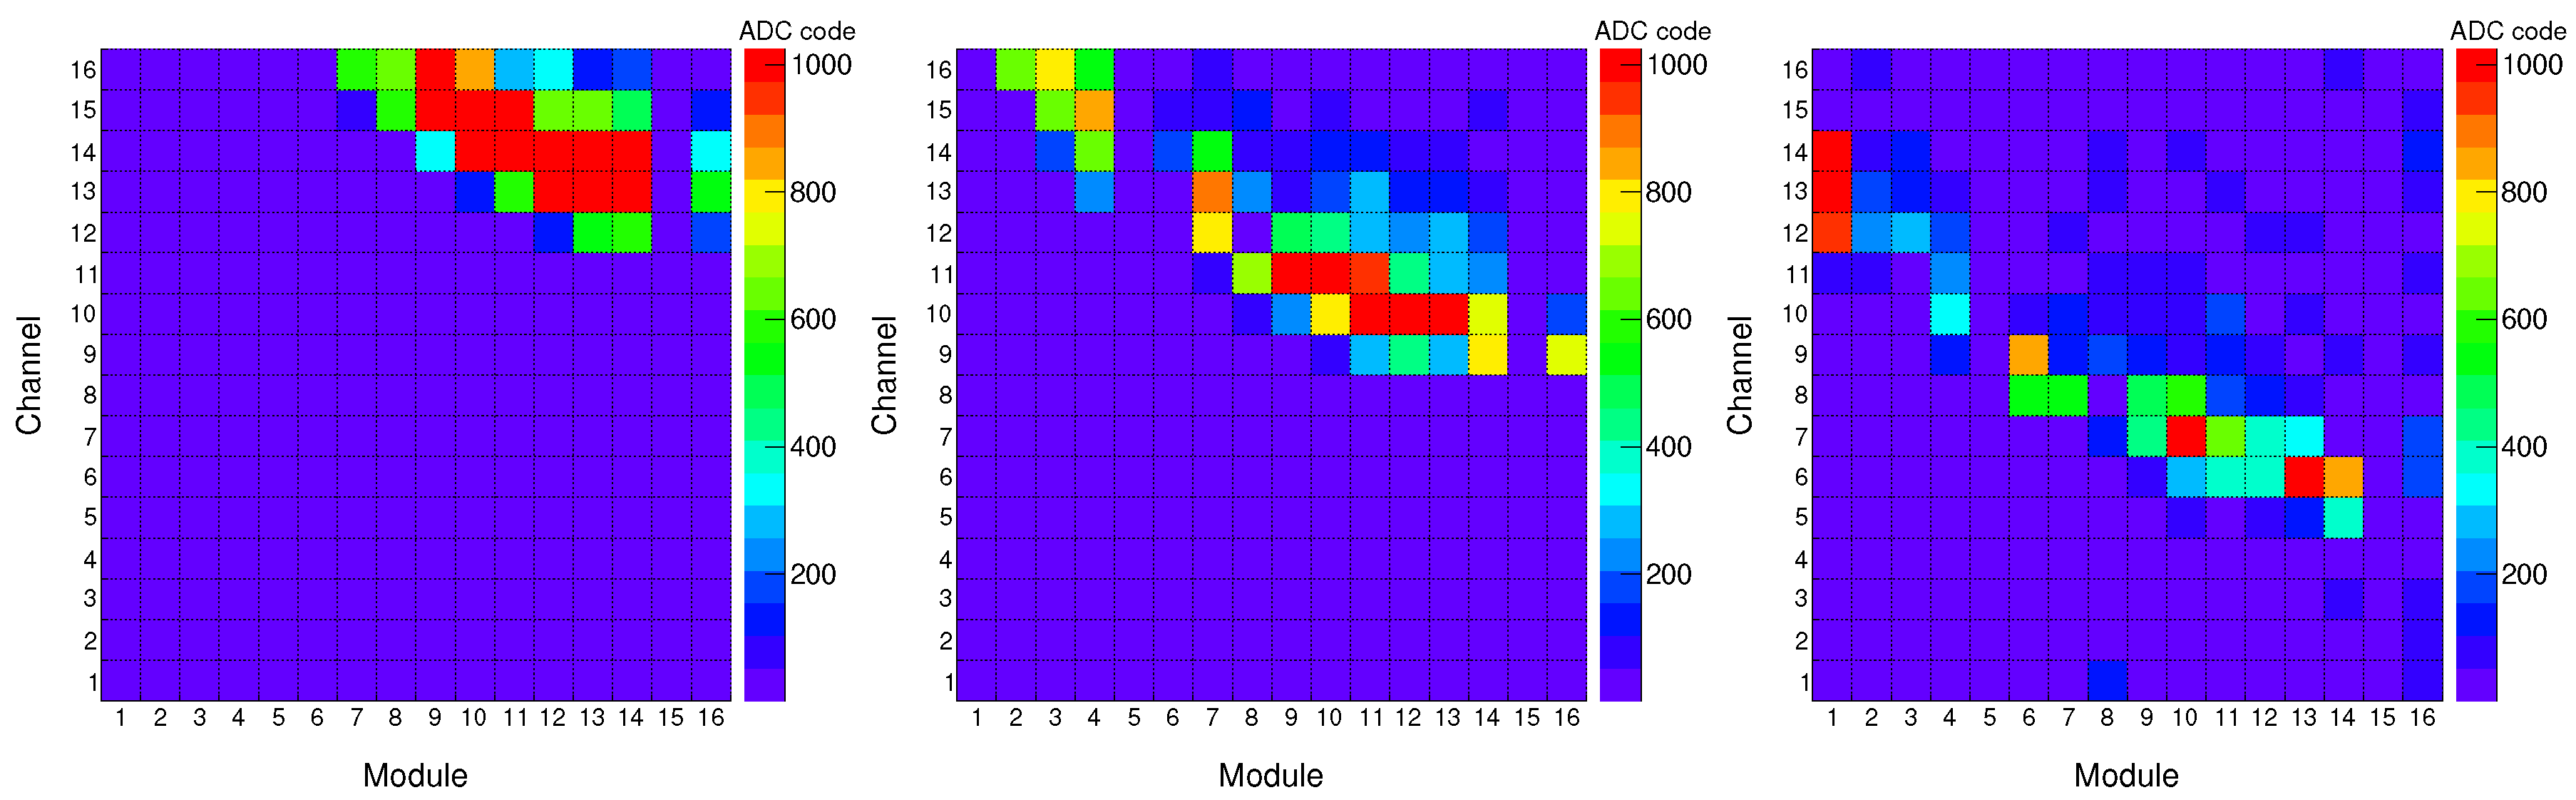
it is expected to observe about three dozen of such events by the TUS detector. Twenty-five elves have been found in the TUS data. Snapshots of the TUS focal plane with an elve registered on 23 August 2017 above the Pacific ocean (
N,
W) are presented in
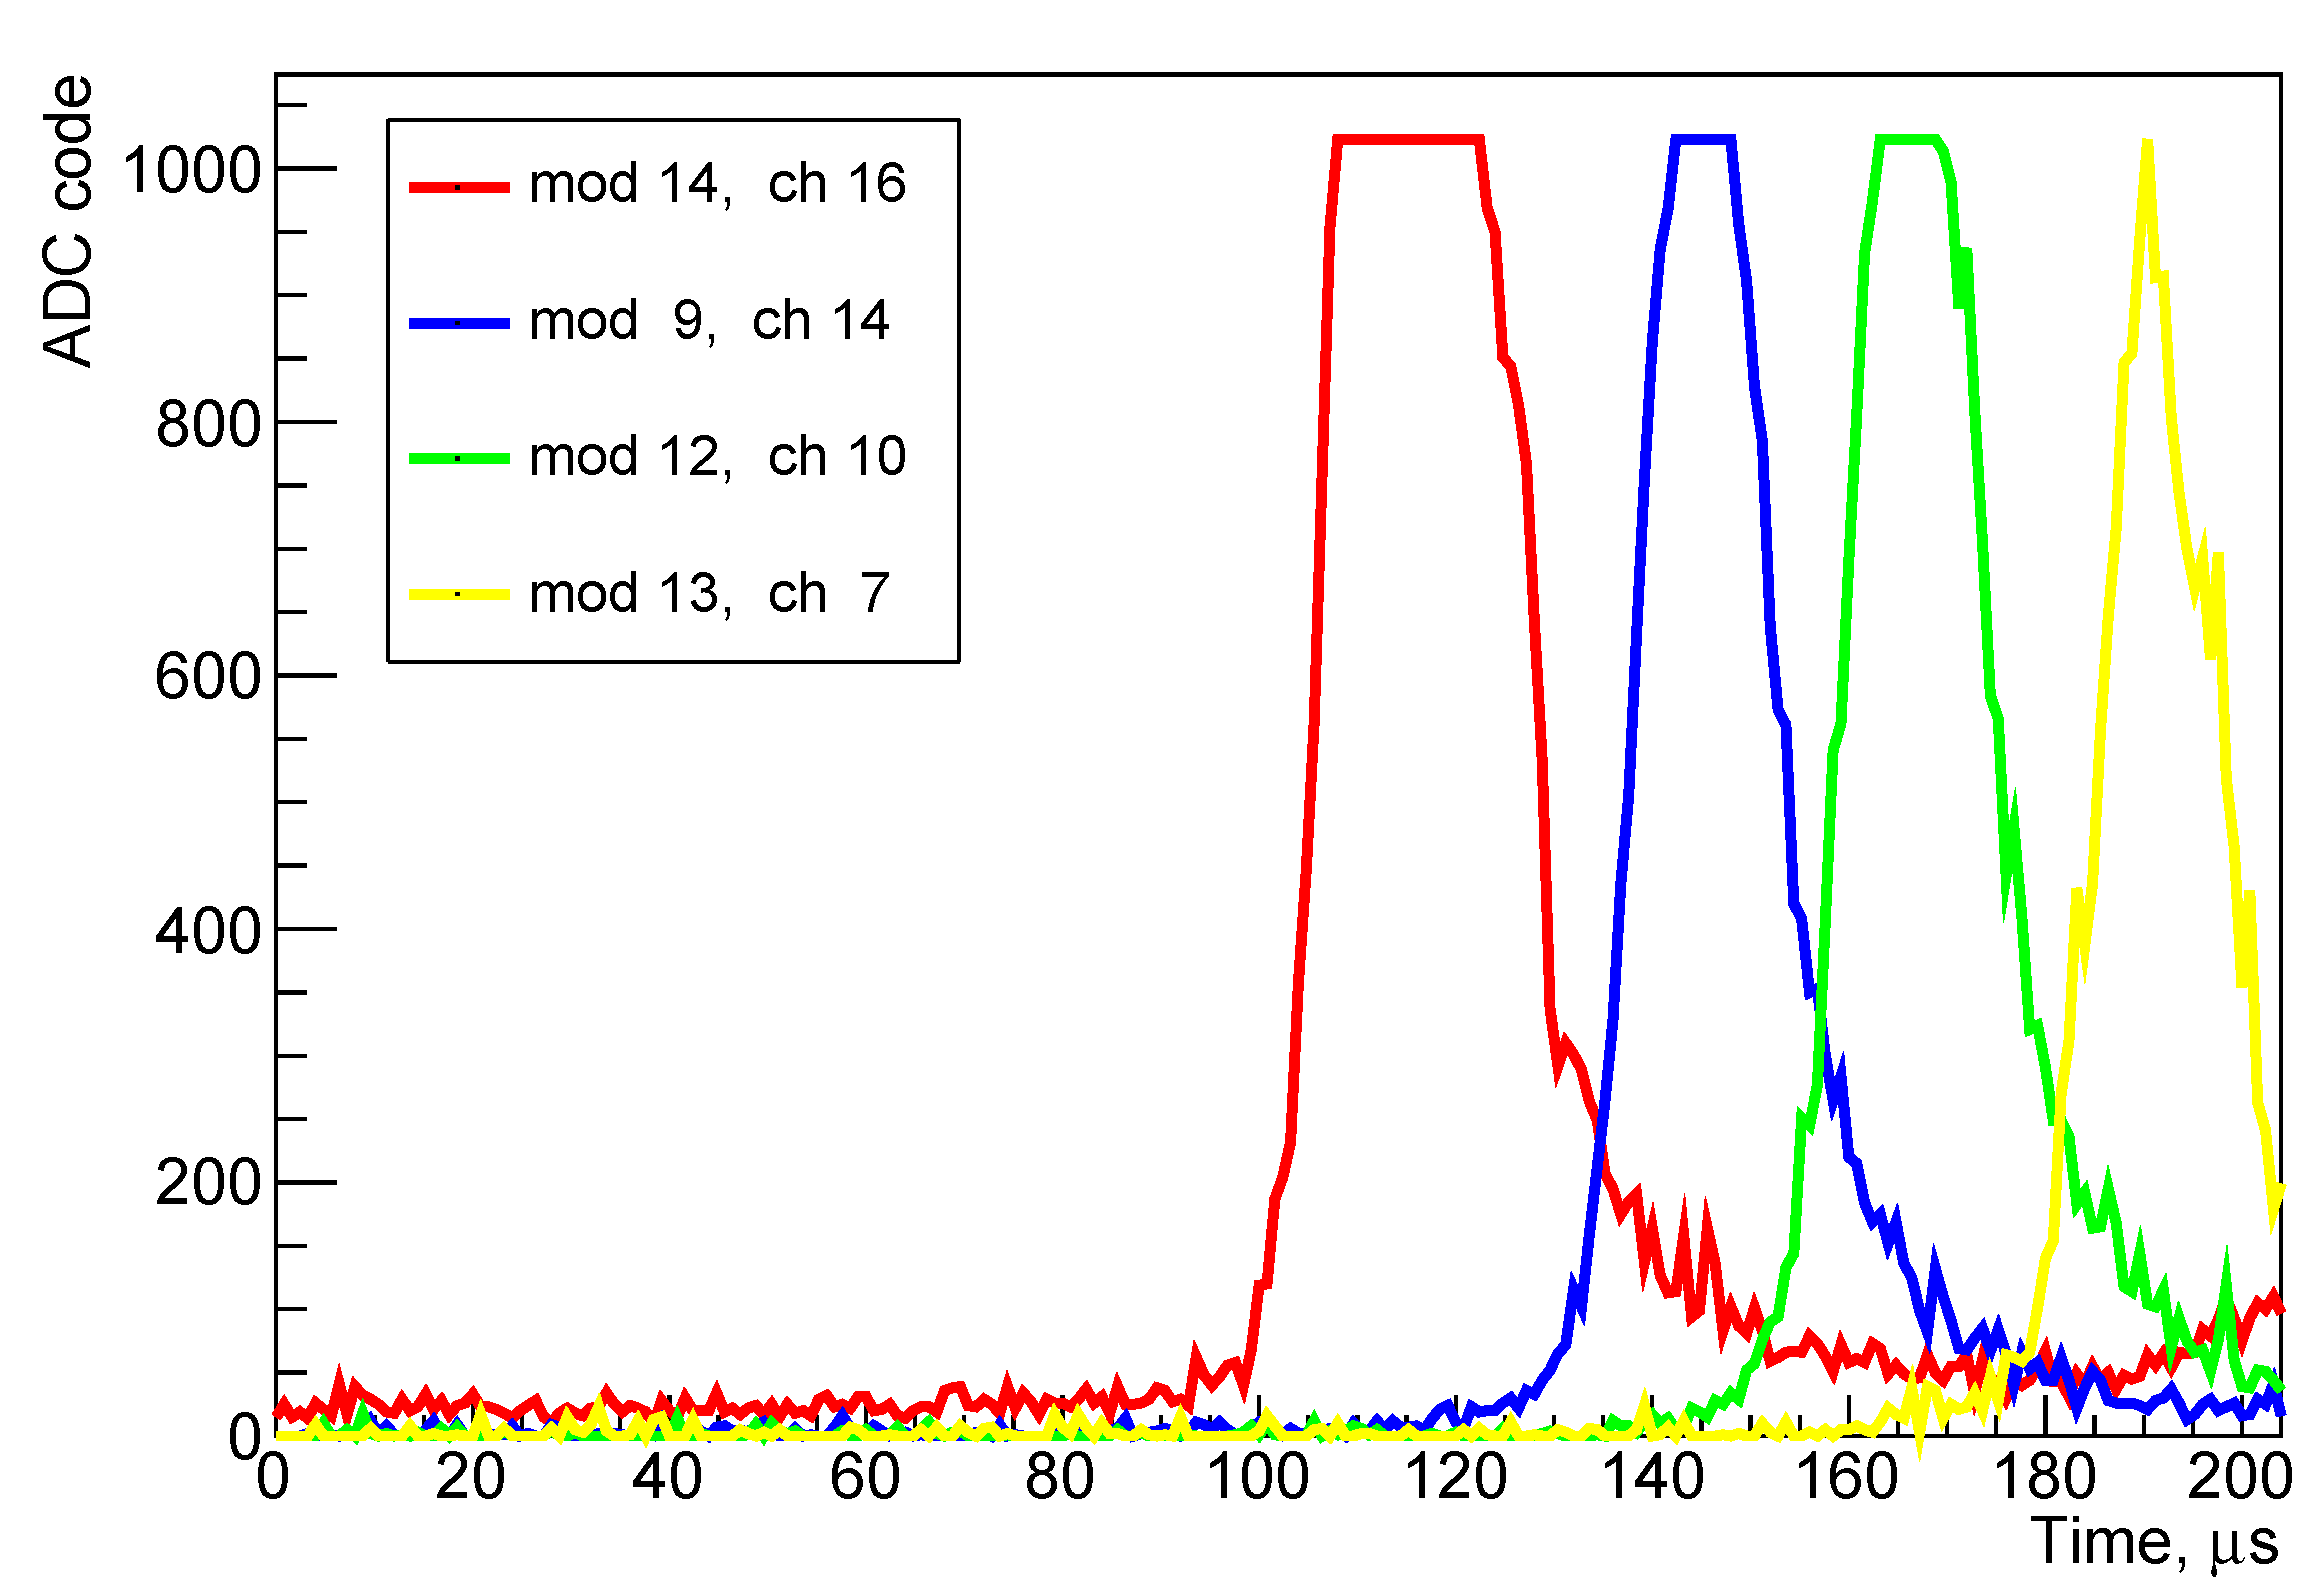
Figure 2. An arc-like shape of the UV source image made by groups of pixels and the high speed of its movement within the FOV made a picture of the elve. Waveforms of several pixels of the event are shown in
Figure 3.
In all figures of this work signals are presented in ADC codes. The correct calibration of the detector was lost during the first day of operation, because of the failure of the high voltage control algorithm. Due to this failure, a number of pixels were burned and others had changed their gains. To estimate the number of photons on the entrance of photodetector which corresponds to ADC code one needs to use the approximate formulae: . We assume an average PMT gain G of and the PMT photocathode quantum efficiency p of 0.2. V is the anode voltage-to-ADC code coefficient, is the fundamental charge, kOhm is the anode resistance, is the time sample, 0.8 s. This expression can be simplified as for the EAS mode. On-flight calibration of the detector is ongoing and will be reported elsewhere as well as the accurate calculation of the UV intensities of various events.
Flat parts on the waveforms correspond to the ADC saturation at 1023 in the EAS mode. We compared data for the event with Vaisala Global Lightning Dataset GLD360 [
36]. Two lightning strikes of opposite polarity were found ∼115 km away from the TUS event. A direction to those lightning discharges coincides with the direction evaluated from the elve arc. The lightning currents are rather low:
kA. It was shown in [
37] that lightning discharges with the current more than 57 kA always produce elves while the probability is ∼50% for currents near
kA.
To compare with other experiments, we evaluated the luminosity of this elve. An estimation of the total number of photons was done by the overall signal of all hit pixels during the record. The sum of all ADC codes with the mean background level subtracted gives ∼
. The number corresponds to ∼
photons on the photodetector surface during the event. Taking into account the satellite orbit altitude (≈500 km), the area of the mirror, and assuming the isotropic radiation in the source, we obtain the number of photons emitted in the atmosphere:
. In this calculation we did not take into account the atmosphere absorption and scattering assuming that elve develops at altitude of 80–90 km in the atmosphere and transparency of the residual atmosphere is close to 1 even in a UV wavelength. It is ∼4 orders of magnitude less in brightness than measured in previous elve imaging experiments [
10]. The large aperture of the TUS optical system allows us to measure faint emission of transient atmospheric events like elves produced by lightning discharges with low peak current. These events were not observed previously due to relatively high thresholds of registration.
Results of [
37] about elves’ parent lightning peak current were used in some studies (for example [
10]) as an elve production threshold. Our results demonstrate that a lightning strike with a sufficiently lower current produces an elve as well.
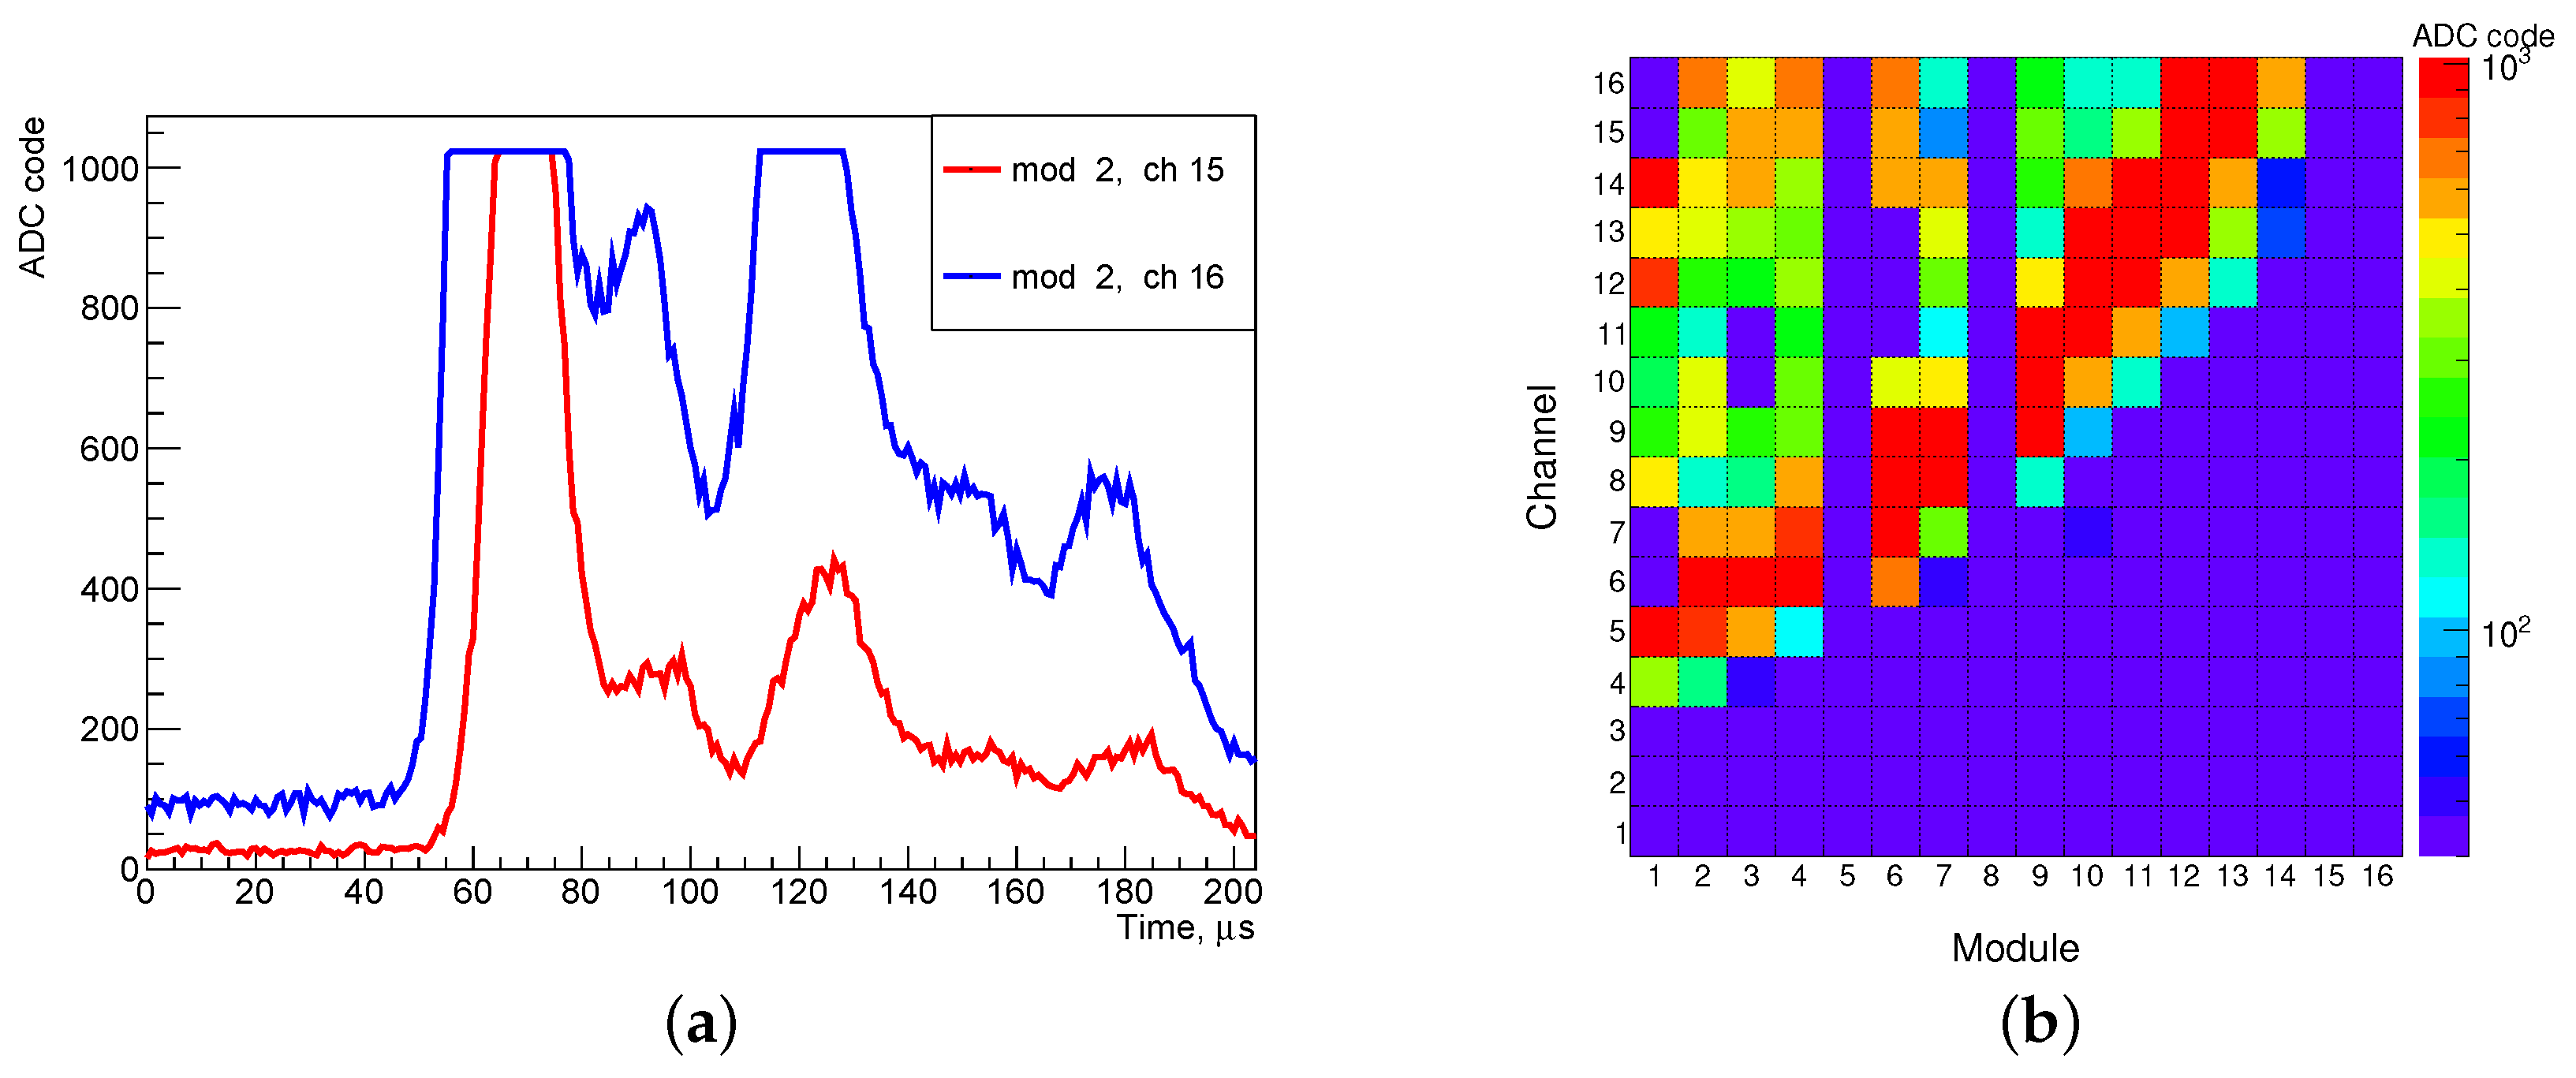
Interestingly, there are measurements of so-called elve doublets, i.e., elves with two rings [
38]. The most probable source of this type of elves is compact intra-cloud discharges (CID) [
39]. Nadir observations are more suitable for observing the multi-ring structure of such elves due to the simpler geometry and higher transparency of the upper atmosphere. An example of such an elve registered in the TUS experiment is presented in
Figure 4. Two bright rings can be seen in the snapshot of the focal surface. A more complicated structure can be found if one looks for a more detailed structure of the waveforms. Namely, there are two bright peaks with some less bright pulses. An analysis of thunderstorm activity near the place of the measurement was done based on data of the Vaisala GLD360 network. A number of lightning strikes were found at the distance of 70–90 km with the most powerful of them having a peak current of
kA. This is far beyond the threshold of an elve formation but this does not mean this particular discharge was parent lightning for the multi-elve. It is more likely the elve was caused by a powerful intra-cloud discharge similar to CID.
4.2. EAS Operation Mode Flashes Outside the TUS FOV
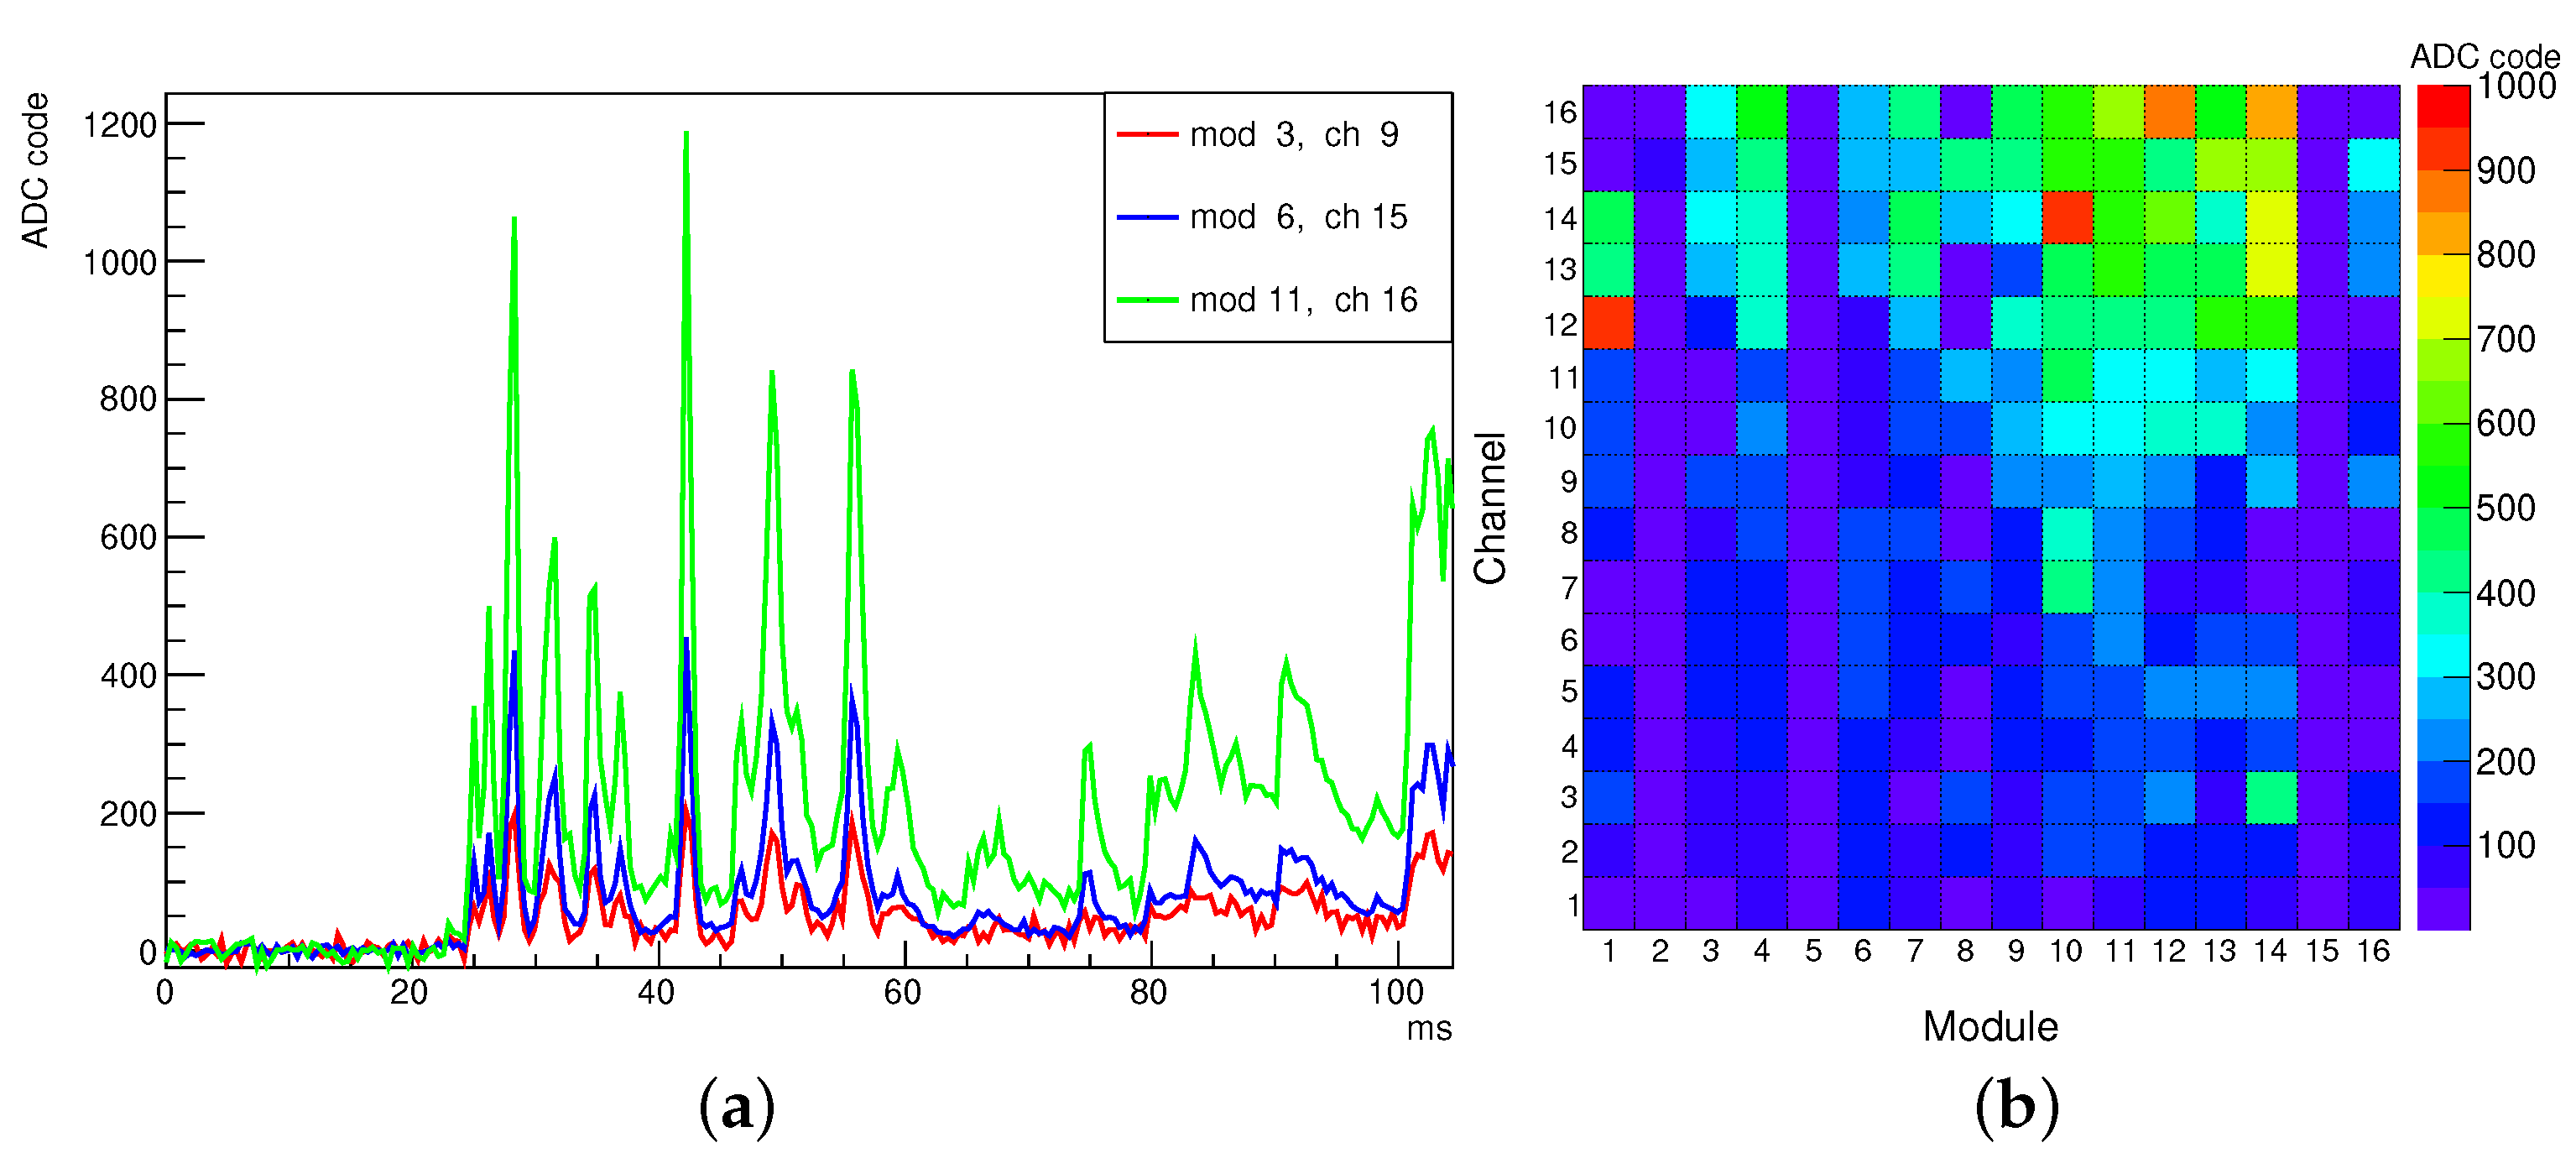
Thunderstorm-related events were measured in all modes of TUS operation but the so-called “monotonously increasing” flashes with simultaneously growing signals in all or at least the majority of pixels were only observed in the EAS mode. An example of waveforms of such a flash is shown in
Figure 5. In most cases, the maximum of a flash of this kind is not seen in the 205
s records. These events can be explained as a signal from a powerful flash outside the detector’s FOV, which becomes “visible” due to diffuse scattering at the TUS mirror.
A comparison of the geographical distribution of such flashes with the distribution of lightning strikes measured by the WWLLN demonstrates a clear correlation of TUS events with some regions of thunderstorm activity, especially above oceans. It is important to remind that the measurements of the TUS detector are influenced by anthropogenic lights, thus over the land, the measurement of flashes is much less efficient. Similarly, the measurements are reduced also by passing above the South Atlantic Anomaly (SAA). The map of these TUS events (“monotonously growing” flashes) is shown in
Figure 6.
4.3. EAS Operation Mode Unusual Transient Events Far from Thunderstorms
Some flashes measured by the TUS detector took place in a clear sky and far from any thunderstorm. One of them is presented in
Figure 7. It was measured over the Atlantic ocean (
N,
W) on 28 July 2017 in the EAS mode. For this event, the Vaisala GLD360 data demonstrate the absence of lightning strikes in the radius of 1000 km from the place of observation for one hour. A peculiar feature of this event is a very steep peak at the beginning (the ADC code increases in hundred of times in less than 1
s) and a much slower afterglow lasting for 20–40
s. The brightness of the first peak is so large that signal appears in all working pixels of the focal surface due to the scattering of light on the mirror. The cloud coverage near the TUS FOV was analyzed. Geostationary infrared images closest in time have been accessed by the Comprehensive Large Array-data Stewardship System (CLASS
https://www.class.ngdc.noaa.gov/saa/products/welcome). NOAA’s Geostationary Operational Environmental Satellite (GOES-13) data on the cloud top temperature are shown in
Figure 8. Only low warm clouds can be found somewhere nearby the detector’s FOV or even absence of them. These clouds are not typical for thunderstorms and can not produce lightning discharges.
The same kind of event but orders of magnitude brighter was measured above Indian ocean (
S,
E), 150 km from the continent of Australia on 26 April 2017. It began with an instantaneous and powerful flash with a center of brightness in the pixel (3.6). This signal in the first in time hit pixel is so big that ADC was saturated for all time samples. The signal in the hit pixels following the first in time hit pixel was ten times larger than in the other events of this kind and demonstrate obvious movement along with photodetector modules with a very high velocity. The data from all hit pixels allowed us to estimate the zenith angle of the event under the assumption of the UV source velocity equal to the speed of light. It was found that the UV source moves in the atmosphere near horizontally. A more detailed description of the event, its signal features and kinematics can be found in [
40].
An explanation of these events is not obvious. An anthropogenic nature is unlikely because events of this type took place far from areas with human activity (over oceans and one of them over the Antarctic).
4.4. TLE-2 Operation Mode
Several hundred events were measured by the TUS detector in the TLE-2 mode during 19 days of exposure (see
Table 1). Most of them represent huge flashes distributed over the entire focal surface. The flashes are supposed to be the photon flux from lightning strikes scattered either in clouds in the field of view of TUS or scattered in neighbor clouds if a discharge occurred outside the FOV. In the second case, the measured signal is diffusely scattered light from the mirror similar to the monotonously increasing flashes registered in the EAS mode.
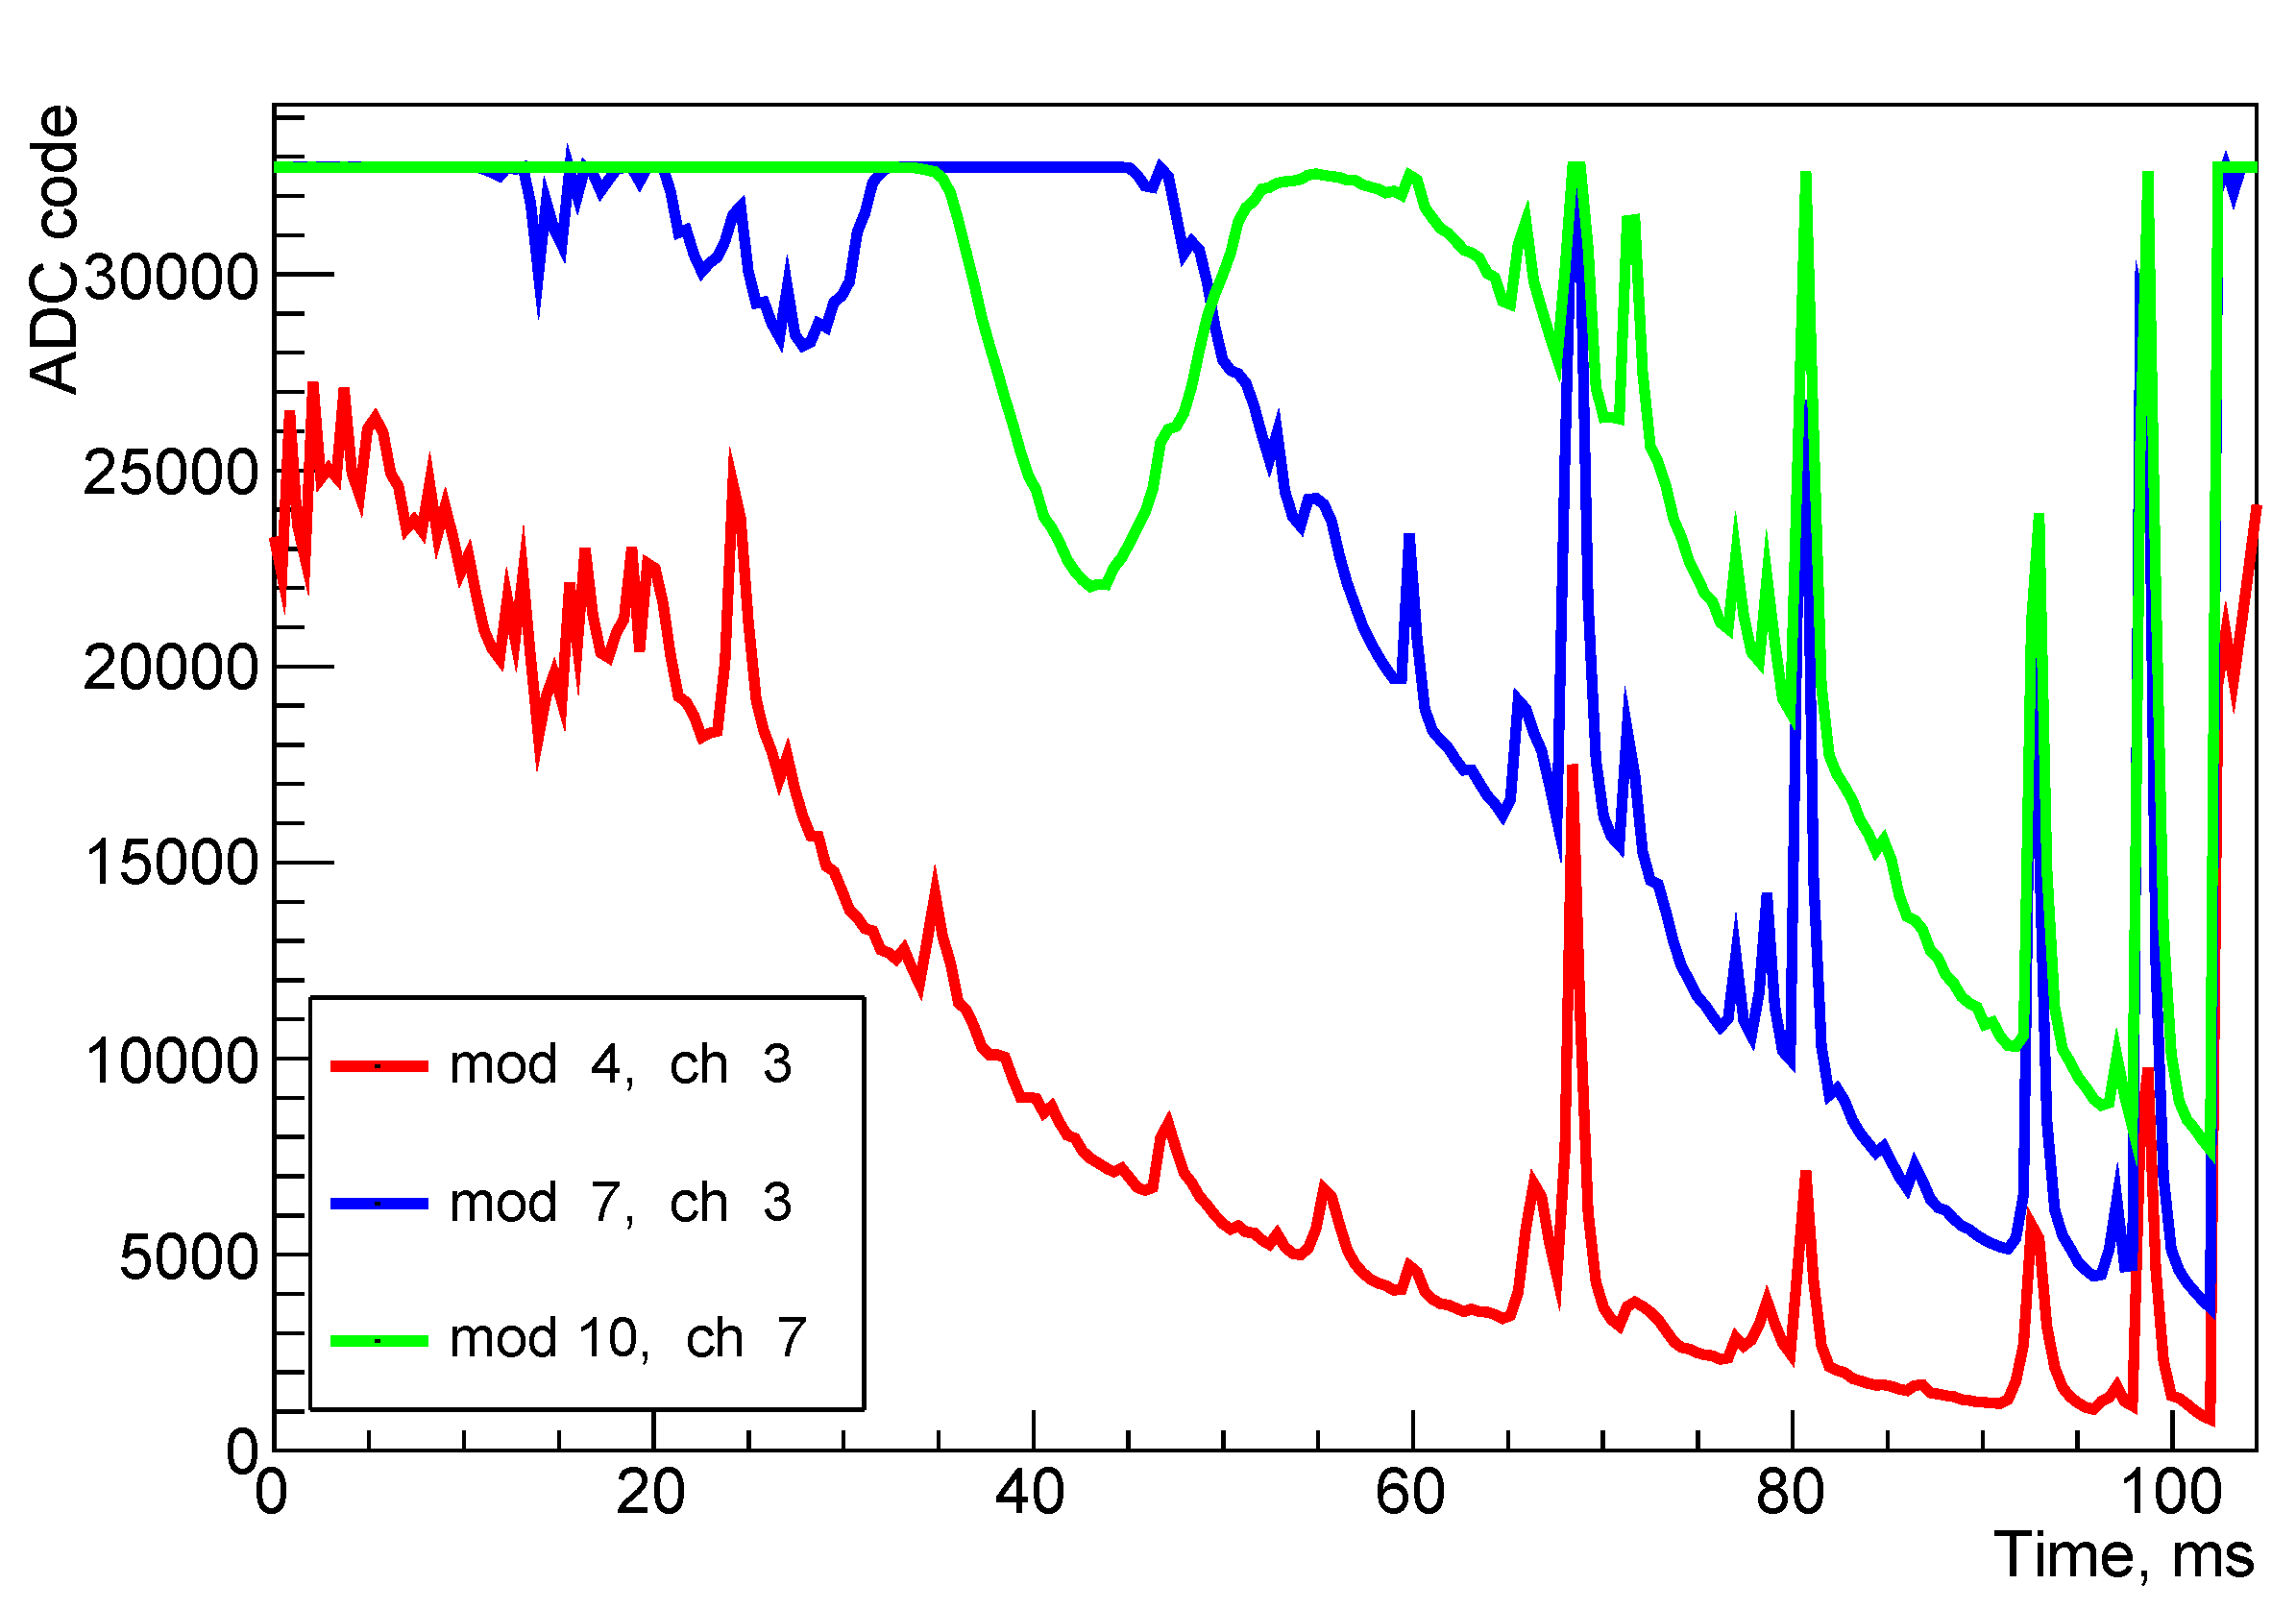
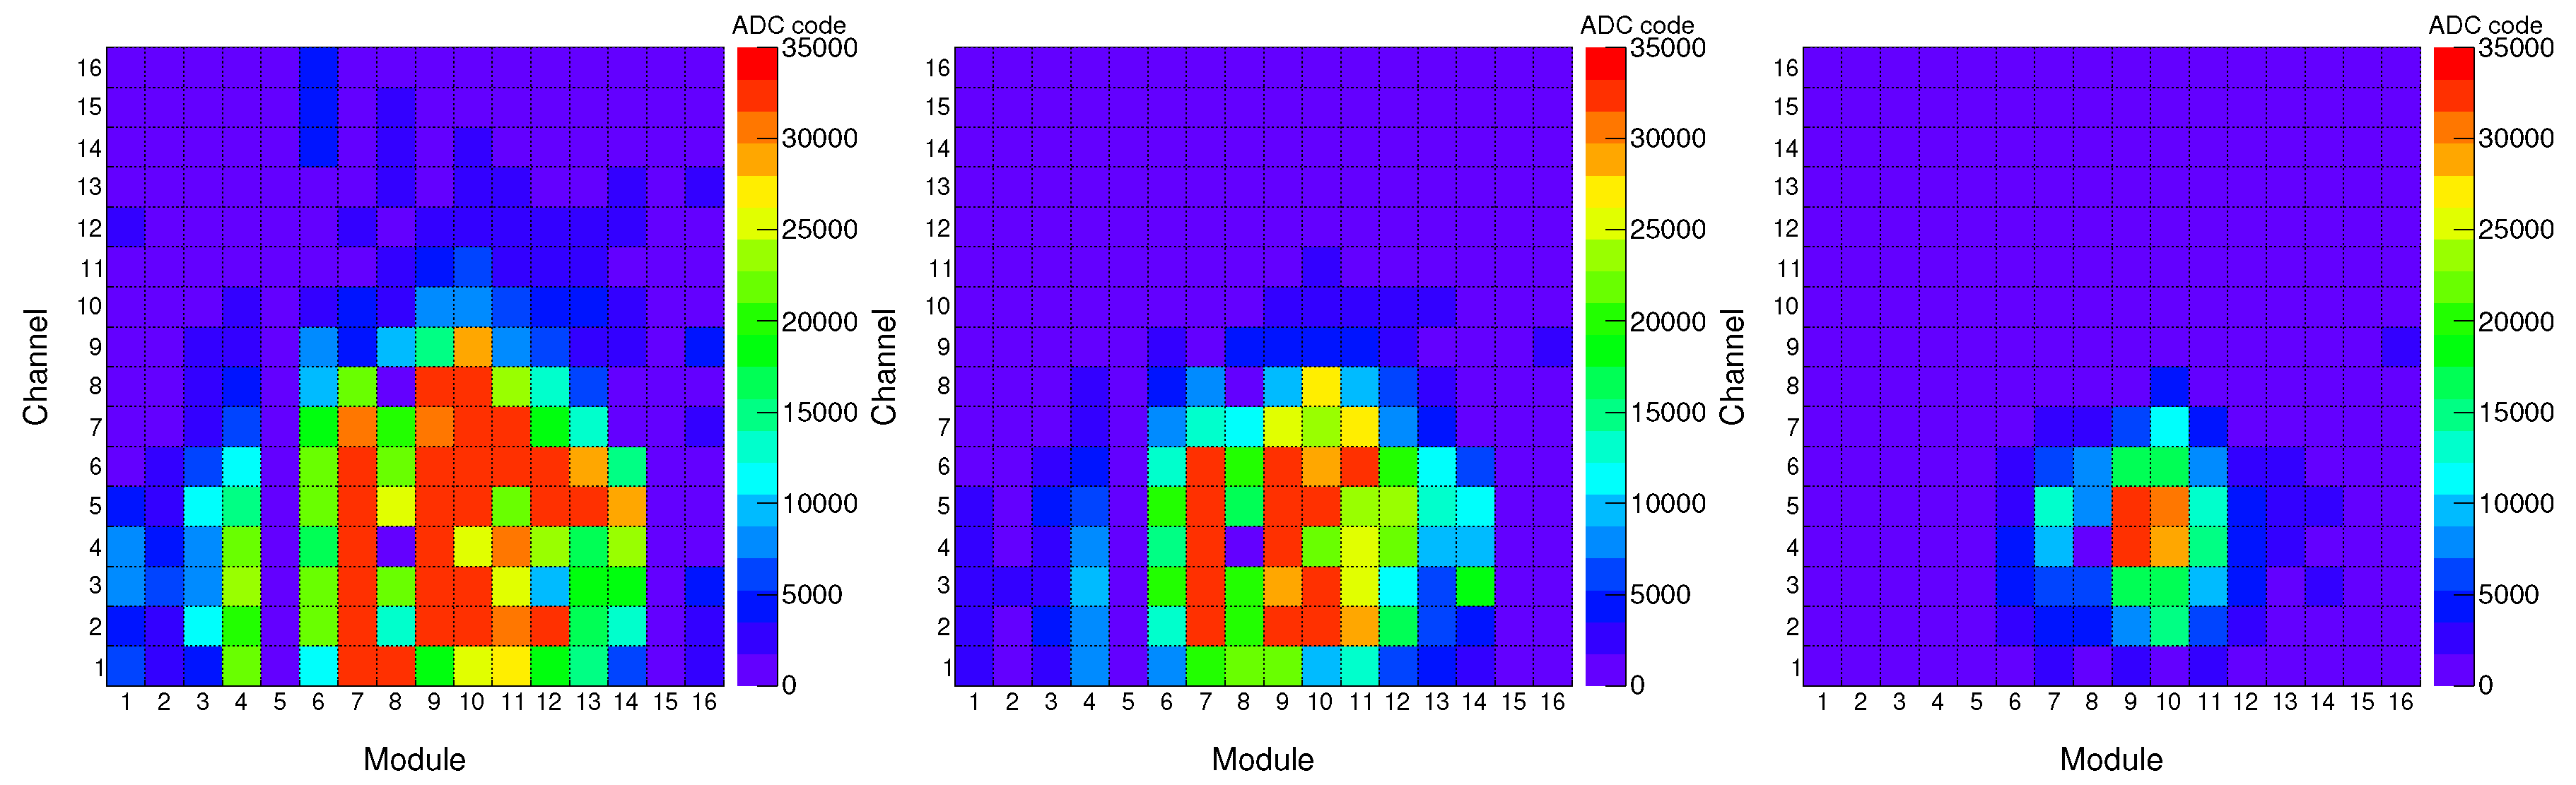
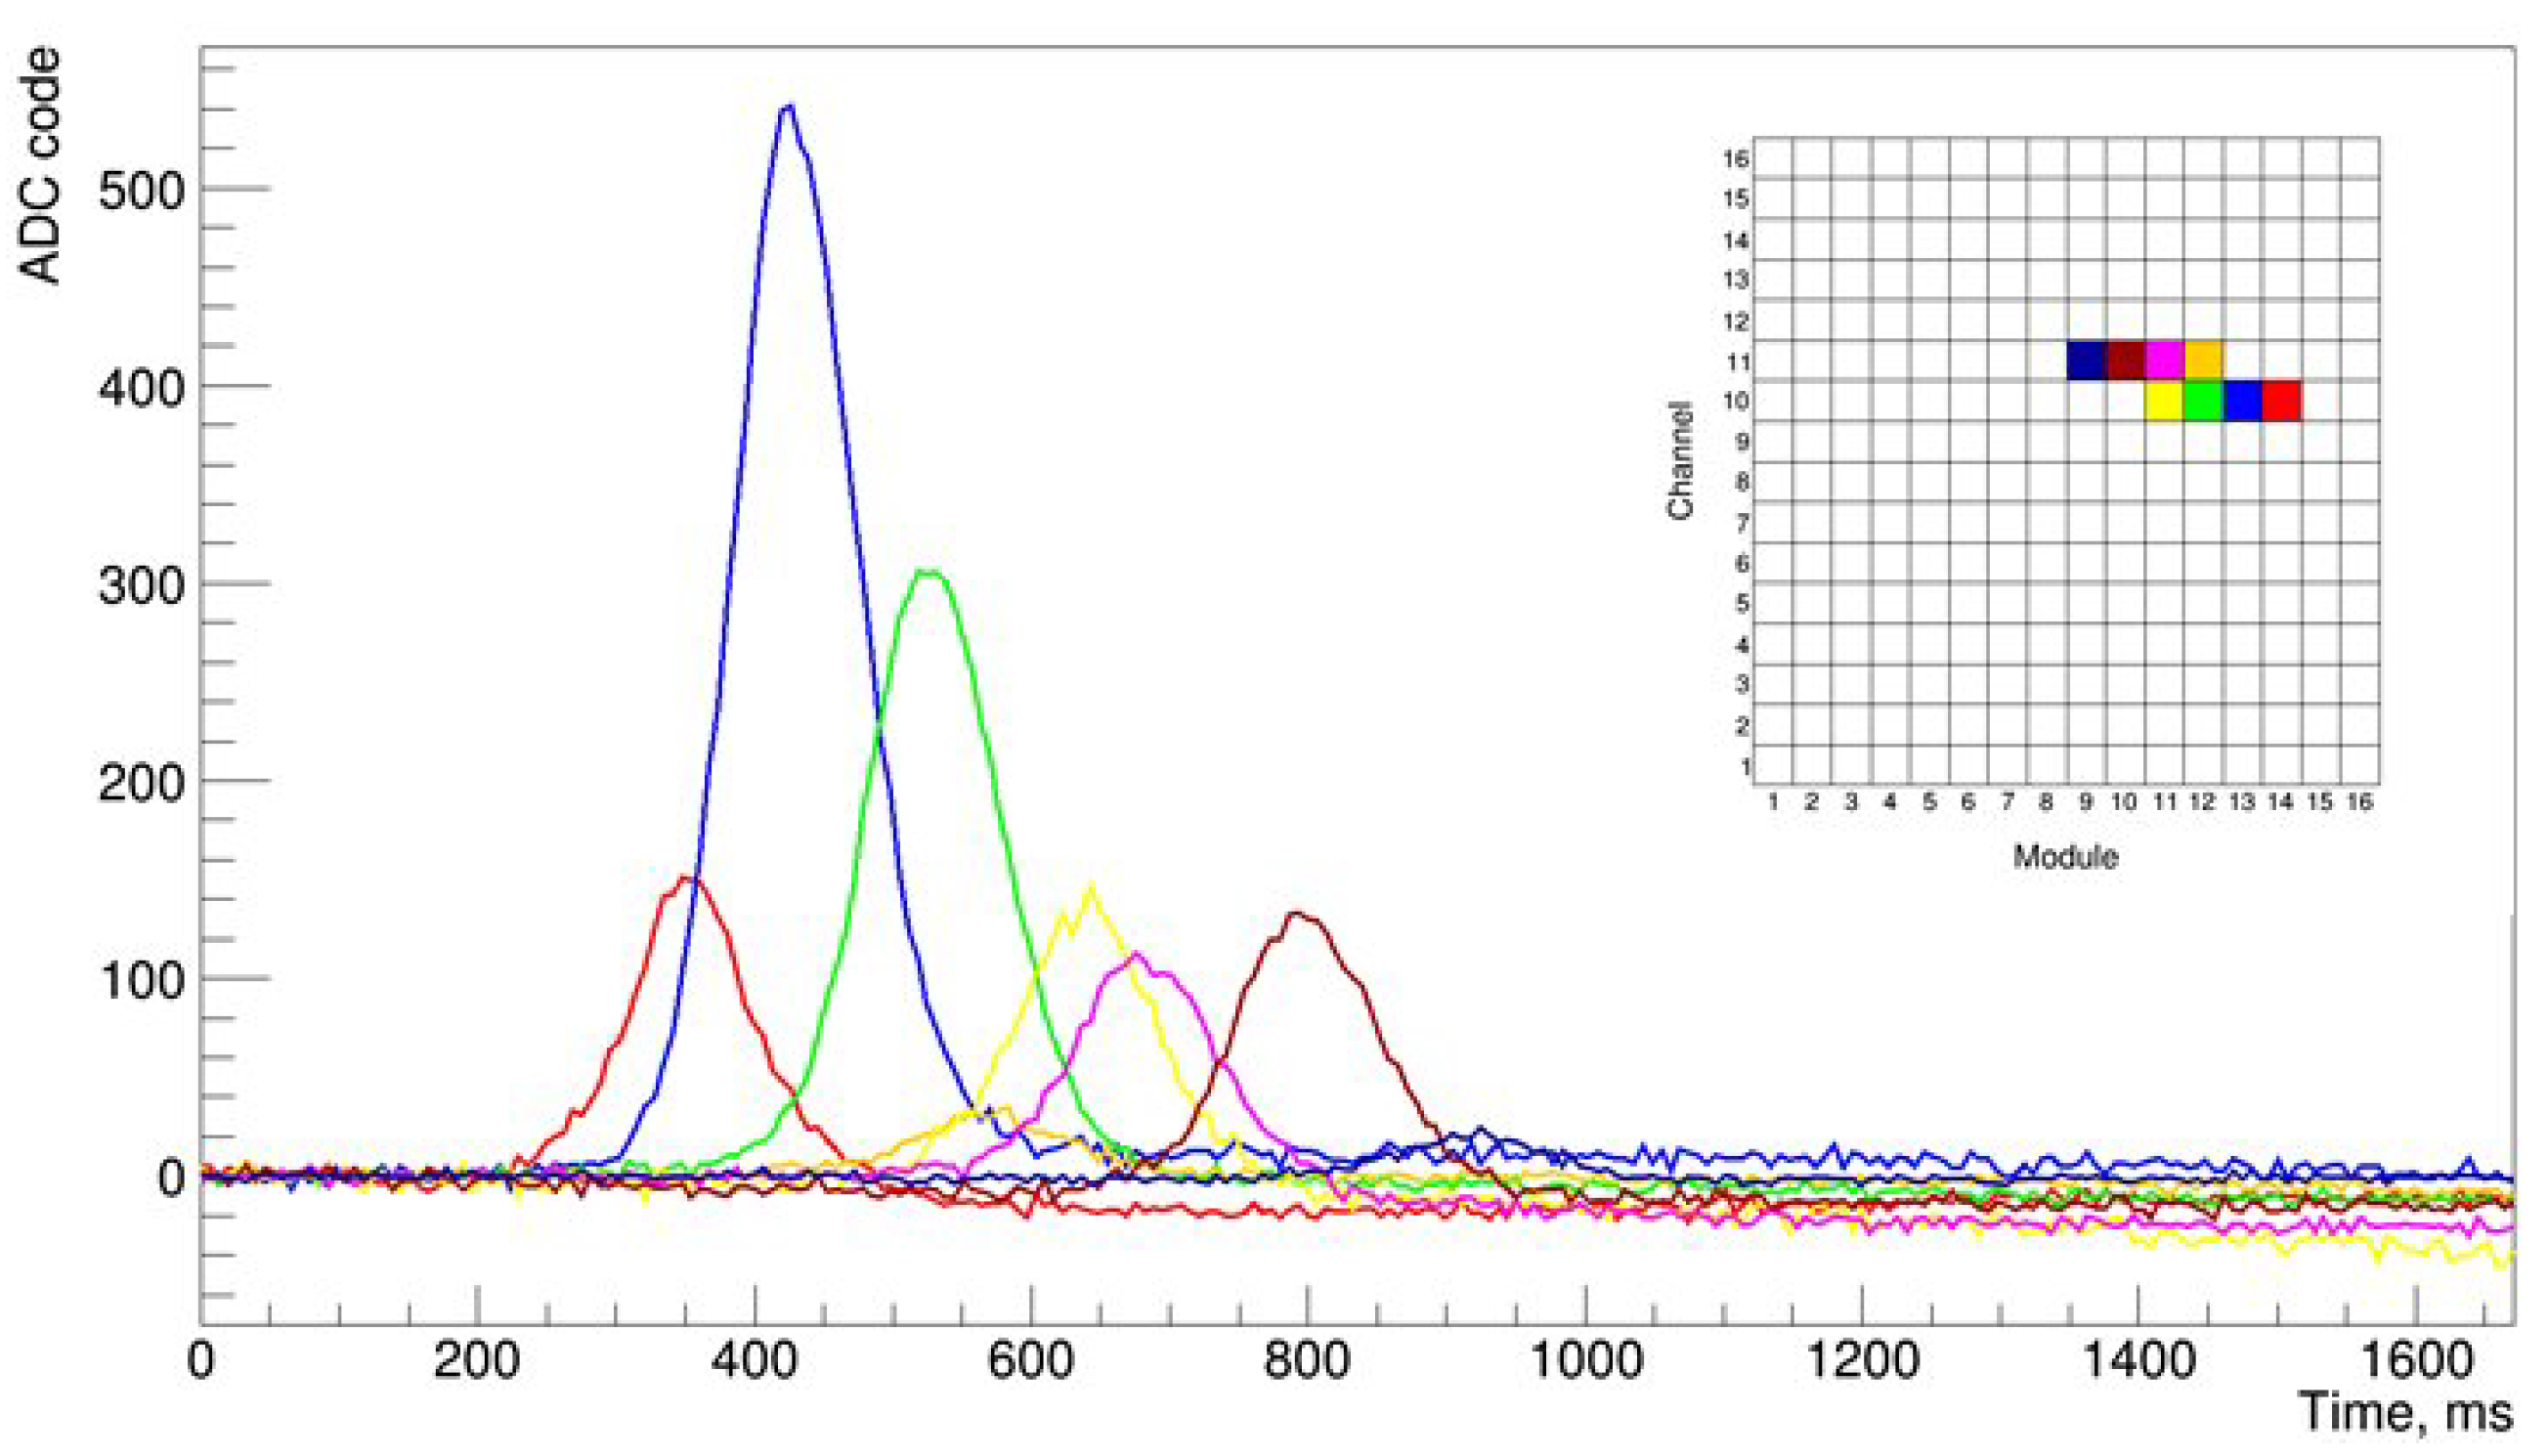
A powerful lightning strike or a TLE event taking place in the FOV of the detector produces a strong signal non-uniform over the focal plane with several pixels in the center of the event being saturated, see
Figure 9 and
Figure 10 demonstrating an event measured on 27 June 2016, above India.
A comparison with the Vaisala global lightning data set GLD360 was made for this event. Several lightning strikes were found in this region at the time of the TUS measurement and two of them (negative cloud-to-ground) took place exactly in the FOV. Different events have various temporal structure (with pulses in the scale of tens of ms) occurring in active thunderstorm regions. This type of TLE was observed in previous measurements made at Vernov and Tatiana satellites.
A phenomenological classification of the events measured in this mode was made to compare them with the flashes registered by the previous experiments (Tatiana and Vernov). The majority of them (∼57%) represent comparatively short pulses (one-time sample of 0.4 ms) measured by many pixels of the photodetector. These events tend to correlate with thunderstorm regions and may be caused by short pulses of a lightning return strike outside the detector FOV. Thus, they are similar to monotonously increasing flashes registered in the EAS mode but without a detailed temporal structure.
Another type of events similar to those observed by Vernov and Tatiana satellites manifests as a series of short pulses within one waveform. These events comprise ∼25% of all TLE mode events.
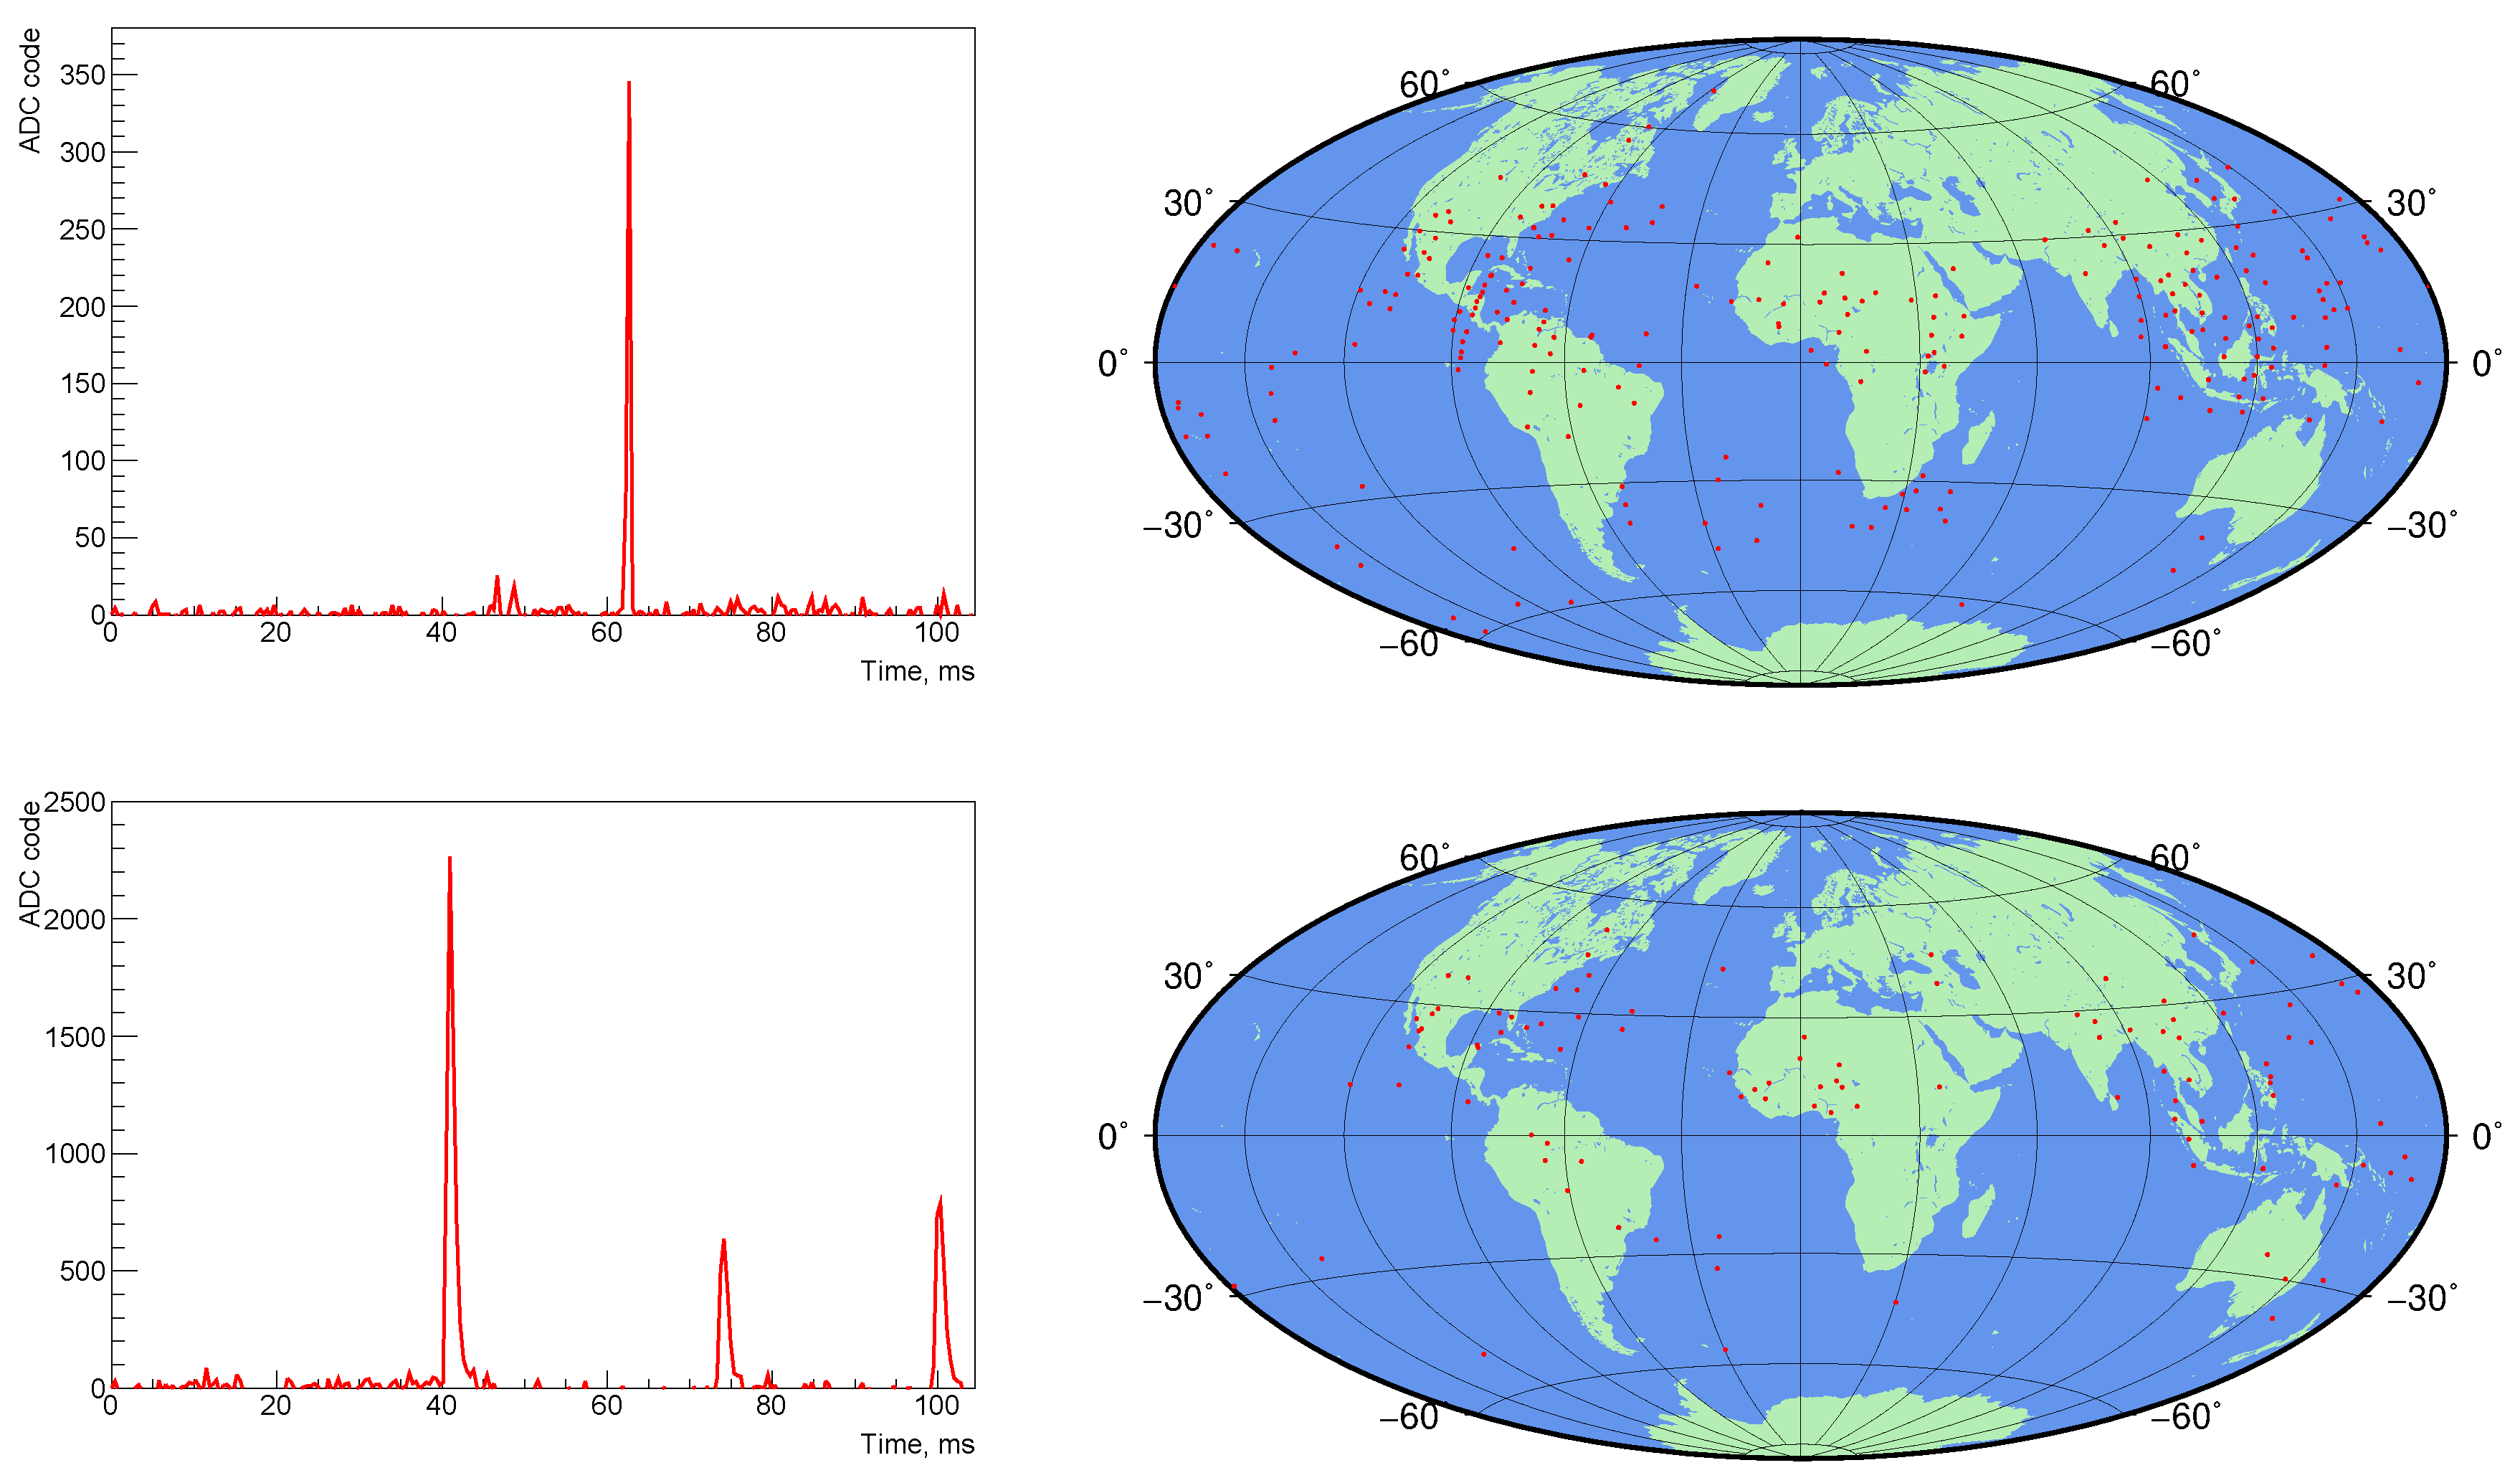
Finally, one more type of events are flashes with a complicated structure and a non-uniform spatial distribution of the signal over the pixels. These events (see examples in
Figure 11 and
Figure 12) occur in the FOV and consist of a large number of peaks. These flashes make up ∼15% of the TLE mode events.
4.5. Meteor Operation Mode Examples of Thunderstorm and Meteor Measurements
It was shown in [
41] that standard “solar system” meteors with velocities of about 30 km/s can be efficiently detected by the fluorescence light produced along the meteor track with the kinetic energy threshold of about 200 J using the TUS detector with the time sampling near 7 ms. The so-called meteor mode of TUS operations had a time resolution of 6.6 ms with the duration of records ≈
s.
A number of bright meteors were measured by TUS during its operation in the meteor mode. One of them is presented in
Figure 13. The meteor was registered on 3 January 2017 at 14:31:08 UTC. This time is close to the Quadrantids meteor shower peak in 2017. The speed of the meteor under the assumption of its horizontal movement in the TUS FOV was calculated. The average time of signal movement from pixel to pixel was found to be near 115 ms. If meteor irradiate light at an altitude of ∼100 km where TUS pixel FOV is 4 km than a visual speed is 35 km/s. The movement of the meteor coincides with a satellite movement thus we add to this number the speed of the satellite and finally obtain meteor speed of about 43 km/s. This value corresponds to the observable speed of Quadrantids.
The trigger of the TUS detector was not optimized for meteor search, because it is aimed for much faster processes like UHECR EAS. But event with that trigger it measured 9 obvious meteors during 250 h of nighttime observations. Date, time and location of meteor measurements are listed in the
Table 2.
These measurements of meteors do not allow one to reconstruct the arrival direction of an object because its velocity is not known. Nevertheless, they are useful for estimating the brightness of faint micro-meteors. The meteors with a signal above photons per time sample (6.6 ms) can be recognized in TUS data which corresponds to photons emitted in the atmosphere.
The majority of events in the meteor mode were measured above thunderstorm regions. These flashes have a complicated temporal structure with numerous peaks. They represent a thunderstorm activity over a large area in the atmosphere and contain lightning discharges, TLEs, intra-cloud flashes etc.
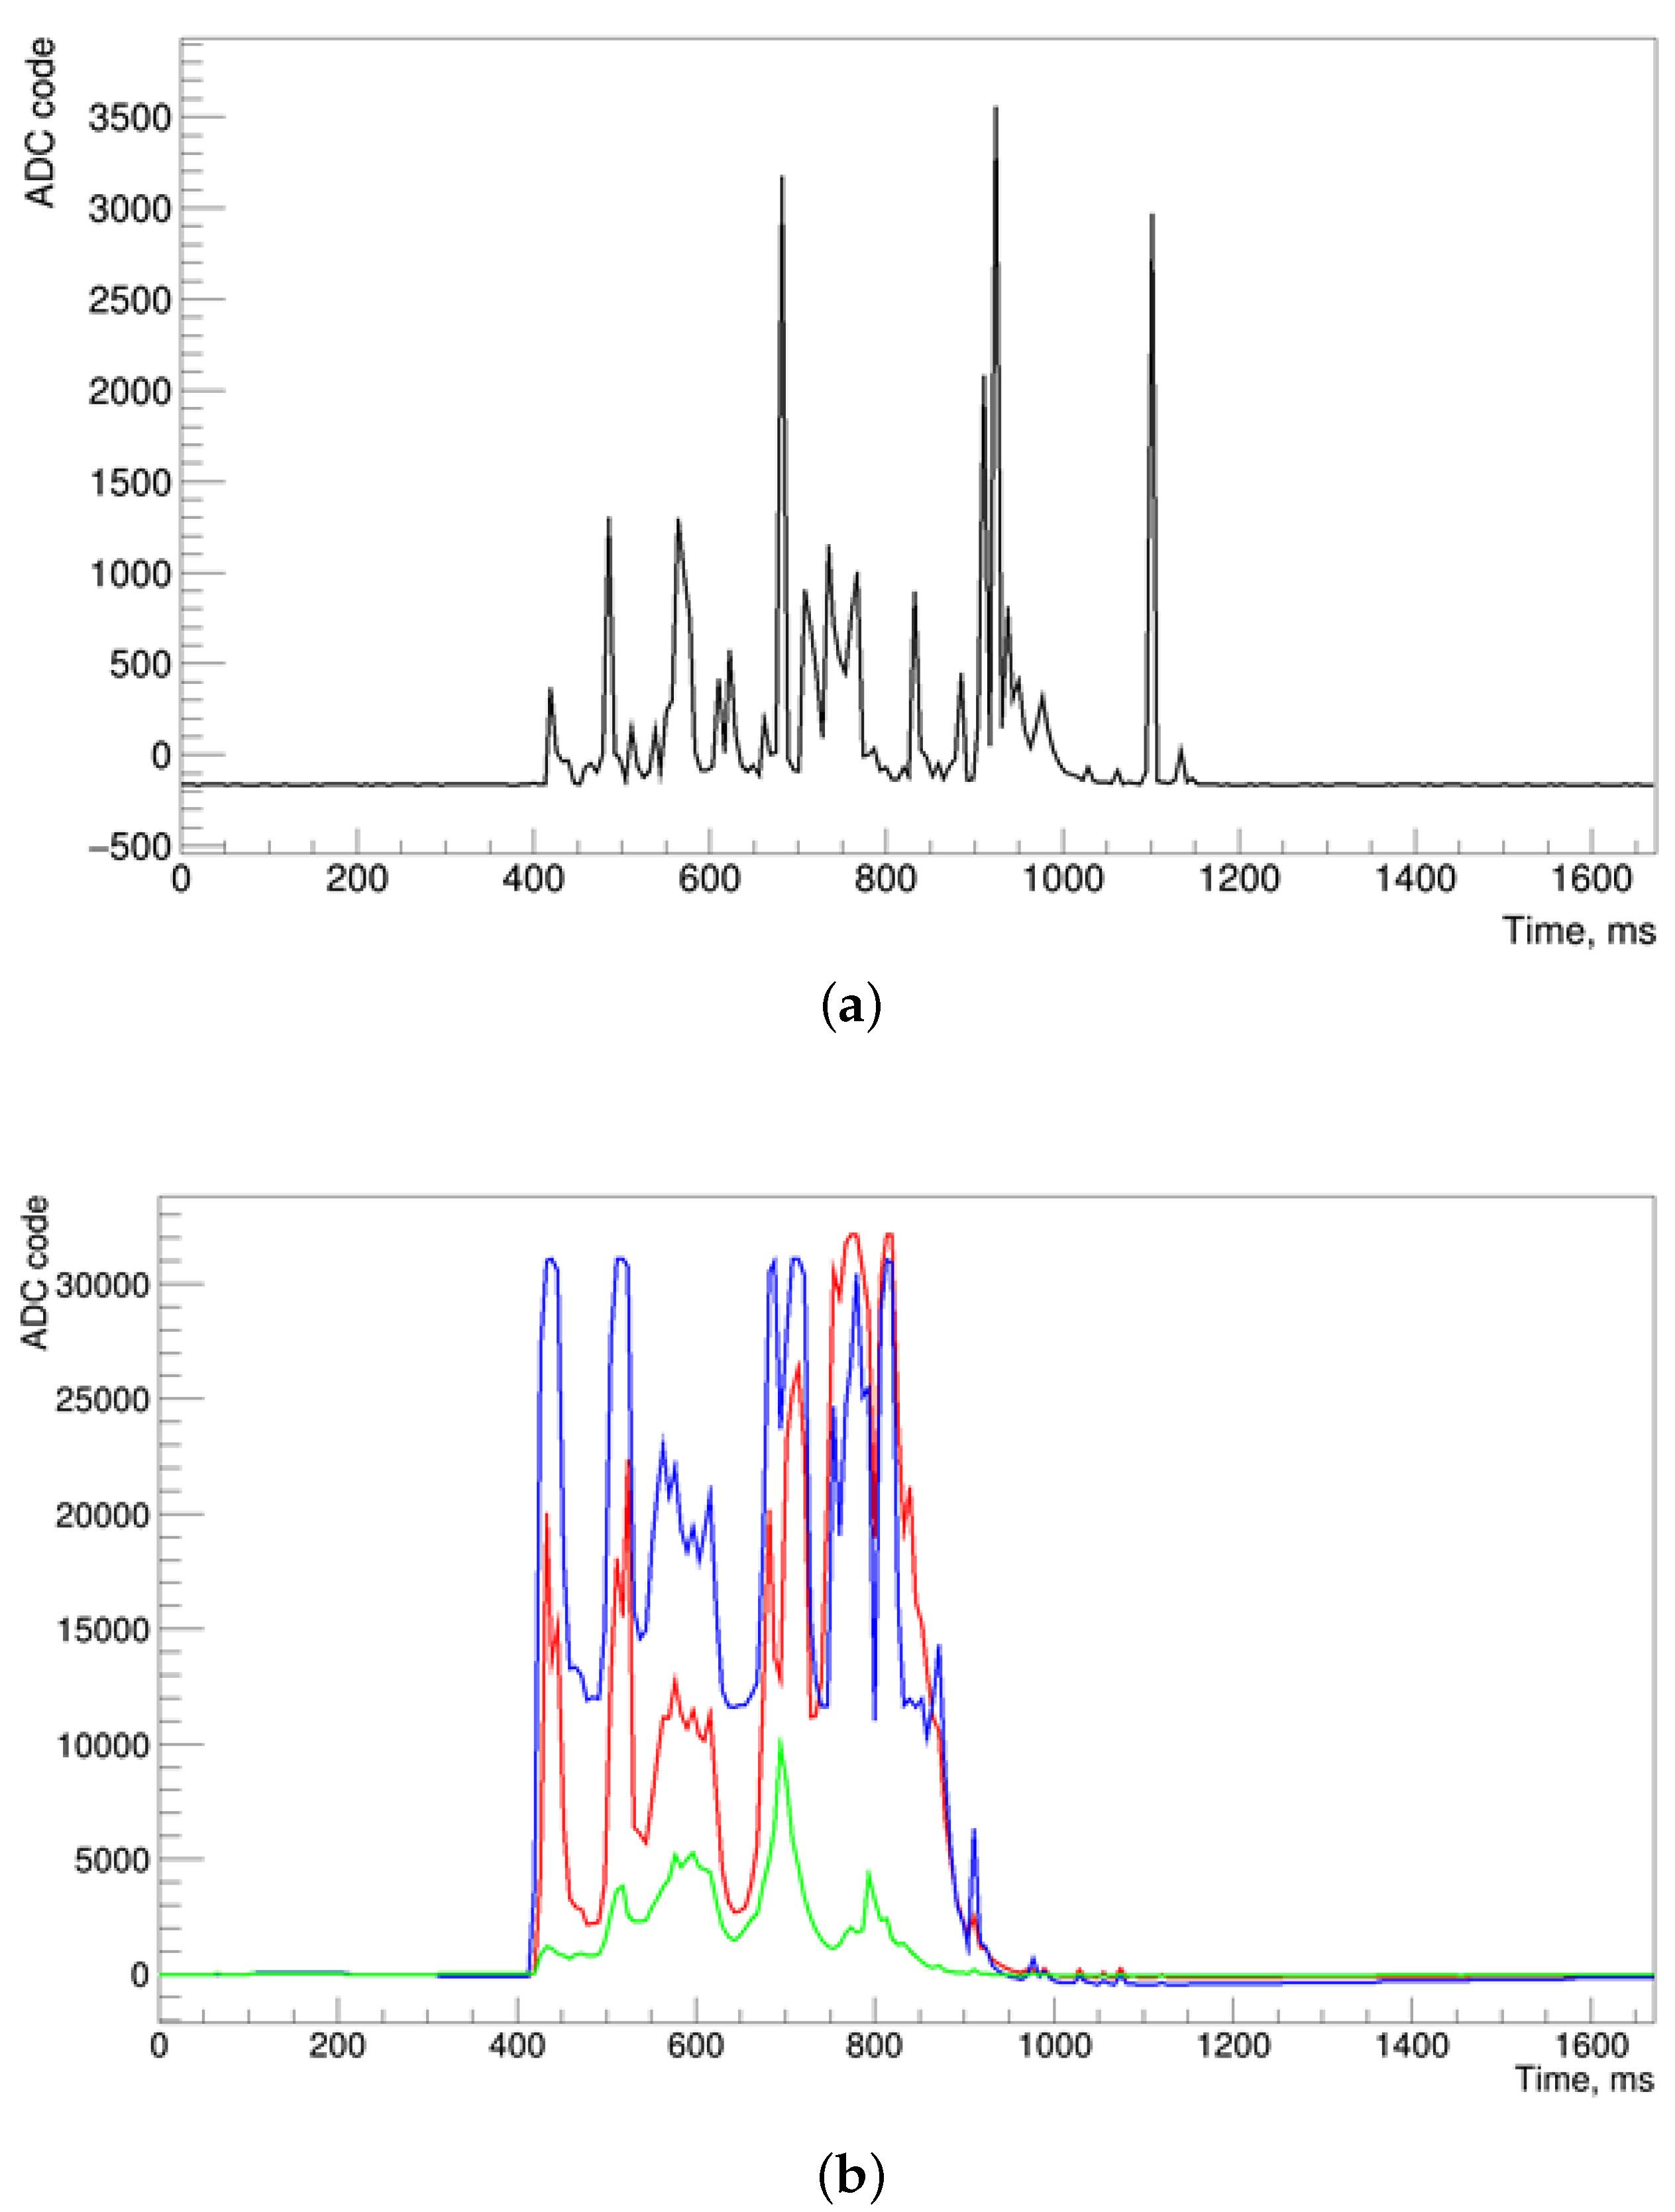
Two examples of events are shown in
Figure 14. The first one was measured above a thunderstorm region. Numerous lightning strikes in the FOV of TUS were registered by the WWLLN and Vaisala GLD360 networks at that time. Three narrow high peaks in the TUS event are supposed to be return strokes of lightning: they match lightning found in the Vaisala GLD360 data. Numerous other less bright UV peaks might be the pre-lightning UV flashes. The second event has a completely different temporal structure: there are no short (one-time sample) peaks. It occurred far from thunderstorms (distance from the TUS FOV more than 300 km) according to the Vaisala GLD360 network and most probably had another nature.
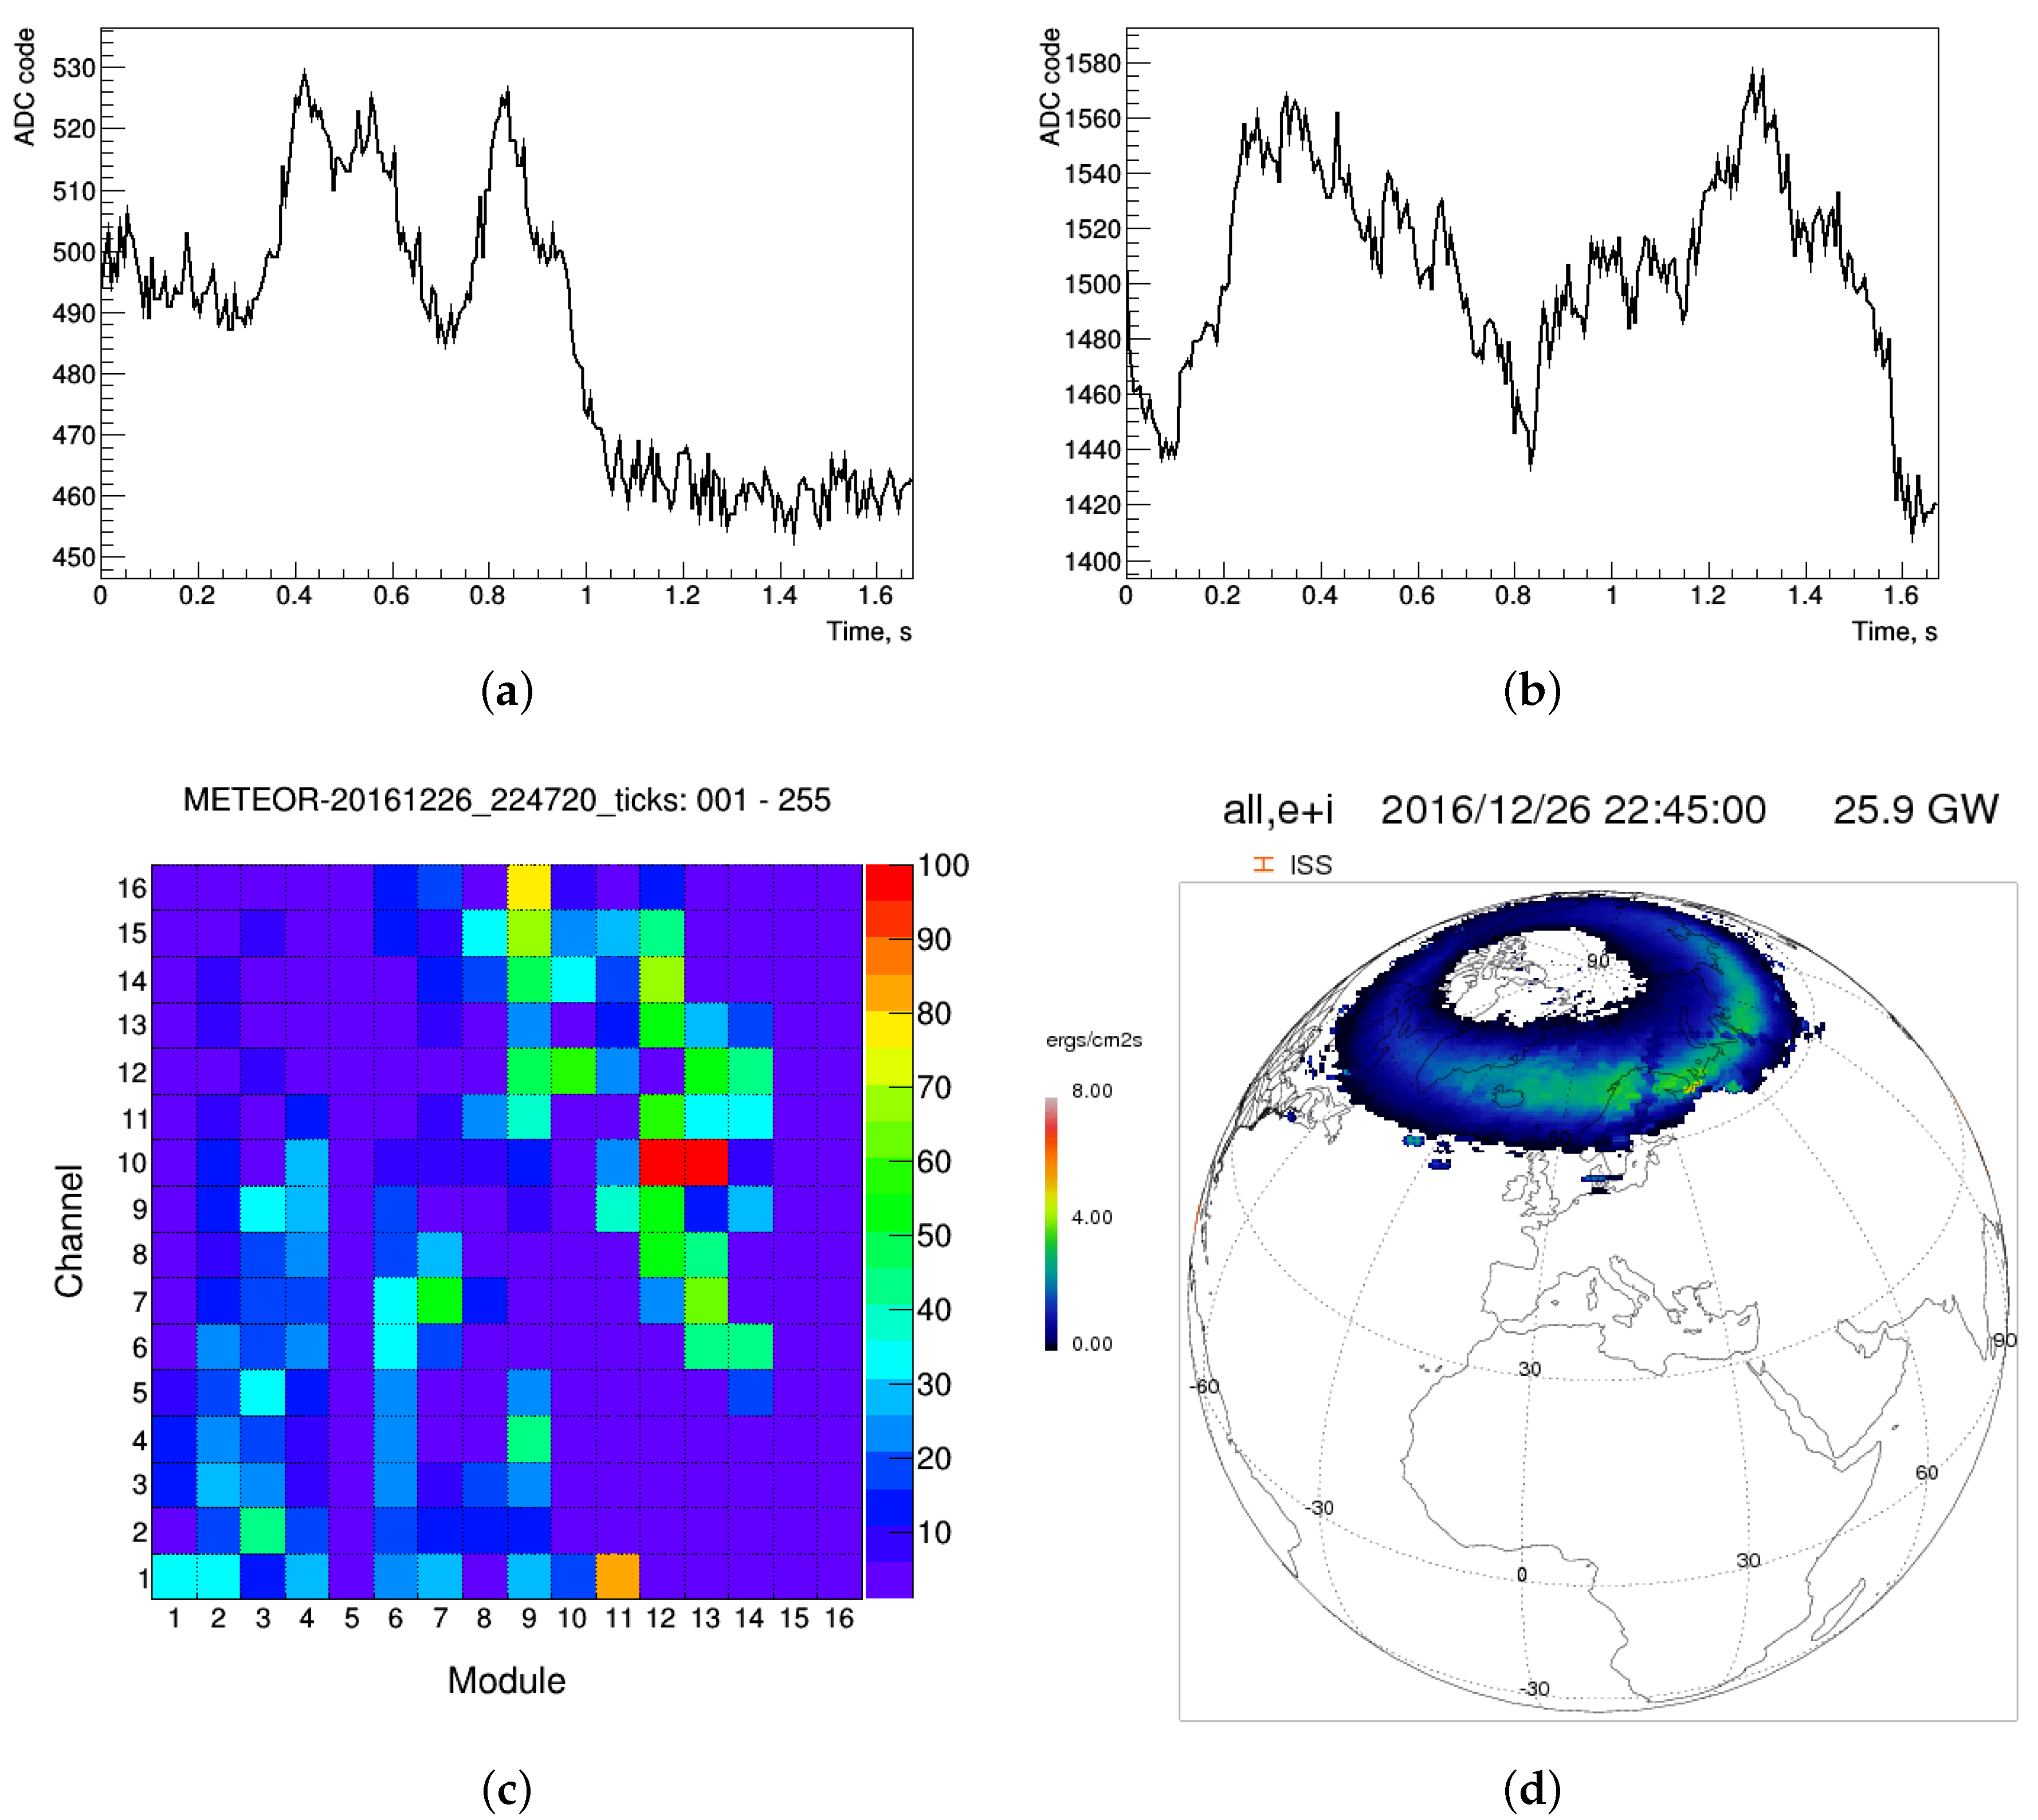
The Lomonosov satellite had a polar orbit, thus it was possible to conduct measurements at high latitudes. This allowed us to see the space-time structure of aurora lights. An example of such measurements is shown in
Figure 15. This event was registered on 26 December 2016 at 22:47:20 UTC above north of Sweden, in the region of active Polar lights (geographical coordinates of the event:
N,
E). A map of electron flux density was obtained using iNTEGRATED SPACE WEATHER ANALYSIS SYSTEM (iSWA)—Web-based dissemination system for NASA-relevant space weather information (See
https://iswa.ccmc.gsfc.nasa.gov/IswaSystemWebApp). It is shown to demonstrate that the event was registered during an active period of charged particle penetration into the atmosphere causing the Aurora light.
4.6. Anthropogenic Sources of UV Radiation in the Atmosphere
As it was mentioned above the majority of events registered by TUS have noise-like waveforms. Within the group, there is a subset of events with noise-like waveforms but strongly non-uniform illumination of the focal plane. An event of this kind is shown in
Figure 16 when TUS was above the southern coast of Greece (
N,
E) at 21:57:21 on 21 August 2016. The top panel of
Figure 16 shows a snapshot of the focal plane in the TUS local coordinates, bottom—the focal plane is rotated so that the position and orientation of the field of view coincide with the position of the detector relative to the geographical map. The superposition of bright pixels with areas of greatest luminosity on the Earth’s surface is clearly visible. As it is seen from the ADC counts values cities can be two orders of magnitude brighter compared to oceans.
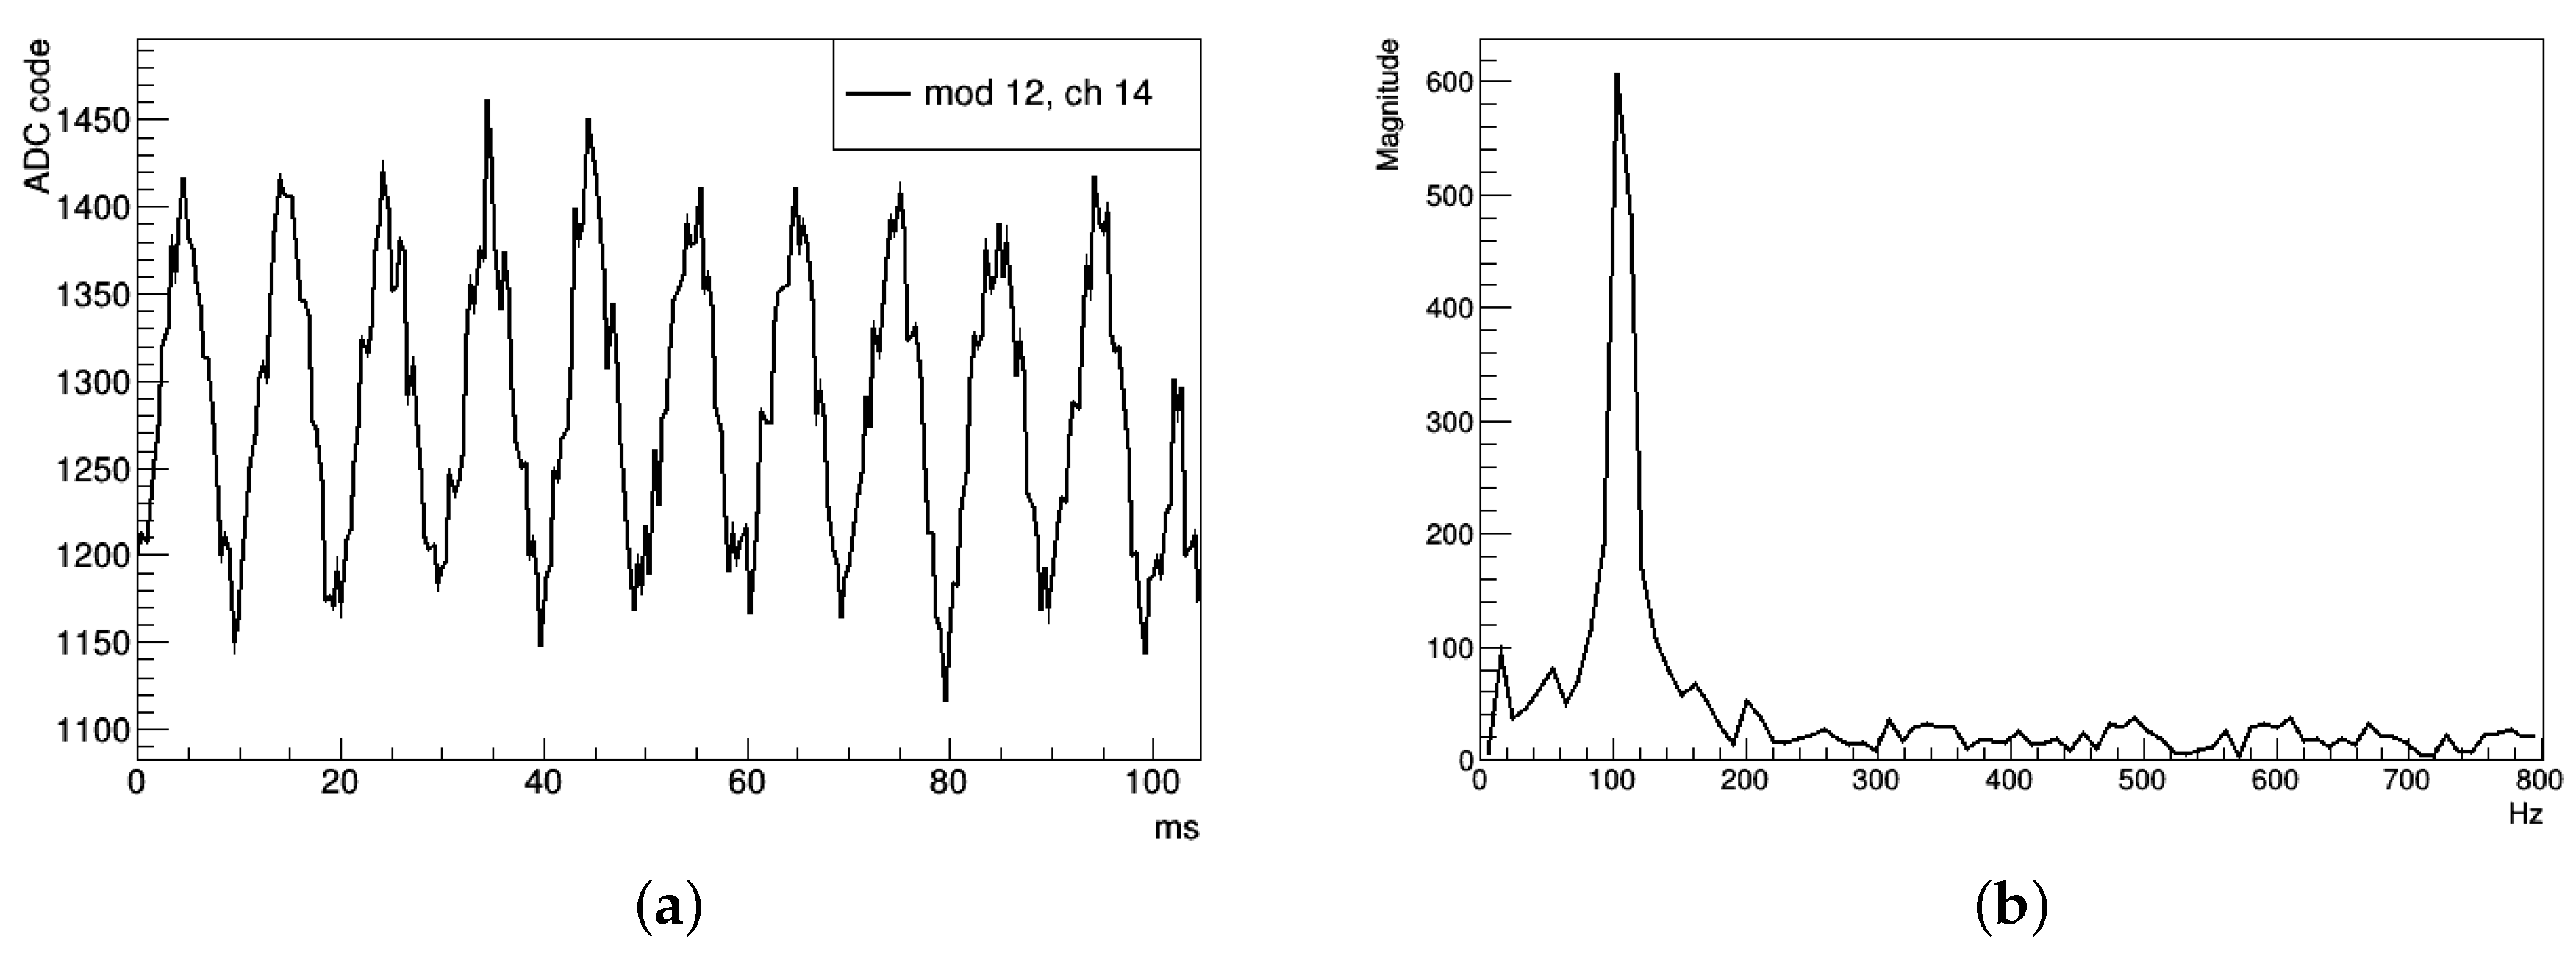
It is interesting to mention that pixel signals are modulated by 100 Hz above Europe and Russia and by 120 Hz above the USA. A waveform of the event shown in
Figure 16 with the 0.4 ms temporal resolution and the result of its Fourier analysis is shown in
Figure 17.
5. Conclusions
The diversity of transient events recorded by TUS in the UV range of wavelengths has significantly improved our earlier understanding of transient atmospheric events obtained in the earlier MSU space experiments Tatiana, Tatiana-2, and Vernov. Spatial and high temporal resolution allow us to select and identify different types of atmospheric phenomena. Measurements in several modes of operation with different temporal scales have demonstrated the multi-functionality of the orbital telescope.
It is important to note that studies of TLEs were performed in the thunderstorm atmosphere which is a complicated system with permanent processes of charge exchange, developing electric fields, electromagnetic discharges accompanied by transient luminosity. These processes are taking place simultaneously at various time scales (from microseconds to minutes) with intra-cloud initial breakdowns, lightning step leaders, and return strikes among them. Different transient UV flashes (elves, sprites, jets, etc.) follow lightning strikes. Measurements of TLE by the TUS detector gave key data for understanding the sequence, frequency and spatial scale of events. A series of UV flashes found in Tatiana and Vernov experiments and confirmed in the TUS experiment become an important characteristic of the atmosphere in its large lateral scale.
The TUS detector observed a certain structure in UV radiated rings of elves. A few events with more than one ring centered in one and the same area were detected. They coincided with lightning strikes measured by the world-wide lightning location networks. Radiation in one ring was found to be structured in some cases demonstrating a brighter ring area in the direction to the ring center (
Figure 4).
An estimate of the full number of UV photons emitted by elves was found to be >, which is four orders of magnitude less than measured with the previous imaging detector of the ISUAL experiment (≳). The brightness of these events is still three orders of magnitude higher than expected from UHECR events. A few possible UHECR candidates were detected by TUS far from thunderstorm areas A discussion of their phenomenology and origin will be presented elsewhere. The TUS detector also registered a lot of slower transients of various origins: meteors, Aurora lights, anthropogenic radiation, etc. Examples demonstrated in this paper prove the multi-functionality of such a detector.
Author Contributions
Writing—original draft preparation P.K., M.K.; writing—review and editing, B.K., M.Z.; methodology, B.K., P.K., G.G., S.S., L.T., V.G., A.B., O.S., A.P., A.N.; supervision, M.P., B.K., P.K., L.T.; project administration, V.P., A.S. (Andrei Shirokov), I.Y.; software and visualization, S.S., A.G., A.T., M.L.; investigation, P.K., S.S., I.Y., V.P.: data curation, M.Z., A.S. (Alexander Senkovsky).
Funding
This work was done with partial financial support from the Russian Foundation for Basic Research grants No. 16-29-13065 and 17-05-00492, State Space Corporation ROSCOSMOS and M.V. Lomonosov Moscow State University through its “Prospects for Development” program (“Perspektivnye Napravleniya Razvitiya”).
Acknowledgments
The authors thank Robert Holzworth, the head of the World Wide Lightning Detection Network, and the Vaisala Inc. company for providing data on the lightning strikes employed in the present study, Roberto Cremonini for the help with the cloud coverage analyses.
Conflicts of Interest
The authors declare no conflict of interest.
Abbreviations
The following abbreviations are used in this manuscript:
| ADC | Analog-to-digital converter |
| CID | Compact intra-cloud discharge |
| GZK | Greizen-Zatsepin-Kuzmin |
| EAS | Extensive air shower |
| EMP | Electromagnetic pulse |
| FOV | Field of view |
| FPGA | Field-programmable gate array |
| MSU | Moscow State University |
| PMT | Photomultiplier tube |
| TLE | Transient luminous events |
| TUS | Tracking Ultraviolet Setup |
| UHECR | Ultra-high-energy cosmic ray |
| UV | Ultraviolet |
| WWLLN | World wide lightning location network |
References
- Khrenov, B.A.; Alexandrov, V.V.; Bugrov, D.I.; Garipov, G.K.; Kalmykov, N.N.; Panasyuk, M.I.; Sharakin, S.A.; Silaev, A.A.; Yashin, I.V.; Grebenyuk, V.M.; et al. KLYPVE/TUS space experiments for study of ultrahigh-energy cosmic rays. Phys. At. Nucl. 2004, 67, 2058–2061. [Google Scholar] [CrossRef]
- Abrashkin, V.; Alexandrov, V.; Arakcheev, Y.; Bitkin, E.; Cordero, A.; Eremin, S.; Finger, M.; Garipov, G.; Grebenyuk, V.; Kalmykov, N.; et al. The TUS space fluorescence detector for study of UHECR and other phenomena of variable fluorescence light in the atmosphere. Adv. Space Res. 2006, 37, 1876–1883. [Google Scholar] [CrossRef]
- Adams, J.H.; Ahmad, S.; Albert, J.N.; Allard, D.; Anchordoqui, L.; Andreev, V.; Anzalone, A.; Arai, Y.; Asano, K.; Ave Pernas, M.; et al. Space experiment TUS on board the Lomonosov satellite as pathfinder of JEM-EUSO. Exp. Astron. 2015, 40, 315–326. [Google Scholar] [CrossRef] [Green Version]
- Klimov, P.A.; Panasyuk, M.I.; Khrenov, B.A.; Garipov, G.K.; Kalmykov, N.N.; Petrov, V.L.; Sharakin, S.A.; Shirokov, A.V.; Yashin, I.V.; Zotov, M.Y.; et al. The TUS Detector of Extreme Energy Cosmic Rays on Board the Lomonosov Satellite. Space Sci. Rev. 2017, 212, 1687–1703. [Google Scholar] [CrossRef]
- Grinyuk, A.; Grebenyuk, V.; Khrenov, B.; Klimov, P.; Lavrova, M.; Panasyuk, M.; Sharakin, S.; Shirokov, A.; Tkachenko, A.; Tkachev, L.; et al. The orbital TUS detector simulation. Astropart. Phys. 2017, 90, 93–97. [Google Scholar] [CrossRef]
- Klimov, P.; Lomonosov-Uhecr/Tle Collaboration. Ultra-high energy cosmic ray detector TUS: Preliminary results of the first year of measurements. Int. Cosm. Ray Conf. 2017, 301, 1098. [Google Scholar]
- Biktemerova, S.V.; Botvinko, A.A.; Chirskaya, N.P.; Eremeev, V.E.; Garipov, G.K.; Grebenyuk, V.M.; Grinyuk, A.A.; Jeong, S.; Kalmykov, N.N.; Kaznacheeva, M.A.; et al. Search for extreme energy cosmic ray candidates in the TUS orbital experiment data. arXiv 2017, arXiv:1706.05369. [Google Scholar]
- Klimov, P.; Lomonosov-UHECR/TLE Collaboration. Status of the KLYPVE-EUSO detector for EECR study on board the ISS. In Proceedings of the Science (ICRC2017), Washington, DC, USA, 8–9 November 2017. [Google Scholar]
- Adams, J.H.; Ahmad, S.; Albert, J.N.; Allard, D.; Anchordoqui, L.; Andreev, V.; Anzalone, A.; Arai, Y.; Asano, K.; Ave Pernas, M. The JEM-EUSO mission: An introduction. Exp. Astron. 2015, 40, 3–17. [Google Scholar] [CrossRef] [Green Version]
- Chen, A.B.; Kuo, C.L.; Lee, Y.J.; Su, H.T.; Hsu, R.R.; Chern, J.L.; Frey, H.U.; Mende, S.B.; Takahashi, Y.; Fukunishi, H.; et al. Global distributions and occurrence rates of transient luminous events. J. Geophys. Res. (Space Phys.) 2008, 113, A08306. [Google Scholar] [CrossRef]
- Sadovnichy, V.A.; Panasyuk, M.I.; Bobrovnikov, S.Y.; Vedenkin, N.N.; Vlasova, N.A.; Garipov, G.K.; Grigorian, O.R.; Ivanova, T.A.; Kalegaev, V.V.; Klimov, P.A.; et al. First results of investigating the space environment onboard the Universitetskii-Tatyana satellite. Cosm. Res. 2007, 45, 273–286. [Google Scholar] [CrossRef]
- Sadovnichy, V.A.; Panasyuk, M.I.; Yashin, I.V.; Barinova, V.O.; Veden’kin, N.N.; Vlasova, N.A.; Garipov, G.K.; Grigoryan, O.R.; Ivanova, T.A.; Kalegaev, V.V.; et al. Investigations of the space environment aboard the Universitetsky-Tat’yana and Universitetsky-Tat’yana-2 microsatellites. Sol. Syst. Res. 2011, 45, 3–29. [Google Scholar] [CrossRef]
- Garipov, G.K.; Khrenov, B.A.; Klimov, P.A.; Klimenko, V.V.; Mareev, E.A.; Martines, O.; Mendoza, E.; Morozenko, V.S.; Panasyuk, M.I.; Park, I.H.; et al. Global transients in ultraviolet and red-infrared ranges from data of Universitetsky-Tatiana-2 satellite. J. Geophys. Res. (Atmos.) 2013, 118, 370–379. [Google Scholar] [CrossRef] [Green Version]
- Panasyuk, M.I.; Svertilov, S.I.; Bogomolov, V.V.; Garipov, G.K.; Barinova, V.O.; Bogomolov, A.V.; Veden’kin, N.N.; Golovanov, I.A.; Iyudin, A.F.; Kalegaev, V.V.; et al. Experiment on the Vernov satellite: Transient energetic processes in the Earth’s atmosphere and magnetosphere. Part II. First results. Cosm. Res. 2016, 54, 343–350. [Google Scholar] [CrossRef]
- Klimov, P.; Garipov, G.; Khrenov, B.; Morozenko, V.; Barinova, V.; Bogomolov, V.; Kaznacheeva, M.; Panasyuk, M.; Saleev, K.; Svertilov, S. Vernov Satellite Data of Transient Atmospheric Events. J. Appl. Meteorol. Climatol. 2017, 56, 2189–2201. [Google Scholar] [CrossRef]
- Garipov, G.K.; Khrenov, B.A.; Panasyuk, M.I.; Tulupov, V.I.; Shirokov, A.V.; Yashin, I.V.; Salazar, H. UV radiation from the atmosphere: Results of the MSU “Tatiana” satellite measurements. Astropart. Phys. 2005, 24, 400–408. [Google Scholar] [CrossRef]
- Vedenkin, N.N.; Garipov, G.K.; Klimov, P.A.; Klimenko, V.V.; Mareev, E.A.; Martinez, O.; Morozenko, V.S.; Park, I.; Panasyuk, M.I.; Ponce, E.; et al. Atmospheric ultraviolet and red-infrared flashes from Universitetsky-Tatiana-2 satellite data. J. Exp. Theor. Phys. 2011, 113, 781–790. [Google Scholar] [CrossRef]
- Garipov, G.K.; Alexandrov, V.V.; Bugrov, D.I.; Cordero, A.; Cuautle, M.; Khrenov, B.A.; Linsley, J.; Martinez, O.; Moreno, E.B.; Panasyuk, M.I. Electronics for the KLYPVE Detector. In Observing Ultrahigh Energy Cosmic Rays from Space and Earth; Salazar, H., Villasenor, L., Zepeda, A., Eds.; American Institute of Physics Conference Series; American Inst. of Physics: College Park, MD, USA, 25 May 2001; Volume 566, pp. 76–90. [Google Scholar] [CrossRef]
- Khrenov, B.A.; Klimov, P.A.; Panasyuk, M.I.; Sharakin, S.A.; Tkachev, L.G.; Zotov, M.Y.; Biktemerova, S.V.; Botvinko, A.A.; Chirskaya, N.P.; Eremeev, V.E.; et al. First results from the TUS orbital detector in the extensive air shower mode. J. Cosmol. Astropart. Phys. 2017, 2017, 006. [Google Scholar] [CrossRef]
- Klimov, P.; Khrenov, B.; Sharakin, S.; Zotov, M.; Chirskaya, N.; Eremeev, V.; Garipov, G.; Kaznacheeva, M.; Panasyuk, M.; Petrov, V.; et al. First results on transient atmospheric events from Tracking Ultraviolet Setup (TUS) on board the Lomonosov satellite. In Proceedings of the International Symposium TEPA-2016, Nor-Amberd, Armenia, 3–7 October 2016; pp. 122–127. [Google Scholar]
- Klimov, P.A.; Zotov, M.Y.; Chirskaya, N.P.; Khrenov, B.A.; Garipov, G.K.; Panasyuk, M.I.; Sharakin, S.A.; Shirokov, A.V.; Yashin, I.V.; Grinyuk, A.A.; et al. Preliminary results from the TUS ultra-high energy cosmic ray orbital telescope: Registration of low-energy particles passing through the photodetector. Bull. Russ. Acad. Sci. Phys. 2017, 81, 407–409. [Google Scholar] [CrossRef]
- Franz, R.C.; Nemzek, R.J.; Winckler, J.R. Television Image of a Large Upward Electrical Discharge Above a Thunderstorm System. Science 1990, 249, 48–51. [Google Scholar] [CrossRef]
- Wescott, E.M.; Sentman, D.D.; Heavner, M.J.; Hampton, D.L.; Vaughan, O.H. Blue Jets: Their relationship to lightning and very large hailfall, and their physical mechanisms for their production. J. Atmos. Sol.-Terr. Phys. 1998, 60, 713–724. [Google Scholar] [CrossRef]
- Yair, Y.; Price, C.; Ziv, B.; Israelevich, P.L.; Sentman, D.D.; São-Sabbas, F.T.; Devir, A.D.; Sato, M.; Rodger, C.J.; Moalem, M.; et al. Space shuttle observation of an unusual transient atmospheric emission. Geophys. Res. Lett. 2005, 32, L02801. [Google Scholar] [CrossRef]
- Surkov, V.V.; Hayakawa, M. Underlying mechanisms of transient luminous events: A review. Ann. Geophys. 2012, 30, 1185–1212. [Google Scholar] [CrossRef]
- Neubert, T.; Rycroft, M.; Farges, T.; Blanc, E.; Chanrion, O.; Arnone, E.; Odzimek, A.; Arnold, N.; Enell, C.F.; Turunen, E. Recent Results from Studies of Electric Discharges in the Mesosphere. Surv. Geophys. 2008, 29, 71. [Google Scholar] [CrossRef]
- Pasko, V.P.; Yair, Y.; Kuo, C.L. Lightning Related Transient Luminous Events at High Altitude in the Earth’s Atmosphere: Phenomenology, Mechanisms and Effects. Space Sci. Rev. 2012, 168, 475–516. [Google Scholar] [CrossRef]
- Kuo, C.L.; Chen, A.B.; Lee, Y.J.; Tsai, L.Y.; Chou, R.K.; Hsu, R.R.; Su, H.T.; Lee, L.C.; Cummer, S.A.; Frey, H.U.; et al. Modeling elves observed by FORMOSAT-2 satellite. J. Geophys. Res. (Space Phys.) 2007, 112, A11312. [Google Scholar] [CrossRef]
- Cummer, S.A.; Jaugey, N.; Li, J.; Lyons, W.A.; Nelson, T.E.; Gerken, E.A. Submillisecond imaging of sprite development and structure. Geophys. Res. Lett. 2006, 33, L04104. [Google Scholar] [CrossRef]
- Stenbaek-Nielsen, H.C.; Moudry, D.R.; Wescott, E.M.; Sentman, D.D.; Sabbas, F.T.S. Sprites and possible mesospheric effects. J. Geophys. Res. 2000, 27, 3829–3832. [Google Scholar] [CrossRef]
- Garipov, G.K.; Panasyuk, M.I.; Rubinshtein, I.A.; Tulupov, V.I.; Khrenov, B.A.; Shirokov, A.V.; Yashin, I.V.; Salazar, H. Ultraviolet radiation detector of the MSU research educational microsatellite Universitetskii-Tat’yana. Instrum. Exp. Tech. 2006, 49, 126–131. [Google Scholar] [CrossRef]
- Klimov, P.A.; Garipov, G.K.; Khrenov, B.A.; Morozenko, V.S.; Barinova, V.O.; Bogomolov, V.V.; Kaznacheeva, M.A.; Panasyuk, M.I.; Saleev, K.Y.; Svertilov, S.I. Transient Atmospheric Events Measured by Detectors on the Vernov Satellite. Izv. Atmos. Ocean. Phys. 2017, 53, 924–933. [Google Scholar] [CrossRef]
- Christian, H.J.; Blakeslee, R.J.; Goodman, S.J.; Mach, D.A.; Stewart, M.F.; Buechler, D.E.; Koshak, W.J.; Hall, J.M.; Boeck, W.L.; Driscoll, K.; et al. The Lightning Imaging Sensor. In Proceedings of the 11th International Conference on Atmospheric Electricity, Untersville, AL, USA, 7–11 June 1999. [Google Scholar]
- Klimov, P.A.; Kaznacheeva, M.A.; Khrenov, B.A.; Garipov, G.K.; Bogomolov, V.V.; Panasyuk, M.I.; Svertilov, S.I.; Cremonini, R. UV Transient Atmospheric Events Observed Far From Thunderstorms by the Vernov Satellite. IEEE Geosci. Remote Sens. Lett. 2018, 15, 1139–1143. [Google Scholar] [CrossRef]
- Kuo, C.L.; Chen, A.B.; Chou, J.K.; Tsai, L.Y.; Hsu, R.R.; Su, H.T.; Frey, H.U.; Mende, S.B.; Takahashi, Y.; Lee, L.C. Radiative emission and energy deposition in transient luminous events. J. Phys. D Appl. Phys. 2008, 41, 234014. [Google Scholar] [CrossRef]
- Said, R.; Inan, U.; Cummins, K. Long-range lightning geolocation using a VLF radio atmospheric waveform bank. J. Geophys. Res. Atmos. 2010, 115. [Google Scholar] [CrossRef] [Green Version]
- Barrington-Leigh, C.P.; Inan, U.S. Elves triggered by positive and negative lightning discharges. Geophys. Res. Lett. 1999, 26, 683–686. [Google Scholar] [CrossRef] [Green Version]
- Newsome, R.T.; Inan, U.S. Free-running ground-based photometric array imaging of transient luminous events. J. Geophys. Res. Space Phys. 2010, 115. [Google Scholar] [CrossRef] [Green Version]
- Marshall, R.A.; Silva, C.L.; Pasko, V.P. Elve doublets and compact intracloud discharges. Geophys. Res. Lett. 2015, 42, 6112–6119. [Google Scholar] [CrossRef]
- Kaznacheeva, M.A.; Klimov, P.A.; Khrenov, B.A. Transient UV Background when Registering EASes with the TUS Orbital Detector. Bull. Russ. Acad. Sci. Phys. 2019, 83, 1024–1027. [Google Scholar] [CrossRef]
- Khrenov, B.A.; Stulov, V.P. Detection of meteors and sub-relativistic dust grains by the fluorescence detectors of ultra high energy cosmic rays. Adv. Space Res. 2006, 37, 1868–1875. [Google Scholar] [CrossRef]
Figure 1.
The TUS (Tracking Ultraviolet Setup) detector on board the Lomonosov satellite (a, an artist’s view). TUS on board the Lomonosov satellite covered with a protective cover during preflight preparations (b).
Figure 1.
The TUS (Tracking Ultraviolet Setup) detector on board the Lomonosov satellite (a, an artist’s view). TUS on board the Lomonosov satellite covered with a protective cover during preflight preparations (b).
Figure 2.
Snapshots of the focal plane show the arc-like shape and movement of an image of the elve registered on 23 August 2017, through the detector’s field of view. The snapshots were taken at 136 s, 168 s and 200 s from the beginning of the record. Colors denote the signal amplitude in ADC codes.
Figure 3.
Waveforms of several hit pixels of the elve registered on 23 August 2017, above Pacific Ocean.
Figure 3.
Waveforms of several hit pixels of the elve registered on 23 August 2017, above Pacific Ocean.
Figure 4.
Example of a multi-elve. (a): waveforms of two pixels (15th and 16th) in the second module. (b): a pixel map at time 132 s from the beginning of the record.
Figure 4.
Example of a multi-elve. (a): waveforms of two pixels (15th and 16th) in the second module. (b): a pixel map at time 132 s from the beginning of the record.
Figure 5.
Waveforms of a “monotonously growing” flash in three pixels. The same kind of waveforms is observed in the majority of channels.
Figure 5.
Waveforms of a “monotonously growing” flash in three pixels. The same kind of waveforms is observed in the majority of channels.
Figure 6.
Geographical distribution of monotonously growing flashes measured by the TUS detector. A correlation with some thunderstorm regions, especially on oceans, can be seen.
Figure 6.
Geographical distribution of monotonously growing flashes measured by the TUS detector. A correlation with some thunderstorm regions, especially on oceans, can be seen.
Figure 7.
Waveforms of three channels for the unusual bright far-from-thunderstorm event measured by TUS on 28 July 2017.
Figure 7.
Waveforms of three channels for the unusual bright far-from-thunderstorm event measured by TUS on 28 July 2017.
Figure 8.
Cloud top temperatures by GOES-13 on July 28th, 2017 at 00:45 UTC near the TUS FOV centered at the event shown in
Figure 7 position. The black star shows the position of the event.
Figure 8.
Cloud top temperatures by GOES-13 on July 28th, 2017 at 00:45 UTC near the TUS FOV centered at the event shown in
Figure 7 position. The black star shows the position of the event.
Figure 9.
Waveforms of three pixels in the event registered on 27 June 2016, above India (S, E).
Figure 9.
Waveforms of three pixels in the event registered on 27 June 2016, above India (S, E).
Figure 10.
Snapshots of the focal plane for the event presented in
Figure 9. Snapshots were made at
ms, 40 ms, and 88 ms from the beginning of the record. Colors denote ADC counts.
Figure 10.
Snapshots of the focal plane for the event presented in
Figure 9. Snapshots were made at
ms, 40 ms, and 88 ms from the beginning of the record. Colors denote ADC counts.
Figure 11.
Example of short single pulse events (top) and series of pulses (bottom) and their respective geographical distributions.
Figure 11.
Example of short single pulse events (top) and series of pulses (bottom) and their respective geographical distributions.
Figure 12.
UV flash with a complicated temporal structure (a) and a map of pixels for this event (b).
Figure 12.
UV flash with a complicated temporal structure (a) and a map of pixels for this event (b).
Figure 13.
Waveforms of a few hit pixels of the meteor measured on 3 January 2017 at 14:31:08 UTC.
Figure 13.
Waveforms of a few hit pixels of the meteor measured on 3 January 2017 at 14:31:08 UTC.
Figure 14.
Waveforms of two events registered in the meteor mode: a series of UV flashes above a thunderstorm (a), a far-from-thunderstorm event (b), see the text.
Figure 14.
Waveforms of two events registered in the meteor mode: a series of UV flashes above a thunderstorm (a), a far-from-thunderstorm event (b), see the text.
Figure 15.
Example of Aurora light measurements. The (a,b) show waveforms of two hit pixels during the TUS passage above the aurora oval. The (c) shows a pixel map in the same passage above the aurora. The (d) shows density of electron flux in the polar region causing the polar light, see the text.
Figure 15.
Example of Aurora light measurements. The (a,b) show waveforms of two hit pixels during the TUS passage above the aurora oval. The (c) shows a pixel map in the same passage above the aurora. The (d) shows density of electron flux in the polar region causing the polar light, see the text.
Figure 16.
(a): a snapshot of the focal plane of an event registered above anthropogenic lights, see the text for details. (b): a snapshot of the focal plane adjusted to the TUS geographical position and orientation and superimposed on the Google map around Greece.
Figure 16.
(a): a snapshot of the focal plane of an event registered above anthropogenic lights, see the text for details. (b): a snapshot of the focal plane adjusted to the TUS geographical position and orientation and superimposed on the Google map around Greece.
Figure 17.
(a): a waveform measured above Greece on 21 August 2016 at 21:57:21 UTC. (b): the result of its Fourier analysis.
Figure 17.
(a): a waveform measured above Greece on 21 August 2016 at 21:57:21 UTC. (b): the result of its Fourier analysis.
Table 1.
The number of events and time of operation of the TUS detector in different modes.
Table 1.
The number of events and time of operation of the TUS detector in different modes.
| Mode (Temporal Resolution) | Time of Operation | Number of Measured Events |
|---|
| EAS (0.8 s) | 286 days (∼14 months with technological breaks) | 78,131 |
| TLE-1 (25.6 s) | 3 days | 185 |
| TLE-2 (0.4 ms) | 19 days | 1708 |
| Meteor (6.6 ms) | 37 days | 11,149 |
Table 2.
Meteors measured by the TUS detector.
Table 2.
Meteors measured by the TUS detector.
| Date | Time (UTC) | Latitude | Longitude |
|---|
| 3 January 2017 | 14:31:08 | 53.8 N | 138.9 E |
| 5 January 2017 | 16:54:56 | 16.8 N | 95.2 E |
| 6 January 2017 | 18:09:26 | 11.7 S | 72.8 E |
| 30 December 2016 | 19:44:46 | 9.4 S | 49.3 E |
| 31 December 2016 | 05:06:54 | 2.1 N | 89.7 W |
| 18 March 2017 | 10:56:39 | 14.1 N | 176.3 W |
| 21 March 2017 | 01:35:37 | 45.5 N | 30.4 W |
| 11 November 2017 | 02:22:15 | 0.18 N | 51.8 W |
| 11 November 2017 | 11:47:16 | 0.22 S | 166.89 E |
© 2019 by the authors. Licensee MDPI, Basel, Switzerland. This article is an open access article distributed under the terms and conditions of the Creative Commons Attribution (CC BY) license (http://creativecommons.org/licenses/by/4.0/).

 ,
, 


