Article

Impact of Urbanization and Climate on Vegetation Coverage in the Beijing–Tianjin–Hebei Region of China

1
State Key Laboratory of Remote Sensing Science, Jointly Sponsored by Beijing Normal University and Institute of Remote Sensing and Digital Earth of Chinese Academy of Sciences, Beijing 100875, China
2
Beijing Engineering Research Center for Global Land Remote Sensing Products, Institute of Remote Sensing Science and Engineering, Faculty of Geographical Science, Beijing Normal University, Beijing 100875, China
3
College of Urban and Environmental Sciences, Peking University, Beijing 100871, China
4
Department of Industrial and Systems Engineering, University of Tennessee, Knoxville, TN 37996, USA
5
College of Geography and Tourism, Anhui Normal University, Wuhu 241002, China
*
Author to whom correspondence should be addressed.
Remote Sens. 2019, 11(20), 2452; https://0-doi-org.brum.beds.ac.uk/10.3390/rs11202452
Submission received: 1 September 2019 / Revised: 14 October 2019 / Accepted: 19 October 2019 / Published: 22 October 2019
(This article belongs to the Special Issue Remote Sensing of Human-Environment Interactions)

Abstract

:
Worldwide urbanization leads to ecological changes around urban areas. However, few studies have quantitatively investigated the impacts of urbanization on vegetation coverage so far. As an important indicator measuring regional environment change, fractional vegetation cover (FVC) is widely used to analyze changes in vegetation in urban areas. In this study, on the basis of a partial derivative model, we quantified the effect of temperature, precipitation, radiation, and urbanization represented as nighttime light on vegetation coverage changes in the Beijing–Tianjin–Hebei (BTH) region during its period of rapid resident population growth from 2001 to 2011. The results showed that (1) the FVC of the BTH region varied from 0.20 to 0.26, with significant spatial heterogeneity. The FVC increased in small cities such as Cangzhou and in the Taihang Mountains, while it decreased in megacities with populations greater than 1 million, such as Beijing and Zhangjiakou Bashang. (2) The BTH region experienced rapid urbanization, with the area of artificial surface increasing by 18.42%. From the urban core area to the fringe area, the urbanization intensity decreased, but the urbanization rate increased. (3) Urbanization and precipitation had the greatest effect on FVC changes. Urbanization dominated the FVC changes in the expanded area, while precipitation had the greatest impacts on the FVC changes in the core area. For future studies on the major influencing factors of FVC changes, quantitative analysis of the contribution of urbanization to FVC changes in urban regions is crucial and will provide scientific perspectives for sustainable urban planning.

Graphical Abstract

1. Introduction

Urbanization, as an important indicator of socioeconomic development, is a general phenomenon of globalization and leads to various changes in the ecological environment [1,2,3,4,5,6,7]. Urbanization is characterized primarily by a drastic demographic move from rural to urban areas and physical urban area expansion [8]. Urbanization has grown rapidly in recent years. In 1900, only 10% of the world’s population were urban residents. In 2008, the proportion of urban residents was over 50%, and this value will increase even more in the next 50 years [9,10]. Urbanization promotes socioeconomic development and attracts more people to move to cities, which leads to increased human activities and land cover change [11]. Urbanization offers opportunities and challenges for the sustainable transition to a long-term balance between the needs of human survival and the environmental loads. Rapid urbanization leads to socioeconomic development but also causes a series of urban ecological environmental problems, such as urban heat islands, land cover changes, vegetation coverage changes, and increases in urban patch diversity [12,13,14,15]. Therefore, the impact of natural factors and human activities on the urban ecological environment during the process of urbanization is of great significance.
In the terrestrial ecosystem affected by urbanization, vegetation is an important part that can timely reflect the impact of urbanization [16]; therefore, it is important to study the changes in vegetation during urban expansion [17]. However, few studies have quantitatively investigated the impacts of urbanization on vegetation coverage. The existing research findings concern fractional vegetation cover (FVC) changes in regions with land cover change; however, few studies have been conducted on the effects of different urbanization intensities and rates on FVC [18,19]. In the process of urbanization, vegetation is mainly affected by two types of factors: climate factors (e.g., temperature, precipitation, and radiation) [20,21,22,23,24], which offer the necessary conditions for vegetation growth, and disturbance caused by human activities, especially land cover change [25,26,27,28,29,30]. To study the effect of urbanization on vegetation coverage, it is necessary to separate the interaction effect of urbanization and climate on vegetation coverage during the process of urban expansion.
The Beijing–Tianjin–Hebei (BTH) metropolitan region is the most significant area of urbanization in China [31,32], and the region experienced its fastest population growth from 2000 to 2010 [33]. Its urban expansion and population growth led to an increasing demand for resources and energy. The impact of urbanization on the ecological environment has also become a hot topic in the BTH region. For example, Li et al. showed that the built-up area of the BTH region had expanded and the vegetation coverage decreased, which led to the reduction of water yield [34]. Hou et al. verified that the vegetation coverage in the BTH region was high, but an obvious degrading trend and a significant seasonal difference were found; also, the rate of degradation was 6.71% [35].
The abovementioned studies have the following shortcomings: (1) They mainly consider the impact of climate change on vegetation but do not consider the impact of human activities, such as urbanization, when studying the major impact factors of changes in vegetation coverage. (2) Currently, many studies use land cover data to represent urbanization. However, this method is limited by data accuracy and time seriality and cannot quantify the urban expansion area exactly. Existing land cover data, such as the MODIS land-cover-type product, usually can only map urban areas but cannot show the intensity of urbanization through processing. (3) Urban areas are not divided into different urbanization intensities, so it is impossible to judge the leading factors of FVC changes in areas with different urbanization intensities.
This study quantitatively calculated the contribution of climate change and urbanization to FVC changes in the BTH region and distinguished the primary factors of FVC spatiotemporal change during the rapid population growth from 2001 to 2011. The spatiotemporal variations of vegetation coverage in the BTH region were analyzed on the basis of the Global LAnd Surface Satellite (GLASS) FVC data. The value of the nighttime light (NTL) data collected from the Defense Meteorological Program Operational Linescan System (DMSP/OLS) was used to represent the intensity of urbanization [36,37]. Combined with the data from the BTH meteorological stations, the contribution of urbanization and climate change to FVC changes was calculated using a partial derivative model, and the main influencing factors of FVC changes were determined [38]. The purpose of this study was to analyze the contribution of urbanization and climate to vegetation coverage and to provide scientific perspectives for urban sustainable development.

2. Study Area and Data

2.1. Study Area

The BTH region, also known as the Jing-Jin-Ji region, is a metropolitan city agglomeration with a total area of up to 217,158 km²; it includes Beijing, Tianjin, and 11 prefecture-level cities in Hebei Province. The BTH region is the largest and most dynamic region in the north of China adjacent to the Bohai Sea (Figure 1). The meteorological condition of the BTH region is characterized by a typical temperate monsoon climate with rainy summers and dry winters. The city agglomeration has experienced rapid population growth in the past decade [33]. As one of the largest urban agglomerations in China’s eastern coastal region, the BTH region has very dynamic economic activities. It has become a hot spot for studies on urbanization in China due to its rapid population growth and urban expansion [39,40]. In order to better demonstrate the impact of urbanization on vegetation cover, six megacities with populations greater than 1 million (based on the records of the 2012 China City Statistical Yearbook [41]) were chosen as our target cities, namely, Beijing (BJ), Tianjin (TJ), Shijiazhuang (SJZ), Handan (HD), Tangshan (TS), and Baoding (BD) (Figure 1). The remaining seven smaller cities, namely, Zhangjiakou (ZJK), Xingtai (XT), Hengshui (HS), Cangzhou (CZ), Langfang (LF), Chengde (CD), and Qinghuangdao (QHD), were used as a comparison group for the larger cities.

2.2. Data

2.2.1. GLASS FVC Data

The FVC data used in this study were obtained from the GLASS products offered by Beijing Normal University [42]. The MODIS reflectance data reprocessing method developed by Tang et al. [43] was used to produce reliable reflectance data before GLASS FVC generation. The method first used MODIS snow and cloud mask data and other supplementary information to identify the data polluted by fallout clouds undetected in the MODIS reflectance data. Then, a temporospatial filtering method was used to remove the contaminated data, and an optimum interpolation algorithm was used to fill the missing data and obtain the final surface reflectance values for earth surface parameter estimation [43]. The machine learning method was used to train the relation model from the pretreated reflectivity to the FVC value. The FVC products produced by this model were in the standard format of the Hierarchical Data Format derived by the Earth Observing System (HDF-EOS), with a sinusoidal projection and global coverage. The temporal resolution was 8 days, and the spatial resolution was 500 m. The FVC product was validated by the time series of field FVC measurements in an agricultural region in the Heihe Basin of Northwest China, and the result showed that the GLASS FVC had high accuracy, with an R2 = 0.86 and a root-mean-square error (RMSE) = 0.087 [44]. These data can be used to evaluate the spatiotemporal distribution and change trend of surface vegetation cover. GLASS FVC data ensure time seriality and complete global coverage, which is suitable for studying changes in regional vegetation coverage. In this study, GLASS FVC data for every 8 days from 2001 to 2011 were synthesized on an annual scale. Then, the annual data were used to calculate the average vegetation coverage to characterize the vegetation state of the BTH region.

2.2.2. Nighttime Light Data

NTL data are the light data collected by the DMSP/OLS [45]. The NTL data used in this study were the Version 4 DMSP/OLS NTL product [46], with a spatial resolution of 1 km from 2000 to 2011, in which the data in 2000 and 2010 were used to extract the core, expanded, and fringe area boundaries of the city. The trend in the NTL data from 2001 to 2011 represents the urbanization rate. Because the NTL data offered by DMSP/OLS can measure the light signals of the earth’s surface, such as that from human settlements, gas torches, flames, and lights of ships, these data have been used to characterize urbanization in many studies [47,48]. With a long history that can be traced back to 1972, DMSP/OLS provides valuable data for monitoring the expansion of urbanization on a global scale based on the same onboard design and continuous space platform of its sensors [49,50,51,52]. To ensure that every part of our study area has human activities, we excluded pixels without light (Digital Number (DN) = 0). In addition, an invariant target area detection method [53] was used for image correction to ensure that the data were useful. Using this method, we obtained a nighttime light data time series with comparable DN values, which was used to represent urbanization. Because the units between urbanization and climate data are not uniform and the data range is wide, we normalized the NTL data.

2.2.3. Meteorological Data

The meteorological data used in this study were the monthly surface temperature, precipitation, and radiation data from 23 meteorological stations in the BTH region. We selected the decade period from 2001 to 2011. The data were offered by China’s meteorological data sharing network (accessed at http://data.cma.cn/data/detail/dataCode/A.0029.0004.html). In this study, the simple kriging interpolation method [54] was used to interpolate the data to a spatial resolution of 1 km, and then the annual data were calculated from the monthly data. The data have undergone quality control procedures to eliminate erroneous and homogenous assessment [55]. Further, we normalized the meteorological data in order to unify the data range.

2.2.4. GlobeLand30 Land Cover Data

GlobeLand30 covers global surfaces and has a resolution of 30 m. The product was generated by an operational mapping method on the basis of a pixel-object-knowledge (POK) approach [56]. The classification system of the product included 10 land cover types in 2000 and 2010 [57]. The classification product was determined based on Landsat TM, ETM+, and HJ-1 data. The overall classification accuracy was over 80% [58]. GlobeLand30 land cover data were used to calculate the FVC of different land cover types and the transition of land use in the past decade in the BTH region.

3. Methods

3.1. Z-Score Model Normalization

In our study, the GLASS FVC data, nighttime light data, and meteorological data had different data ranges and units. In order to unify the data ranges and make the data comparable, a Z-score model was used to standardize these data [59]:
Z V = x μ σ
where ZV indicates the FVC value after normalization, x represents the FVC data that needed to be normalized, μ indicates the mean FVC, and σ denotes the standard deviation of FVC. The normalization of the nighttime light and meteorological data was the same as that used to normalize the FVC.

3.2. Mapping Urban Area

In this study, DMSP/OLS data in 2000 and 2010 were used to extract the built-up areas of the cities using the cluster-based method used by Zhou et al. [60]. The optimal threshold was derived from the following formula [60]:
N T L t h l d = 1 1 + e α ( γ γ m e a n ) ( N T L m a x N T L m i n ) + N T L m i n
where NTLthld is the optimal threshold to delineate the urban area in the potential cluster, NTLmin and NTLmax are minimum and maximum NTL DN in the study area, respectively, α is the coefficient for the logistic model, and γ indicates the lighting magnitude within a certain cluster size.
When the urban areas mapped by a certain threshold were consistent with the urban areas mapped by the classified data, this threshold was considered to be the optimal threshold. α was derived by the optimal threshold, and the coefficient α was 0.22 in China. Then, the optimal threshold was derived by Formula (2). Those areas with values larger than the optimal threshold were defined as urban built-up areas, while the others were defined as nonurban areas [60]. The core area was mapped by DMSP/OLS in 2000, and it was defined as the central zone of the city. The expanded area indicated the area where the fringe area in 2000 changed into the core area in 2010. The fringe area was characterized by the buffer zone, the area of which was equal to the urban area mapped in 2010. The core, expanded, and fringe areas also denoted the initial, middle, and final stage of urban expansion, respectively.

3.3. Interannual Variability

A linear regression model was used to calculate the interannual variability by minimizing the sum-of-squares errors. Taking the FVC time series data as an example, the interannual variability was the slope of the fit line after the least-squares regression of the pixel’s multiyear value. The formula for calculating the slope is as follows [38]:
K V = n × i = 1 n i × V i i = 1 n i i = 1 n V i n × i = 1 n i 2 ( i = 1 n i ) 2
where K V indicates the interannual variability of FVC, n denotes the total number of years, i represents the ith year, and V i represents the FVC value in the ith year. A positive variability represents an increasing trend in the FVC, while a negative variability represents a decrease in the FVC.
The F test was used to test the significance of FVC variability, and the calculation formula is as follows:
F = U × ( n 2 ) Q
where Q = i = 1 n ( y i y i ^ ) 2 represents the sum-of-squares error, U = i = 1 n ( y i ^ y i ¯ ) 2 indicates the regression square sum, y i represents the FVC value in the ith year, y i ^ represents the FVC regression value in the ith year, y i ¯ represents the mean FVC across all years, and n represents the total number of years. The calculation of the urbanization and climate factor interannual variation rate was the same as that used to calculate the FVC.

3.4. Attribution Analysis

Urbanization and climate factors are the primary factors affecting FVC changes [35], and the influence of each factor corresponding to each pixel on the interannual FVC variation of the pixel can be expressed by the following formula [38]:
K V = C ( U ) + C ( T ) + C ( P ) + C ( R ) + C ( O )
where K V indicates the interannual variability of the FVC, and C(U), C(T), C(P), C(R), and C(O) denote the contributions of urbanization, temperature, precipitation, radiation, and other factors to the annual variation of the FVC, respectively. The contribution of urbanization to the annual variation of the FVC was calculated by the following formula:
C ( U )   =   F V C U × K U
where K U represents the interannual variability of urbanization, and F V C U indicates the sensitivity of FVC to urbanization. This sensitivity term was derived as a partial derivative via the multiple regression of FVC on climate factors and NTL. Positive and negative sensitivity values represent the correlation between urbanization and FVC, specifically. The value of sensitivity represents the degree of correlation, and larger values indicate stronger correlations between urbanization and FVC changes. In contrast, smaller values indicate weaker correlations. The calculation of other factors contributing to FVC changes was the same. The partial derivative considers the interaction of multiple factors, which can comprehensively consider the joint effects of multiple factors on FVC change and evaluates the joint effects of multiple influencing factors on FVC.
To make the contributions of different factors to FVC changes comparable, the contributions of each factor were absolutized, so as to obtain the comparable and cumulative contributions of each factor, and the calculation formula is as follows:
P ( U )   =   | C ( U ) | | C ( U ) | + | C ( T ) | + | C ( P ) | + | C ( R ) | + | C ( O ) | × 100 %
P ( O ) = 100 % P ( U ) P ( T ) P ( P ) P ( R )
where P(U), P(T), P(P), P(R), and P(O) indicate the contributions of urbanization, temperature, precipitation, radiation, and other factors, respectively, and the same is true for the calculation of the contribution of other factors to the annual variation of the FVC.

4. Results

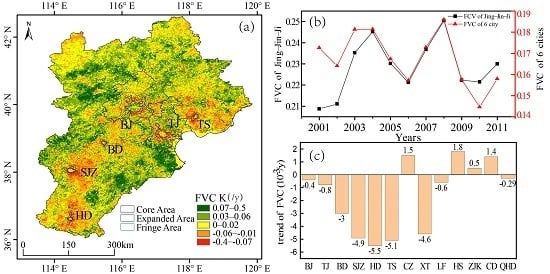
4.1. The Distribution of FVC in the BTH Region

The spatial distribution of FVC in the BTH region from 2001 to 2011 is shown in Figure 2a. The Taihang Mountains had the highest vegetation coverage, which ranged from 0.4 to 0.5. Beijing, Tianjin, Tangshan, Baoding, Handan, and Shijiazhuang had the lowest vegetation coverage values, which ranged from 0 to 0.1. The FVC values of the other areas were between the FVC values of six cities and mountains. The distribution rules of the FVC in the six large cities were similar, increasing from the core area to the expanded area. The FVC values in the core areas were all below 0.1, while the values were between 0.1 and 0.2 in the expanded area. The vegetation coverage in the fringe area was the highest (Figure 2d). The FVC in 13 cities declined in stages except in Tianjin (Figure 2c), but the drop in the second phase was larger than in the first. The FVC in all cities showed a downward trend from 2001 to 2011.
The land cover in the BTH region was mainly cultivated land, while the Taihang Mountains were mainly covered by forest and shrubland. The North China Plain in the southeast of the Taihang Mountains was mostly artificial surface, cultivated land, and water bodies. The land cover in Zhangjiakou was mainly cultivated land and grassland. According to the statistics of the average FVC of all land cover types (Figure 2b), the average FVC of cultivated land, forest, grassland, water bodies, artificial surface, and bareland were 0.20, 0.30, 0.21, 0.13, 0.12, and 0.13, respectively, among which the type with the lowest FVC was artificial surface. The annual mean of FVC was generally less than the mean of the growing season, and the average FVC values of forest and grassland in the growing season were 0.35 and 0.34, respectively.
According to the spatial variation figure of FVC (Figure 3a), 66.12% of the regional FVC increased and 33.88% decreased from 2001 to 2011. The increased areas were mainly natural areas with fewer human activities, which were mainly distributed in CZ, HS, and the Taihang Mountains. The reduced areas were mainly distributed in the surrounding areas of Beijing, Tianjin, Shijiazhuang, Tangshan, Baoding, and the Zhangjiakou Bashang. Due to strong human disturbances, such as overgrazing and over-reclamation, the FVC in Zhangjiakou Bashang had decreased, and desertification was becoming increasingly serious. In addition, the FVC in the core areas of Beijing showed an upward trend from 2001 to 2011, which was completely opposite to the obvious downward trend in the core areas of other cities.
According to the temporal variation of the FVC (Figure 3b), the average FVC from 2001 to 2011 in the BTH region was stable, with a small range from 20.87% to 25.83%. The years with high FVC values were 2004 and 2008, and the years with low FVC values were 2006 and 2010.
The FVC values of the six large cities were decreasing (Figure 3c), but the rate of FVC decrease varied across the different cities. In Handan, the rate of FVC reduction was the highest, at 0.54%. In contrast, the rate of FVC loss in Beijing was the smallest among the six cities, with a value of 0.041%. The six major cities ranked from highest to lowest FVC reduction are as follows: Handan, Tangshan, Shijiazhuang, Baoding, Tianjin, and Beijing, which was related to the urbanization intensity and mode. Areas with significant FVC increases were mainly located in small cities such as HS and CZ.

4.2. Urban Expansion Model

Figure 4 shows the changes of the urban area from 2001 to 2011, which reflect the rapid urban expansion of the BTH region over the past decade. Figure 5 shows the urbanization intensity and rate in the BTH region from 2001 to 2011. The six large cities had the maximum urbanization intensity, and Beijing and Tianjin were the most obvious. Although the core area of each of the six cities had the highest urbanization intensity, from 2001 to 2011, the urban core areas had the slowest growth rate of urbanization intensity, and the expanded areas had the fastest urbanization intensity growth rates, while the fringe areas had moderate values between the others. Compared with the expanded areas of other cities, the urbanization intensity growth rates in the expanded areas of Beijing and Tianjin were higher. The rate of urbanization intensity growth in the BTH region increased from 2001 to 2011.
From the changes in land cover types in the BTH region (Figure 1), it can also be seen that, from 2001 to 2011, the proportion of cultivated land and water decreased by 1.74% and 0.09%, respectively, among which the proportion of cultivated land decreased the most. The proportions of forests, grasslands, shrublands, wetlands, artificial land, and bareland all increased from 2000 to 2010, and there were 1.27% increases in artificial land. From the transfer matrix of land use types from 2000 to 2010 (Table 1), it can be seen that much cultivated land was converted into artificial surface in the BTH region (14.56%). The percentages of forests, grasslands, wetlands, and water bodies converted to artificial surfaces were 5.62%, 27.72%, 2.04%, and 9.32%, respectively. In areas with strong human activities, a variety of land cover types were transformed into artificial surfaces, and the expansion of artificial surfaces was obvious. The urbanization process will inevitably lead to changes in the underlying surface, which will change the vegetation cover.

4.3. Contribution of Urbanization to FVC Variation

In the BTH region, urbanization and precipitation had the highest contributions to the FVC changes, accounting for 36.12% and 25.61%, respectively, and there were significant differences in different urban areas (Figure 6f). The contributions of temperature and radiation to the FVC changes were small (10.78% and 10.19%, respectively).
According to the contribution of each factor to the FVC changes in the BTH region (Figure 6), there was little difference in the contribution of precipitation and urbanization to FVC changes, but there was still a significant difference in the spatial distribution. In terms of the spatial distribution, climate factors mainly affected the core areas of the six large cities. In urban areas, the contribution of each factor was different. In the Beijing core area, climate factors dominated the FVC changes; in the core areas of the other five cities, the influence of other factors not considered in this paper was dominant, and the contribution of urbanization in the core area was small. In urban expanded areas and fringe areas, urbanization played a leading role in FVC changes.
The contributions of temperature, precipitation, radiation, urbanization, and other factors to FVC in different areas of each city were calculated (Figure 7). Precipitation was the leading factor of FVC changes in the core area of Beijing, accounting for 48.63%. The main influencing factors of FVC changes in the core areas of the six cities other than Beijing were the other factors (e.g., artificial planting and irrigation systems) not considered in this study, which had values between 33.91% and 59.36%. The contribution of urbanization in the core areas of the six cities was small, ranging from 3.63% to 14.69%. In urban extension areas, urbanization played a leading role in FVC changes, reaching 46.36% in Shijiazhuang and 28.6–46.36% in the other cities. The contribution of other factors not considered in this study was larger than that of precipitation except in Beijing. In the fringe areas of the city, the dominant factor was urbanization; the maximum contribution of urbanization was 47.25% in Tangshan, and the values ranged from 32.3% to 47.25% in the other cities. In Beijing, Tangshan, and Handan, the contribution of precipitation was greater than that of the other factors. The effect of urbanization in the core area of small cities on FVC was greater than that in big cities. Through the variance analysis of the impact of urbanization on FVC in big and small cities, we found that the difference was significant (F crit = 4.8, F = 5.2, p = 0.04).

5. Discussion

This study analyzed the spatiotemporal dynamics of FVC in the BTH region from 2001 to 2011 using a partial derivative model and quantitatively analyzed the contributions of human activities and climate factors to FVC changes. The FVC in the BTH region was higher in the north. The areas with high FVC values were in the Taihang Mountains and small cities, such as HS and CZ, while the areas with low FVC values were mainly in the surrounding areas of the core areas of the six large cities and the Zhangjiakou Bashang area. This result is consistent with the FVC distribution of the BTH region studied in the past [61]. The area with a significantly increased FVC was in the natural area with fewer human activities, and these areas were concentrated in the Taihang Mountains and in small cities such as HS. Urbanization induces urban heat islands, thus leading to an increase in FVC [62]. The increase in the FVC in this region was related to the implementation of the sandstorm source control project, the policy of returning farmland to forest, and the closing of mountains for forest cultivation [40,63,64]. The area where the FVC decreased was mainly distributed in the six cities and surrounding areas. The cultivated land and grassland in these areas were converted to artificial surfaces during rapid urbanization. In addition, due to the influence of human activities, such as overgrazing and over-reclamation, the ecosystem in the Zhangjiakou Bashang area was seriously damaged, leading to a significant decline in the FVC and increasingly serious desertification. The result of this study is consistent with previous research results. For example, Wang et al. (2017) [65] proved that vegetation coverage tended to increase from 2000 to 2010. However, there was obvious spatial heterogeneity. The FVC decreased in large cities such as Beijing and Tianjin, while it increased in small cities such as Hengshui and Cangzhou. In this study, we found that there were different FVC variations in different cities. For example, in the six cities we studied, the city with the largest decrease in FVC was Handan, followed by Tangshan, Shijiazhuang, Baoding, Tianjin, and Beijing. We think that this result is related to the urbanization intensity and rate. Sun et al. (2018) [32] had proved that the urban expansion rates of cities were inversely related to city size in general from 1978 to 2015, with an exception only from 2005 to 2010. Beijing and Tianjin have a higher urbanization intensity and slower urban expansion rates, which lead to better planning of vegetation coverage and less human damage.
Based on the results of the quantitative research in this study, we believe that, in the core areas of cities, climate is the main factor leading to the changes in FVC, among which precipitation contributes most to the changes in FVC. In the urban core area, there are strong human activities, high urbanization intensity, and low FVC. The increase in urbanization has little impact on FVC changes, and climate factors contribute more to changes in vegetation coverage. Among climate factors, precipitation contributes the most. Yan et al. [66] mentioned that their quantitative analysis results based on geographical detectors showed that precipitation was the leading factor of the normalized difference vegetation index (NDVI) spatial distribution on the annual scale in the BTH region, explaining 39.4% of the vegetation changes, and the interaction between land use and precipitation had the most obvious influence on the NDVI, explaining 58.2% of the vegetation changes, which is consistent with the leading influence factor of the FVC in this study. Meng et al. [67] used partial and multiple correlation methods to research the BTH region’s NDVI variation characteristics and driving forces, and the results showed that the influence of precipitation on vegetation was greater than that of temperature. This result is consistent with our results, which showed that the leading climate factor is precipitation, and the changes in FVC are mainly driven by nonclimate factors, similar to the conclusion of our study. In urban expanded and fringe areas, urbanization is the main factor causing the changes in FVC. Urban expansion has led to a reduction of FVC in urban expanded and fringe areas, chiefly because urbanization has encroached on a large amount of high-quality cultivated land and forest land around the city.
The urban core area has high urbanization intensity, and the vegetation in this area is mainly planted by humans; thus, vegetation is minimally impacted by urbanization due to perfect planning, artificial planting, and irrigation systems, which were represented as other factors. However, the BTH region is located in the North China Plain, where the annual rainfall amount is very low, and yet precipitation is still the dominant factor influencing FVC changes. In this study, the leading factor of FVC changes in the urban core area was found to be precipitation. Therefore, the change trend of FVC and precipitation was analyzed in this study (Figure 8a). The analysis results showed that the FVC in the core area had a good positive correlation with precipitation, which explained why precipitation was the leading factor in the core area. In urban expanded areas, urbanization was the leading factor of FVC changes. Therefore, this study analyzed FVC change trends and urbanization change trends in the expanded areas (Figure 8b). The results showed that there was a negative correlation between FVC changes and urbanization.
So far, there have been several studies on the influence of climate change on FVC. In our study, the contributions of multiple factors to FVC were quantitatively calculated based on mathematical statistics at the pixel scale. Moreover, urbanization was considered in the influencing factors of FVC changes, and urbanization intensity was quantitatively represented by NTL data, which represented an improvement in this study. However, our study still has shortcomings. (1) Changes in FVC represent a complex process that is affected by many factors (e.g., vegetation species, temperature, precipitation, carbon dioxide, ozone, and nitrogen content) [25,27,29,68,69]. In this study, only climate factors and urbanization were considered. The influence factors not considered were replaced by other factors without specific analysis. (2) This research used NTL data to represent urbanization intensity. However, it has not been verified whether these data can accurately evaluate urban intensity because of their low spatial resolution. Due to the limitation of time length, only the decade of rapid resident growth in the BTH region was considered, and the time series length was small; thus, the influence of data volume on relevant calculation results remains to be evaluated. (3) The method used in this study was a partial derivative regression, and the results cannot be evaluated with uncertainty. Our understanding of the impact of different driving forces on vegetation dynamics is still limited by the available data. The time span of data used in this study is still limited, being only from 2001 to 2011. If longer time series lighting data were obtained, the effects of urbanization with different intensities on vegetation cover could be analyzed more accurately. In future studies, we will consider the factors contained in the other factors not considered in this study and lengthen the study period. At the same time, other attribution models that reduce the interaction of factors will be used. It is necessary to further study how to more effectively quantify the respective impacts of climate and human factors and establish the quantitative effects of different human activities.

6. Conclusions

This study analyzed the temporal and spatial FVC distribution and its change characteristics in the BTH region based on remote sensing data and quantitatively studied the contribution of human activities and climate changes to FVC changes using a partial derivative model. The following main conclusions have been drawn.
(1) The FVC of the BTH region varied from 0.20 to 0.26, but there was a large spatial difference. The areas with increased FVC values were in small cities such as Cangzhou and Hengshui as well as the Taihang Mountains, while the areas with decreased FVC values were mainly in large cities with population sizes greater than 1 million, such as in Beijing, Tianjin, and the surrounding areas, as well as in Zhangjiakou Bashang. (2) The BTH region has experienced rapid urbanization, with the area of artificial surface increasing by 18.42%. At the same time, the urbanization intensity from the urban core area to the fringe area has increased, but the rate of urbanization expansion has decreased. (3) Urbanization and precipitation have the greatest effect on FVC changes. In the expanded area, urbanization dominates the changes in FVC, while in the core area, precipitation is most influential.
In general, we used a mathematical statistics method to quantitatively estimate the contributions of urbanization, temperature, precipitation, and radiation to FVC changes. When studying the spatial and temporal distribution differences in FVC, the intensity and rate of urbanization will help us understand the impact of human activities on FVC changes and provide a data basis for formulating scientific urbanization policies.

Author Contributions

Q.Z. and X.Z. conceived of and designed the experiments. Q.Z. processed and analyzed the data. All authors contributed to the ideas, writing, and discussion.

Funding

This study was supported by the National Key Research and Development Program of China (Nos. 2016YFB0501404 and 2016YFA0600103).

Acknowledgments

The authors thank Qian Wang, Jianghai Peng, and Qi Zeng for helpful comments that improved this manuscript and Yuyu Zhou for providing the urban area data.

Conflicts of Interest

The authors declare no conflict of interest.

References

  1. Chaolin, G.; Liya, W.; Cook, I. Progress in research on Chinese urbanization. Front. Archit. Res. 2012, 1, 101–149. [Google Scholar] [CrossRef] [Green Version]
  2. Bai, X.; McAllister, R.R.; Beaty, R.M.; Taylor, B. Urban policy and governance in a global environment: Complex systems, scale mismatches and public participation. Curr. Opin. Environ. Sustain. 2010, 2, 129–135. [Google Scholar] [CrossRef]
  3. Camagni, R.; Gibelli, M.C.; Rigamonti, P. Urban mobility and urban form: The social and environmental costs of different patterns of urban expansion. Ecol. Econ. 2002, 40, 199–216. [Google Scholar] [CrossRef]
  4. Creutzig, F.; Baiocchi, G.; Bierkandt, R.; Pichler, P.-P.; Seto, K.C. Global typology of urban energy use and potentials for an urbanization mitigation wedge. Proc. Natl. Acad. Sci. USA 2015, 112, 6283–6288. [Google Scholar] [CrossRef] [Green Version]
  5. Deng, X.; Huang, J.; Rozelle, S.; Zhang, J.; Li, Z. Impact of urbanization on cultivated land changes in China. Land Use Policy 2015, 45, 1–7. [Google Scholar] [CrossRef]
  6. Fu, P.; Weng, Q.H. A time series analysis of urbanization induced land. use and land cover change and its impact on land surface temperature with Landsat imagery. Remote Sens. Environ. 2016, 175, 205–214. [Google Scholar] [CrossRef]
  7. Kennedy, C.; Cuddihy, J.; Engel-Yan, J. The changing metabolism of cities. J. Ind. Ecol. 2007, 11, 43–59. [Google Scholar] [CrossRef]
  8. Tisdale, H. The process of urbanization. Soc. Forces 1941, 20, 311–316. [Google Scholar] [CrossRef]
  9. Grimm, N.B.; Faeth, S.H.; Golubiewski, N.E.; Redman, C.L.; Wu, J.; Bai, X.; Briggs, J.M. Global change and the ecology of cities. Science 2008, 319, 756–760. [Google Scholar] [CrossRef]
  10. Cui, X.; Fang, C.; Liu, H.; Liu, X. Assessing sustainability of urbanization by a coordinated development index for an Urbanization-Resources-Environment complex system: A case study of Jing-Jin-Ji region, China. Ecol. Indic. 2019, 96, 383–391. [Google Scholar] [CrossRef]
  11. Carlson, T.N.; Arthur, S.T. The impact of land use—land cover changes due to urbanization on surface microclimate and hydrology: A satellite perspective. Glob. Planet. Chang. 2000, 25, 49–65. [Google Scholar] [CrossRef]
  12. Zhou, D.; Zhao, S.; Zhang, L.; Sun, G.; Liu, Y. The footprint of urban heat island effect in China. Sci. Rep. 2015, 5, 11160. [Google Scholar] [CrossRef]
  13. Zhang, W.; Villarini, G.; Vecchi, G.A.; Smith, J.A. Urbanization exacerbated the rainfall and flooding caused by hurricane Harvey in Houston. Nature 2018, 563, 384–388. [Google Scholar] [CrossRef]
  14. Kalnay, E.; Cai, M. Impact of urbanization and land-use change on climate. Nature 2003, 423, 528–531. [Google Scholar] [CrossRef]
  15. Cadenasso, M.L.; Pickett, S.T.; Schwarz, K. Spatial heterogeneity in urban ecosystems: Reconceptualizing land cover and a framework for classification. Front. Ecol. Environ. 2007, 5, 80–88. [Google Scholar] [CrossRef]
  16. Wu, D.; Wu, H.; Zhao, X.; Zhou, T.; Tang, B.; Zhao, W.; Jia, K. Evaluation of spatiotemporal variations of global fractional vegetation cover based on GIMMS NDVI data from 1982 to 2011. Remote Sens. 2014, 6, 4217–4239. [Google Scholar] [CrossRef]
  17. Li, X.; Zhou, Y.; Asrar, G.R.; Mao, J.; Li, X.; Li, W. Response of vegetation phenology to urbanization in the conterminous United States. Glob. Chang. Biol. 2017, 23, 2818–2830. [Google Scholar] [CrossRef]
  18. Tang, J.; Bu, K.; Yang, J.; Zhang, S.; Chang, L. Multitemporal analysis of forest fragmentation in the upstream region of the Nenjiang River Basin, Northeast China. Ecol. Indic. 2012, 23, 597–607. [Google Scholar] [CrossRef]
  19. Zhao, S.; Liu, S.; Zhou, D. Prevalent vegetation growth enhancement in urban environment. Proc. Natl. Acad. Sci. USA 2016, 113, 6313–6318. [Google Scholar] [CrossRef] [Green Version]
  20. Peteet, D. Sensitivity and rapidity of vegetational response to abrupt climate change. Proc. Natl. Acad. Sci. USA 2000, 97, 1359–1361. [Google Scholar] [CrossRef] [Green Version]
  21. Nemani, R.R.; Keeling, C.D.; Hashimoto, H.; Jolly, W.M.; Piper, S.C.; Tucker, C.J.; Myneni, R.B.; Running, S.W. Climate-driven increases in global terrestrial net primary production from 1982 to 1999. Science 2003, 300, 1560–1563. [Google Scholar] [CrossRef]
  22. Pearson, R.G.; Phillips, S.J.; Loranty, M.M.; Beck, P.S.; Damoulas, T.; Knight, S.J.; Goetz, S.J. Shifts in Arctic vegetation and associated feedbacks under climate change. Nat. Clim. Chang. 2013, 3, 673–677. [Google Scholar] [CrossRef]
  23. Peng, S.; Piao, S.; Ciais, P.; Myneni, R.B.; Chen, A.; Chevallier, F.; Dolman, A.J.; Janssens, I.A.; Penuelas, J.; Zhang, G. Asymmetric effects of daytime and night-time warming on Northern Hemisphere vegetation. Nature 2013, 501, 88–92. [Google Scholar] [CrossRef]
  24. Li, X.; Zhou, Y.; Asrar, G.R.; Meng, L. Characterizing spatiotemporal dynamics in phenology of urban ecosystems based on Landsat data. Sci. Total Environ. 2017, 605, 721–734. [Google Scholar] [CrossRef]
  25. Bala, G.; Caldeira, K.; Wickett, M.; Phillips, T.; Lobell, D.; Delire, C.; Mirin, A. Combined climate and carbon-cycle effects of large-scale deforestation. Proc. Natl. Acad. Sci. USA 2007, 104, 6550–6555. [Google Scholar] [CrossRef] [Green Version]
  26. Malhi, Y.; Roberts, J.T.; Betts, R.A.; Killeen, T.J.; Li, W.; Nobre, C.A. Climate change, deforestation, and the fate of the Amazon. Science 2008, 319, 169–172. [Google Scholar] [CrossRef]
  27. Choat, B.; Jansen, S.; Brodribb, T.J.; Cochard, H.; Delzon, S.; Bhaskar, R.; Bucci, S.J.; Feild, T.S.; Gleason, S.M.; Hacke, U.G. Global convergence in the vulnerability of forests to drought. Nature 2012, 491, 752–755. [Google Scholar] [CrossRef] [Green Version]
  28. Sterling, S.M.; Ducharne, A.; Polcher, J. The impact of global land-cover change on the terrestrial water cycle. Nat. Clim. Chang. 2013, 3, 385–390. [Google Scholar] [CrossRef]
  29. Brando, P.M.; Balch, J.K.; Nepstad, D.C.; Morton, D.C.; Putz, F.E.; Coe, M.T.; Silvério, D.; Macedo, M.N.; Davidson, E.A.; Nóbrega, C.C. Abrupt increases in Amazonian tree mortality due to drought–fire interactions. Proc. Natl. Acad. Sci. USA 2014, 111, 6347–6352. [Google Scholar] [CrossRef]
  30. Zhang, Y.; Liang, S. Changes in forest biomass and linkage to climate and forest disturbances over Northeastern China. Glob. Chang. Biol. 2014, 20, 2596–2606. [Google Scholar] [CrossRef]
  31. Haas, J.; Ban, Y. Urban growth and environmental impacts in Jing-Jin-Ji, the Yangtze, River Delta and the Pearl River Delta. Int. J. Appl. Earth Obs. Geoinf. 2014, 30, 42–55. [Google Scholar] [CrossRef]
  32. Sun, Y.; Zhao, S. Spatiotemporal dynamics of urban expansion in 13 cities across the Jing-Jin-Ji urban agglomeration from 1978 to 2015. Ecol. Indic. 2018, 87, 302–313. [Google Scholar] [CrossRef]
  33. Li, Q.; Shi, J. Analysis of population distribution in beijing-tianjin-hebei region in 2000–2013. Youth Times, 2016; 13, 85–86. (In Chinese) [Google Scholar]
  34. Li, S.; Yang, H.; Lacayo, M.; Liu, J.; Lei, G. Impacts of land-use and land-cover changes on water yield: A case study in Jing-Jin-Ji, China. Sustainability 2018, 10, 960. [Google Scholar] [CrossRef]
  35. Hou, X.; Wu, T.; Yu, L.; Qian, S. Characteristics of multi-temporal scale variation of vegetation coverage in the Circum Bohai Bay Region, 1999–2009. Acta Ecol. Sin. 2012, 32, 297–304. [Google Scholar] [CrossRef]
  36. Huang, Q.; Yang, X.; Gao, B.; Yang, Y.; Zhao, Y. Application of DMSP/OLS nighttime light images: A meta-analysis and a systematic literature review. Remote Sens. 2014, 6, 6844–6866. [Google Scholar] [CrossRef]
  37. Wu, S.; Zhou, S.; Chen, D.; Wei, Z.; Dai, L.; Li, X. Determining the contributions of urbanisation and climate change to NPP variations over the last decade in the Yangtze River Delta, China. Sci. Total Environ. 2014, 472, 397–406. [Google Scholar] [CrossRef]
  38. Tang, R.; Zhao, X.; Zhou, T.; Jiang, B.; Wu, D.; Tang, B. Assessing the Impacts of Urbanization on Albedo in Jing-Jin-Ji Region of China. Remote Sens. 2018, 10, 1096. [Google Scholar] [CrossRef]
  39. Dong, J.; Zhuang, D.; Xu, X.; Ying, L. Integrated evaluation of urban development suitability based on remote sensing and GIS techniques–a case study in Jingjinji Area, China. Sensors 2008, 8, 5975–5986. [Google Scholar] [CrossRef]
  40. Tan, M.; Li, X.; Xie, H.; Lu, C. Urban land expansion and arable land loss in China—A case study of Beijing–Tianjin–Hebei region. Land Use Policy 2005, 22, 187–196. [Google Scholar] [CrossRef]
  41. Statistics, B.M.B.O. China City Statistical Yearbook; China Statistics Press: Beijing, China, 2013. [Google Scholar]
  42. Jia, K.; Liang, S.; Liu, S.; Li, Y.; Xiao, Z.; Yao, Y.; Jiang, B.; Zhao, X.; Wang, X.; Xu, S. Global land surface fractional vegetation cover estimation using general regression neural networks from MODIS surface reflectance. IEEE Trans. Geosci. Remote Sens. 2015, 53, 4787–4796. [Google Scholar] [CrossRef]
  43. Tang, H.; Yu, K.; Hagolle, O.; Jiang, K.; Geng, X.; Zhao, Y. A cloud detection method based on a time series of MODIS surface reflectance images. Int. J. Digit. Earth 2013, 6, 157–171. [Google Scholar] [CrossRef]
  44. Jia, K.; Liang, S.; Wei, X.; Yao, Y.; Yang, L.; Zhang, X.; Liu, D. Validation of Global LAnd Surface Satellite (GLASS) fractional vegetation cover product from MODIS data in an agricultural region. Remote Sens. Lett. 2018, 9, 847–856. [Google Scholar] [CrossRef]
  45. Cao, X.; Hu, Y.; Zhu, X.; Shi, F.; Zhuo, L.; Chen, J. A simple self-adjusting model for correcting the blooming effects in DMSP-OLS nighttime light images. Remote Sens. Environ. 2019, 224, 401–411. [Google Scholar] [CrossRef]
  46. Shi, K.; Yu, B.; Huang, Y.; Hu, Y.; Yin, B.; Chen, Z.; Chen, L.; Wu, J. Evaluating the ability of NPP-VIIRS nighttime light data to estimate the gross domestic product and the electric power consumption of China at multiple scales: A comparison with DMSP-OLS data. Remote Sens. 2014, 6, 1705–1724. [Google Scholar] [CrossRef]
  47. Elvidge, C.; Ziskin, D.; Baugh, K.; Tuttle, B.; Ghosh, T.; Pack, D.; Erwin, E.; Zhizhin, M. A fifteen year record of global natural gas flaring derived from satellite data. Energies 2009, 2, 595–622. [Google Scholar] [CrossRef]
  48. Baugh, K.; Elvidge, C.D.; Ghosh, T.; Ziskin, D. Development of a 2009 stable lights product using DMSP-OLS data. Proc. Asia-Pac. Adv. Netw. 2010, 30, 114–130. [Google Scholar] [CrossRef]
  49. Zhang, Q.; Seto, K.C. Mapping urbanization dynamics at regional and global scales using multi-temporal DMSP/OLS nighttime light data. Remote Sens. Environ. 2011, 115, 2320–2329. [Google Scholar] [CrossRef]
  50. Herao, W.; Xinqi, Z.; Tao, Y. Overview of researches based on DMSP/OLS nighttime light data. Prog. Geogr. 2012, 1, 11–18. [Google Scholar]
  51. Liu, Z.; He, C.; Zhang, Q.; Huang, Q.; Yang, Y. Extracting the dynamics of urban expansion in China using DMSP-OLS nighttime light data from 1992 to 2008. Landsc. Urban Plan. 2012, 106, 62–72. [Google Scholar] [CrossRef]
  52. Ma, T.; Zhou, C.; Pei, T.; Haynie, S.; Fan, J. Quantitative estimation of urbanization dynamics using time series of DMSP/OLS nighttime light data: A comparative case study from China’s cities. Remote Sens. Environ. 2012, 124, 99–107. [Google Scholar] [CrossRef]
  53. Cao, Z.; Wu, Z.; Kuang, Y.; Huang, N. Correction of DMSP/OLS night-time light images and its application in China. J. Geo-Inf. Sci. 2015, 17, 1092–1102. [Google Scholar]
  54. Oliver, M.A.; Webster, R. Kriging: A method of interpolation for geographical information systems. Int. J. Geogr. Inf. Syst. 1990, 4, 313–332. [Google Scholar] [CrossRef]
  55. Tong, K.; Su, F.; Yang, D.; Hao, Z. Evaluation of satellite precipitation retrievals and their potential utilities in hydrologic modeling over the Tibetan Plateau. J. Hydrol. 2014, 519, 423–437. [Google Scholar] [CrossRef]
  56. Han, G.; Chen, J.; He, C.; Li, S.; Wu, H.; Liao, A.; Peng, S. A web-based system for supporting global land cover data production. ISPRS J. Photogramm. Remote Sens. 2015, 103, 66–80. [Google Scholar] [CrossRef]
  57. Brovelli, M.; Molinari, M.; Hussein, E.; Chen, J.; Li, R. The first comprehensive accuracy assessment of GlobeLand30 at a national level: Methodology and results. Remote Sens. 2015, 7, 4191–4212. [Google Scholar] [CrossRef]
  58. Chen, J.; Chen, J.; Liao, A.; Cao, X.; Chen, L.; Chen, X.; He, C.; Han, G.; Peng, S.; Lu, M. Global land cover mapping at 30 m resolution: A POK-based operational approach. ISPRS J. Photogramm. Remote Sens. 2015, 103, 7–27. [Google Scholar] [CrossRef]
  59. Runyon, R.P. Behavioral Statistics: The Core: Study Guide to Accompany Runyon, Haber, Coleman; McGraw-Hill: New York, NY, USA, 1994. [Google Scholar]
  60. Zhou, Y.; Smith, S.J.; Elvidge, C.D.; Zhao, K.; Thomson, A.; Imhoff, M. A cluster-based method to map urban area from DMSP/OLS nightlights. Remote Sens. Environ. 2014, 147, 173–185. [Google Scholar] [CrossRef]
  61. Li, Z.; Sun, R.; Zhang, J.; Zhang, C. Temporal-spatial analysis of vegetation coverage dynamics in Beijing-Tianjin-Hebei metropolitan regions. Acta Ecol. Sin. 2017, 37, 7418–7426. (In Chinese) [Google Scholar]
  62. Wang, M.; Yan, X. A comparison of two methods on the climatic effects of urbanization in the Beijing-Tianjin-Hebei metropolitan area. Adv. Meteorol. 2015, 2015, 352360. [Google Scholar] [CrossRef]
  63. Wu, Z.; Wu, J.; Liu, J.; He, B.; Lei, T.; Wang, Q. Increasing terrestrial vegetation activity of ecological restoration program in the Beijing–Tianjin Sand Source Region of China. Ecol. Eng. 2013, 52, 37–50. [Google Scholar] [CrossRef]
  64. Wu, Z.; Wu, J.; He, B.; Liu, J.; Wang, Q.; Zhang, H.; Liu, Y. Drought offset ecological restoration program-induced increase in vegetation activity in the Beijing-Tianjin Sand Source Region, China. Environ. Sci. Technol. 2014, 48, 12108–12117. [Google Scholar] [CrossRef] [PubMed]
  65. Wang, J.; Zhou, W.; Xu, K.; Yan, J. Spatiotemporal pattern of vegetation cover and its relationship with urbanization in Beijing-Tianjin-Hebei megaregion from 2000 to 2010. Acta Ecol. Sin. 2017, 37, 7019–7029. (In Chinese) [Google Scholar] [Green Version]
  66. Yan, S.; Wang, H.; Jiao, K. Spatiotemporal dynamics of NDVI in the Beijing-Tianjin-Hebei region based on MODIS data and quantitative attribution. J. Geo-Inf. Sci. 2019, 21, 767–780. (In Chinese) [Google Scholar]
  67. Meng, D.; Li, X.; Gong, H.; Qu, Y. Analysis of spatial-temporal change of NDVI and its climatic driving factors in Beijing-Tianjin-Hebei metropolis circle from 2001 to 2013. J. Geo-Inf. Sci. 2015, 17, 1001–1007. (In Chinese) [Google Scholar]
  68. de Jong, R.; Schaepman, M.E.; Furrer, R.; De Bruin, S.; Verburg, P.H. Spatial relationship between climatologies and changes in global vegetation activity. Glob. Chang. Biol. 2013, 19, 1953–1964. [Google Scholar] [CrossRef]
  69. Fang, J.; Piao, S.; He, J.; Ma, W. Increasing terrestrial vegetation activity in China, 1982–1999. Sci. China Ser. C Life Sci. 2004, 47, 229–240. [Google Scholar]
Figure 1. Location and land cover of the research area. (a) The location of the Beijing–Tianjin–Hebei (BTH) region in China, (b) the variation in land cover in the BTH region, and (c) the distribution of land use types. Beijing (BJ), Tianjin (TJ), Shijiazhuang (SJZ), Handan (HD), Tangshan (TS), Baoding (BD) Zhangjiakou (ZJK), Xingtai (XT), Hengshui (HS), Cangzhou (CZ), Langfang (LF), Chengde (CD), and Qinghuangdao (QHD) refer to 13 cities in the BTH region.
Remotesensing 11 02452 g001
Figure 2. The fractional vegetation cover (FVC) in the BTH region: (a) average FVC from 2001 to 2011; (b) box plots of FVC values of different land covers; (c) average FVC of six large cities from 2001 to 2003, 2004 to 2008, and 2009 to 2011; and (d) average and standard deviation of FVC in the core, expanded, and fringe areas of six large cities.
Remotesensing 11 02452 g002
Figure 3. Spatiotemporal variation of the FVC in the BTH region: (a) spatial variation of the FVC, (b) temporal variation of the FVC, and (c) interannual variation rate of the FVC in 13 cities. Beijing (BJ), Tianjin (TJ), Shijiazhuang (SJZ), Handan (HD), Tangshan (TS), Baoding (BD), Zhangjiakou (ZJK), Xingtai (XT), Hengshui (HS), Cangzhou (CZ), Langfang (LF), Chengde (CD), and Qinghuangdao (QHD) refer to 13 cities in the BTH region.
Remotesensing 11 02452 g003
Figure 4. Changes in urban areas from 2001 to 2011. The value represents urbanization intensity.
Remotesensing 11 02452 g004
Figure 5. Spatial distribution of urban areas and urbanization rate in the BTH region: (a) and (b) are urbanization areas in 2001 and 2011, and (c) is the urbanization rate from 2001 to 2011.
Remotesensing 11 02452 g005
Figure 6. Contribution of each factor to FVC changes: (ad) are the contributions of temperature, precipitation, radiation, and urbanization, respectively, to FVC changes, (e) shows the contributions of other factors not considered to FVC changes, and (f) is the average contribution of various factors to FVC changes in the BTH region.
Remotesensing 11 02452 g006
Figure 7. Regional statistics of the contribution of each factor to FVC changes. T, P, R, and U refer to temperature, precipitation, radiation, and urbanization, respectively, and O represents the other factors not considered in this study.
Remotesensing 11 02452 g007
Figure 8. (a) Changes in FVC and precipitation in urban core areas, and (b) changes in FVC and urbanization in urban expanded areas. P and U indicate precipitation and urbanization, respectively.
Remotesensing 11 02452 g008
Table 1. Land cover transfer matrix (unit: %).
2010Cultivated LandForestGrasslandWetlandWater BodiesArtificial SurfacesBareland
2000
Cultivated Land81.621.520.520.211.5714.560.00
Forest0.5193.630.160.000.085.620.00
Grassland10.491.1956.840.383.3827.720.00
Wetland11.220.002.7263.7320.292.040.00
Water Bodies19.980.601.693.8064.619.320.00
Artificial Surfaces2.810.160.200.260.6695.910.00
Bareland0.000.0041.670.000.000.0058.33

