1. Introduction
Doppler radar observation data have been utilized in many meteorological fields, such as supplying quality radar related products in the real-time forecasting of hazardous and adverse weather systems, quantitative rainfall, and wind field forecasting from numerical forecast models with advanced radar assimilation techniques. Doppler radar observations, especially radial velocity, play an increasingly important role in the assimilation of radar data for the improvement of precipitation predictions from different weather systems, including those of typhoons and hurricanes [
1,
2,
3,
4,
5,
6]. The assimilation of the radial velocity into numerical forecast models requires sufficient accuracy, considerable automation, and a powerful quality control scheme for radar observations. An existing challenge of data assimilation with radial velocity observations is velocity de-aliasing. The maximum radial velocity or Nyquist radial velocity [
7] of each radar observation is related to the radar pulse repetition frequency (PRF) and transmitted radar wavelength where:
The interval [−
vmax,
vmax] is an unambiguous velocity interval. True radial velocity observations exceeding the spacing of [−
vmax,
vmax] are aliased and will show between ±
vmax. The relation between the observed radial velocity
v0 and true radial velocity
vT is:
By choosing a correct n, the true velocity vT can be recovered from the original radar radial velocity v0 from an accurate dealiasing algorithm.
The existing dealiasing algorithms include two kinds of general techniques, known as the reference wind check scheme and continuity check scheme, and are meant to correct the aliased velocities. Accurate and robust radial velocity dealiasing is still a difficult challenge although some success has been demonstrated. In particular, it is essential to have a radial velocity dealiasing algorithm that is highly reliable and fully automated when the observed radar radial velocities are assimilated into a numerical weather forecasting model. Forecasting model analysis errors of initial conditions which then pollute the consecutive forecasts can be caused by only a small percentage of erroneously or mistakenly dealiased radial velocities. When a data assimilation system is cycled, the problem can become more serious because of the error propagation with time.
The reference wind check dealiasing scheme applies a referred wind velocity field to dealiase the radar radial velocity observations in each grid point [
8,
9]. Lim and Sun [
8] developed a reference wind check dealiasing scheme in which the reference velocity was frequently updated through the data assimilation of radar observations, creating an “online” two-way interactive data assimilation/velocity dealiasing procedure. The dealiasing process was thus embedded in the cycled radar data assimilation system. This algorithm was implemented in the variational doppler radar analysis system (VDRAS) [
10] and was shown to improve the success rate of dealiasing by 2.6% in an experiment using reference winds without radar data assimilation. However, our recent experiences with the algorithm showed that, in cases of strong horizontal shear, the algorithm could have the serious issue of spreading the dealiasing errors over time due to the continuous cycling of interactive data assimilation and the dealiasing procedure. In addition, the online dealiasing algorithm must wait for a data assimilation cycle to finish before the dealiasing of the radar radial velocity to be used for the next cycle can commence. In comparison, an offline algorithm solely based on the continuity of the radial velocity observations has the advantage of faster computations and does not have the issue of error spreading over time. Ray and Ziegler [
7] first developed a one-dimensional continuity check algorithm to dealias the aliased radial velocities in each separate radial using only radial observation information. Some two-dimensional continuity check algorithms [
11,
12,
13,
14,
15,
16,
17,
18,
19] which check both the radial and azimuthal directions were exploited following Ray and Ziegler [
7]. Based on the two-dimensional dealiasing scheme, James and Houze [
20] evolved a four-dimensional dealiasing scheme by including observations in different elevation scans and different volume scans.
In recent years, Doppler radar networks have been implemented in many developing countries. These radar networks often have unique quality control challenges due to excessive noise contaminations, and hence, traditional dealiasing algorithms may not work as well as expected. He et al. [
17] (HE2012 hereafter) developed an improved two-dimensional continuity check for the dealiasing algorithm for S-band China radar network (CINRAD) observations, named the CINRAD improved dealiasing algorithm (CIDA). An original characteristic of CIDA was the utilization of a new scheme to choose a first reference radial near zero-line observation where the radar radial velocity gates are almost impossibly aliased. Furthermore, CIDA replaced the use of wind profile products and radiosonde observations with a multi-pass dealiasing process, which improved the dealiasing result of isolated aliased echoes and missing data. He et al. [
19] (HE2019 hereafter) introduced the dealiasing algorithm ADTH (Automated Dealiasing for Typhoon and Hurricane), which was developed based on the CIDA algorithm for dealiasing typhoon and hurricane systems. The ADTH algorithm tested 789 volumes and 7981 radial velocity elevation fields, all observed from S-band radars stations in two hurricane and four typhoon cases. These six cases had radial velocities that were severely aliased for a large percentage of the constant-elevation scans, and some included challenging dealiasing situations with multiple aliased radial velocities due to strong wind speeds.
Examinations of the CIDA algorithm with 14 cases of squall line, typhoon, and heavy rain observations from the CINRAD network displayed an advanced performance compared to the NEXRAD (Next Generation Weather Radar) algorithm for the U.S. radar network. Even though HE2012 has made important contributions towards our objective of developing a robust and fully automated radial velocity dealiasing algorithm that can be applied for operational data assimilation, the problem of whether the algorithm is familiarly suitable for radar observations from different operational networks still exists. Additionally, HE2012 tested CIDA only on CINRAD S-band radar systems and used only one chosen volume observation for each weather case, with a total of 14 cases. The ADTH employed algorithm in HE2019 has proved the good performance of dealiasing more than 12 h of continuous observation for hurricanes and typhoons. Nevertheless, ADTH is only designed for tropical cyclone systems observed from S-band radar stations, and is prone to failure with data from C-band radars because of the smaller Nyquist interval common in C-band radars. In NWP (Numerical Weather Prediction) radar data assimilation, it is often inevitable that one will have to deal with a variety of radars automatically in a given domain and a variety of weather phenomena. Different to these existing algorithms, our goal in the current study is to develop a common use algorithm for the purpose of data assimilation which can not only deal with different band radar data, but also exhibit a good performance for different radar networks and different weather processes. In this paper, we enhance the dealiasing schemes of HE2012 and HE2019 and rename the improved algorithm—automated dealiasing for data assimilation (ADDA). The former was done by implementing a number of new techniques with the aim of developing a robust and fully automated radar velocity dealiasing algorithm for real-time radar data assimilation. ADDA is tested with radar radial observation from different networks, including CINRAD (both S-band and C-band), NEXRAD, and the Taiwan radar network, to examine its robustness. These radar systems have different scanning strategies and error characteristics, which subject ADDA to a more generalized test. To examine the scheme under different weather conditions, our selected test cases included typhoons, hurricanes, squall lines, and localized heavy rains. In addition, we ran ADDA continuously for more than 12 h for each chosen cases to assess the algorithm’s stability for testing large sets of radar radial data and to receive statistical verification. The same data from all tested cases was run through both the ADDA and CIDA algorithm to quantify the improvement of the new ADDA algorithm over the CIDA algorithm in
Section 3 of this paper. The new ADDA scheme characterized in this paper contains four new advancements. First, the promoted multi-pass radial velocity dealiasing scheme was combined with passes along both the radial direction and azimuthal direction. Second, the process of choosing the first radial scheme with added winds was approximated from the radial velocity information as an additive restriction. Third, it included the addition of a scheme to identify and preserve the large, but correct, shear regions associated with real weather phenomena. Last, a developed least-square error check scheme was used to apply localized dealiasing.
The rest of this paper is structured as follows:
Section 2 depicts detailed information on the different modules in the improved dealiasing scheme, with an emphasis on the recent refinements;
Section 3 describes the radial velocity dealiasing results of seven severe weather cases observed by different types of radar systems from different radar networks and the analysis of the statistical dealiasing results;
Section 4 summarizes with a brief conclusion.
2. Materials and Methods
The enhanced dealiasing scheme ADDA was composed of five modules: (1) noise removal; (2) choice of the first reference radial; (3) preservation of the convective shear regions, (4) multi-pass dealiasing in both azimuthal and radial directions; and (5) local error checks. These five modules are depicted in the following section.
2.1. Module 1: Noise Removal
Due to various factors, such as the different atmospheric conditions, radar parameters, transmitted power of the radar transmitter, sensitivity of the radar receiver, and accuracy of the signal processing and non-meteorological targets, the radar measurements were inevitably contaminated by random noise in addition to ground clutter gates, second trip gates, and side lobe gates, etc. There is a need to eliminate most of the noisy data before radial velocity dealiasing. HE2012 presented a scheme that utilized the threshold of reflectivity and spectrum width to identify noise in the CIDA algorithm. The same scheme was used in ADDA in the current study, but different thresholds were applied for different radar networks and radar wavelengths to effectively remove the noise. For radar data observed from the S-band radar station, the radial velocities were removed when the corresponding reflectivity was less than 20 dBZ and the spectrum width was larger than 8 m/s. For C-band radar data, the velocity data was removed if the corresponding spectrum width was higher than 3 m/s and the reflectivity was less than 16 dBZ.
2.2. Module 2: Choice of the First Reference Radial
A good reference radial is one which does not include aliased information, as the following dealiasing depended on the already adjusted radial velocity gates. The most likely position occurred where the wind direction was almost orthogonal to the direction in which the antenna was pointing. Furthermore, the average value of the absolute value of that radial’s Doppler velocity was at a minimum.
To be a first reference radial, four criteria must be met. First, they are minima in the curve of the normalized average of the absolute values of the measured velocities at all the valid gates along each radial. Second, these two initial reference radials should be separated by approximately 180° [
18]. The reference radial was chosen with the larger average velocity and more valid gates in all of the radials. Because of the smaller Nyquist interval of the C-band radar, more than two radials may meet the first criterion in C-band radial velocity data when observing the same weather situation, and only a couple of radials were separated by nearly 180° (unless there were multiple folds). The third criterion is that the reference radial must have the biggest difference between minima in the curve and the adjacent maxima. The fourth criterion is that the number of data points for the radial with the minimum sum must contain at least two-thirds of the average number of valid gates in all the radials in each azimuths.
The above-elaborated strategy works fine and can determine the correct first reference radial in most conditions, but still easily fails when multiple-folded radial velocity gates show up in tropical cyclones. To remove the ambiguous result from the multiple-folded radar radial velocity gates, a standard which is the same as in the ADTH scheme [
19] due to the prevailing real environmental wind direction was added in this module. The wind direction was calculated by the gradient velocity–azimuth display (G-VAD) scheme proposed in Gao et al. [
3]. The velocity–azimuth display (VAD) scheme [
21] can predict the areal vertical-profile distribution of the horizontal-wind information from one Doppler weather radar. However, the VAD scheme suffers from troubles when the observed radial wind field has aliased radial velocity gates or has a wide region of missing gates. The G-VAD scheme does not need prior dealiasing or other measurement information and can calculate the real environmental wind direction and speed from the velocity gradient information of radial velocity observations. The radial has more valid radial velocity gates and the wind direction perpendicular to that of the real environmental will be chosen as the first reference radial (more details can be referred to in HE2019).
2.3. Module 3: Preserving the Convective Regions
Dealiasing errors tend to occur in vigorous small-scale convective regions that are often associated with high winds and sharp shear edges where the positive and negative signs of the radial velocity information change, resulting in large gradients. This kind of large but true gradient can be mistaken as being caused by dealiased velocities and thus, can trigger erroneous dealiasing. It is hence necessary to identify the convective regions and prevent incorrect dealiasing. In ADDA, an algorithm consisting of three steps was added to identify the regions of the true gradient associated with convection, following a similar method to that presented in Lim and Sun [
8]. The first step was discovering all the edges where the positive and negative signs of the radial velocity information changed, including those caused not only by aliased velocities, but also by atmospheric convection. At each valid point, a search was performed with the adjacent four points in the radial and azimuthal directions. If the signs of any two adjacent points were different, both were marked with flag 1. The second step was to distinguish the real wind shear boundaries from the boundaries from aliased points. This was done by selecting the points with absolute radial velocity differences between the two neighbor gates of less than 80% of the Nyquist radial velocity. This standard considered the fact that the real meteorological disturbance had a certain degree of continuity, with velocity values near zero in a narrow transition zone. All adjacent points meeting this condition were then marked with flag 2. The last step was to check whether the real shear regions were confined, which was done by setting all points to flag 3 in between two boundary points (with flag 2) that were separated by a distance of less than 60 km (a tunable parameter). Even through the choice of 60 km was empirical, it reflected the typical spatial scale of extreme winds that are associated with deep convective storms. All the points marked with flag 3 were defined as real meteorological disturbance regions that should not be dealiased. As will be shown later, this module was quite effective in reducing the potential error propagation that is often triggered by vigorous convection.
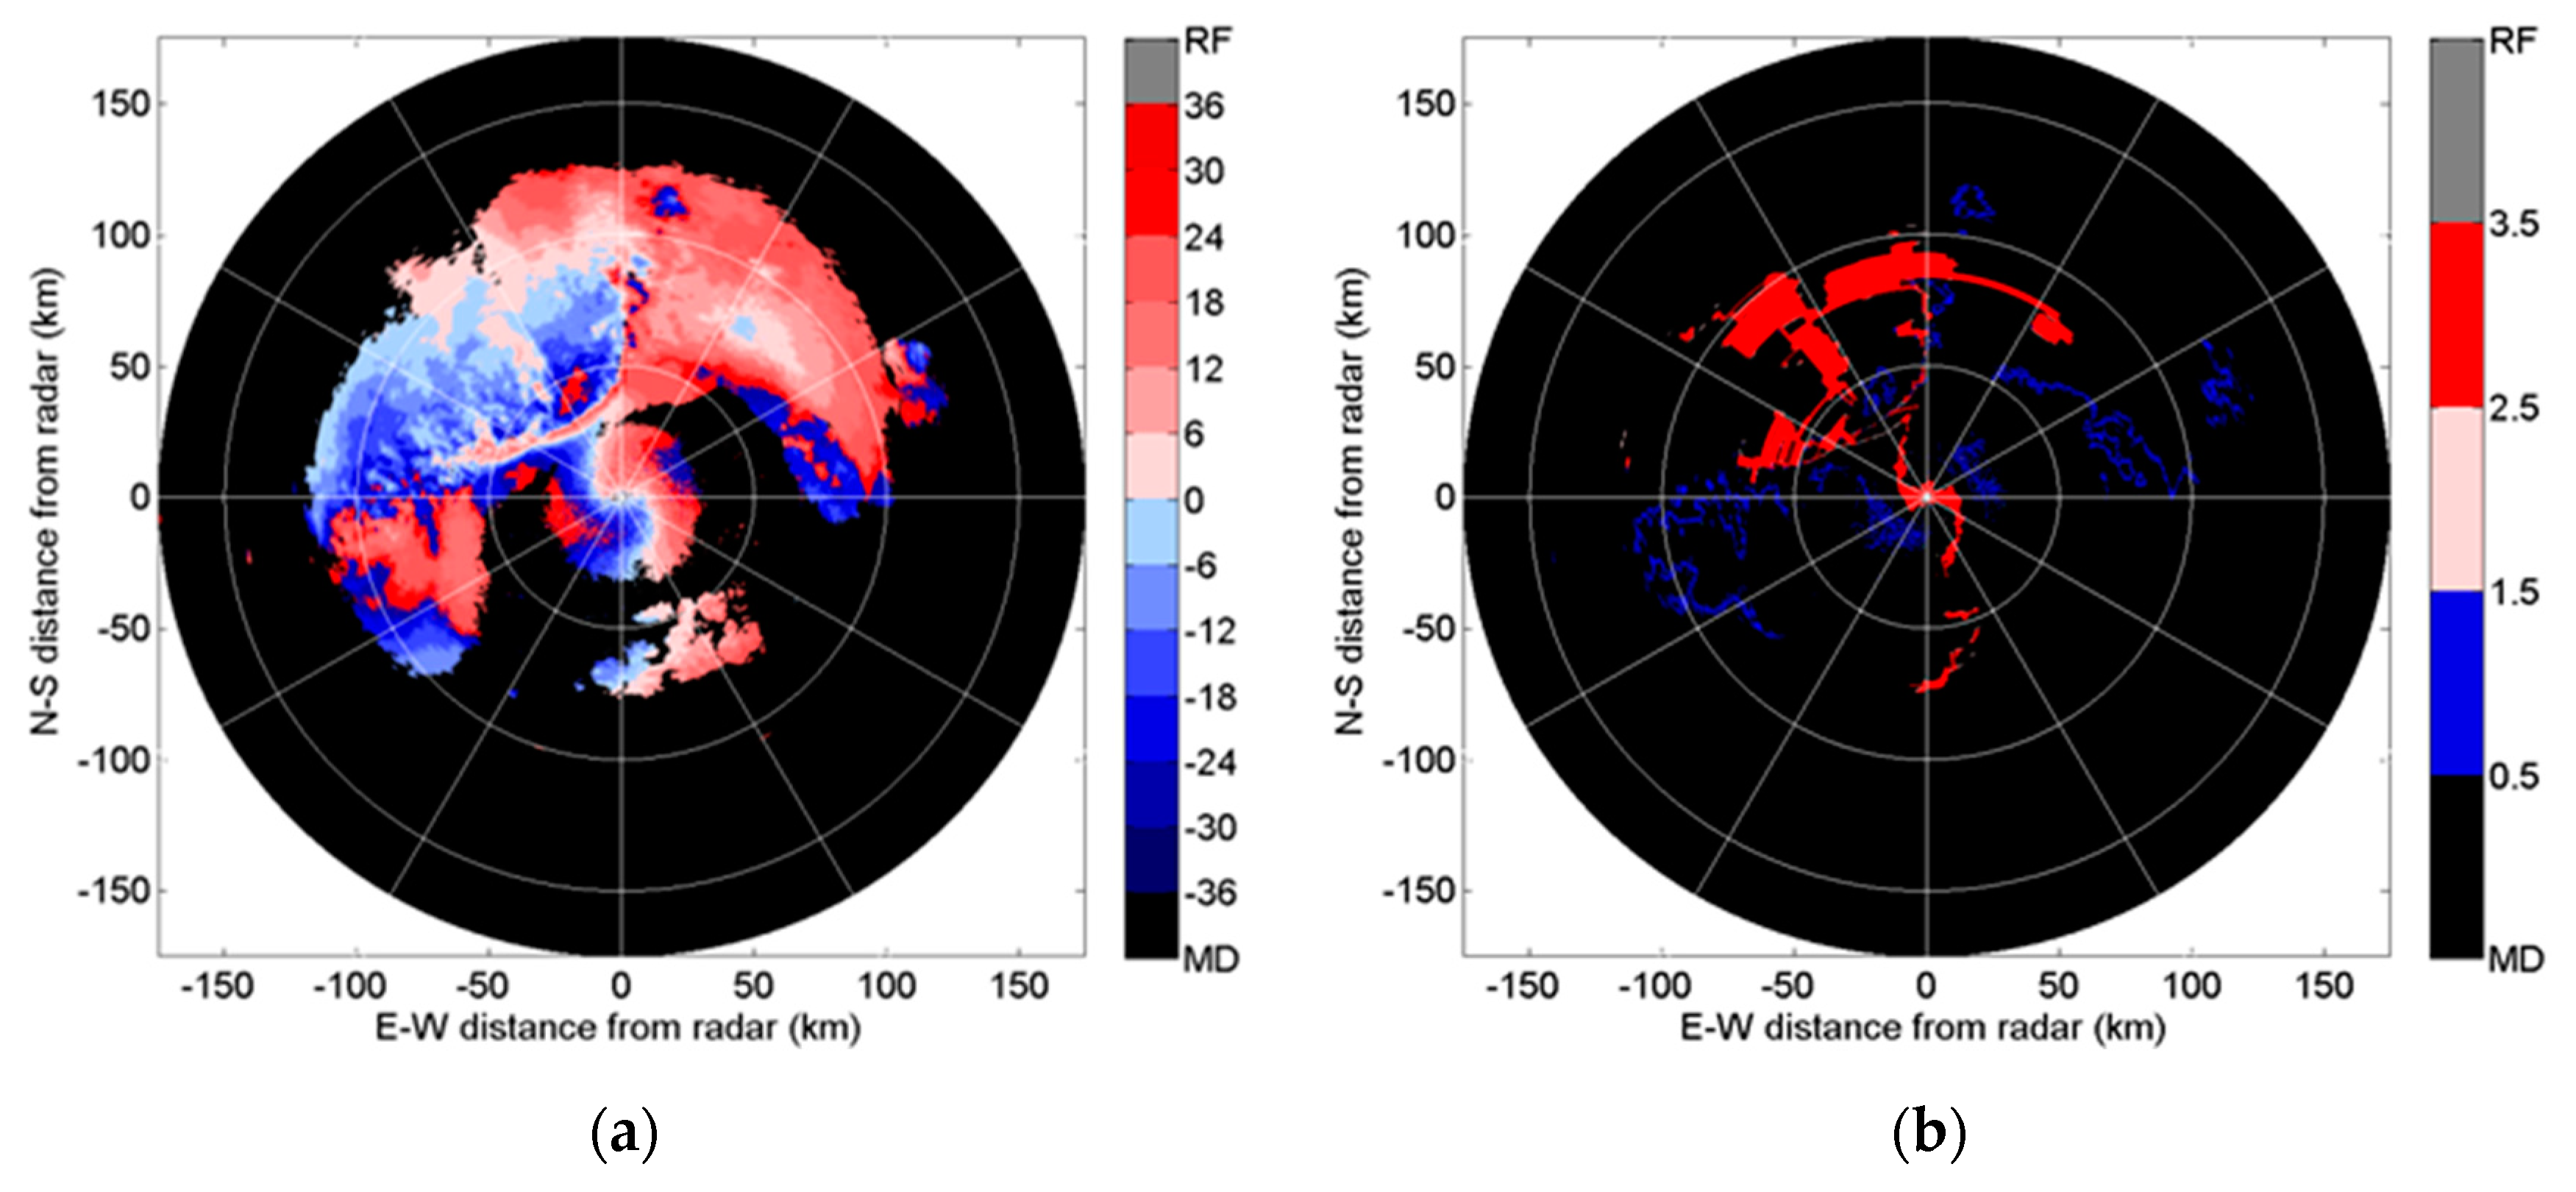
Figure 1b expresses a case of the flag field after the three steps have been utilized for the original radial velocity of the 6.0° elevation angle (
Figure 1a) observed by an S-band radar located in Guangxi, China.
2.4. Module 4: Multi-Pass Dealiasing
The dealiasing scheme began with the radial following to the left and right side of the first reference radial selected from module 2 passing through two steps: one step went through 180° in a clockwise course and the other step went through 180° in a counterclockwise course.
The dealiasing scheme executed four steps in the radial and azimuth direction in each half circle. First, dealiasing occurred from the inner to outer area for each radial in the azimuth direction; second, dealiasing from the outer to inner area for each radial in the azimuth direction took place; third, dealiasing from the inner to outer area for all the points with the same distance from the Doppler radar station in the radial direction occurred; and fourth, dealiasing from the outer to inner area for all the points with the same distance from the Doppler radar station in the radial direction took place. The dealiasing scheme performed utilizing a coherence check that contrasted its radial velocity gate with the reference radial velocity information that was chosen from the dealiased velocity gates within the preceding gates for each observation gate. Because of the continuity of the wind speed, the coherence test checked the difference between the current gate and the proximal gates in the preceding correctly dealiased radial. In this study, dealiasing was performed through minimizing the difference between the current gate and the proximal gates. The reader can refer to He2012 for the main details of choosing the reference radial velocity. The two ways and two directions scheme did not need to depend on the radiosonde information or velocity-azimuth display wind profile, and it was powerful for managing the near-range aliased problem and aliased gates near to missing observation.
2.5. Module 5: Local Error Check and Dealiasing
To eliminate any possible existing local errors dealiased by the previous four modules, the ADDA scheme executed a local error check in the final step. The error check scheme compared the dealiased result from module 4 with the average of the valid gates in a designated geometric window. If the difference between the dealiased result from module 4 and the average value was less than the Nyquist interval, then the dealiased result was correct. Otherwise, a new result from the following step replaced the dealiased result from module 4. The average radial velocity of all of the valid gates within a designated geometric window was computed as the consultation geometric wind for the following Equation (3) to calculate an appropriate in Equation (2) at each observation gate:
where
NINT stands for rounding up to the closest integer. The dimension of the consultation geometric window was determined by the valid gate number m (empirically selected) and changed with the distance between the checked gate and the radar station. For all weather conditions excluding hurricanes and typhoons, m was set to 49 when the range distance was less than 100 km and m was set to 100 when the range distance was larger than 100 km. In the case of a hurricane or typhoon, the dimension of the geometric window was equal to 81 or 225 for distances less or larger than 100 km, respectively, because of the large-scale nature of these storms. The final local error check was not executed until the total number of valid observation gates in this consultation geometric window was larger than 60% of all gate points to prevent uncertainty.
The above local dealiasing method may possibly fail when the eye location of a tropical cyclone is very close to a radar station, although it worked well for most of the weather cases. Therefore, the ADDA scheme added the following two steps to guarantee the stability of the new scheme. In the first step, ADDA executed new linear least square error dealiasing in each radial direction. The radial velocity value was presumed to meet the linear relation in each radial, as follows: , where vT is the real radial velocity value and Xn is the range between the radar station and the checked gate. The constant numbers a0 and b0 were obtained by resolving a linear least-square equation with the radial velocity gates along each radial. All the radial velocity gates which did not meet the linear relation were dealiased again with Equation (2). In the second step, ADDA performed a new quadratic least square error dealiasing in the azimuthal direction. Because the observed radial velocities were the real wind velocities field casted onto a radar radial beam, in every half-circle observation area, beginning with the first reference radial and ending with the radar radial 180° away from the reference radial, all of the velocity gates that had the same distance from the radar center in the azimuth direction roughly met a quadratic relation which was similar to a function between 0° and ±180°. Following this, the quadratic least-square fit was applied to determine and dealiase the remaining aliased gates.
3. Results
The ADDA dealiasing scheme described in
Section 2 was applied to two typhoon cases, two hurricane cases and three deep convection cases. These seven selected cases were obtained from different radar systems with S- or C-band wavelengths from different radar networks. The typhoon and hurricane cases were collected by three S-band radar systems from China’s CINRAD network and the U.S. NEXRAD network. The data of the three deep convection cases were observed using an S-band radar and two C-band radar systems from China’s CINRAD network. The radius of the radar radial velocity observation area for an S-band radar station was 230 km and for a C-band radar station was 200 km. The Nyquist radial velocity changed from 22 m s
−1 to 32 m s
−1 for the S-band radar station and from 13 m s
−1 to 15 m s
−1 for the C-band radar, depending on the different PRF from the different PRF from different radars. The ADDA’s successive dealiasing covered a stage of more than twelve hours in each of the selected cases. These seven selected cases had 849 volumes and 7463 tilts in total. The total volume and total number of tilts of the seven selected periods are shown in
Table 1. The detailed dealiasing results of several cases are presented below and the statistical assessment will be shown in the next section.
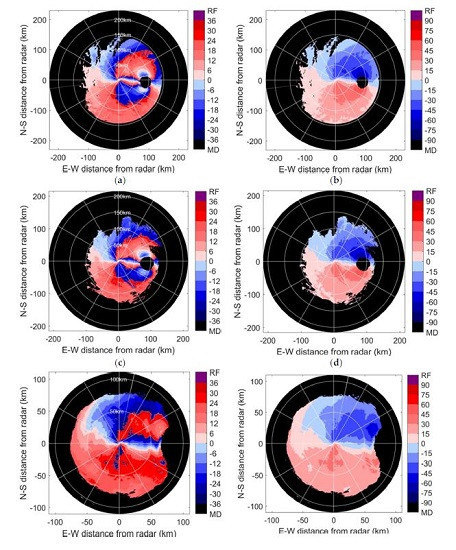
3.1. Result of Typhoon Rammasun from an S-band Radar of CINRAD
In the Philippines, Typhoon Rammasun was also known as tropical cyclone Glenda. Typhoon Rammasun was recorded as one of the only two category five super typhoons in the South China Sea. Typhoon Rammasun made its landfall close to Wenchang City of Hainan province on 17 July 2014. Numerous houses were damaged due to Typhoon Rammasun and almost 750,000 individuals were evacuated. Haikou radar observations of the twice-aliased situation exist, with the maximum maintained real wind speed of 92 m/s, which presented the dealiasing algorithm with a greater challenge. There was another challenge of tropical cyclone dealiasing when the storm eye was near to the radar center since the radar radial velocity observations showed asymmetry at the two sides of the zero velocity line.
The Haikou S-band radar station located near the north coast of Hainan has a Nyquist velocity of 35.34 m/s and was near to the storm eye of typhoon Rammasun at 06:35 (UTC), on 18 July 2014, when Rammasun almost made its landfall. Therefore, this supplied the best observation data to examine ADDA’s performance in exceeding situations.
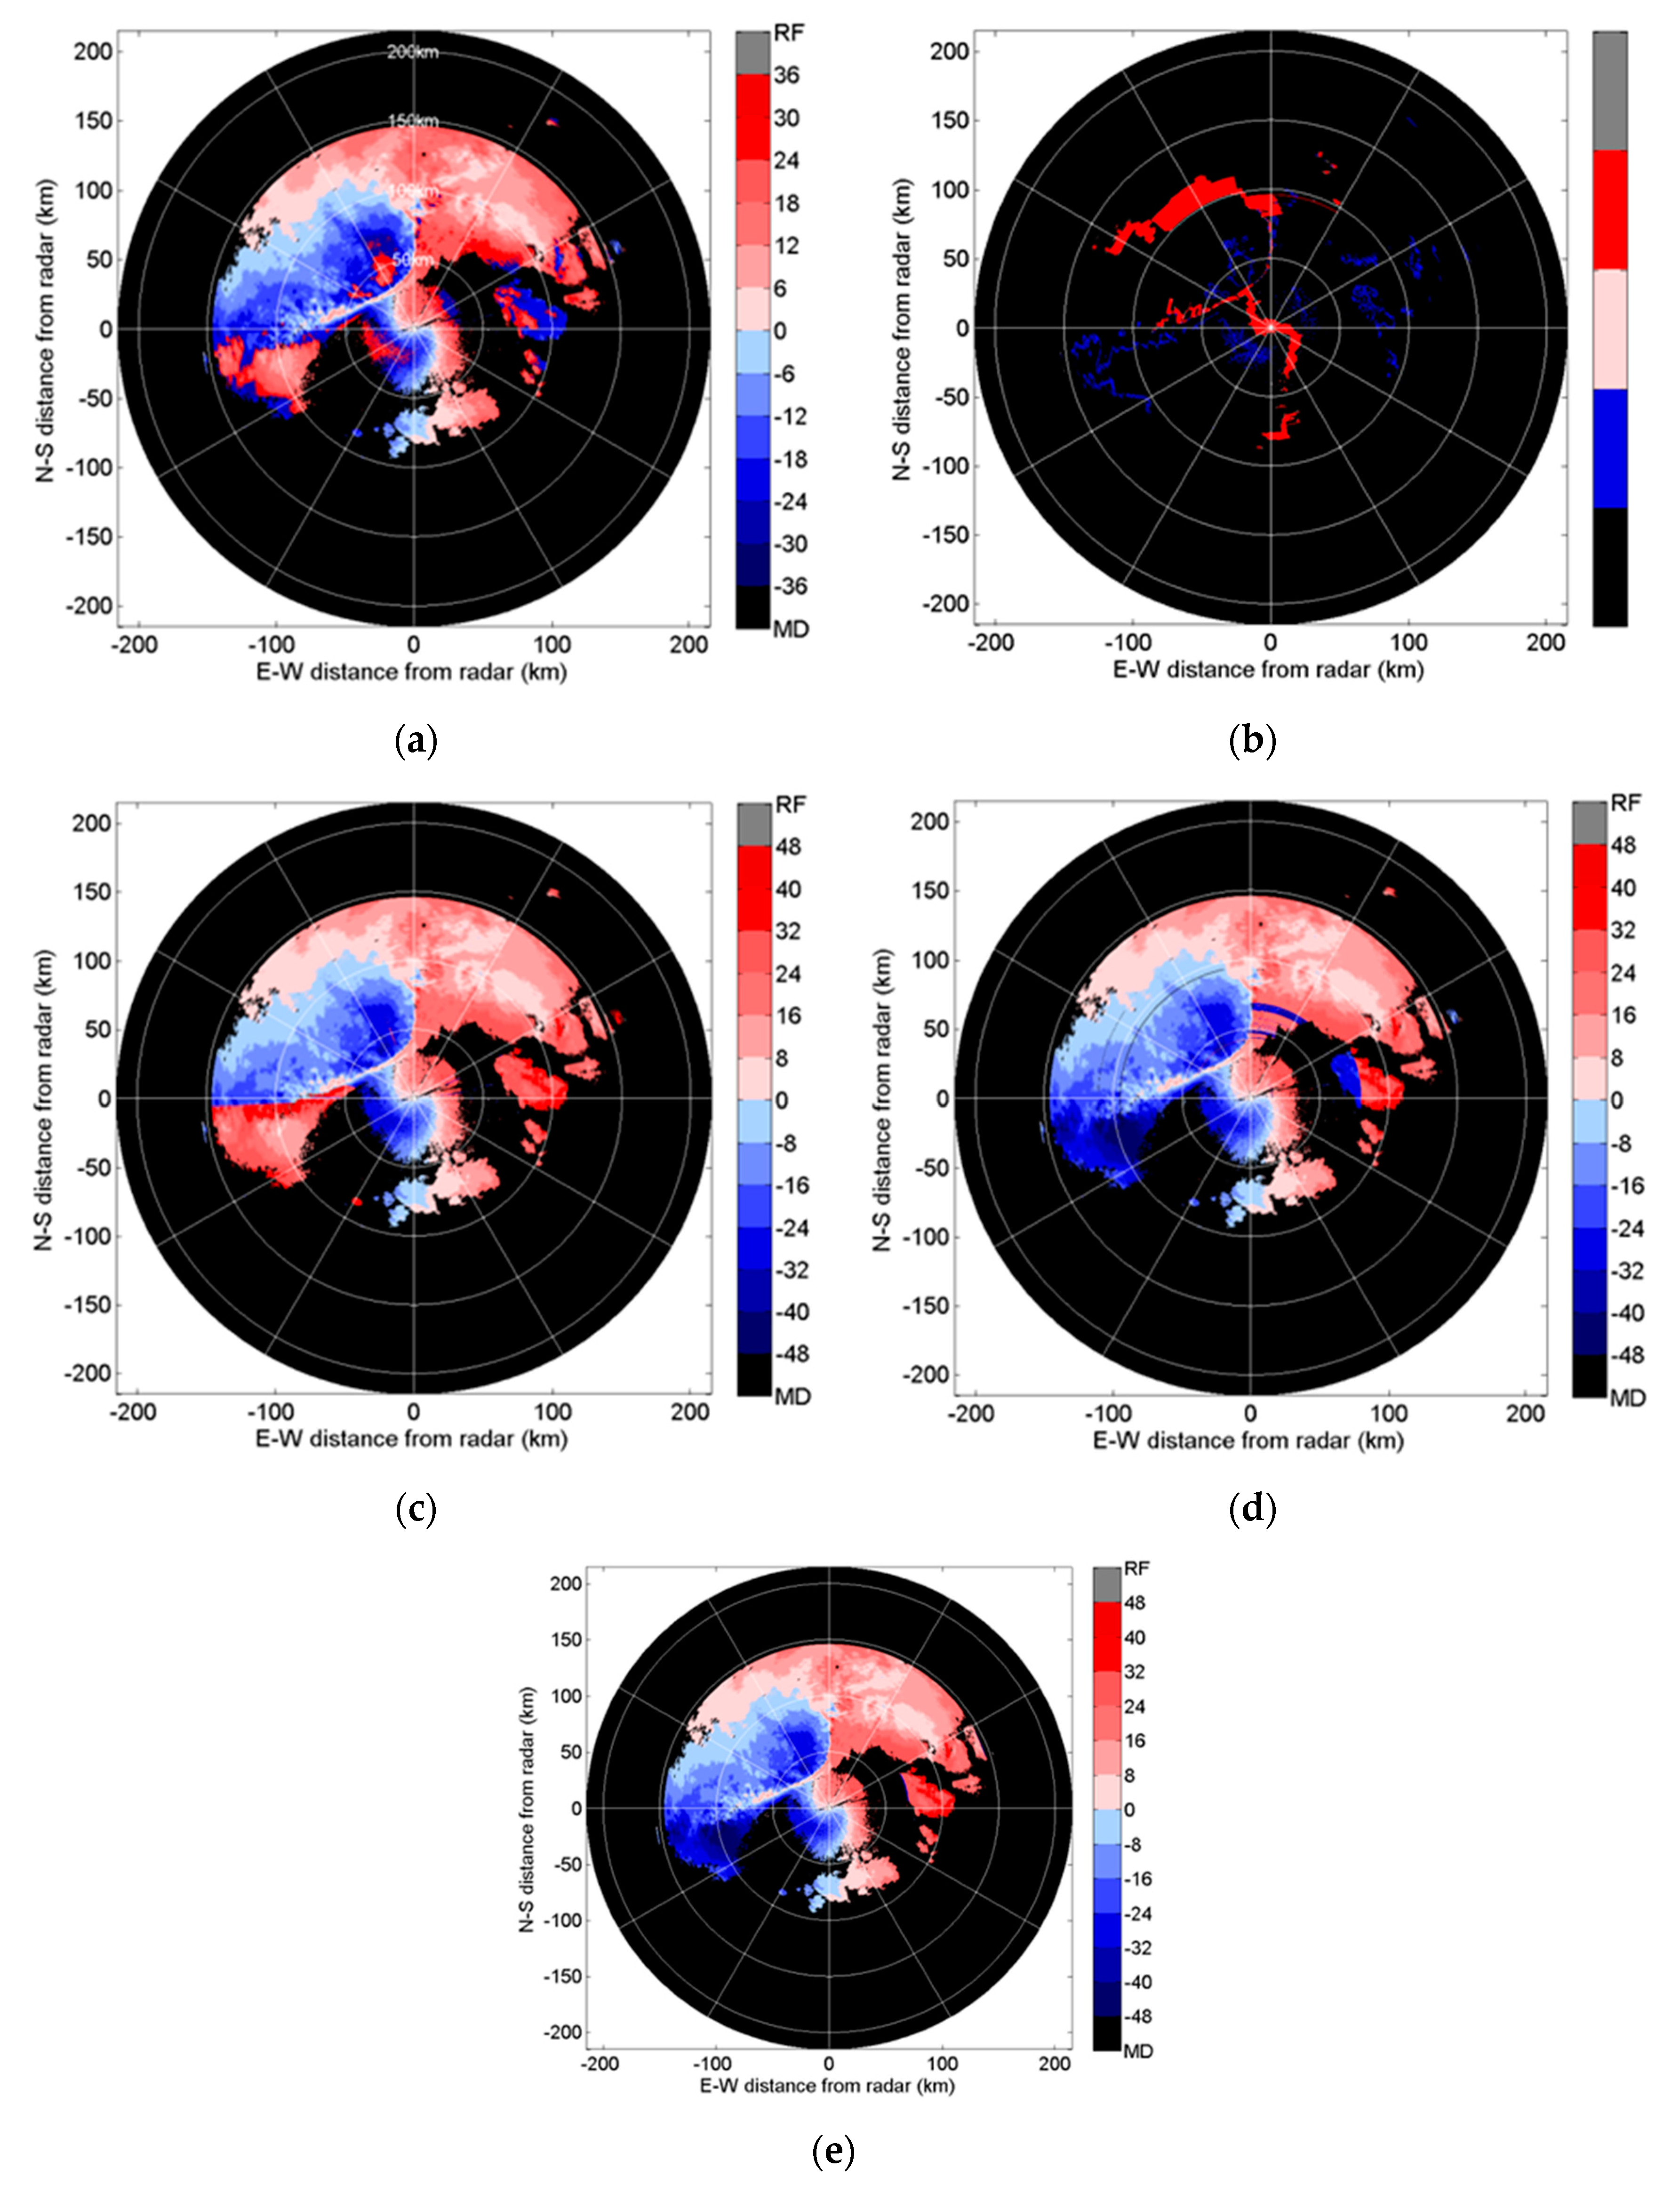
Figure 2a,c, edemonstrates the original radial velocity fields collected from Haikou radar station at a 2.4°, 6.0°, and 14.6°elevation, respectively. As can be seen in
Figure 2, the eye of Rammasun was about 75 km away from the east of the radar center at that moment. Many radial velocity gates in the south and north of the typhoon eye were obviously twice-aliased. ADDA properly selected the first reference radial close to the zero-line and correctly dealiased these twice-aliased gates.
Figure 3b shows the ultimate dealiasing result at elevation angle of 2.4° after running all these five dealiasing modules. In
Figure 2c, almost 30% of the valid radial velocity gates were aliased and a discontinuous aliased echo existed in the northeast of the eye of typhoon Rammasun at the elevation angle of 4.3°. The local dealiasing scheme with the least-square error check elaborated in module 5 of ADDA played a very important role for the 4.3° elevation angle. As demonstrated in
Figure 2d, the ADDA scheme smoothly dealiased these severely aliased radial velocity gates. In the 9.9° elevation angle, the G-VAD scheme mentioned in module 2 was certified as beneficial for properly choosing the first reference radial around 92°, as presented in
Figure 3e. The proper first reference radial guaranteed that the following modules were implemented successfully, resulting in the satisfactory dealiasing of the 9.9° elevation angle, as demonstrated in
Figure 3f.
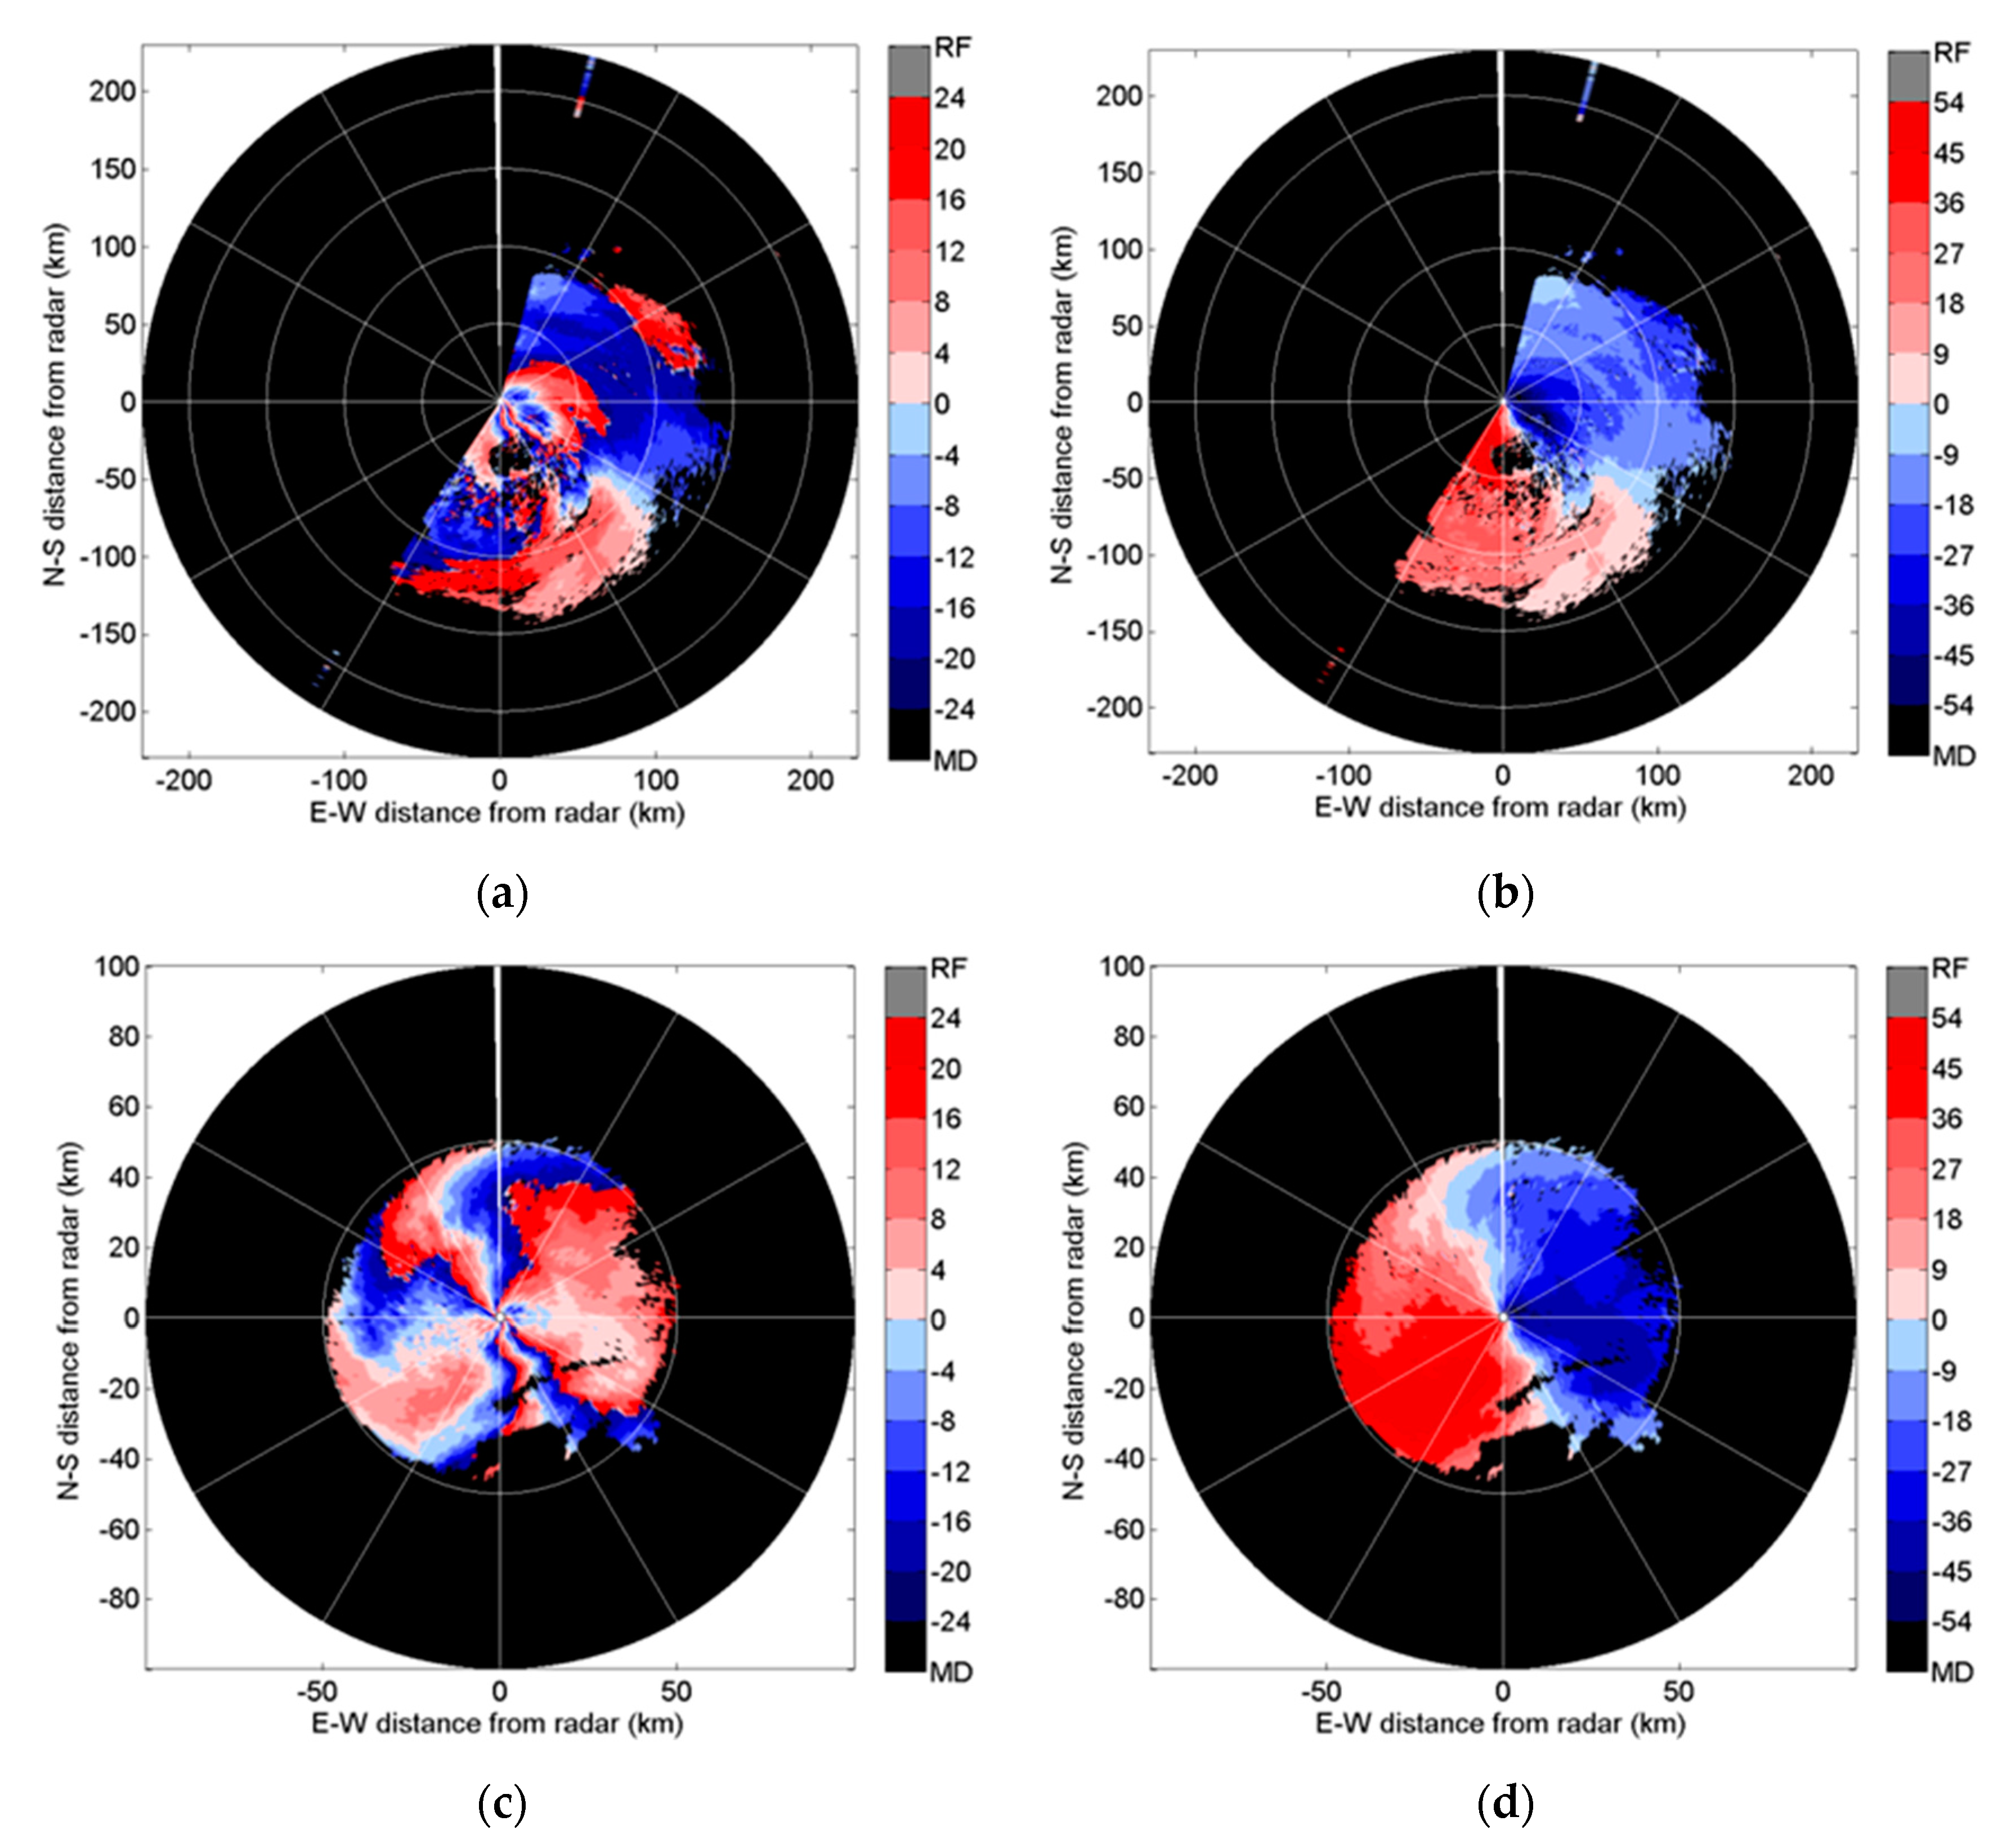
3.2. Result of Typhoon Fanapi from an S-band Radar of Taiwan
Typhoon Fanapi formed as a tropical storm on 14 September 2010, southeast of Taiwan. It intensified into a typhoon on 16 September and started moving northwest. By 18 September, Fanapi had strengthened into a category three typhoon heading toward Taiwan with maximum sustained wind speeds of 54 m/s. Fanapi made landfall early on 19 September, at which time it changed direction and started moving southwest. Later that day, it weakened to a tropical storm that lasted 9 h, before becoming a tropical depression on 20 September and totally dissipating on 21 September.
The dealiasing of typhoon observations is always a challenge for any algorithm because of the high wind speed of the typhoon vortex. The phenomena of a large area and multiple aliasing may happen easily. The dealiasing algorithms often fail especially when the typhoon eyes is close to the radar station. The radial velocity field will exhibit asymmetry on both sides of the “zero” velocity line.
Figure 3 shows the Fanapi Typhoon case observation by the Hualien radar at 23:53 (UTC), 18 September 2010, just before the typhoon made landfall.
Figure 3a,c display the raw radial velocity field observed at the elevation angle of 3.3° at a 14.6°, respectively. The new algorithm can correctly change the aliased velocity in both angles (
Figure 3b,d). As mentioned in module 2, the GVAD technique found out the first reference radial near 330° on a 14.6° elevation angle. The correct first reference makes sure the rest of the modules were executed successfully.
3.3. Result of a Squall Line Case from a CINRAD S-Band Radar
Squall lines are a type of convective system that can cause damaging winds, heavy rain and hail. Strong updrafts and downdrafts are present in the convective area of a squall line. This squall line involving severe thunderstorms grew in the Guangxi Province of China between 29 March and 31 March 2014, with wind speeds greater than 14 m/s observed by 34 automatic meteorological stations. Hail damage was reported in 13 cities. Two people died from this hazardous weather event and the economic and property losses were appraised to be $9.32 million.
When strong wind shear appears in radar radial velocity observations, such as that often existing in tornadoes or squall lines, most of the current algorithms can easily fail because of the difficulty in distinguishing the non-meteorological shear caused by the aliased data from the real shear. Squall line systems have the characteristics of rapid development, fast movement and short lifetimes. Data voids often appear at low elevation angles of radar observations of squall lines (Glickman 2000). An effective dealiasing algorithm should have the ability to address these difficulties.
Figure 4 shows the radial velocities before and after dealiasing the squall line case observations from the Guangxi S-band radar at 20:28 (UTC), UTC 30 Mar 2014, at several elevation angles.
Figure 4a is the raw radial velocity at the 4.3° elevation angle.
Figure 4b shows the result of the flag field after module 3 in the ADDA algorithm. Module 3 was able to successfully protect the real convection regions with flag 3 throughout the whole case period. The yellow line represents the position of the first reference radial where the algorithm started for this particular volume.
Figure 4c is the dealiasing result after the first two steps of module 4. Because of the existence of a discontinuous echo area in the southwest of the radar observation, between the 50 and 100 km ranges, an incorrect dealiasing area appears in the white ellipse in
Figure 4c. The last two steps in module 4 helped correct the errors in this area but resulted in incorrectly dealiased data (blue shaded area in the white ellipse in
Figure 4d) due to the strong velocity difference near the wind shear line.
Figure 4e shows the final dealiased result after the local error check of module 5. All the aliased data are correctly dealiased at this elevation angle. This example showed the benefit of the two added dealiasing passes in module 5 in ADDA.
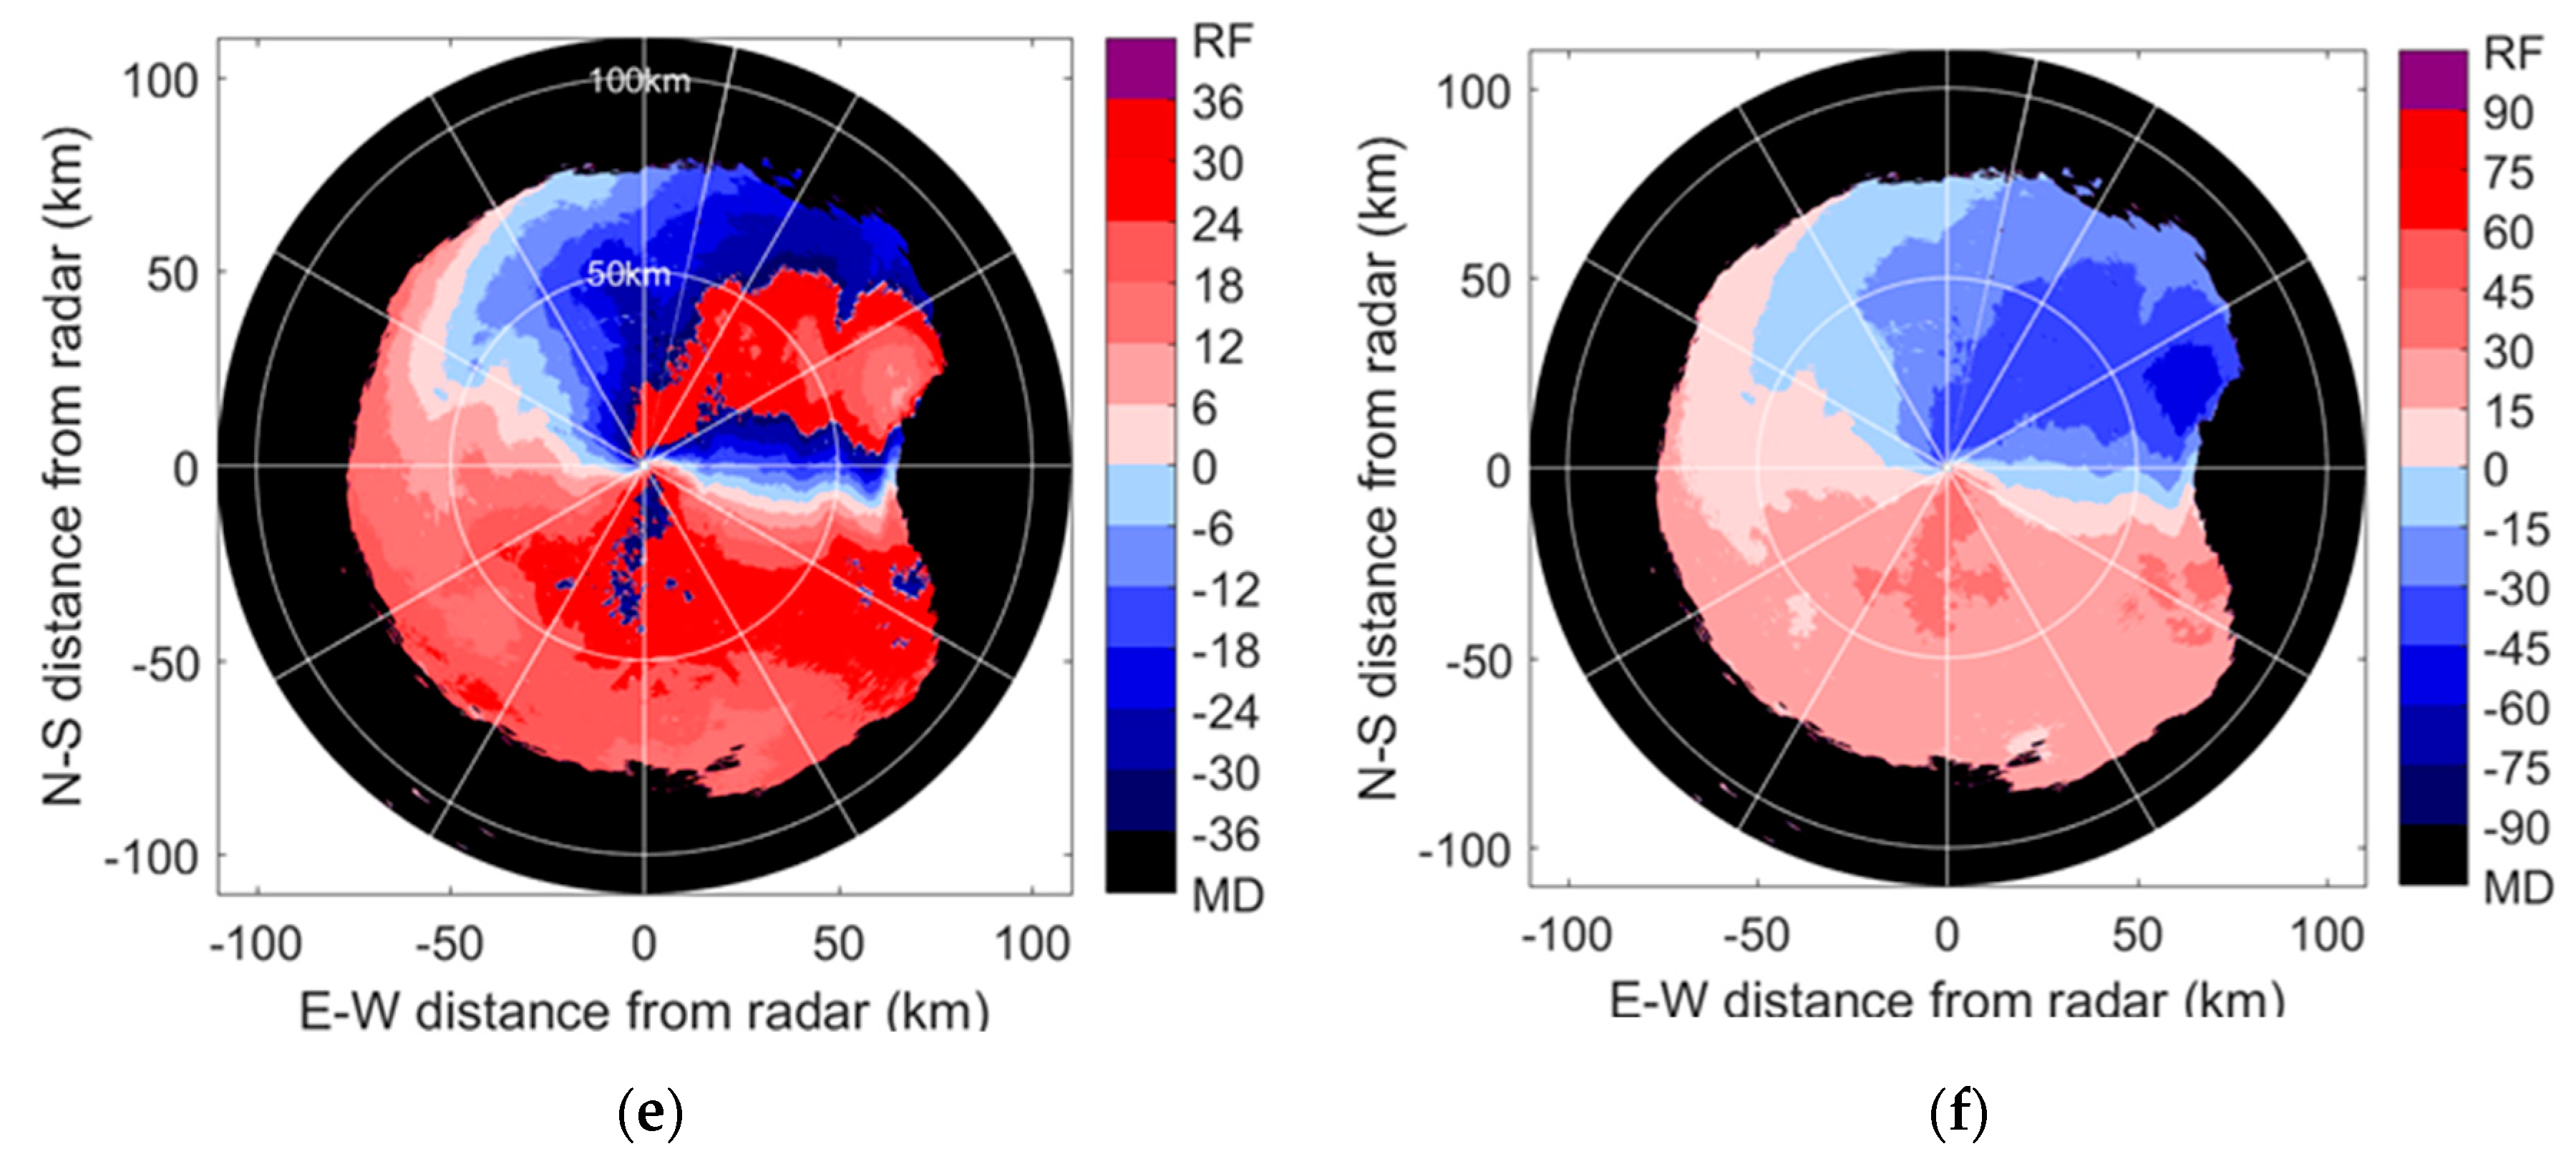
3.4. Results of a Squall Line and a Hailstorm from CINRAD C-Band Radars
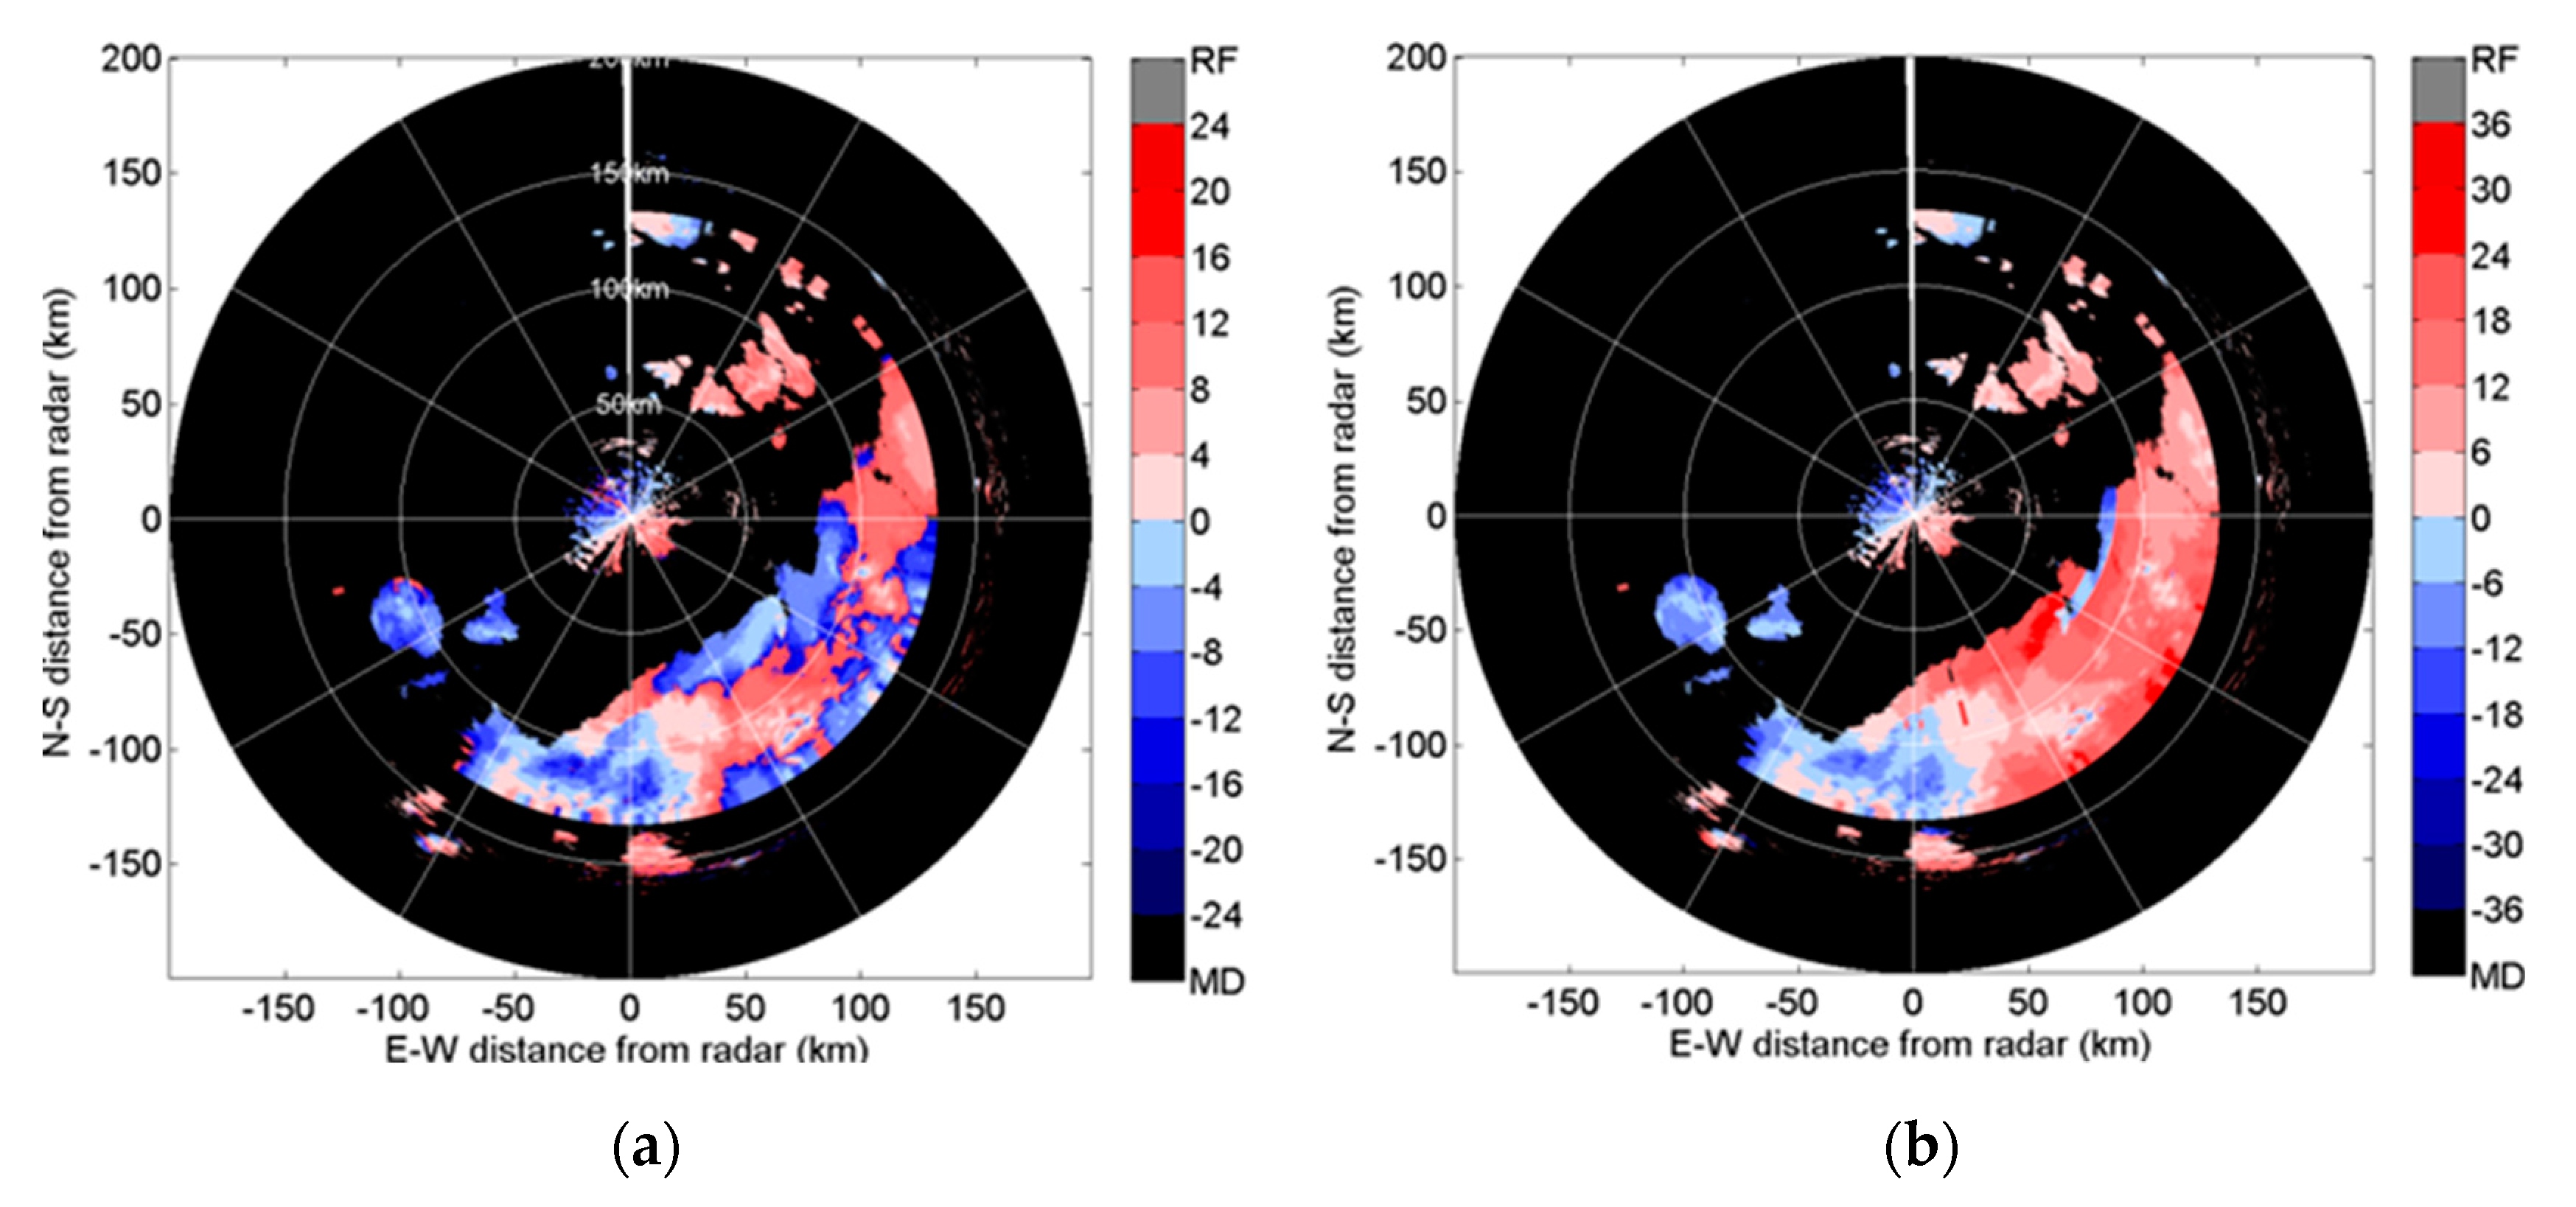
Nearly half of the radars in China’s CINRAD network are C-band Doppler radar systems, which are mainly installed in the northeast and midwest of China. These C-band radars present particular challenges for dealiasing algorithms due to their small Nyquist velocity values. To examine the capability of ADDA in dealing with aliased velocities from C-band radars, we ran ADDA for two intense convective cases. The first was a squall line system initiated in the northwest part of North China close to 05:00 (UTC), 23 July 2009, which developed to its maximum intensity when the storm passed through Beijing at 09:00 (UTC). Six CINRAD radar systems, including the C-band Zhangbei radar, observed the event. The Nyquist velocity of the Zhangbei radar was only 13.55 m/s, resulting in a considerable amount of folded velocity data.
Figure 5a displays the original radial velocity observation at the 3.3° elevation angle of 3.3° by the Zhangbei radar at 07:05 (UTC), 23 July 2009. The dealiasing result shows that more than 95% of the aliased data were correctly dealiased at this elevation, and the only error appears in the eastern area of the radar field between the 100 and 200km ranges shown by the narrow arc-shaped blue band (within the white ellipse) in
Figure 5b. Because some remaining noisy gates and large observations of the missing area led to insufficient velocity gates with the same distance from the radar, the quadratic least squares error check in the azimuth direction could not determine accurate coefficients for some ranges.
The second case was a hailstorm event observed by the Datong C-band radar in the Shanxi province of China on 27 June, 2008. The large wind speeds, i.e., those exceeding 25 m/s, that occurred during this event caused many aliased velocity observations since the Nyquist velocity of the Datong radar was only 13.99 m/s.
Figure 5c shows the raw radial velocity field at the 4.3° elevation angle from the Datong radar at 08:06 (UTC), 27 June 2008. The aliased data (blue shade), including the isolated echoes, were completely corrected, as shown in
Figure 5d.
Due to the small Nyquist velocities and the higher frequencies of occurrence of the patchy observations from the CINRAD C-band radar, ADDA has a lower success rate for the two C-band cases than for the other S-band cases (see
Table 2).
4. Discussion
The ability of ADDA for all the selected radar observations from the seven severe weather events was assessed statistically and also contrasted with the results obtained with the CIDA scheme, as described in HE2012 [
17]. The judgment was built on the metrics of the false alarm ratio (FAR), probability of detection (POD), and critical success index (CSI). The following formulas were applied to compute the FAR, POD, and CSI:
where: A = total number of aliased gates; B = total number of correctly dealiased gates; C = total number of incorrectly dealiased gates; D = total number of missed dealiased gates.
The FAR shows the percent of these velocity gates that should be aliased but are not; the POD gives the percent of all aliased velocity gates that are dealiased; and the CSI gives the number of properly dealiased velocities over all of the velocities that are correctly dealiased, missed, and erroneously dealiased. In other words, the denominator is all the velocities minus those that are not aliased. The period of continuously tested radar observations was more than 12 h for each of the seven cases. More than half of the velocity gates were aliased among the total 7463 tilts. Some of these gates were even aliased multiple times, especially in the hurricane or typhoon cases and the deep convection cases observed by the C-band radar systems with smaller Nyquist velocities. All of the tilts were dealiased, and the aliased tilts were hand-edited to produce “truths” for evaluation. The “truths” for the analysis were manually dealiased with SOLOII software developed by the National Center for Atmospheric Research. SOLOII software is a widget-driven piece of software that displays sweeps of radar data and enables the user to manually dealias the radial velocity data.
Table 1 and
Table 2 show the statistical dealiasing results of the seven cases from ADDA and CIDA. First, it is shown that ADDA performs better CIDA for all the seven cases. The China Haikou and Taiwan Hualian radars for typhoons observation have the most obvious skill improvement, which was primarily attributable to the advanced selection of the first reference radial. The CINRAD Guangxi radar for the squall line case also resulted in significant skill improvement due to the ability of the algorithm in module 4 to distinguish the real shear caused by convection from the false shear caused by aliased velocities. For the two most inaccurate CINRAD C-band radars, the Datong radar showed a significant improvement while the Zhangbei radar had only minor improvements. In addition to the inherent difficulties in dealiasing the C-band radar data because of their small Nyquist velocities, the Zhangbei radar presented additional challenges due to the excessive data voids caused by topography. Comparing the statistical results of the seven cases, it was seen that the typhoon or hurricane cases resulted in higher skills than the continental convection cases. Moreover, the results for the S-band radar were noticeably better than those for the C-band radar, which is not surprising given the low Nyquist velocities of the C-band radar.
Overall, the new ADDA algorithm exhibited a reliable performance for five S-band radar systems and two C-band radar systems, despite being from different networks with different scanning strategies. ADDA’s ability to dealiase the C-band radar data was reasonably good. It is worth noting that no dealiasing algorithm can do a perfect job, but fortunately, most data assimilation systems have general quality check schemes to get rid of suspicious data using model backgrounds as a necessary step for cleaning up the data prior to assimilation.
5. Conclusions
An improved velocity dealiasing named algorithm ADDA was presented and evaluated in this paper, which was then further prepared with the aim of future applications for radar data assimilation. The skill of the ADDA algorithm was examined for seven severe convective cases, including hurricanes, typhoons and continental convective cases observed by either S-band or C-band radars from three different operational networks, with a total of 849 volumes and 7463 tilts of data. The selected cases were all seriously aliased for a large percentage of the tilts, and some tilts contained challenging situations with multiple-aliased radial velocity gates due to strong wind speeds or small radar Nyquist co-intervals.
The new ADDA included five modules, which were devised to remove noise, to select the properly first reference radial, to preserve the real convective shear regions, to determine and revise the aliased velocities with a two-direction multiple-pass method and to redress the wrong dealiasing results with local error checks. The choice of the first reference radial close to the zero line guarantees that the ADDA scheme begins with the velocity gates that are less likely to be aliased. The G-VAD scheme, with the information of the radial velocity gradient in the second module, was illustrated to help enhance the accurateness of first reference radial selections in typhoon and hurricane cases, where twice-folded situations occur quite regularly. It was also shown that module 3, in which a three-step scheme to discriminate between the real weather shear and the aliased shear was applied, was effective for keeping the vigorous convective regions intact and preventing erroneous dealiasing. The two-way multiple-pass dealiasing scheme employed in module 4 enhanced the dealiasing accuracy, especially when aliased gates appeared close to large regions of missing observed gates. Furthermore, we found that the linear least-square error checks along the radar’s radial direction and quadratic least-square error check along radar azimuthal direction added in the last module removed the remaining dealiasing errors in the typhoon and hurricane cases.
The statistical dealiasing results of the ADDA scheme, with metrics including pod, far, and csi, illustrated that the improved ADDA scheme performs better than the CIDA scheme for seven cases, with the most obvious advancements for the Haikou Typhoon Rammasun case and the Taiwan Typhoon Fanapi case, and for the squall line case observed by the CINRAD Guangxi S-band radar. The advanced dealiasing resulted from the more accurate selection of the first reference radial and the ability of the scheme to preserve the physical shear associated with vigorous convection. The success rate of ADDA for S-band radar stations was above 96% in terms of POD. The skill of ADDA for the CINRAD C-band radar was lower but reasonably good, given the challenges associated with these C-band radar systems.
ADDA is currently being implemented for the data assimilation systems of the variational Doppler data analysis system (VDRAS) and the weather research and forecasting data assimilation system (WRFDA), as radar quality control software systems. Both systems have operational capabilities, so ADDA can be operationally running. ADDA can be run automatically, with human interaction required only when a hurricane approaches the radar, in which case the G-VAD in module 2 and the linear and quadratic local fits need to be turned on. To make ADDA fully automated, a hurricane detection algorithm is needed, which will be one of our future projects.


