Article

Determination of Appropriate Remote Sensing Indices for Spring Wheat Yield Estimation in Mongolia

by
Battsetseg Tuvdendorj
1,2,
Bingfang Wu
1,2,*,
Hongwei Zeng
1,2,
Gantsetseg Batdelger
3 and
Lkhagvadorj Nanzad
2,3,4
1
State Key Laboratory of Remote Sensing Science, Aerospace Information Research Institute, Chinese Academy of Sciences, Beijing 100101, China
2
University of Chinese Academy of Sciences, Beijing 100049, China
3
National Remote Sensing Center, Information and Research Institute of Meteorology, Hydrology, and Environment (IRIMHE), Ulaanbaatar 15160, Mongolia
4
Key Laboratory of Digital Earth Science, Aerospace Information Research Institute, Chinese Academy of Sciences, Beijing 100194, China
*
Author to whom correspondence should be addressed.
Remote Sens. 2019, 11(21), 2568; https://0-doi-org.brum.beds.ac.uk/10.3390/rs11212568
Submission received: 6 September 2019 / Revised: 22 October 2019 / Accepted: 29 October 2019 / Published: 1 November 2019
(This article belongs to the Special Issue Remote Sensing in Agriculture: State-of-the-Art)

Abstract

:
In Mongolia, the monitoring and estimation of spring wheat yield at the regional and national levels are key issues for the agricultural policy and food management as well as for the economy and society as a whole. The remote sensing data and technique have been widely used for the estimation of crop yield and production in the world. For the current research, nine remote sensing indices were tested that include normalized difference drought index (NDDI), normalized difference water index (NDWI), vegetation condition index (VCI), temperature condition index (TCI), vegetation health index (VHI), normalized multi-band drought index (NMDI), visible and shortwave infrared drought index (VSDI), and vegetation supply water index (VSWI). These nine indices derived from MODIS/Terra satellite have so far not been used for crop yield prediction in Mongolia. The primary objective of this study was to determine the best remote sensing indices in order to develop an estimation model for spring wheat yield using correlation and regression method. The spring wheat yield data from the ground measurements of eight meteorological stations in Darkhan and Selenge provinces from 2000 to 2017 have been used. The data were collected during the period of the growing season (June–August). Based on the analysis, we constructed six models for spring wheat yield estimation. The results showed that the range of the root-mean-square error (RMSE) values of estimated spring wheat yield was between 4.1 (100 kg ha−1) to 4.8 (100 kg ha−1), respectively. The range of the mean absolute error (MAE) values was between 3.3 to 3.8 and the index of agreement (d) values was between 0.74 to 0.84, respectively. The conclusion was that the best model would be (R2 = 0.55) based on NDWI, VSDI, and NDVI out of the nine indices and could serve as the most effective predictor and reliable remote sensing indices for monitoring the spring wheat yield in the northern part of Mongolia. Our results showed that the best timing of yield prediction for spring wheat was around the end of June and the beginning of July, which is the flowering stage of spring wheat in this study area. This means an accurate yield prediction for spring wheat can be achieved two months before the harvest time using the regression model.

Graphical Abstract

1. Introduction

Food security is an important topic for every country in the world [1]. Accurate and timely estimation of the spring wheat yield on regional and national scales is becoming absolutely essential for developing countries like Mongolia. In particular, crop yield estimation and the monitoring of crop production can provide fundamental information for crop producers, decision-makers in planning harvest and for agricultural development overall [2]. The agriculture sector is the second contributor to the Mongolian economy after mining [3]. However, only 13% of agricultural production is sourced from crops, mostly spring wheat, the remaining 87% is from the livestock [4] since the Mongolian climate is more suitable for extensive grazing, which covers more than 80% of the total land area. The spring wheat is below 1% of the total land area and around 1.35 million hectares of the total land is suitable for crop cultivation [5]. The northern part of Mongolia has the most favorable natural conditions and a more suitable area for rain-fed crops [6]. Hence, most of the spring wheat is grown in the northern provinces due to above-average precipitation. However, precipitation can only support the basic water requirement of spring wheat, and little variation in precipitation would cause a big fluctuation in crop yield. The vegetation cover, crop yields, and their growth are highly dependent on the amount of precipitation and the related soil moisture [7,8]. Mongolia has an extreme continental climate, with a short growing season, high evaporation, and low precipitation, which pose serious limitations for the Mongolian agriculture development. Because of the high altitude, our country’s climate is much colder than other countries in the same latitude. More than 80% of total spring wheat cultivation is rain-fed and only 5000 hectares is irrigated for spring wheat in Mongolia [4]. Therefore, agricultural production is particularly sensitive to climate variability and climatic conditions make agriculture very challenging. Due to the impacts of climate change, more extreme and continued droughts have occurred in many parts of Mongolia and have directly affected the vegetation and crop growth, biodiversity and socioeconomics in Mongolia [9]. Nanzad et al. [10] found that about 41–57% of Mongolia has been ravaged by mild to severe droughts for many of the last 17 years. A consecutive severe drought in 2002, 2005, 2007, 2010, 2013, and 2015 lowered spring wheat production severely as shown in Figure 1 and spring wheat had to be imported as local production declined due to weather conditions [4].
Weather information is normally used to forecast crop yield, but there is a lack of continuous measurement among others due to cost factors. Using Earth observation satellite imagery for monitoring temporal and spatial variation, combined with the point observation as a co-monitoring has advantages. Furthermore, satellite imagery is produced at a lower cost than the traditional way and is more easily accessible for use [11,12]. The use of remote sensing data helps to assess crop conditions in different fields at regional and whole country levels, even in remote areas, as it gives a timely and accurate measurement. Therefore, there have been many attempts in the applications of remote sensing in crop yield estimation, monitoring and mapping and most of these work streams indicated that remote sensing technology was prospective and promising [13,14,15,16,17,18,19,20,21]. A number of field studies have shown that models based on remote sensing data enable to estimate crop yield in many countries. Usually, remote sensing derived indices are connected to crop yield using empirical regression-based models [22,23]. During the past decades, remote sensing has been broadly used in forecasting crop yield. The Advanced Very-High-Resolution Radiometer (AVHHR) is the most popular sensor, the most widely used in terms of crop monitoring and yield forecasting since the early 1980s for a large scale [24,25]. In recent years, satellite-derived data such as Moderate Resolution Imaging Spectroradiometer (MODIS), Landsat, and Sentinel data were used for the yield prediction and monitoring and meaningful results have been obtained [11,12,26,27,28]. Lewis et al., [29] used AVHRR-NDVI data for maize production forecasts and correlated results showed that forecasts could be obtained one month before the harvest. In Spain, Vicente-Serrana et al. [30] combined AVHHR-NDVI data and drought indices and were able to predict wheat and barley yield four months before harvest. Moreover, Peterson [12] found the best timing to predict crop yield was from two to four months before the harvesting using NDVI, EVI, and NDWI of MODIS for different crops in Africa. Recently, some remote sensing indices such as the normalized multiband drought index (NMDI), vegetation supply water index (VSWI), and visible and shortwave infrared drought index (VSDI) were utilized in a number of studies for drought and crop monitoring and crop yield estimation according to previous studies [31,32,33,34]. The more promising method is using crop growth modeling that incorporates updated crop biophysical parameters such as leaf area index (LAI) and a fraction of absorbed photosynthetically active radiation (fPAR) retrieved from satellite imagery and by using survey information of crops throughout the growing season in local to regional areas. For example, Huang et al. [35] found that more accurate county-level winter wheat estimation was obtained using the WOFOST-PROSAIL model. Furthermore, many researchers have developed crop growth models to estimate crop yields [36,37,38,39,40]. However, the crop growth models require more specific information, such as daily weather data, soil properties, and crop growth determining factors, which would make analytical costs excessive. It is obvious that no general indicator can be used to predict crop yields in all regions. The applicability of the indicator will vary with the region, crop type, and crop growth stage.
Some recent studies in Mongolia were conducted to monitor the cropland cover changes, to assess land degradation for the agricultural region. Erdenee et al. [5] have used Landsat TM and ETM data in the detection of changes cropland over Tsagaannuur, Selenge provinces from 1989 and 2000. Otgonbayar et al. [41] investigated to prepare a cropland suitability map of Mongolia using Landsat and MODIS (MOD13, MOD15, and MOD17). Furthermore, Enkhjargal et al. [42] used MODIS and SPOT time-series remotely sensed data from 2000–2013 to estimate long-term soil moisture content in agricultural regions of Mongolia. Ariya [43] used Landsat images from 2000 and 2015 to assess land degradation for the agricultural area of Mongolia. Nevertheless, to date, no studies of crop yield estimation using remote sensing indicators have been done yet in Mongolia. Recently, remote sensing indicators are employed to monitor the drought across the pasture lands of Mongolia [44] and provide valuable information for drought management and reduction. Compared to drought, more attention should be paid to crop yield, while these indices were not getting enough attention in the field of crop yield in Mongolia. The small variation of precipitation would cause the big fluctuation of crop yield so that it is very important to forecast spring wheat yield early for food security in Mongolia. Although spring wheat accounts for a small proportion of Mongolia’s land area, as the size of the spring wheat field is large enough that it provides the possibility of predicting spring wheat yields based on remote sensing technology in Mongolia.
Therefore, our analysis focuses on Selenge and Darkhan provinces of Mongolia due to the availability of high-quality spring wheat yield data for those regions. It is the first attempt to estimate the spring wheat yield using space observation technology in Mongolia. The main objectives of this study were as follows: (i) to evaluate the potential of using remote sensing nine indices to estimate spring wheat yield; (ii) to choose the more suitable remote sensing indices for predicting spring wheat yield; (iii) to identify the best timing and more accurate model to estimate spring wheat yield in Northern Mongolia.

2. Study Area and Data
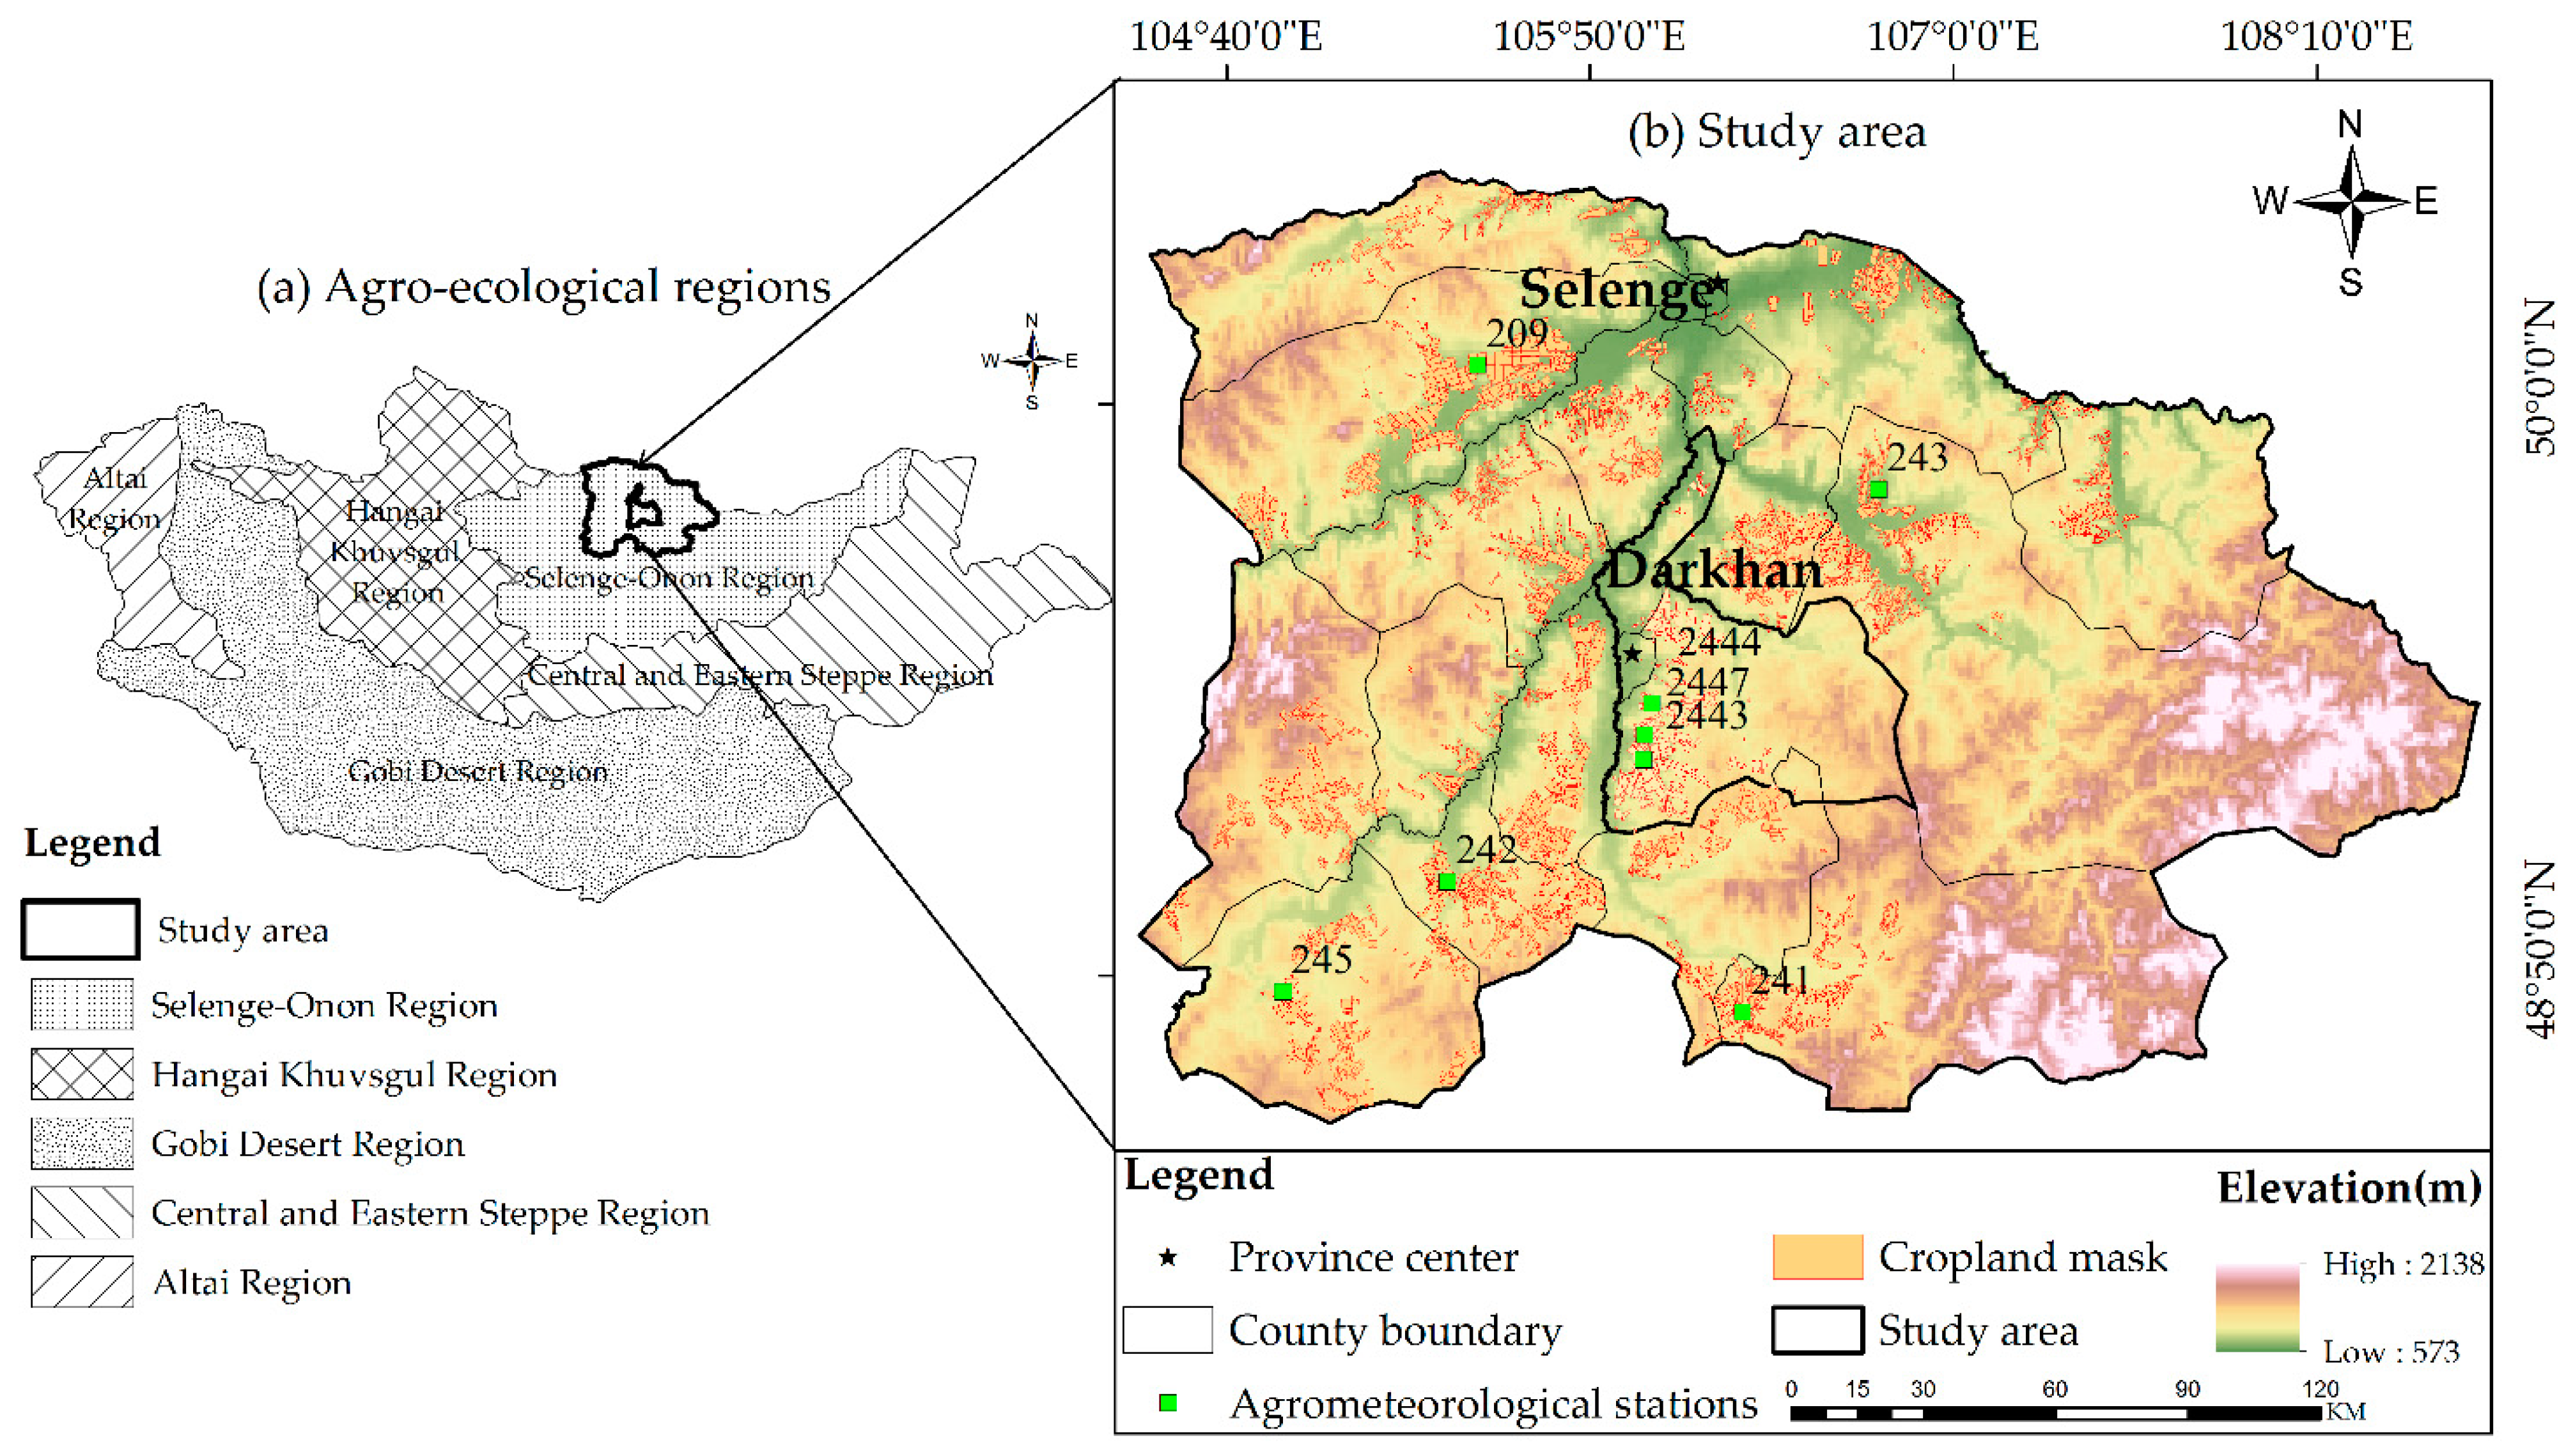
2.1. Study Area

Mongolia is divided into five different agro-ecological regions, which reflect distinct geographical patterns of agricultural production and climate. The study was conducted in Darkhan and Selenge provinces, which is located in Selenge-Onon agro-ecological region (N48–51 °C and E104–108 °C) (Figure 2). Selenge and Darkhan provinces are the principle cropping area for and account for more than 50% of national total grain production (Figure 1). In this region, most of the spring wheat cultivated area is rain-fed cropland. Thus, determining the fluctuation of spring wheat yield is highly dependent on the weather condition. The region averages between 90 to 110 frost-free days and has annual mean precipitation between 250 and 400 mm. In addition, crop growing duration is short (90–140 days) in this region, and depends on location and altitude. Approximately 90% of the nationwide precipitation is lost to evapotranspiration, which is associated with a continental climate. The remaining 10% of the total precipitation has been unable to evaporate, and 37% contribute to soil and underground reserves and streams, while 63% is surface runoff. In other words, 3–4% of total precipitation becomes potentially available as a water resource in the form of soil moisture or groundwater [6]. Additionally, the mean annual temperature is between 0.0 °C and 2.5 °C with cold temperature in January to –20 °C and warm temperature in July to 19 °C. Average elevations in this region have ranged between 1500 and 2000 m [45].

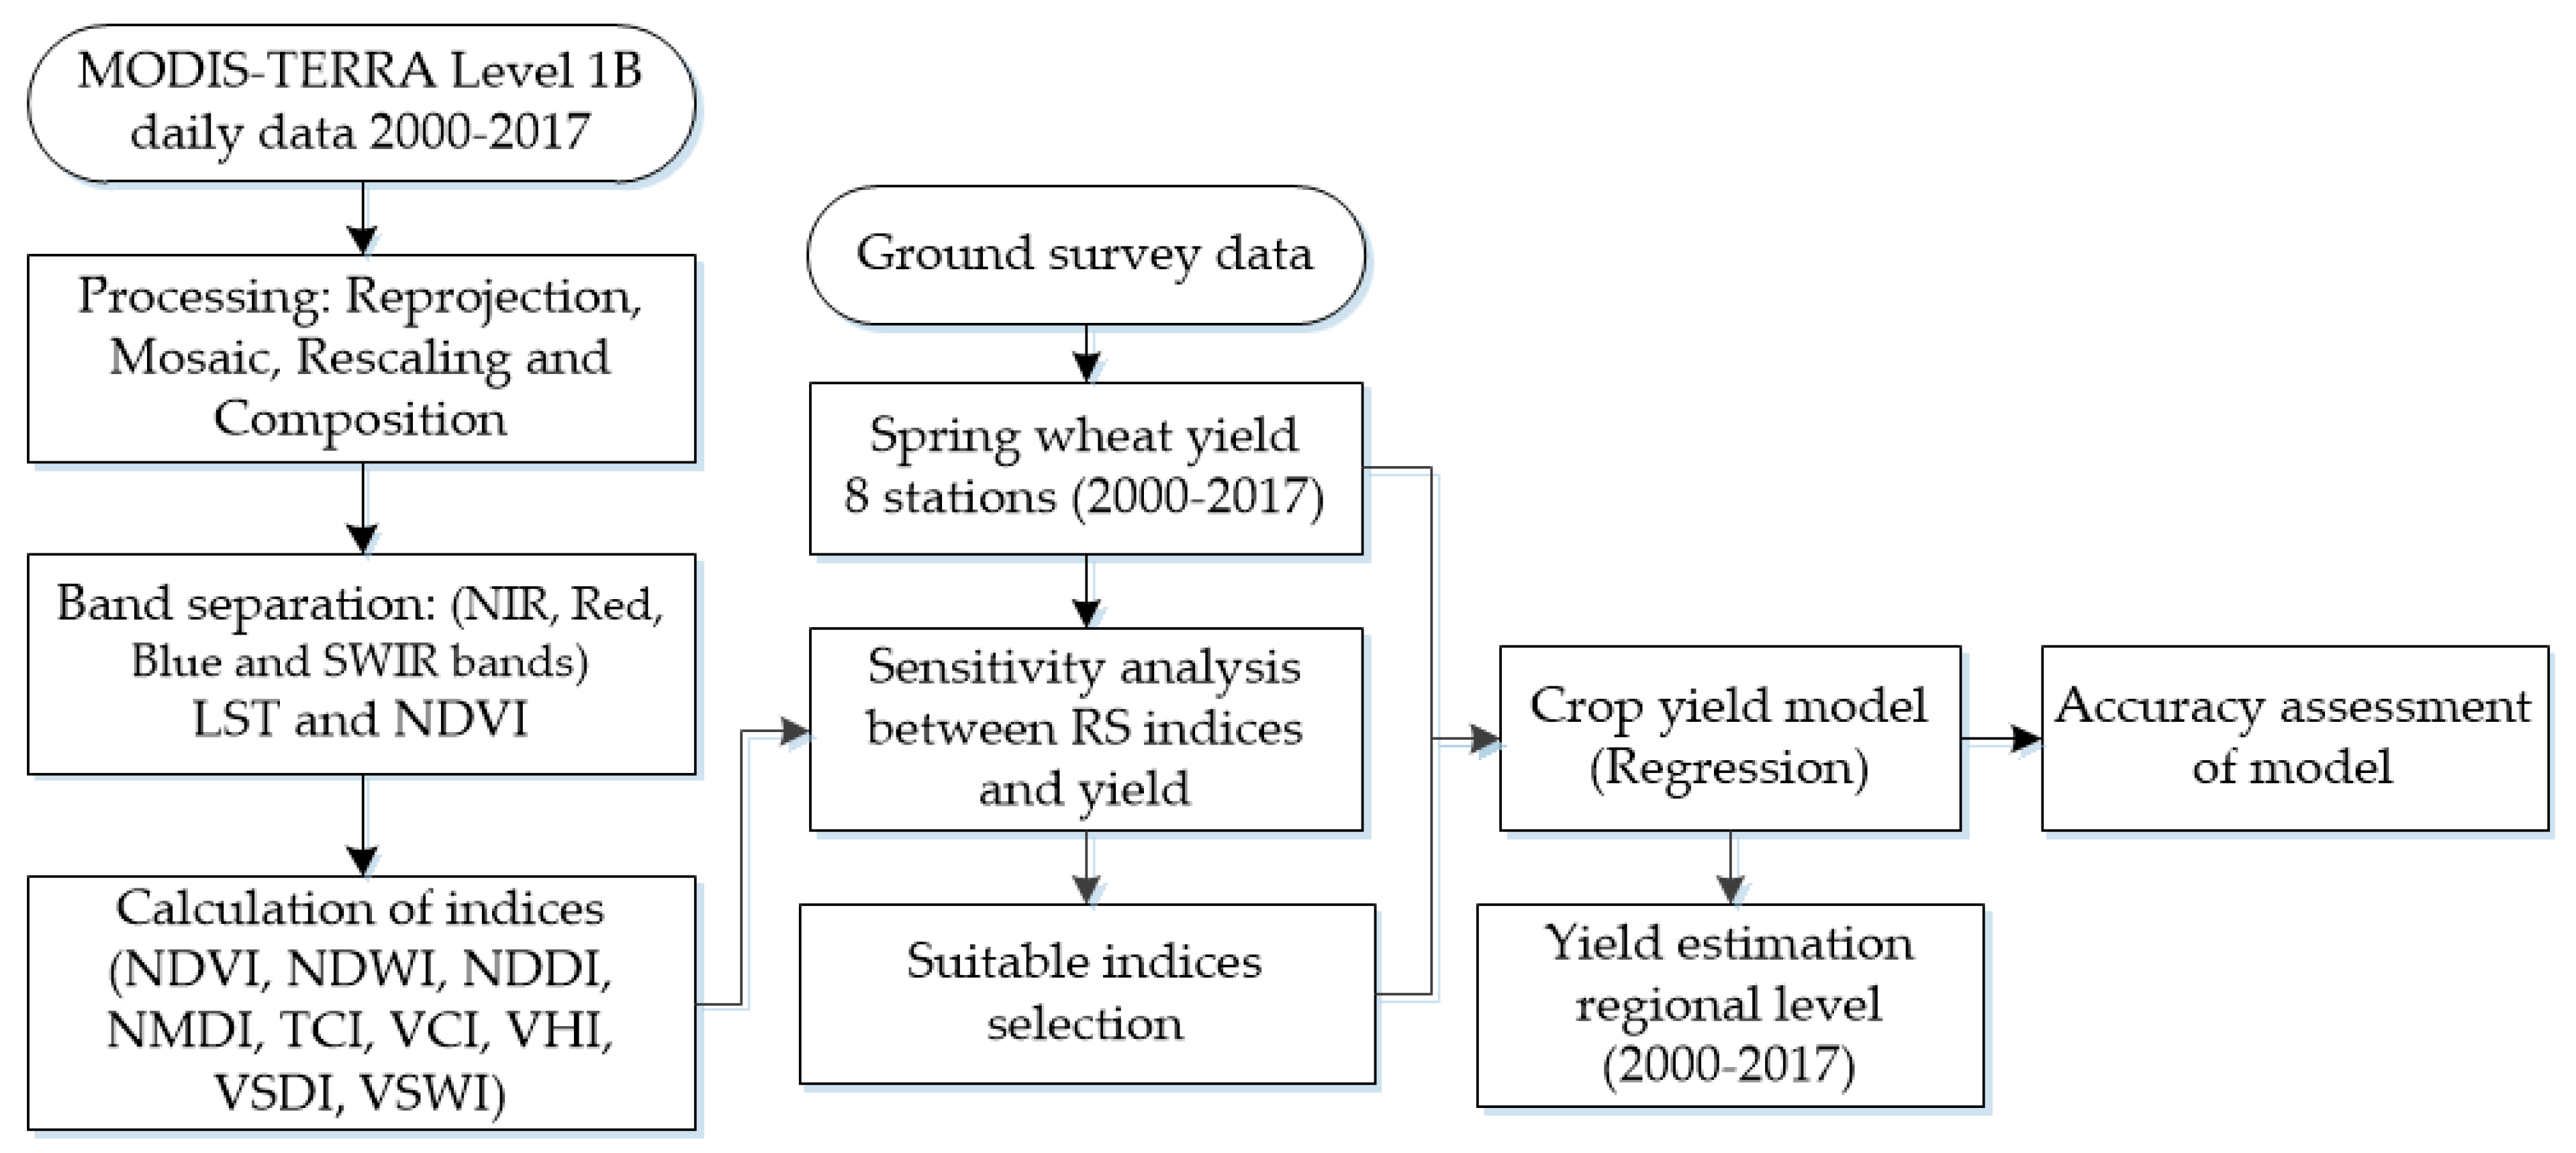
2.2. MODIS Data and Processing

This study applied the use of 1 km spatial resolution, daily intervals MODIS/MOD1B time-series data to evaluate spring wheat yield. The MODIS data provided a high temporal resolution and wide coverage areas but a low spatial resolution. MODIS time-series data during the growing season (June to August) were obtained for the study area from the Atmosphere Archive and Distribution System (LAADS) of (NASA) for 2000–2017. Available online https://ladsweb.modaps.eosdis.nasa.gov (accessed on 20-10-2019). The study area covered over three tiles of granules of MODIS data such as an H24V03, H24V04, and H25V04 (H is horizontal and V is vertical coordinate). All downloaded MODIS 18 years’ images were re-projected from sinusoidal to the Albers equal area projection. The reflectance bands (NIR, red, blue, and SWIR) were calculated using MOD021KM level 1b calibrated data. In the processing section, all the collected images were re-projected, mosaicked and calibrated for atmospheric and geometric correction using ENVI IDL software. In this study, the nine vegetation and drought indices (NDVI, NMDI, NDWI, VCI, TCI, VHI, NDDI, VSDI, and VSWI) are calculated from cloud-free and corrected reflectance bands.

2.3. Crop Data

In this study, we have utilized annual spring wheat yield data for eight agrometeorological stations from 2000 to 2017 in Northern Mongolia (Table 1). The sowing stage of spring wheat is generally in the first decade of May. All the crops present an important vegetative development in the June–August period and spring wheat harvest occurs generally in September. The statistics of spring wheat yield were obtained from the agrometeorological division of Information and Research Institute of Meteorology, Hydrology, and Environment (IRIMHE) in Mongolia. Agrometeorological stations measure the crop phenology stage, growth condition and damage, crop density and height for every 10 days from May to September. Finally, the spring wheat yield sown from sampling surveys at the end of the growing season was also measured. Spring wheat yield was collected in 50 × 50 cm plots, in four repeated samplings at each agrometeorological station. From the homologies sample plots, four samples of spring wheat were taken through crop cutting from a different area at equal distance and their average was taken to minimize random errors. Before thrashing and weighting the spring wheat grain yield, the sample plot was placed in the oven for 5–10 min and at 20°C–25°C to easily split the grain yield and the straw. The final spring wheat grain weight of each station was converted to 100kg ha−1 unit. As shown in (Figure 3), the phenological stages of the normal growth cycle of spring wheat and mean climate variables in the study area from May to September (2000–2017). In order to obtain the crop remote sensing indices values correctly, we had to solve image masking for regional spring wheat yield estimation. Applying a cropland mask to select remote sensing indices values as input to a crop yield model significantly improves the accuracy of the crop yield estimation [18,46]. A copy of the crop cover mask was obtained from the land cover map of Mongolia, provided by Elbegjargal et al. [47], and used to reduce the influence of non-agricultural areas on the remote sensing indices signal [48]. Finally, all areas with non-agricultural land were masked out and the regional annual yield was estimated and mapped for only cropland areas yield estimated maps were produced by model (M4) in the study area from 2000 to 2017.

3. Methodologies

The purpose of this study is to create a predictive measure of spring wheat yield computed from satellite data. The methodology has three main parts. Firstly, we calculate the nine remote sensing indices using MODIS data. Secondly, nine remote sensing indices are used for the relationship between actual spring wheat yield as input for the testing of the estimation model of spring wheat yield. Thirdly, we develop spring wheat yield regression models and map estimated spring wheat yield for the regional level to the 18 years. The general flowchart of this research, the processing method, and the individual steps are illustrated in Figure 4.

3.1. Calculation of Remote Sensing Nine Indices:

Crop yield is markedly influenced by the growth conditions in each crop stage. Nine typical vegetation and drought indices were computed and compared with spring wheat yield. These indices are commonly used for crop yield estimation, drought monitoring, and only require optical spectral bands for calculation. For example, the NDVI has been most commonly used for vegetation monitoring, crop yield assessment and forecasting [27,49,50]. Kogan [51] has been developed the VCI to study the response of vegetation to drought conditions worldwide. Unganai et al. [52] conducted that the vegetation condition index (VCI) derived from AVHHR-NDVI correlated significantly with maize yield in Zimbabwe. The growth condition and crop yield are strongly correlated at the pixel level. Each pixel’s value of remote sensing indices was directly taken at point locations of the eight stations. We examined the relationship between NDVI, NDWI, NMDI, TCI, VCI, VHI, NDDI, VSDI, and VSWI with actual spring wheat yield during the growing season (June–August) for 2000–2017 across Northern Mongolia. The 10 day and monthly nine remote sensing indices (NDVI, NMDI, NDWI, VCI, TCI, VHI, NDDI, VSDI, and VSWI), which are derived from transformations of the red, NIR, blue, and SWIR spectral bands, was used to continuous time series of data the represented the spring wheat growth indices temporal curve for each pixel in the study area. We used Table 2 for remote sensing indices calculation. Active plants are intensely absorbed by red and blue bands and reflected by the near-infrared band (NIR) [53]. Depending on the type of plant and the crop yield stage, the absorption of red and blue bands and the degree of the NIR band is different. When vegetation is stressed by lack of water, and also at the end of the growing period, the chlorophyll absorption declines and the ratio of NIR to RED or visible reflectance decreases. Therefore, vegetation index can be defined as the difference between RED and NIR bands reflections measured from satellites. The SWIR-1 and SWIR-2 bands are sensitive to the soil and vegetation moisture content. Hence, we calculated nine remote sensing indices utilized NIR, red, blue, and SWIR bands for spring wheat yield monitoring. Furthermore, we determined which indices from nine remotely sensed indices were more suitable to estimate spring wheat yields. To reduce the impact of atmosphere and cloud, the 10-day remote sensing-based indices derived from the daily data using maximum value composition (MVC) [54] were considered. Besides, we have retrieved monthly remote sensing indices from 10 days MVC indices by a simple moving average method. Particularly, each monthly remote sensing index was calculated by averaging three temporally 10 days MVC indices.

3.2. Sensitive Analysis between Remote Sensing Indicators and Crop Yield

In this study, Pearson’s correlation coefficient (R) between remote sensing indices and spring wheat yield was calculated for every 10 days and every month of the growing season from June to August for the northern part of Mongolia for 2000–2017 using following (Equation (1)). Pearson’s correlation coefficient (R) represents the degree and direction of the linear regression between two continuous variables that are measured on the equal interval. The range of values for the R is from −1 to 1 (R > 0 it is a positive linear relationship, R = 0 it is indicated that there is no relationship and R < 0 it is a negative linear relationship).
R = i = 1 n ( x i x ¯ ) ( y i y ¯ ) i = 1 n ( x i x ¯ ) 2 i = 1 n ( y i y ¯ ) 2 ,
where x i and y i presents remote sensing indices and the value of spring wheat yield at different time periods, n is the number of samples, x ¯ and y ¯ are the average values of x i and y i .

3.3.1. Crop Yield Estimation Model

The process of crop production is directly influenced by many biological, physiological and biophysical laws that are directly responsible for plants, and theoretically, it is possible to model the whole process of vegetative growth by mathematically describing the physical processes of these processes. Nowadays, dynamic modeling techniques are based on simple statistical equations, based on complex differential equations systems, in modeling the events of agroecosystems. In this study, using the remote sensing nine indices, we tested and attempted to develop the spring wheat yield estimation model. The relationship between spring wheat yield and remote sensing indices was observed through the linear regression model, where the independent variable was represented by remote sensing nine indices and the dependent variable was spring wheat. The estimation model is multilinear and includes slope and an interception constant coefficient. The empirical regression methods based on spectral indices have commonly used for modeling crop yield in many studies [49,60,61]. Bolton et al. [62] found a good linear correlation between different crop yields with MODIS-NDVI, EVI, and NDWI data at the county levels. Sui et al. [11] developed the estimation model for winter wheat production based on the environmental factors derived from satellite at a regional level, with errors of <12% for winter wheat yield, respectively. To determine when the correlation between remote sensing indices and spring wheat yield is strongest, we estimated the coefficient of determination (R2) using data from every 10 days and monthly in the growing period of spring wheat. In order to make the final predicted results more accurate and stable, we considered it necessary to select the critical growth stage and remote sensing indices from all indices. We used a stepwise regression model in order to select the best candidate indices for yield estimation using SPSS 12 software. Stepwise regression provides a strong mean between the one or more independent variables and a dependent variable that conforms to the general equation for a multidimensional flat.
Y ^ =   b 0 + b 1 X 1 + b 2 X 2 + + b n X n ,
where, Y ^ is the dependent variable and predicted spring wheat yield, X1, X2... Xn are the independent variables and MODIS remote sensing indices, and b0, b1, b2… bn are the regression coefficients and n is the number of independent variables.

3.3.2. Model Performance Evaluation

Then we selected the month that produced the highest coefficients to the determination to develop multilinear regression models based on all 18 years of data. Generally, the comprehensive method to validate models is to correlate the measured values against the predicted values [48]. We used model fitting and performance statistics such as the coefficient of determination (R2), root mean square error (RMSE), mean absolute error (MAE), bias and an index of agreement (d) agreement.
RMSE = i = 1 n ( Y ^ Y ) 2 n ,
MAE =   1 n i = 1 n | Y ^ Y | ,
d = 1 i = 1 n ( Y i Y ^ i ) 2 i = 1 n ( | Y ^ i Y ¯ | + | Y i Y ¯ |   ) 2   ,
where Y is observed values, Y ^ is modeled values, Y ¯ is an average of observed values, and n is a number of yield and RS data.

4. Results

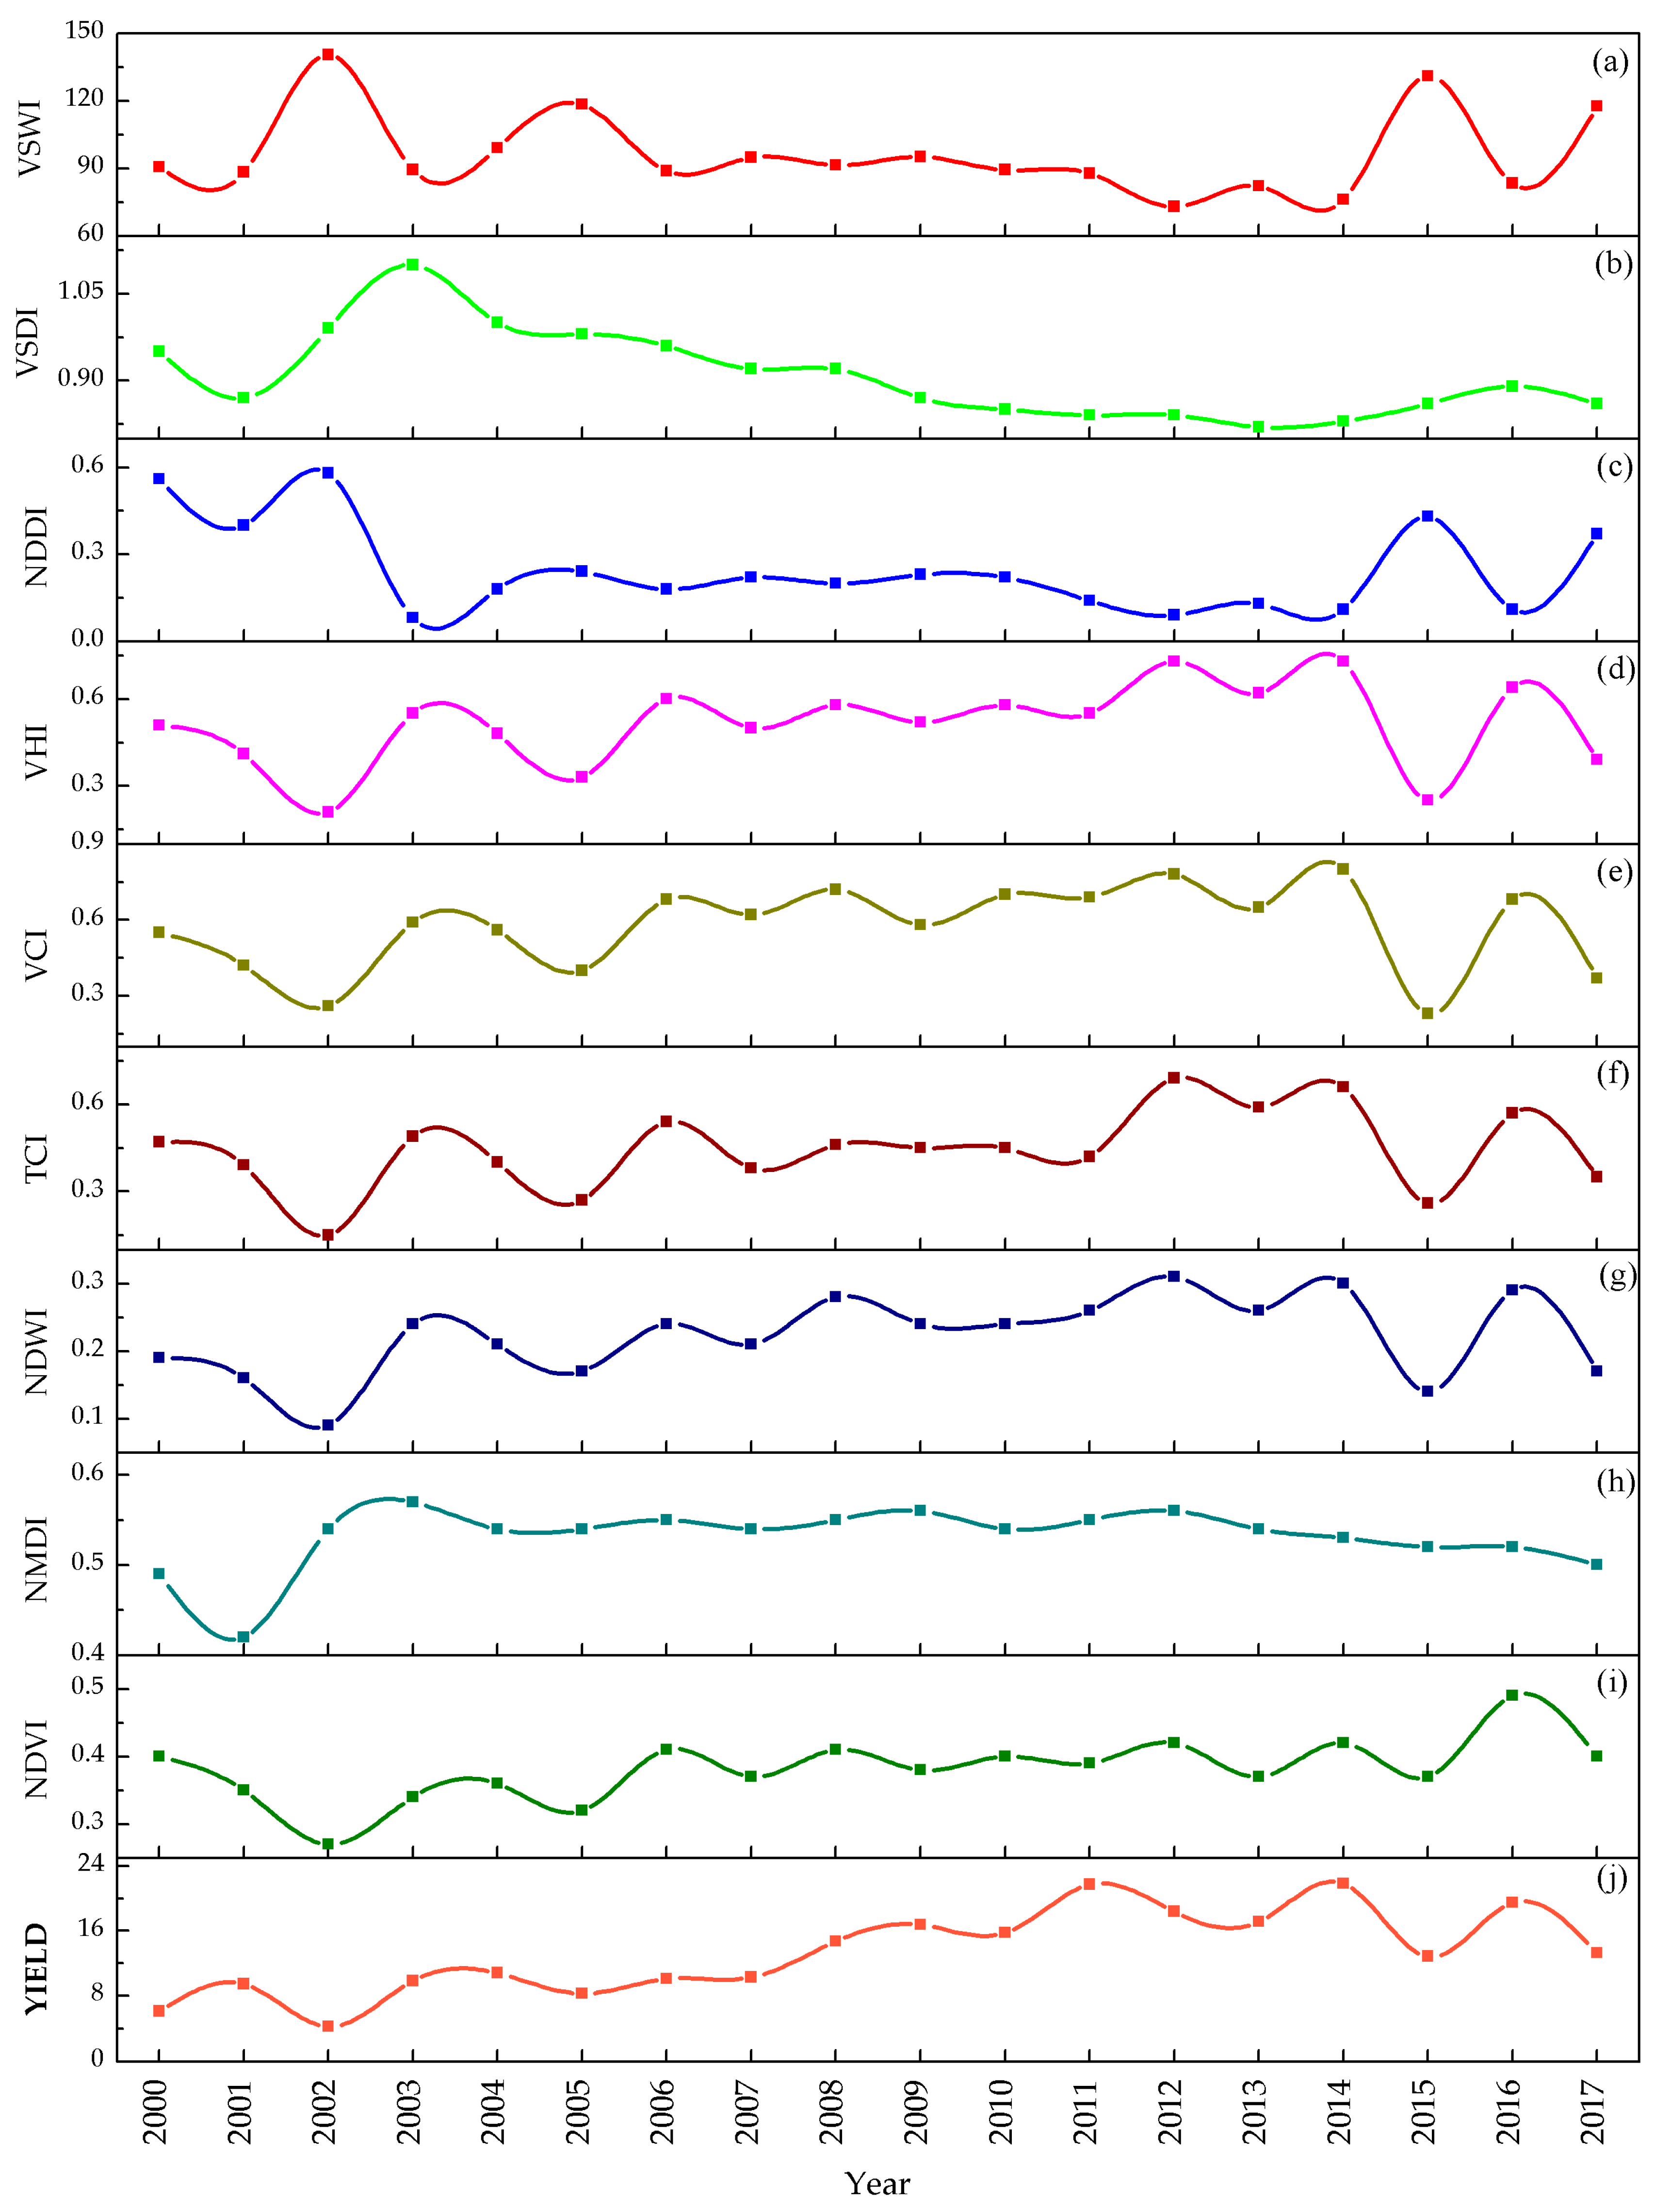
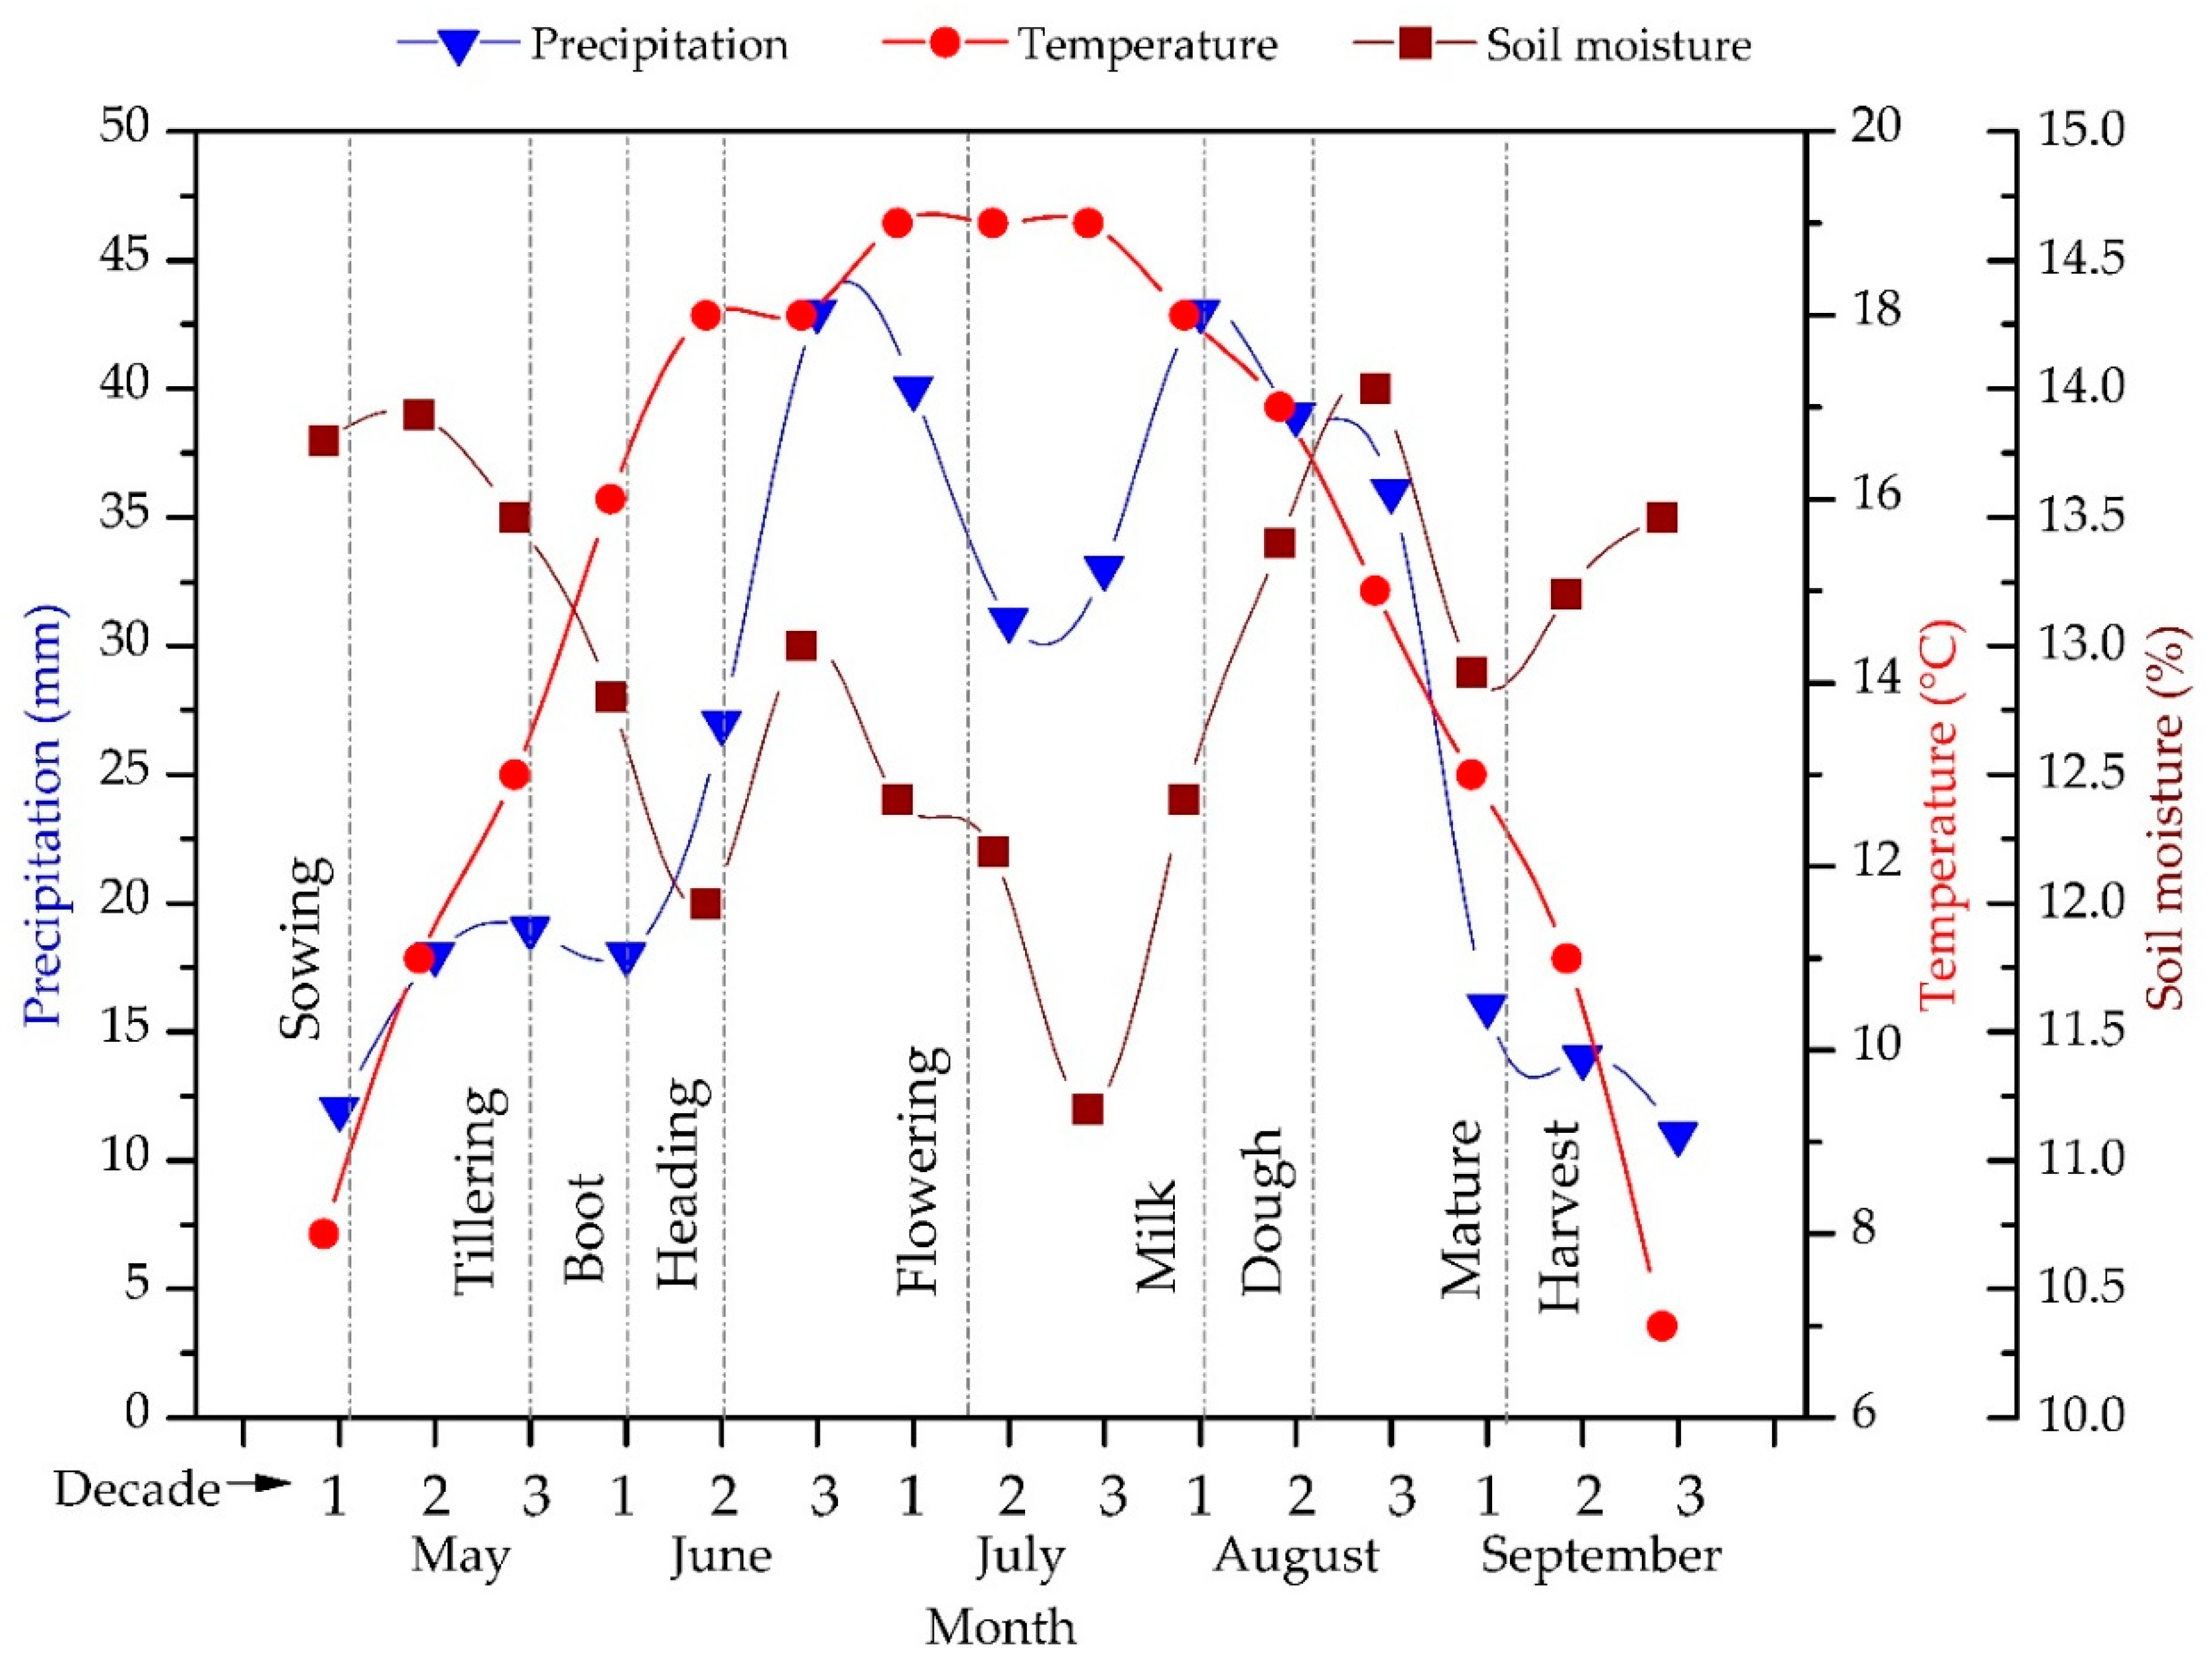
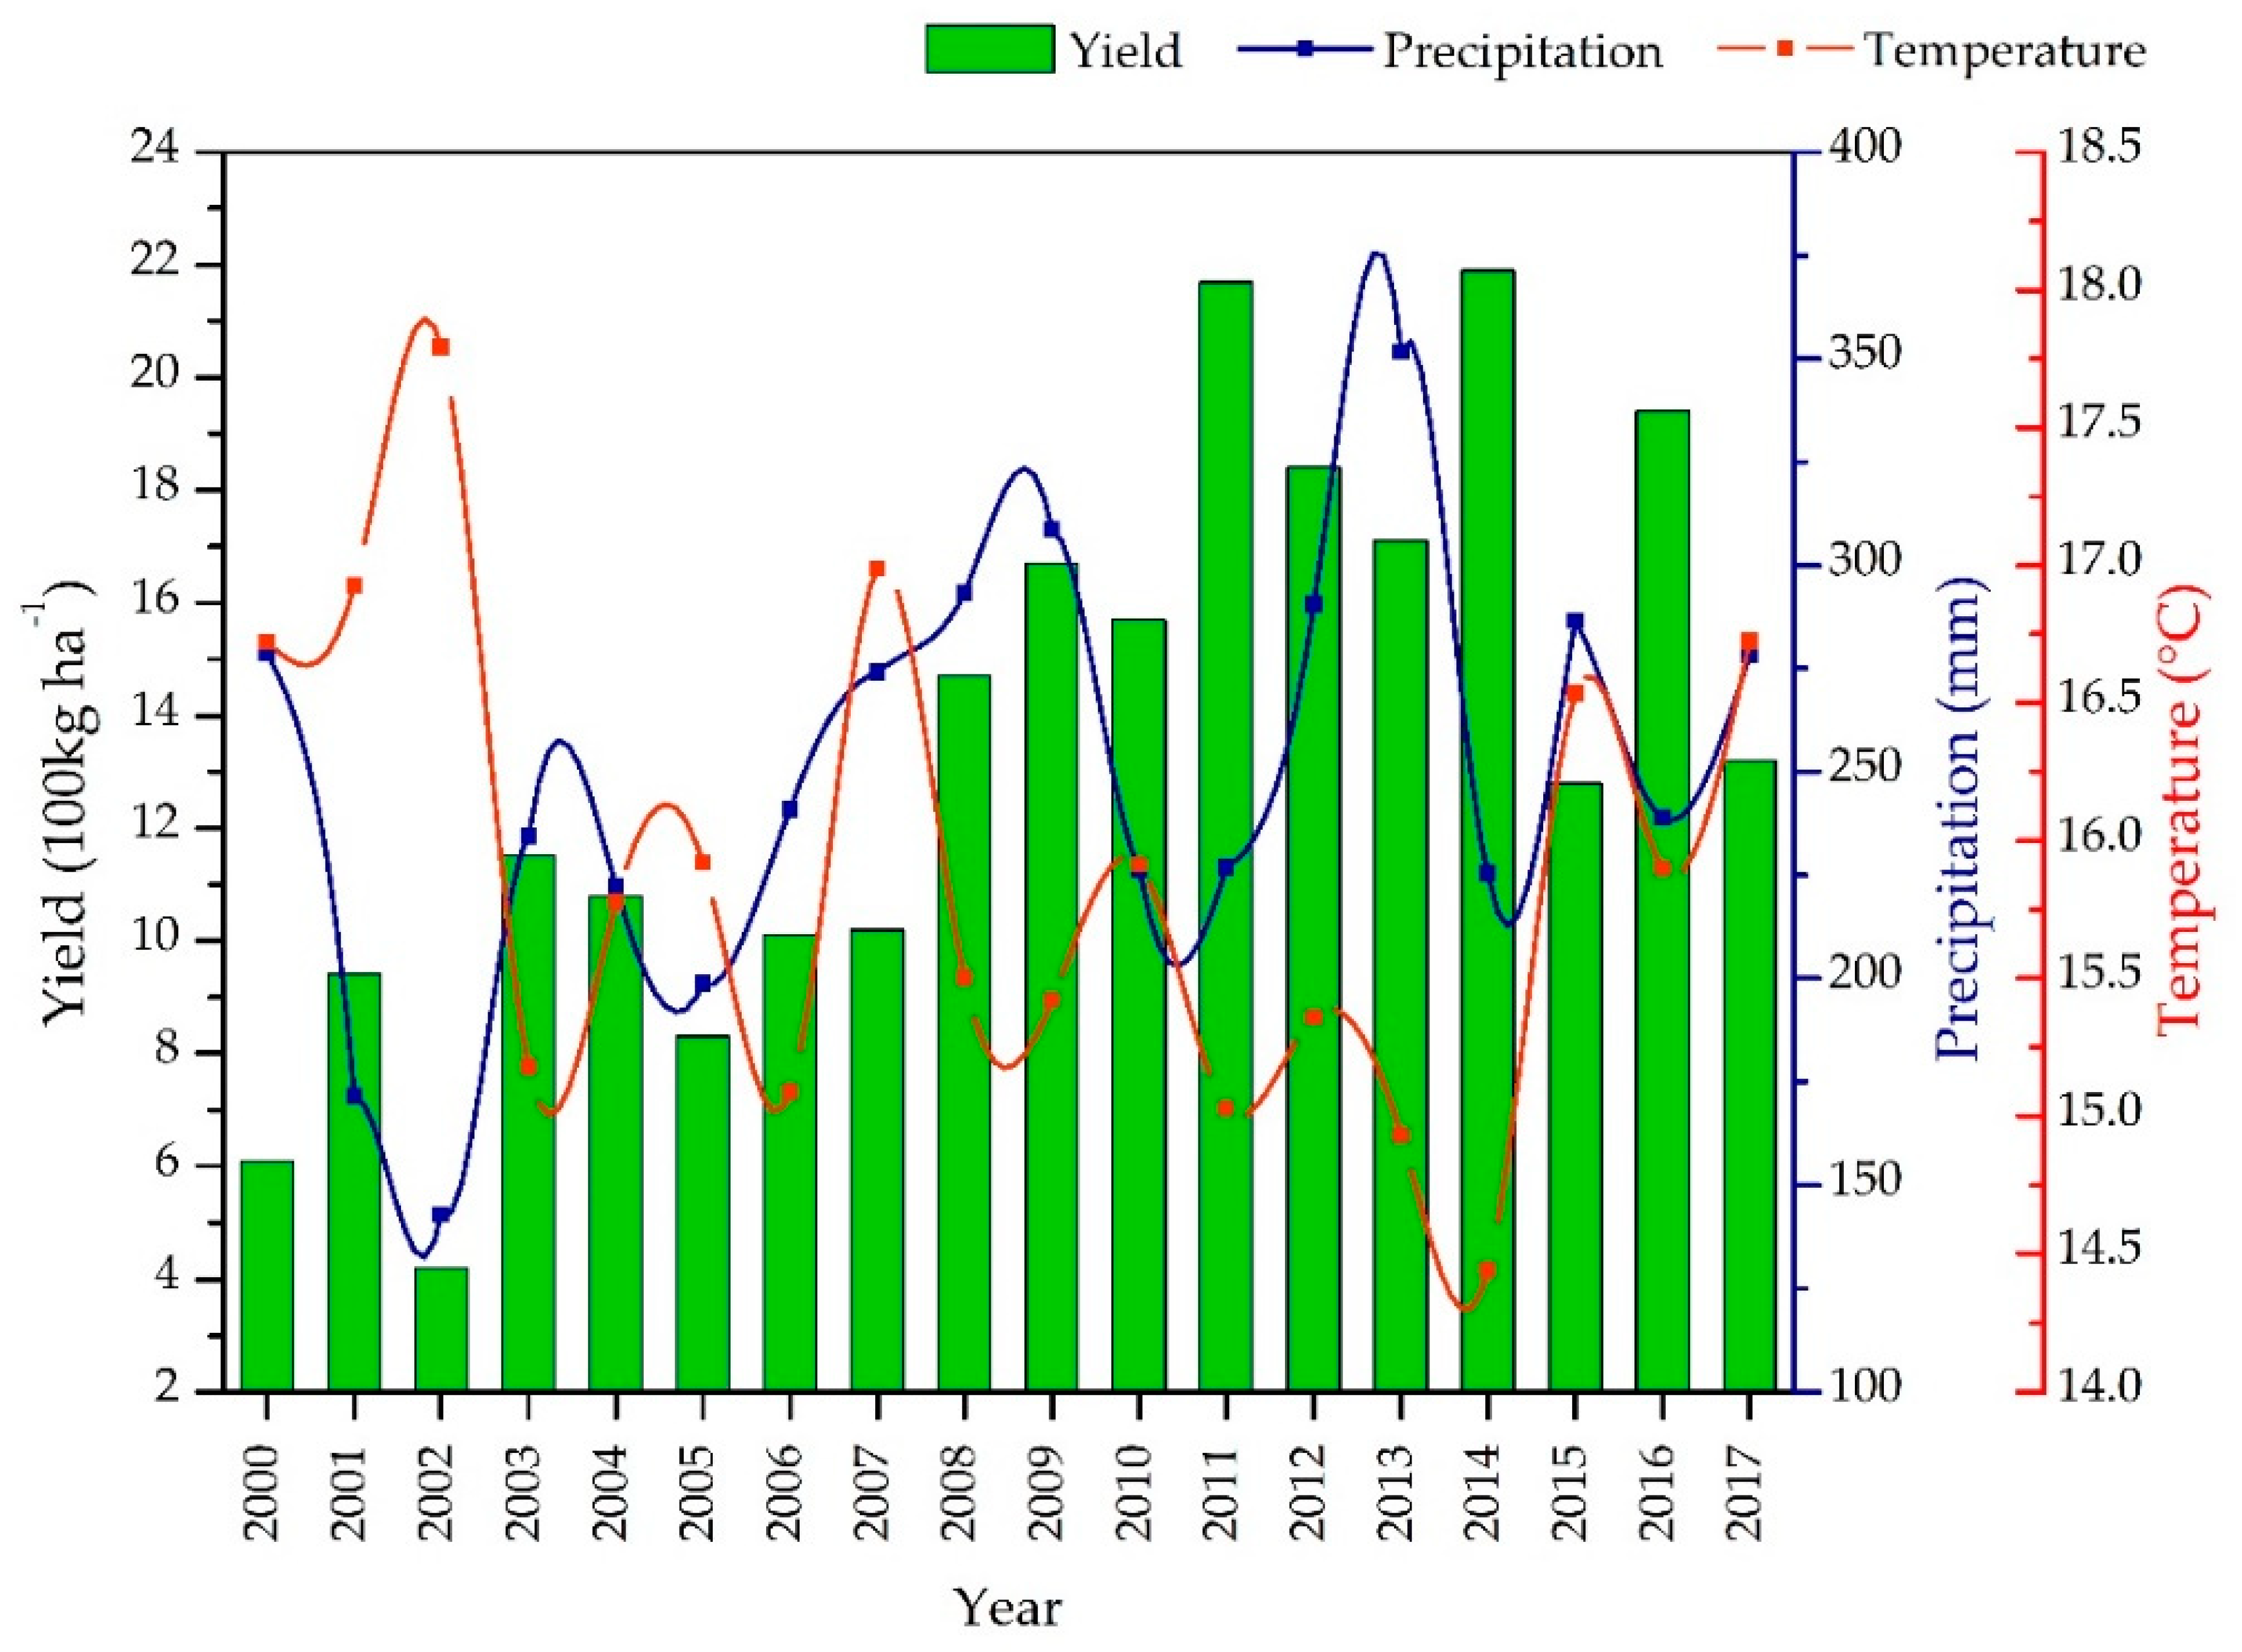
4.1. Temporal Climate Variables and Remote Sensing Indices Profiles for Spring Wheat

Figure 5 describes annual spring wheat yield with the amount of precipitation and average temperature throughout each growing season from 2000 to 2017. The temperature change, precipitation, and soil moisture have a significant impact on wheat yield. Mainly in the period May–September which accounts for 85% of annual precipitation. Especially in June–August, about 50%–60% of the annual precipitation occurs in Mongolia [63]. According to the [64] results show that the break of rainy season caused a similar reduction in soil moisture around mid-July in Mongolia. The highest mean precipitation of the growing months at the eight meteorological stations was 352 mm in 2013, 309 mm in 2009, 293 mm in 2008, 290 mm in 2012 and lowest annual precipitation occurred in 143 mm in 2002, 172 mm in 2001, and 199 mm in 2005 for the study area. In summer, especially growing season temperature and precipitation were negatively correlated. From (Figure 5) the lowest yield of spring wheat harvested in 2002(4.2kg ha−1) and the highest yield in 2014(21.9kg ha−1) in these two provinces. The main reason is that high temperatures and low precipitation led to soil moisture deficits, which is a significant impact on wheat yield. The climate of Mongolia is dry and semi-arid, and the growing vegetation cover and crop yields and development are highly dependent on the amount of precipitation and the related soil moisture [7,8].
Processed growing season (June–August) Moderate Resolution Imaging Spectroradiometer (MODIS-Terra) daily reflectance bands for study area for the years to 2000 to 2017. Based on the corrected surface reflectance NIR, red, blue, SWIR bands and LST of MODIS data, we have computed nine remote sensing indices and listed in (Table 2). We extracted time series values of NDVI, NDVI, NMDI, NDWI, VCI, TCI, VHI, NDDI, VSDI, and VSWI interpolated 10 day and monthly intervals in growing season (June–August) from 2000 to 2017. As shown in (Figure 6), the long-term annual remote sensing nine indices variables for spring wheat yield in Northern Mongolia.

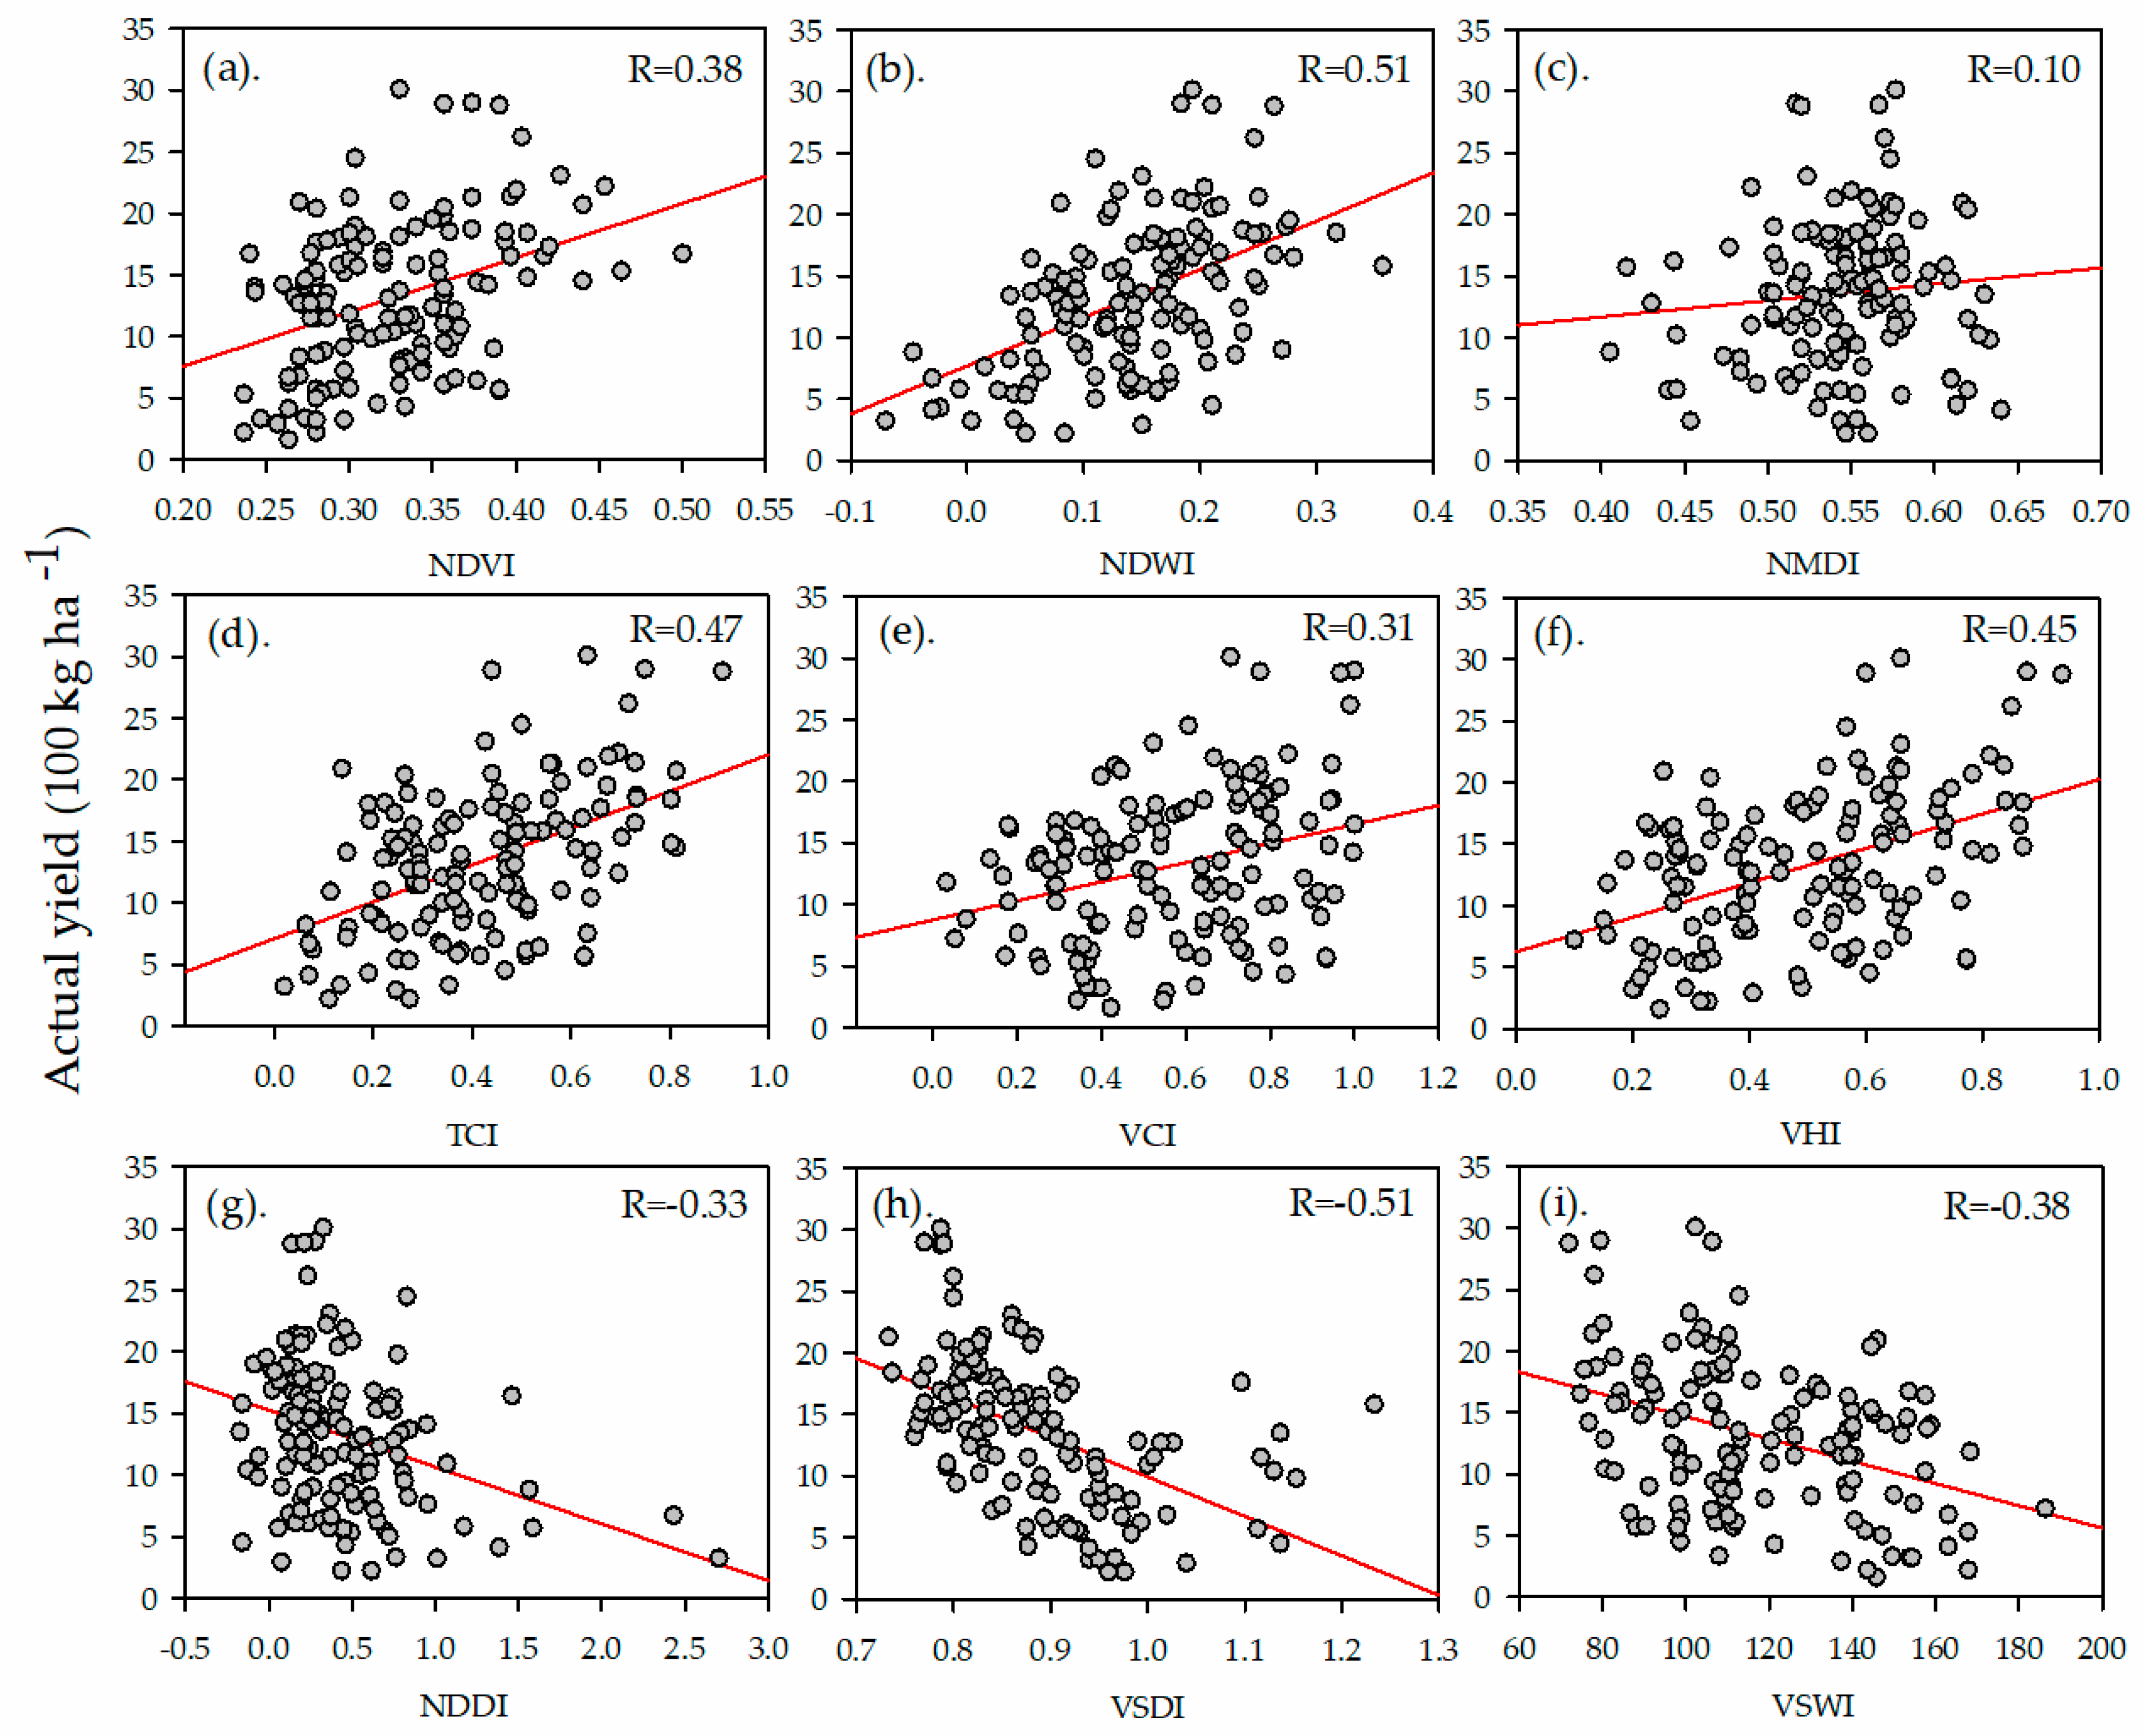
4.2. Sensitivity Analysis between Remote Sensing Indicators and Crop Yield

The Pearson’s correlation analysis examined between multi-year spring wheat yield data of eight stations and NDVI, NMDI, NDWI, TCI, VCI, VHI, NDDI, VSDI, and VSWI for June-August from 2000 to 2017, for a total of about 135 data points. To test the regional effectiveness of remote sensing indices and determine the best index during the growing period (June to August) for spring wheat yield estimation, we compared the 10 days and monthly remote sensing indices with the spring wheat yield. In general, in terms of the sown stage in the middle of May, emergency in early June, flowering in late June and early July, milk, and dough in August, maturity in early September, and harvesting in late September in the study area (each growing stage shown in Figure 3). For each of the remote sensing indices, the correlation values and significant p-values were produced by eight stations from 2000 to 2017 (Table 3).
The results show that most of the indices had found a higher correlation with spring wheat yield in June and July. This period covers the heading and flowering phenological stage of spring wheat. To see all of the correlations between June remote sensing indices and spring wheat yield in more detail, refer to Figure 7. About 50–60% of the annual precipitation occurred in the growing period, especially most of the precipitation occurred in June and the beginning of July. Because of that reason, there is sufficient moisture and suitable weather condition. Slightly lower correlation was found in August since crops are harvested in September. We can see that results of correlation (R) among the nine indices, NDDI, VSDI, VSWI, and crop yield were negatively correlated with spring wheat yield, while other NDVI, VCI, TCI, VHI, NDWI, and NMDI were positively correlated. The highest correlation coefficient (R) values of between 10 day remote sensing 9 indices with spring wheat yield were NDVI (0.51) in first 10 days of July, NMDI (0.18) in first 10 days of August, NDWI (0.48) in first 10 days of June, TCI (0.57) in third 10 days of June, VCI (0.31) in first 10 days of July, VHI (0.46) in third 10 days of June, NDDI (−0.38) in second 10 days of July, VSDI (−0.56) in first 10 days of July and August, and VSWI (−0.36) in first 10 days of June, respectively. These were statistically significant values with a yield of p < 0.05. Indices including NDDI, VSDI, and VSWI were negatively correlated with spring wheat yield, this implies when the values of these indices increase, the spring wheat yield decreased.
Also, we did a correlation between monthly nine remote sensing indices and spring wheat yield at each station in the monitoring period. The results show that the absolute value of correlation coefficients (R) of each month as shown in Table 4. These were statistically significant p < 0.01 with yield, except NMDI.
The relationship between NMDI and spring wheat yield showed was the lowest results (0.10–0.15), which is indicating that this index not suitable for spring wheat yield estimation in this region. From Table 4 we can see that monthly NDWI was the highest correlated indices with yield in June (0.51) and monthly VSDI was the highest correlated with yield in July (−0.57) and these were statistically significant p < 0.001, respectively. It indicates the soil and crops moisture and water content are most important for crop yield.

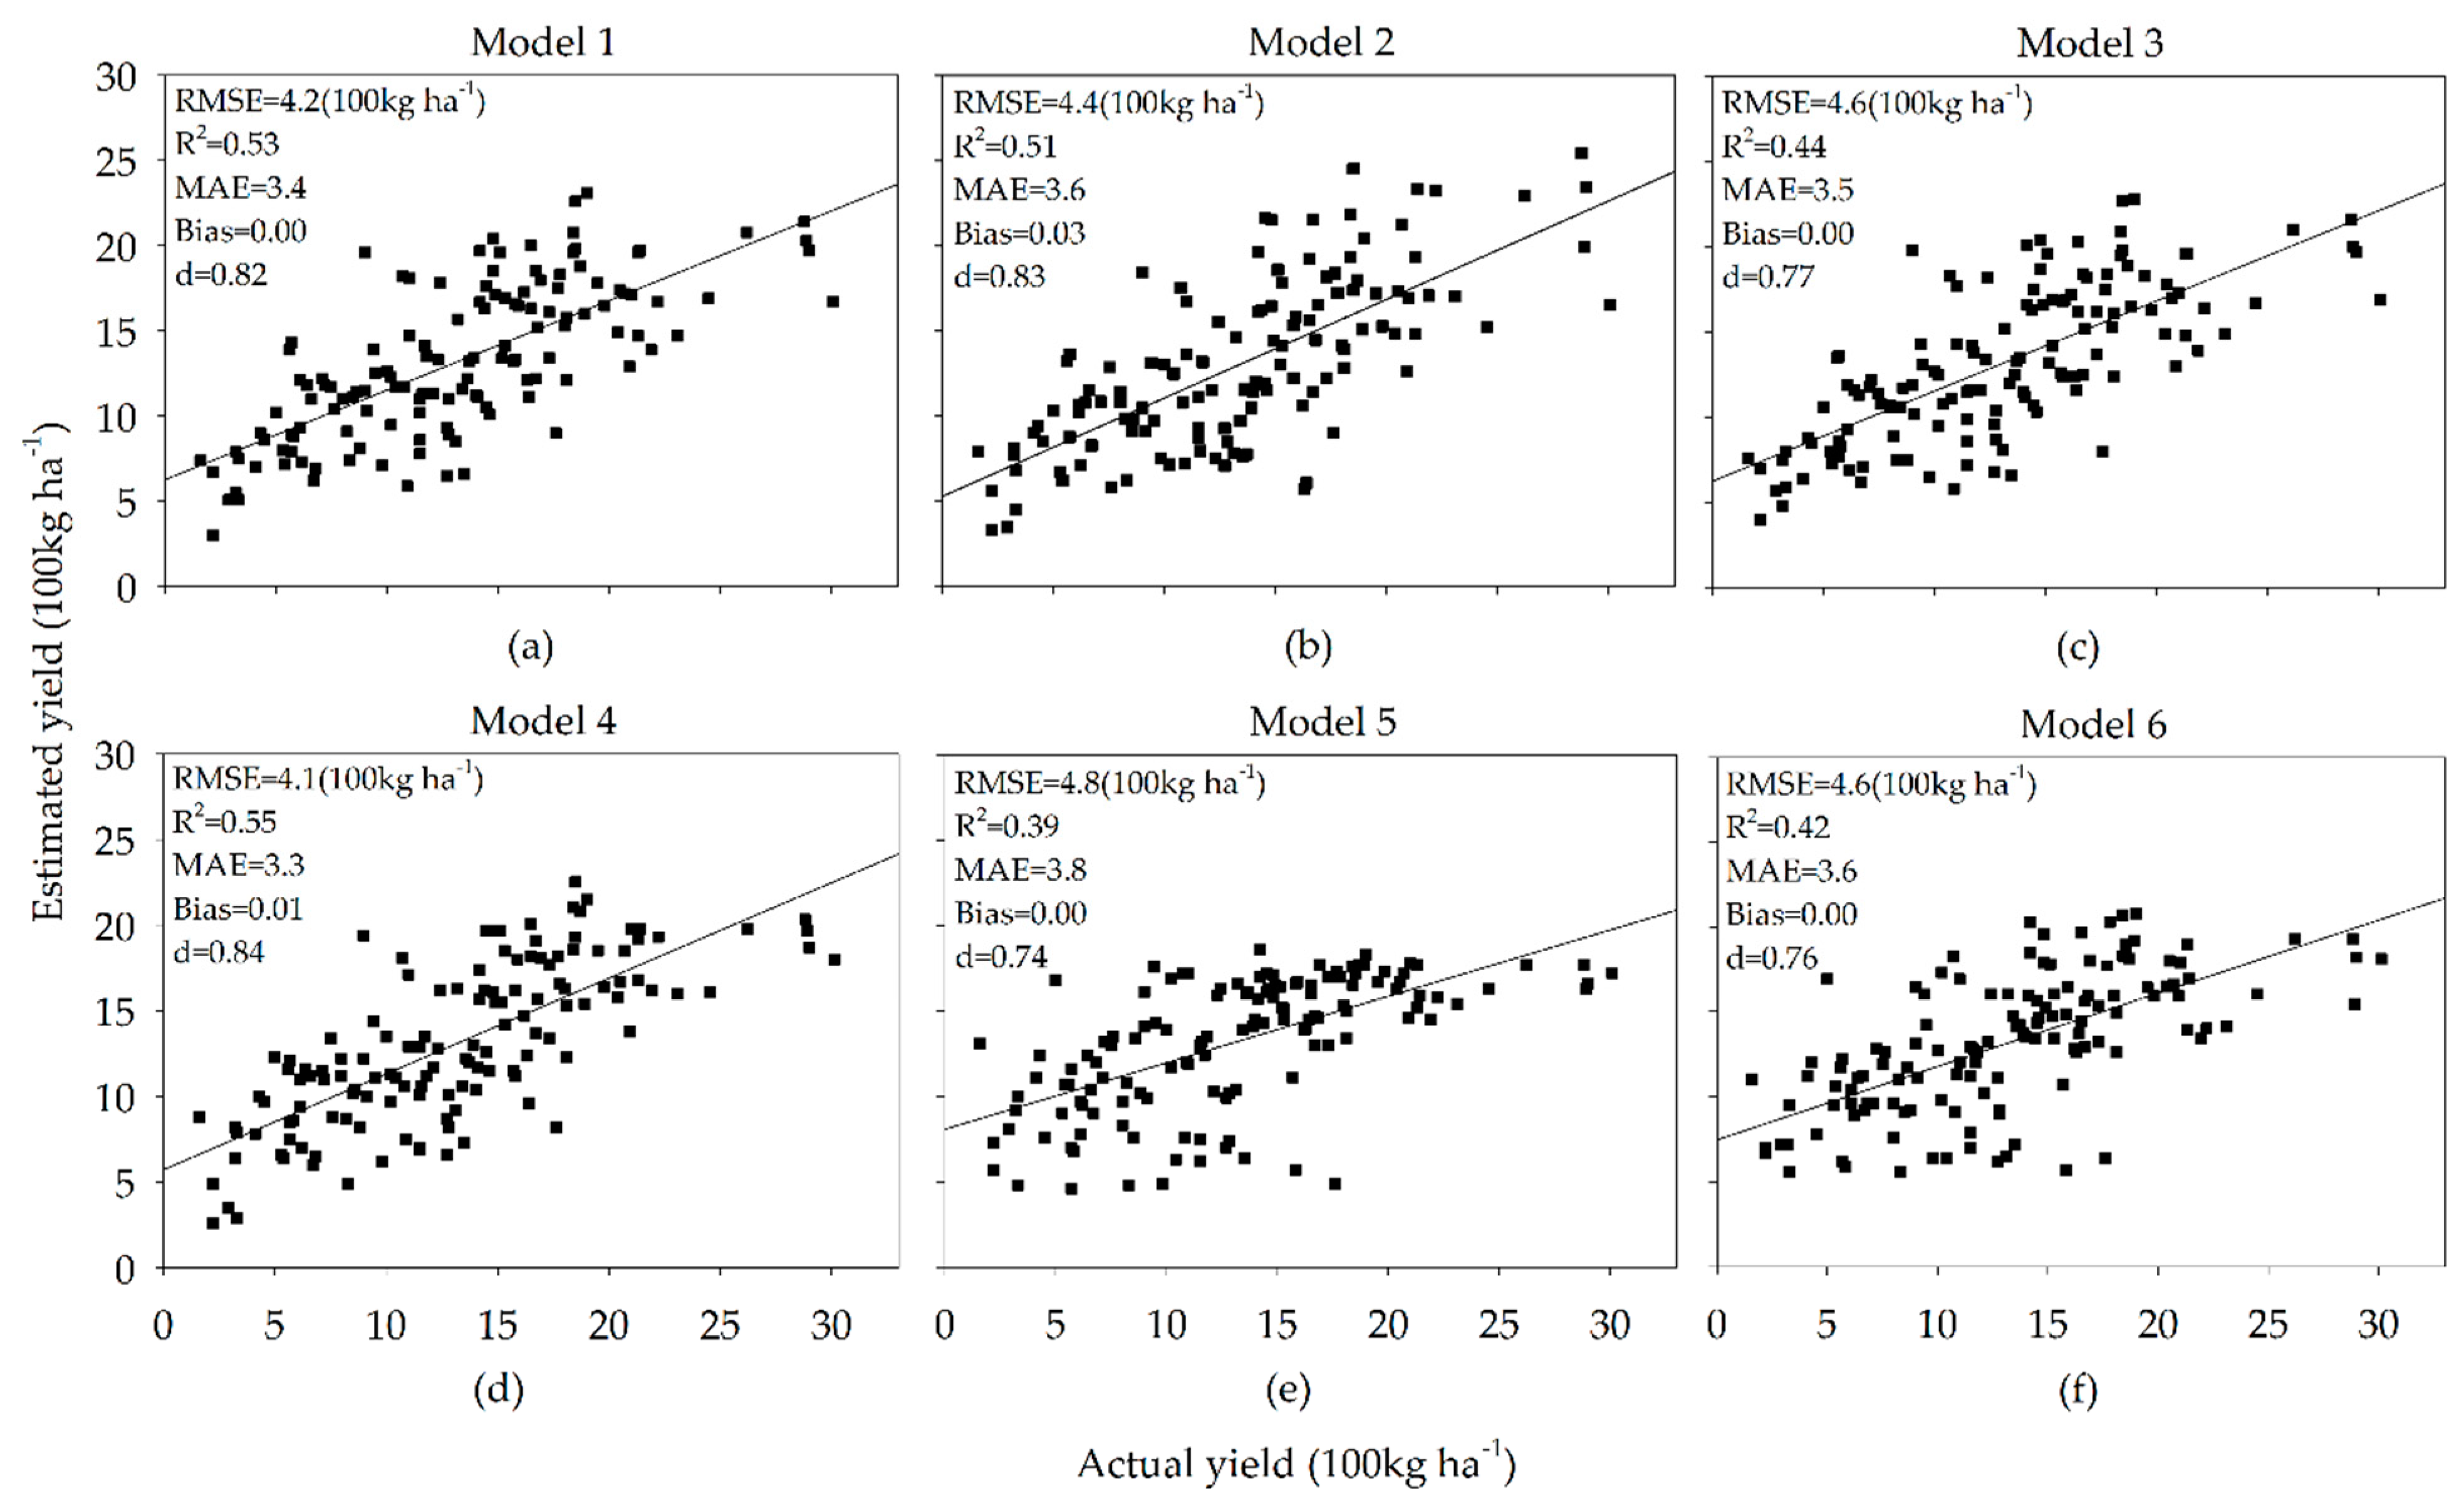
4.3. Yield Estimation Model

In this study, we tested nine remote sensing indices to develop the best and most accurate estimation models for spring wheat yield for Northern Mongolia. The yield was estimated at station level based on remote sensing indices for the spring wheat-growing season (June to August) and ground crop yield data. Each model has used eight stations crop yield data and nine remote sensing indices (10 daily and monthly) from 2000 to 2017. We used stepwise regression as a technique for choosing independent nine remote sensing indices for a multiple linear regression equation from a list of candidate indices. The results of regression analysis and best-fitted models are summarized in (Table 5).
The models had R2 values ranging from 0.39 to 0.57 and all models had statistically significant p < 0.001, respectively. The models with high R2 values, low RMSE, and MAE values indicate the best model for spring wheat yield estimation. The highest R2 values were 0.57 in June and 0.55 in July. Final all models include NDWI and VSDI (VHI and NDVI in some models) from June to August were good predictors of spring wheat yield.
In order to test the estimate performance of the method, we used the coefficient of determination (R2), root means square error (RMSE), mean absolute error (MAE), bias and index of agreement (d) to evaluate the estimated spring wheat yield in regional level. We compared the predicted yield with the actual yield of eight stations for 2000–2017, the results showed in (Figure 8).
The best timing and more accurate model for spring wheat yield estimation was found at the end of June and beginning of July. Model 4 was selected as the best estimation model for spring wheat in Northern Mongolia. Model 4 has combined variables of VSDI, NDWI, and NDVI, and index of agreement (d) value was 0.84, the relationship between estimated and actual yield was R2 = 0.55, mean absolute error was MAE = 3.3 and root mean square error was RMSE = 4.1(100 kg ha−1), respectively.

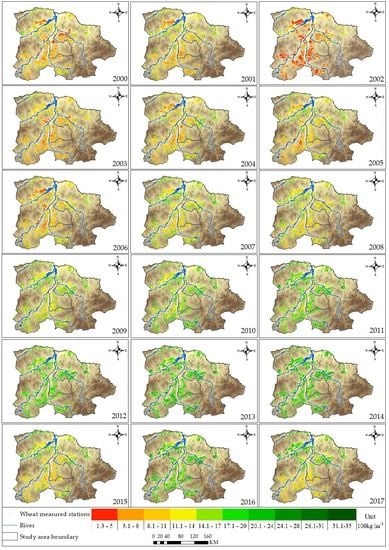
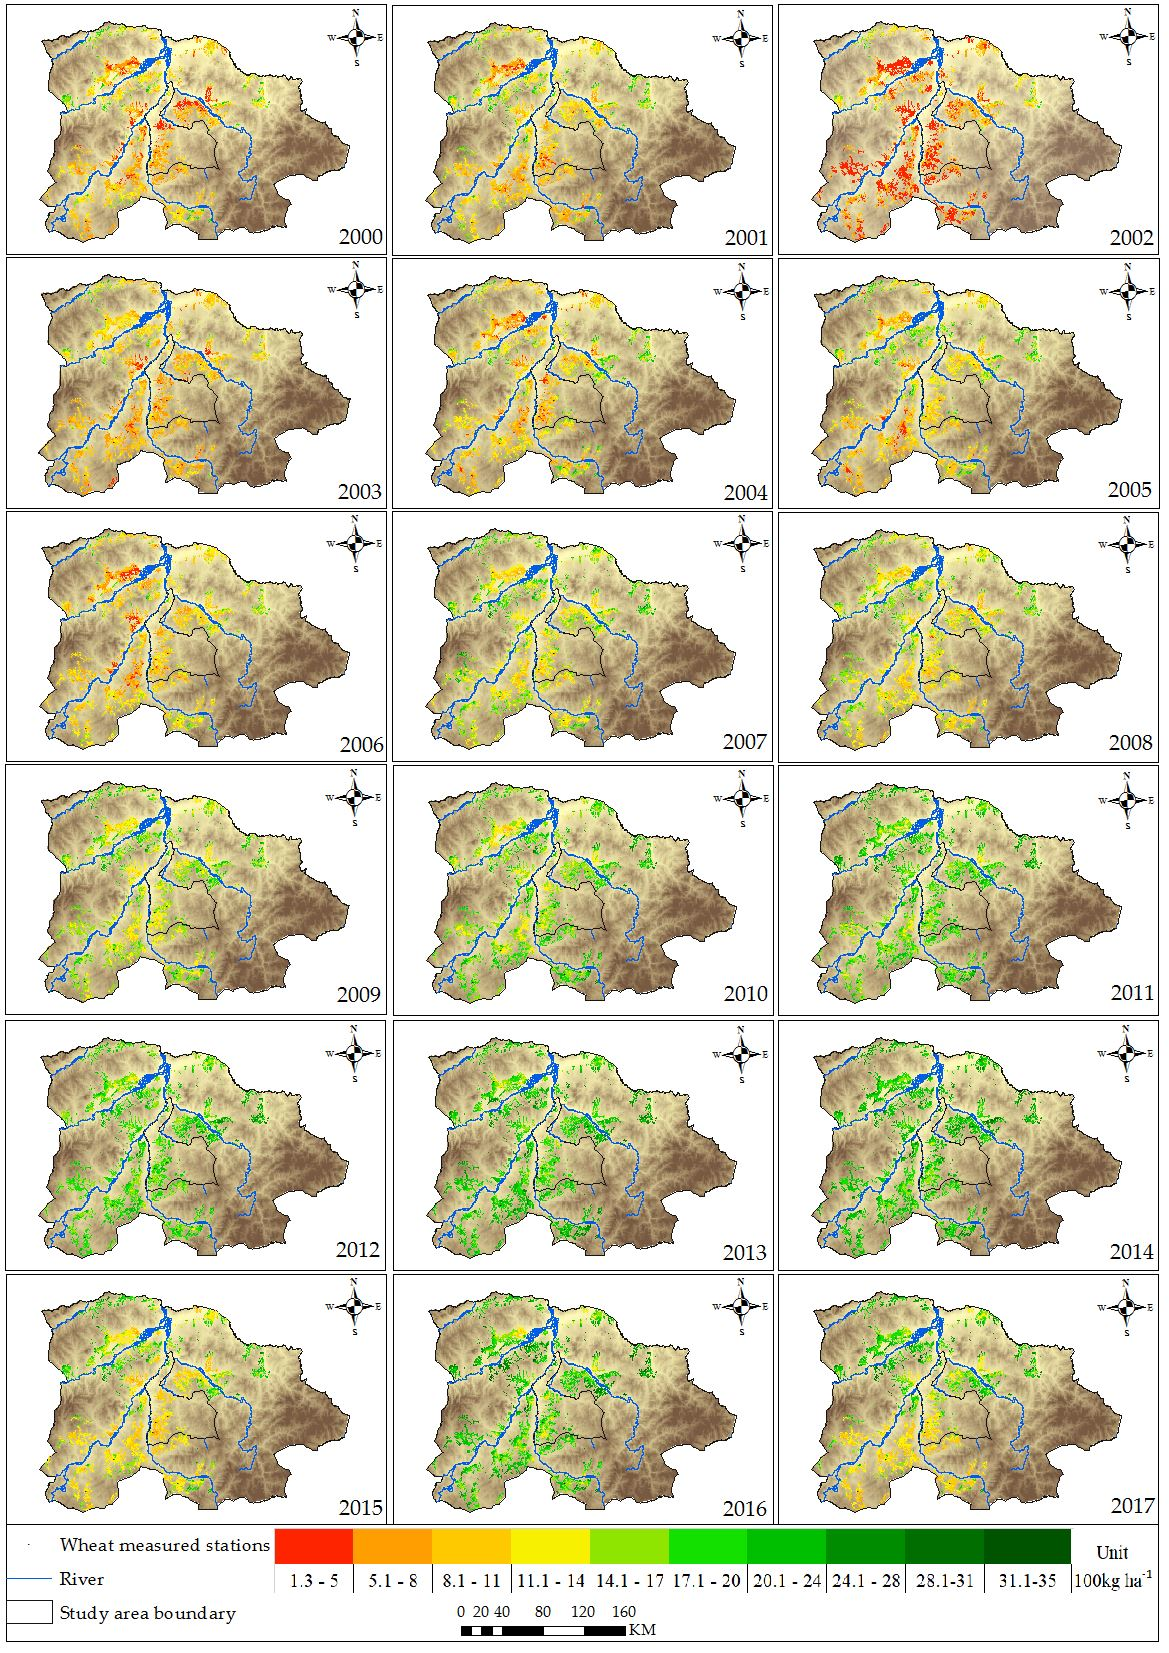
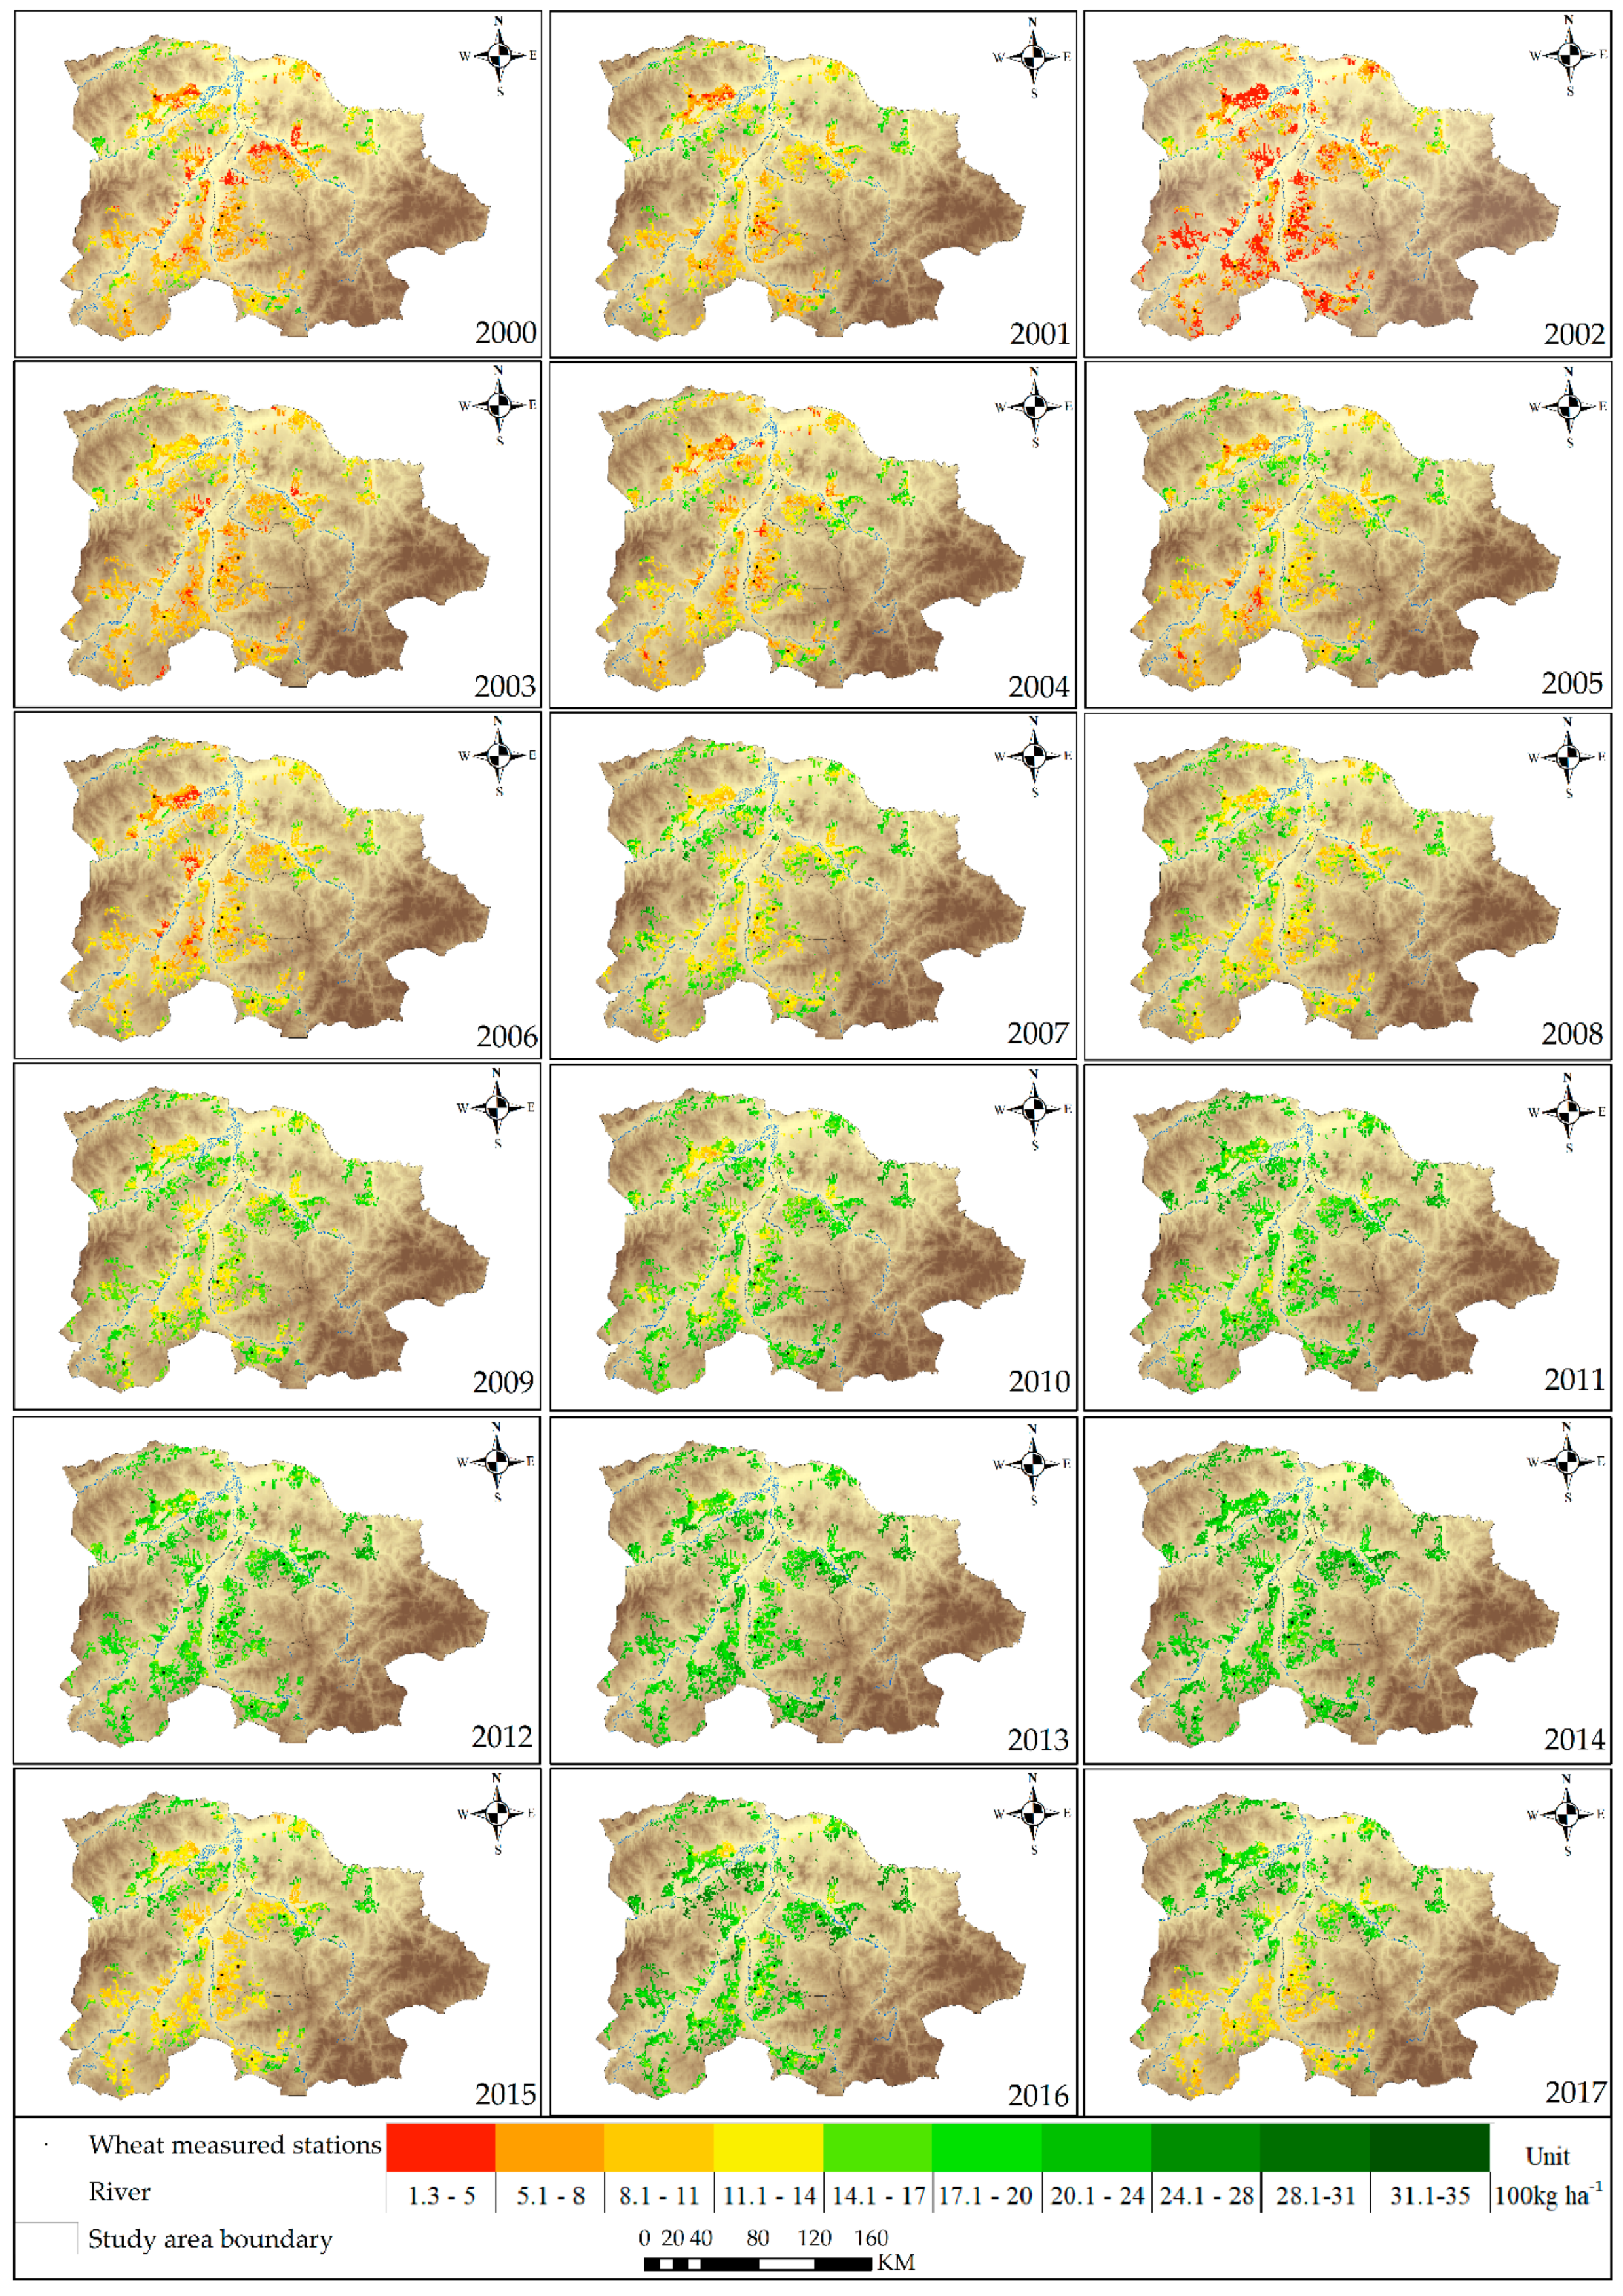
4.4. Evaluation of Spring Wheat Yield at the Regional Scale

Using a cropland mask, the calibrated model was applied in the study area. The spring wheat yield was evaluated based on the best model 4 from 2000 to 2017 in the Northern part of Mongolia (Selenge and Darkhan provinces) and the results are shown in (Figure 9). The temporal and spatial spring wheat yield maps produced based on the best model using NDWI (June), VSDI (third decade of June), and NDVI (first decade of July) indices, at the regional level have been generated in cropland area from 2000 to 2017. The spatial patterns of estimated spring wheat yield ranged from 1.3–35(100kg ha−1). In generated spring wheat yield maps, green colors indicating the normal and favorable condition and highest values of crop yield; red color shows unfavorable conditions and less amount of crop yield, respectively. From this result, we can see that spring wheat yield was low in drought years (2000–2002, 2005, 2006, 2015, and 2017). The irrigation system is limited in Mongolia, most of the spring crops at their vegetative and reproductive stages suffer water stress due to recurrent drought. Drought stress influences the water supply to vegetation and reduces accumulated biomass and production of crops [65].

5. Discussions

The study paves a new way for crop monitoring in Northern Mongolia. We have explored nine remote sensing indices in decade and month intervals. We found that there are 4 indices (VHI, VSDI, NDWI, and NDVI) that are more relevant than other indices for spring wheat yield estimation. This study has found that the NDWI and VSDI are the best indices for Mongolian crop monitoring. The NDWI was mainly indicated as an effective tool for water stress, soil, and vegetation moisture conditions and water content in vegetative areas, which was determined by the NIR and SWIR bands [11,12,33,48,62]. The supply of moisture to the north-central cropping region of Mongolia comes out as the main factor that clearly demonstrates the results of findings [66]. Water deficiency causes a physiological disorder that can inhibit cell division and differentiation, leading to the reduction of plant size and yield [67]. Our best results were obtained through Model 4 that showed R2 = 0.55, respectively. The results of the relationship between indices showed that MSAVI obtained the best wheat yield estimation model (R2 = 0.63), which was slightly higher than our result. Indices (SAVI, MSAVI, NDVI, and EVI) selected for wheat yield estimation in irrigated Indus Basin of Pakistan [68] are the difference from ours, because at, irrigation area, water is not stress issue. Water is a stressed factor in rainfed spring wheat in Mongolia. Dempewolf et al. [49] developed the wheat yield forecasting model in Punjab province of Pakistan using time-series MODIS and Landsat derived vegetation indices (NDVI, WDRVI, EVI2, SANDVI). The final results show that a forecasted wheat yield was within 0.2% and 11.5% of actual values, which was lower than our result. Bolton and Friedl et al. [62] compared the accuracy of different indices (EVI2, NDVI, and NDWI) in different zones for maize and soybean yield in the Central United States, and the EVI2 obtained best accuracy result with R2 = 0.73, respectively. This result was higher than our result.
We also find the highest correlation between indices with spring wheat yield and peaked at the flowering stage. The peak period of vegetative for spring wheat yield is June and July in this region. This implies that vegetation has its strongest response to moisture availability during this period. The growth condition of spring wheat during flowering stage might have more yield information than other stages at all growth stages, which means the developed regression model can be predicted two months before harvesting the crop and the correlation of estimated and actual yield from heading to flowering periods is higher than other crop growth stages. These results are in agreement with previous studies showing this to be the most suitable time to predict yield [27,48,60,61,69].
Furthermore, we find that later June is the most critical time for spring wheat yield formation. Indices in later June are used in every equation. We examined the relationship between actual spring wheat yield with 10 days and monthly indices for the regression model in the growing period (June–August). Similarly, we tried out the relationship between accumulated and relative values of nine indices with spring wheat yield from 2000 to 2017. The results of the correlation between accumulated and relative values of remote sensing nine indices with actual yield were lower than 10 day and monthly indices value. Juan Sui et al. [11] developed the dry aboveground mass and wheat yield estimation model using several remote sensing indices derived from MODIS and Himawari-8 sensor. A dry aboveground mass and yield errors of <10% and 12% were reported in Hengshui city of Hebei province, which was slightly lower than our results. Lopresti et al. [27] performed based on time-series MODIS-NDVI data for wheat yield estimation model obtained a higher correlation with estimated and actual yield (R2 = 0.75), which was higher than our results. Also, several regression models for crop yield estimation based on MODIS, NDVI, are presented [18,48,61]. Moriondo et al. [61] have carried out the NDVI data to estimate wheat yield in the Grosseto and Foggia provinces of Italy. The results of the correlation coefficient between simulated and actual yield were 0.73–0.77, with corresponding RMSE were 0.44Mg/ha and 0.47Mg/ha, respectively.
The impacts of global warming are already confronted in Mongolia, visible from records between 1940 and 2013 from 48 meteorological stations. According to Dagvadorj et al. [70], the temperature has increased by 2.07°C compare to mean. Due to the impacts of climate change, more extreme and continued droughts have occurred in many parts of Mongolia and which directly affect the vegetation and crop growth, biodiversity and socioeconomics in Mongolia [9]. Reportedly, [10,44,71] 2000–2002, 2004, 2005, 2007, and 2009 years were extremely affected by mild to severe drought and slight drought-hit Mongolia in 2003 and 2011. An additional notable finding of this study is that the spatial regional spring wheat yield distributions shown that the spring wheat yield was high in 2011, 2012, 2013, and 2016 and was low from 2000 to 2003 and 2015. It was statistically significant (p < 0.001), respectively and confirmed our result that during the drought years’ spring wheat yield was low. Perhaps, in the year 2003, we had the highest precipitation in our monitoring period. The amount of precipitation, soil type, soil moisture, and changes in air temperature have a significant impact on wheat yield. Particularly, drought and soil moisture deficit influence the most reduced crop yield and vegetation size [72]. Thus, from our results, we recommend developing an irrigation system for spring wheat cultivation and increase the number of crop yield observation samples in this region. These results obviously show the promising application of NDWI and VSDI data in crop yield assessment at relatively cheap cost and timely.

6. Conclusions

In Mongolia, the application of remote sensing methodology in agricultural policy and practices is in its nascent stage. This was the first time a multi-regression model based on remote sensing indicators was used to estimate crop yield in Northern Mongolia which is the main spring wheat-producing region. For this purpose, the best and most suitable indices were first defined through the testing of correlations between the nine indices and the actual spring wheat yield. Our results show that NDVI, NDWI, VCI, TCI, VHI, and NMDI indices with spring wheat yield were positively correlated (0.47, 0.51, 0.38, 0.47, 0.45, and 0.15), respectively and NDDI, VSWI, and VSDI with spring wheat yield were negatively correlated (−0.39, −0.57, and −0.38), respectively. Furthermore, the results confirmed the importance of the integration of both satellite and ground data for crop yield estimation. Consequently, we selected the NDWI, VSDI, and NDVI as the most suitable indices out of the nine indices, which are NDVI, NDWI, VCI, TCI, VHI, and NMDI. The highest negatively and positively correlated indices are a combination of NIR, red, blue, and SWIR bands. SWIR and red bands are found more sensitive to moisture variation and water stress of crops and soils [33]. Among nine indices, NDWI (0.51) in June and VSDI (−0.57) in July show the highest correlated indices with actual spring wheat yield, which indicates that the soil and crop moisture, as well as water content, are very important factors for crop yield.
As next step, we refined and developed the regression model using the above three selected indices in order to estimate crop yield. In total, six models were elaborated to be used for the growing period which is June to August. Timeline observation showed a higher correlation between indices and spring wheat yield during the flowering stage in June and July. Therefore, it is suggested that a suitable time to estimate spring wheat yield is at this stage of one to two months before the harvest. Whereas the results for the month of August showed a lower correlation indicating the lateness to estimate. The best results were obtained through Model 4 that used a combination of indicators from the period of third 10 days of June of VSDI, average of June NDWI and first 10 days of July of NDVI. Therefore, the Model 4 is the most effective predictor for crop yield monitoring in the northern part of Mongolia.
In this paper, we could estimate only 74% of the actual yield. This was due to several reasons that possibly could be ascribed to the different spatial resolution between MODIS data (1 km) and the ground measured spring wheat yield data (station-based measurements). Also, phenomena such as the different soil structures and the amount of precipitation have a big influence on the yield. However, the application of remote sensing regression model results enormously enrich the ground station collected data by providing large scale, region-wide data for the decision-makers to better manage food security challenges. In the future, work needs to be carried out to apply more consistently high-resolution images, such as Landsat and Sentinel for more accurate estimation of crop yield. In general, a comprehensive and systematic use of remote sensing technology in the agriculture sector of Mongolia is to be considered, including broader policy for research and development, the introduction of the latest technology and equipment and targeted capacity-building activities.

Author Contributions

B.T. contributed to the research experiments, methodology, software, data analysis, and the writing-original draft of the manuscript; B.W. conceived the experiments, and was responsible for the research analysis; H.Z. contributed to experimental design and the manuscript revision; G.B. contributed to the collection of crop yield data and the manuscript revision; L.N. contributed the manuscript revision.

Funding

This paper was funded by the National Natural Science Foundation of China (41561144013, 41601464), National Key R&D Program of China (2016YFA0600304), the International Partnership Program of Chinese Academy of Sciences (131C11KYSB20160061,121311KYSB20170004), the Queensland-Chinese Academy of Sciences (Q-CAS) Collaborative Science Fund (grant number: 131211KYSB20170008 & 2017000257).

Acknowledgments

We are very grateful to colleagues of the Information and Research Institute of Meteorology, Hydrology, and Environment (IRIMHE) of Mongolia. Special thanks to Elbegjargal Nasanbat for his comments and suggestions. We thank the anonymous reviewers for reviewing the manuscript and providing comments to improve the manuscript.

Conflicts of Interest

The authors declare no conflict of interest.

References

  1. Rosegrant, M.W. Global Food Security: Challenges and Policies. Science 2003, 302, 1917–1919. [Google Scholar] [CrossRef] [Green Version]
  2. Becker-Reshef, I.; Vermote, E.; Lindeman, M.; Justice, C. A generalized regression-based model for forecasting winter wheat yields in Kansas and Ukraine using MODIS data. Remote Sens. Environ. 2010, 114, 1312–1323. [Google Scholar] [CrossRef]
  3. Batchuluun, A.; Lin, J.Y. An Analysis of Mining Sector Economics in Mongolia. Glob. J. Bus. Res. 2010, 4, 81–93. [Google Scholar]
  4. Coslet, C.; Palmeri, F.; Sukhbaatar, J.; Batjargal, E.; Wadhwa, A. Special Report FAO/WFP Crop and Livestock Assessment Mission to Mongolia. 2017. Available online: http://www.wfp.org/food-security/reports/ (accessed on 28 October 2017).
  5. Erdenee, B.; Tana, G.; Tateishi, R. Cropland information system in Mongolia using remote sensing and geographical information system: Case study in Tsagaannuur, Selenge aimag. Int. J. Geomat. Geosci. 2010, 1, 577–586. [Google Scholar]
  6. Altansukh, N. Mongolia: Country Report the FAO International Technical Conference on Plant Geneticresources. Available online: http://www.fao.org/fileadmin/templates/agphome/documents/PGR/SoW1/east/MONGOLIA.pdf (accessed on 28 October 2017).
  7. Bao, G.; Qin, Z.; Bao, Y.; Zhou, Y.; Li, W.; Sanjjav, A. NDVI-Based Long-Term Vegetation Dynamics and Its Response to Climatic Change in the Mongolian Plateau. Remote Sens. 2014, 6, 8337–8358. [Google Scholar] [CrossRef] [Green Version]
  8. Gantsetseg, B.; Ishizuka, M.; Kurosaki, Y.; Mikami, M. Topographical and hydrological effects on meso-scale vegetation in desert steppe, Mongolia. J. Arid Land 2017, 9, 132–142. [Google Scholar] [CrossRef]
  9. Batima, P.; Natsagdorj, L.; Gombluudev, P.; Erdenetsetseg, B. Observed climate change in Mongolia. AIACC Work. Pap. 2005, 12, 1–25. [Google Scholar]
  10. Nanzad, L.; Zhang, J.; Tuvdendorj, B.; Nabil, M.; Zhang, S.; Bai, Y. NDVI anomaly for drought monitoring and its correlation with climate factors over Mongolia from 2000 to 2016. J. Arid Environ. 2019, 164, 69–77. [Google Scholar] [CrossRef]
  11. Sui, J.; Qin, Q.; Ren, H.; Sun, Y.; Zhang, T.; Wang, J.; Gong, S. Winter wheat production estimation based on environmental stress factors from satellite observations. Remote Sens. 2018, 10, 962. [Google Scholar] [CrossRef]
  12. Petersen, L.K. Real-time prediction of crop yields from MODIS relative vegetation health: A continent-wide analysis of Africa. Remote Sens. 2018, 10, 1726. [Google Scholar] [CrossRef]
  13. Atzberger, C. Advances in Remote Sensing of Agriculture: Context Description, Existing Operational Monitoring Systems and Major Information Needs. Remote Sens. 2013, 5, 949–981. [Google Scholar] [CrossRef] [Green Version]
  14. Dong, T.; Shang, J.; Qian, B.; Liu, J.; Chen, J.M.; Jing, Q.; McConkey, B.; Huffman, T.; Daneshfar, B.; Champagne, C.; et al. Field-Scale Crop Seeding Date Estimation from MODIS Data and Growing Degree Days in Manitoba, Canada. Remote Sens. 2019, 11, 1760. [Google Scholar] [CrossRef]
  15. He, T.; Xie, C.; Liu, Q.; Guan, S.; Liu, G. Evaluation and Comparison of Random Forest and A-LSTM Networks for Large-scale Winter Wheat Identification. Remote Sens. 2019, 11, 1665. [Google Scholar] [CrossRef]
  16. Kogan, F. World droughts in the new millennium from AVHRR-based vegetation health indices. Eos 2002, 83, 557. [Google Scholar] [CrossRef]
  17. Kogan, F.N. Operational space technology for global vegetation assessment. Bull. Am. Meteorol. Soc. 2001, 82, 1949–1964. [Google Scholar] [CrossRef]
  18. Ren, J.; Chen, Z.; Zhou, Q.; Tang, H. Regional yield estimation for winter wheat with MODIS-NDVI data in Shandong, China. Int. J. Appl. Earth Obs. Geoinf. 2008, 10, 403–413. [Google Scholar] [CrossRef]
  19. Sakamoto, T.; Gitelson, A.A.; Arkebauer, T.J. Near real-time prediction of U.S. corn yields based on time-series MODIS data. Remote Sens. Environ. 2014, 147, 219–231. [Google Scholar] [CrossRef]
  20. Singh, R.P.; Roy, S.; Kogan, F. Vegetation and temperature condition indices from NOAA AVHRR data for drought monitoring over India. Int. J. Remote Sens. 2003, 24, 4393–4402. [Google Scholar] [CrossRef]
  21. Yeom, J.; Jung, J.; Chang, A.; Ashapure, A.; Maeda, M.; Maeda, A.; Landivar, J. Comparison of Vegetation Indices Derived from UAV Data for Differentiation of Tillage Effects in Agriculture. Remote Sens. 2019, 11, 1548. [Google Scholar] [CrossRef]
  22. Guindin-Garcia, N.; Gitelson, A.A.; Arkebauer, T.J.; Shanahan, J.; Weiss, A. An evaluation of MODIS 8- and 16-day composite products for monitoring maize green leaf area index. Agric. For. Meteorol. 2012, 161, 15–25. [Google Scholar] [CrossRef] [Green Version]
  23. Rembold, F.; Atzberger, C.; Savin, I.; Rojas, O. Using Low-Resolution Satellite Imagery for Yield Prediction and Yield Anomaly Detection. Remote Sens. 2013, 5, 1704–1733. [Google Scholar] [CrossRef]
  24. Malingreau, J.P. Global vegetation dynamics: Satellite observations over Asia. Int. J. Remote Sens. 1986, 7, 1121–1146. [Google Scholar] [CrossRef]
  25. Tucker, C.J.; Vanpraet, C.L.; Sharman, M.J.; Van Ittersum, G. Satellite remote sensing of total herbaceous biomass production in the senegalese sahel: 1980–1984. Remote Sens. Environ. 1985, 17, 233–249. [Google Scholar] [CrossRef]
  26. Battude, M.; Al Bitar, A.; Morin, D.; Cros, J.; Huc, M.; Sicre, C.M.; Le Dantec, V.; Demarez, V. Estimating maize biomass and yield over large areas using high spatial and temporal resolution Sentinel-2 like remote sensing data. Remote Sens. Environ. 2016, 184, 668–681. [Google Scholar] [CrossRef]
  27. Lopresti, M.F.; Di Bella, C.M.; Degioanni, A.J. Relationship between MODIS-NDVI data and wheat yield: A case study in Northern Buenos Aires province, Argentina. Inf. Process. Agric. 2015, 2, 73–84. [Google Scholar] [CrossRef] [Green Version]
  28. Sandford, S.A.; Bernstein, M.P.; Materese, C.K. NASA Public Access. Astrophys. J. Suppl. Ser. 2013, 205, 1–58. [Google Scholar]
  29. Lewis, J.E.; Rowland, J.; Nadeau, A. Estimating maize production in kenya using ndvi: Some statistical considerations. Int. J. Remote Sens. 1998, 19, 2609–2617. [Google Scholar] [CrossRef]
  30. Vicente-Serrano, S.; Cuadrat-Prats, J.M.; Romo, A. Early prediction of crop production using drought indices at different time-scales and remote sensing data: Application in the Ebro Valley (north-east Spain). Int. J. Remote Sens. 2006, 27, 511–518. [Google Scholar] [CrossRef]
  31. Carlson, T.N.; Gillies, R.R.; Perry, E.M. A method to make use of thermal infrared temperature and NDVI measurements to infer surface soil water content and fractional vegetation cover. Remote Sens. Rev. 1994, 9, 161–173. [Google Scholar] [CrossRef]
  32. Carlson, T.N.; Perry, E.M.; Schmugge, T.J. Remote estimation of soil moisture availability and fractional vegetation cover for agricultural fields. Agric. For. Meteorol. 1990, 52, 45–69. [Google Scholar] [CrossRef]
  33. Zhang, N.; Hong, Y.; Qin, Q.; Zhu, L. Evaluation of the Visible and Shortwave Infrared Drought Index in China. Int. J. Disaster Risk Sci. 2013, 4, 68–76. [Google Scholar] [CrossRef]
  34. Wang, L.; Qu, J.J. NMDI: A normalized multi-band drought index for monitoring soil and vegetation moisture with satellite remote sensing. Geophys. Res. Lett. 2007, 34. [Google Scholar] [CrossRef]
  35. Huang, J.; Ma, H.; Sedano, F.; Lewis, P.; Liang, S.; Wu, Q.; Su, W.; Zhang, X.; Zhu, D. Evaluation of regional estimates of winter wheat yield by assimilating three remotely sensed reflectance datasets into the coupled WOFOST–PROSAIL model. Eur. J. Agron. 2019, 102, 1–13. [Google Scholar] [CrossRef]
  36. Jones, J.W.; Hoogenboom, G.; Porter, C.H.; Boote, K.J.; Batchelor, W.D.; Hunt, L.A.; Wilkens, P.W.; Singh, U.; Gijsman, A.J.; Ritchie, J.T. The DSSAT cropping system model. Eur. J. Agron. 2003, 18, 235–265. [Google Scholar] [CrossRef]
  37. Rezzoug, W.; Gabrielle, B.; Suleiman, A.; Benabdeli, K. Application and evaluation of the DSSAT-wheat in the Tiaret region of Algeria. African J. Agric. Res. 2008, 3, 284–296. [Google Scholar]
  38. Zhuo, W.; Huang, J.; Li, L.; Huang, R.; Gao, X.; Zhang, X.; Zhu, D. Assimilating SAR and Optical Remote Sensing Data into WOFOST Model for Improving Winter Wheat Yield Estimation. In Proceedings of the 2018 7th International Conference on Agro-geoinformatics (Agro-geoinformatics), Hangzhou, China, 6–9 August 2018; pp. 1–5. [Google Scholar]
  39. Ceglar, A.; van der Wijngaart, R.; de Wit, A.; Lecerf, R.; Boogaard, H.; Seguini, L.; van den Berg, M.; Toreti, A.; Zampieri, M.; Fumagalli, D.; et al. Improving WOFOST model to simulate winter wheat phenology in Europe: Evaluation and effects on yield. Agric. Syst. 2019, 168, 168–180. [Google Scholar] [CrossRef]
  40. Gilardelli, C.; Stella, T.; Frasso, N.; Cappelli, G.; Bregaglio, S.; Chiodini, M.E.; Scaglia, B.; Confalonieri, R. WOFOST-GTC: A new model for the simulation of winter rapeseed production and oil quality. Field Crop. Res. 2016, 197, 125–132. [Google Scholar] [CrossRef]
  41. Otgonbayar, M.; Atzberger, C.; Chambers, J.; Amarsaikhan, D.; Böck, S.; Tsogtbayar, J. Land Suitability Evaluation for Agricultural Cropland in Mongolia Using the Spatial MCDM Method and AHP Based GIS. J. Geosci. Environ. Prot. 2017, 5, 238–263. [Google Scholar] [CrossRef] [Green Version]
  42. Natsagdorj, E.; Renchin, T.; De Maeyer, P.; Dari, C.; Tseveen, B. Long-term soil moisture content estimation using satellite and climate data in agricultural area of Mongolia. Geocarto Int. 2019, 34, 722–734. [Google Scholar] [CrossRef]
  43. Ariya, B. Land Degradation Assessment in an Agricultural Area of Mongolia: Case Study in Orkhon Soum. United Nations University Land Restoration Training Programme [final project]. 2017, pp. 1–20. Available online: http://www.unulrt.is/static/fellows/document/ariya2017.pdf (accessed on 28 October 2017).
  44. Chang, S.; Wu, B.; Yan, N.; Davdai, B.; Nasanbat, E. Suitability assessment of satellite-derived drought indices for Mongolian grassland. Remote Sens. 2017, 9, 650. [Google Scholar] [CrossRef]
  45. Tsegmid, S.; Vorobiev, V. The National Atlas; Mongolian People’s Republic (in Mongolian). GUGK SSSR GUGK MNR Mosc: Ulaanbaatar, Mongolia, 1990. [Google Scholar]
  46. Kastens, J.; Kastens, T.; Kastens, D.; Price, K.; Martinko, E.; Lee, R. Image masking for crop yield forecasting using AVHRR NDVI time-series imagery. Remote Sens. Environ. 2005, 99, 341–356. [Google Scholar] [CrossRef]
  47. Elbegjargal, N.; Khudulmur, S.; Tsogtbaatar, J.; Dash, D.; Mandakh, N. Desertification Atlas of Mongolia; Institute of Geoecology, Mongolian Academy of Sciences: Ulaanbaatar, Mongolia, 2014. [Google Scholar]
  48. Mkhabela, M.S.; Bullock, P.; Raj, S.; Wang, S.; Yang, Y. Crop yield forecasting on the Canadian Prairies using MODIS NDVI data. Agric. For. Meteorol. 2011, 151, 385–393. [Google Scholar] [CrossRef]
  49. Dempewolf, J.; Adusei, B.; Becker-Reshef, I.; Hansen, M.; Potapov, P.; Khan, A.; Barker, B. Wheat yield forecasting for Punjab Province from vegetation index time series and historic crop statistics. Remote Sens. 2014, 6, 9653–9675. [Google Scholar] [CrossRef]
  50. Kogan, F.; Gitelson, A.; Zakarin, E.; Spivak, L.; Lebed, L. AVHRR-based spectral vegetation index for quantitative assessment of vegetation state and productivity: Calibration and validation. Photogramm. Eng. Remote Sens. 2003, 69, 899–906. [Google Scholar] [CrossRef]
  51. Kogan, F.N. Droughts of the late 1980s in the United States as derived from NOAA polar-orbiting satellite data. Bull. Am. Meteorol. Soc. 1995, 76, 655–668. [Google Scholar] [CrossRef]
  52. Unganai, L.S.; Kogan, F.N. Drought monitoring and corn yield estimation in southern Africa from AVHRR data. Remote Sens. Environ. 1998, 63, 219–232. [Google Scholar] [CrossRef]
  53. Gitelson, A.A.; Kaufman, Y.J.; Merzlyak, M.N. Use of a green channel in remote sensing of global vegetation from EOS-MODIS. Remote Sens. Environ. 1996, 58, 289–298. [Google Scholar] [CrossRef]
  54. Holben, B.N. Characteristics of maximum-value composite images from temporal AVHRR data. Int. J. Remote Sens. 1986, 7, 1417–1434. [Google Scholar] [CrossRef]
  55. Tucker, C.J. Red and photographic infrared linear combinations for monitoring vegetation. Remote Sens. Environ. 1979, 8, 127–150. [Google Scholar] [CrossRef] [Green Version]
  56. Gao, B.C. NDWI—A normalized difference water index for remote sensing of vegetation liquid water from space. Remote Sens. Environ. 1996, 58, 257–266. [Google Scholar] [CrossRef]
  57. Kogan, F.N. Application of vegetation index and brightness temperature for drought detection. Adv. Space Res. 1995, 15, 91–100. [Google Scholar] [CrossRef]
  58. Jianbo, W.; Jianjun, B.; Lele, L.; Yuan, Y. Vegetation supply water index based on MODIS data Analysis of the in Yunnan in spring of 2012. In Proceedings of the Third International Conference on Agro-Geoinformatics, Beijing, China, 11–14 August 2014; pp. 1–7. [Google Scholar]
  59. Gu, Y.; Brown, J.F.; Verdin, J.P.; Wardlow, B. A five-year analysis of MODIS NDVI and NDWI for grassland drought assessment over the central Great Plains of the United States. Geophys. Res. Lett. 2007, 34, 06407. [Google Scholar] [CrossRef]
  60. Balaghi, R.; Tychon, B.; Eerens, H.; Jlibene, M. Empirical regression models using NDVI, rainfall and temperature data for the early prediction of wheat grain yields in Morocco. Int. J. Appl. Earth Obs. Geoinf. 2008, 10, 438–452. [Google Scholar] [CrossRef] [Green Version]
  61. Moriondo, M.; Maselli, F.; Bindi, M. A simple model of regional wheat yield based on NDVI data. Eur. J. Agron. 2007, 26, 266–274. [Google Scholar] [CrossRef]
  62. Bolton, D.K.; Friedl, M.A. Forecasting crop yield using remotely sensed vegetation indices and crop phenology metrics. Agric. For. Meteorol. 2013, 173, 74–84. [Google Scholar] [CrossRef]
  63. Nandintsetseg, B.; Shinoda, M. Seasonal change of soil moisture in Mongolia: Its climatology. Int. J. Clim. 2011, 31, 1143–1152. [Google Scholar] [CrossRef]
  64. Shinoda, M. Phenology of Mongolian Grasslands and Moisture Conditions. J. Meteorol. Soc. Jpn. 2007, 85, 359–367. [Google Scholar] [CrossRef] [Green Version]
  65. Delfine, S.; Loreto, F.; Alvino, A. Drought-stress Effects on Physiology, Growth and Biomass Production of Rainfed and Irrigated Bell Pepper Plants in the Mediterranean Region. J. Am. Soc. Hortic. Sci. 2001, 126, 297–304. [Google Scholar] [CrossRef]
  66. Azzaya, D. Agro-Meteorological Assessment of Plant Growth Conditions in the Central Region of Mongolia. Ph.D. Thesis, Mongolian University of Life Sciences, Ulaanbaatar, Mongolia, 1997. [Google Scholar]
  67. Loka, D. Effect of Water-Deficit Stress on Cotton During Reproductive Development. Ph.D. Thesis, University of Arkansas, Fayetteville, NC, USA, 2012. [Google Scholar]
  68. Liaqat, M.U.; Cheema, M.J.M.; Huang, W.; Mahmood, T.; Zaman, M.; Khan, M.M. Evaluation of MODIS and Landsat multiband vegetation indices used for wheat yield estimation in irrigated Indus Basin. Comput. Electron. Agric. 2017, 138, 39–47. [Google Scholar] [CrossRef]
  69. Royo, C.; Aparicio, N.; Villegas, D.; Casadesus, J.; Monneveux, P.; Araus, J.L. Usefulness of spectral reflectance indices as durum wheat yield predictors under contrasting Mediterranean conditions. Int. J. Remote Sens. 2003, 24, 4403–4419. [Google Scholar] [CrossRef]
  70. Dagvadorj, D.; Batjargal, Z.; Natsagdorj, L. Mongolia Second Assessment Report on Climate Change-2014; Ministry of Environment and Green Development of Mongolia with Financial Support from the GIZ Programme: Ulaanbaatar, Mongolia, 2014. [Google Scholar]
  71. Dorjsuren, M.; Liou, Y.A.; Cheng, C.H. Time-series MODIS and in situ data analysis for Mongolia drought. Remote Sens. 2016, 8, 509. [Google Scholar] [CrossRef]
  72. Alizadeh, V.; Shokri, V.; Soltani, A.; Yousefi, M.A. Effects of Climate Change and Drought-Stress on Plant Physiology. Int. J. Adv. Biol. Biomedical Res. 2014, 2, 468–472. [Google Scholar]
Figure 1. Whole Mongolian grain production with study area (National Statistics Office, 2019).
Remotesensing 11 02568 g001
Figure 2. Study area: (a) Agro-ecological regions of Mongolia; (b) Digital Elevation Model data (DEM), Spatial distribution of agrometeorological stations in Selenge and Darkhan provinces and cropland.
Remotesensing 11 02568 g002
Figure 3. Growing stage of spring wheat and climate variables distribution in the study area.
Remotesensing 11 02568 g003
Figure 4. Flowchart of processing method.
Remotesensing 11 02568 g004
Figure 5. Long-term trend of average spring wheat yield and climate variables (2000–2017).
Remotesensing 11 02568 g005
Figure 6. Annual growth season (June–August) average VSWI (a), VSDI (b), NDDI (c), VHI (d), VCI (e), TCI (f), NDWI (g), NMDI (h), NDVI (i), and Spring wheat yield (j).
Remotesensing 11 02568 g006
Figure 7. The correlations between spring wheat yield with June (a) NDVI, (b) NDWI, (c) NMDI, (d) TCI, (e) VCI, (f) VHI, (g) NDDI, (h) VSDI, and (i)VSWI. Number of samples N = 135.
Remotesensing 11 02568 g007
Figure 8. Comparison between actual spring wheat yield with estimated spring wheat yield for each model; model 1 (a), model 2 (b), model 3 (c), model 4 (d), model 5 (e), model 6 (f). Each point indicates the estimated yield versus the actual yield for a single station and year.
Remotesensing 11 02568 g008
Figure 9. Estimated temporal and spatial spring wheat yield map at the regional level.
Remotesensing 11 02568 g009
Table 1. Information of meteorological stations with location (spring wheat yield available stations).
NProvince Name Station Name Station IDLatitudeLongitudeCrop Type
1SelengeTsagaannuur20950.0886105.3252wheat
2SelengeBaruunkharaa24148.7856106.2624wheat
3SelengeOrkhon24249.0039105.4208wheat
4SelengeEruu24349.6842106.6008wheat
5SelengeOrkhontuul24548.7208105.0358wheat
6DarkhanTsaidam244349.3221105.9826wheat
7Darkhan6th Brigad 244449.3602106.0782wheat
8DarkhanAltangadas244749.2328105.9466wheat
Table 2. Equations of tested nine remote sensing indices.
NRemote Sensing Based IndicesEquationReferences
1Normalized Difference Vegetation Index   N D V I = N I R R E D N I R + R E D   [55]
2Normalized Difference Water Index   N D W I = N I R S W I R N I R + S W I R   [56]
3Vegetation Condition Index V C I = ( N D V I j N D V I m i n ) ( N D V I m a x + N D V I m i n ) × 100 % [57]
4Temperature Condition Index T C I = T m a x T j T m a x T m i n × 100 % [57]
5Vegetation Health Index V H I = a × V C I + ( 1 a ) × T C I   [57]
6Normalized Multi-Band Drought Index   N M D I = N I R ( S W I R 1 S W I R 2 ) N I R ( S W I R 1 + S W I R 2 )   [34]
7Vegetation Supply Water Index V S W I = T s / N D V I [58]
8Normalized Difference Drought Index   N D D I = ( N D V I N D W I ) ( N D V I + N D W I )   [59]
9Visible and Shortwave Infrared Drought Index   V S D I = 1 [ ( S W I R B L U E ) + ( R E D B L U E ) ]   [33]
NIR-near-infrared band, Band2 (841–876 nm); RED-red band, Band1 (620–670 nm); SWIR1 - shortwave infrared band, Band6 (1628–1652 nm); SWIR2-shortwave infrared band, Band7 (2105–2155 nm); Blue–Band 3 (459–479 nm); Tj, Tmax and Tmin–surface temperature (current, maximum, and minimum).
Table 3. Multi-year correlation between 10-day indices and spring wheat yield in June to August (2000–2017).
MonthDecadeIndex
NDVINMDINDWITCIVCIVHINDDIVSDIVSWI
JuneFirst 10 days0.290.050.480.310.20.34−0.36−0.51−0.36
Second 10 days0.320.130.40.240.160.32−0.23−0.44−0.31
Third 10 days0.310.020.460.570.060.46−0.27−0.52−0.22
JulyFirst 10 days0.510.010.390.250.310.41−0.26−0.56−0.33
Second 10 days0.30.180.390.240.240.32−0.38−0.52−0.3
Third 10 days0.270.10.340.180.270.21−0.35−0.54−0.21
AugustFirst 10 days0.160.180.280.010.170.12−0.37−0.56−0.13
Second 10 days0.310.170.270.080.250.35−0.14−0.14−0.22
Third 10 days0.3-0.070.420.260.280.35−0.33−0.11−0.35
Significant at highlighted values = p < 0.05, Number of samples = 126 − 134 ((Due to the clouds or error data of satellite images there were some 10days of some indices are missed).
Table 4. Multi-year correlation between monthly indices and spring wheat yield in June- August (2000–2017).
NIndex
NDVINMDINDWITCIVCIVHINDDIVSDIVSWI
June0.38***0.10.51***0.47***0.31***0.45***−0.33***-0.51***−0.38***
July0.47***0.120.4***0.29***0.35***0.35***−0.39***-0.57***−0.3***
August0.28***0.150.35***0.17*0.38***0.32***−0.37***-0.33***−0.25**
Significant at *= p < 0.05, ** = p < 0.01, *** = p < 0.001; Number of samples=134.
Table 5. Best-fit estimation models for spring wheat yield during the growing period (June–August).
MonthModel EquationsR2SEMp-Value
JuneModel 1y = 44.837 − 41.661 × VSDI63 + 37.745 × NDWI60.534.6<0.001
Model 2y = 35.041 − 36.358 × VSDI63 + 24.621*NDWI6 + 13.668 × VHI630.574.3<0.001
JulyModel 3y = 44.721 − 39.502*VSDI7 + 21.296 × NDWI710.444.6<0.001
Model 4y = 34.492 − 37.189 × VSDI63 + 28.571 × NDWI6 + 19.61 × NDVI710.554.3<0.001
AugustModel 5y = 52.224 + 12.774 × NDWI81 − 46.207 × VSDI81 0.394.9<0.001
Model 6y = 62.527 + 25.492 × NDWI81 - 50.254 × VSDI81 − 23.552 × NDVI810.444.8<0.001
Number of samples (N = 135), VSDI63-third 10 days of June, VSDI; NDWI6–June, NDWI; VSDI7–July, VSDI; NDVI71-first 10 days, NDVI; VSDI81, NDWI81, and NDVI81- first 10 days of August, VSDI, NDWI, and NDVI.

