New Insights of Geomorphologic and Lithologic Features on Wudalianchi Volcanoes in the Northeastern China from the ASTER Multispectral Data


Abstract
:
1. Introduction
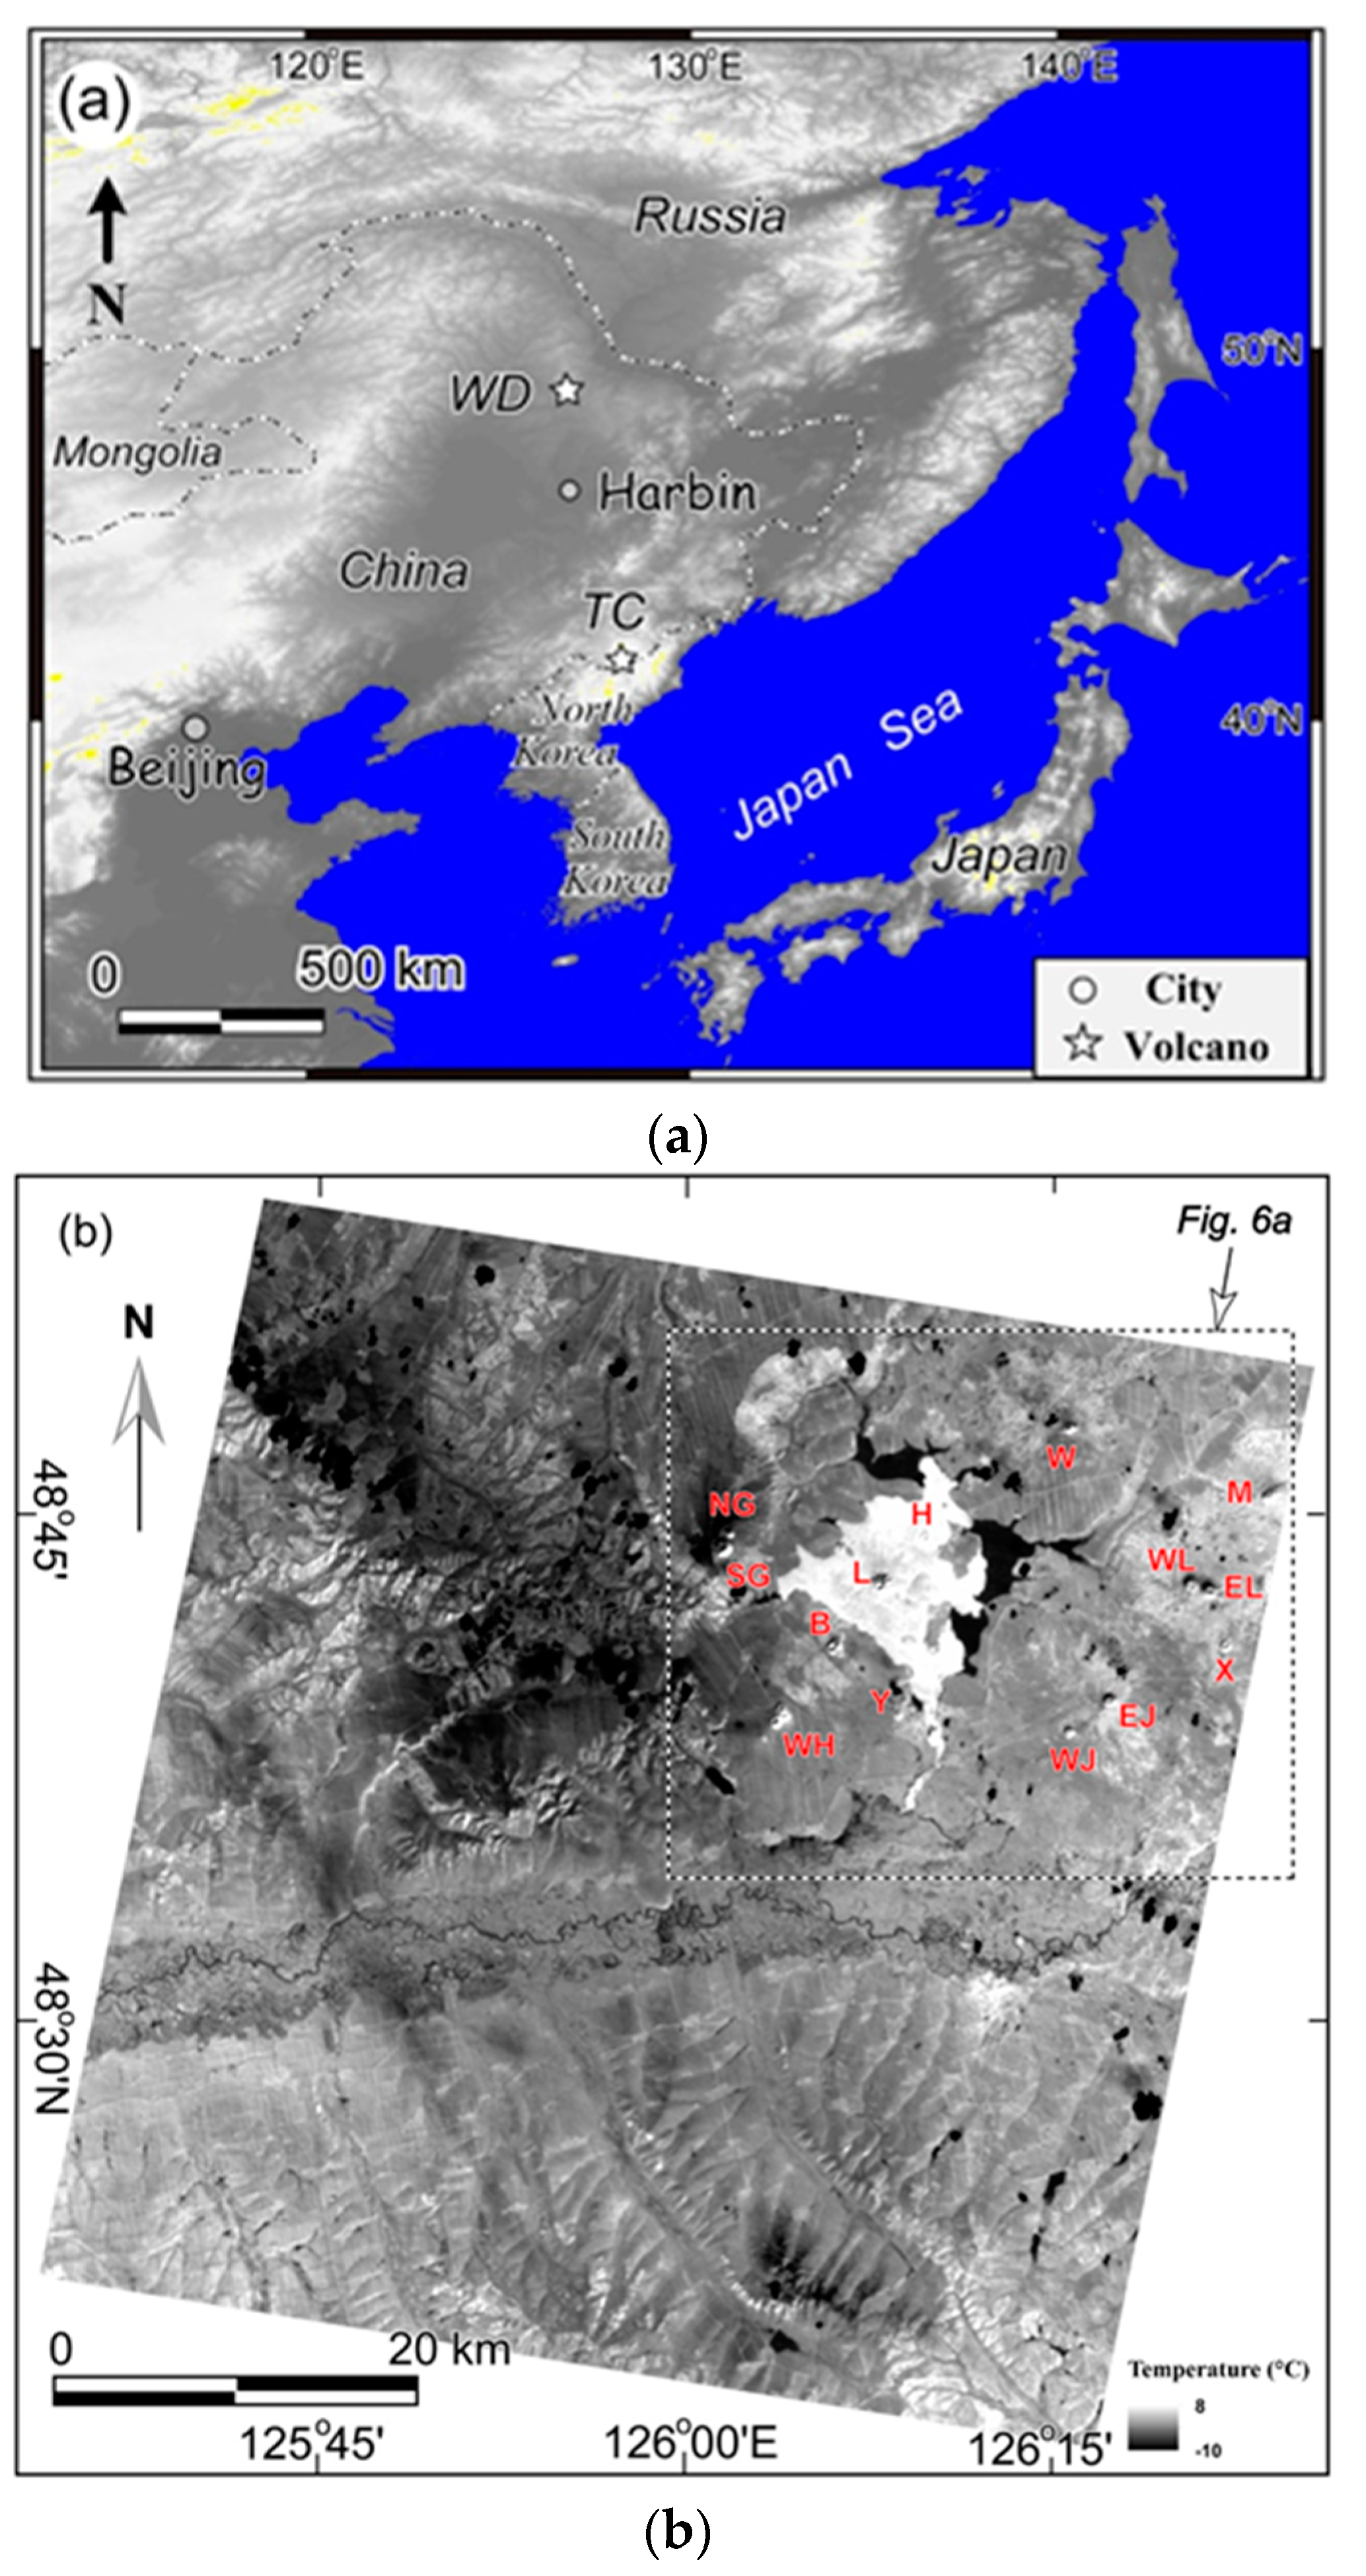
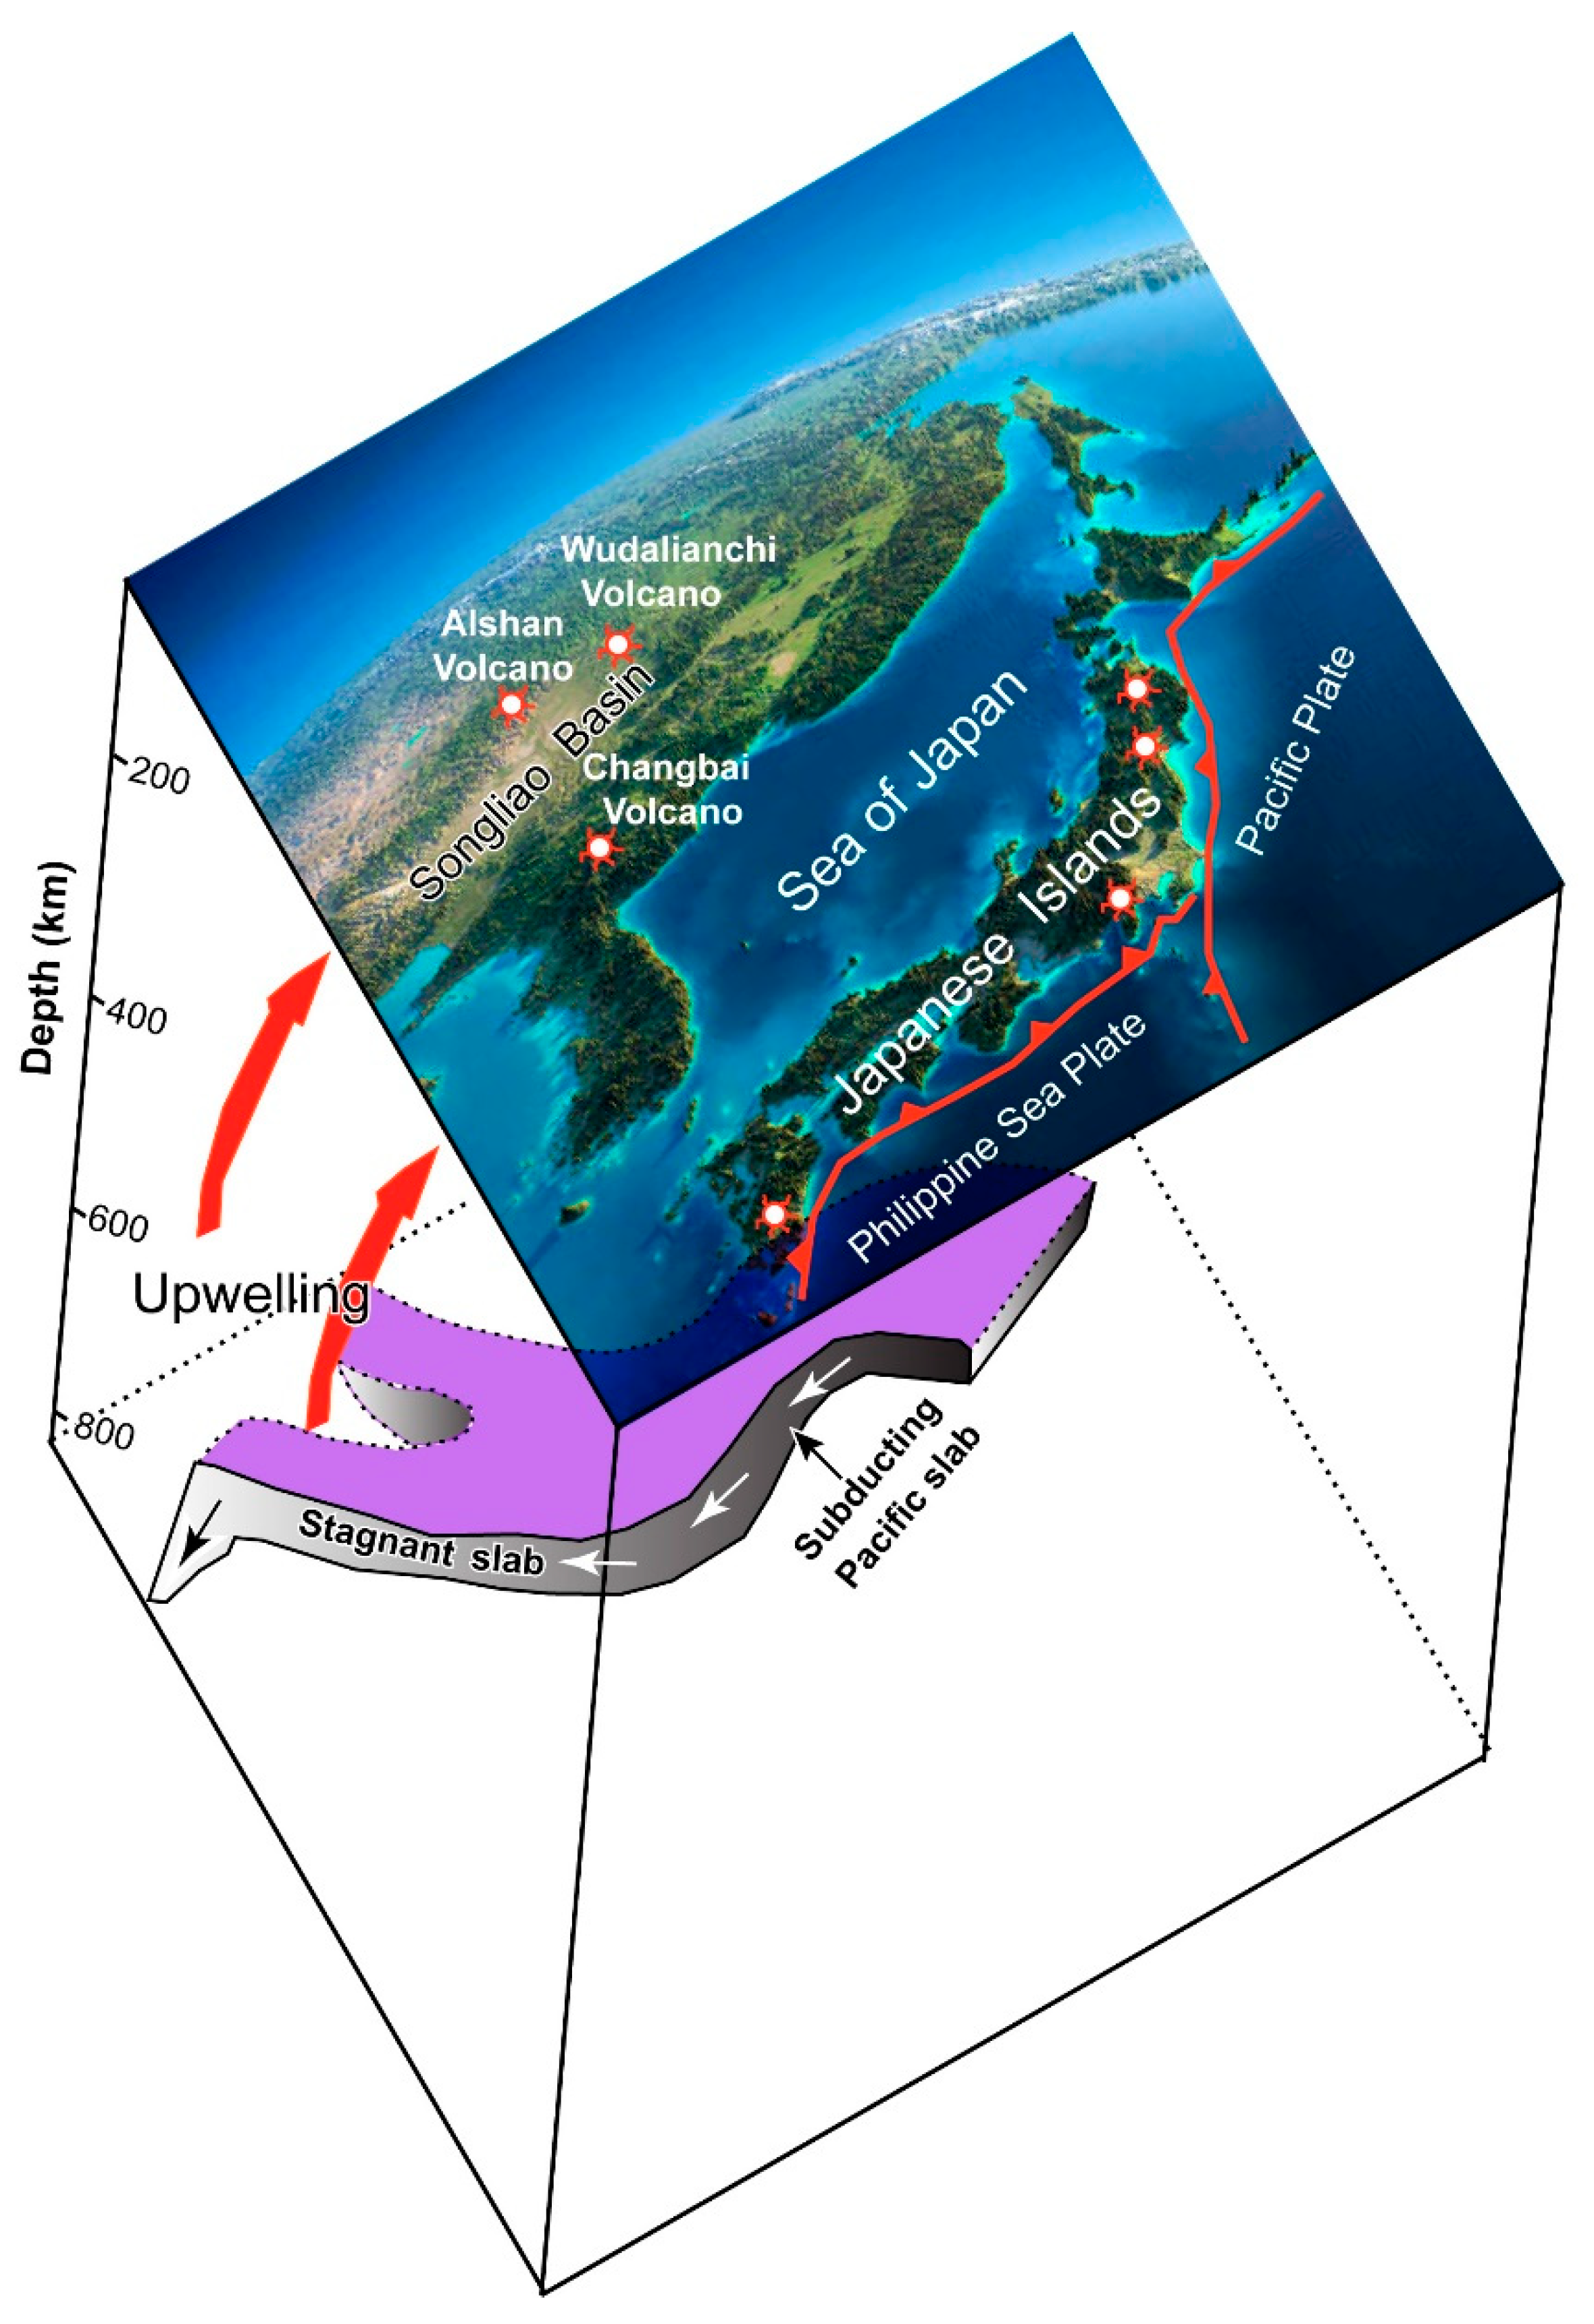
2. Geologic Setting
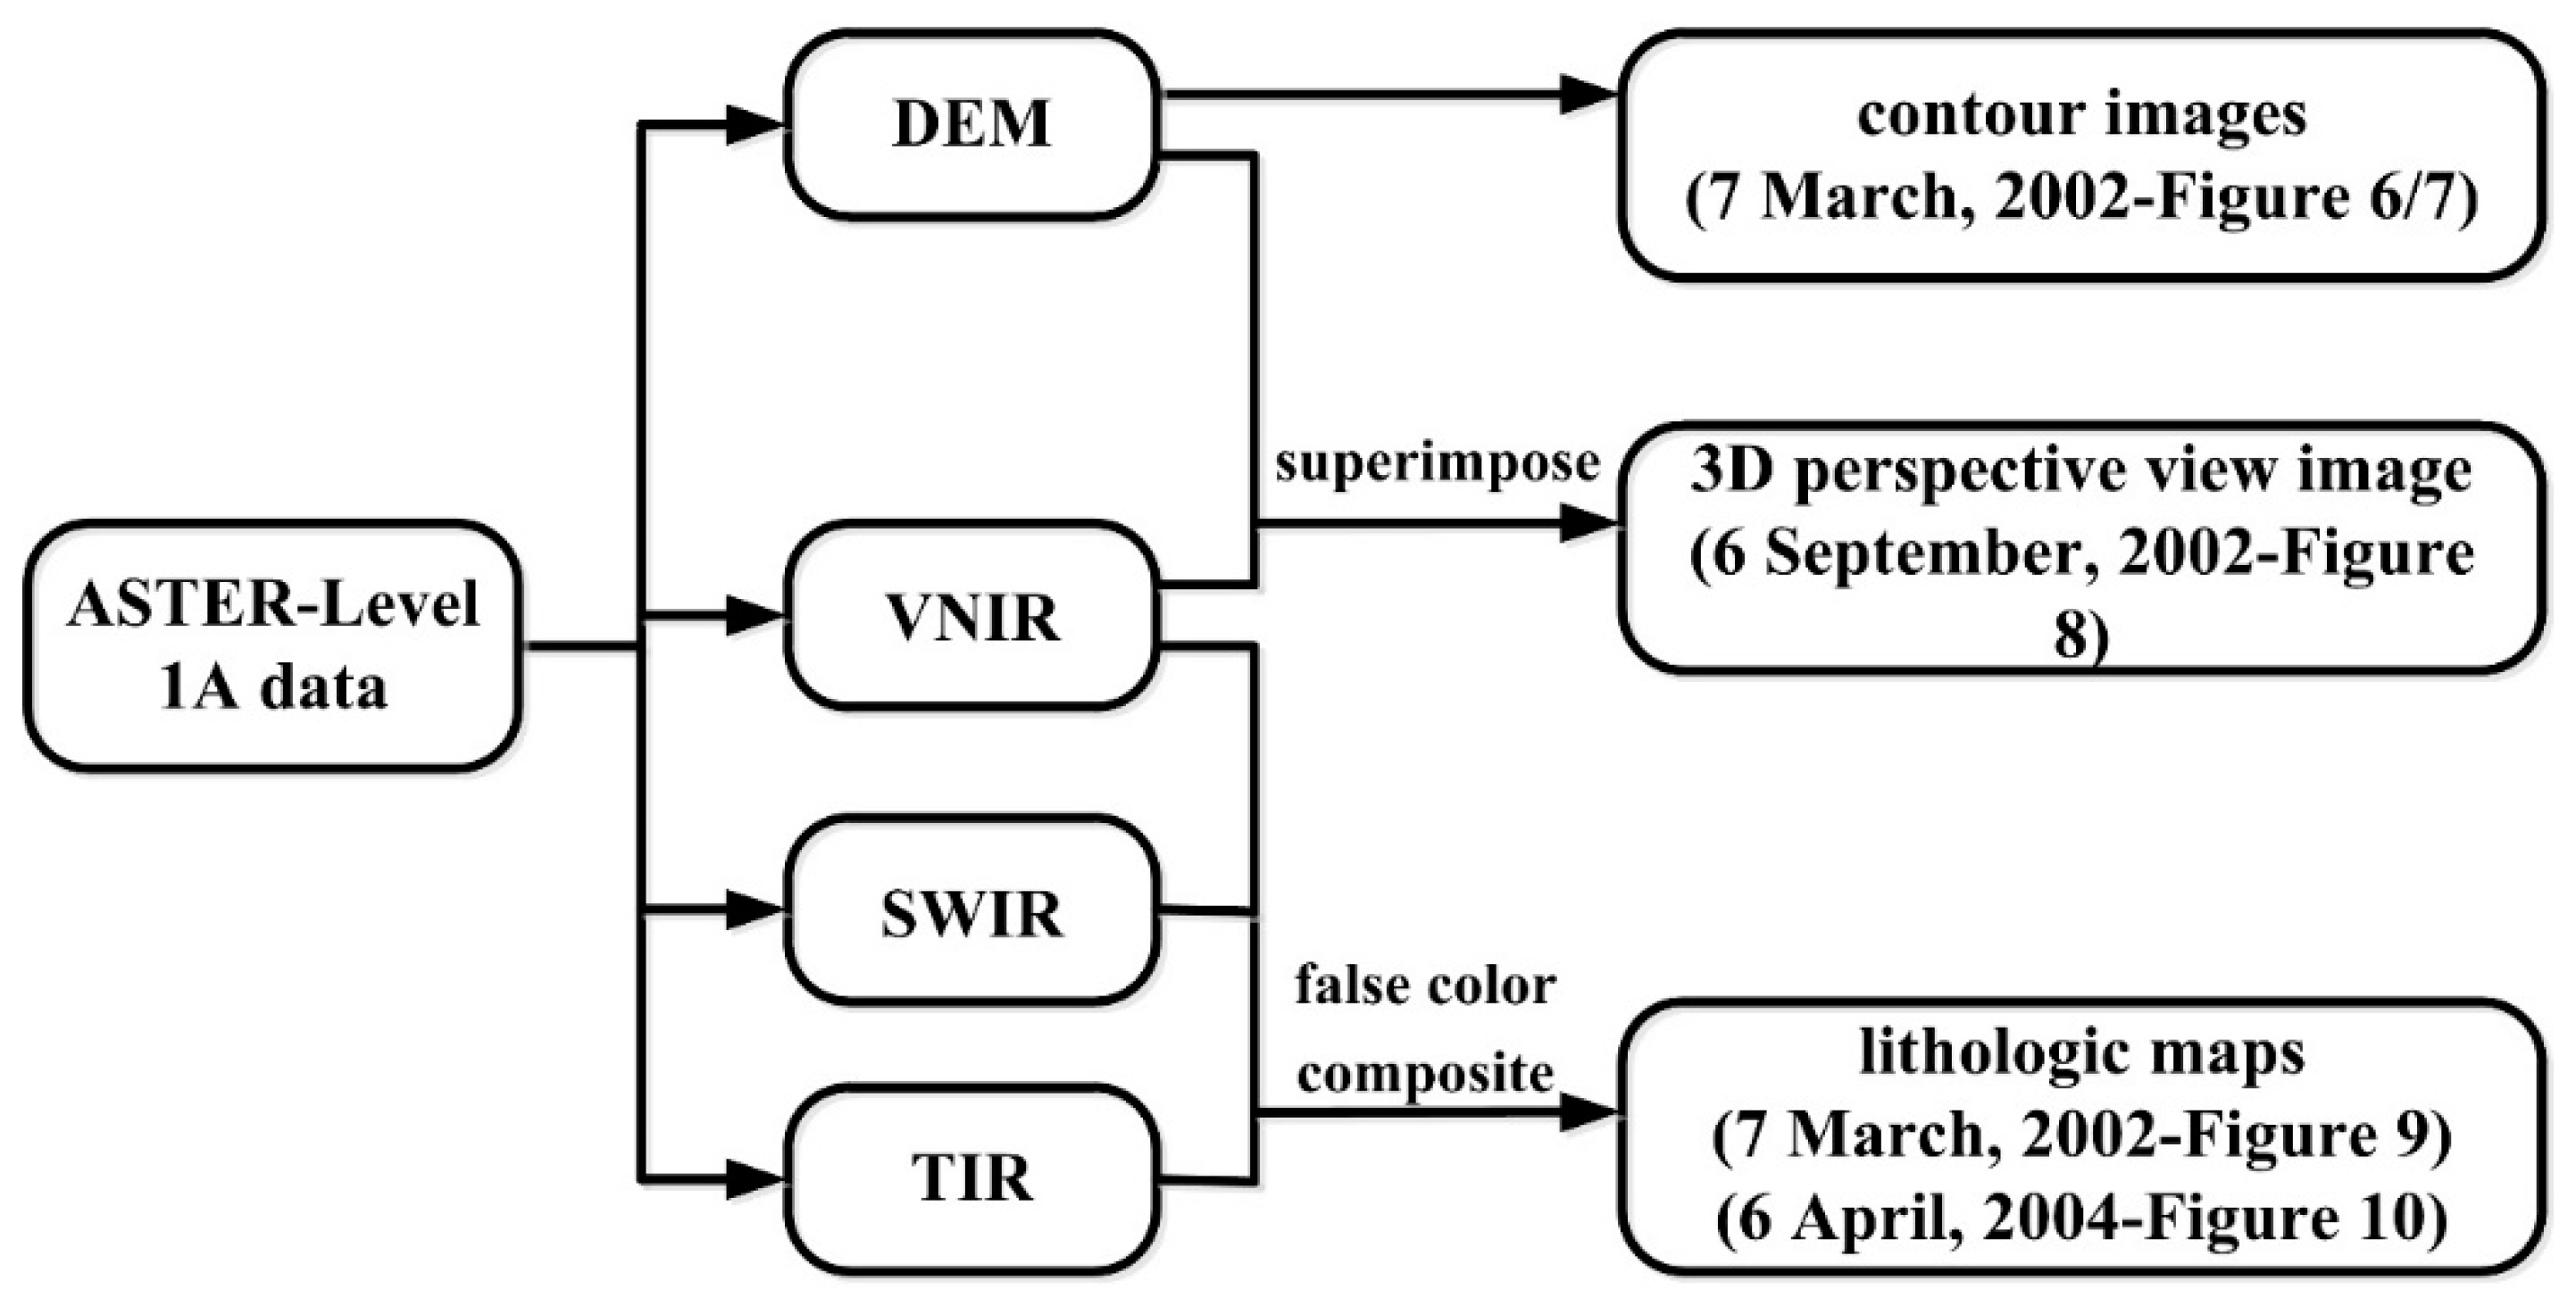
3. Methodology
3.1. The Generation of Contour Image and 3D Perspective View Image
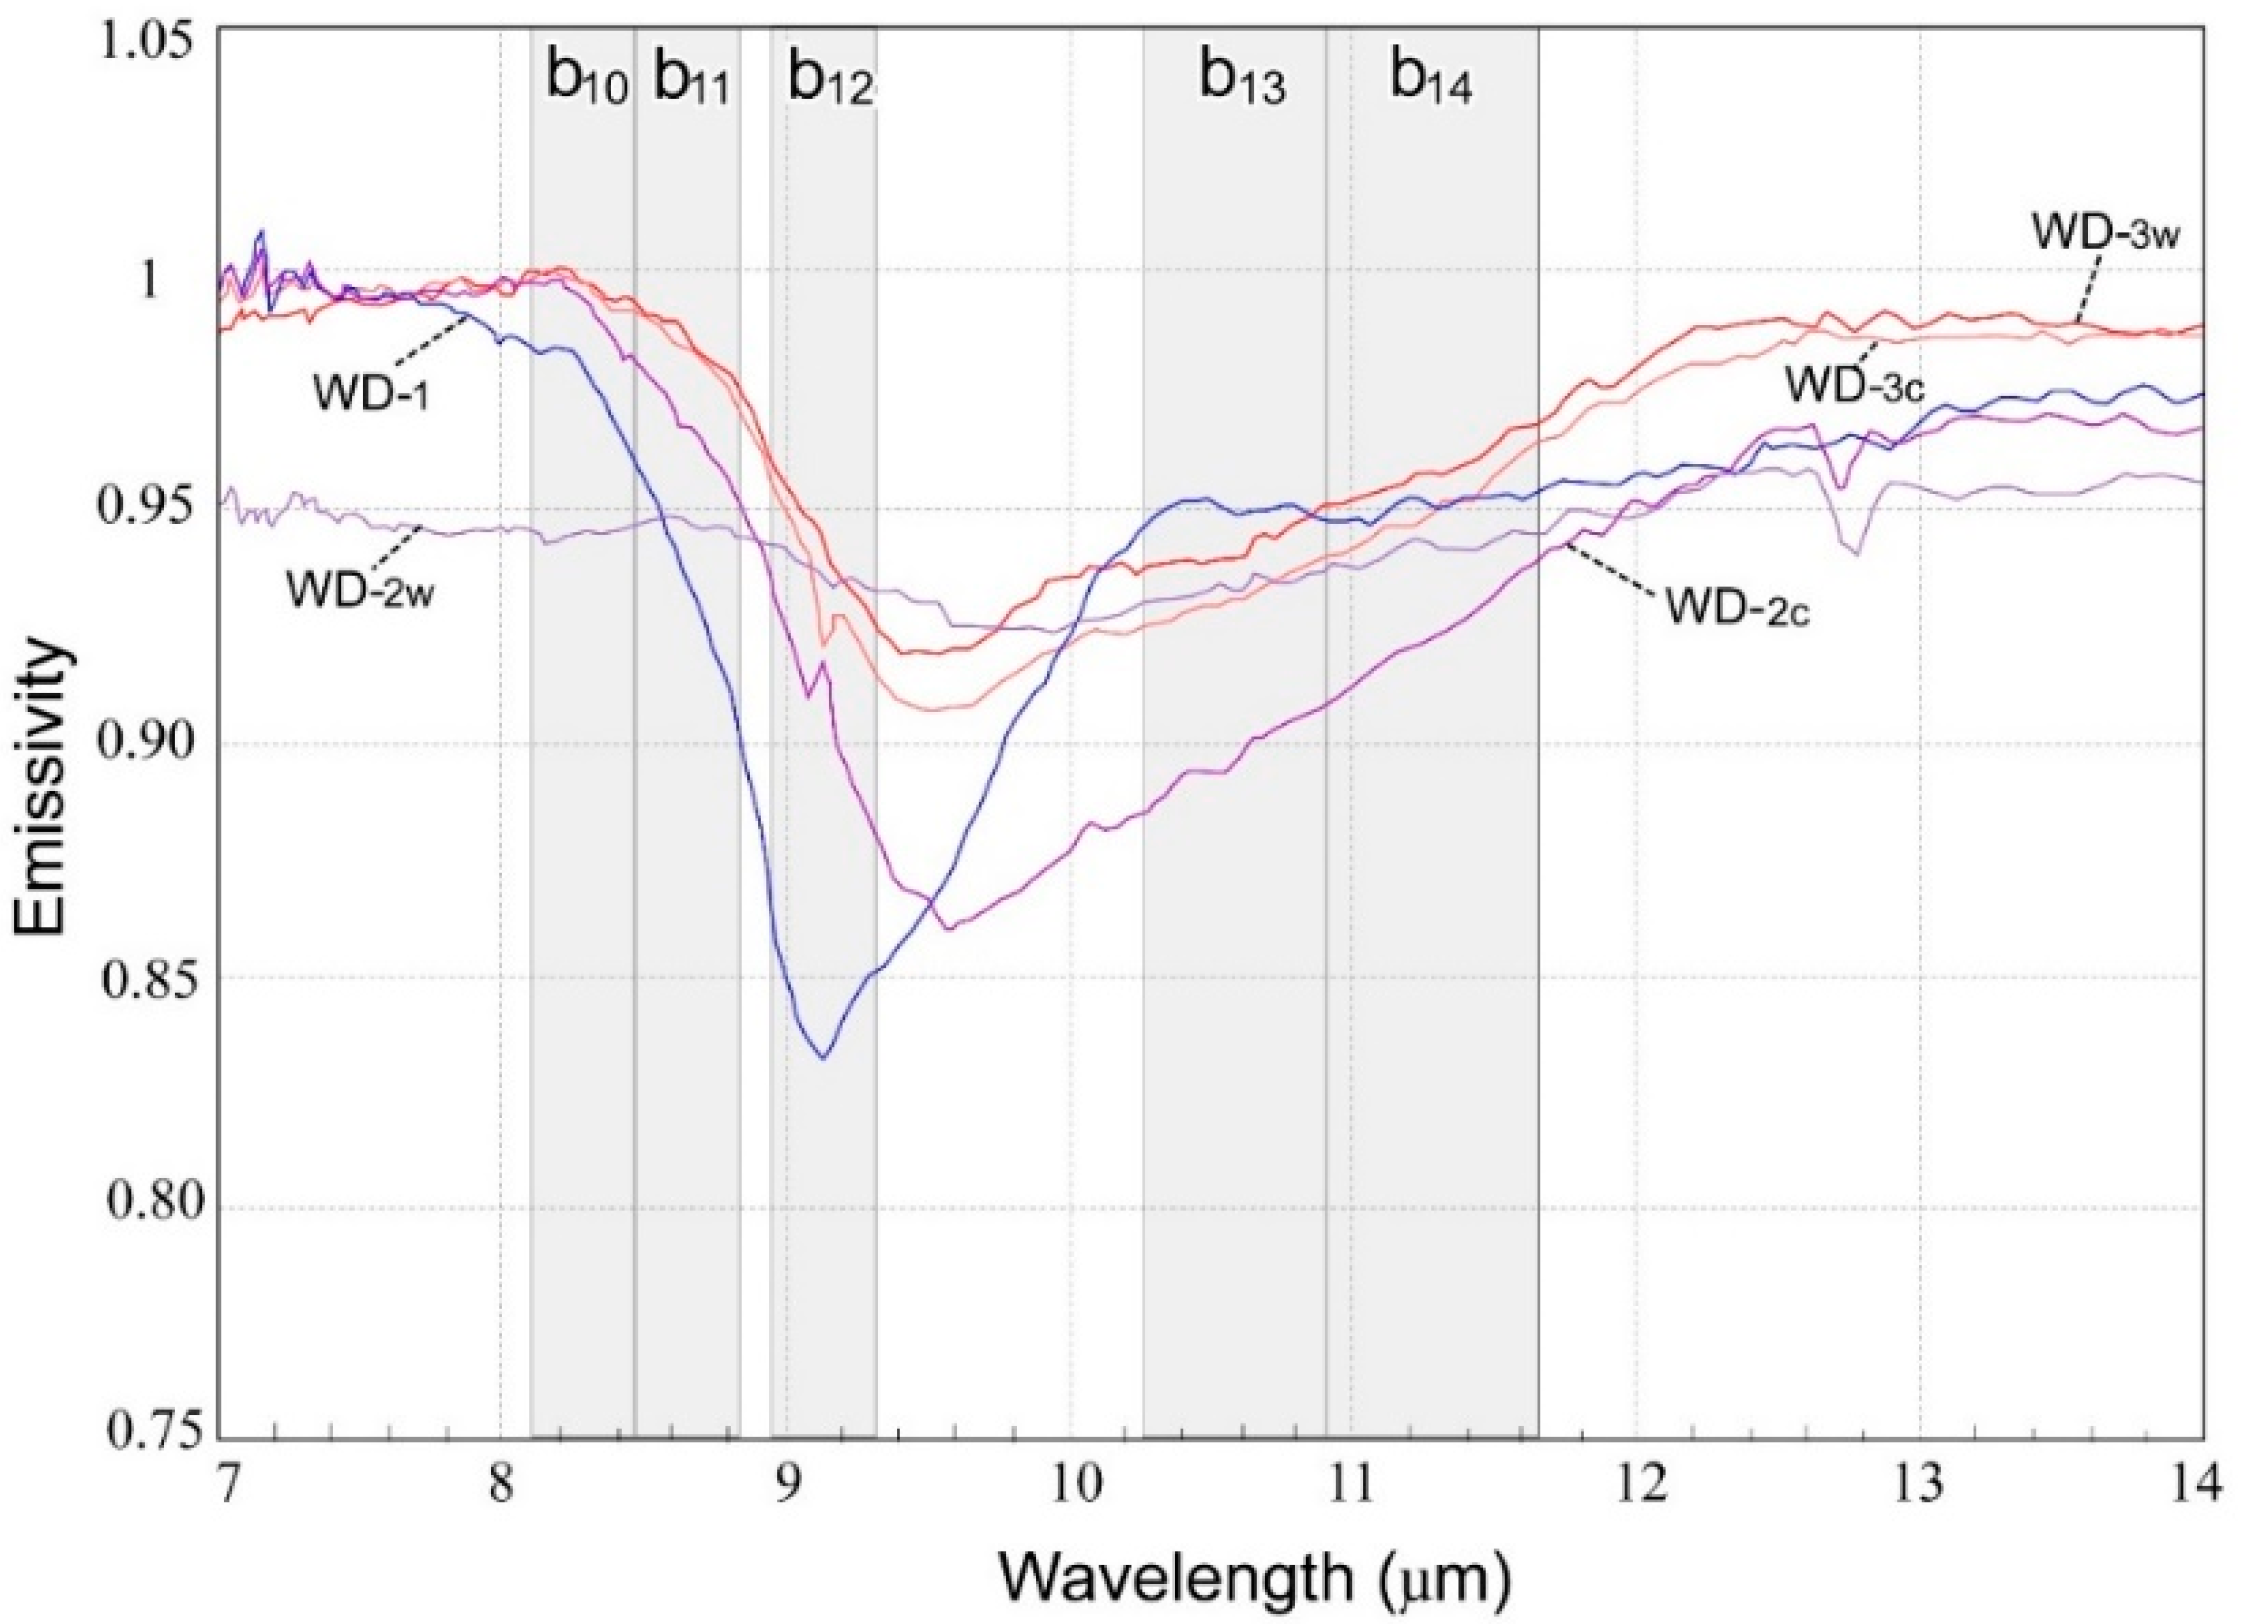
3.2. Laboratory Measurement for the Emissivity of Lava Fows
4. Results
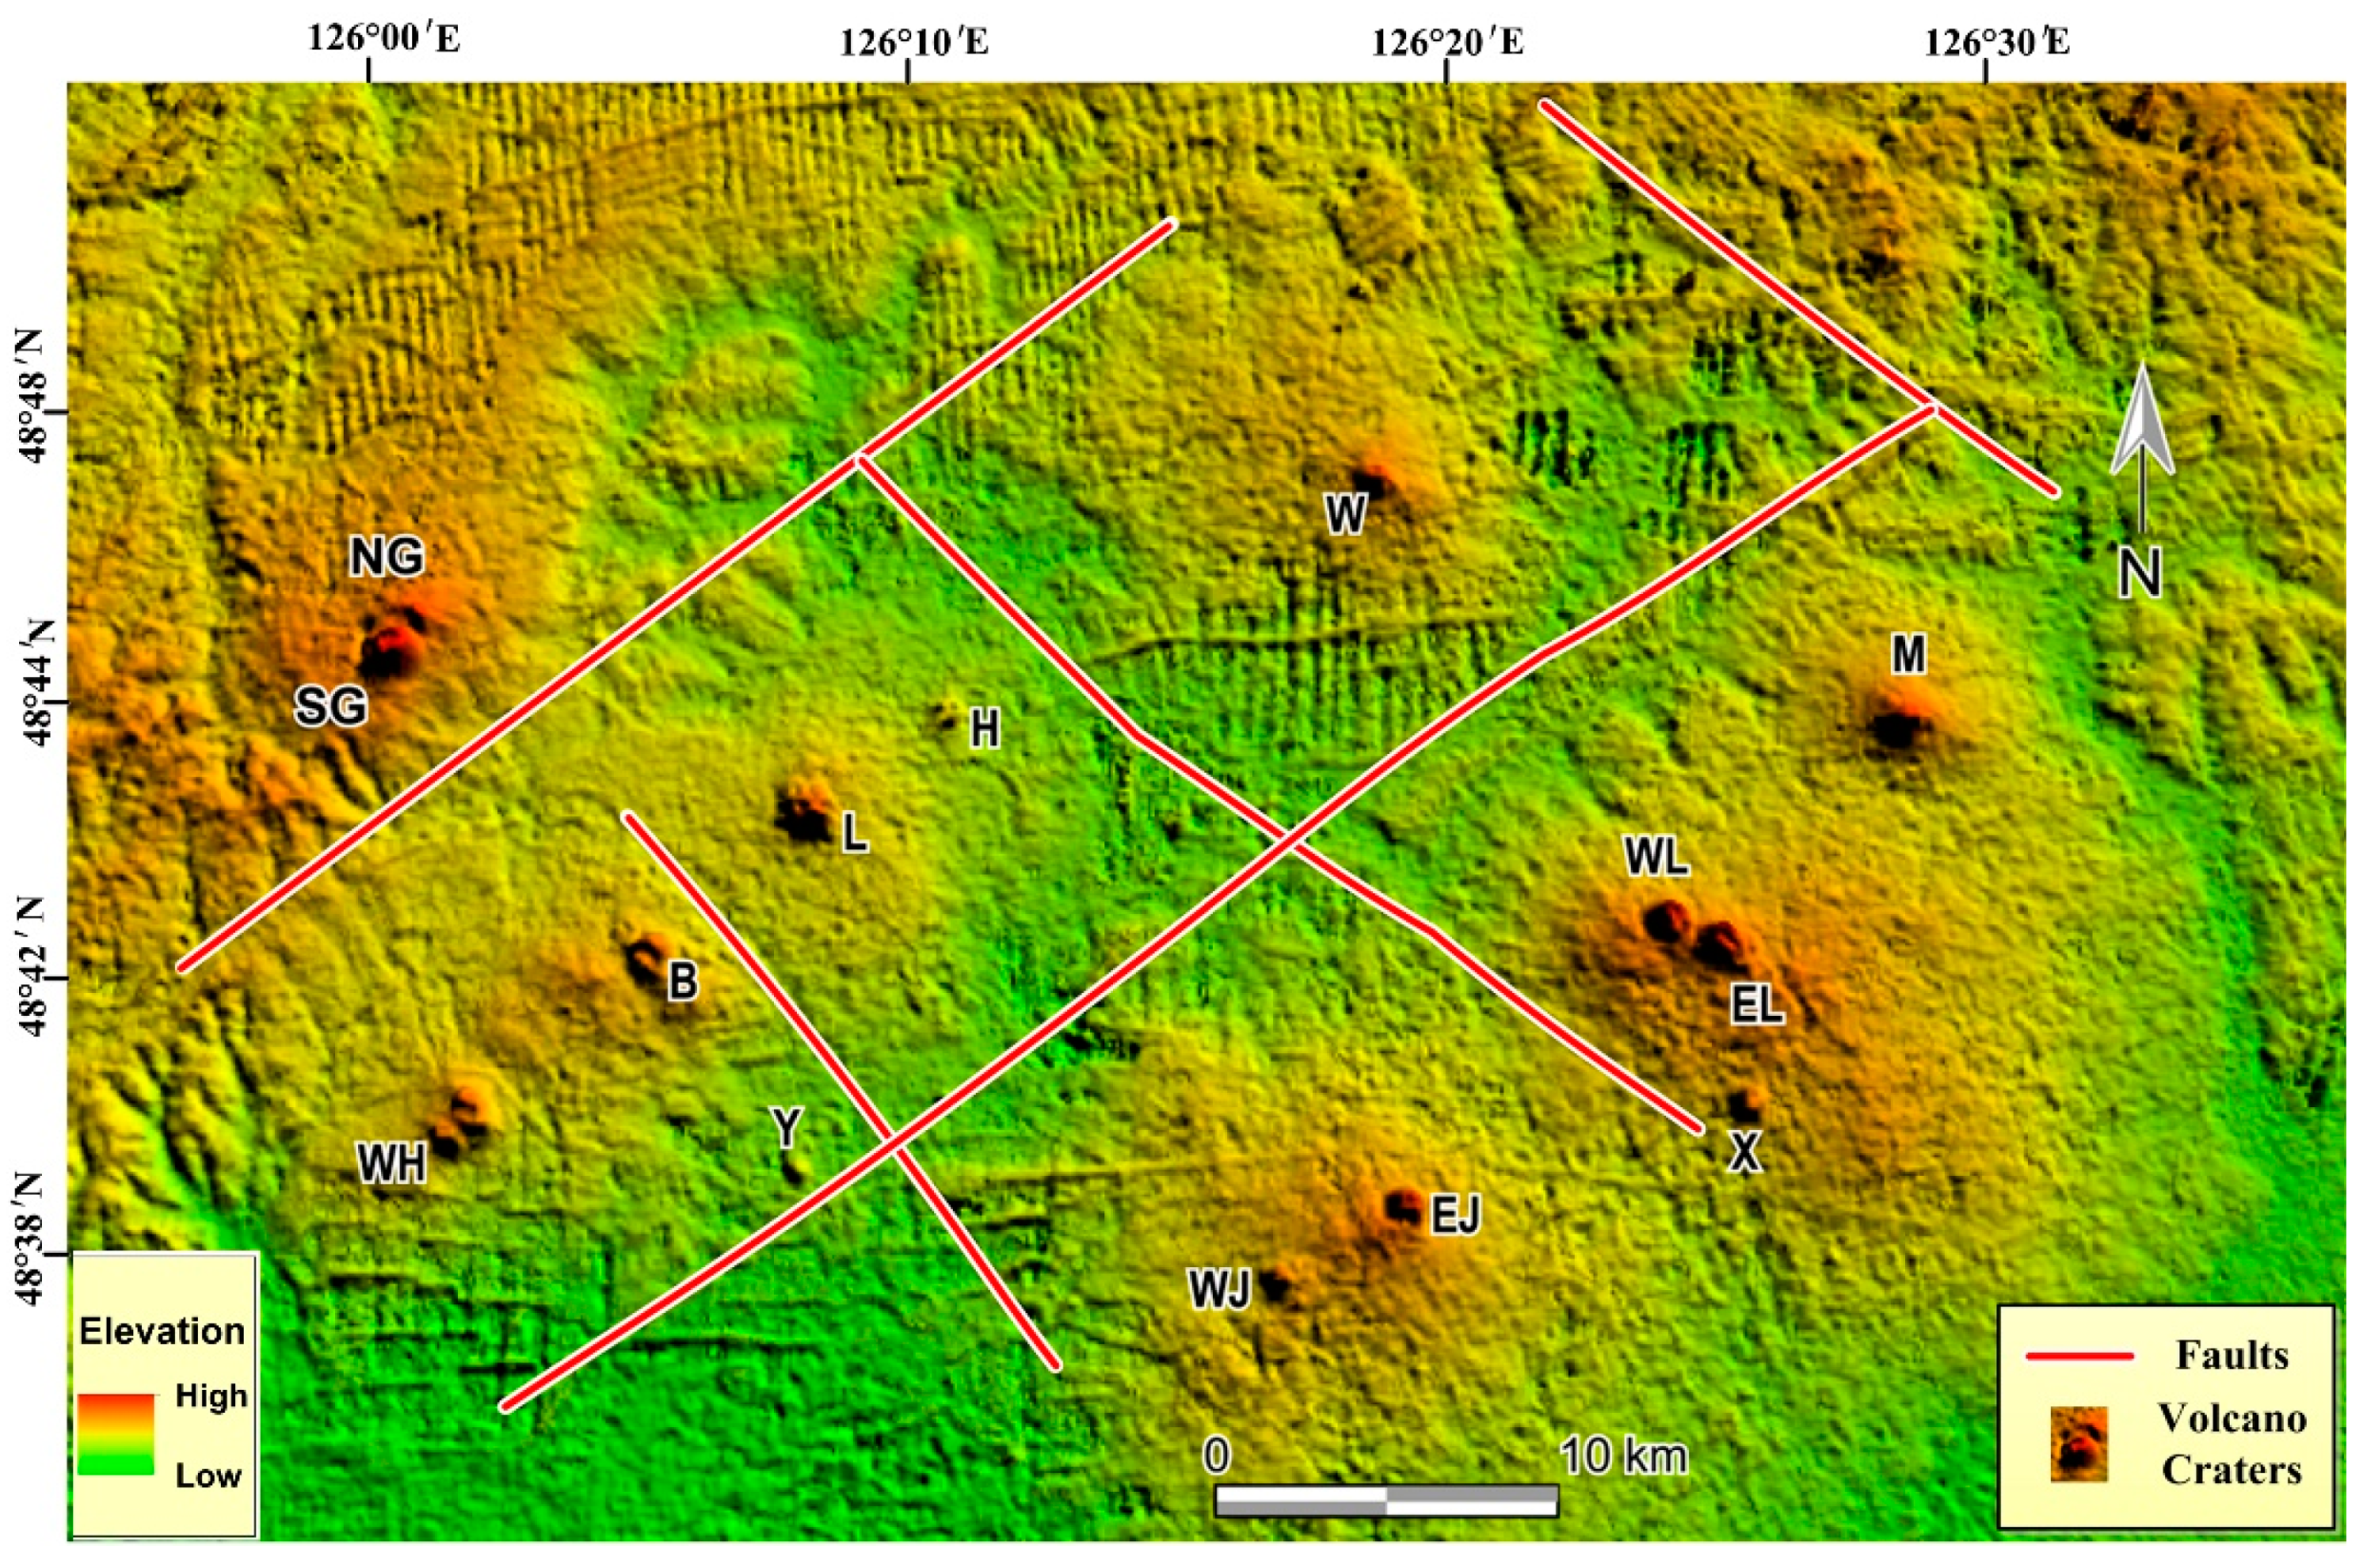
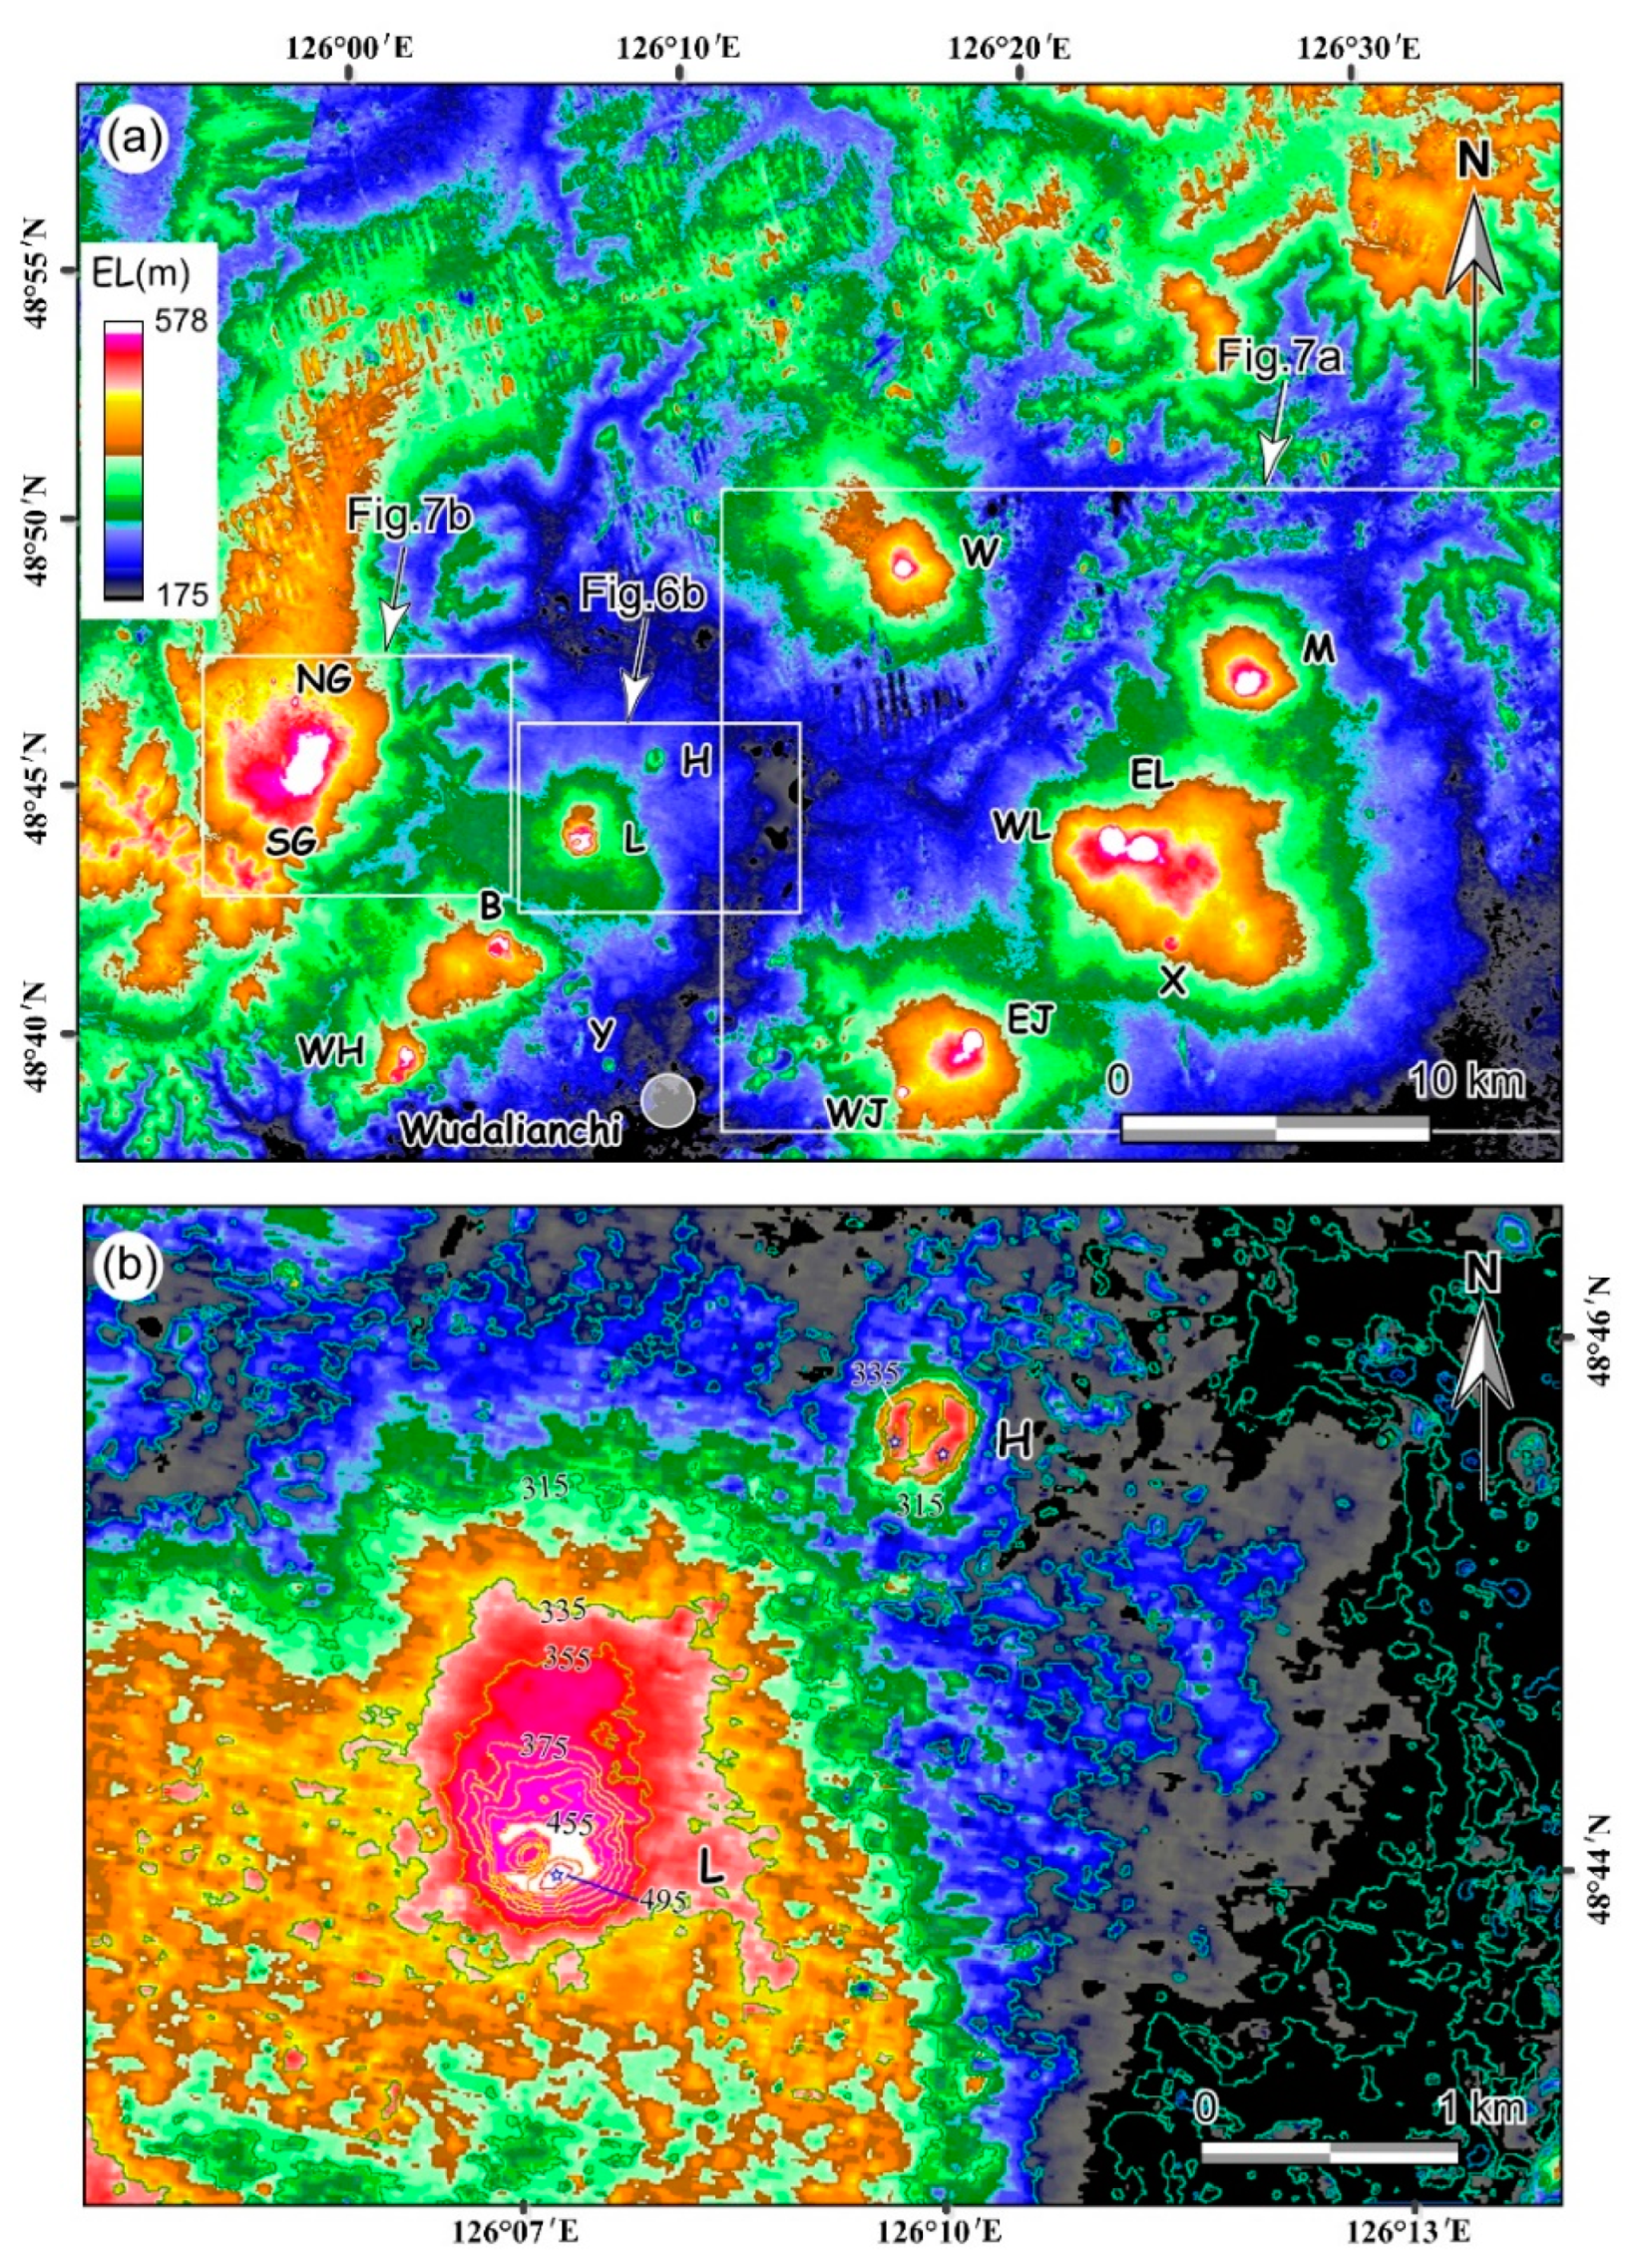
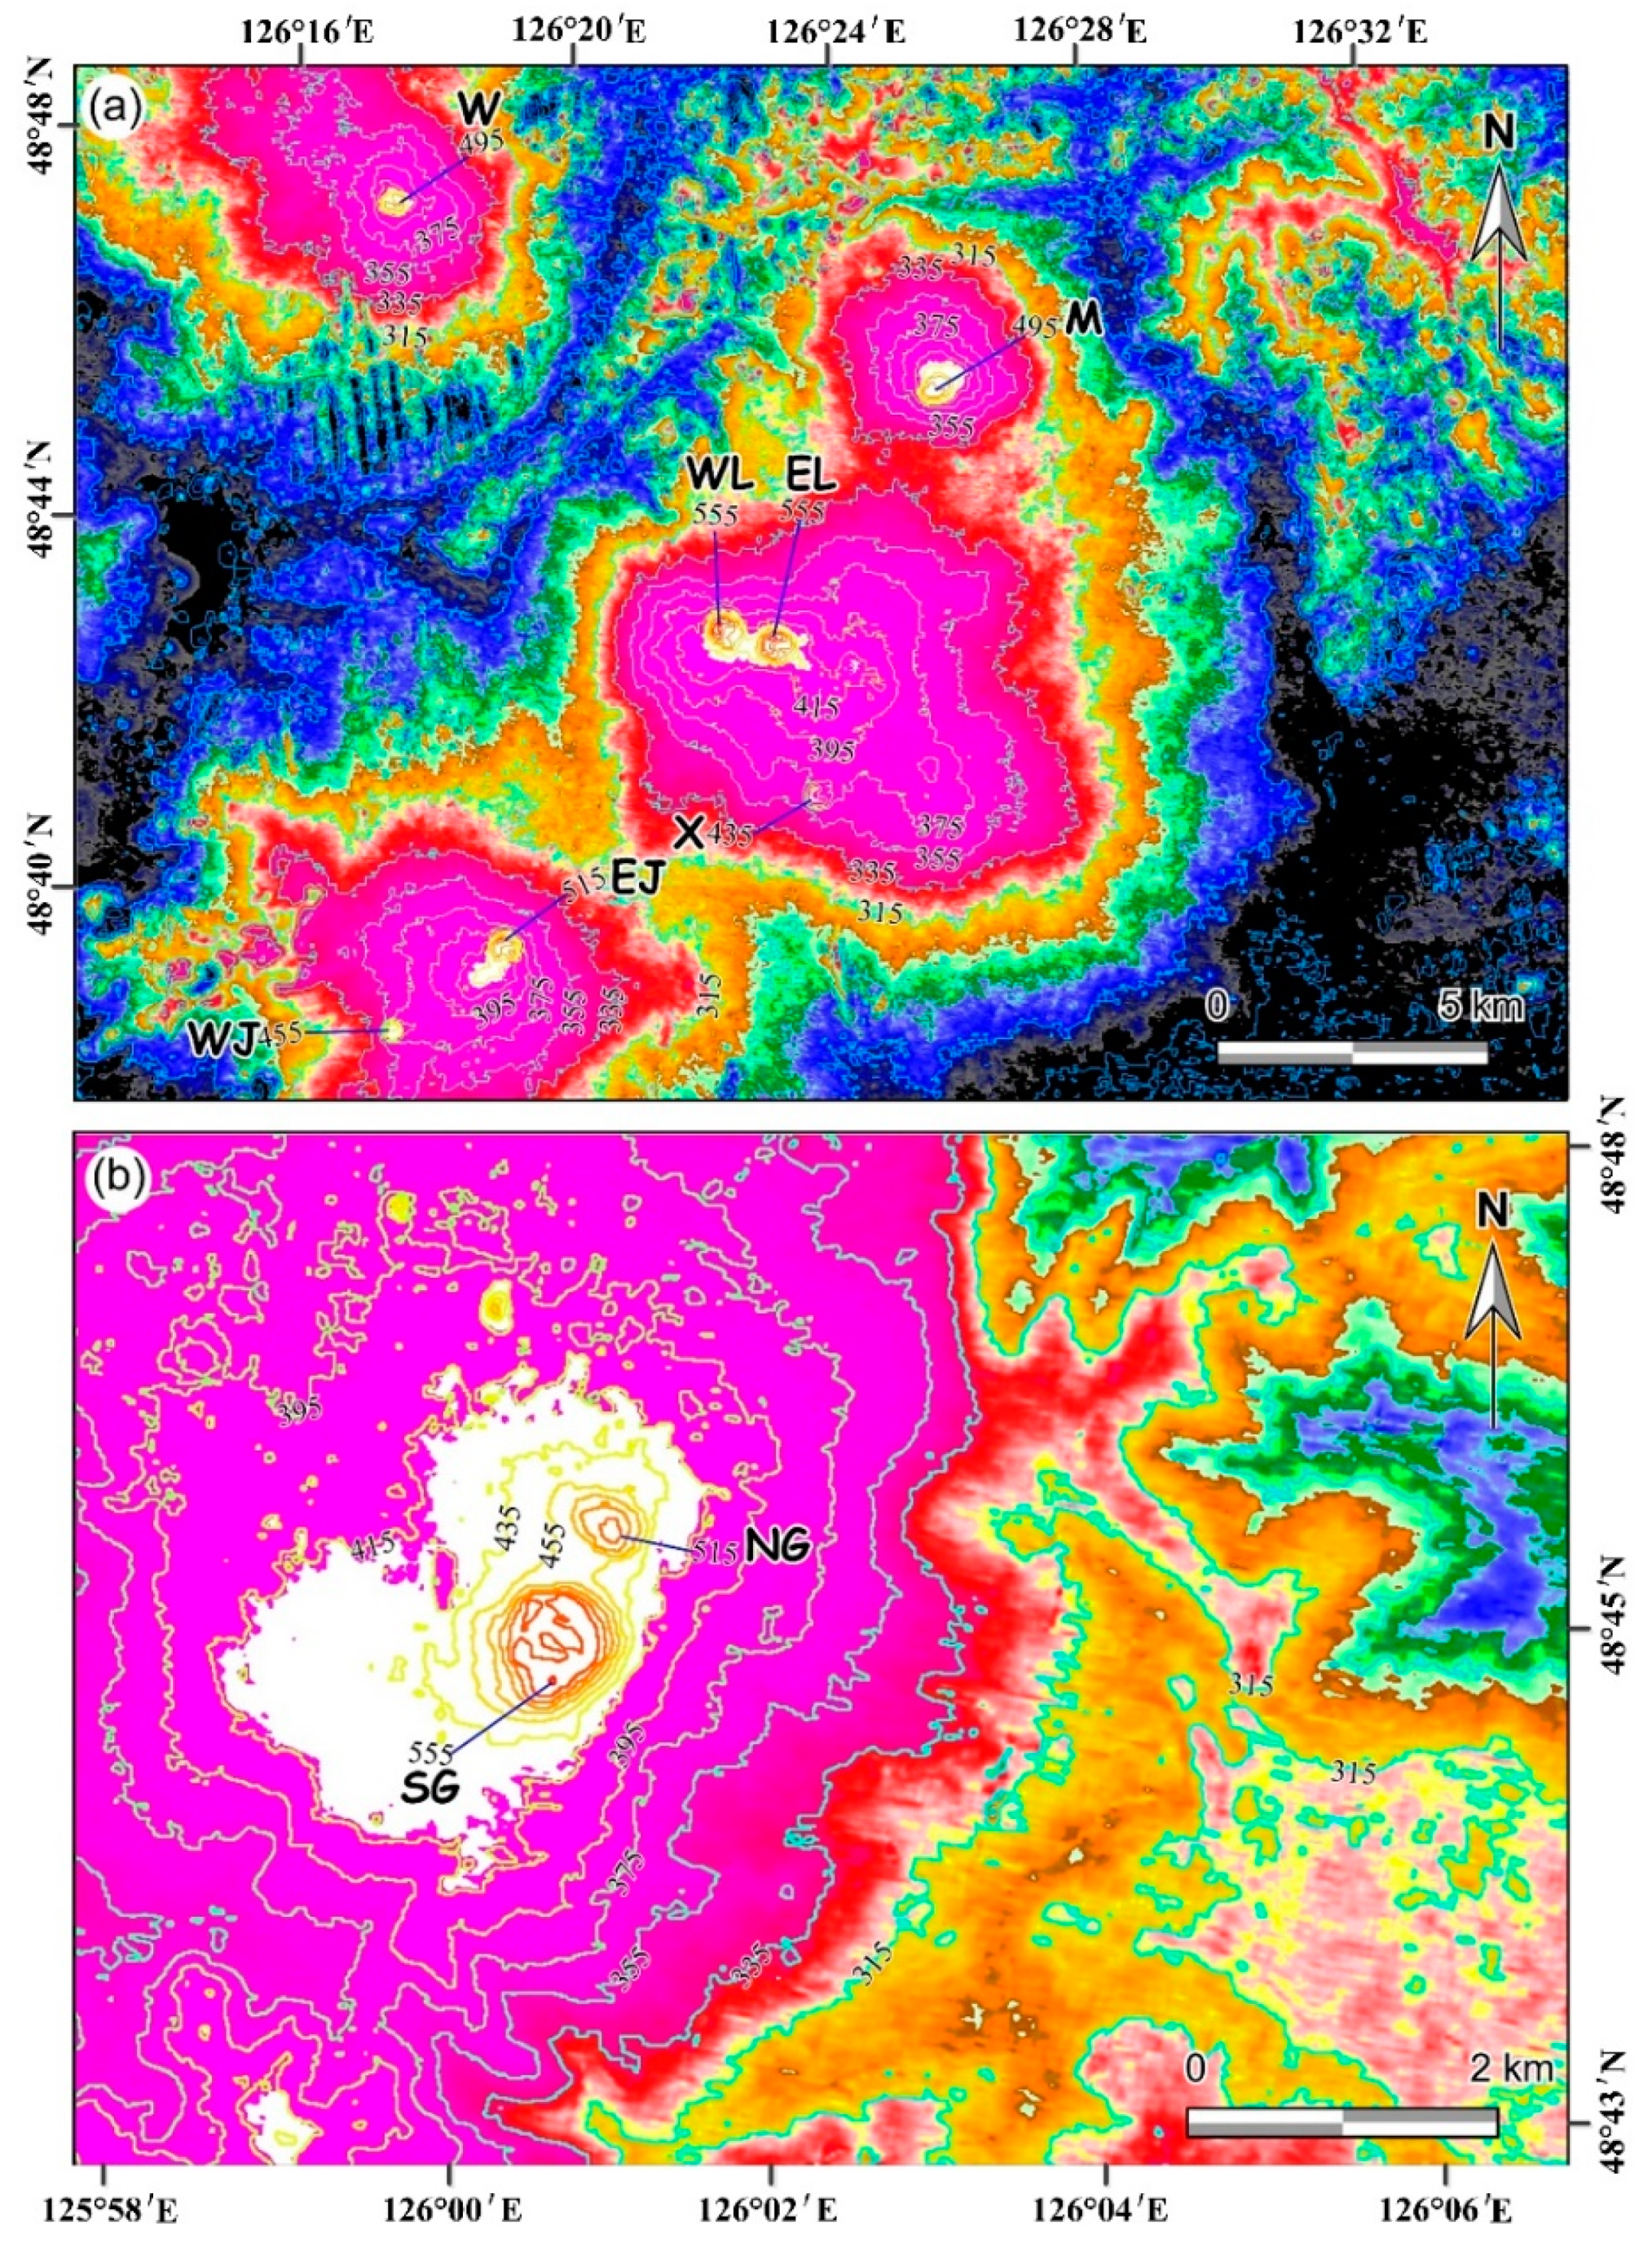
4.1. Topographic and Geomorphologic Features of Quaternary Volcanoes
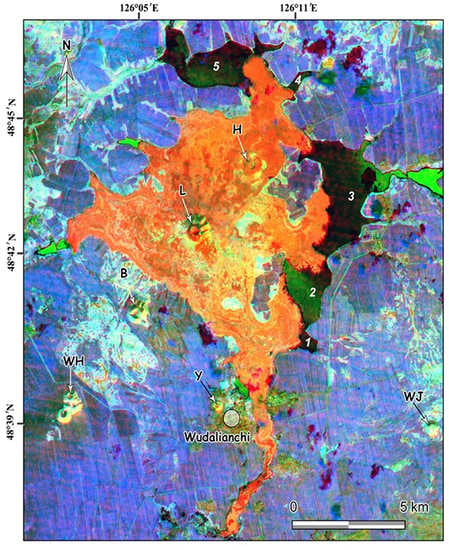
4.2. Lithologic Mapping of Lava Products and Their Relative Age Dating
5. Discussion
- (1)
- (2)
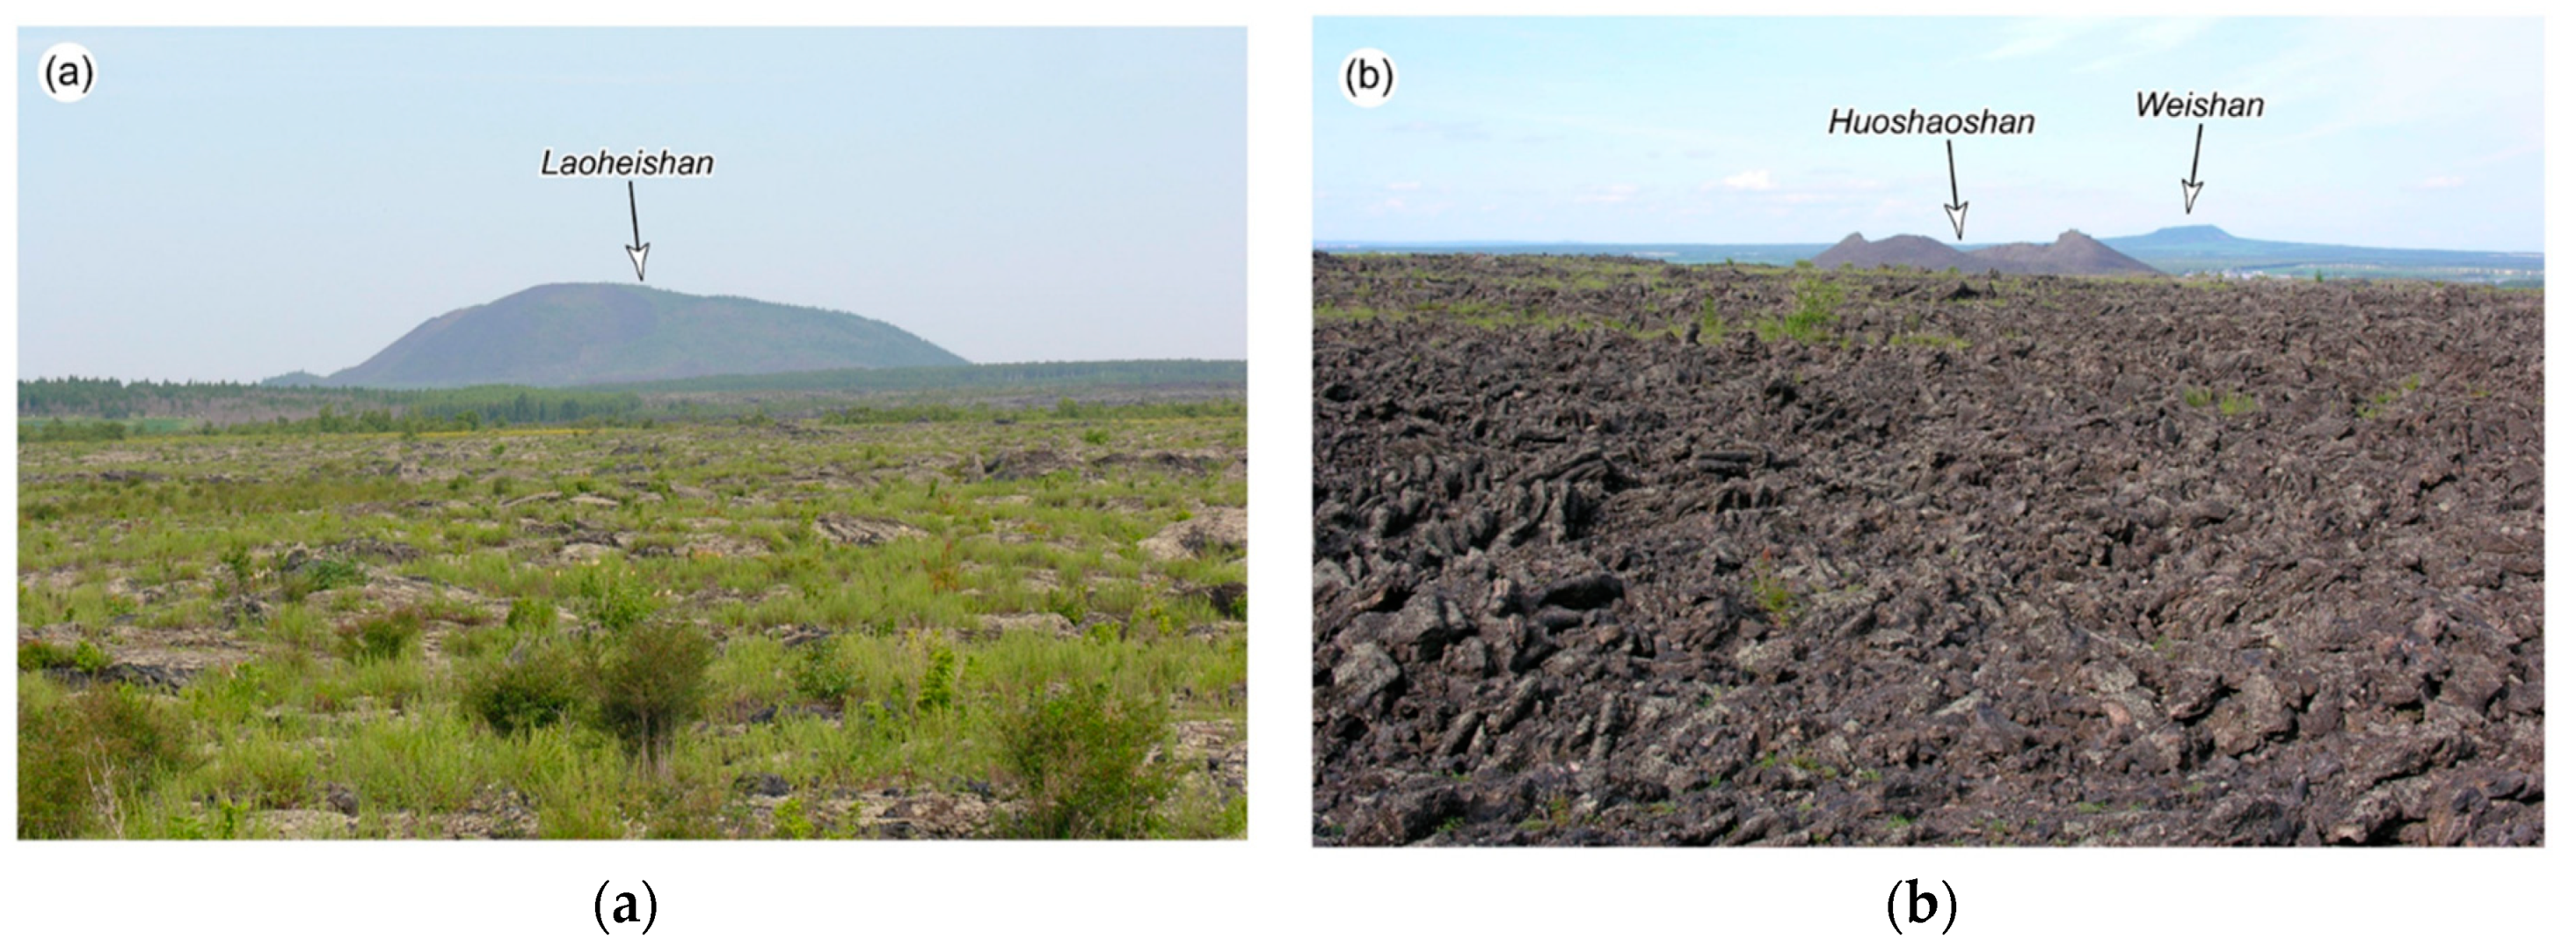
- The presence of vegetation on lava flows. Spectral measurement shows that the value of emissivity in band 12 increases comparing weathered surface covered by the lichen (WD-2w) with cut surface of same sample (WD-2c in Figure 5). Field investigation shows that some lava flows are indeed covered by dry lichen or low brushes although vegetation is sparsely in the Wudalianchi volcanic region (Figure 11).
6. Conclusions
Author Contributions
Funding
Conflicts of Interest
References
- Ramsey, M.S.; Fink, J.H. Estimating silicic lava vesicularity with thermal remote sensing: A new technique for volcanic mapping and monitoring. Bull. Volcanol. 1999, 66, 32–39. [Google Scholar] [CrossRef]
- Francis, P.; Rothery, D. Remote sensing of active volcanoes. Annu. Rev. Earth Planet. Sci. 2000, 28, 81–106. [Google Scholar] [CrossRef]
- Abrams, M.; Glaze, L.; Sheridan, M. Monitoring Colima volcano, Mexico, using satellite data. Bull. Volcanol. 1991, 53, 571–574. [Google Scholar] [CrossRef]
- Pieri, D.; Abrams, M. ASTER observations of thermal anomalies preceding the April 2003 eruption of Chikurachki volcano, Kurile Islands, Russia. Remote Sens. Environ. 2005, 99, 84–94. [Google Scholar] [CrossRef]
- Urai, M.; Machida, S. Disclored seawater detection using ASTER reflectance products: A case study of Satsuma-Iwojima, Japan. Remote Sens. Environ. 2005, 99, 95–104. [Google Scholar] [CrossRef]
- Urai, M.; Geshi, N.; Staudacher, T. Size and volume evaluation of the caldera collapse on Piton de la Fournaise volcano during the April 2007 eruption using ASTER stereo imagery. Geophys. Res. Lett. 2007, 34, L22318. [Google Scholar] [CrossRef]
- Cater, A.J.; Ramsey, M.S.; Belousov, A.B. Detection of a new summit crater on Bezymianny Volcano lava dome: Satellite and field-based thermal data. Bull. Volcanol. 2007, 69, 811–815. [Google Scholar] [CrossRef]
- Kahle, A.B.; Gllispie, A.R.; Abbott, E.A.; Abrams, M.J.; Walker, R.E.; Hoover, G.; Lockwood, J.P. Relative dating of Hawaiian lava flows using multispectral thermal infrared images: A new tool for geologic mapping of young volcanic terranes. J. Geophys. Res. 1988, 93, 15239–15251. [Google Scholar] [CrossRef]
- Abrams, M.; Abbott, E.; Kahle, A. Combined use of visible, reflected infrared and thermal infrared images for mapping Hawaiian lava flows. J. Geophys. Res. 1991, 98, 475–484. [Google Scholar] [CrossRef]
- Yamaguchi, Y.; Kahle, A.B.; Tsu, H.; Kawakami, T.; Pniel, M. Overview of Advanced Spaceborne Thermal Emission and Reflection Radiometer (ASTER). IEEE Trans. Geosci. Remote Sens. 1998, 36, 1062–1071. [Google Scholar] [CrossRef]
- Abrams, M.; Yamaguchi, Y. Twenty years of ASTER contributions to lithologic mapping and mineral exploration. Remote Sens. 2019, 11, 1394. [Google Scholar] [CrossRef]
- Fujisada, H.; Bailey, G.B.; Kelly, G.G.; Hara, S.; Abrams, M.J. ASTER DEM performance. IEEE Trans. Geosci. Remote Sens. 2005, 43, 2707–2714. [Google Scholar] [CrossRef]
- Ninomiya, Y.; Fu, B. Extracting lithologic information from ASTER multispectral thermal infrared data in the northeastern Pamirs. Xinjiang Geol. 2003, 21, 22–30. [Google Scholar]
- Ninomiya, Y.; Fu, B.; Cudahy, T.J. Detecting lithology with Advanced Spaceborne Thermal Emission and Refection Radiometer (ASTER) multispectral thermal infrared “radiance-at-sensor” data. Remote Sens. Environ. 2005, 99, 127–139. [Google Scholar] [CrossRef]
- Rowan, L.C.; Mars, J.C. Lithologic mapping in the Mountain Pass, California area using Advanced Spaceborne Thermal Emission and Reflection Radiometer (ASTER) data. Remote Sens. Environ. 2003, 84, 350–366. [Google Scholar] [CrossRef]
- Fu, B.; Zheng, G.; Ninomiya, Y.; Wang, C.; Sun, G. Mapping hydrocarbon-induced mineralogical alterations in the northern Tian Shan using ASTER multispectral data. Terra Nova 2007, 19, 225–231. [Google Scholar] [CrossRef]
- Feng, M.; Whitford-Sttark, J.L. The 1719–1721 eruptions of potassium-rich lavas at Wudalianchi, China. J. Volcanol. Geotherm. Res. 1986, 30, 131–140. [Google Scholar] [CrossRef]
- Wei, H.; Sparks, R.S.J.; Liu, R.; Fan, Q.; Wang, Y.; Hong, H.; Zhang, H.; Chen, H.; Jiang, C.; Dong, J.; et al. Three active volcanoes in China and their hazards. J. Asian Earth Sci. 2003, 21, 515–526. [Google Scholar] [CrossRef]
- Wang, Y.; Chen, H. Tectonic controls on the Pleistocene-Holocene Wudalianchi volcanic field (northeastern China). J. Asian Earth Sci. 2005, 24, 419–431. [Google Scholar] [CrossRef]
- Xu, S.; Zheng, G.; Nakai, S.; Wakita, H.; Wang, X.; Guo, Z. Hydrothermal He and CO2 at Wudalianchi intra-plate volcano, NE China. J. Asian Earth Sci. 2013, 62, 526–530. [Google Scholar] [CrossRef]
- Zhou, X.; Armstrong, R.L. Cenozoic volcanic rocks of eastern China-secular and geographic trends in chemistry and strontium isotopic composition. Earth Planet. Sci Lett. 1982, 58, 301–329. [Google Scholar] [CrossRef]
- Liu, J.; Han, J.; Fyfe, W.S. Cenozoic episodic volcanism and continental rifting in northeast China and possible link to Japan Sea development as revealed from K-Ar geochronology. Tectonophysics 2001, 339, 385–401. [Google Scholar] [CrossRef]
- Revenaugh, J.; Sipkin, S.A. Mantle discontinuity structure beneath China. J. Geophys. Res. 1994, 99, 21911–21927. [Google Scholar] [CrossRef]
- Lei, J.; Zhao, D. P-wave tomography and origin of the Changbai intraplate volcano in Northeast Asia. Tectonophysics 2005, 397, 281–295. [Google Scholar] [CrossRef]
- Fan, Q.; Liu, R.; Sui, J. Petrology and geochemistry of rift-type Wudalianchi K-rich volcanic rock zone. Geol. Rev. 1999, 45, 358–368, (In Chinese with English abstract). [Google Scholar]
- Chen, H.; Ren, J.; Wu, X. Volcanic eruptive processes and characteristics of the current volcanoes in the Wudalianchi volcano clusters known from Manchurian-langanauge historical archives discovered at present. Geol. Rev. 1999, 45, 409–413, (In Chinese with English abstract). [Google Scholar]
- Geological Museum of the Ministry of Geology. Wudalianchi Volcano, China; Shanghai Science and Technology Press: Shanghai, China, 1979; p. 3, (In Chinese with English introduction). [Google Scholar]
- Ji, F.J.; Li, Q. The TL chronological evidence of the recent eruption in Wudalianchi volcanic cluster. Seismol. Geol. 1998, 20, 302–304, (In Chinese with English abstract). [Google Scholar]
- Wu, X. Some Mongolian archives about eruption history in Wudalianchi volcanoes. North. Cult. Relics 1998, 2, 90–91, (In Chinese with English abstract). [Google Scholar]
- Lu, Z. Modern volcanic structure and its formation mechanism of the Wudalianchi volcanic group in Heilongjiang Province. J. Spectrosc. Miner. 1994, 1, 5–21. [Google Scholar]
- Mao, X.; Li, J.; Gao, W. A new understanding of the relationship between volcanic distribution and faults in the Wudalianchi volcanic group of Heilongjiang Province. J. Geol. Geol. 2010, 16, 226–235. [Google Scholar]
- Tatsumi, Y.; Maruyama, S.; Nohda, S. Mechanism of backarc opening in the Japan sea: Role of asthenospheric injection. Tectonophysics 1990, 181, 299–306. [Google Scholar] [CrossRef]
- Huang, J.; Zhao, D. High-resolution mantle tomography of China and surrounding regions. J. Geophys. Res. 2006, 111, B09305. [Google Scholar] [CrossRef]
- Zhao, D.; Hasegawa, A.; Kanamori, H. Deep structure of Japan subduction zone as derived from local, regional, and teleseismic events. J. Geophys. Res. Solid Earth 1994, 99, 2313–22329. [Google Scholar] [CrossRef]
- Zhao, D.; Xu, Y.; Wien, D. Depth extent of the lau back-arc spreading center and its relation to subduction processes. Science 1997, 278, 254–257. [Google Scholar] [CrossRef]
- Zhao, D.; Mishra, O.P.; Sanda, R. Influence of fluids and magma on earthquakes: Seismological evidence. Phys. Earth Planet. Inter. 2002, 132, 249–267. [Google Scholar] [CrossRef]
- Wei, W.; Hammond, J.O.S.; Zhao, D.; Xu, J.; Liu, Q.; Gu, Y. Seismic evidence for a mantle transition zone origin of the Wudalianchi and Halaha volcanoes in northeast China. Geochem. Geophys. Geosyst. 2019, 20, 398–416. [Google Scholar] [CrossRef]
- Qiu, J.; Wu, Z.; Du, X. Study on the mantle inclusions in the Erkeshan-Wudalianchi-Kolofu potassium volcanic rocks in Heilongjiang Province. Mod. Geol. 1987, 3, 44–356. [Google Scholar]
- Peng, N. Study on Dynamic Stability of Volcanic Magma Chamber in Wudalianchi New Period. Ph.D. Thesis, Capital Normal University, Beijing, China, 2004. (In Chinese with English abstract). [Google Scholar]
- Qin, H. The Cracking Characteristics and Genesis of the Lava Flow in the Western Heilongjiang, Wudalianchi. Master’s Thesis, Capital Normal University, Beijing, China, 2009. (In Chinese with English abstract). [Google Scholar]
- Hook, S.J.; Kahle, A.B. The micro Fourier Transform Interferometer (µFTIR)—A new field spectrometer for acquisition of infrared data of natural surfaces. Remote Sens. Environ. 1996, 56, 172–181. [Google Scholar] [CrossRef]
- Cornelissen, J.H.C.; Callaghan, T.V.; Alatalo, J.M.; Michelsen, A.; Graglia, E.; Hartley, A.E. Global change and arctic ecosystems: Is lichen decline a function of increases in vascular plant biomass? J. Ecol. 2001, 89, 984–994. [Google Scholar] [CrossRef]
- Zou, Y.; Zhao, Y.; Fan, Y. Volcanic eruption methods and types of disasters in the Wudalianchi volcanic belt. Seismol. Geol. 2019, 41, 192–210, (In Chinese with English abstract). [Google Scholar]
- Fu, B.; Ninomiya, Y.; Lei, X.; Toda, S.; Awata, Y. Mapping the active strike-slip fault triggered the 2003 Mw 6.6 Bam, Iran, earthquake with ASTER 3D images. Remote Sens. Environ. 2004, 92, 153–157. [Google Scholar] [CrossRef]


| Band | Wavelength Range (μm) | Band Type | Spatial Resolution (m) |
|---|---|---|---|
| B1 | 0.52–0.60 | VNIR (visible and near infrared) | 15 |
| B2 | 0.63–0.69 | VNIR | 15 |
| B3N | 0.76–0.86 | VNIR | 15 |
| B3B | 0.76–0.86 | VNIR | 15 |
| B4 | 1.60–1.70 | SWIR (shortwave infrared) | 30 |
| B5 | 2.145–2.185 | SWIR | 30 |
| B6 | 2.185–2.225 | SWIR | 30 |
| B7 | 2.235–2.285 | SWIR | 30 |
| B8 | 2.295–2.365 | SWIR | 30 |
| B9 | 2.36–2.43 | SWIR | 30 |
| B10 | 8.125–8.475 | TIR (thermal infrared) | 90 |
| B11 | 8.475–8.825 | TIR | 90 |
| B12 | 8.925–9.275 | TIR | 90 |
| B13 | 10.25–10.95 | TIR | 90 |
| B14 | 10.95–11.65 | TIR | 90 |
| Obtained Date | Central Point | Product Level | Vertical Accuracy of Digital Elevation Model |
|---|---|---|---|
| 7 March, 2002 | 48.87°N, 126.42°E | orthorectified Level-3A | 20 m |
| 6 September, 2002 | 48.73°N, 125.82°E | orthorectified Level-3A | 20 m |
| 6 April, 2004 | 48.60°N, 125.98°E | orthorectified Level-3A | 20 m |
| Sample No. | Lithologic Characters | Location |
|---|---|---|
| WD-1 | fresh surface of black lava | South part of Huoshaoshan |
| WD-2c | fresh cut surface of lava | North part of Laoheishan |
| WD-2w | weathered surface of lava covered by some dry lichen | North part of Laoheishan |
| WD-3c | fresh cut surface of lava | South part of Laoheishan |
| WD-3w | weathered surface of lava | South part of Laoheishan |
© 2019 by the authors. Licensee MDPI, Basel, Switzerland. This article is an open access article distributed under the terms and conditions of the Creative Commons Attribution (CC BY) license (http://creativecommons.org/licenses/by/4.0/).
Share and Cite
Fu, H.; Fu, B.; Ninomiya, Y.; Shi, P. New Insights of Geomorphologic and Lithologic Features on Wudalianchi Volcanoes in the Northeastern China from the ASTER Multispectral Data. Remote Sens. 2019, 11, 2663. https://0-doi-org.brum.beds.ac.uk/10.3390/rs11222663
Fu H, Fu B, Ninomiya Y, Shi P. New Insights of Geomorphologic and Lithologic Features on Wudalianchi Volcanoes in the Northeastern China from the ASTER Multispectral Data. Remote Sensing. 2019; 11(22):2663. https://0-doi-org.brum.beds.ac.uk/10.3390/rs11222663
Chicago/Turabian StyleFu, Han, Bihong Fu, Yoshiki Ninomiya, and Pilong Shi. 2019. "New Insights of Geomorphologic and Lithologic Features on Wudalianchi Volcanoes in the Northeastern China from the ASTER Multispectral Data" Remote Sensing 11, no. 22: 2663. https://0-doi-org.brum.beds.ac.uk/10.3390/rs11222663