Lab Non Destructive Test to Analyze the Effect of Corrosion on Ground Penetrating Radar Scans


Department of Strength of Materials and Structural Engineering (RMEE), Polytechnic University of Catalonia, BarcelonaTech, 08019 Barcelona, Spain
*
Author to whom correspondence should be addressed.
Remote Sens. 2019, 11(23), 2814; https://0-doi-org.brum.beds.ac.uk/10.3390/rs11232814
Submission received: 30 September 2019
/
Revised: 23 November 2019
/
Accepted: 25 November 2019
/
Published: 27 November 2019
(This article belongs to the Special Issue Close Range Remote Sensing)
Abstract
:Corrosion is a significant damage in many reinforced concrete structures, mainly in coastal areas. The oxidation of embedded iron or steel elements degrades rebar, producing a porous layer not adhered to the metallic surface. This process could completely destroy rebar. In addition, the concrete around the metallic targets is also damaged, and a dense grid of fissures appears around the oxidized elements. The evaluation of corrosion is difficult in early stages, because damage is usually hidden. Non-destructive testing measurements, based on non-destructive testing (NDT) electric and magnetic surveys, could detect damage as consequence of corrosion. The work presented in this paper is based in several laboratory tests, which are centered in defining the effect of different corrosion stage on ground penetrating radar (GPR) signals. The analysis focuses on the evaluation of the reflected wave amplitude and its behavior. The results indicated that an accurate analysis of amplitude decay and intensity could most likely reveal an approach to the state of degradation of the embedded metallic targets because GPR images exhibit characteristics that depend on the effects of the oxidized rebar and the damaged concrete. These characteristics could be detected and measured in some cases. One important feature is referred to as the reflected wave amplitude. In the case of corroded targets, this amplitude is lower than in the case of reflection on non-oxidized surfaces. Additionally, in some cases, a blurred image appears related to high corrosion. The results of the tests highlight the higher amplitude decay of the cases of specimens with corroded elements.
Keywords:
GPR; corrosion; reinforced concrete; NDT; non-invasive; structural damage; laboratory test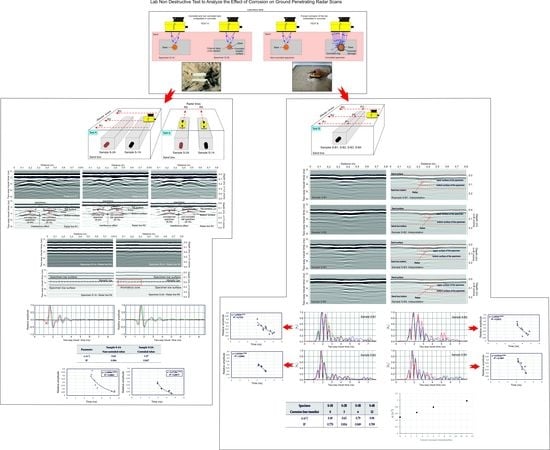
1. Introduction
Damage as consequence of corrosion is a frequent problem in reinforced concrete structures, mainly in coastal zones; in some cases, it is the cause of early failure. The corrosion of metallic reinforcements can cause degradation of steel and, in long term, the reduction of effective sections. Actually, this damage can produce the total loss of an effective section [1,2,3]. The detection of damage in early stages could be significant in the maintenance of structures. However, this early detection is difficult because, in many cases, metallic elements are embedded in concrete and the damage is hidden for long period of time. Nowadays, assessment, maintenance and restoration require a significant cost of time and money, with the replacement of the structure when the damage is extended necessary in some cases.
The most common assessment is the visual inspection. However, the difficulty of detecting hidden damages requires a lot of experience, and, in many cases, corrosion cannot be detected in early stages. Some problems in concrete associated with corrosion, such as delaminating, are usually analyzed by sounding with a hammer or with a chain. However, these two sonic methods can only approximately detect damaged areas and, in most cases, the extension affected by corrosion is higher than the extension affected by delamination. In addition, detection is only possible when damage is important [4]. Other techniques are minimally invasive because small drills are necessary to reach to metallic elements. The requirements for any technique are the detection of incipient cracks in tendons, prestressed wires of other metallic elements [5]. The most widely applied techniques to the detection of damage associated with corrosion can be classified in three groups:
- Drill cores in combination with chemical or petrography analysis, which only provides local information [4].
- Potential measurements, divided into techniques, depending on the methodology: open circuit potential (OCP), a method that determines corrosion by measuring changes in potential between metallic rebar [6,7], and surface potential, which is based on the detection of potential changes depending on the charge of materials [8,9]. However, in both methods, it is necessary to drill until the metallic rebar, quantitative measurements and handling are difficult, and many factors such as the resistance of concrete and carbonation affect the results [4].
- Resistivity measurements allow for the determination concrete resistivity, with a lower resistivity suggesting a greater risk of corrosion [10]. However, this method also needs contact with embedded rebar and is sensitive to rebar configurations.
Recently, the application of ground penetrating radar (GPR) to the detection of corrosion and damage as consequence of corrosion has demonstrated its effectiveness in the detection of corrosion of the shallowest rebar by measuring qualitative changes in the amplitude, even though variation in depth could affect highly the results [11]. This non-destructive testing (NDT) technique is highly efficient in the detection of metallic objects embedded in concrete or other non-conductive materials because of the high reflectivity of metals and the contrast between the electromagnetic properties of metals and concrete [12,13,14]. In the last decade, several tests using qualitative and comparative analyses have demonstrated clear changes in the radar signal associated with corroded elements [15,16,17,18,19,20]. Those qualitative results confirm this method as a useful tool in corrosion detection, as it presents several advantages over other methods: non-invasive testing, fast data acquisition, and the possibility of survey large areas. The application of GPR to corrosion detection is usually tested in laboratory [21]. However, recent field studies have demonstrated the possibility of obtaining a quantitative approach of damage degree by combining GPR with other NDT survey such as infrared thermography [22].
This paper presents some controlled laboratory tests focused on the qualitative and quantitative analysis of GPR signal changes as consequence of corrosion. The study was separated in two experimental laboratory assays. Both assays were not focused on reproducing real concrete structures but on obtaining accurate radar images with low noise levels to clearly detect rebar and corroded rebar. The first assay was based on the analysis of possible changes in the GPR signal by comparing data obtained from corroded and non-corroded targets. The second assay was focused on the analysis of the changes in the GPR images depending on the corrosion degree and its effects on the concrete. In this case, corrosion was forced on specimens with a metallic bar. Our results denoted qualitative changes in the amplitude in the first case, with an approach to a quantitative analysis of the amplitude decay. These changes were more evident in Case 2, revealing a trend that could be used in the more precise assessment of concrete structures.
2. Materials and Methods
2.1. GPR Fundamentals in the Detection of Corrosion
A common GPR application in structure assessment is the detection of rebar in concrete. GPR is usually applied in order to determine the location of bars, to obtain a 3D image of bar distribution (e.g., [19,23,24,25]), or to determine rebar diameter in concrete structures [12,26,27]. This form of detection is also used to determine damaged zones affected by water [27,28] and cracks [29], as well as in the diagnosis of fire-damaged reinforced concrete structures [30].
The importance of corrosion damage in reinforced concrete structures has led to applications in this field, showing the potential in qualitative analysis (e.g., [17,20,31,32]). Several studies have shown a significant decrease in the amplitude of the GPR reflected wave in parts of the radar images [17]. This attenuation phenomenon could be associated with the corrosion of the reinforcement, facilitating the detection of damaged zones—although the degree of damage cannot be determined. However, other factors could affect GRP wave amplitude, obscuring the results and leading to complex radar data interpretations. Attenuation also depends on: (i) the depth of the targets; (ii) the existence of other small targets or heterogeneities in the concrete or in the surface of the concrete over the bar; and (iii) the geometry of the rebar. These elements are sources of uncertainty, and they only allow for the definition of approximated results. However, some corrections in amplitude could improve final interpretations.
2.2. Tests Design and Description of the Specimens
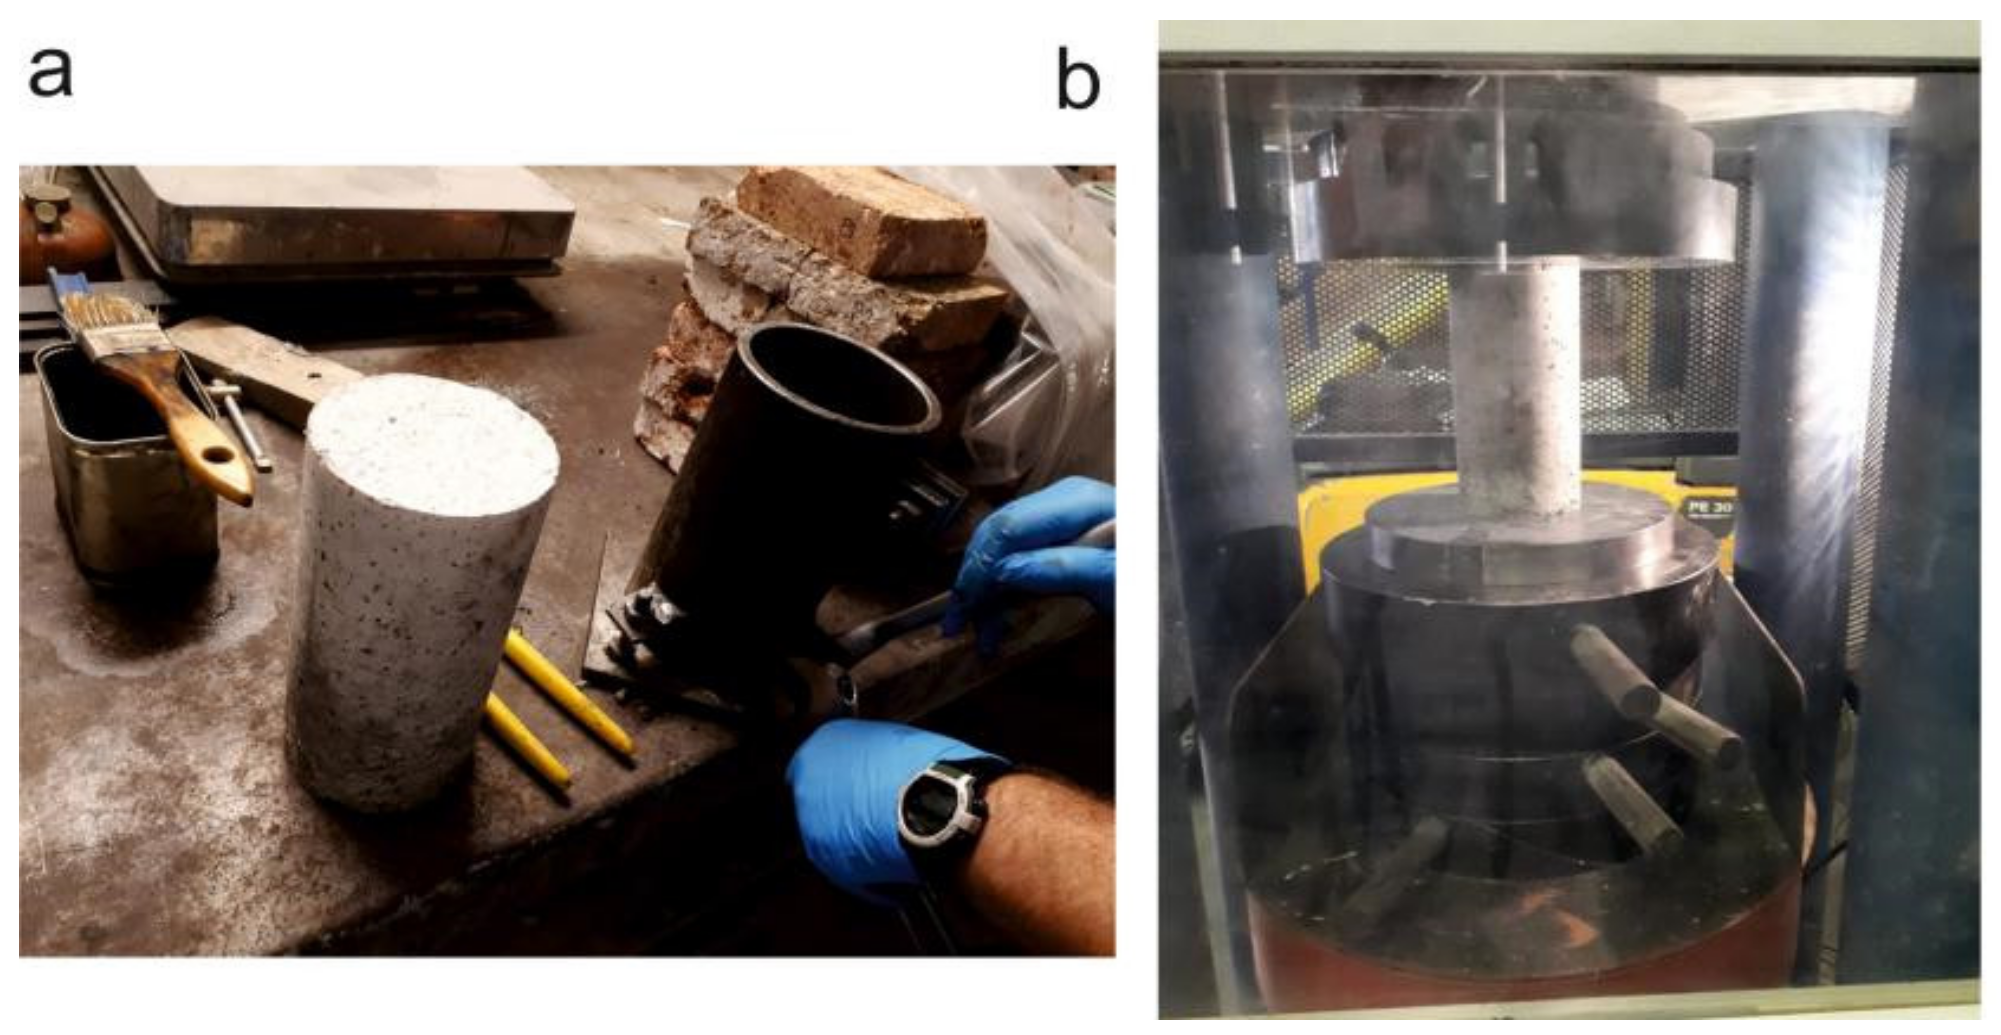
To perform the analyses, two different tests were designed that took the corrosion level of the rebars used in concrete specimens into consideration. These specimens were prepared with C30/35 concrete (fck = 30 MPa) and S460 steel rebar (fyk = 460 MPa) [33]. This concrete and rebar combination is one of the most used in building constructions. The compressive strength of the specimens was tested in the laboratory using a compressive test (Figure 1).
Test A: In this test group, two specimens were prepared. In the first specimen (S-1A), a 12 mm rebar exempt of any corrosion was embedded into fresh concrete. The second sample used a rebar with an advanced level of corrosion (S-2A). The specimen’s dimensions were 30 × 8 × 8 cm. Later, there were no additional corrosion processes added, and the samples were surveyed with the GPR. The characteristics of those specimens are summarized in Table 1.
Test B: In this second group of tests, the used rebar (diameter of 12 mm) was initially exempt of any corrosion. Once embedded in the fresh concrete, the initially sane rebar suffered an accelerated corrosion process under artificially ambient conditions. In this case, the specimen dimensions were 30 × 20 × 7 cm.
The corrosion process performed on the concrete samples lasted one year and was performed by using a curing chamber where a specific ambient was generated that favored the acceleration of the time of the corrosion process. The technical basis of this process was to generate a moist and warm atmosphere where the monitored variables of the process were the temperature and the humidity. In this case, the Test B group of samples was subjected to a temperature of 20 °C and to a humidity of 95%. Table 1 shows the corrosion ageing process applied in the curing chamber to four samples included in Test B. As a result, four samples, including each of the different stages of corrosion, were obtained. Table 1 summarizes the characteristics of the specimens and shows the four samples of the corroded rebar at different stages. Additionally, a ring—an annular area of shadowed concrete embracing the rebar—can be appreciated. This perimeter-shadowed area indicates that the concrete was affected by the corrosion in the rebar.
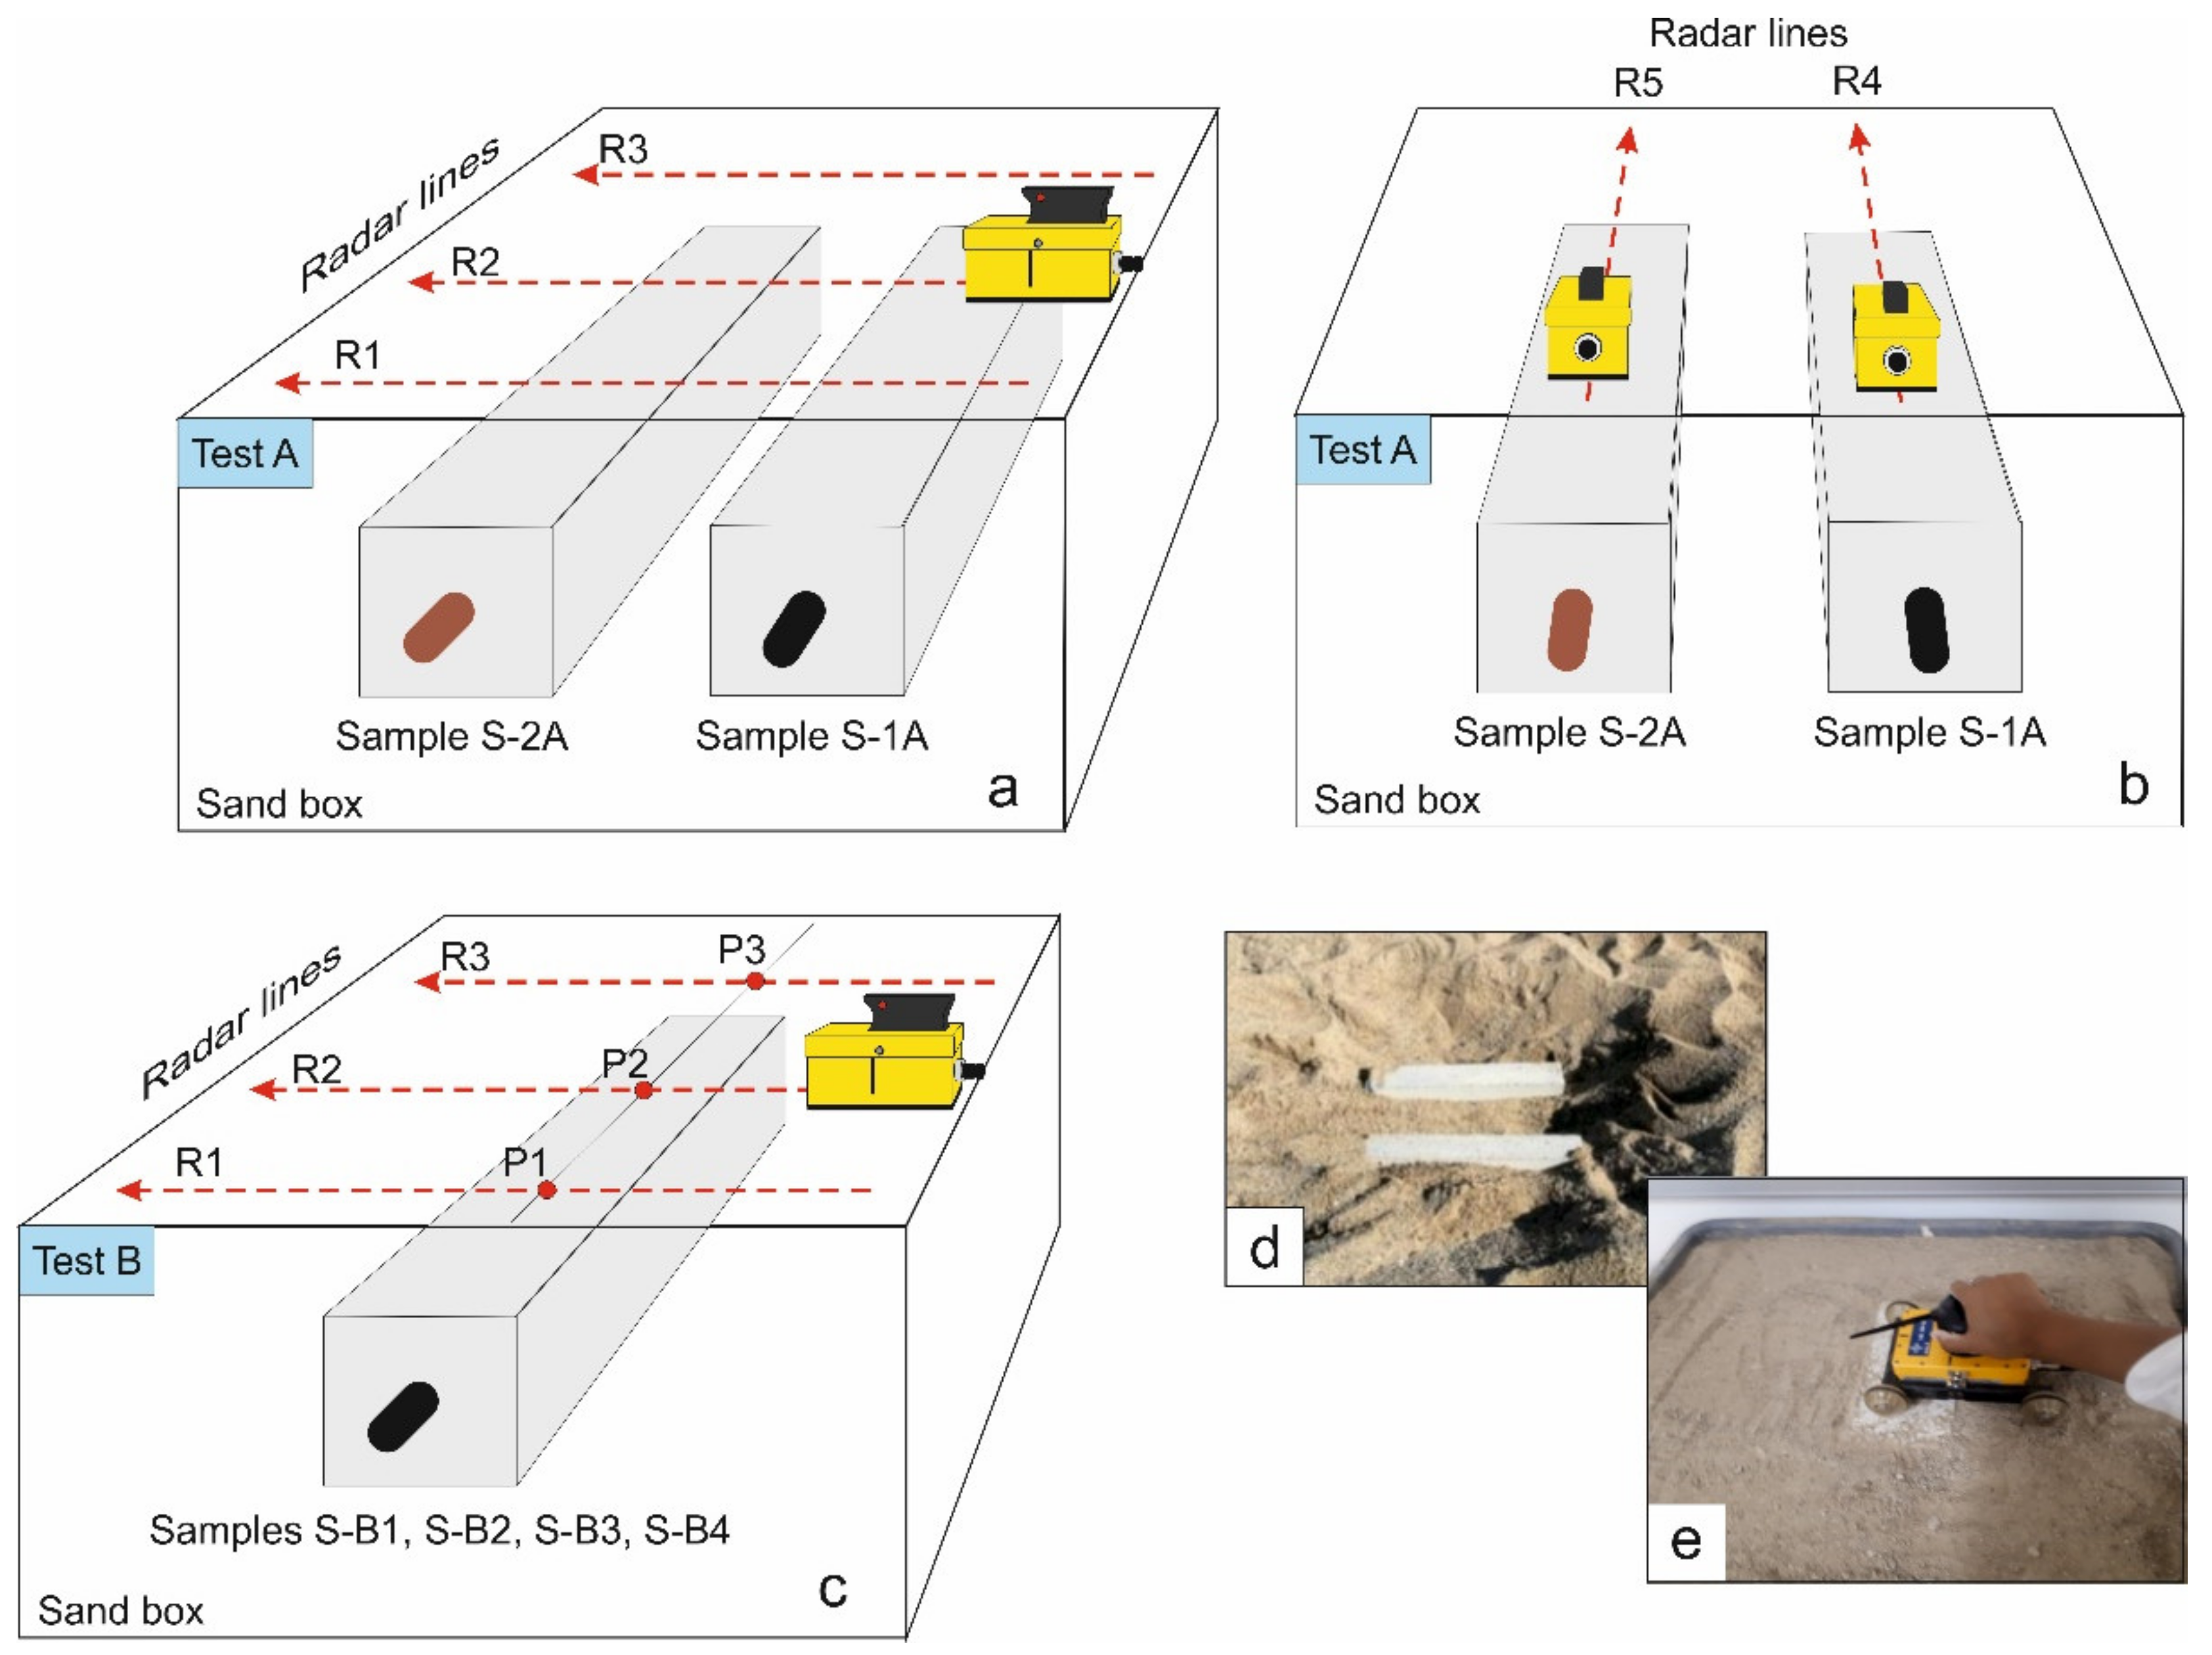
Additionally, in both tests, the previously prepared samples were buried in dry sand in Test A and in wet sand in Test B (Figure 2). The objective of this was to obtain clear radar images because of the flat surface for the radar lines, the weaker boundary effects, and the separation between the samples surface and the antenna. The samples were buried at a depth of 10 cm in Test A and at a depth of 4 cm in Test B. The wave velocity in the sand was experimentally determined in both tests, with the average value for Test A being about 13 cm/ns, corresponding to a dielectric constant of 5,3 and an average velocity value of about 8 cm/ns for Test B,, corresponding to a dielectric constant of 14.
2.3. Data Acquisition
With the purpose of evaluating the capability of GPR in the qualitative and quantitative evaluation of the corrosion stage of rebar in reinforced concrete, an experiment consisting of acquiring GPR high frequency traces on individual specimens of test Groups A and B was set up. The measurement instrument was a 1.6 GHz nominal center frequency antenna (Mala Geosciences manufacturer). The samples were embedded in a sand container (Figure 2). With this purpose, a polyvinyl chloride (PVC) box whose dimensions (100 × 100 × 40 cm) were big enough to avoid edge effects on the boundaries (Figure 2) was used. GPR data were acquired along radar lines perpendicular and along the axis of the specimens.
In Test A (Figure 2a,b), the acquired sets of radar lines were obtained by moving the antenna along the axis of the specimen (longitudinal radar lines R4A and R5A) and in the orthogonal direction (transversal radar lines R1A, R2A and R3A). In Test B (Figure 2c) the groups of radar lines were acquired by moving the antenna only in the orthogonal direction (transversal radar lines R1B, R2B and R3B).
The radar data acquisition parameters are summarized in Table 2. Data were analyzed without any processing flow to avoid further effects on the A-scans amplitudes.
3. Results
3.1. Test A
3.1.1. Qualitative Analysis
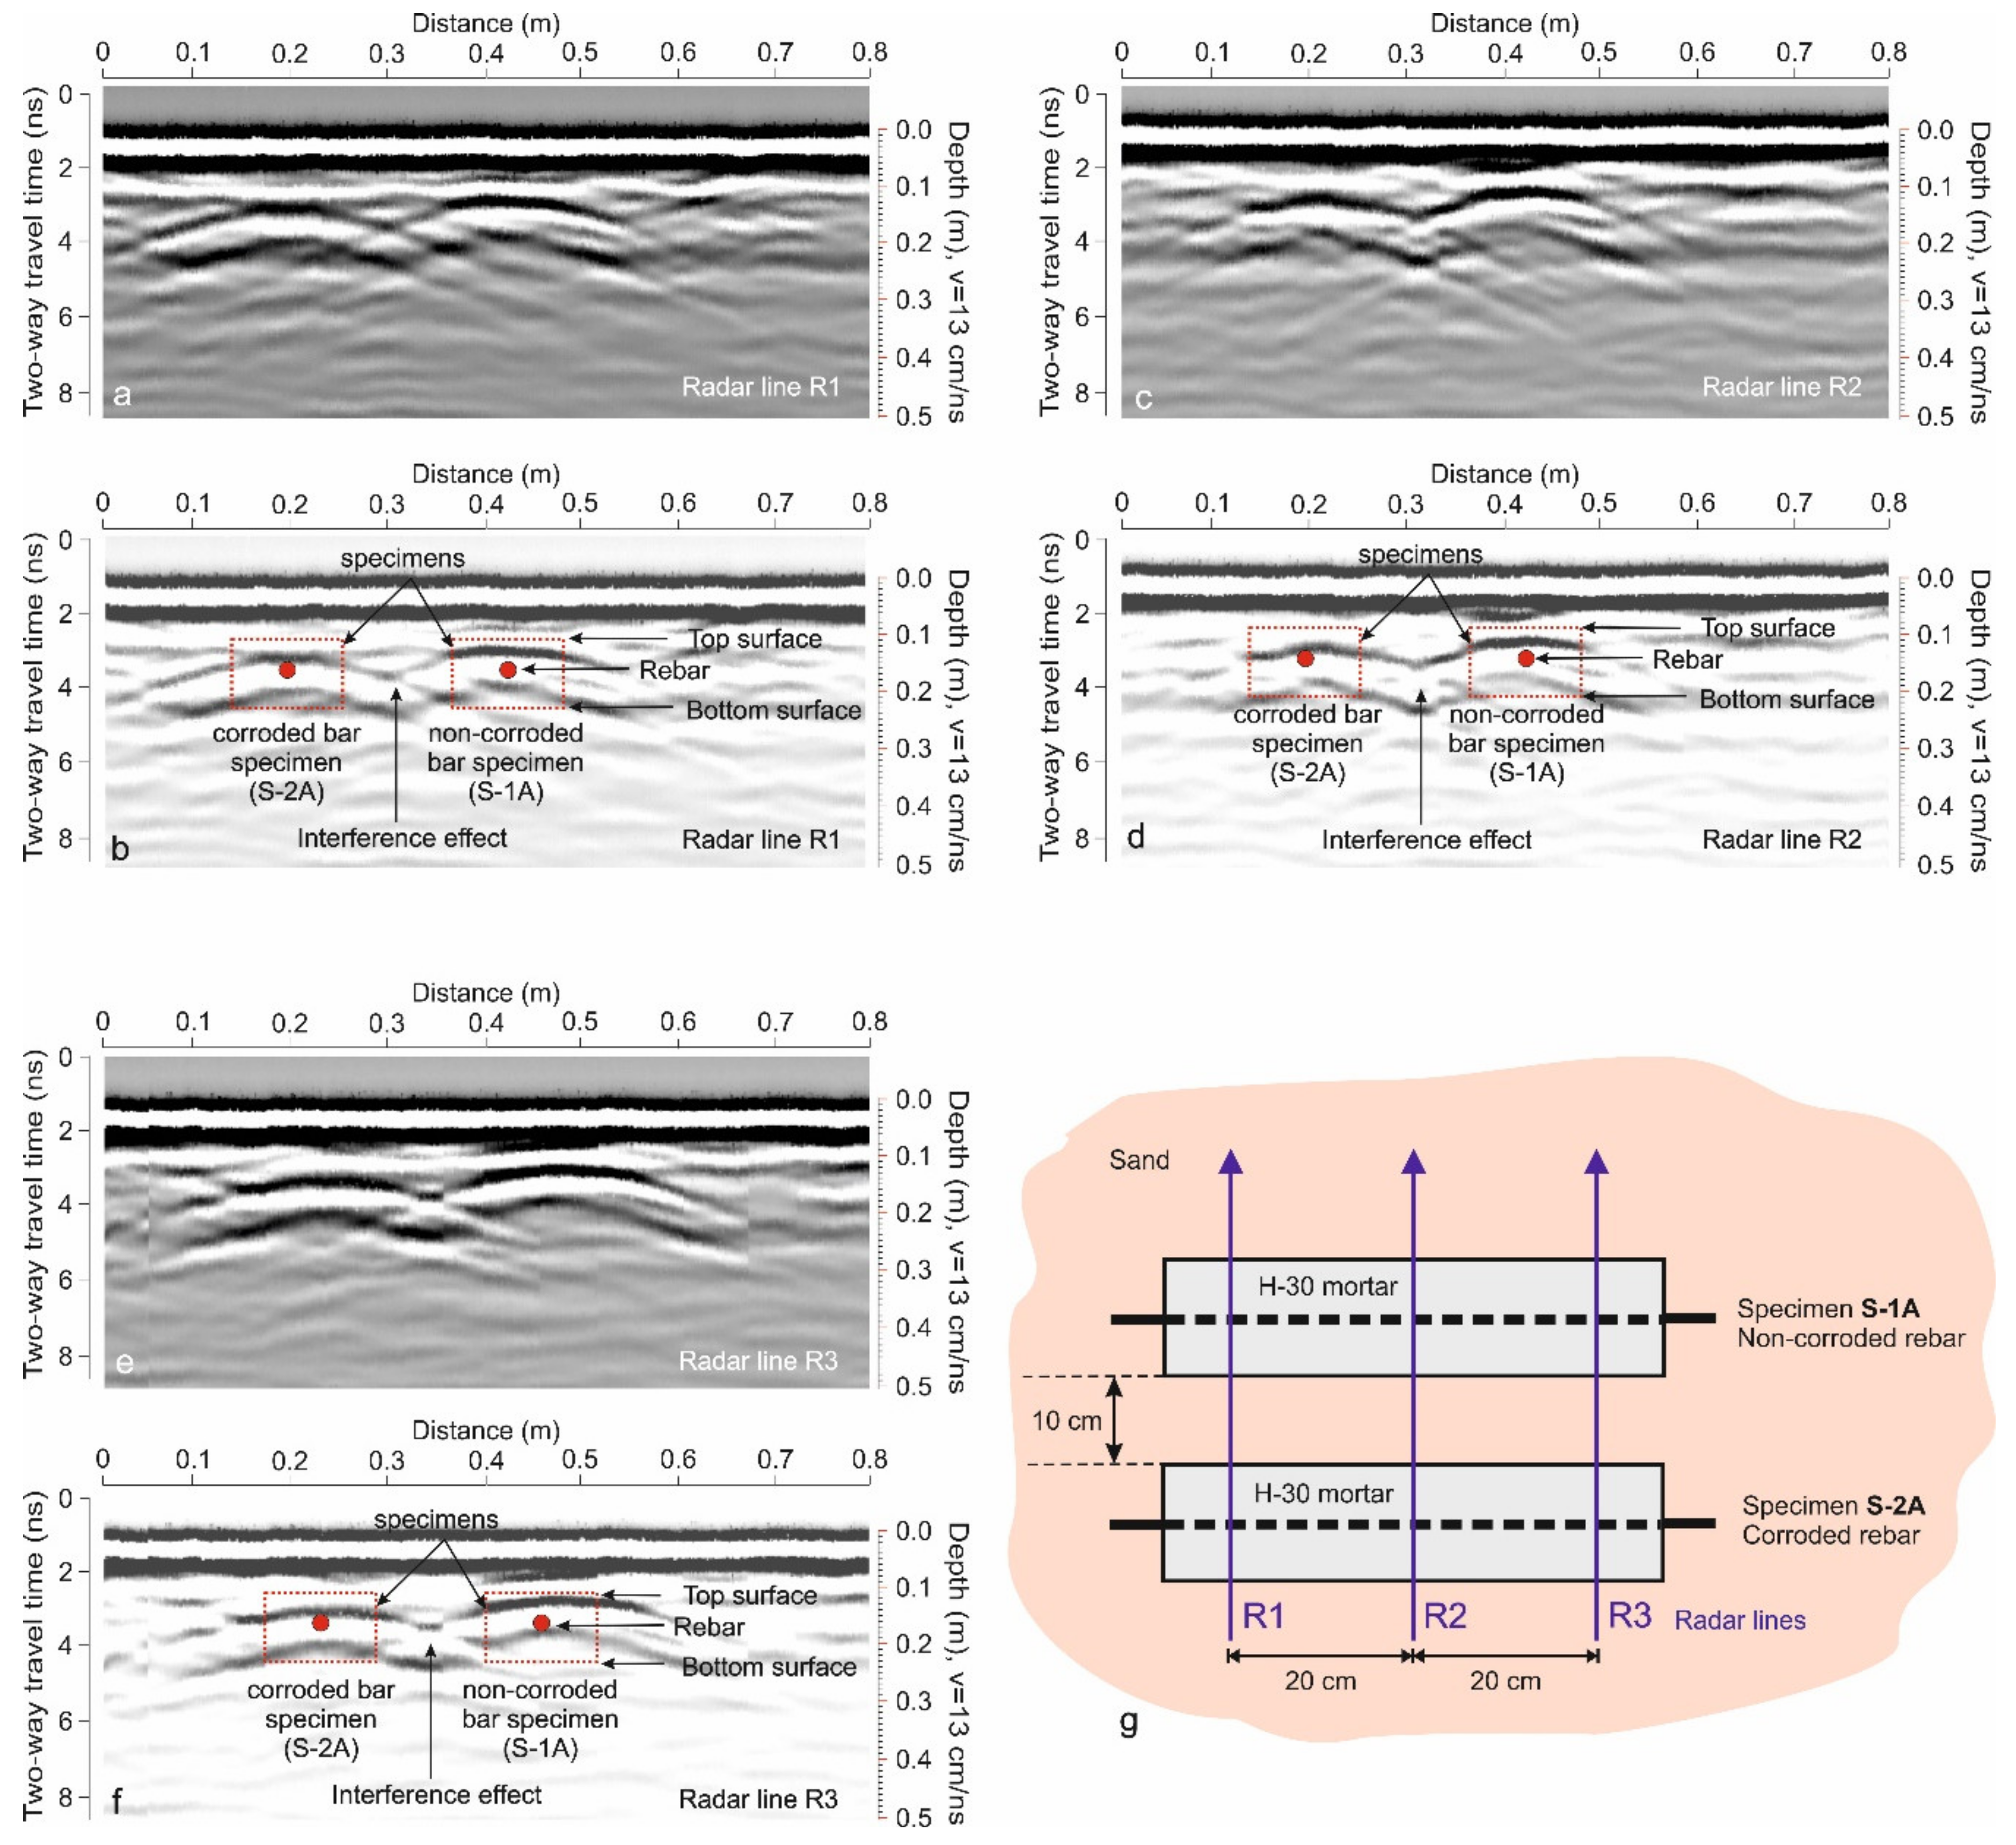
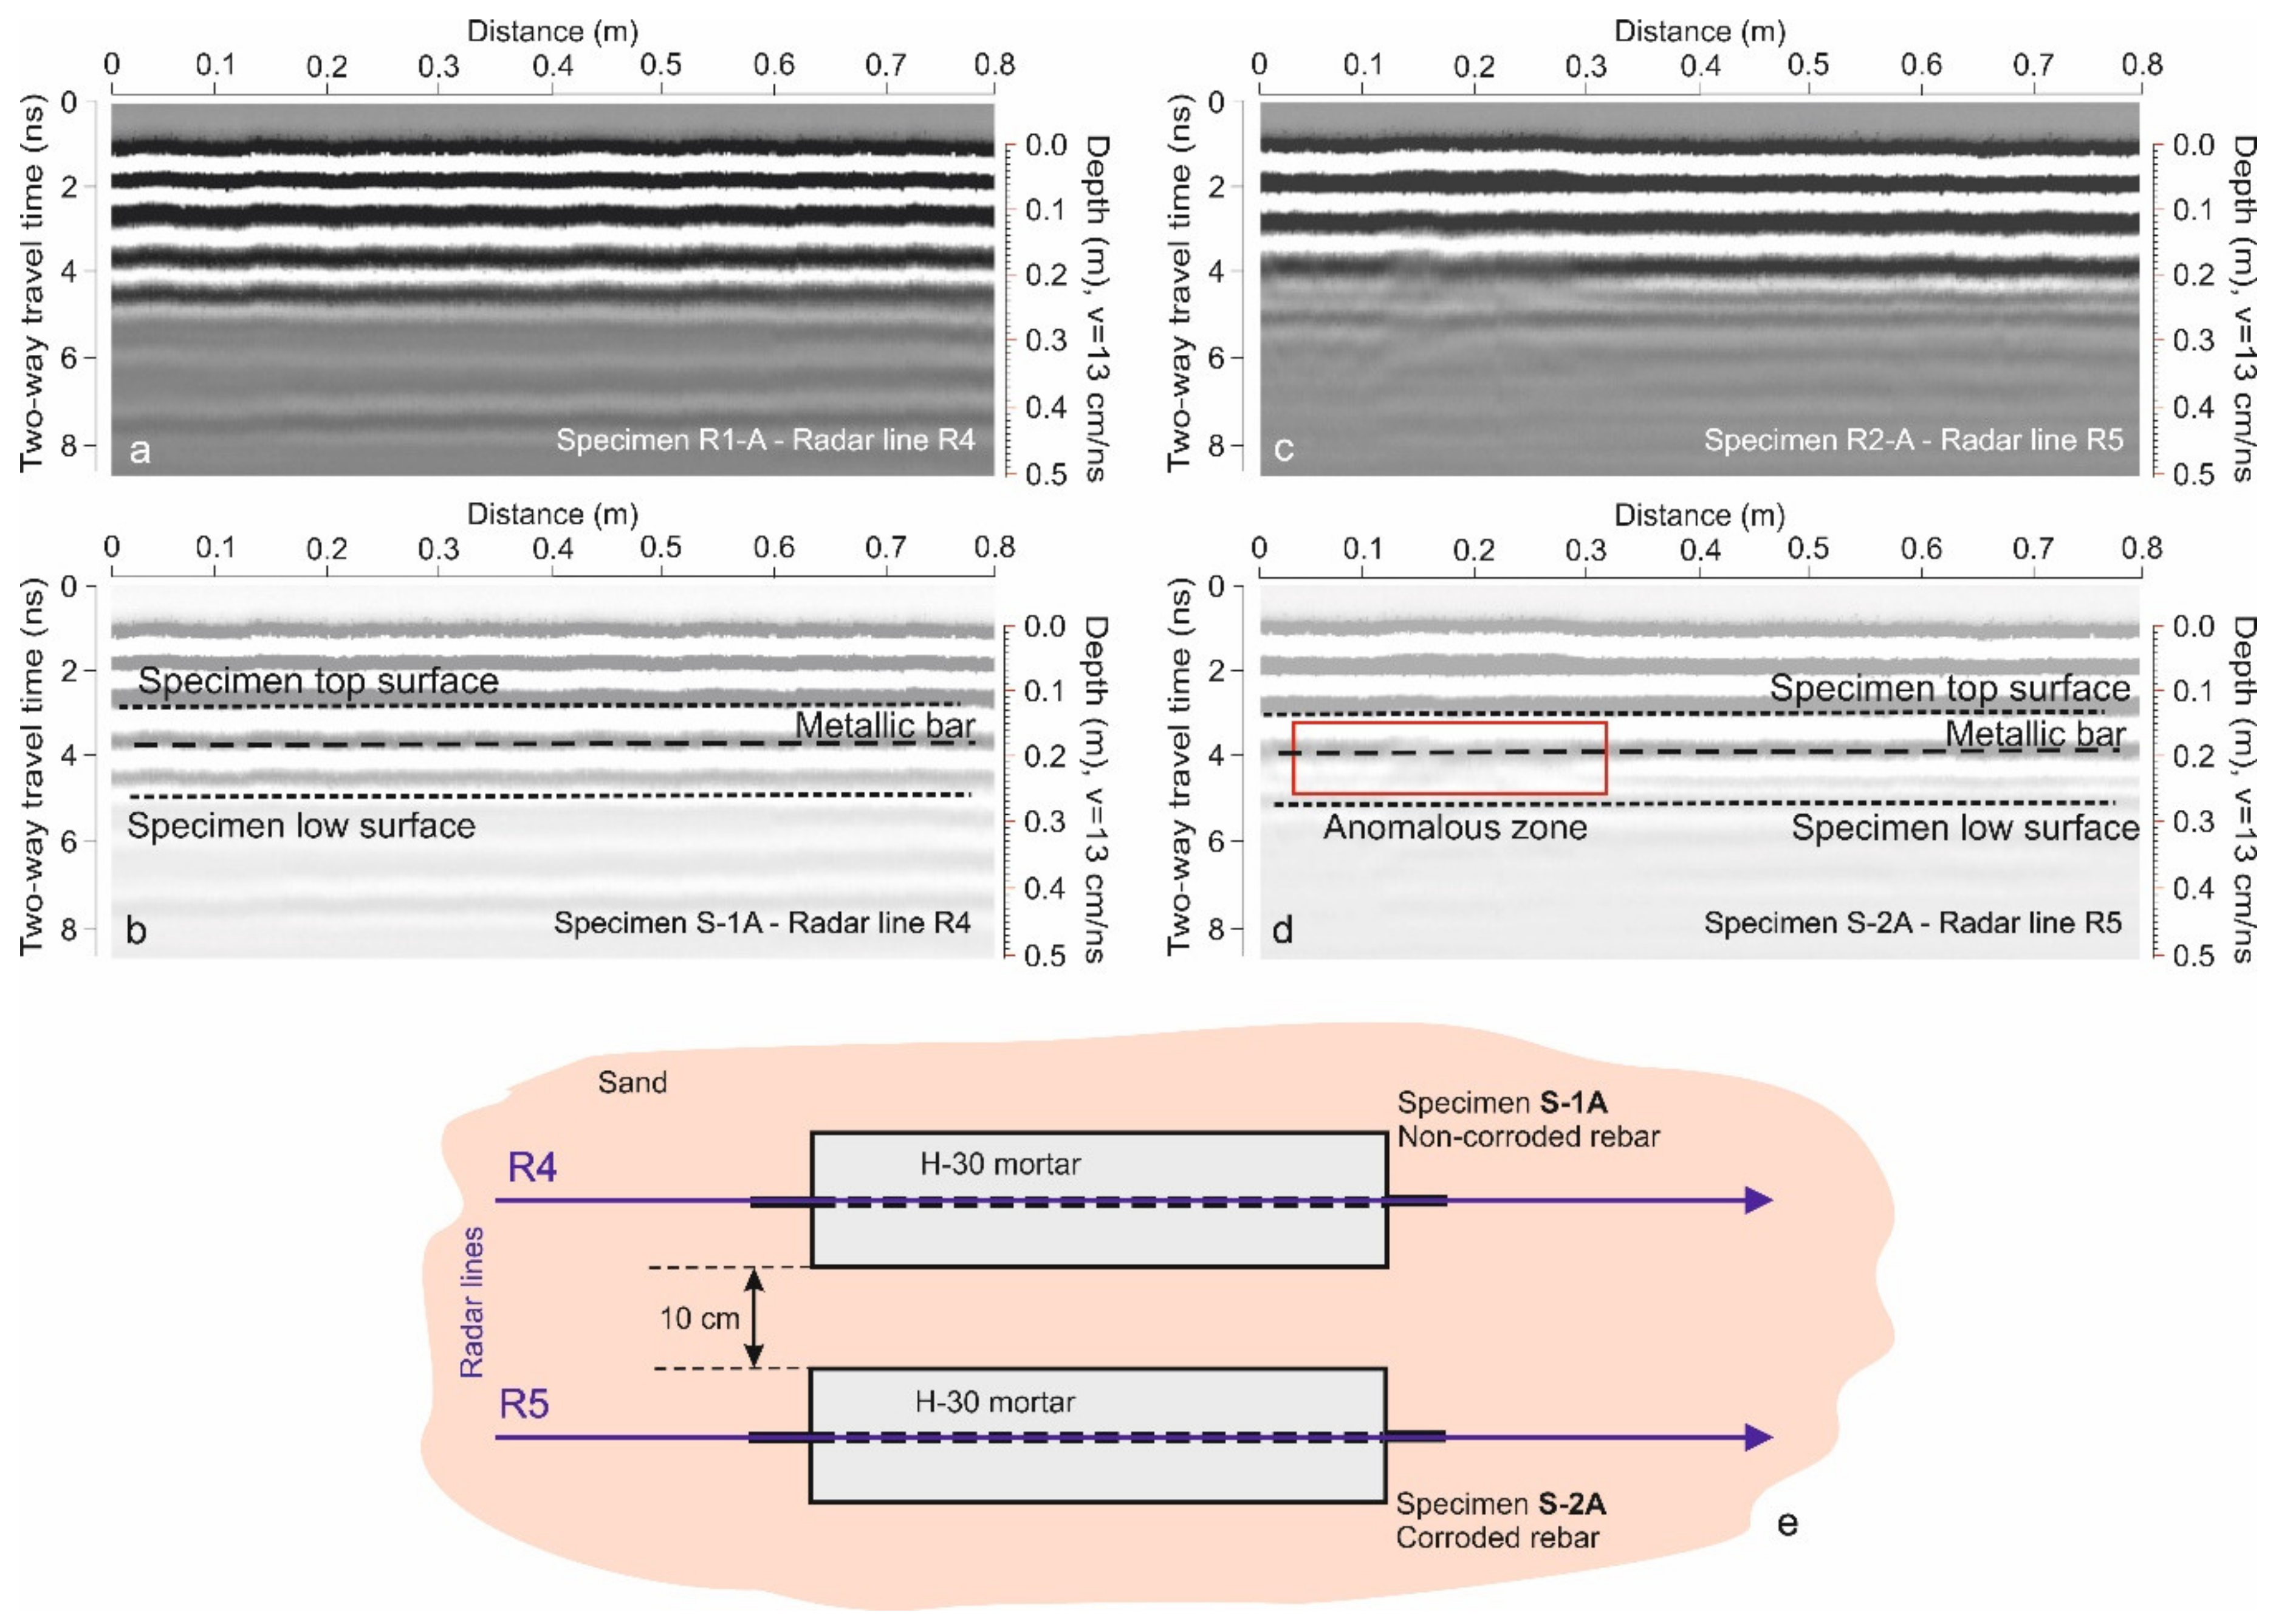
The analysis of the B-scans obtained in the radar lines crossing both specimens (S-1A and S-2A) allowed for the clear observation of both pieces of metallic rebar (see Figure 3). In all the images, the upper and bottom surfaces of the concrete specimens were detected. A small anomaly between both targets was caused by the coupled effects at the edges of both specimens. The amplitude of the reflected wave on the surfaces was smaller than the amplitude of the reflected wave on the metallic bar due to the contrast between amplitudes.
Radar images highlighted small differences between the bars, with the image produced by the reflection on the corroded specimen being more diffuse. In addition, the two-way travel time of the anomaly associated with the reflected wave on the corroded bar was slightly higher. It was also noticeable that the effect changed at the different radar lines, most likely due to the changes in the damage along the rebar. The most blurred zone in the B-scans obtained in the radar lines along the axis of the specimen, corresponded with a specific part of one specimen (Figure 4). In those images, a nebulous section was recorded over the corroded specimen, probably because of the scattering in the most corroded part of the metallic rebar. The result could indicate changes in the corrosion degree along the same rebar. In the case of a non-corroded rebar, a homogeneous longitudinal reflection was recorded.
3.1.2. Analysis of the Decay of the Amplitude
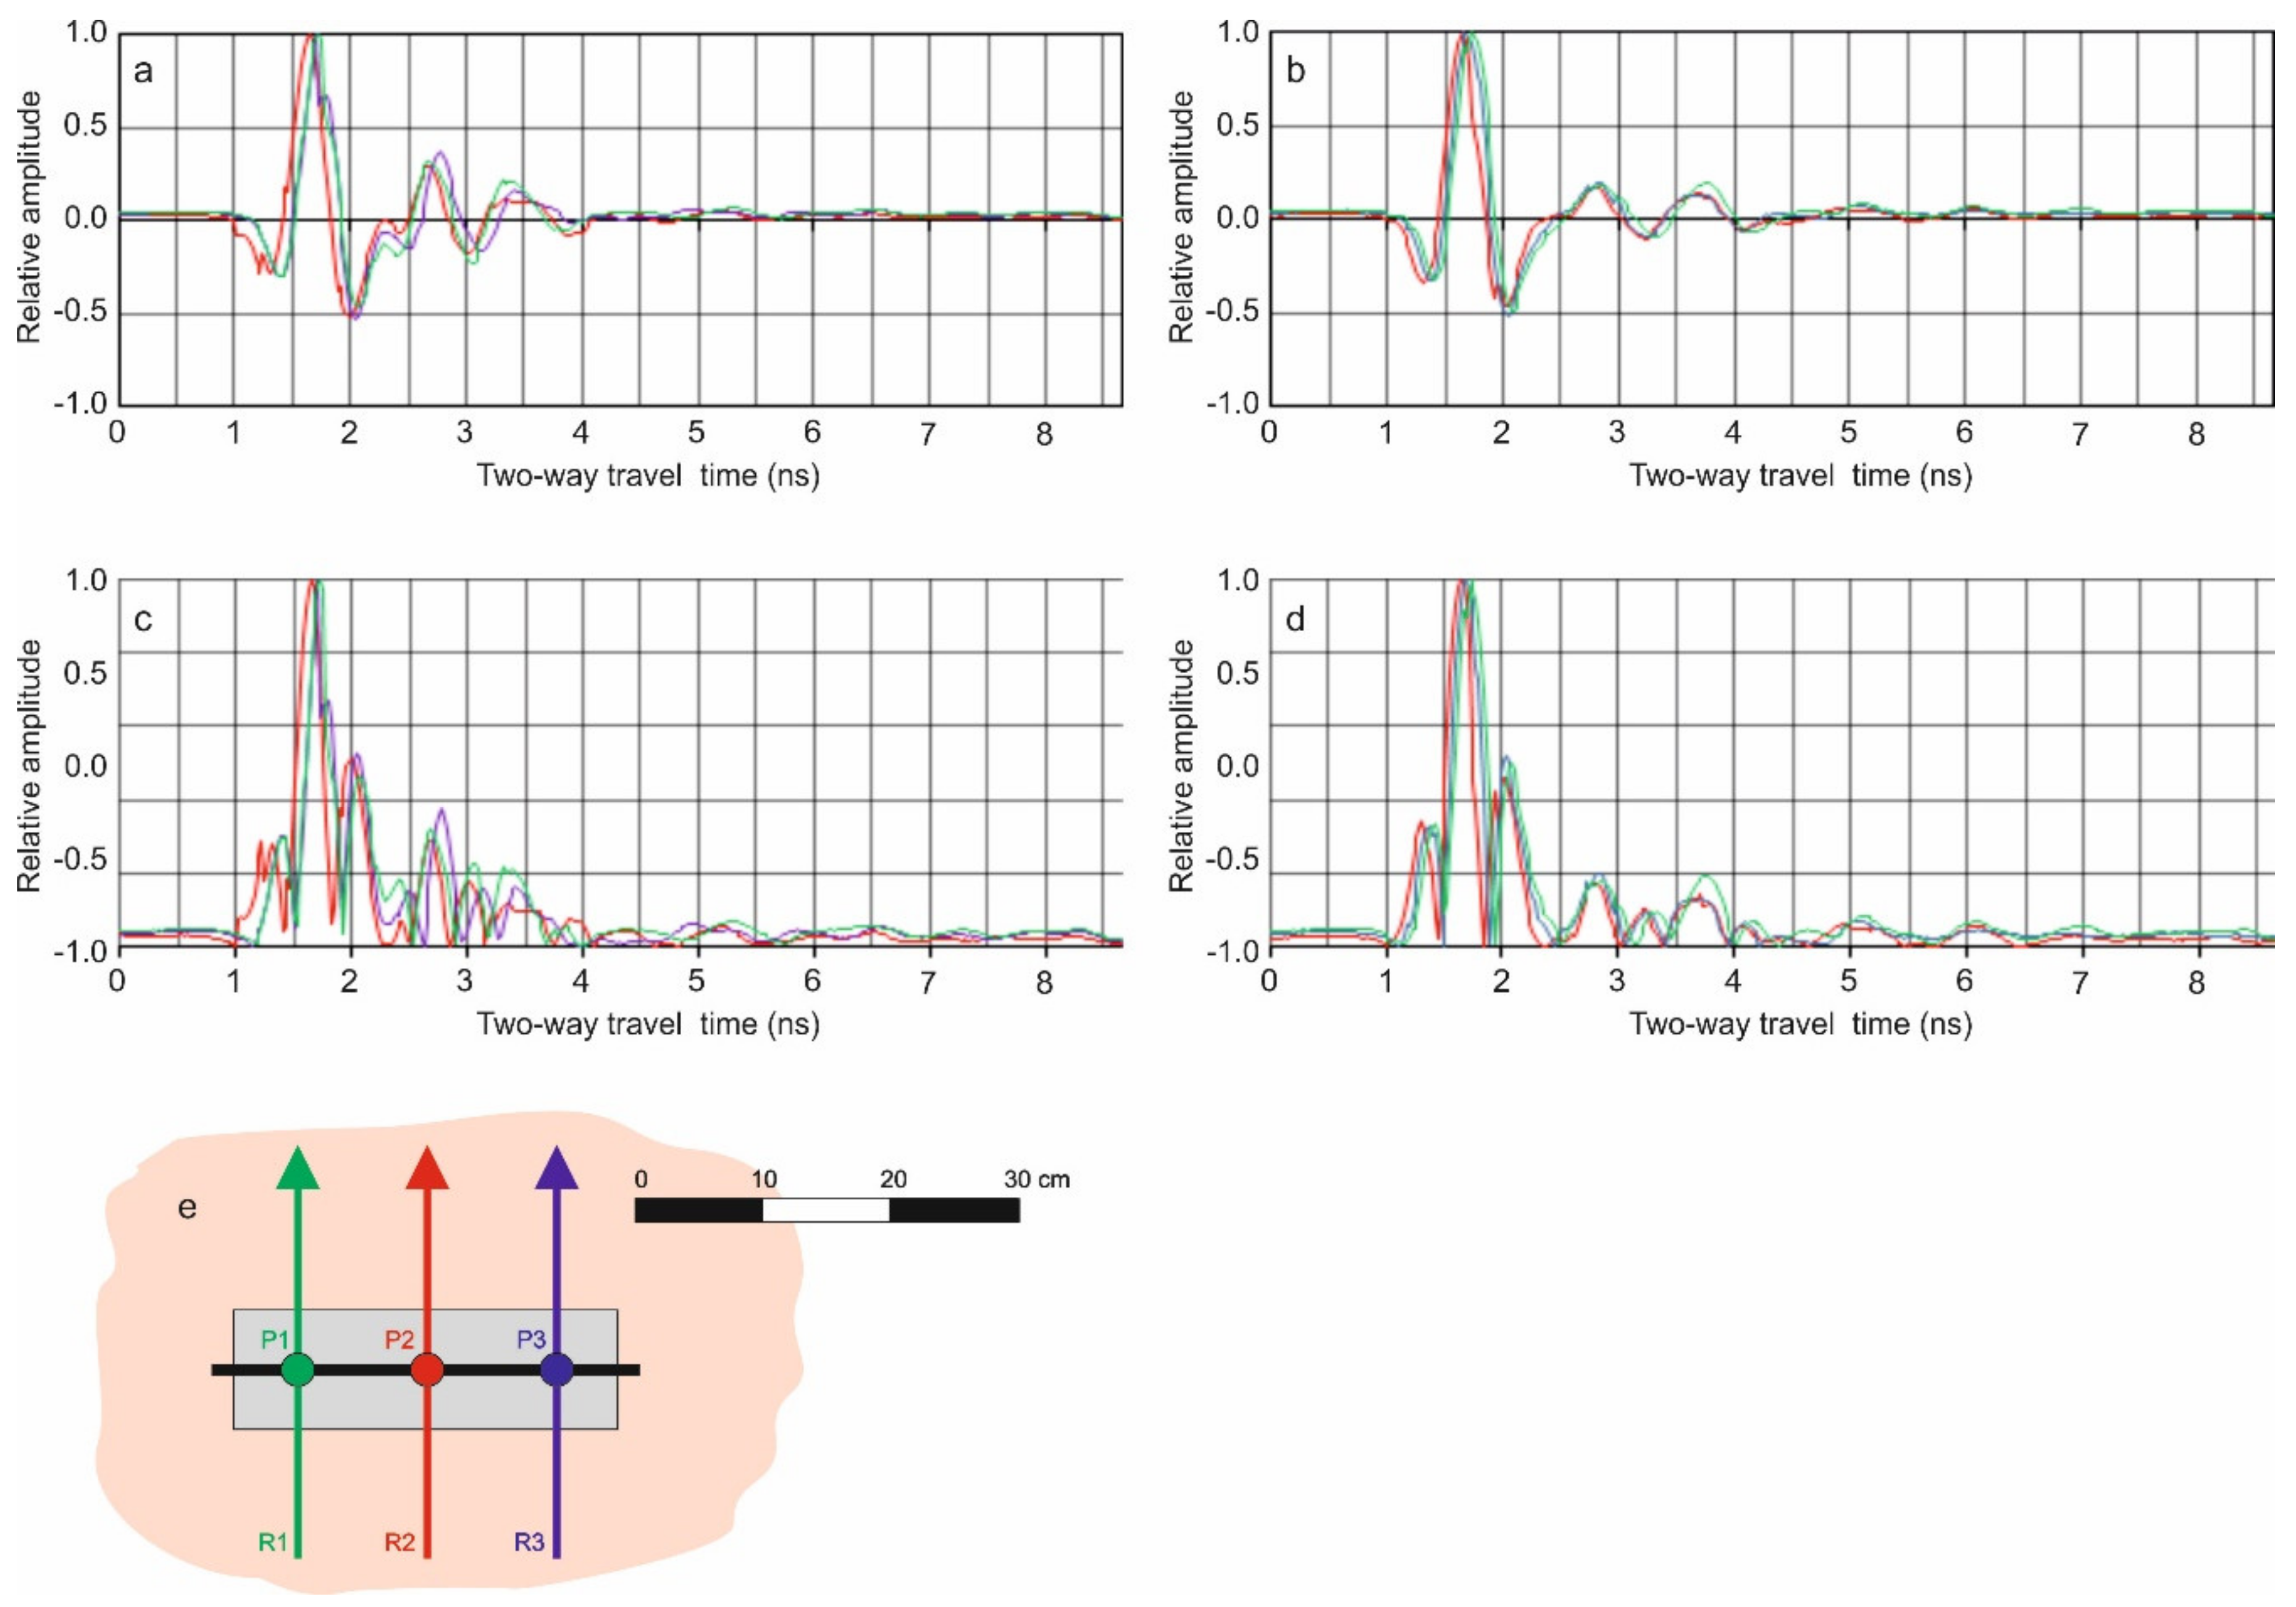
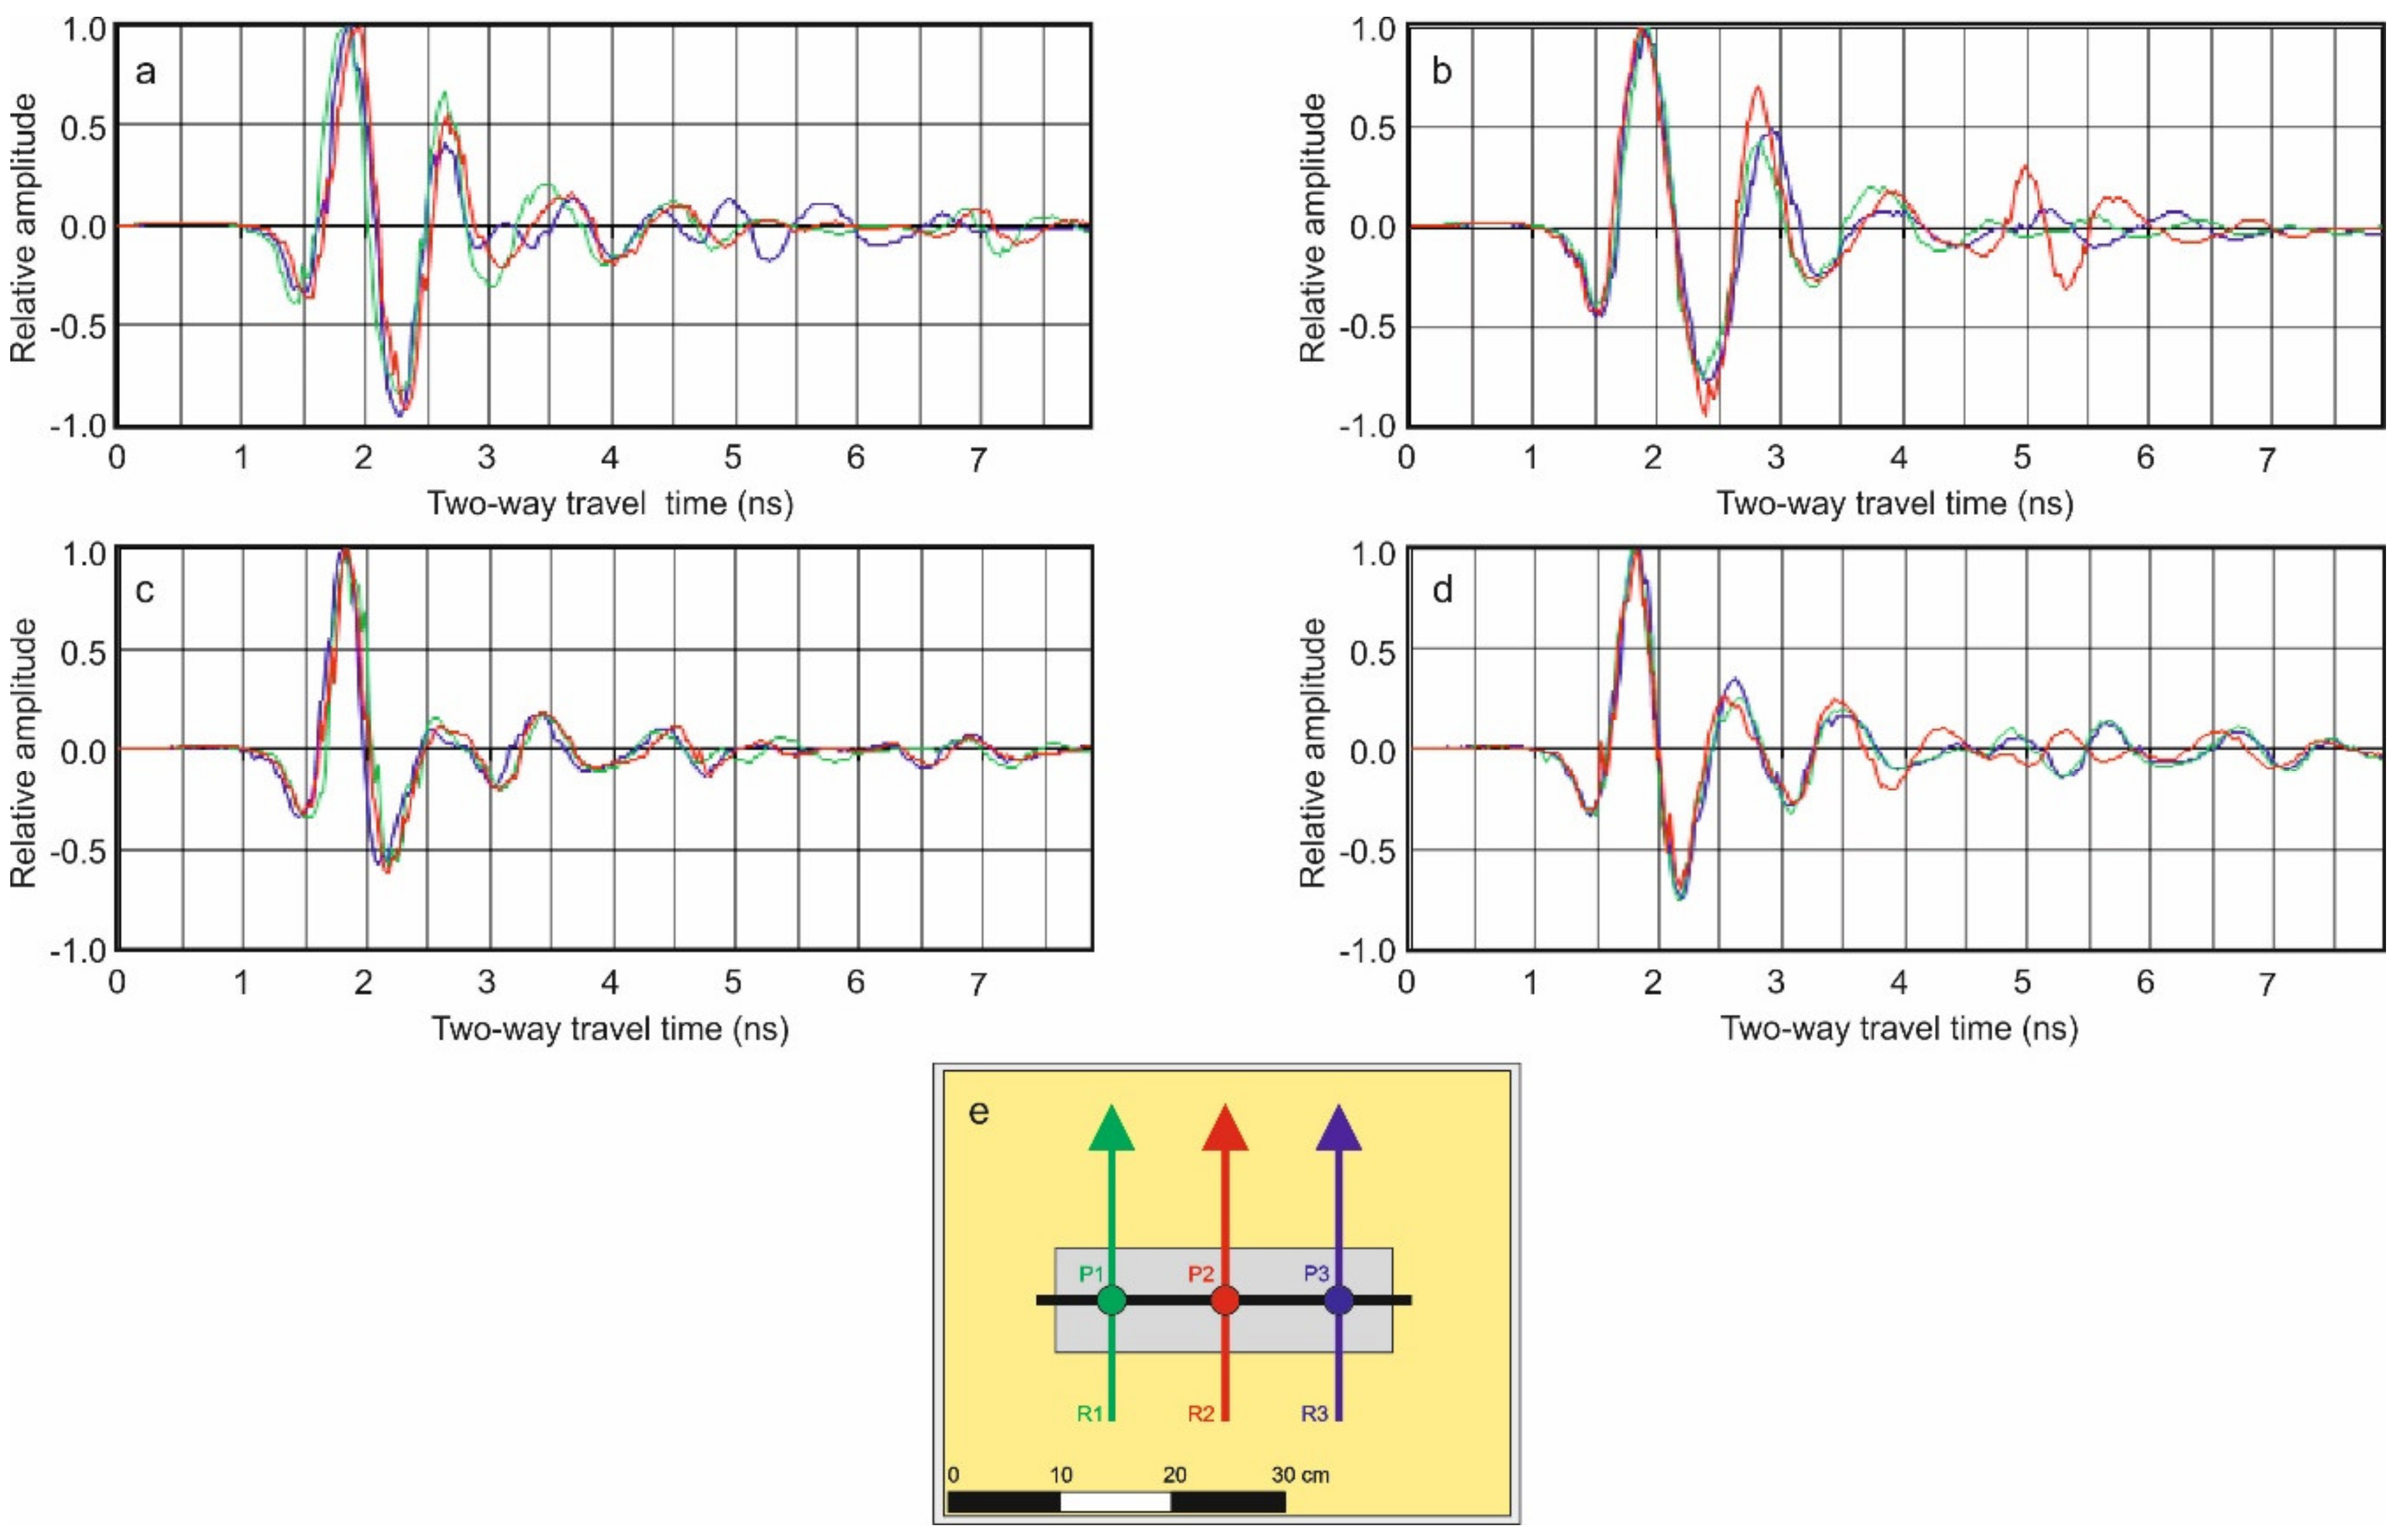
A detailed amplitude analysis requires the evaluation of reflected waves of the metallic bar at each A-scan. Figure 5 shows some A-scans obtained at each one of the measurements, as well as the absolute value of the amplitude. The decay on the reflected wave amplitude, A, was defined depending on the geometrical spreading and the attenuation as a consequence of the absorption and scattering:
where r is the travelled distance; A0 is the initial amplitude and a constant coefficient; β is a coefficient that describes the geometrical spreading; and α is the absorption coefficient.
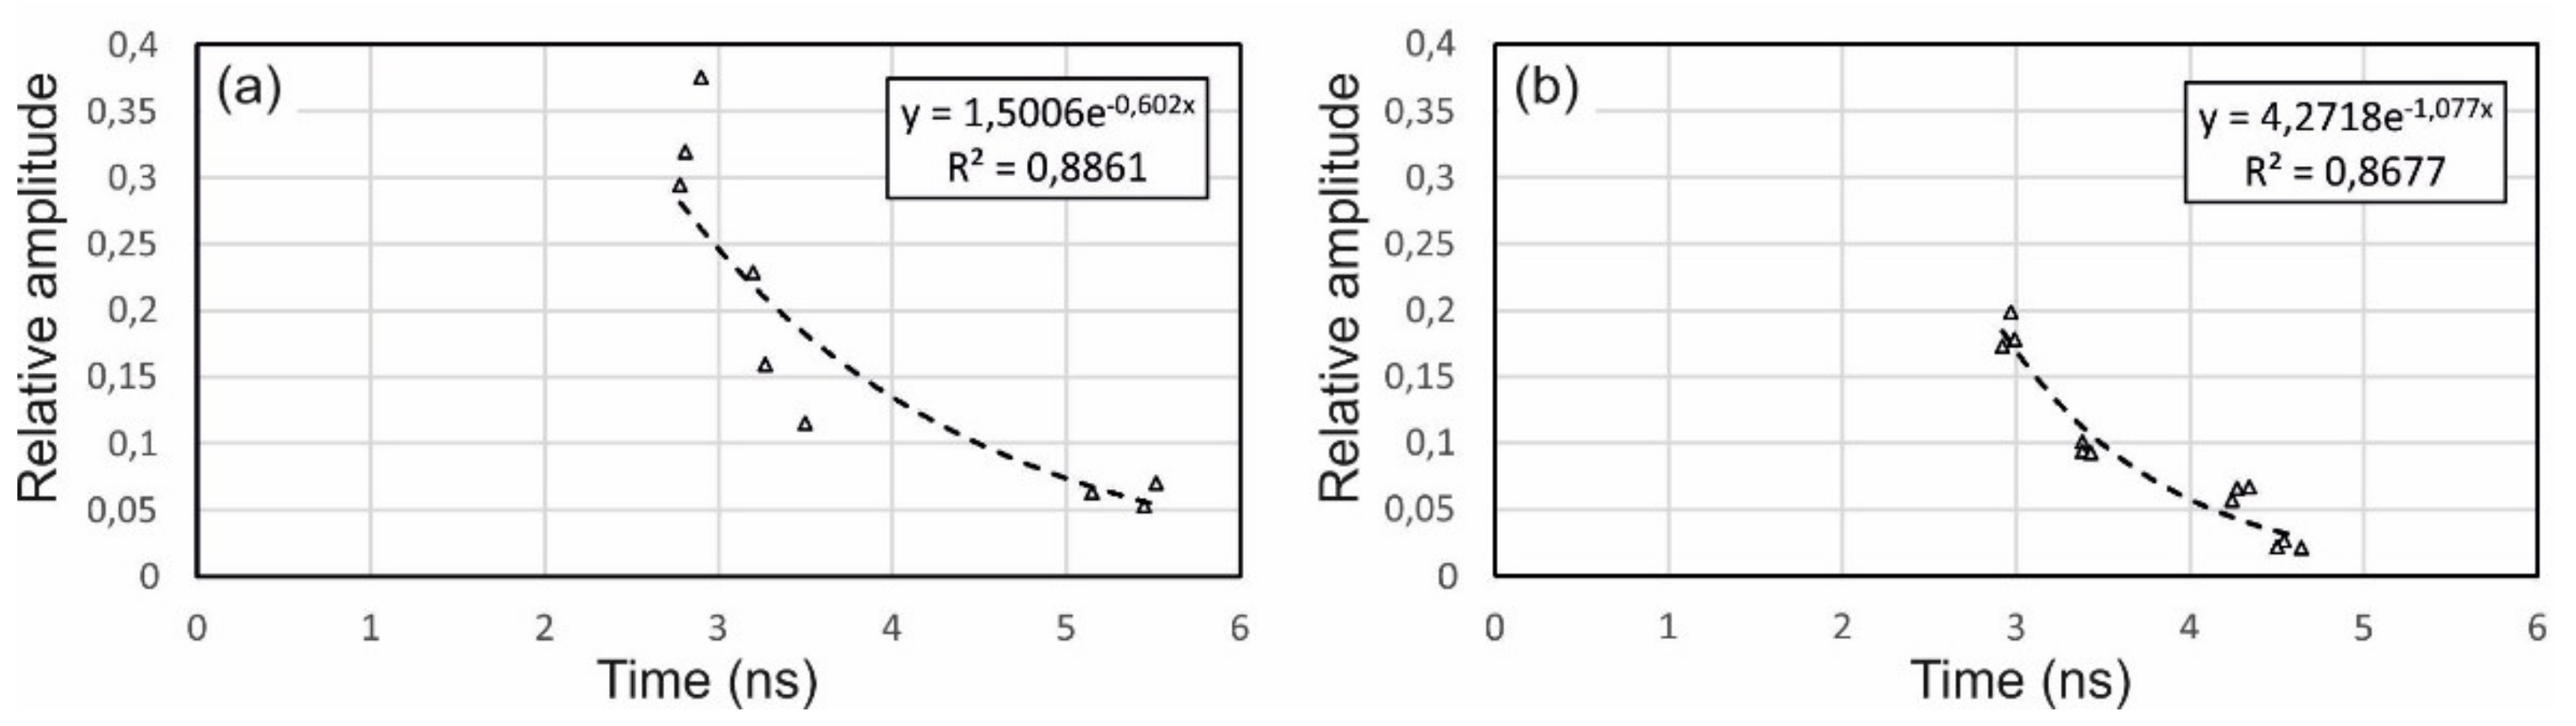
Assuming that the travelled distance was small and the velocity of the wave was approximately the same in the two specimens, the only term used in the decay of the amplitude analysis was the part associated with absorption and scattering. Therefore, attenuation was found by considering the amplitude of the peaks of the wave reflected on the metallic bar in both specimens, measured in the A-scan that were collected above the rebar. The values of the amplitude were plotted as function of TWT. That representation defined the amplitude as function of the time (Figure 6), and the attenuation was represented by a single term in which all the terms of the decay were included:
Being α′ a coefficient obtained from α by using the wave velocity and converting the TWT into depths.
When comparing both cases, it can be seen that the decay of the amplitude was higher in the case of the corroded rebar (Specimen S-2A). Table 3 presents the results of both approaches, denoting an important change in the attenuation in the case of the specimen with the corroded rebar.
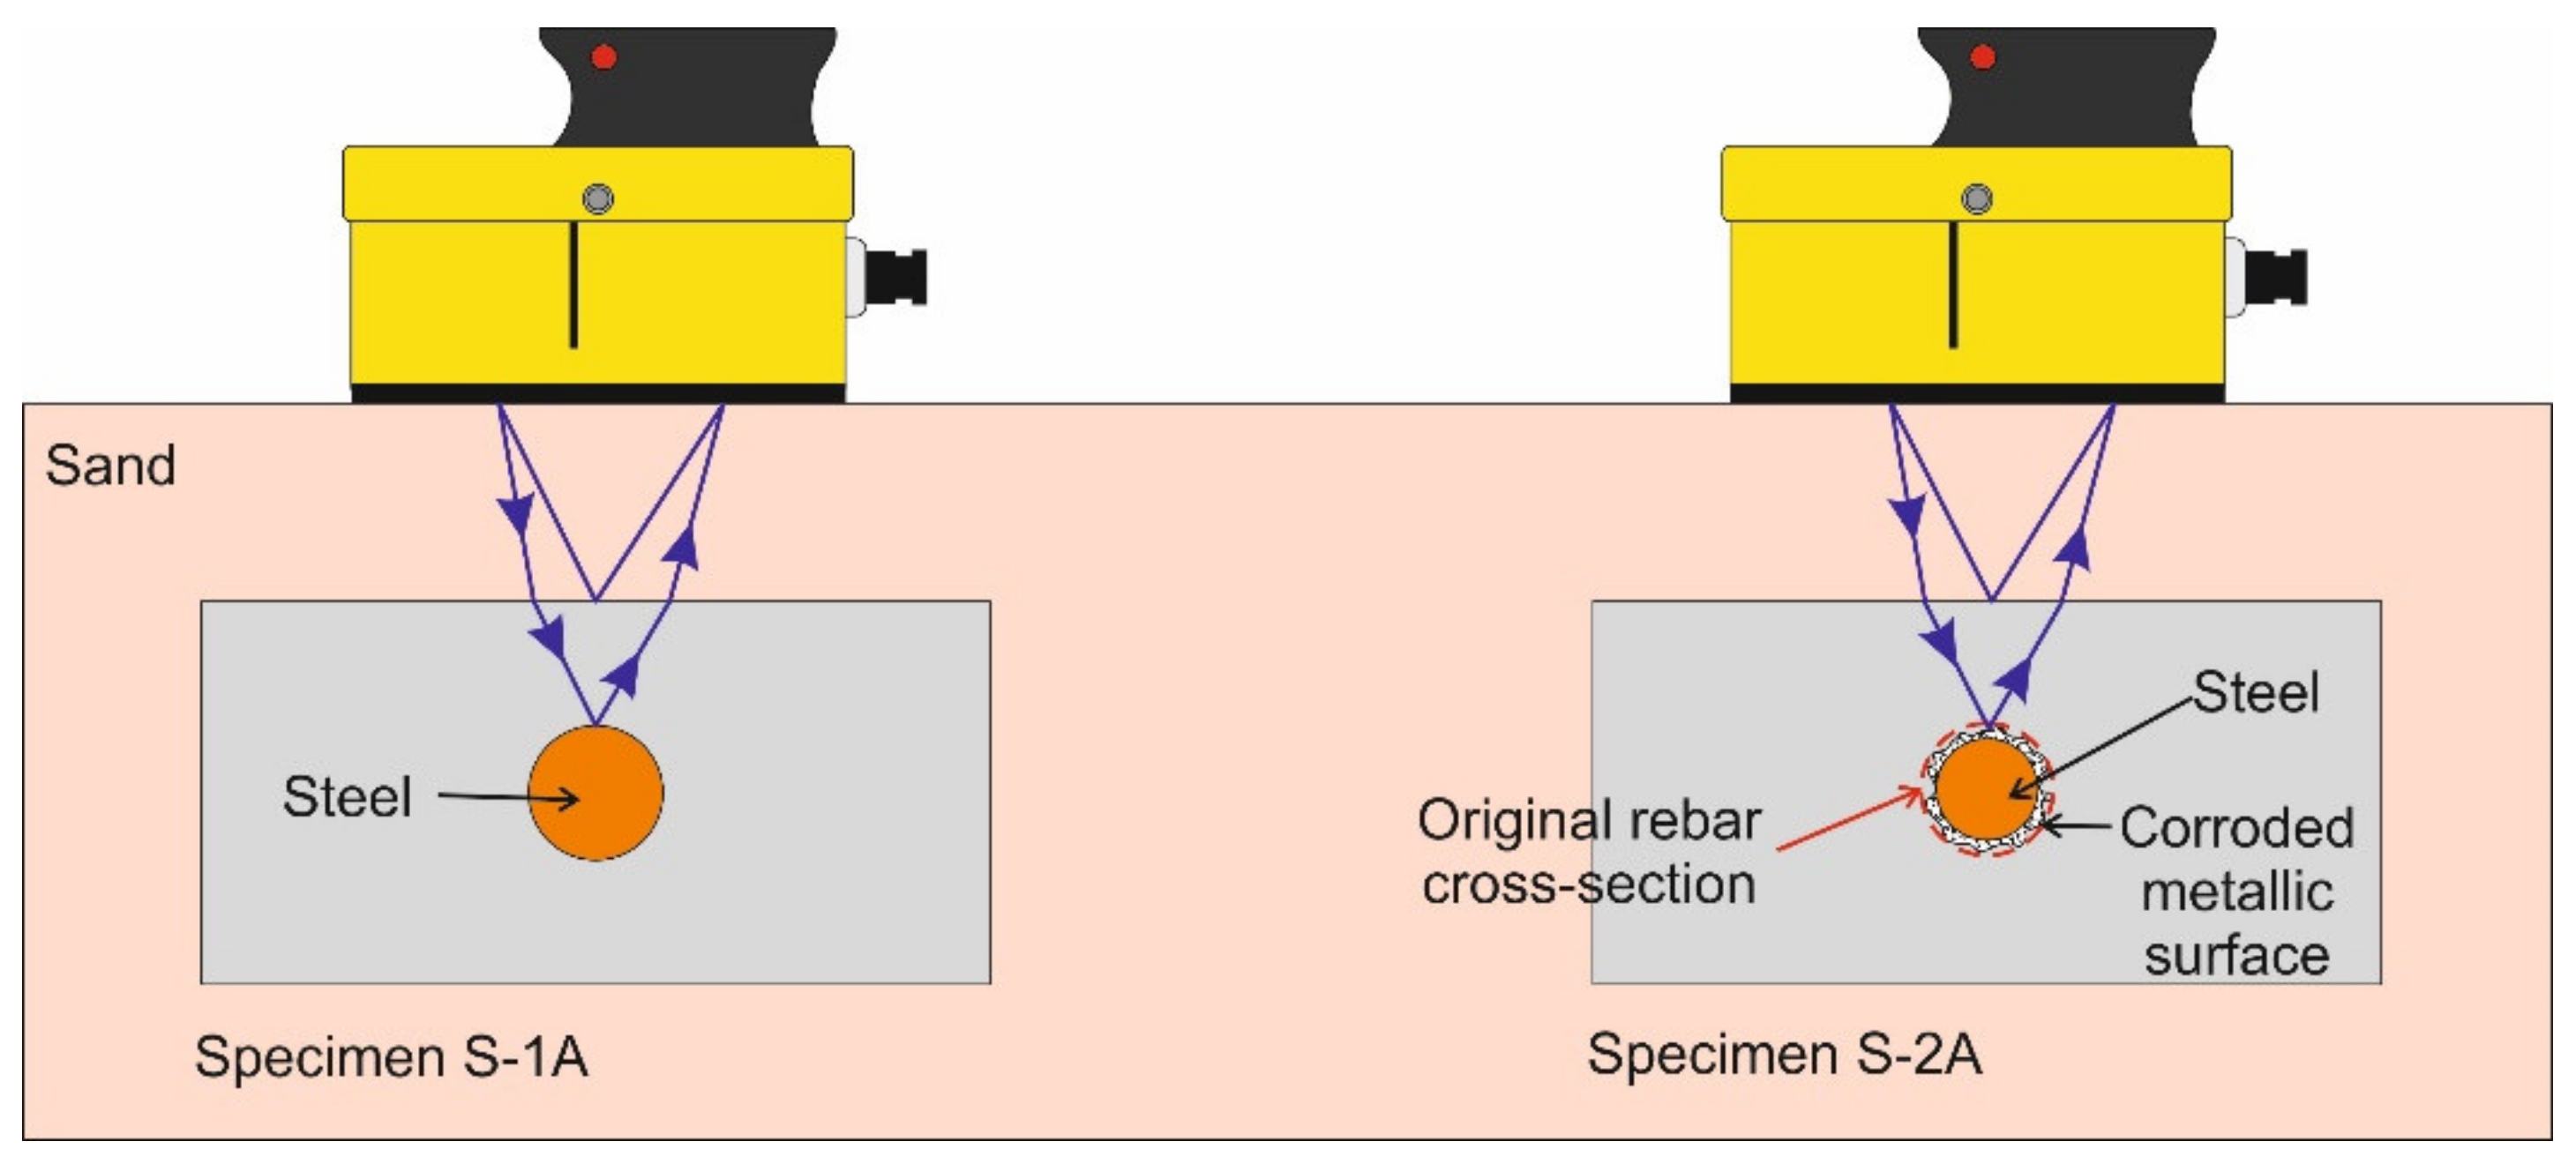
The change in the amplitude decay could be associated with the corrosion of the metallic rebar. In Test A, the concrete was not affected by the corrosion of the rebar because the corrosion process happened prior to specimen manufacturing. Therefore, the change in the attenuation was most likely due to the dispersion of the incident energy on the irregular surface of the metallic rebar. An irregular ring of affected material could be seen when removing the corroded rebar from the concrete specimen. This perimeter surface (Figure 7) could have produced scattering and, as a consequence, the amplitude of the reflected wave was smaller than in the case of the non-corroded rebar.
3.2. Test B
3.2.1. Qualitative Analysis
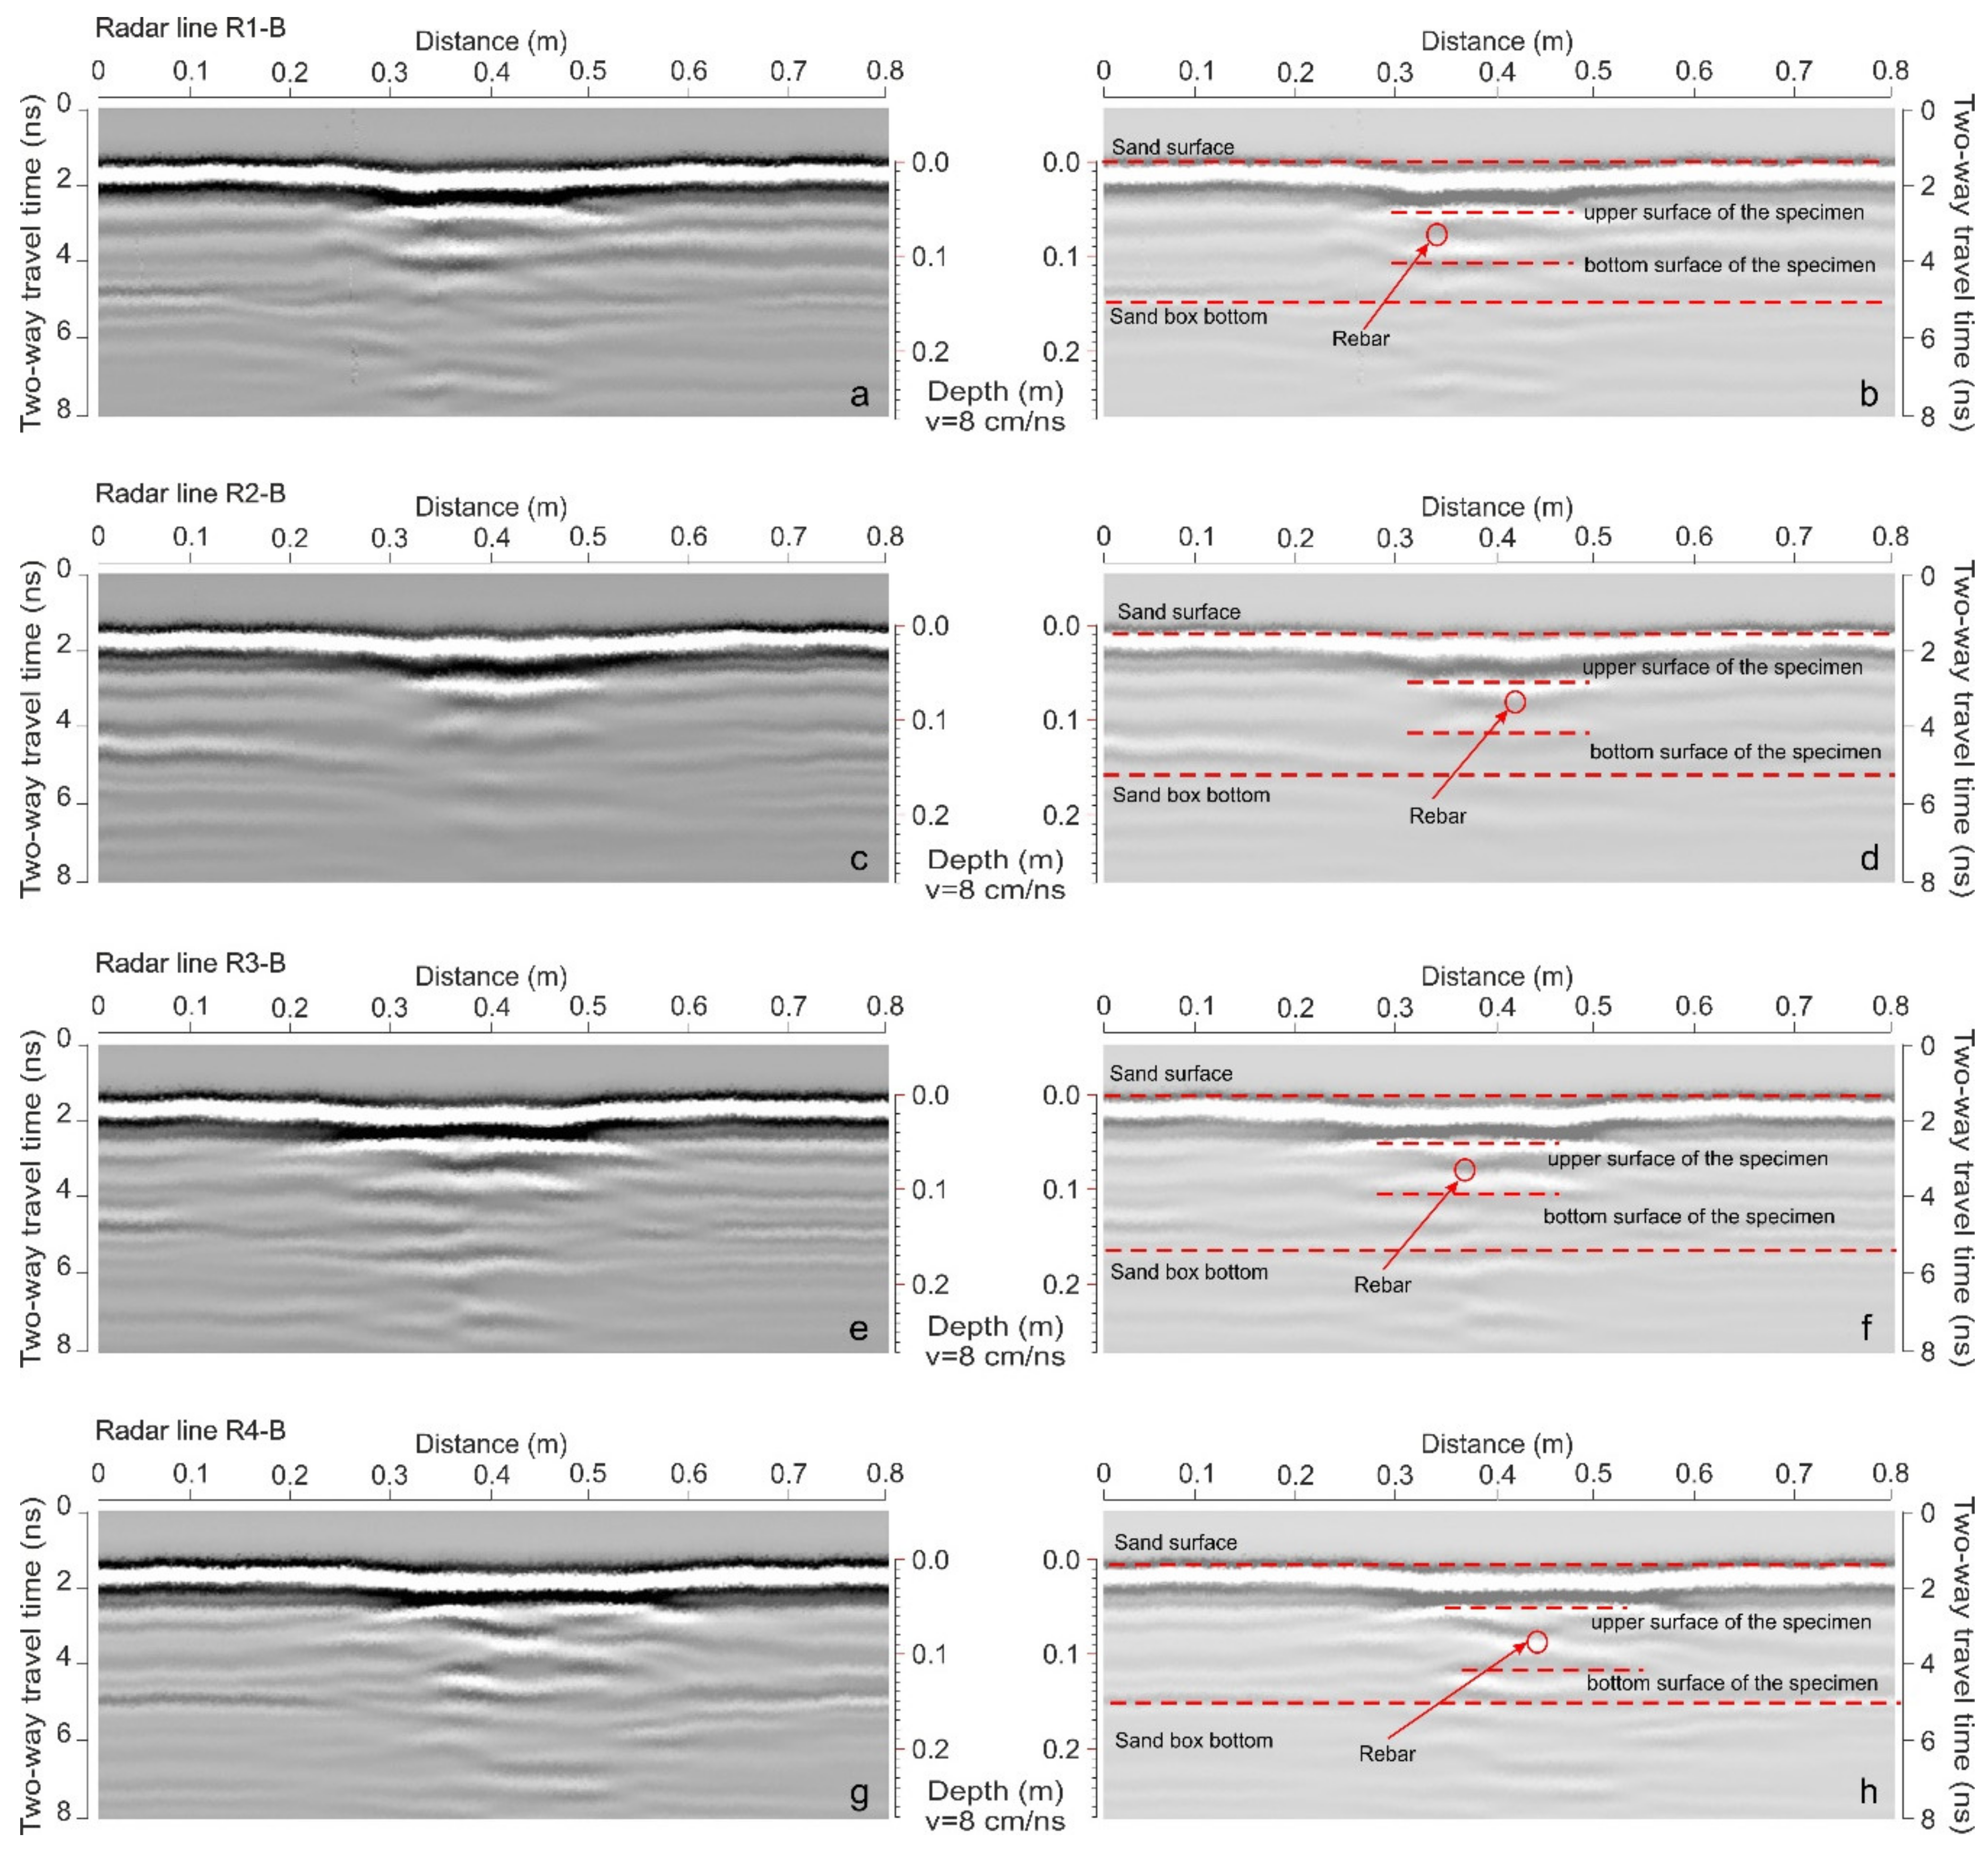
This test was focused on the consequences of the corrosion process of a metallic rebar embedded in concrete. The corrosion of the metallic target was produced inside the specimen, affecting the concrete. The specimens were buried in sand. Radar lines were perpendicular to them. Figure 8 shows examples of the B-scans obtained at each case at different corrosion times. Radargrams S-1B, S-2B, S-3B and S-4B were obtained from specimens with a non-corroded rebar after three, six and 12 months in a special chamber forcing corrosion, respectively.
In all B-scans in Figure 8, the concrete specimen can be clearly observed, and it is possible to identify the upper and bottom sides even though the detection of the underside was more obscure. In addition, the rebar could be identified in all cases, despite the existence of differences in the anomalies. The most outstanding result was the difference between the reflections on the corroded and non-corroded bars. The anomaly due to the non-corroded target (B-scan S-1B) is clearer than the anomalies due to the other bars, getting vaguer the image as the corrosion time increased. Large corrosion time made it more difficult to identify the rebar.
3.2.2. Analysis of Amplitudes
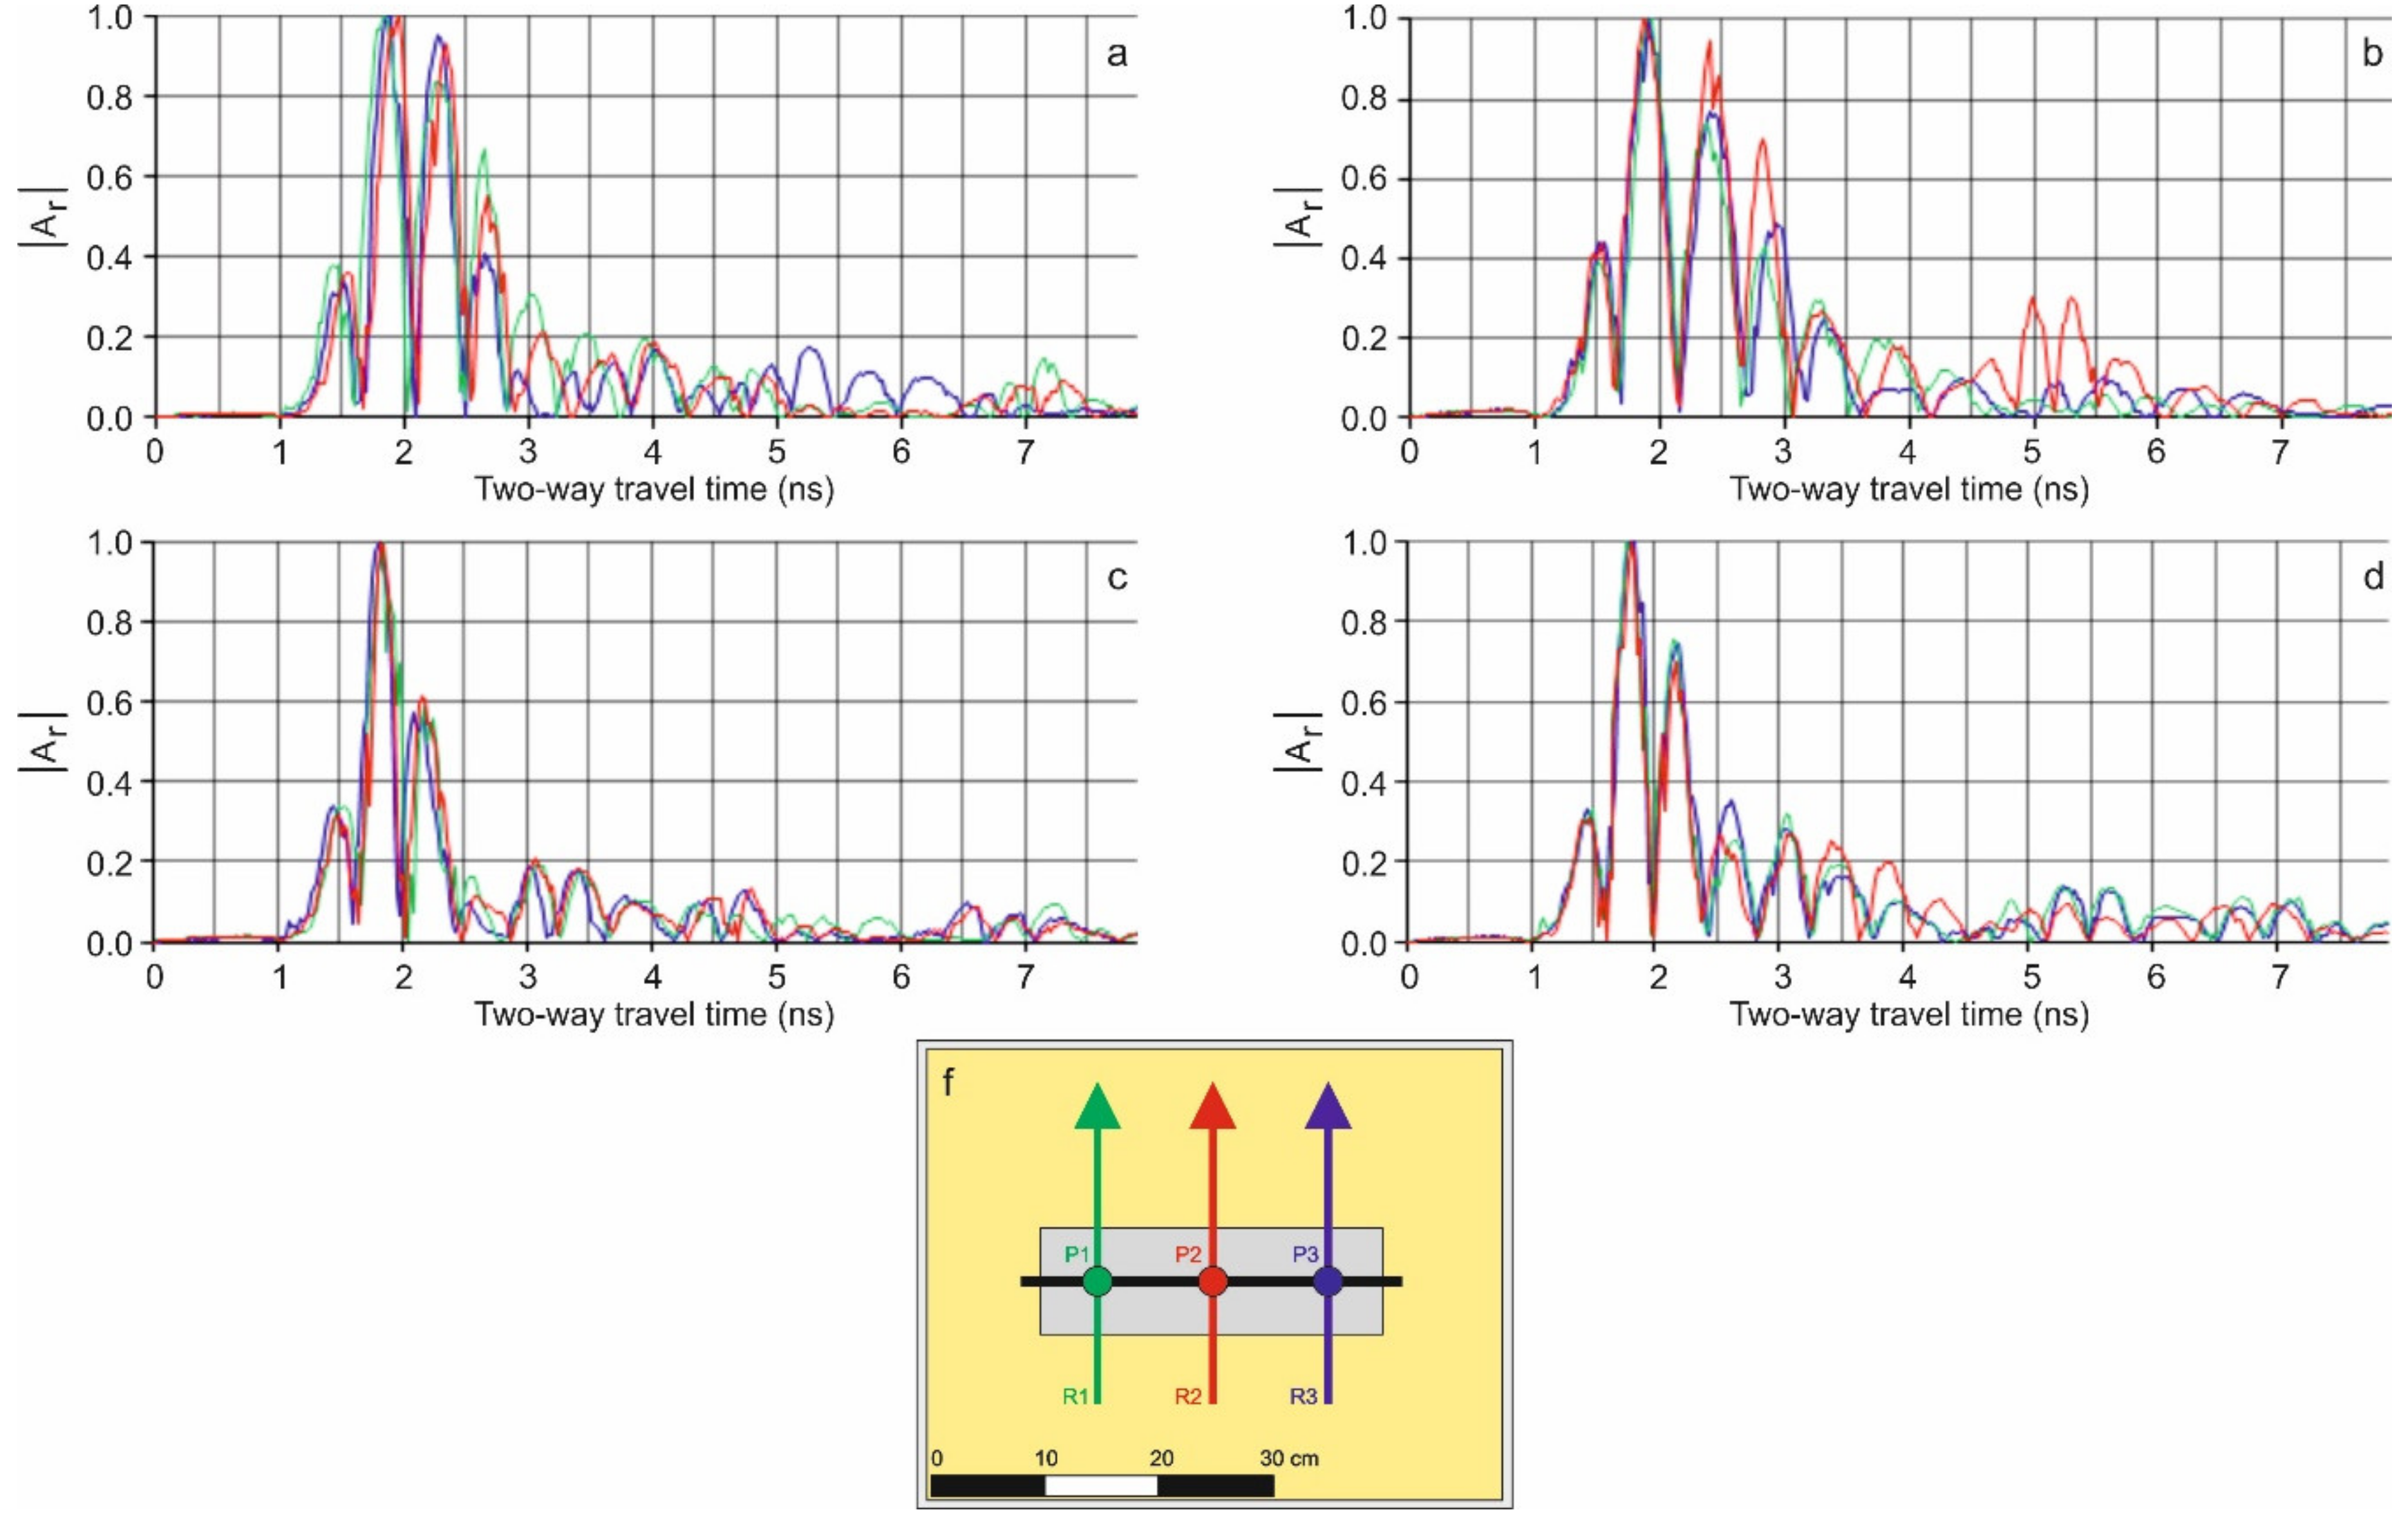
The trace obtained over the metallic target at each radar line was used in the analysis of the reflected wave’s amplitudes. Figure 9 presents examples of those traces at each one of the measurements. Figure 10 exhibits the absolute value of the amplitudes for the same A-scans.
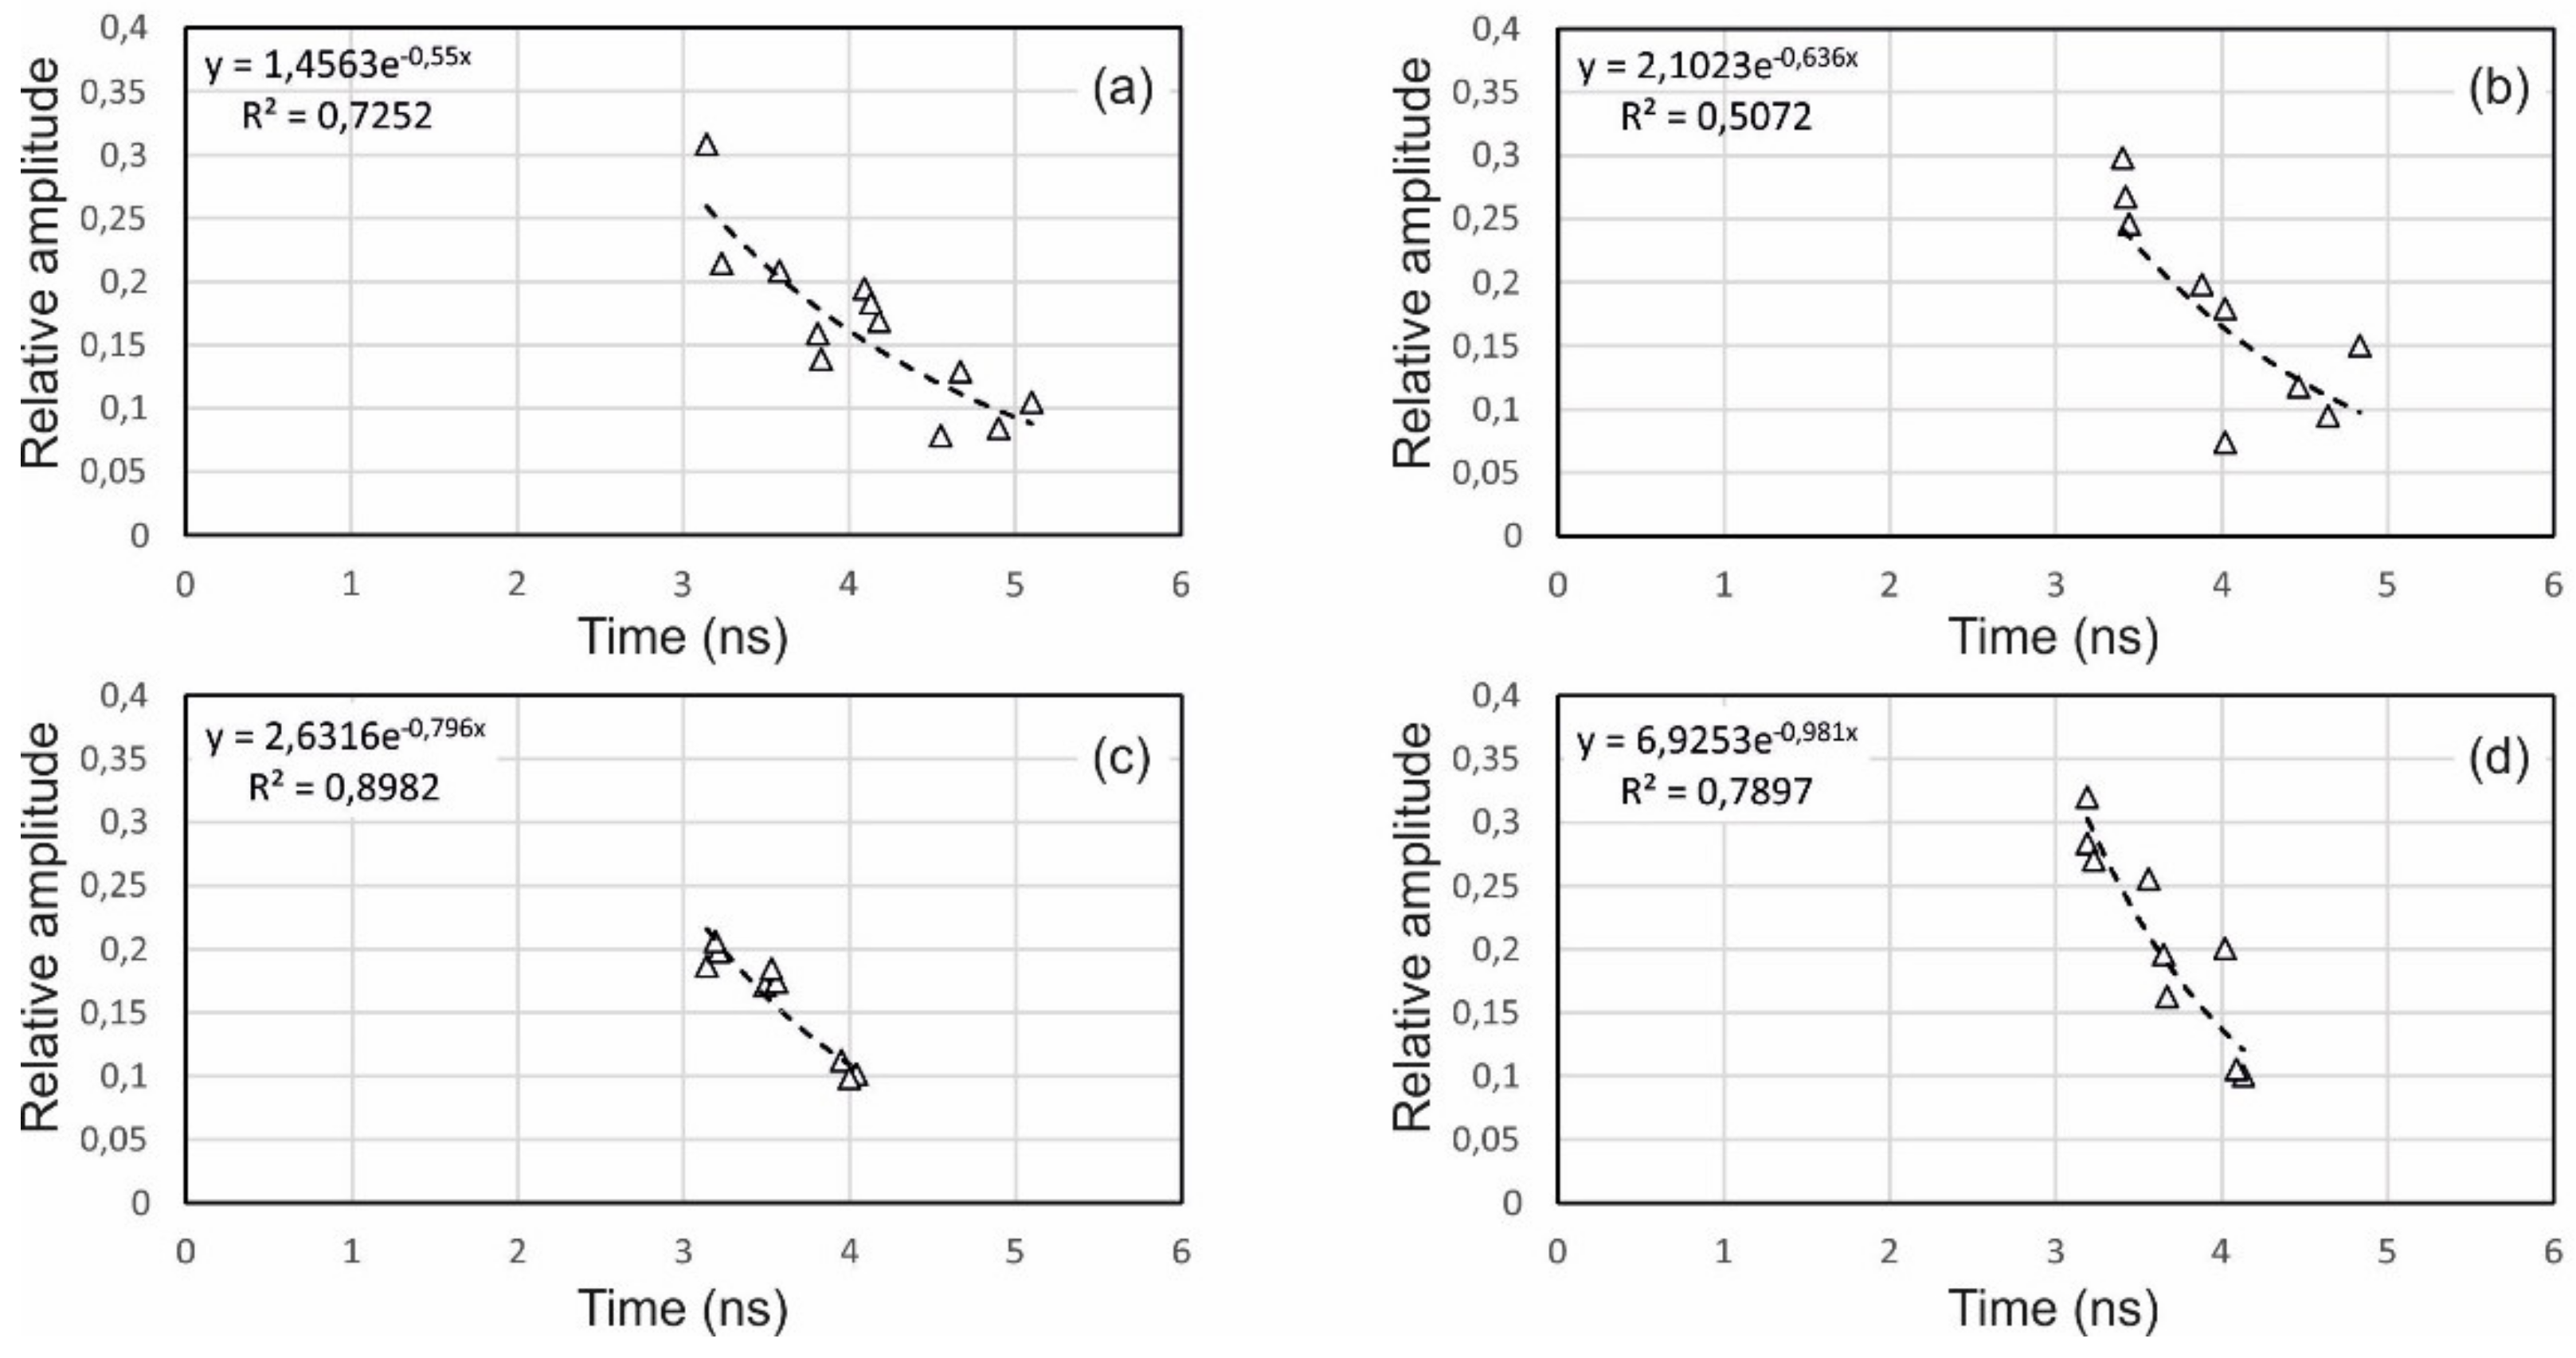
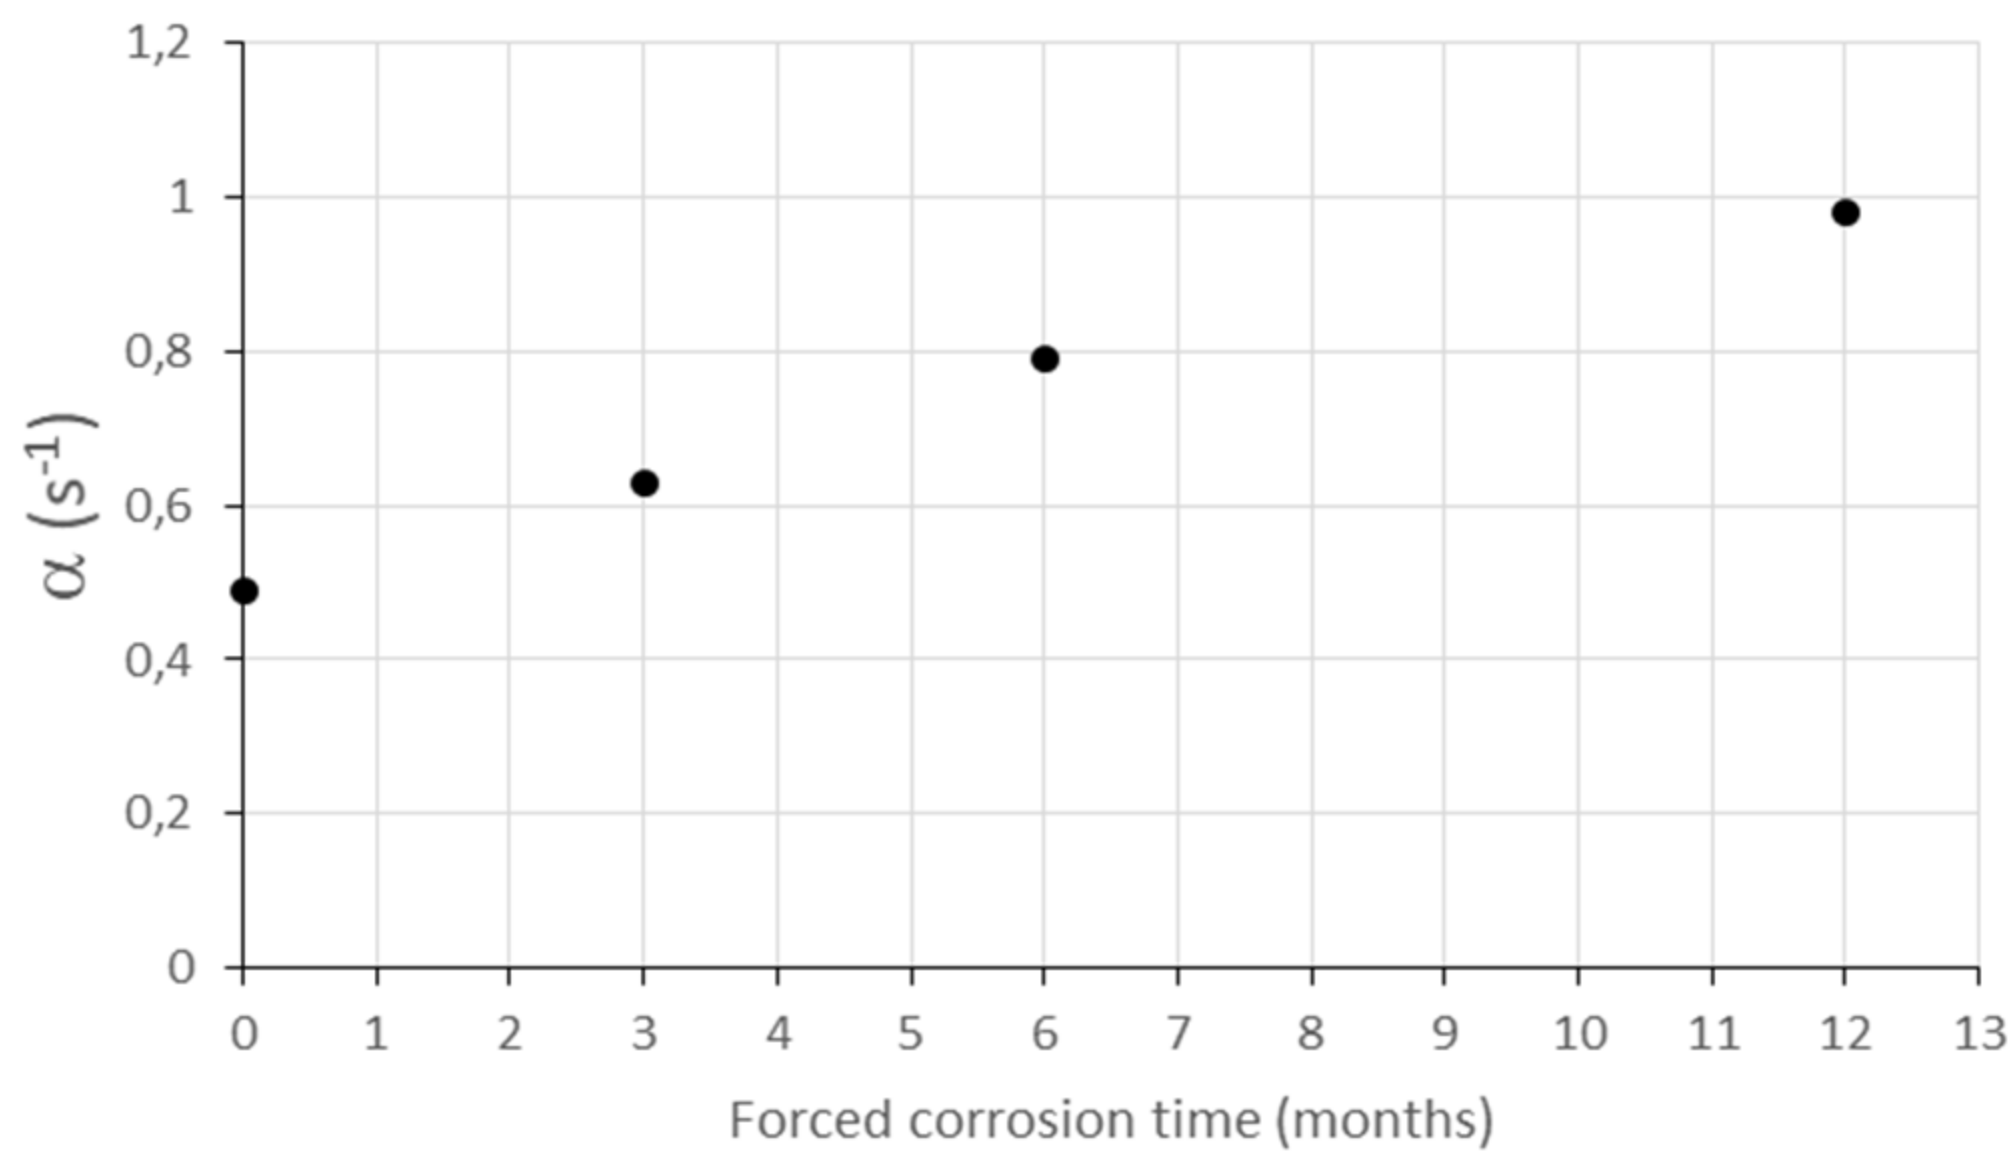
The decay of the amplitudes corresponding to the reflection on the metallic rebar was defined by picking the points associated with the maximum of amplitude, as seen in the graphs of Figure 10. These points are represented in front of time (Figure 11), and the points were fit by an exponential curve. The coefficient determined the attenuation, mainly as consequence of absorption and dispersion of the energy. Table 4 and Figure 12 summarize the average results.
Test B compared the results of specimens with metallic rebar embedded in concrete to different times of forced corrosion. The results indicated that during the corrosion process, attenuation was higher with higher times of corrosion. Possible causes of this effect could be:
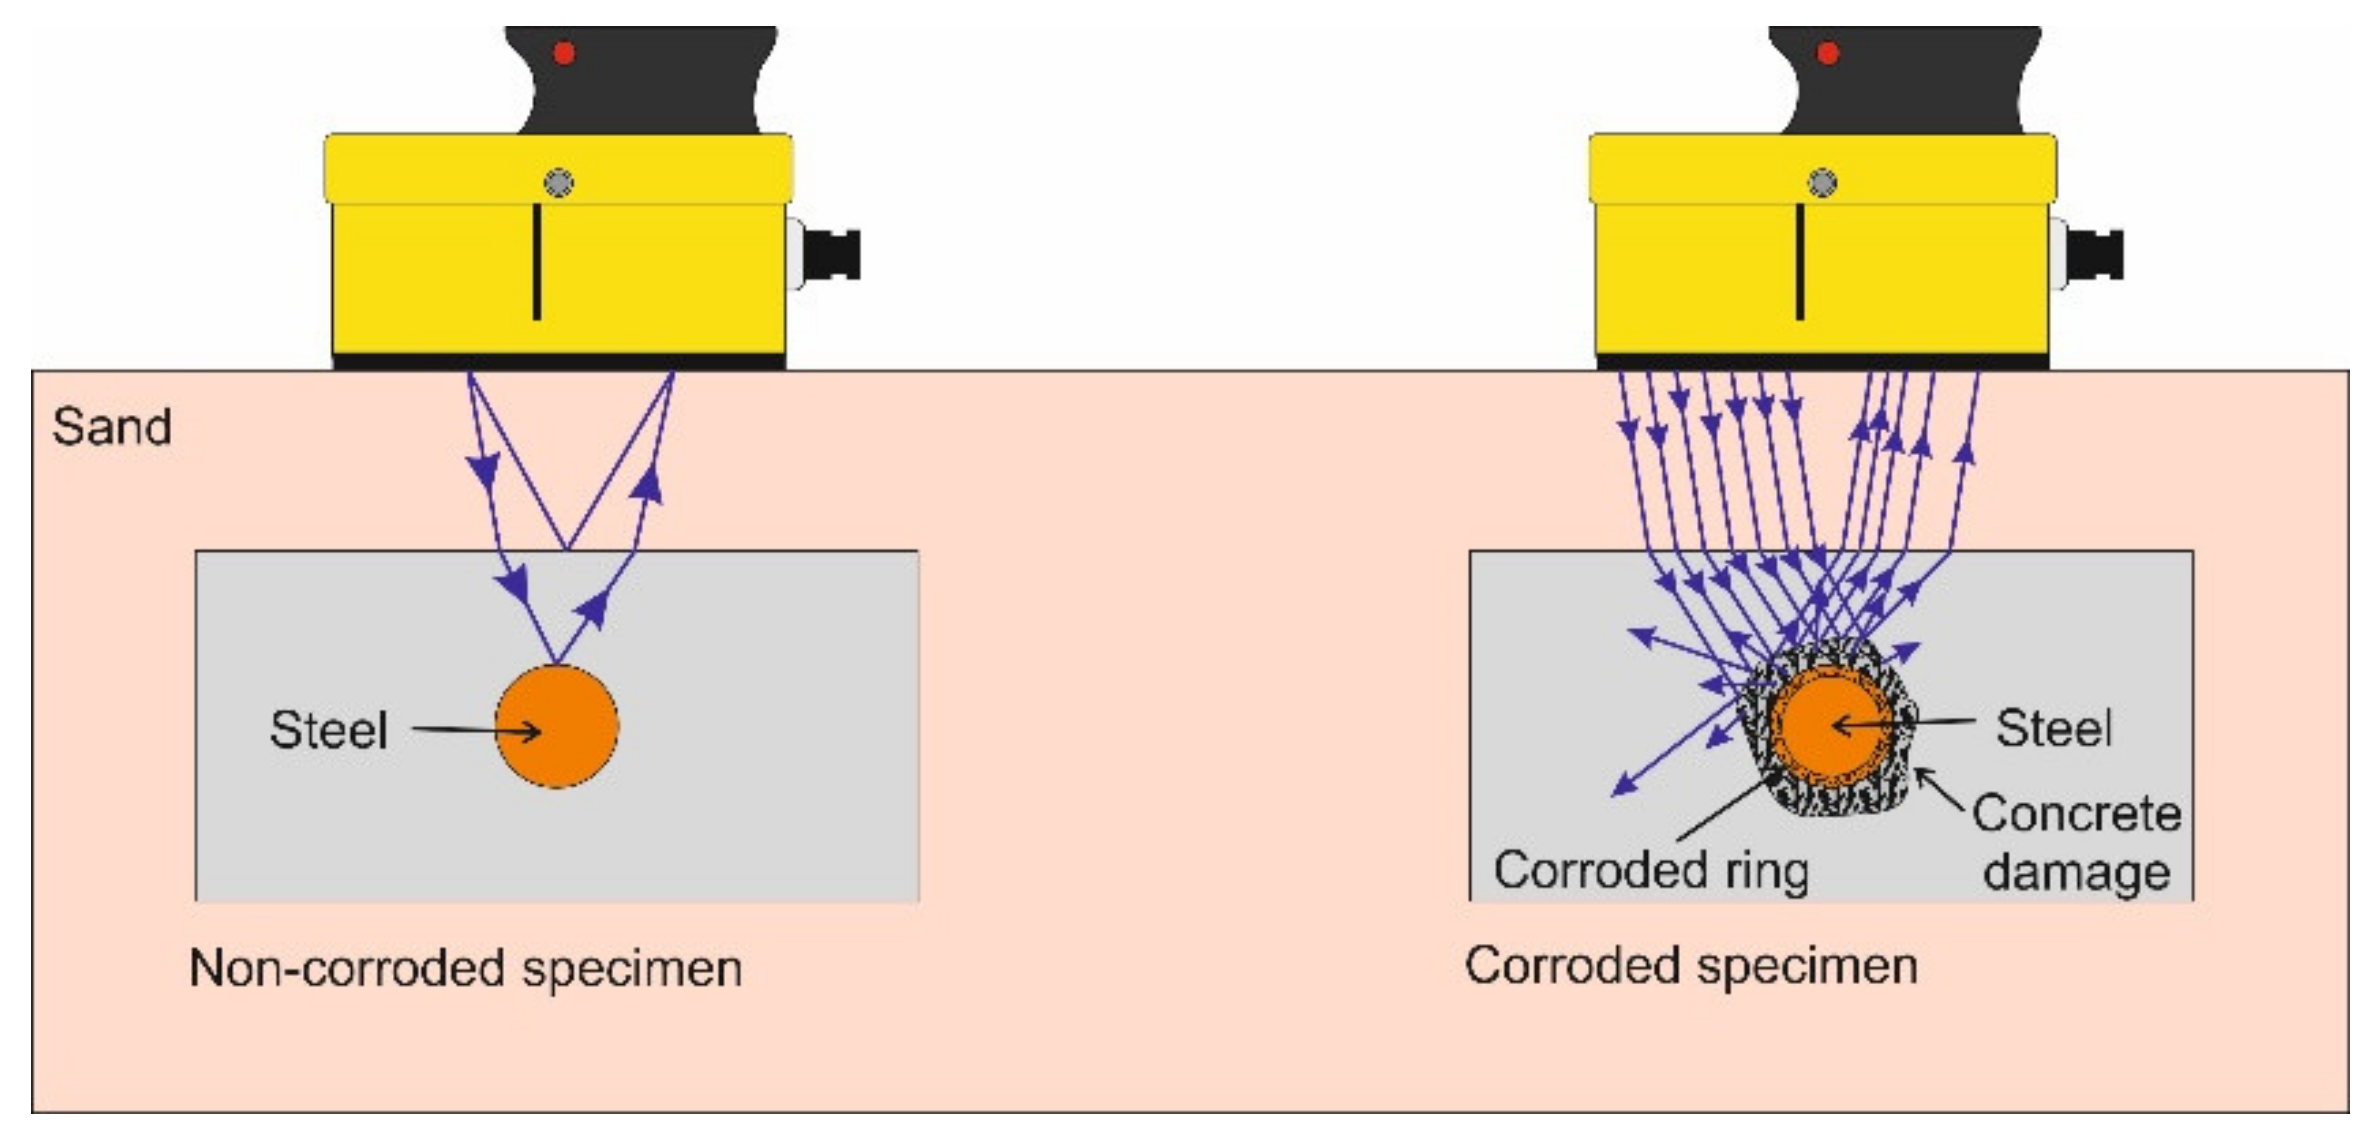
- The scattering of the GPR signal could have been produced in the concrete zone around the corroded rebar because concrete was affected with the iron oxide. Therefore, small fissures appeared adjacent to the rebar and grew in the rest of the specimen in a defined area. This fact affected the porosity and density of the medium [34,35]. This increase of heterogeneities in a ring around the rebar (Figure 13) scattered the GPR signal. As a result, the amplitude of the reflected wave arriving to the surface of the medium is smaller than in the cases of lower damaged media. The effect on the GPR images could usually be an increase of background noise, diminishing the amplitude of the received signal and increasing the attenuation. Moreover, the increase of the background noise could obscure the anomaly, making the detection of the rebar difficult.
- The corrosion of the metallic target presented the effect described in Test A.
4. Discussion
The effect of corrosion in GPR signals was analyzed with two different tests. The first test was focused on the effect of corroded rebar, highly corroded the target. The aim of the second test was to detect the effects of corrosion affecting concrete at different stages of damage. The analysis was based on the evaluation of B-scans and A-scans, detecting changes on the amplitude of the reflected signal and changes in the blurring of the images. Previous reported works (e.g., [15,17,22]) have shown that corrosion could be identified both in B-scans due to blurred images and in A-scans due to changes in the amplitude. In those cases, the change in the intensity was related to the chemical action of chlorides in the concrete as consequence of corrosion rebar. The analysis of the results of the tests presented in this paper indicated a change in the amplitude that corresponded to a decay of the wave reflected on the corroded target. Both tests highlighted the decrease on the reflected wave amplitude that was recorded by the GPR antenna in the case of corroded targets.
The analysis of the images from Test A underscores the decrease of the recorded GPR anomaly and showed a more blurred image in the case of corroded rebar (S-2A) embedded in non-affected concrete, as compared to the data from Specimen S-1A (non-corroded rebar). This result indicated that the blurring in B-scans appeared not only because of chemical changes in concrete but also in the case of corrosion that exclusively affected the rebar. A possible explanation could be related to changes on the reflective cross section. Corrosion altered the surface, making it more irregular and generating a dispersion of the incident energy. This effect has been observed in different GPR applications (e.g., [36,37,38]). This result points to the possibility of corrosion detection at early stages.
The results from Test B showed that the increase of the above mentioned effects on the amplitude and the image sharpness as the corrosion grade increased, producing more blurred B-scans and higher amplitude attenuation in A-scans. In this case, the effect on the signals could have been caused by the changes on the rebar cross section. However, other possible causes could be: (1) alteration of the concrete as consequence of chemical composition changes, (2) scattering in the steel delamination and, (3) scattering in the fissured concrete. Even though the anomalies were under the resolution of the antenna [39,40], the changes in the medium, as heterogeneity increases, could have produced those blurred images [41,42,43].
By comparing not only the amplitude of the reflected wave in an oxidized and in a non-oxidized target but also its decay, it was possible to observe a higher attenuation in the case of corroded element. The attenuation included the effects of absorption and dispersion of the signal. The trend of the decay (Figure 13) indicated a higher attenuation related to a higher corrosion period. The analysis of those results indicated that that decay was related to the degree of corrosion. Further controlled experiments that increase the number of samples, measurements and surveying specimens at shorter periods of time should approach the problem to provide a more precise quantitative analysis.
5. Conclusions
This evaluation introduces a non-destructive method oriented to the qualitative and quantitative assessment of progress of the corrosion process of reinforced concrete structures. Results point to the possible detection of corrosion at early stages. The tests were focused on a first analysis of controlled and simple specimens with the objective of obtaining clear radar images. Therefore, this work was based on the analysis of those simple specimens with the objective of obtaining not-confuse radar data that were oriented to the analysis of the specific behavior of the wave associated with corrosion. More complex settings require the consideration of more variables that could affect final data. Therefore, in more complex structures and zones, further analysis could be needed to find the association between the effects and the different variables.
Subsequently, further investigation should include more rebar in order to complicate the problem and obtain a better approach for the evaluation of real reinforced concrete structures. These non-invasive methodologies that prevent damage can contribute to a diminishing of the vulnerability of existing constructions, making them more sustainable by enlarging their live-cycles.
Author Contributions
Conceptualization, V.S., V.P.-G. and R.G.-D.; methodology, V.S., V.P.-G. and R.G.-D.; software, V.P.-G.; validation, V.P.-G. and R.G.-D.; formal analysis, V.S., V.P.-G., M.A.R. and R.G.-D.; investigation, V.S., V.P.-G. and R.G.-D.; resources, V.P.-G. and R.G.-D.; data curation, V.S., V.P.-G. and R.G.-D.; writing—original draft preparation, V.S., V.P.-G. and R.G.-D.; project administration V.P.-G. and R.G.-D.; funding acquisition, V.P.-G. and R.G.-D; revision and correction, V.P.-G.
Funding
This research was partially funded by the Ministry of Economy and Competitiveness (MINECO) of the Spanish Government and by the European Regional Development Fund (ERDF) of the European Union (EU) through projects with references CGL2015-65913-P (MINECO/ERDF, EU).
Acknowledgments
The authors are grateful to the Editors of the Remote Sensing Special Issue “Close Range Remote Sensing” for inviting them to submit this paper.
Conflicts of Interest
The authors declare no conflict of interest.
References
- François, R.; Laurens, S.; Deby, F. Corrosion and Its Consequences for Reinforced Concrete Structures; Elsevier: Amsterdam, The Netherlands, 2018. [Google Scholar]
- Rodriguez, J.; Ortega, L.M.; Casal, J. Load carrying capacity of concrete structures with corroded reinforcement. Constr. Build. Mater. 1997, 11, 239–248. [Google Scholar] [CrossRef]
- Al-Sulaimani, G.J.; Kaleemullah, M.; Basunbul, I.A. Influence of corrosion and cracking on bond behavior and strength of reinforced concrete members. Struct. J. 1990, 87, 220–231. [Google Scholar]
- Arndt, R.; Jalinoos, F. NDE for corrosion detection in reinforced concrete structures-benchmark approach. In Proceedings of the Non-Destructive Testing in Civil Engineering (NDTCE’09), Nantes, France, 30 June–3 July 2009; pp. 1–6. [Google Scholar]
- Mietz, J.; Fischer, J. Evaluation of NDT methods for detection of prestressing steel damage at post-tensioned concrete structures. Mater. Corros. 2007, 58, 789–794. [Google Scholar] [CrossRef]
- Gece, G. The use of quantum chemical methods in corrosion inhibitor studies. Corros. Sci. 2008, 50, 2981–2992. [Google Scholar] [CrossRef]
- Andrade, C.; Martínez, I.; Alonso, C.; Fullea, J. New advanced electrochemical techniques for on site measurements of reinforcement corrosion. Mater. Constr. 2001, 51, 97–107. [Google Scholar] [CrossRef]
- Song, H.W.; Saraswathy, V. Corrosion monitoring of reinforced concrete structures-A. Int. J. Electrochem. Sci. 2007, 2, 1–28. [Google Scholar]
- Kohli, R. Methods for monitoring and measuring cleanliness of surfaces. In Developments in Surface Contamination and Cleaning; William Andrew Publishing; Elsevier: Waltham, MA, USA, 2012; pp. 107–178. [Google Scholar]
- Assis, S.L.; Wolynec, S.; Costa, I. Corrosion characterization of titanium alloys by electrochemical techniques. Electrochim. Acta 2006, 51, 1815–1819. [Google Scholar] [CrossRef]
- Barnes, C.L.; Trottier, J.F.; Forgeron, D. Improved concrete bridge deck evaluation using GPR by accounting for signal depth–amplitude effects. NDT E Int. 2008, 41, 427–433. [Google Scholar] [CrossRef]
- Chang, C.W.; Lin, C.H.; Lien, H.S. Measurement radius of reinforcing steel bar in concrete using digital image GPR. Constr. Build. Mater. 2009, 23, 1057–1063. [Google Scholar] [CrossRef]
- Barrile, V.; Pucinotti, R. Application of radar technology to reinforced concrete structures: A case study. NDT E Int. 2005, 38, 596–604. [Google Scholar] [CrossRef]
- Shaw, M.R.; Millard, S.G.; Molyneaux, T.C.K.; Taylor, M.J.; Bungey, J.H. Location of steel reinforcement in concrete using ground penetrating radar and neural networks. NDT E Int. 2005, 38, 203–212. [Google Scholar] [CrossRef]
- Zaki, A.; Johari, M.; Azmi, M.; Hussin, W.; Aminuddin, W.M.; Jusman, Y. Experimental Assessment of Rebar Corrosion in Concrete Slab Using Ground Penetrating Radar (GPR). Int. J. Corros. 2018, 283, 1–10. [Google Scholar] [CrossRef]
- Wong, T.W.P.; Poon, C.S.; Lai, W.L.W. Laboratory validation of corrosion-induced delamination in concrete by ground penetrating radar. In Proceedings of the 17th International Conference on Ground Penetrating Radar (GPR), Rapperswil, Switzerland, 18–21 June; 2018; pp. 1–6. [Google Scholar]
- Hong, S.; Wiggenhauser, H.; Helmerich, R.; Dong, B.; Dong, P.; Xing, F. Long-term monitoring of reinforcement corrosion in concrete using ground penetrating radar. Corros. Sci. 2017, 114, 123–132. [Google Scholar] [CrossRef]
- Lai, W.L.; Kind, T.; Wiggenhauser, H. Detection of accelerated reinforcement corrosion in concrete by ground penetrating radar. In Proceedings of the XIII International Conference on Ground Penetrating Radar, Lecce, Italy, 21–25 June 2010; pp. 1–5. [Google Scholar]
- He, X.Q.; Zhu, Z.Q.; Liu, Q.Y.; Lu, G.Y. Review of GPR rebar detection. In Proceedings of the PIERPS, Beijing, China, 23–27 March; 2009; pp. 804–813. [Google Scholar]
- Hubbard, S.S.; Zhang, J.; Monteiro, P.J.; Peterson, J.E.; Rubin, Y. Experimental detection of reinforcing bar corrosion using nondestructive geophysical techniques. Mater. J. 2003, 100, 501–510. [Google Scholar]
- Tosti, F.; Ferrante, C. Using ground penetrating radar methods to investigate reinforced concrete structures. Surv. Geophys. 2019, 1–46. [Google Scholar] [CrossRef]
- Solla, M.; Lagüela, S.; Fernández, N.; Garrido, I. Assessing Rebar Corrosion through the Combination of Nondestructive GPR and IRT Methodologies. Remote Sens. 2019, 11, 1705. [Google Scholar] [CrossRef]
- Xu, X.; Xia, T.; Venkatachalam, A.; Huston, D. Development of high-speed ultrawideband ground-penetrating radar for rebar detection. J. Eng. Mech. 2012, 139, 272–285. [Google Scholar] [CrossRef]
- Bala, D.C.; Garg, R.D.; Jain, S.S. Rebar detection using GPR: An emerging non-destructive QC approach. Int. J. Eng. Res. Appl.(IJERA) 2011, 1, 2111–2117. [Google Scholar]
- Soldovieri, F.; Solimene, R.; Monte, L.L.; Bavusi, M.; Loperte, A. Sparse reconstruction from GPR data with applications to rebar detection. IEEE Trans. Instrum. Meas. 2010, 60, 1070–1079. [Google Scholar] [CrossRef]
- Zanzi, L.; Arosio, D. Sensitivity and accuracy in rebar diameter measurements from dual-polarized GPR data. Constr. Build. Mater. 2013, 48, 1293–1301. [Google Scholar] [CrossRef]
- Leucci, G. Ground penetrating radar: An application to estimate volumetric water content and reinforced bar diameter in concrete structures. J. Adv. Concr. Technol. 2012, 10, 411–422. [Google Scholar] [CrossRef]
- Pérez-Gracia, V.; García, F.G.; Abad, I.R. GPR evaluation of the damage found in the reinforced concrete base of a block of flats: A case study. NDT E Int. 2008, 41, 341–353. [Google Scholar] [CrossRef]
- Orlando, L.; Slob, E. Using multicomponent GPR to monitor cracks in a historical building. J. Appl. Geophys. 2009, 67, 327–334. [Google Scholar] [CrossRef]
- Abraham, O.; Dérobert, X. Non-destructive testing of fired tunnel walls: The Mont-Blanc Tunnel case study. NDT E Int. 2003, 36, 411–418. [Google Scholar] [CrossRef]
- Agred, K.; Klysz, G.; Balayssac, J.P. Location of reinforcement and moisture assessment in reinforced concrete with a double receiver GPR antenna. Constr. Build. Mater. 2018, 188, 1119–1127. [Google Scholar] [CrossRef]
- Shahid, M. Corrosion protection with eco-friendly inhibitors. Adv. Nat. Sci. Nanosci. Nanotechnol. 2011, 2, 043001. [Google Scholar] [CrossRef]
- Hendy, C.R.; Smith, D.A. Designers’ Guide to EN 1992–2: Eurocode 2: Design of Concrete Structures: Part 2: Concrete Bridges; Thomas Telford: London, UK, 2007. [Google Scholar]
- Hasan, M.I.; Yazdani, N. An experimental and numerical study on embedded rebar diameter in concrete using ground penetrating radar. Chin. J. Eng. 2016. [CrossRef]
- Krishnarajapete Raju, R. Estimation of Rebar Corrosion in Concrete using Ground Penetrating Radar. Master’s Thesis, The University of Texas at Arlington, Arlington, TX, USA, 2015. [Google Scholar]
- Beckmann, P.; Spizzichino, A. The Scattering of Electromagnetic Waves from Rough Surfaces; Artech House Inc.: Norwood, MA, USA, 1987; p. 511. [Google Scholar]
- Al-Qadi, I.L.; Xie, W.; Roberts, R. Scattering analysis of ground-penetrating radar data to quantify railroad ballast contamination. NDT E Int. 2008, 41, 441–447. [Google Scholar] [CrossRef]
- Salinas Naval, V.; Santos-Assunçao, S.; Pérez-Gracia, V. GPR clutter amplitude processing to detect shallow geological targets. Remote Sens. 2018, 10, 88. [Google Scholar] [CrossRef]
- Pérez-Gracia, V.; González-Drigo, R.; Di Capua, D. Horizontal resolution in a non-destructive shallow GPR survey: An experimental evaluation. NDT E Int. 2008, 41, 611–620. [Google Scholar] [CrossRef]
- Pérez-Gracia, V.; Di Capua, D.; González-Drigo, R.; Pujades, L. Laboratory characterization of a GPR antenna for high-resolution testing: Radiation pattern and vertical resolution. NDT E Int. 2009, 42, 336–344. [Google Scholar] [CrossRef]
- Grimm, R.E.; Heggy, E.; Clifford, S.; Dinwiddie, C.; McGinnis, R.; Farrell, D. Absorption and scattering in ground-penetrating radar: Analysis of the Bishop Tuff. J. Geophys. Res. Planets 2006, 111. [Google Scholar] [CrossRef]
- Takahashi, K.; Igel, J.; Preetz, H. Modeling of GPR clutter caused by soil heterogeneity. Int. J. Antennas Propag. 2012. [Google Scholar] [CrossRef]
- Takahashi, K.; Igel, J.; Preetz, H.; Sato, M. Sensitivity analysis of soil heterogeneity for ground-penetrating radar measurements by means of a simple modeling. Radio Sci. 2015, 50, 79–86. [Google Scholar] [CrossRef]
Figure 1.
Compressive test of concrete. (a) Manufacturing concrete specimens for the compressive test (diameter of 10 cm and height of 20 cm; (b) testing the concrete specimens.
Figure 1.
Compressive test of concrete. (a) Manufacturing concrete specimens for the compressive test (diameter of 10 cm and height of 20 cm; (b) testing the concrete specimens.

Figure 2.
Scheme of data acquisition in Test A (a and b). Scheme of data acquisition in Test B (c). Preparation of the samples (specimens buried in sand) previous to data acquisition in Test A (d) and Test B (e).
Figure 2.
Scheme of data acquisition in Test A (a and b). Scheme of data acquisition in Test B (c). Preparation of the samples (specimens buried in sand) previous to data acquisition in Test A (d) and Test B (e).

Figure 3.
Test A: Raw radar data and interpretation from radar lines R1 (a,b), R2 (c,d), and R3 (e,f), with the B-scans obtained from the radar lines crossing perpendicularly the specimens (g). The wave velocity in sand was used in the conversion of wo-way-travel time (TWT ) into depths.
Figure 3.
Test A: Raw radar data and interpretation from radar lines R1 (a,b), R2 (c,d), and R3 (e,f), with the B-scans obtained from the radar lines crossing perpendicularly the specimens (g). The wave velocity in sand was used in the conversion of wo-way-travel time (TWT ) into depths.

Figure 4.
Raw radar data and interpretation from radar lines R4 (a and b) and R5 (c and d). B-scans were obtained from radar lines along the specimen (e).
Figure 4.
Raw radar data and interpretation from radar lines R4 (a and b) and R5 (c and d). B-scans were obtained from radar lines along the specimen (e).

Figure 5.
A-scans from Specimens S-1A (non-corroded) (a) and S-2A (corroded) (b), as well as the corresponding amplitude absolute value from Specimens S-1A (c) and S-2A (d). (e) The A-scans represented in the graphs correspond to the points P1, P2 and P3 from radar lines R1, R2 and R3.
Figure 5.
A-scans from Specimens S-1A (non-corroded) (a) and S-2A (corroded) (b), as well as the corresponding amplitude absolute value from Specimens S-1A (c) and S-2A (d). (e) The A-scans represented in the graphs correspond to the points P1, P2 and P3 from radar lines R1, R2 and R3.

Figure 6.
Amplitude of the reflected wave versus two-way travel time. (a) Specimen R1-A (non-corroded rebar) and (b) Specimen R2-A (corroded rebar).
Figure 6.
Amplitude of the reflected wave versus two-way travel time. (a) Specimen R1-A (non-corroded rebar) and (b) Specimen R2-A (corroded rebar).

Figure 7.
The difference between specimens in Test A was the corroded ring around the metallic rebar that changed the cross-section. The concrete in both cases was the same and not affected by the corroded metallic target.
Figure 7.
The difference between specimens in Test A was the corroded ring around the metallic rebar that changed the cross-section. The concrete in both cases was the same and not affected by the corroded metallic target.

Figure 8.
B-scans obtained at measurements S-1B (a), S-2B (c), S-3B (e) and S-4B (g), as well as the respective corresponding interpretation (b,d,f,h).
Figure 8.
B-scans obtained at measurements S-1B (a), S-2B (c), S-3B (e) and S-4B (g), as well as the respective corresponding interpretation (b,d,f,h).

Figure 9.
A-scans from Specimens (a) S-1B (non-corroded rebar), (b) S-2B (three months corrosion), (c) S-3B (six months corrosion), and (d) S-4B (12 months corrosion). Points P1, P2 and P3 correspond to the A-scan position selected at each trace crossing the specimen.
Figure 9.
A-scans from Specimens (a) S-1B (non-corroded rebar), (b) S-2B (three months corrosion), (c) S-3B (six months corrosion), and (d) S-4B (12 months corrosion). Points P1, P2 and P3 correspond to the A-scan position selected at each trace crossing the specimen.

Figure 10.
Absolute value of the amplitudes of the A-scans from Specimens (a) S-1B (non-corroded rebar), (b) S-2B (three months corrosion), (c) S-3B (six months corrosion), and (d) S-4B (12 months corrosion).
Figure 10.
Absolute value of the amplitudes of the A-scans from Specimens (a) S-1B (non-corroded rebar), (b) S-2B (three months corrosion), (c) S-3B (six months corrosion), and (d) S-4B (12 months corrosion).

Figure 11.
Decay of the amplitude of the wave reflected on the metallic target. (a) Specimen S-1B (non-corroded rebar), (b) Specimen S-2B (three months corrosion), (c) Specimen S-3B (six months corrosion), and (d) Specimen S-4B (12 months corrosion).
Figure 11.
Decay of the amplitude of the wave reflected on the metallic target. (a) Specimen S-1B (non-corroded rebar), (b) Specimen S-2B (three months corrosion), (c) Specimen S-3B (six months corrosion), and (d) Specimen S-4B (12 months corrosion).

Figure 12.
Decay coefficient depending on the forced corrosion time.

Figure 13.
Scheme of the effect of the damaged concrete as consequence of the corrosion of the inside of the metallic targets. Dispersion occurred as consequence of heterogeneities in the affected zones.
Figure 13.
Scheme of the effect of the damaged concrete as consequence of the corrosion of the inside of the metallic targets. Dispersion occurred as consequence of heterogeneities in the affected zones.


Table 1.
Characteristics of the tested specimens. Test A (S-1A and S-2A) and Test B (S-1b, S-2B, S-3B and S-4B).
Table 1.
Characteristics of the tested specimens. Test A (S-1A and S-2A) and Test B (S-1b, S-2B, S-3B and S-4B).
| Specimen | Time Corrosion Chamber | Concrete Type | Steel Type | Size | Medium | Figure |
|---|---|---|---|---|---|---|
| S-1A | 0 | C30/35 | S460 Non Corroded | 30 × 8 × 8 cm | Wet Sand |  |
| S-2A | S460 Corroded |  | ||||
| S-1B | 0 | C30/35 | S460 | 30 × 20 × 7 cm | Dry Sand |  |
| S-2B | 3 |  | ||||
| S-3B | 6 |  | ||||
| S-4B | 12 |  |
Table 2.
Radar data acquisition parameters.
| Antenna Type | Centre Frequency (MHz) | Bandwidth (MHz) | Radar Line Sampling | Time Sampling | Time Window (ns) |
|---|---|---|---|---|---|
| Shielded antenna | 1600 | 1400 | 2 scans/cm | 356 | 8 |
Table 3.
Curve parameters in the approach of the reflected wave amplitude versus time.
| Parameter | Sample S-1A | Sample S-2A |
|---|---|---|
| Non-Corroded Rebar | Corroded Rebar | |
| α (s−1) | 0.60 | 1.07 |
| R2 | 0.886 | 0.867 |
Table 4.
Decay parameters in Test B.
| Specimen Corrosion Time (Months) | S-1B | S-2B | S-3B | S-4B |
|---|---|---|---|---|
| 0 | 3 | 6 | 12 | |
| α (s−1) | 0.49 | 0.63 | 0.79 | 0.98 |
| R2 | 0.778 | 0.816 | 0.849 | 0.789 |
© 2019 by the authors. Licensee MDPI, Basel, Switzerland. This article is an open access article distributed under the terms and conditions of the Creative Commons Attribution (CC BY) license (http://creativecommons.org/licenses/by/4.0/).
Share and Cite
MDPI and ACS Style
Sossa, V.; Pérez-Gracia, V.; González-Drigo, R.; A. Rasol, M. Lab Non Destructive Test to Analyze the Effect of Corrosion on Ground Penetrating Radar Scans. Remote Sens. 2019, 11, 2814. https://0-doi-org.brum.beds.ac.uk/10.3390/rs11232814
AMA Style
Sossa V, Pérez-Gracia V, González-Drigo R, A. Rasol M. Lab Non Destructive Test to Analyze the Effect of Corrosion on Ground Penetrating Radar Scans. Remote Sensing. 2019; 11(23):2814. https://0-doi-org.brum.beds.ac.uk/10.3390/rs11232814
Chicago/Turabian StyleSossa, Viviana, Vega Pérez-Gracia, Ramón González-Drigo, and Mezgeen A. Rasol. 2019. "Lab Non Destructive Test to Analyze the Effect of Corrosion on Ground Penetrating Radar Scans" Remote Sensing 11, no. 23: 2814. https://0-doi-org.brum.beds.ac.uk/10.3390/rs11232814
Note that from the first issue of 2016, this journal uses article numbers instead of page numbers. See further details here.