A Multi-Channel Algorithm for Mapping Volcanic Thermal Anomalies by Means of Sentinel-2 MSI and Landsat-8 OLI Data

 , ,
, ,  , , and
Abstract
:
1. Introduction
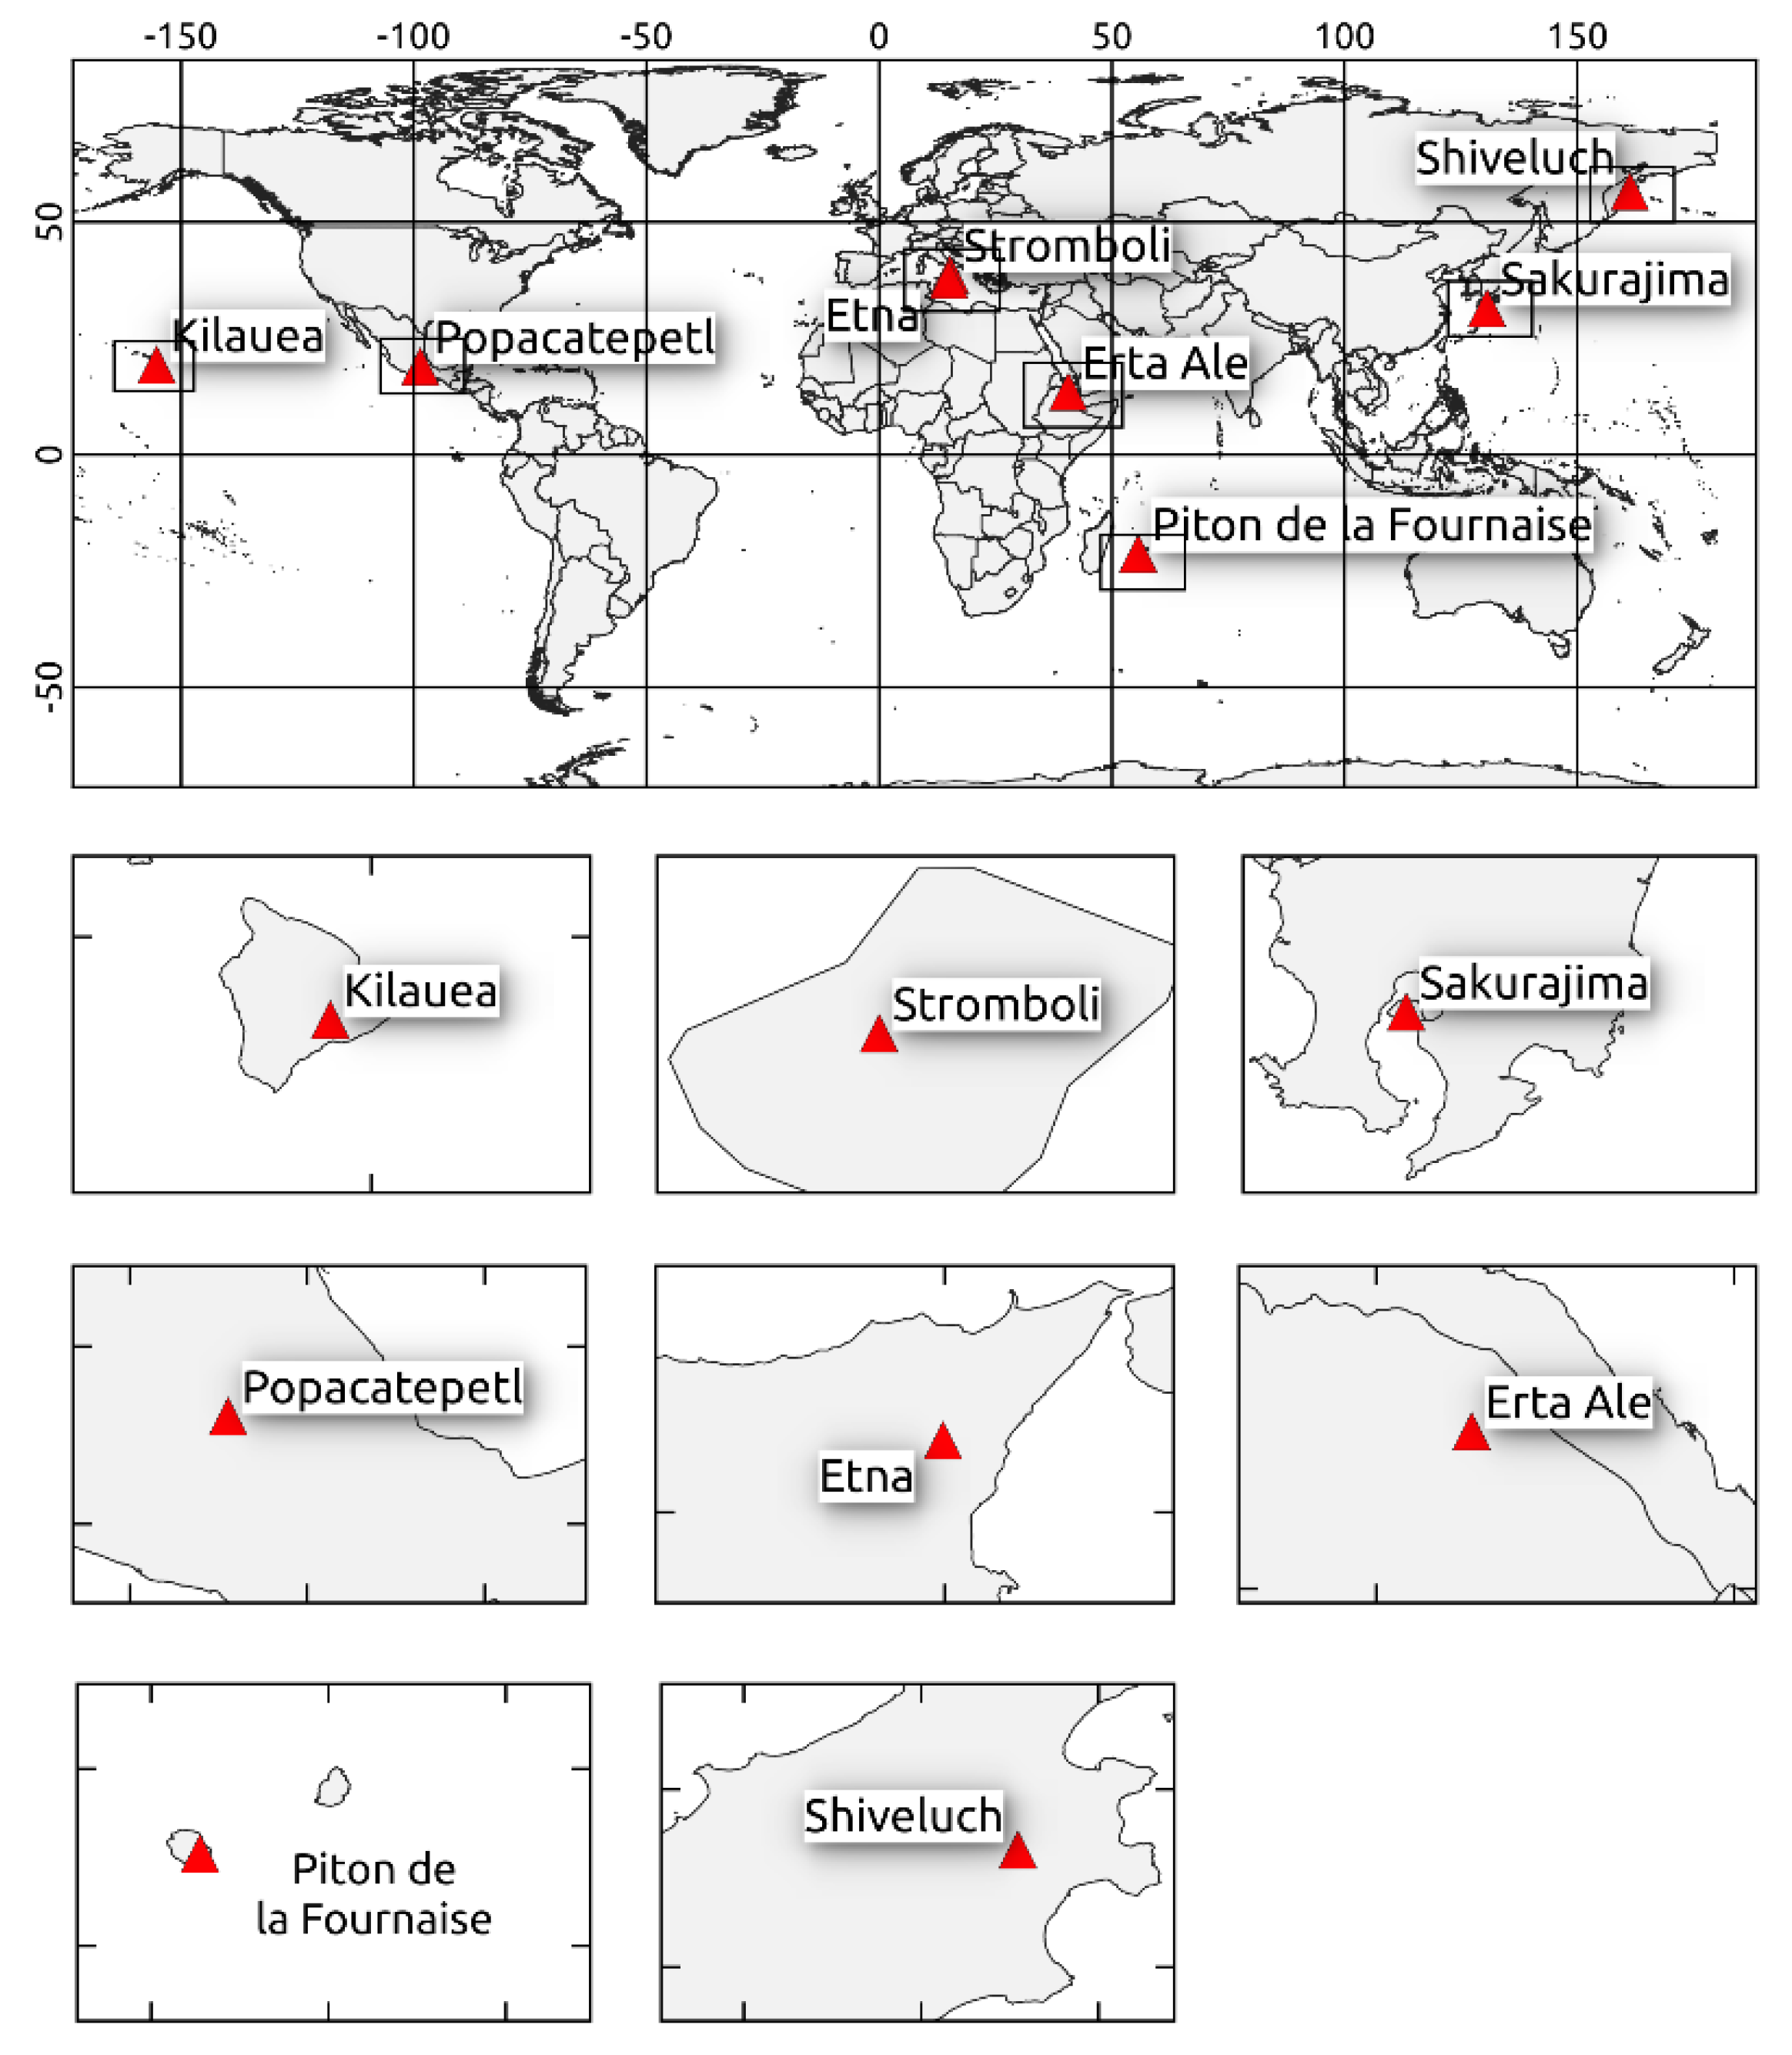
2. Test Cases
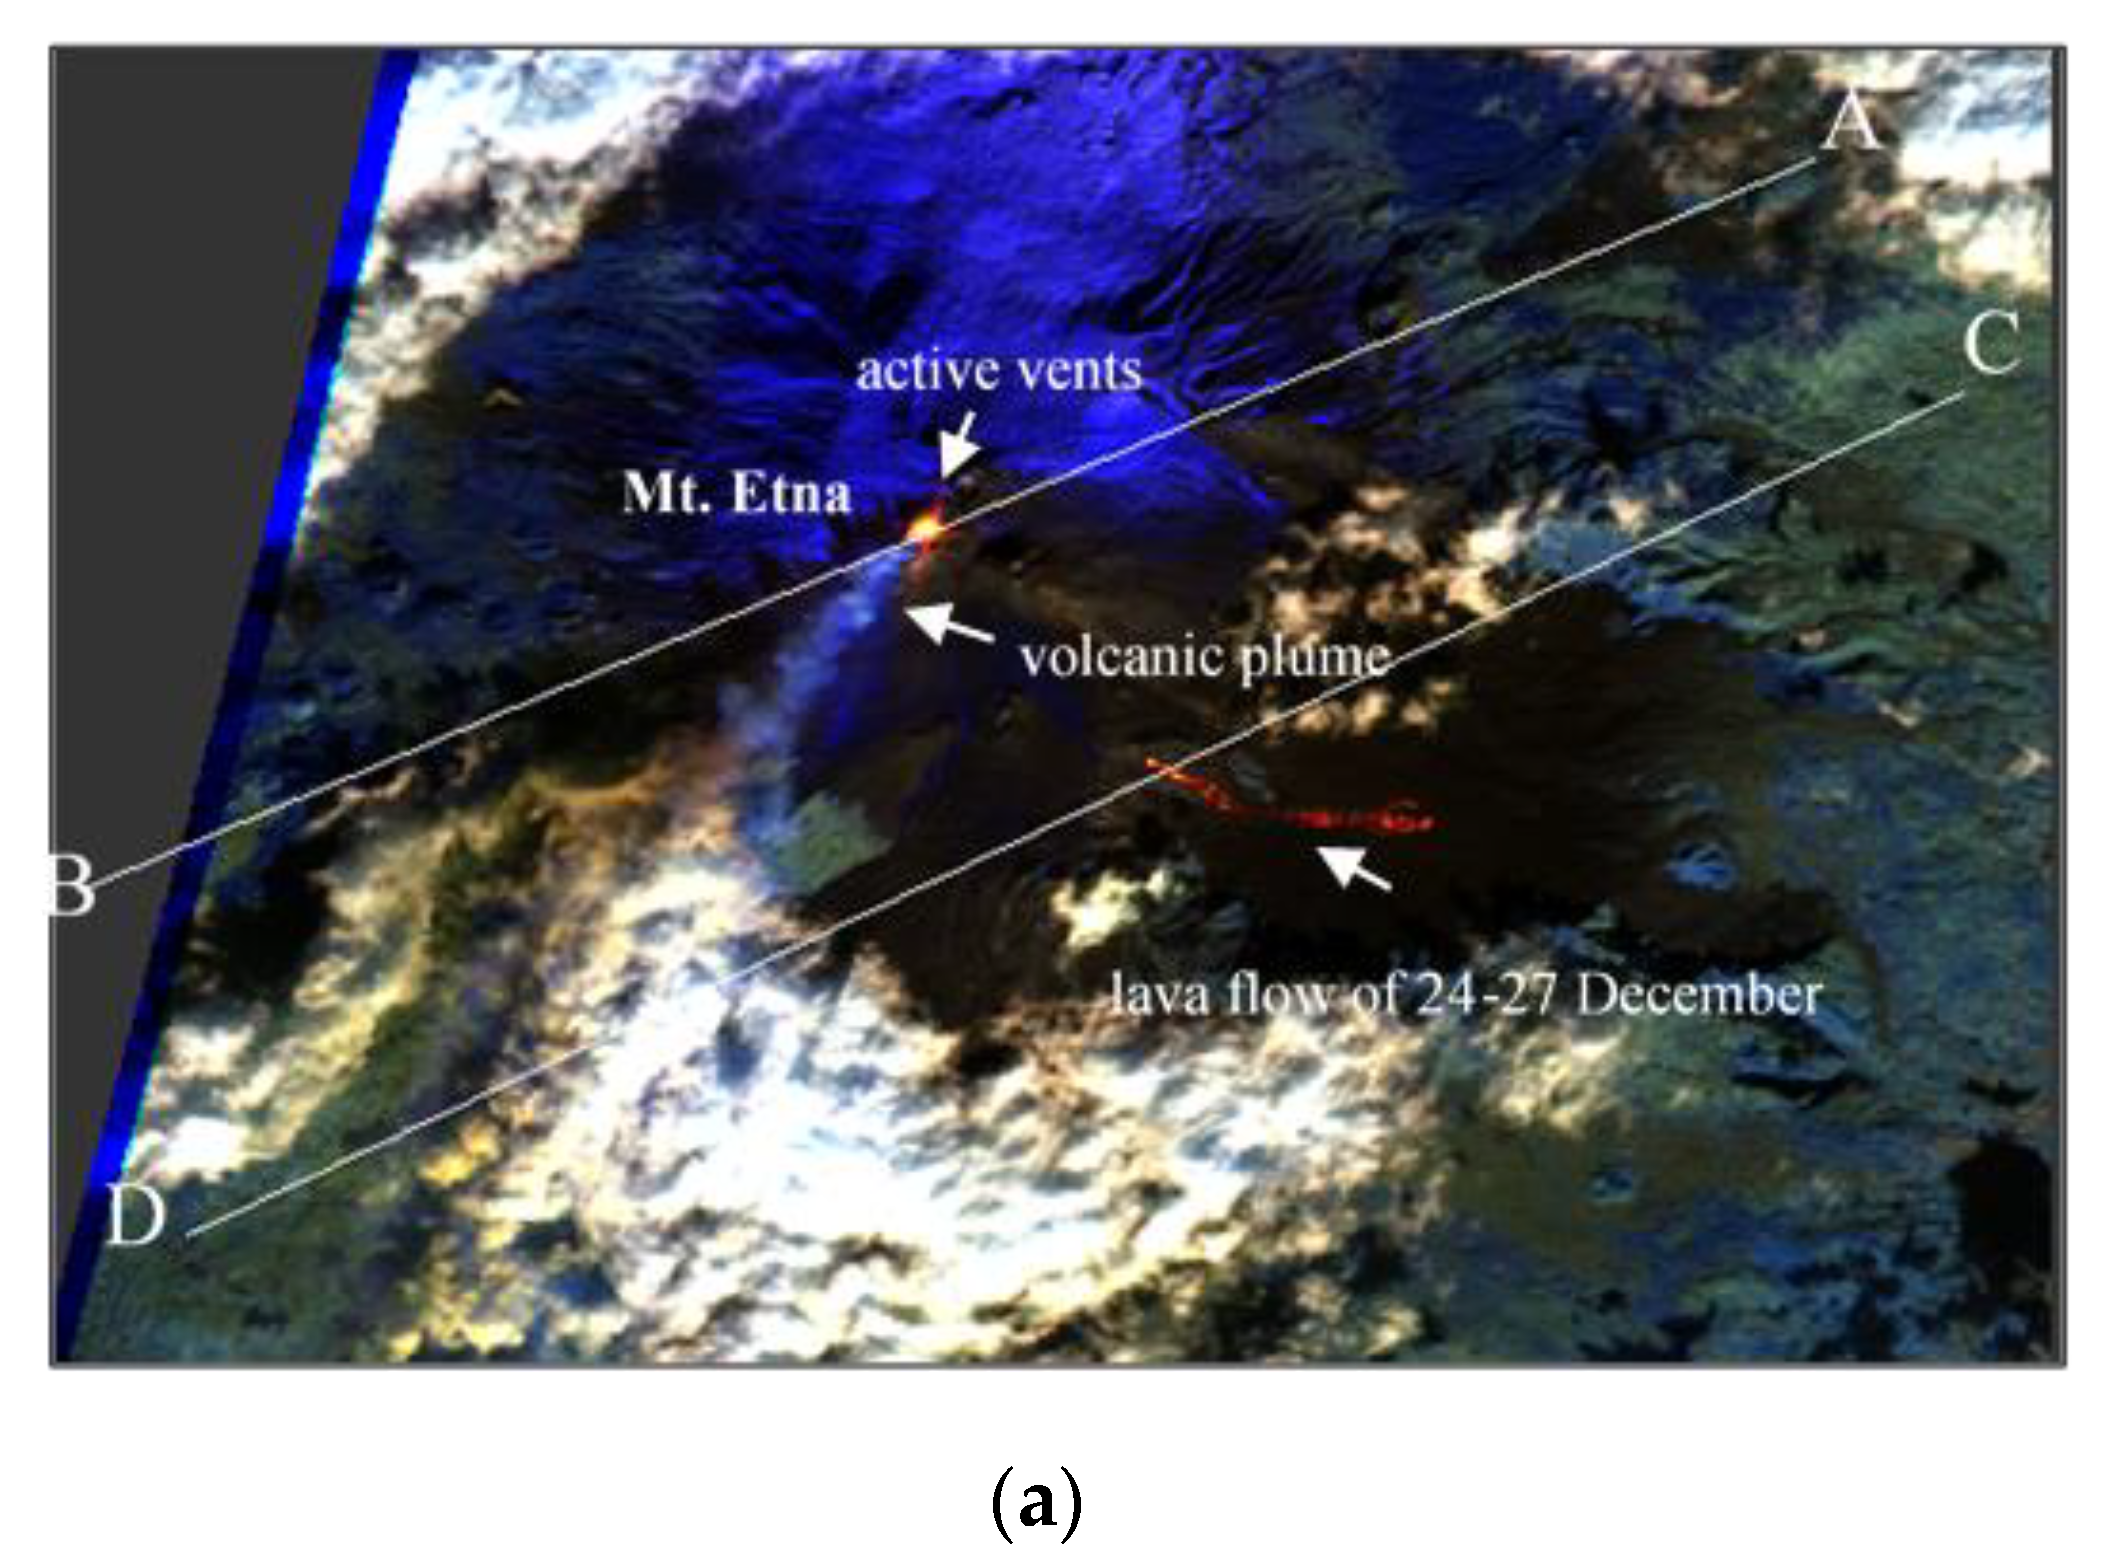
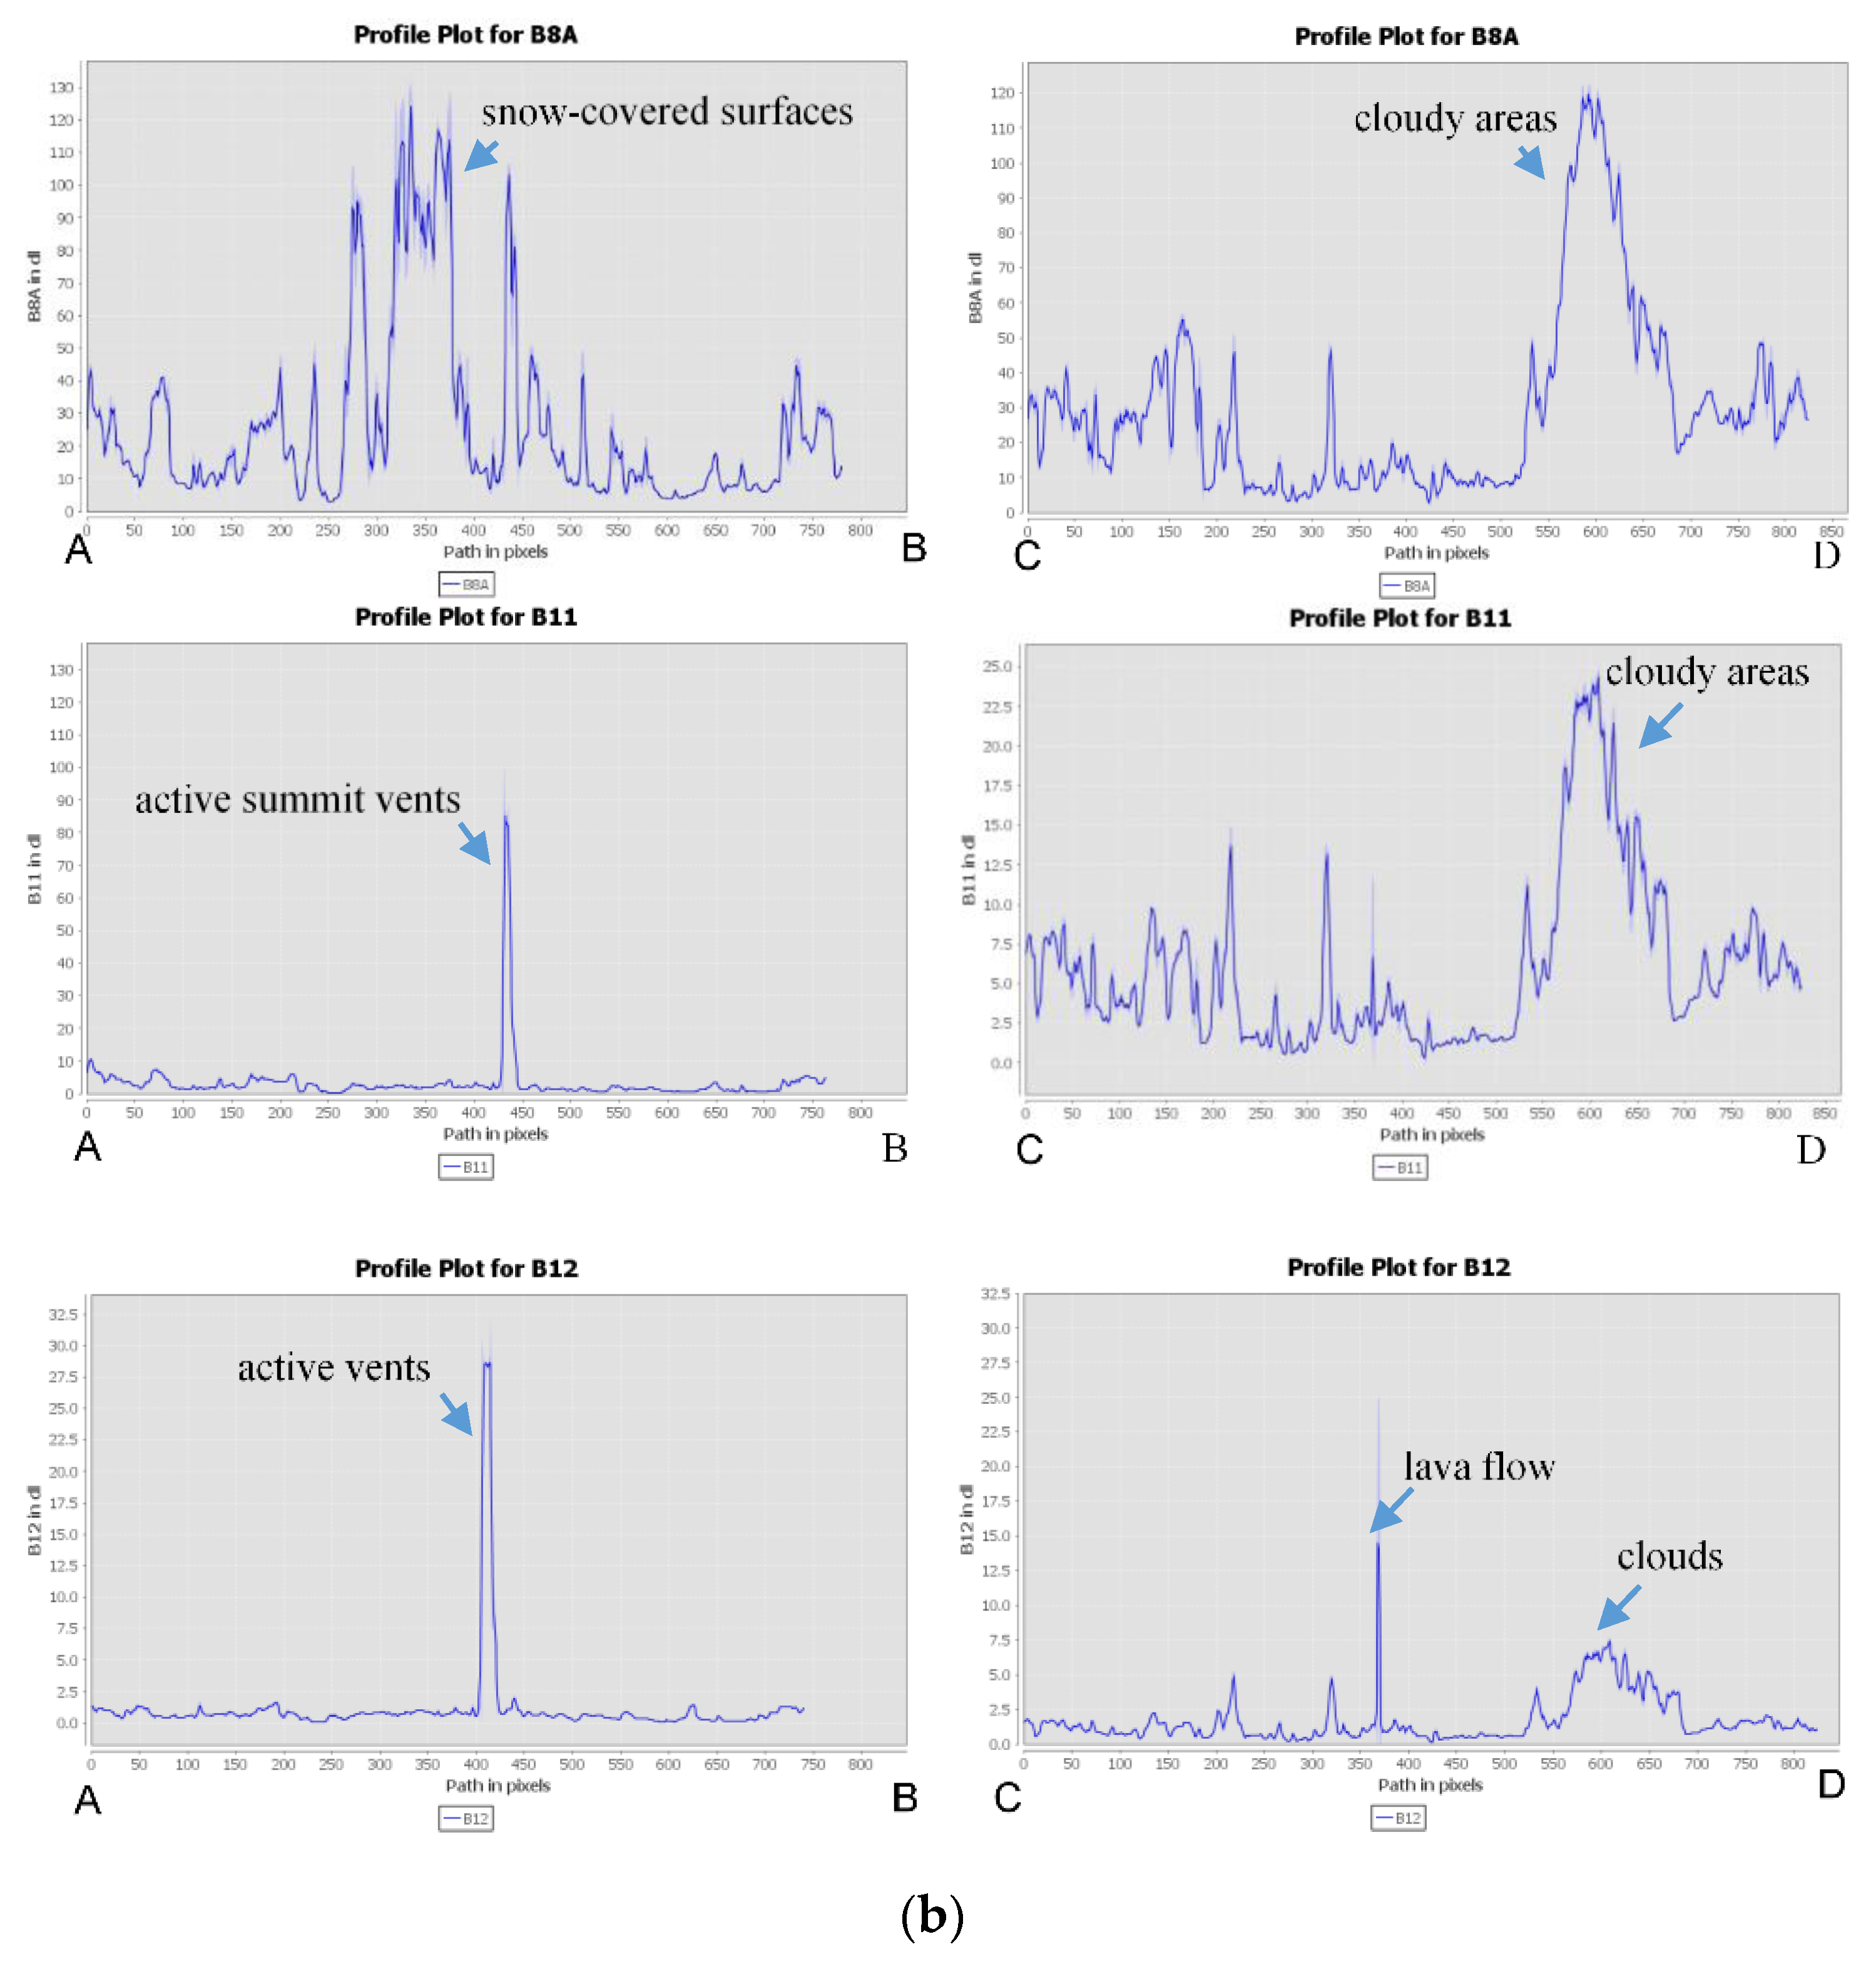
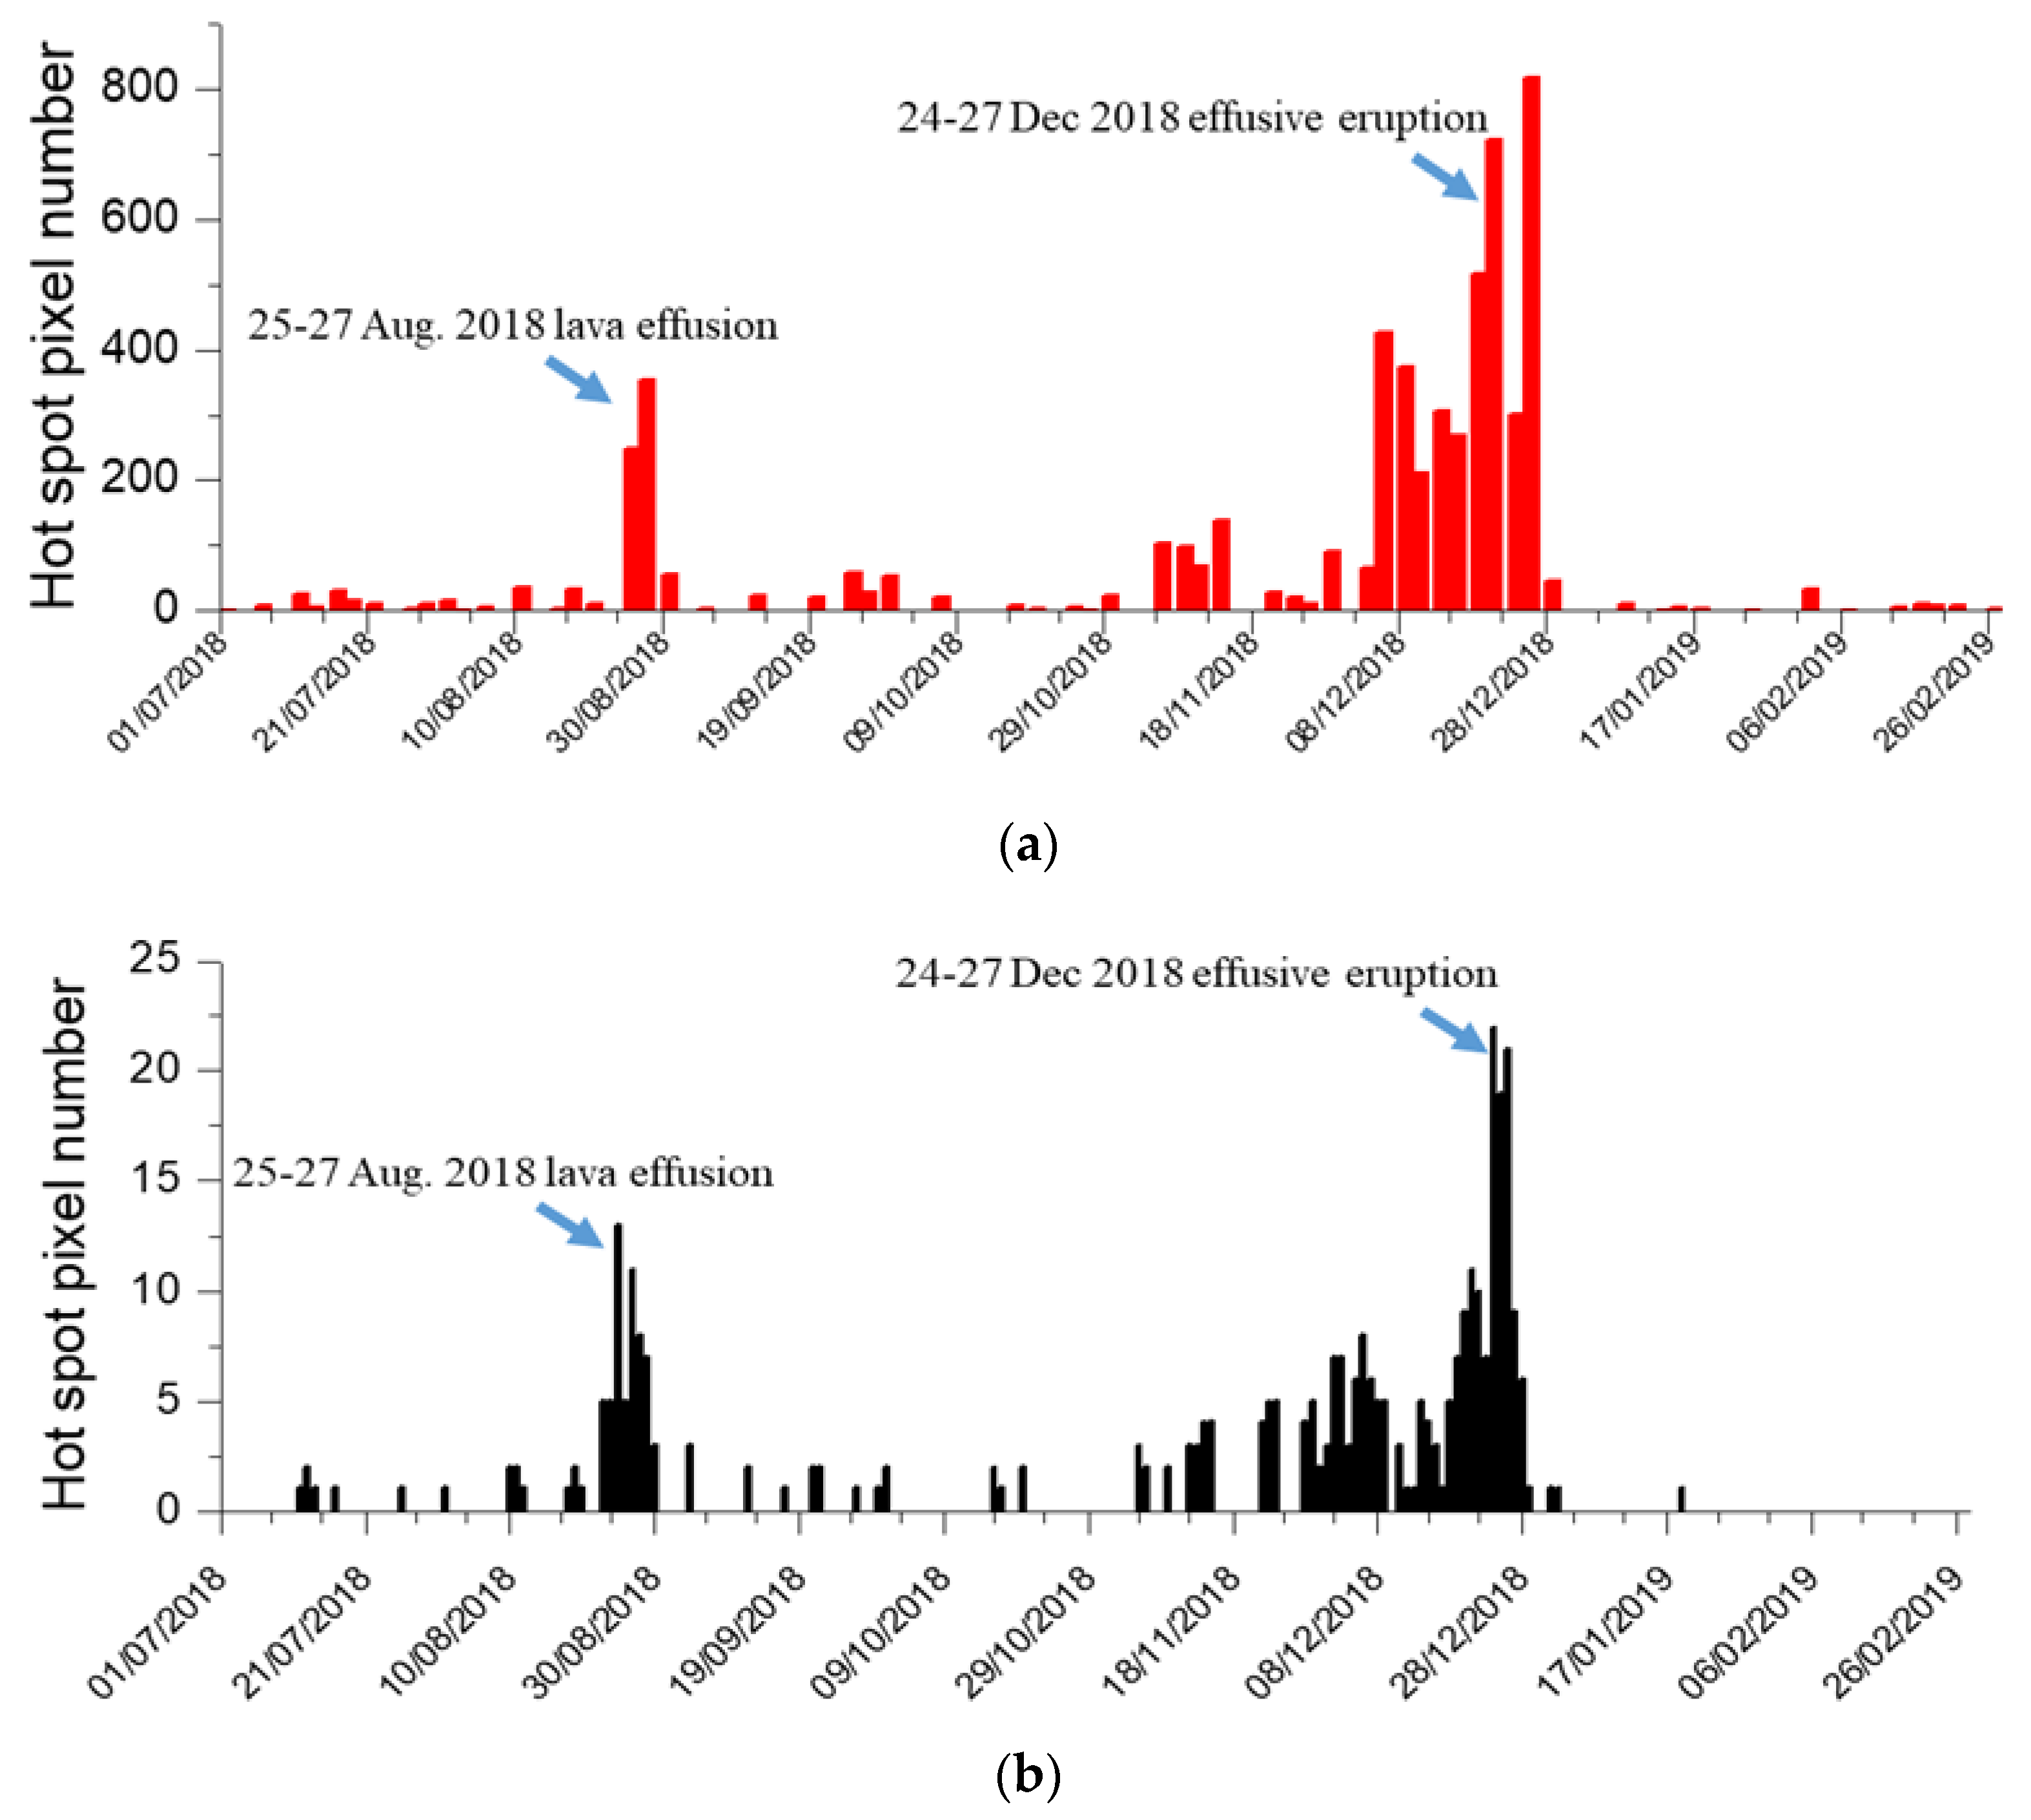
2.1. Mt. Etna Eruptive Events of July 2018–February 2019
2.2. Eruptive Events of Stromboli (Italy) Volcano of March–June 2019
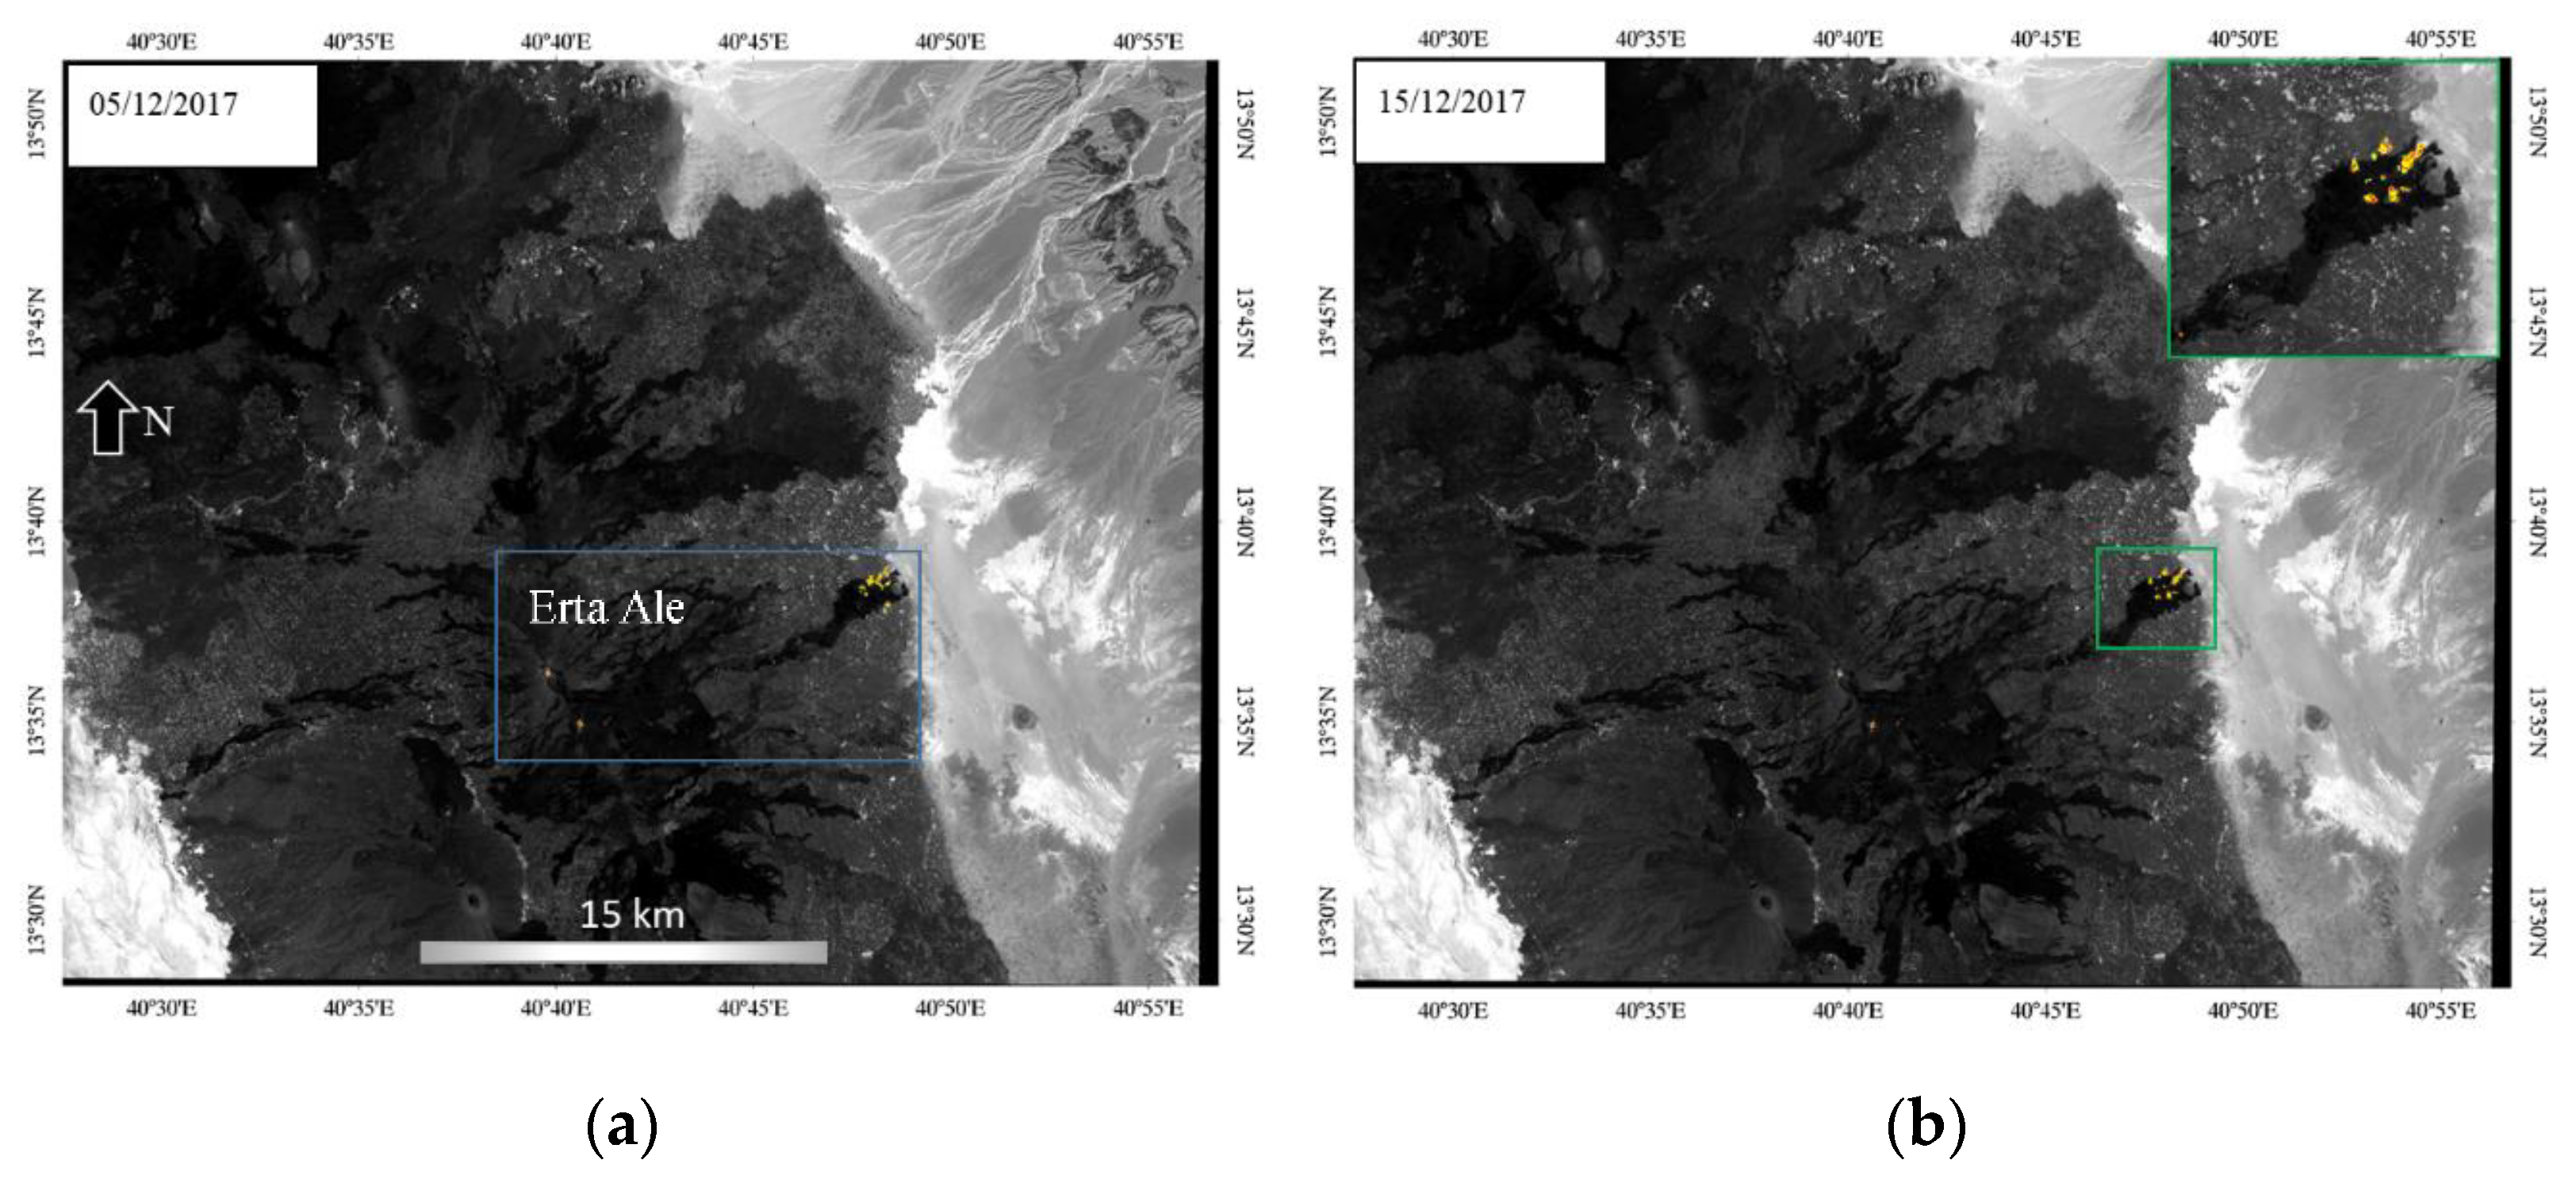
2.3. Erta Ale (Africa) Eruptions of 2017
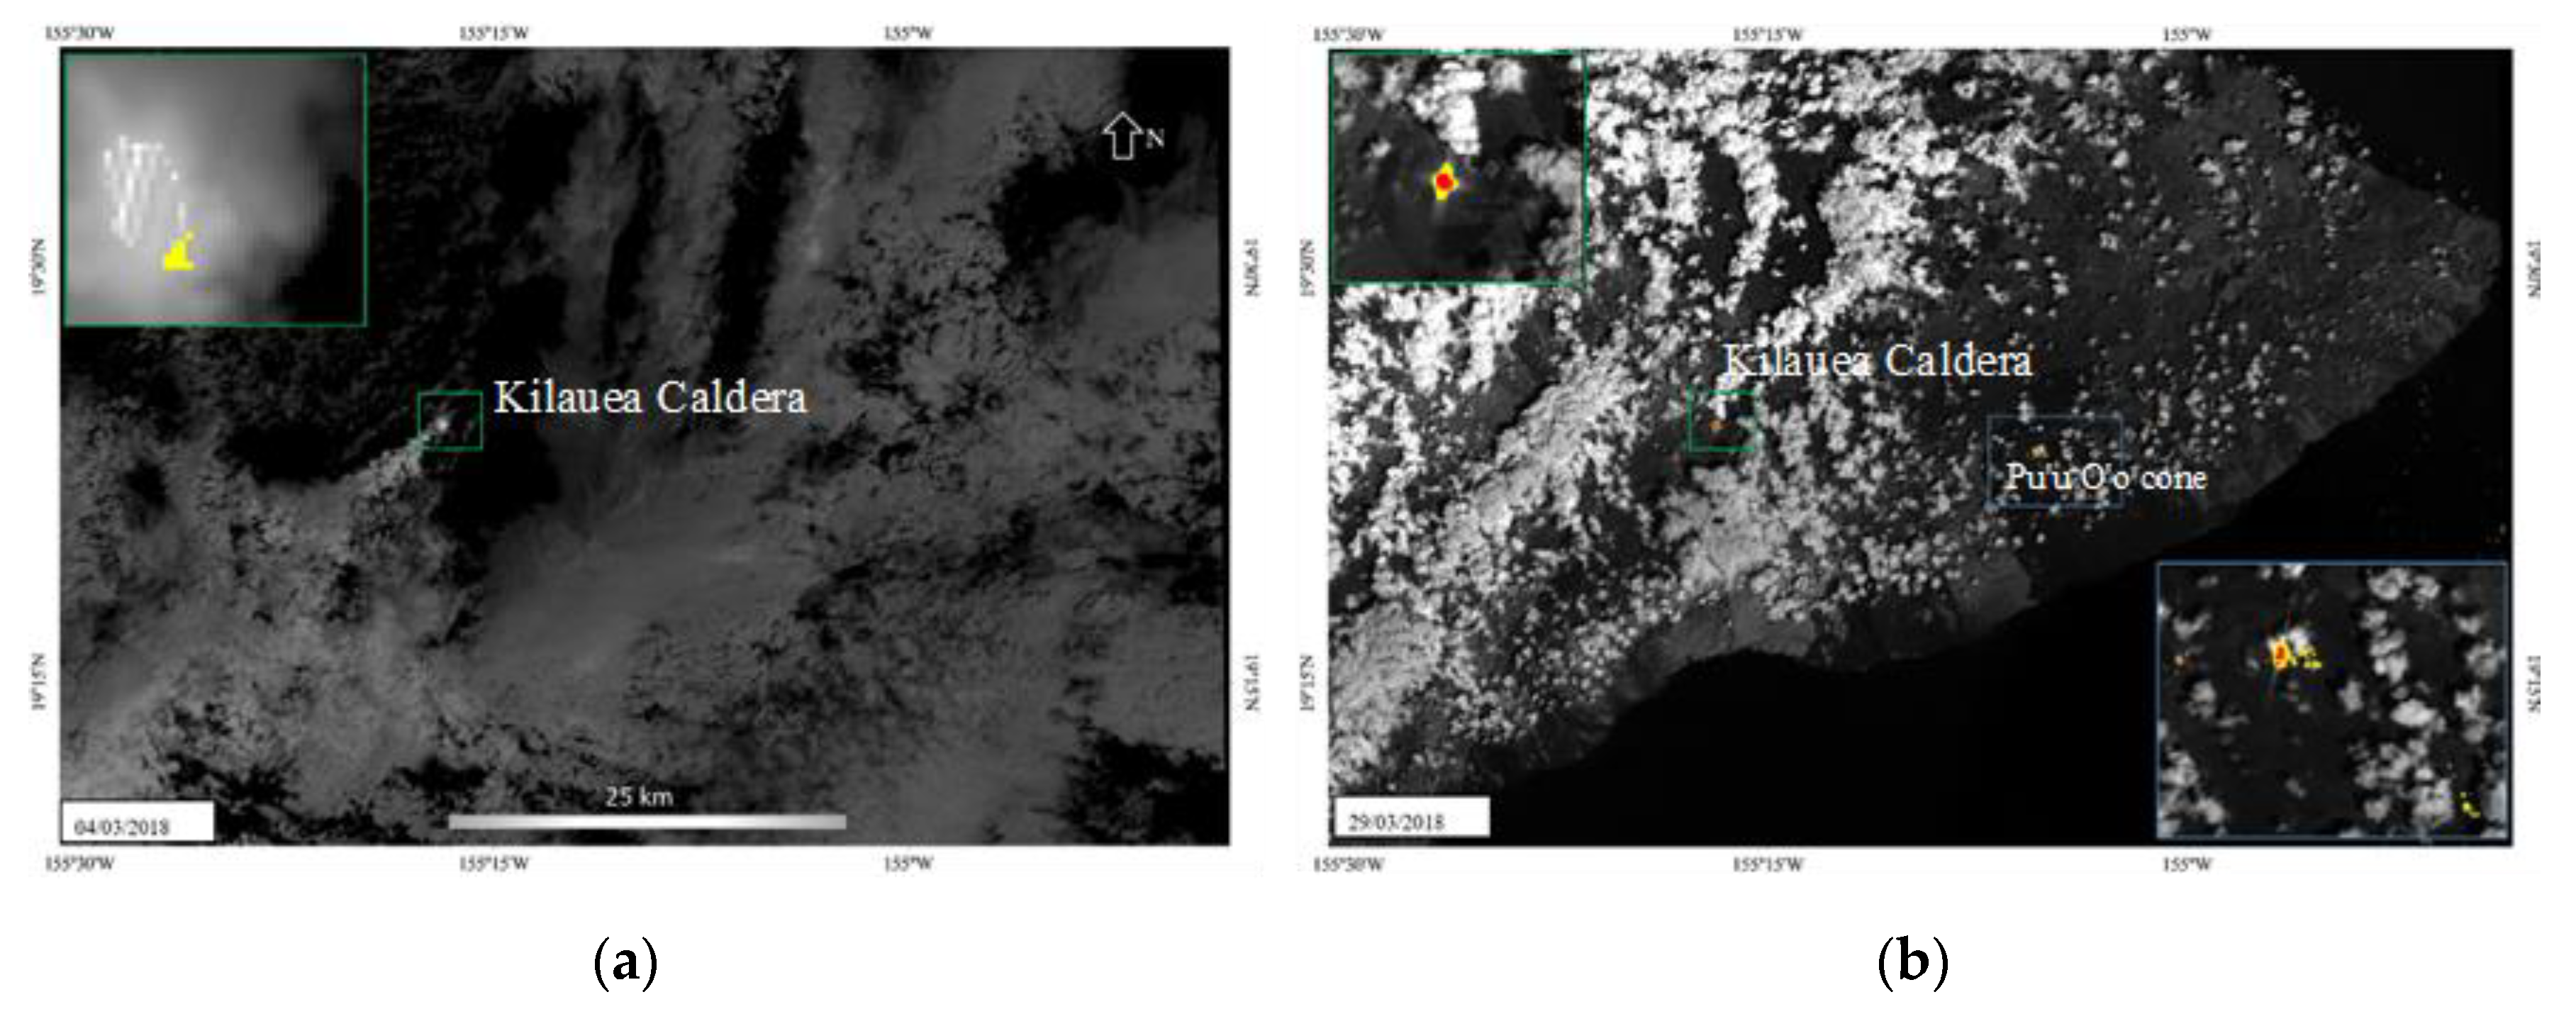
2.4. Kilauea (Hawaii) Eruptive Activity of March 2018
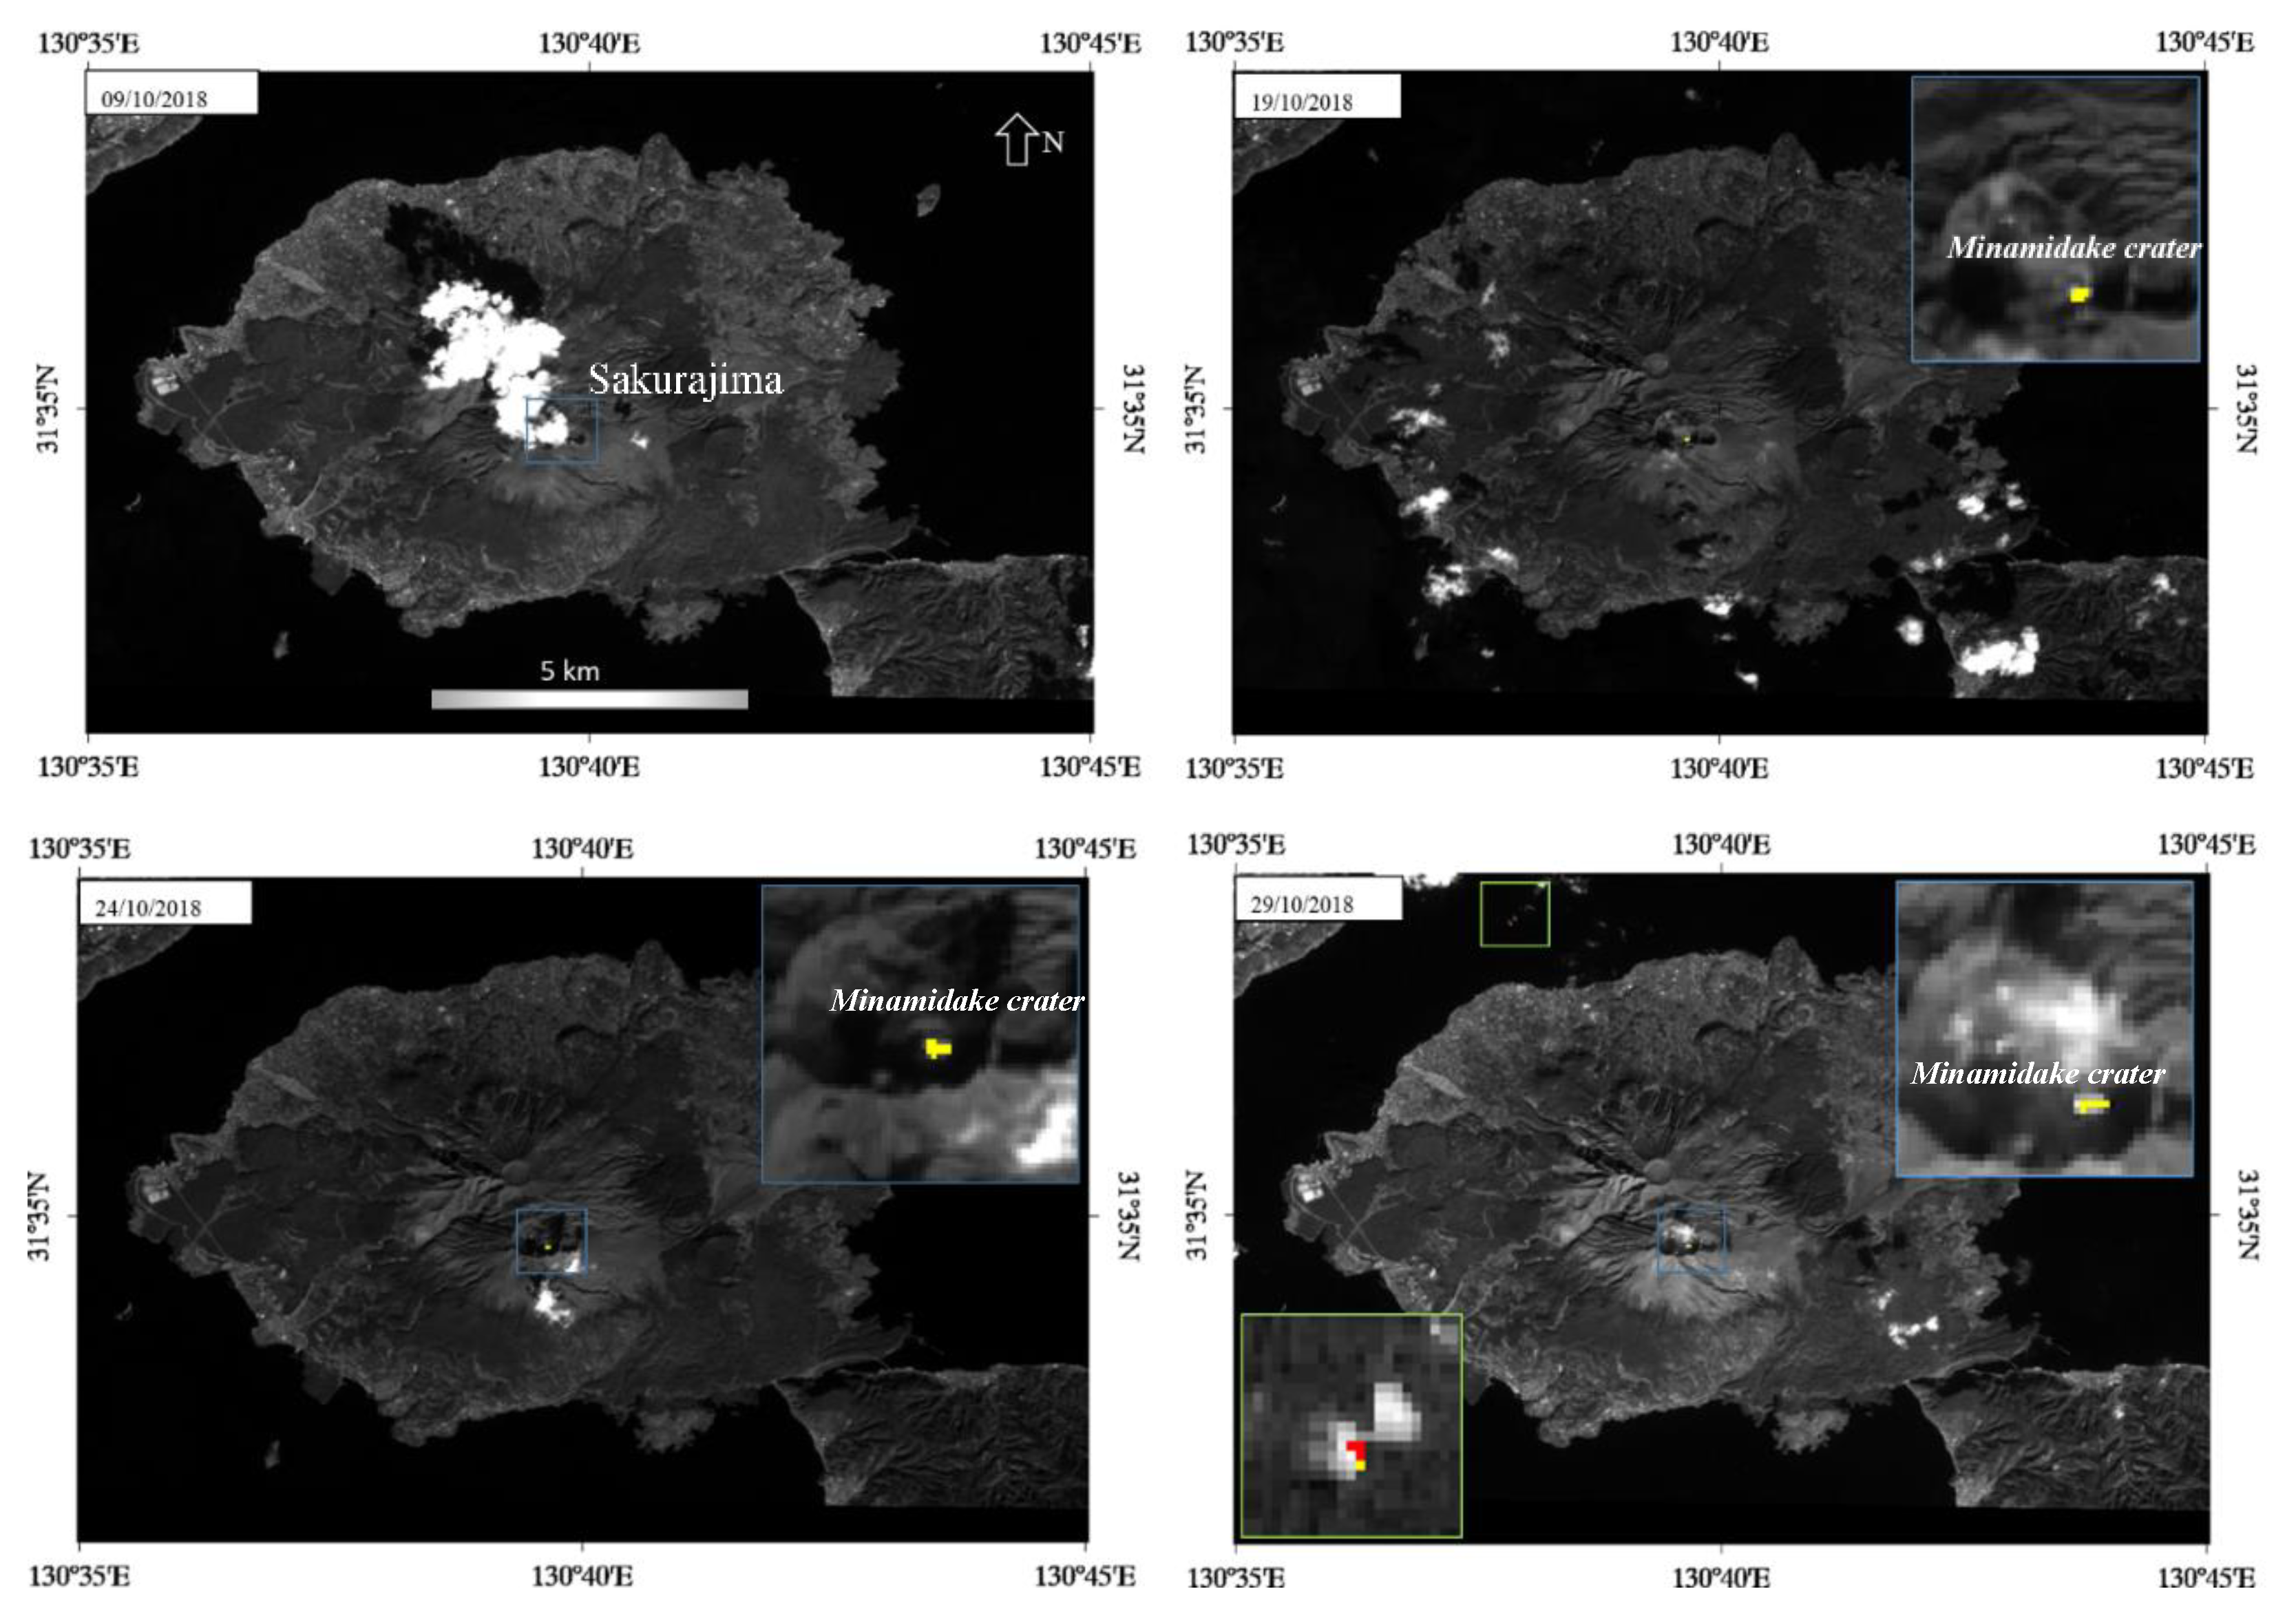
2.5. Sakurajima (Japan) Eruptive Events of September–October 2018
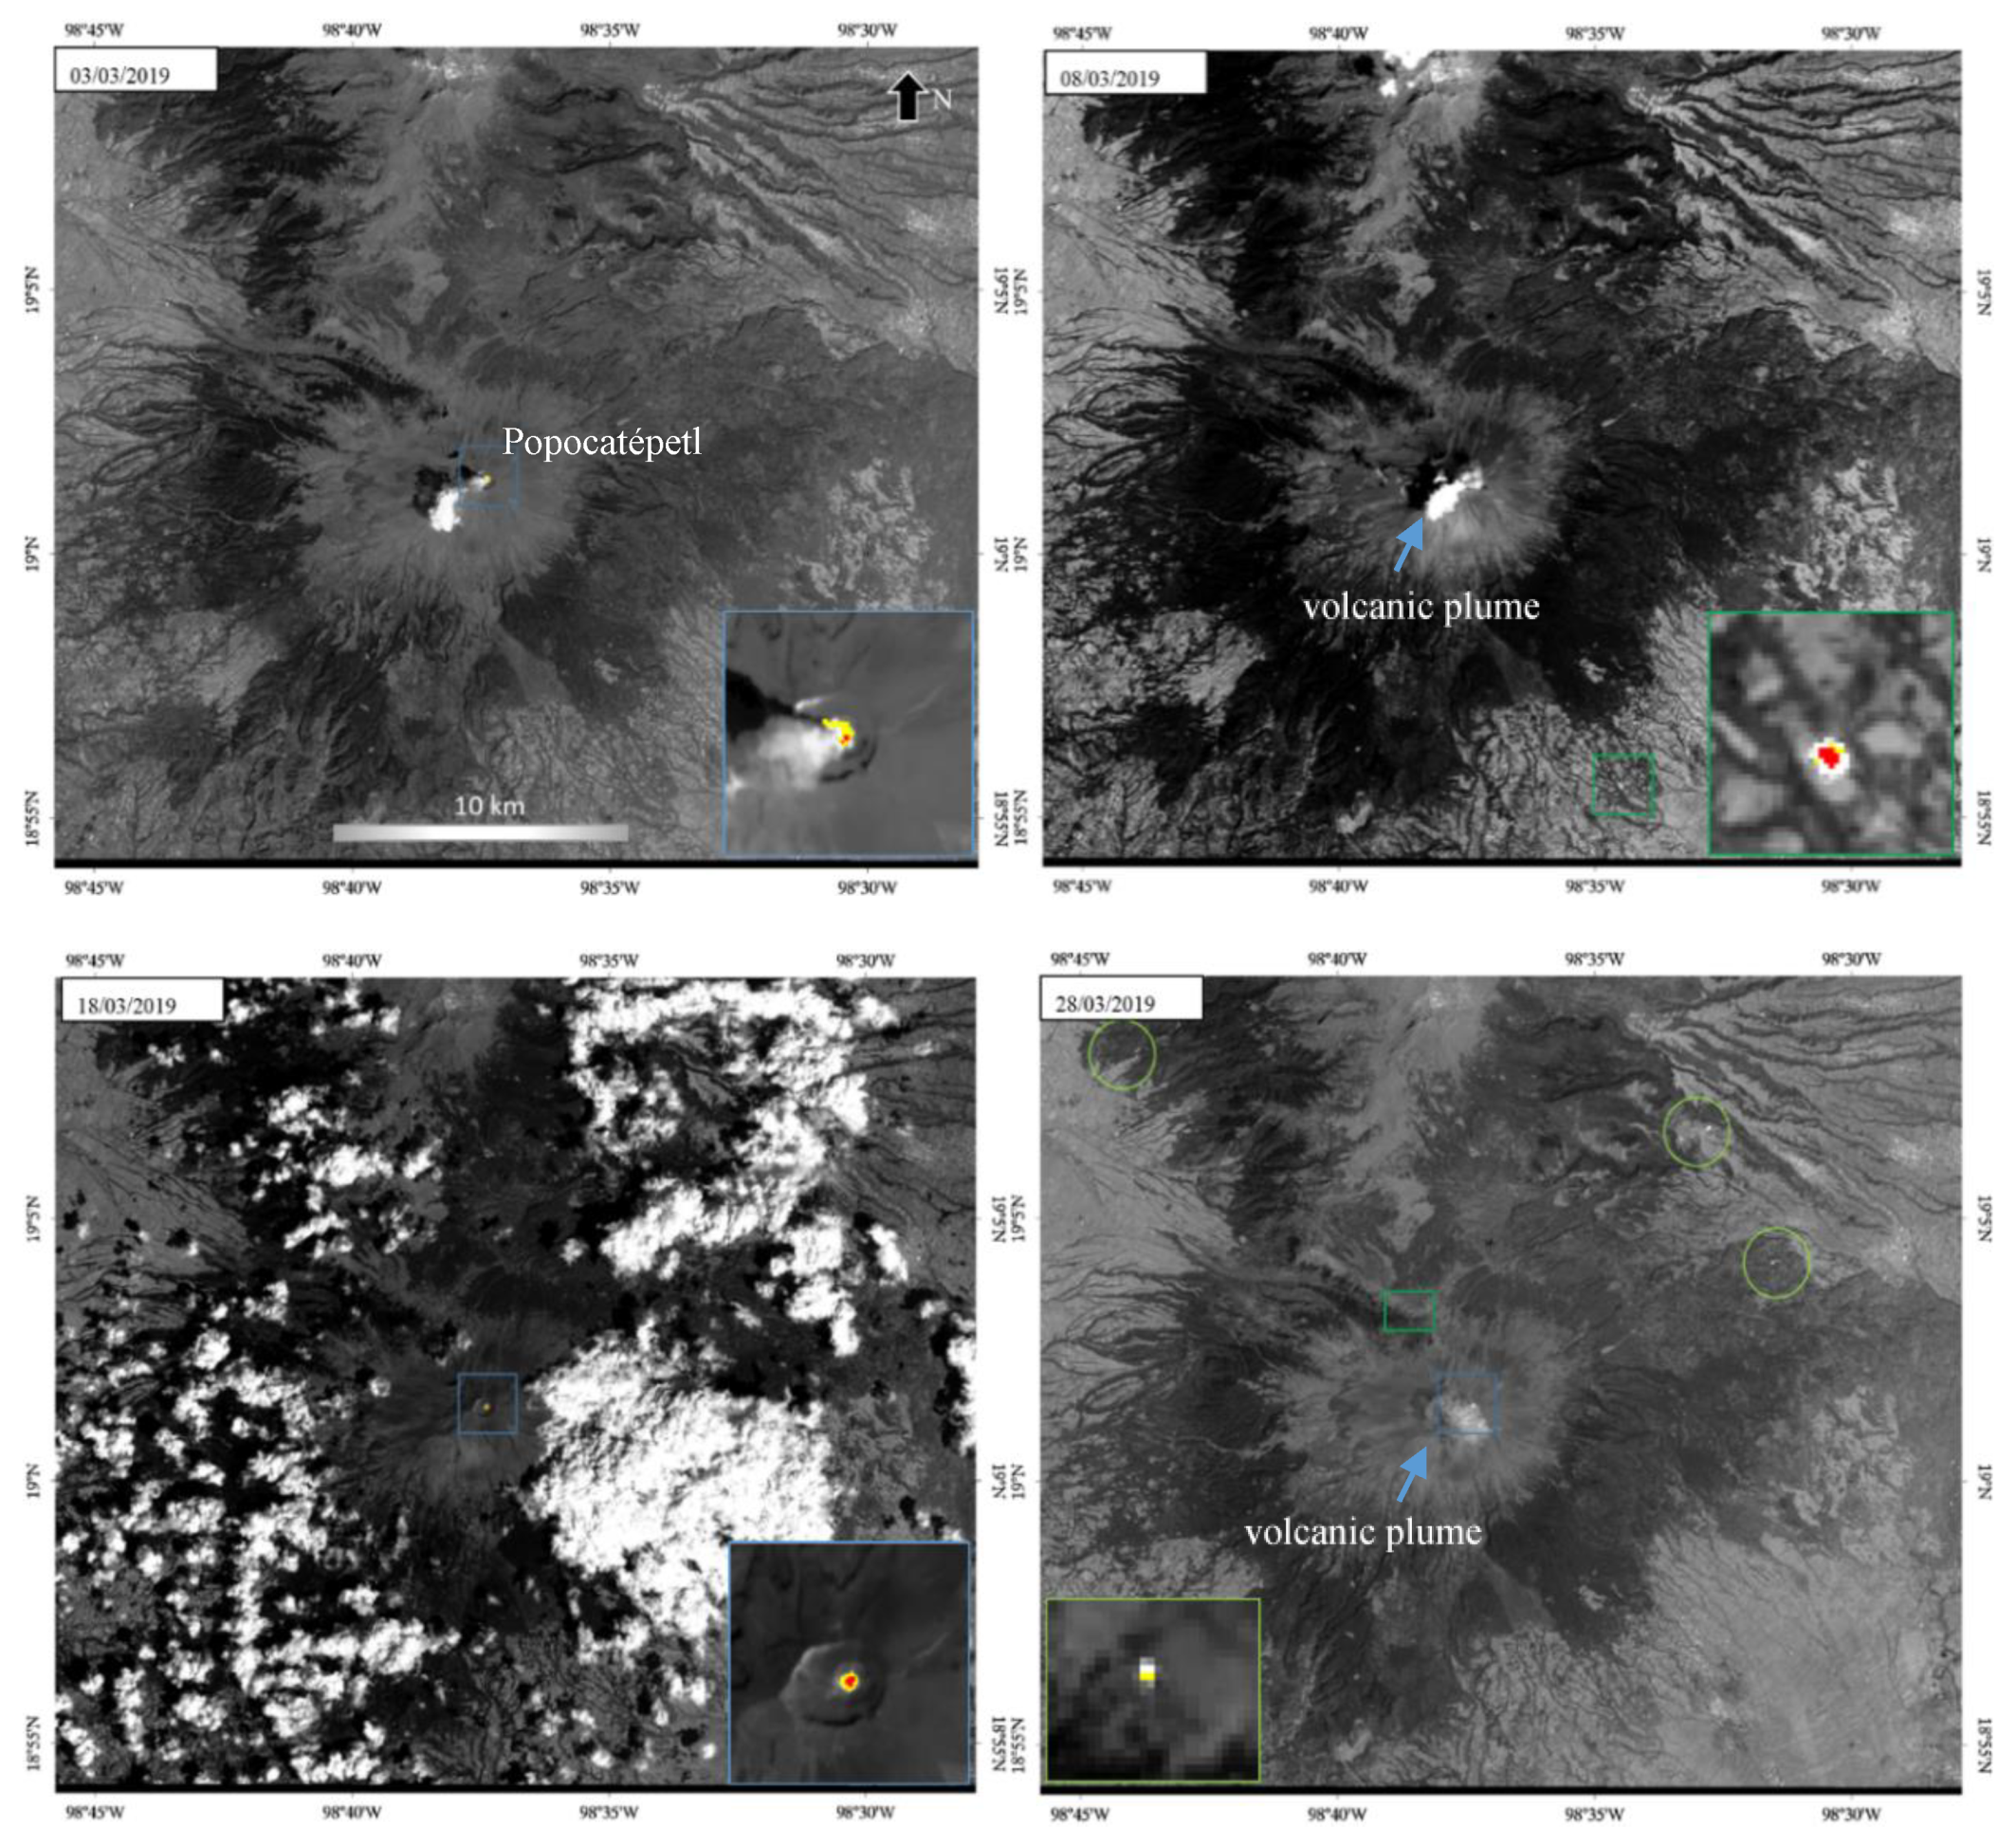
2.6. Popocatepetl (Mexico) Eruptive Activity of March 2019
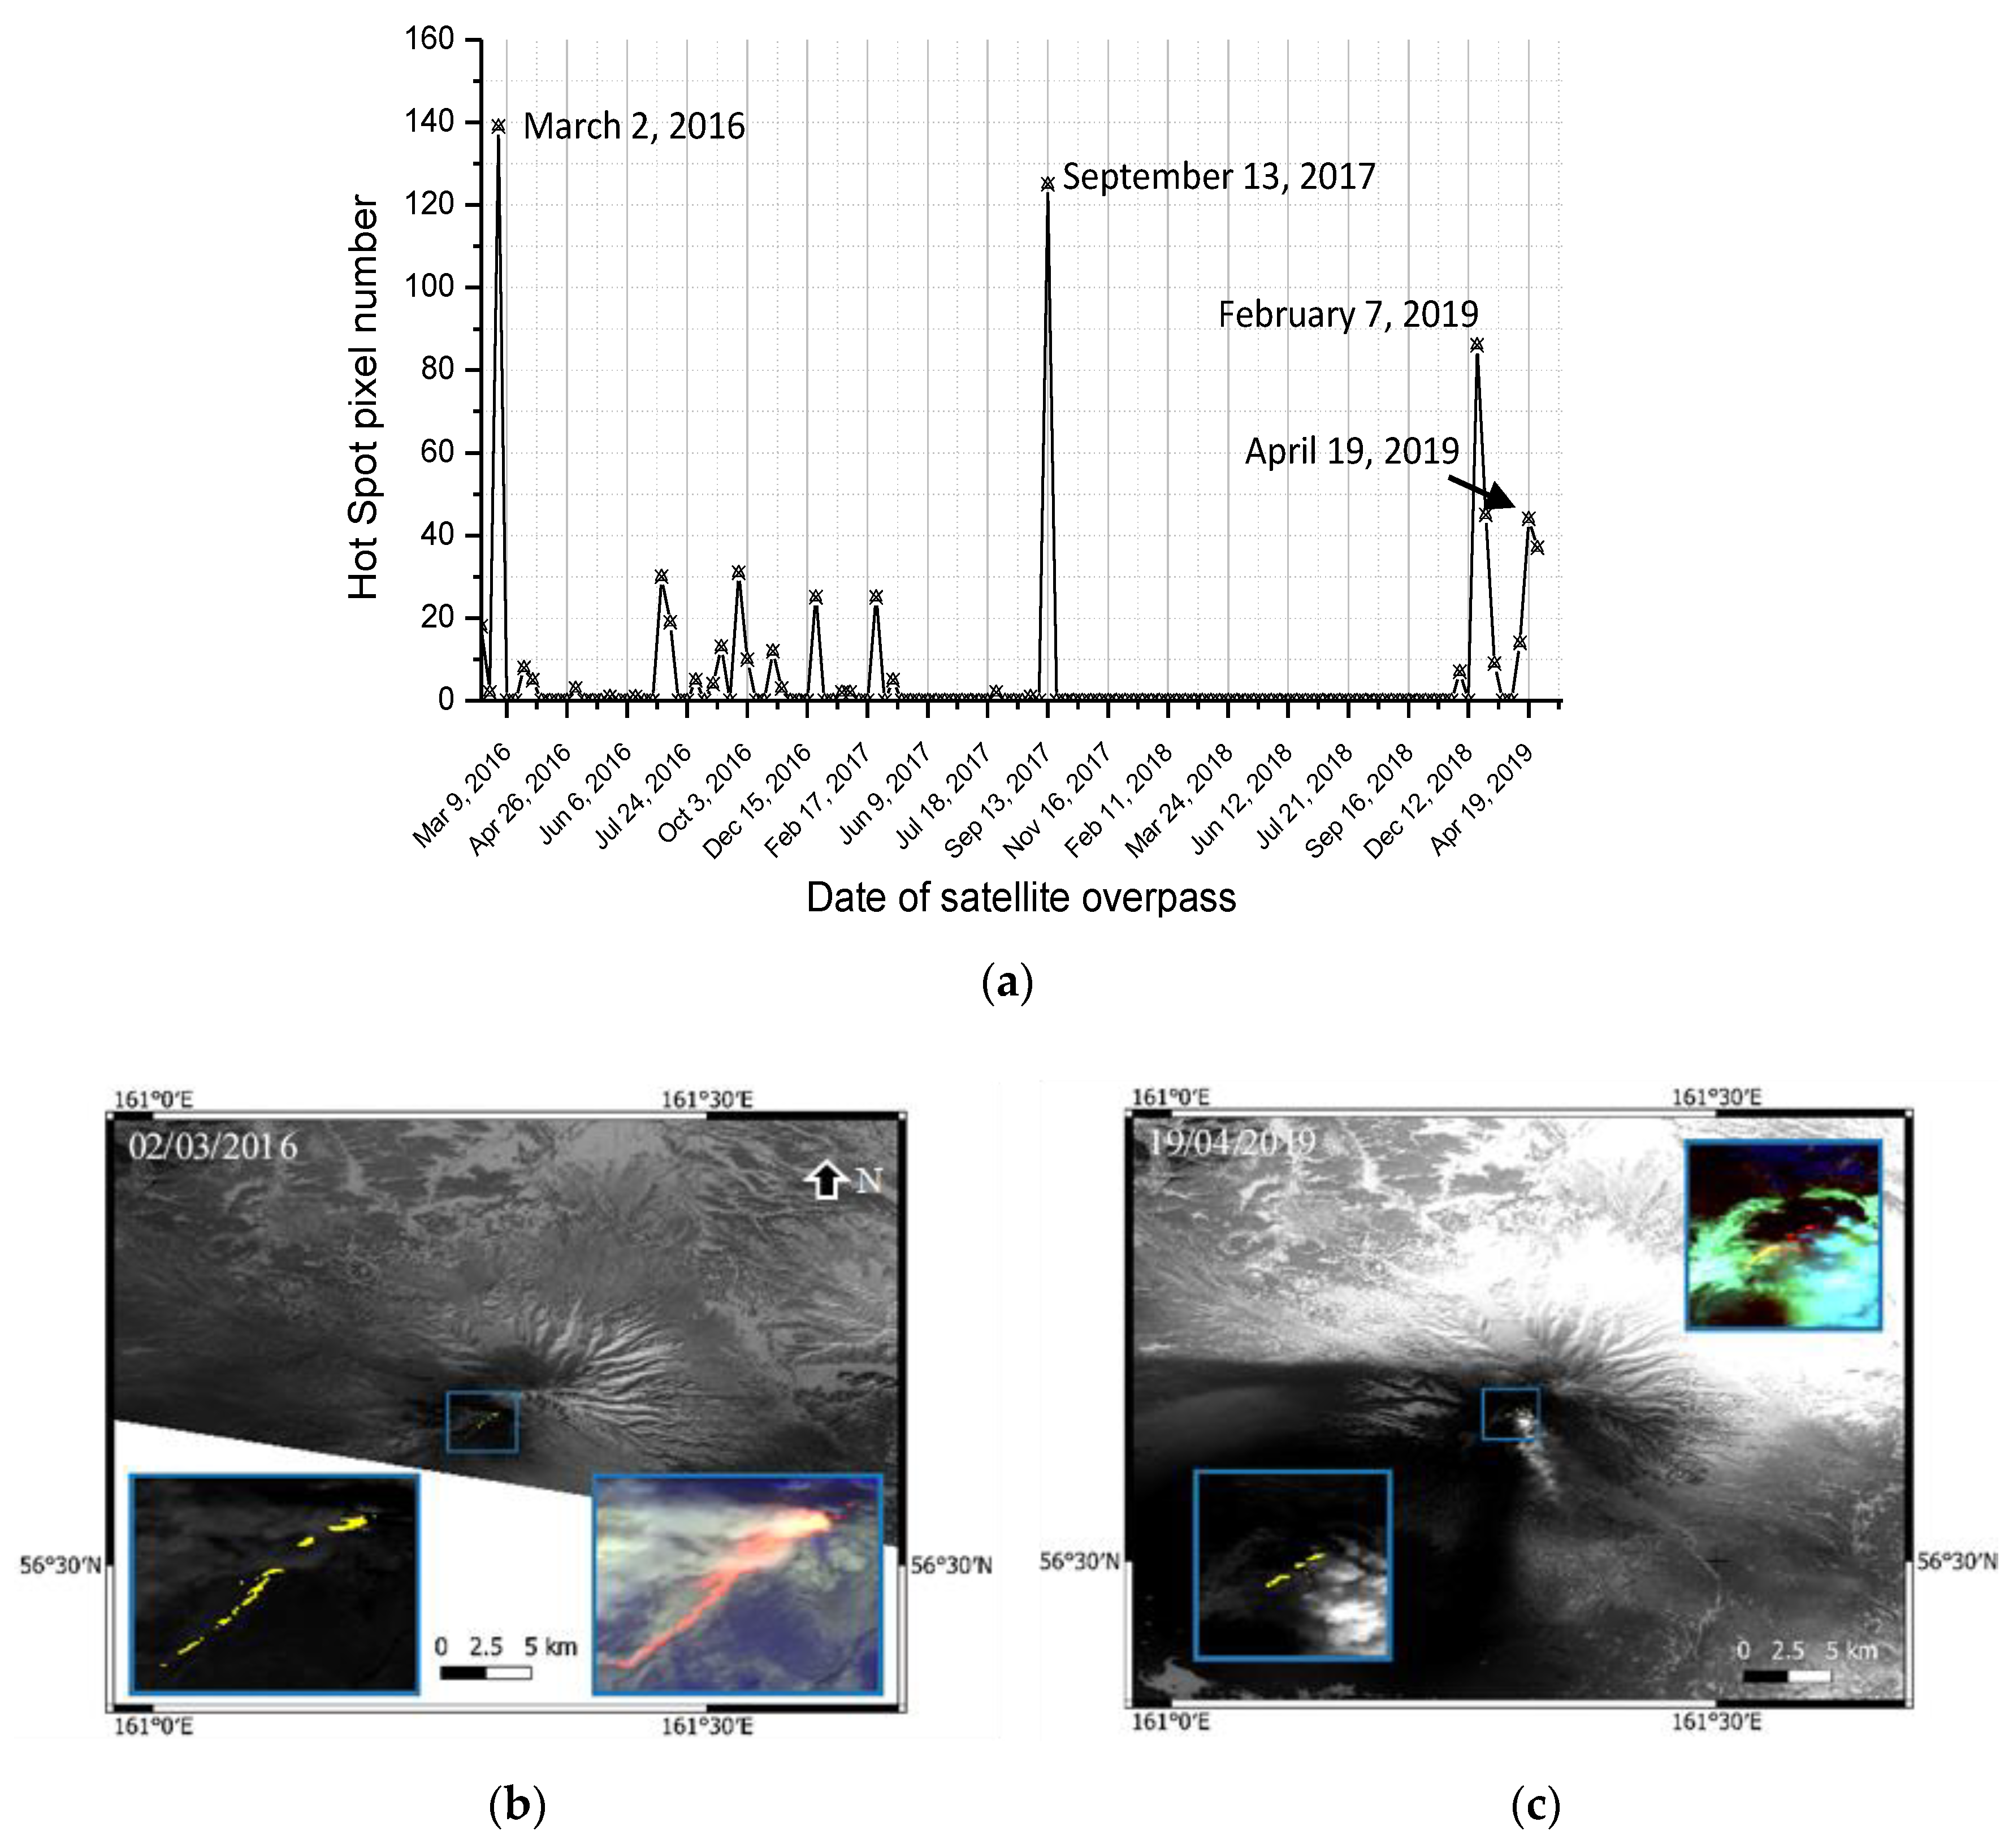
2.7. Shiveluch (Kamchatka) Activity of March 2016–April 2019
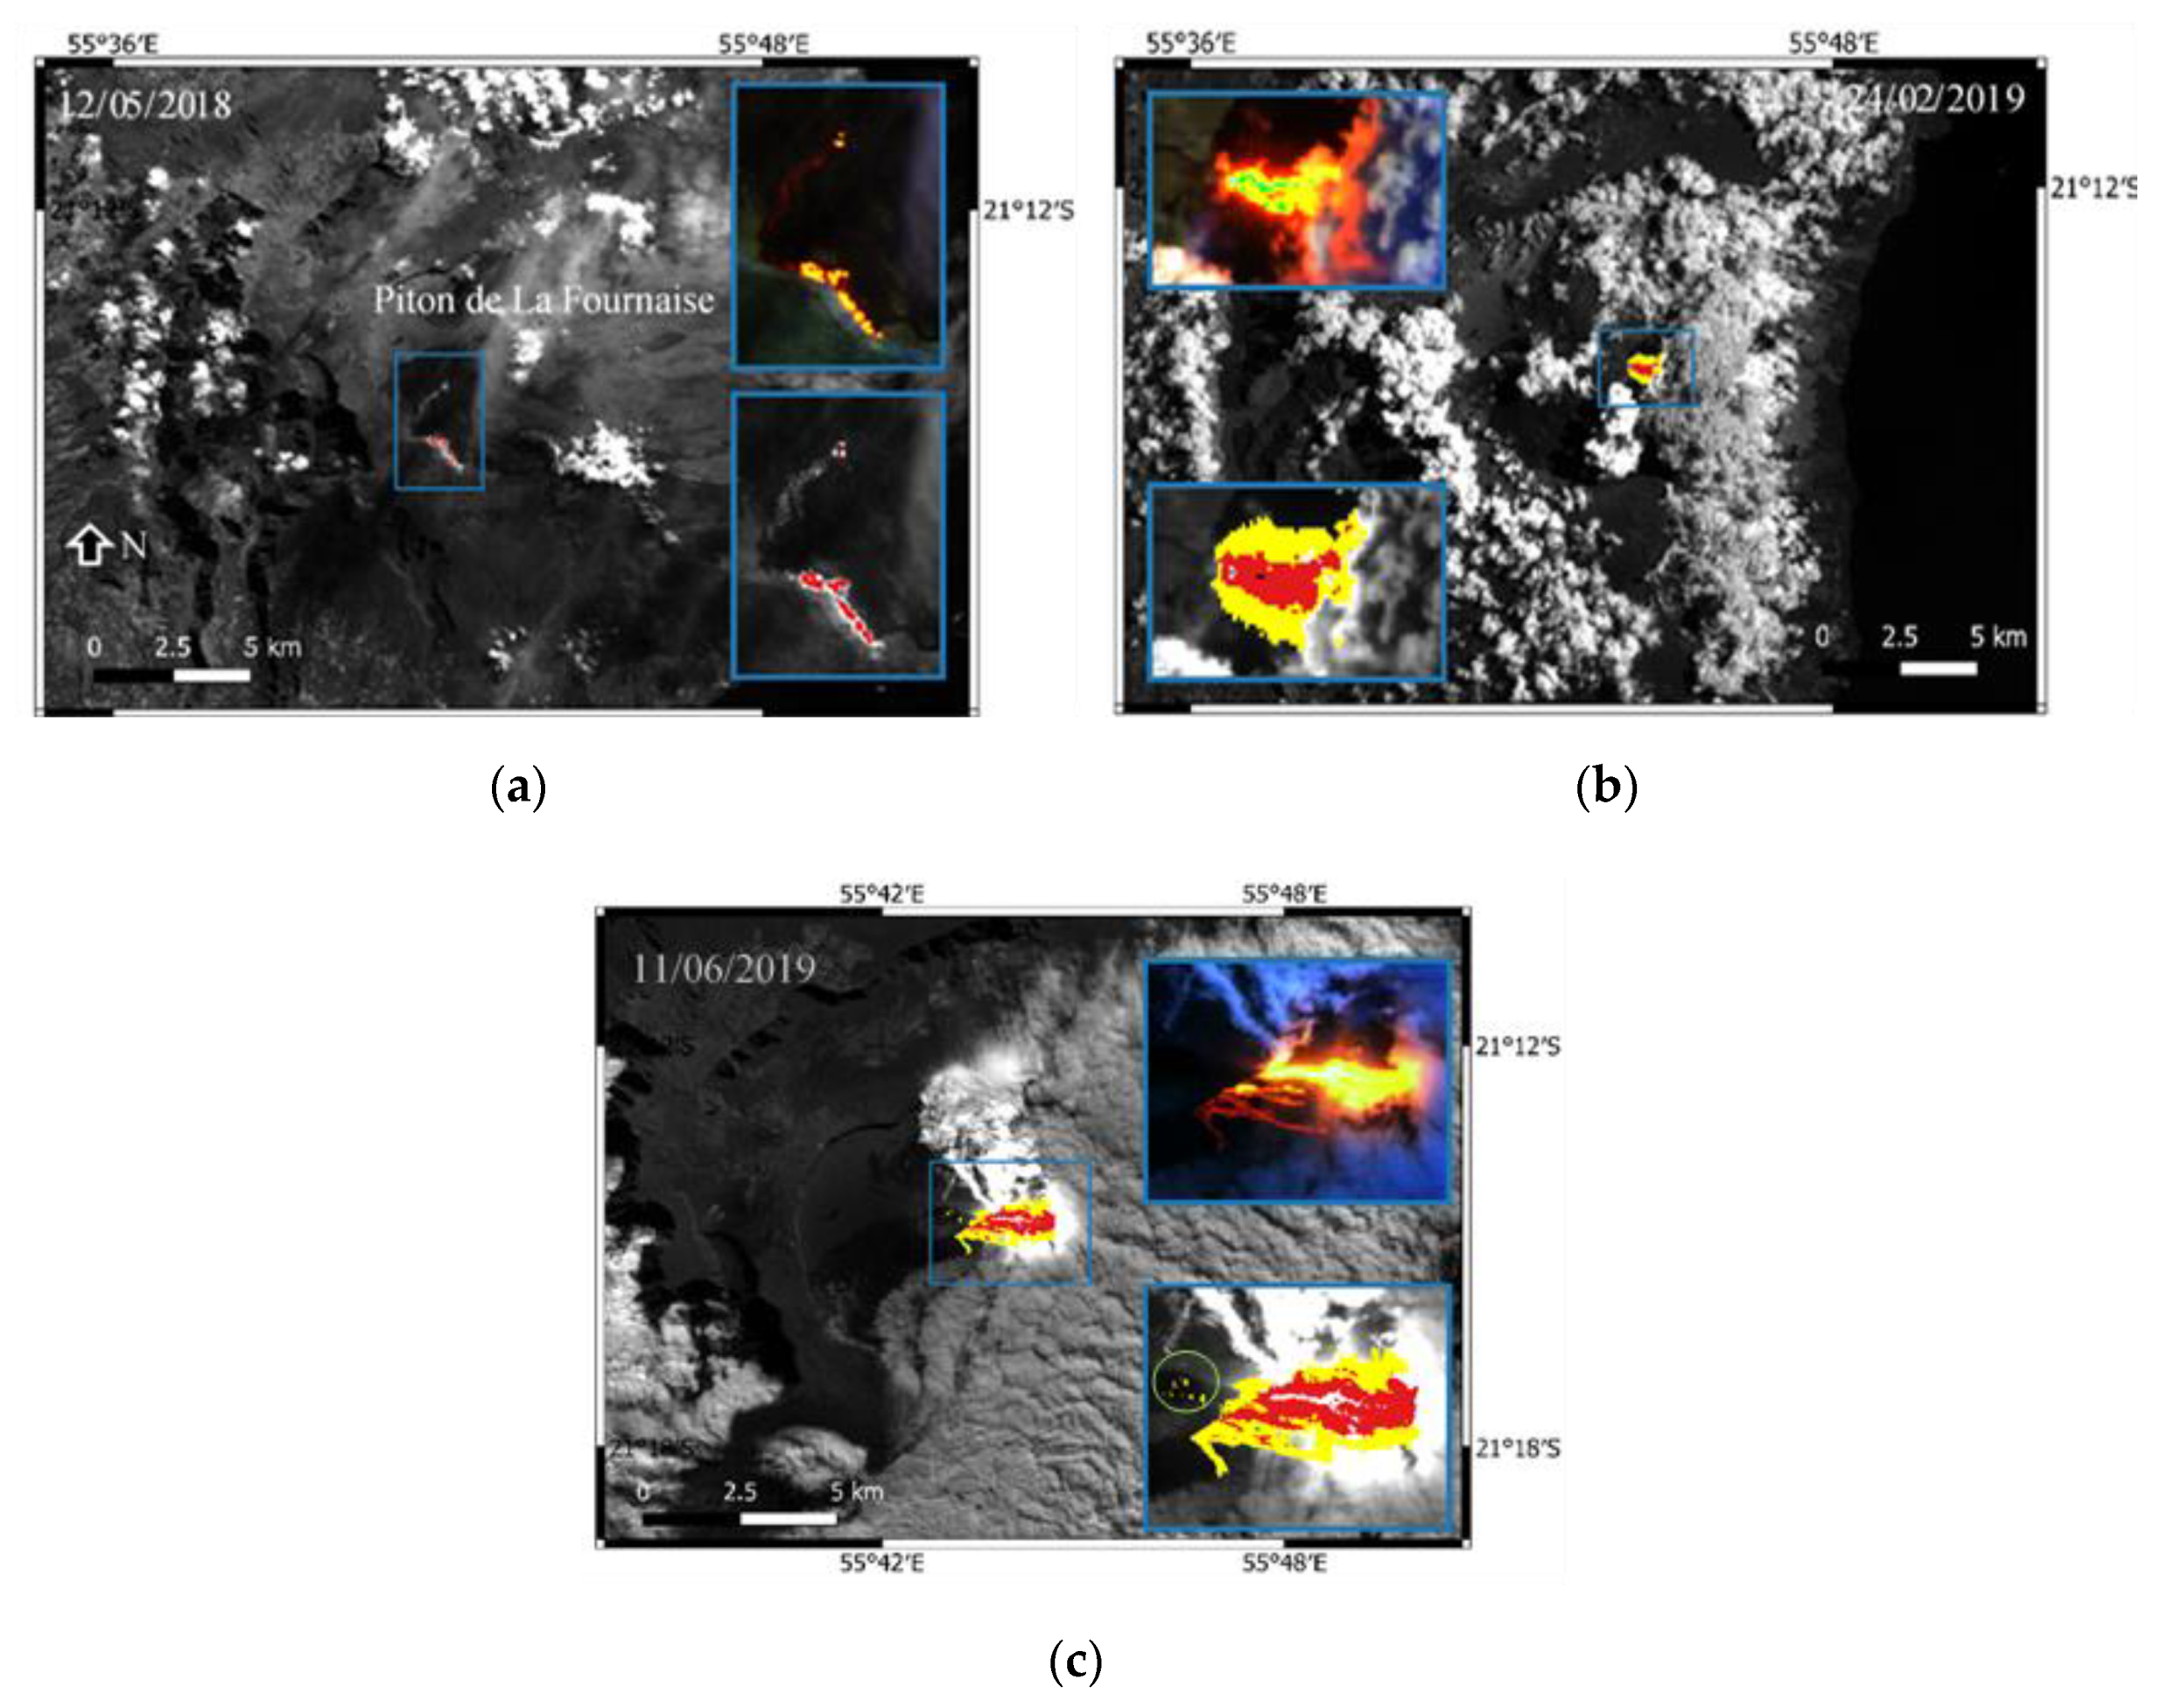
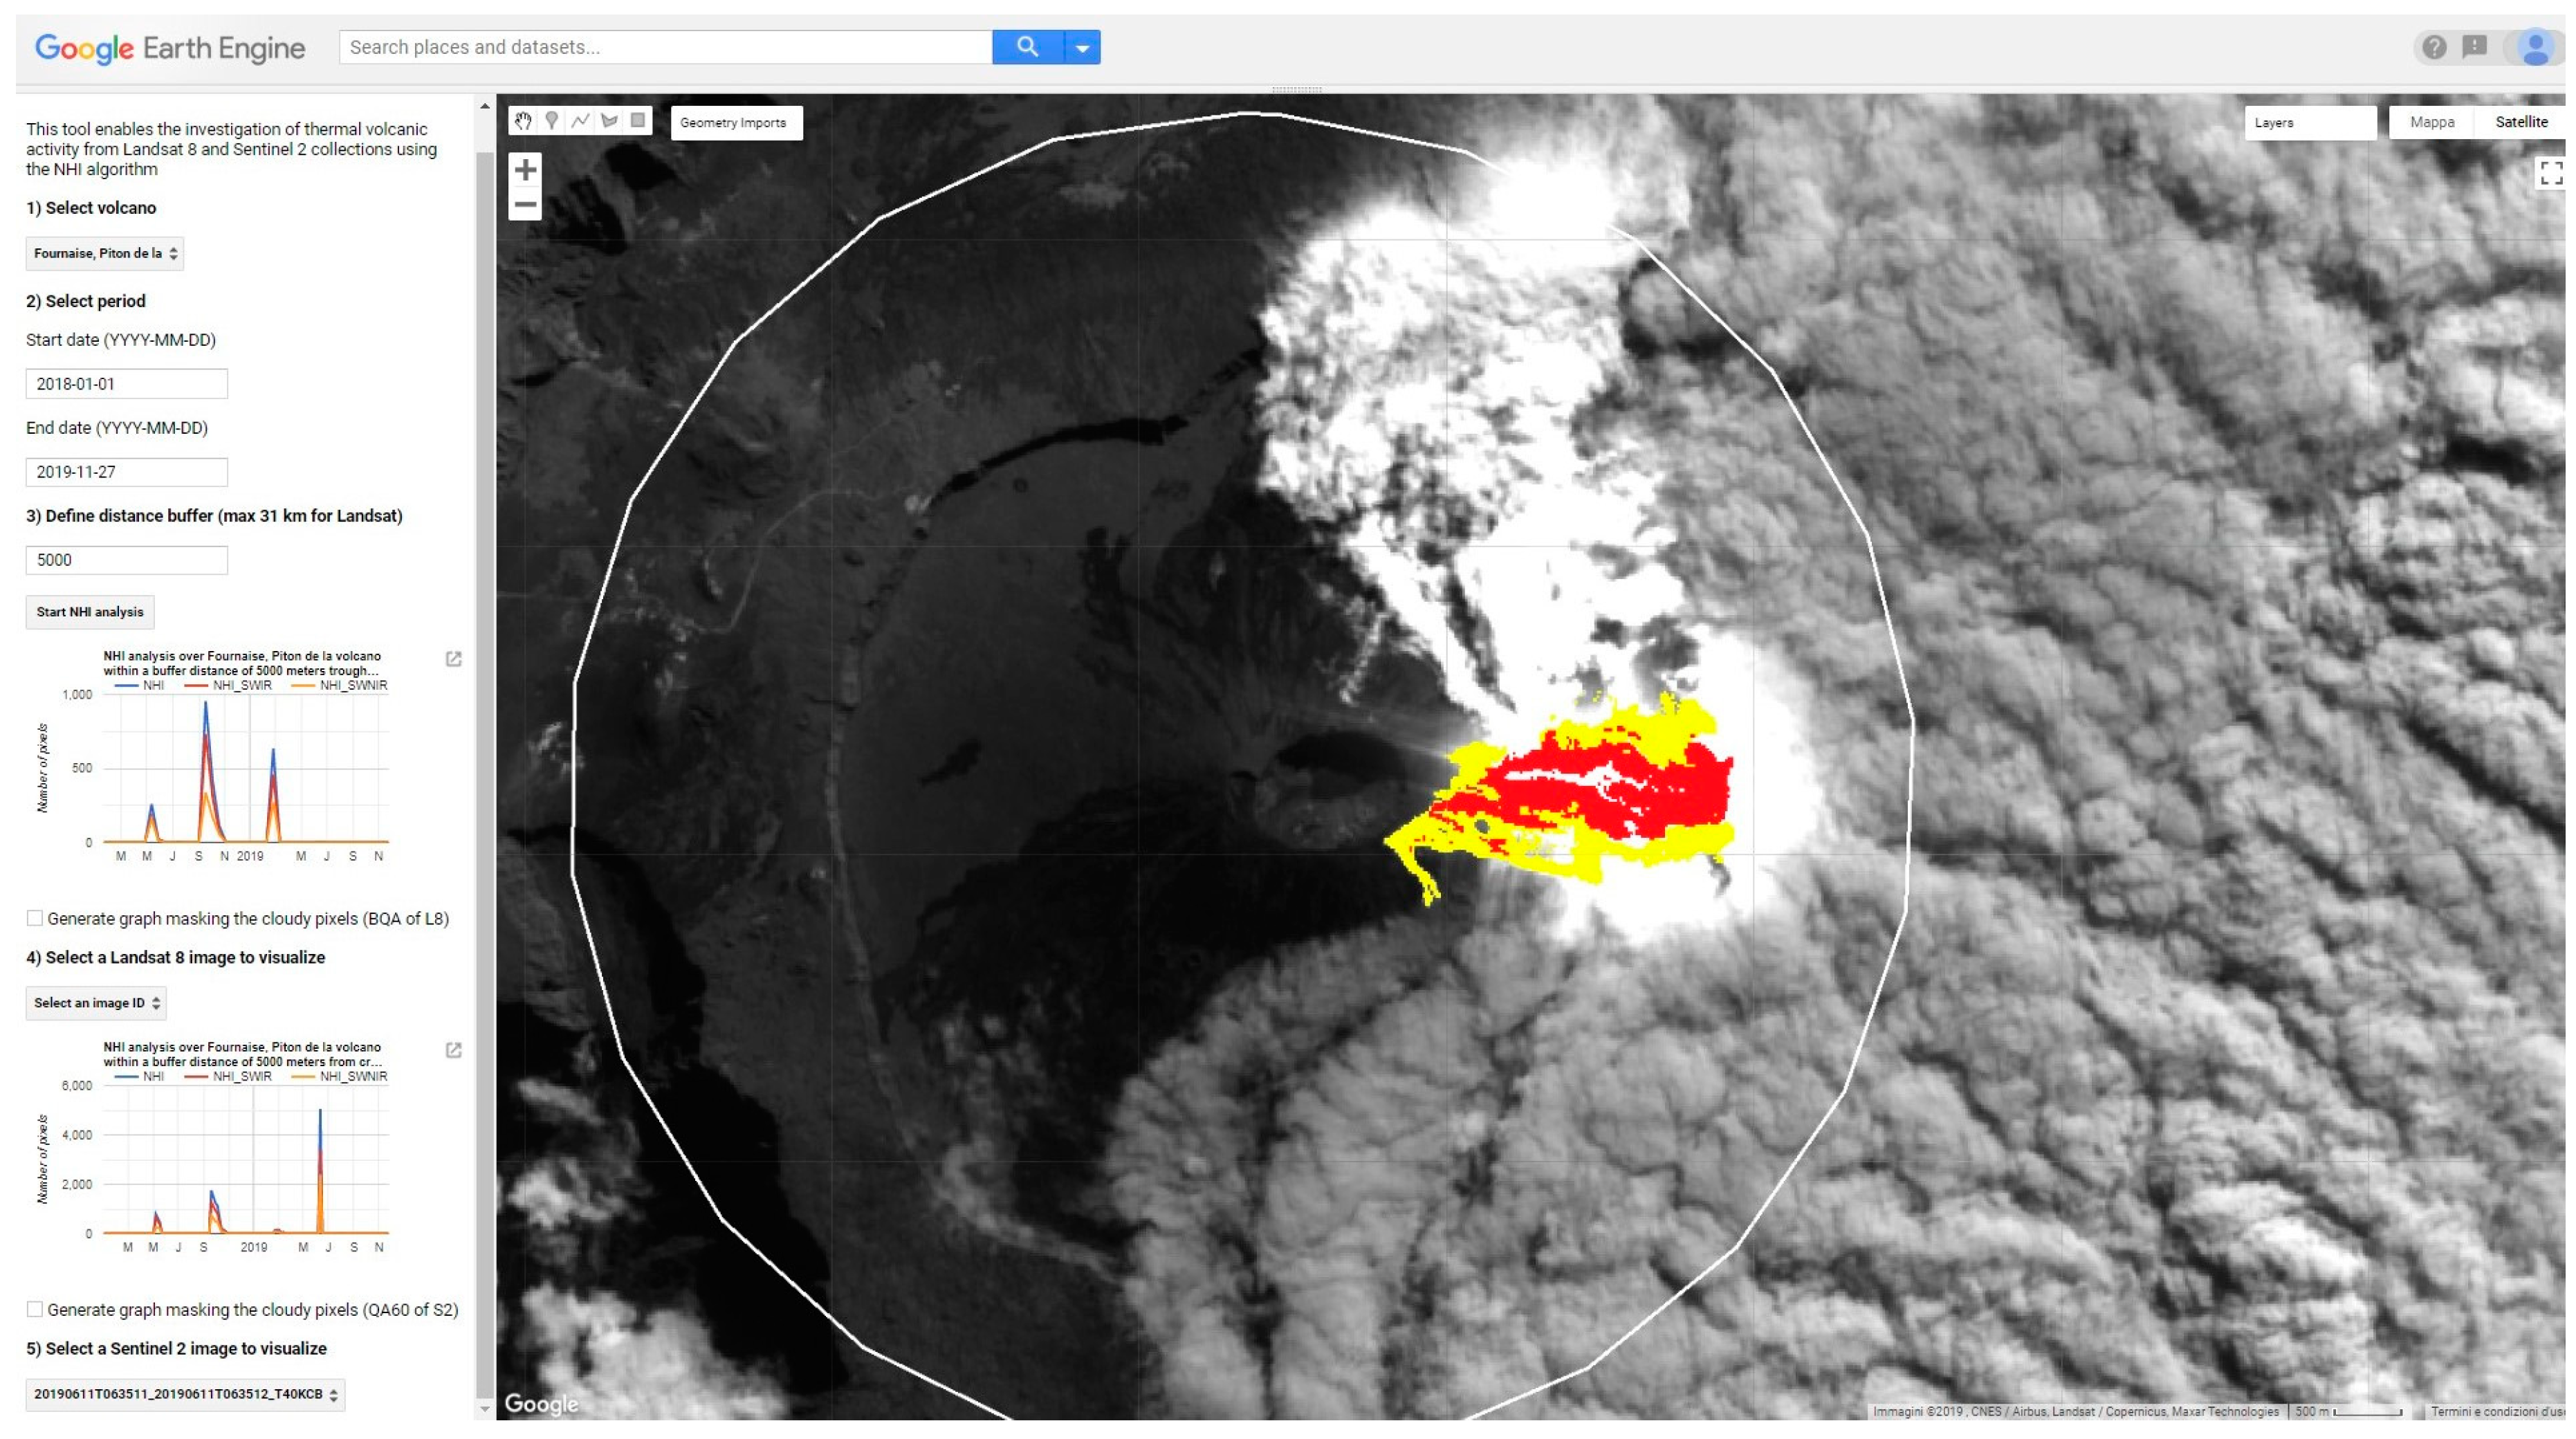
2.8. Piton de la Fournaise (Reunion Islands) Eruptions of April 2018–June 2019
3. Data
3.1. Sentinel-2 MSI Data
3.2. Landsat 8 OLI Data
4. Methods
4.1. Background
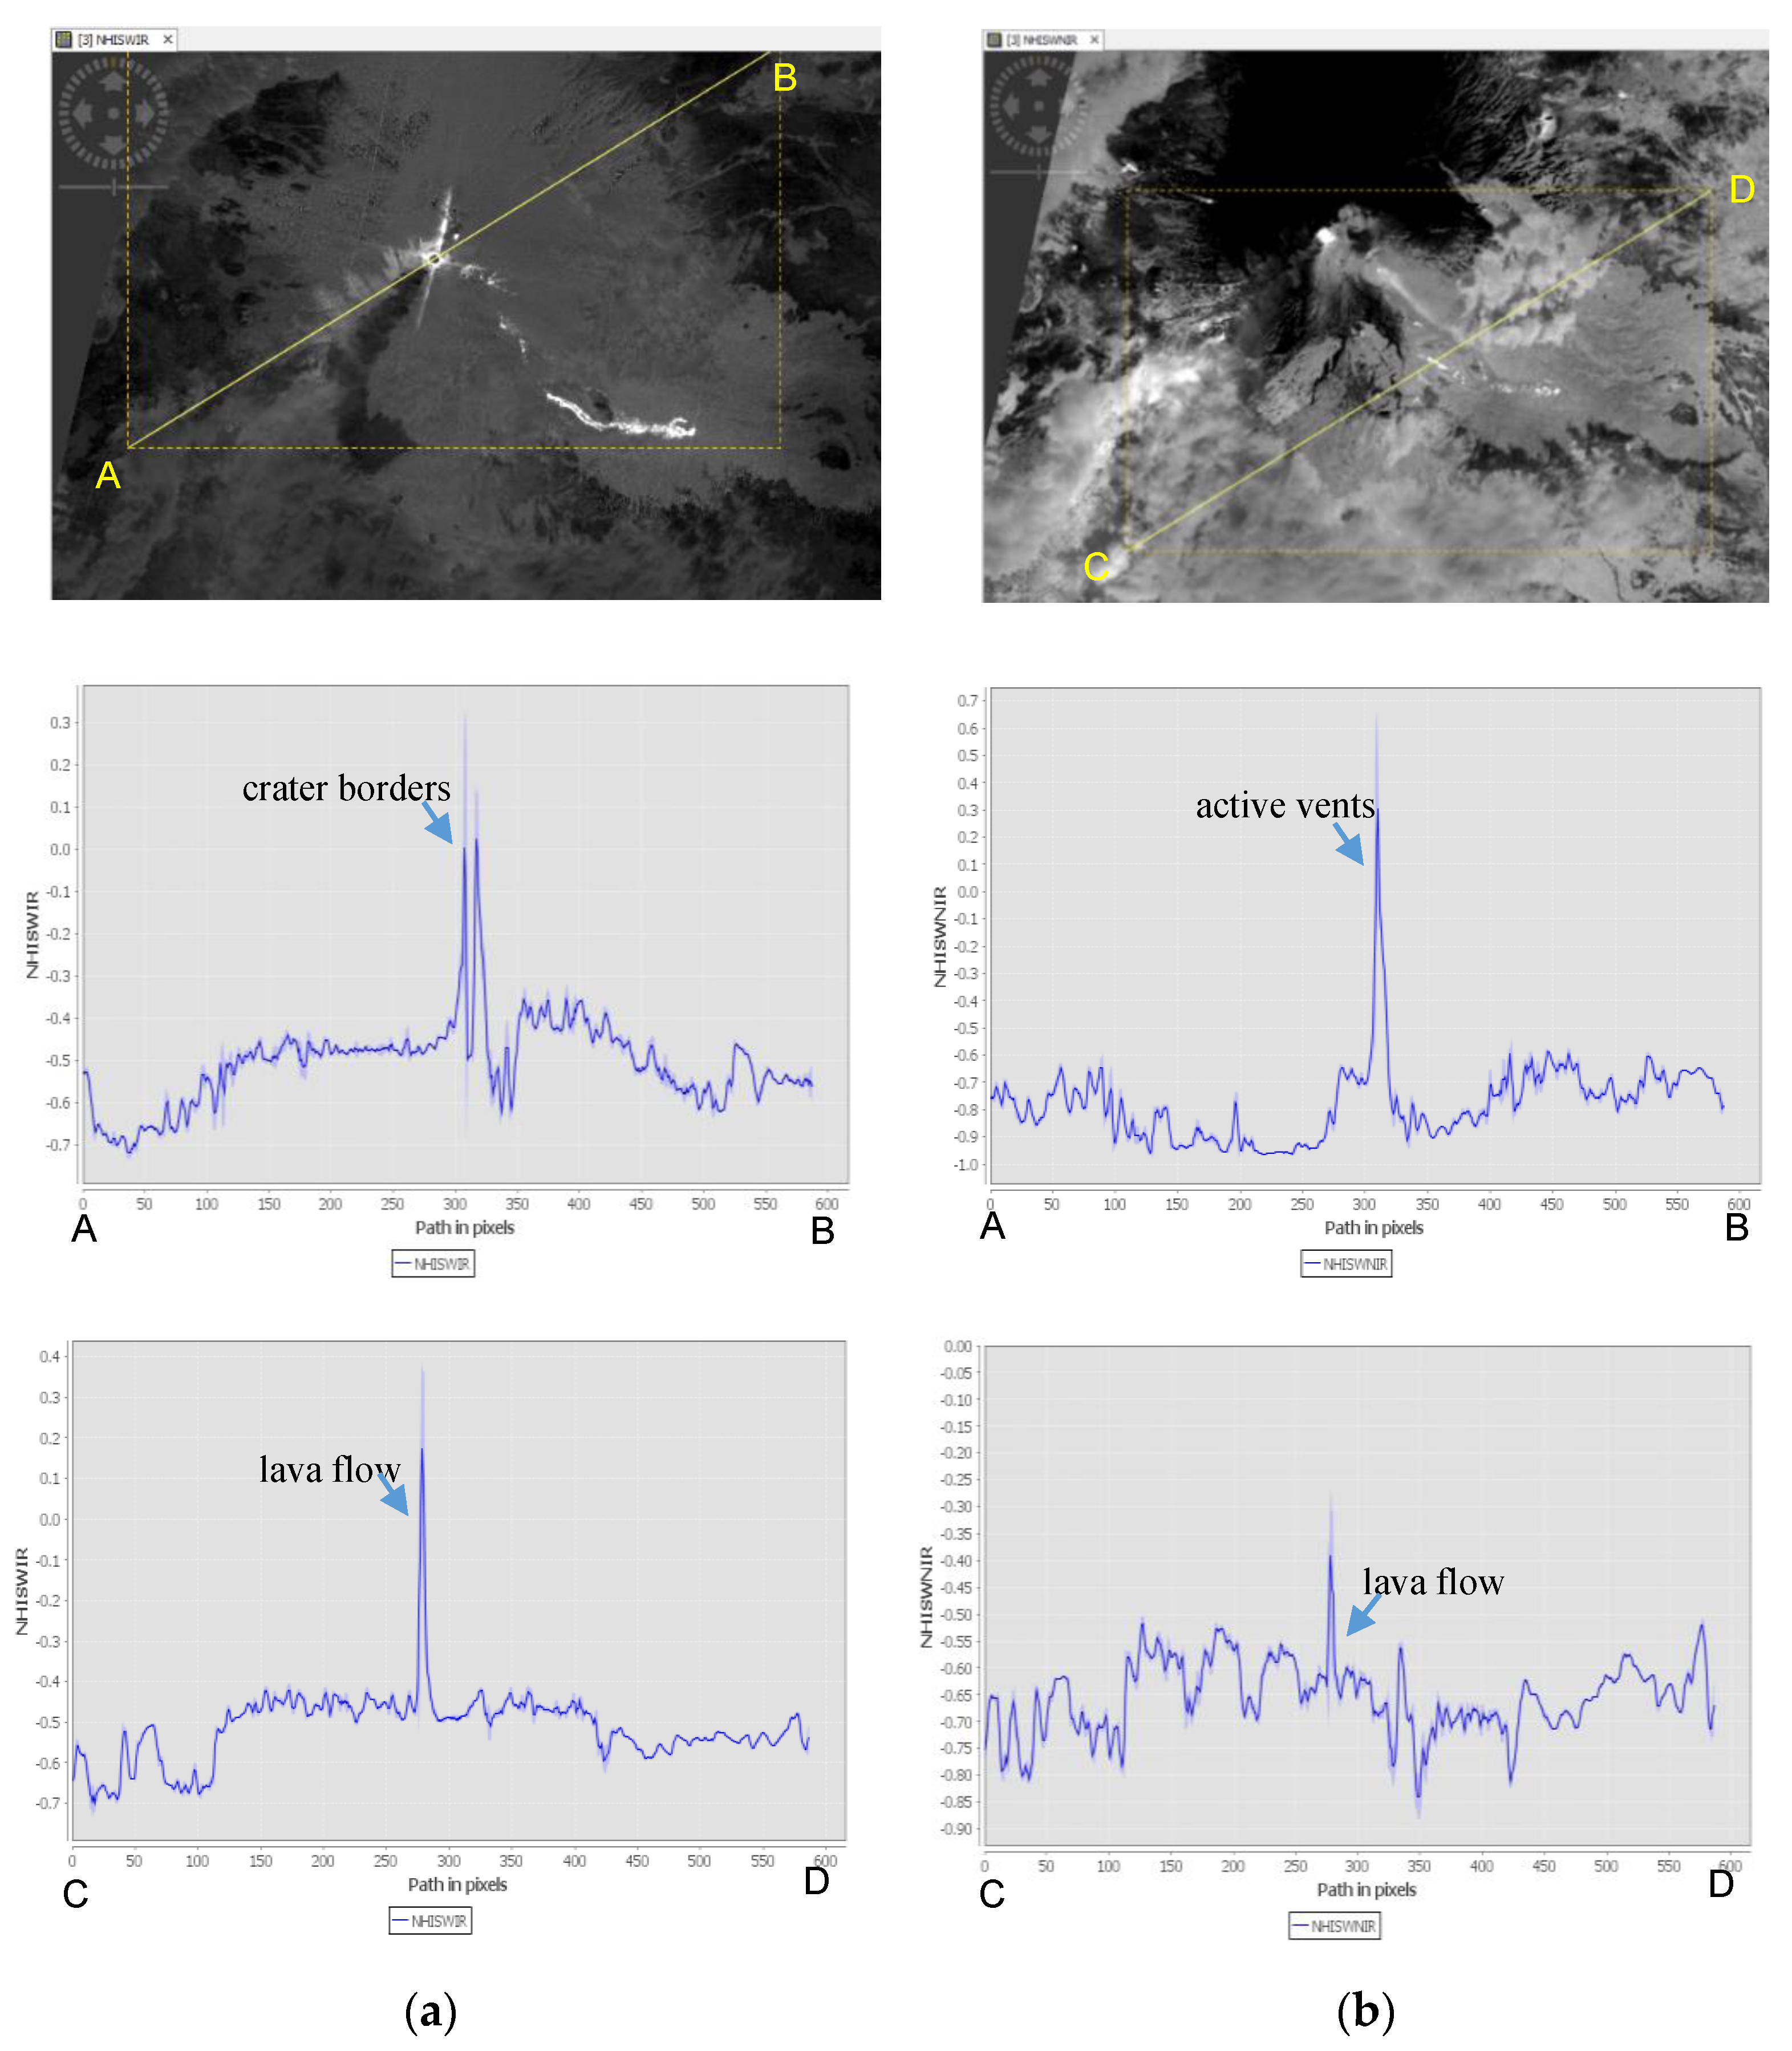
4.2. NHI Algorithm
5. Results
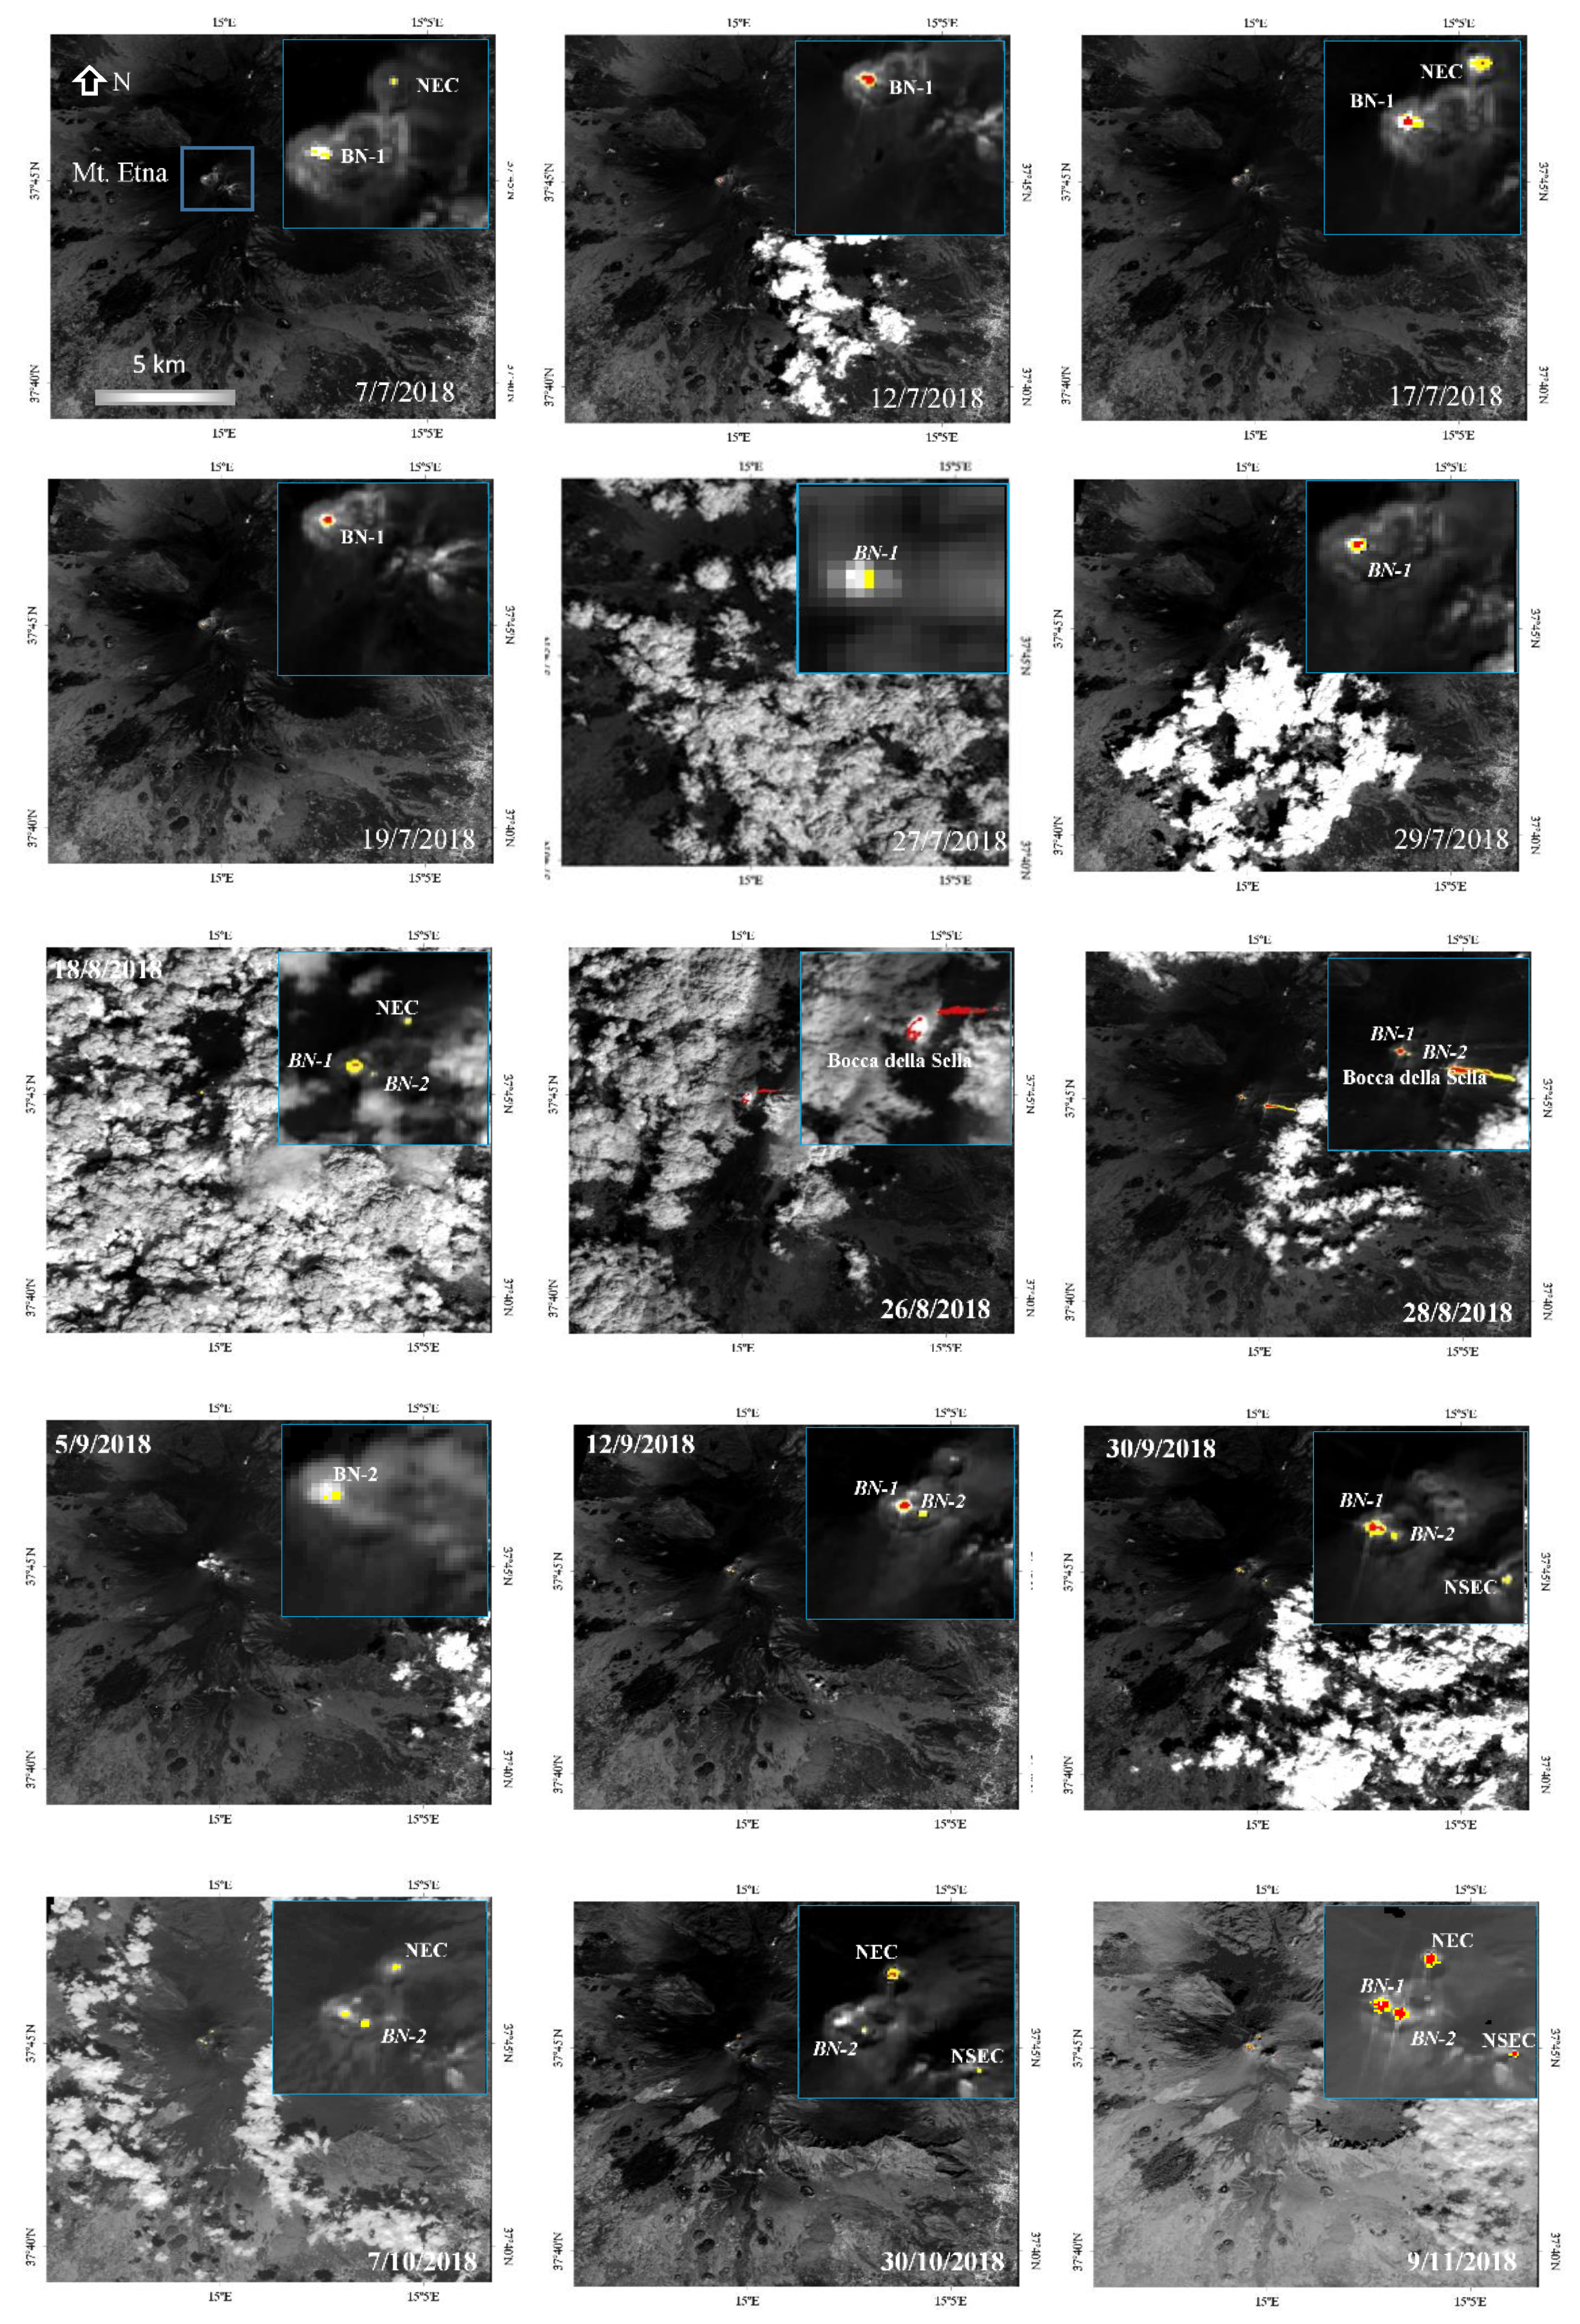
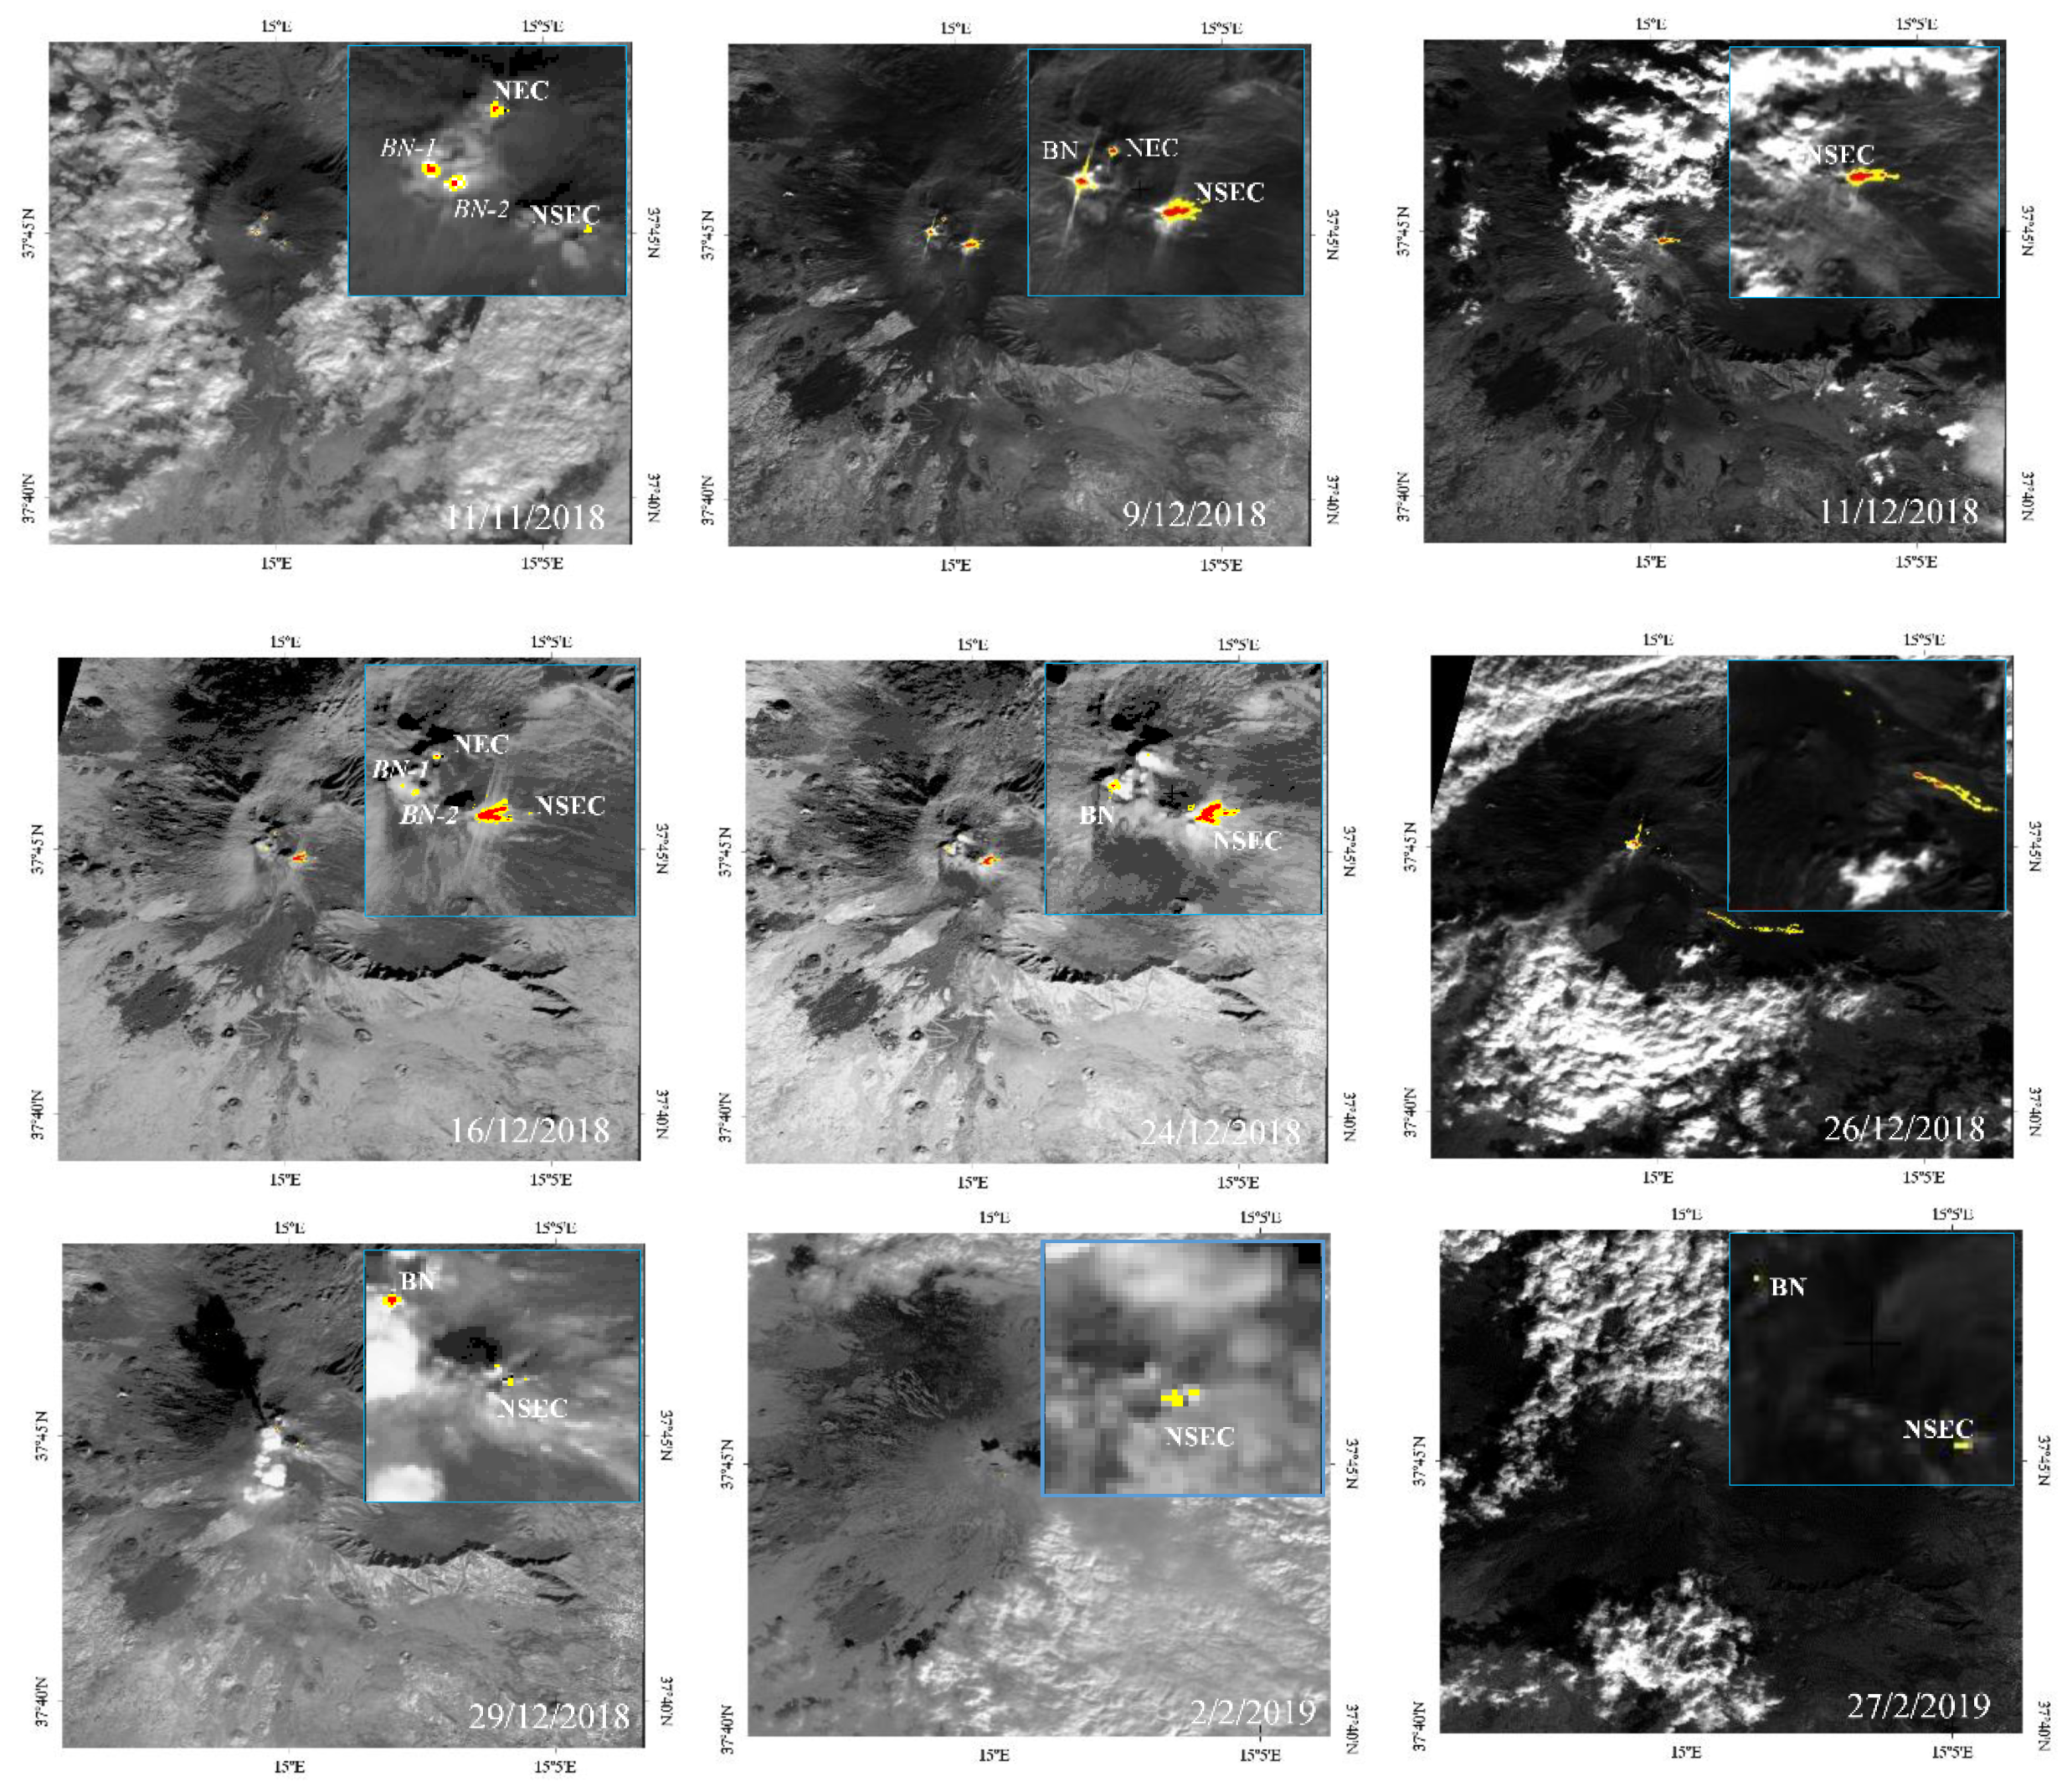
5.1. Mt. Etna Eruptive Events of July 2018–February 2019
5.2. Activity of Stromboli Vlcano of March–June 2019
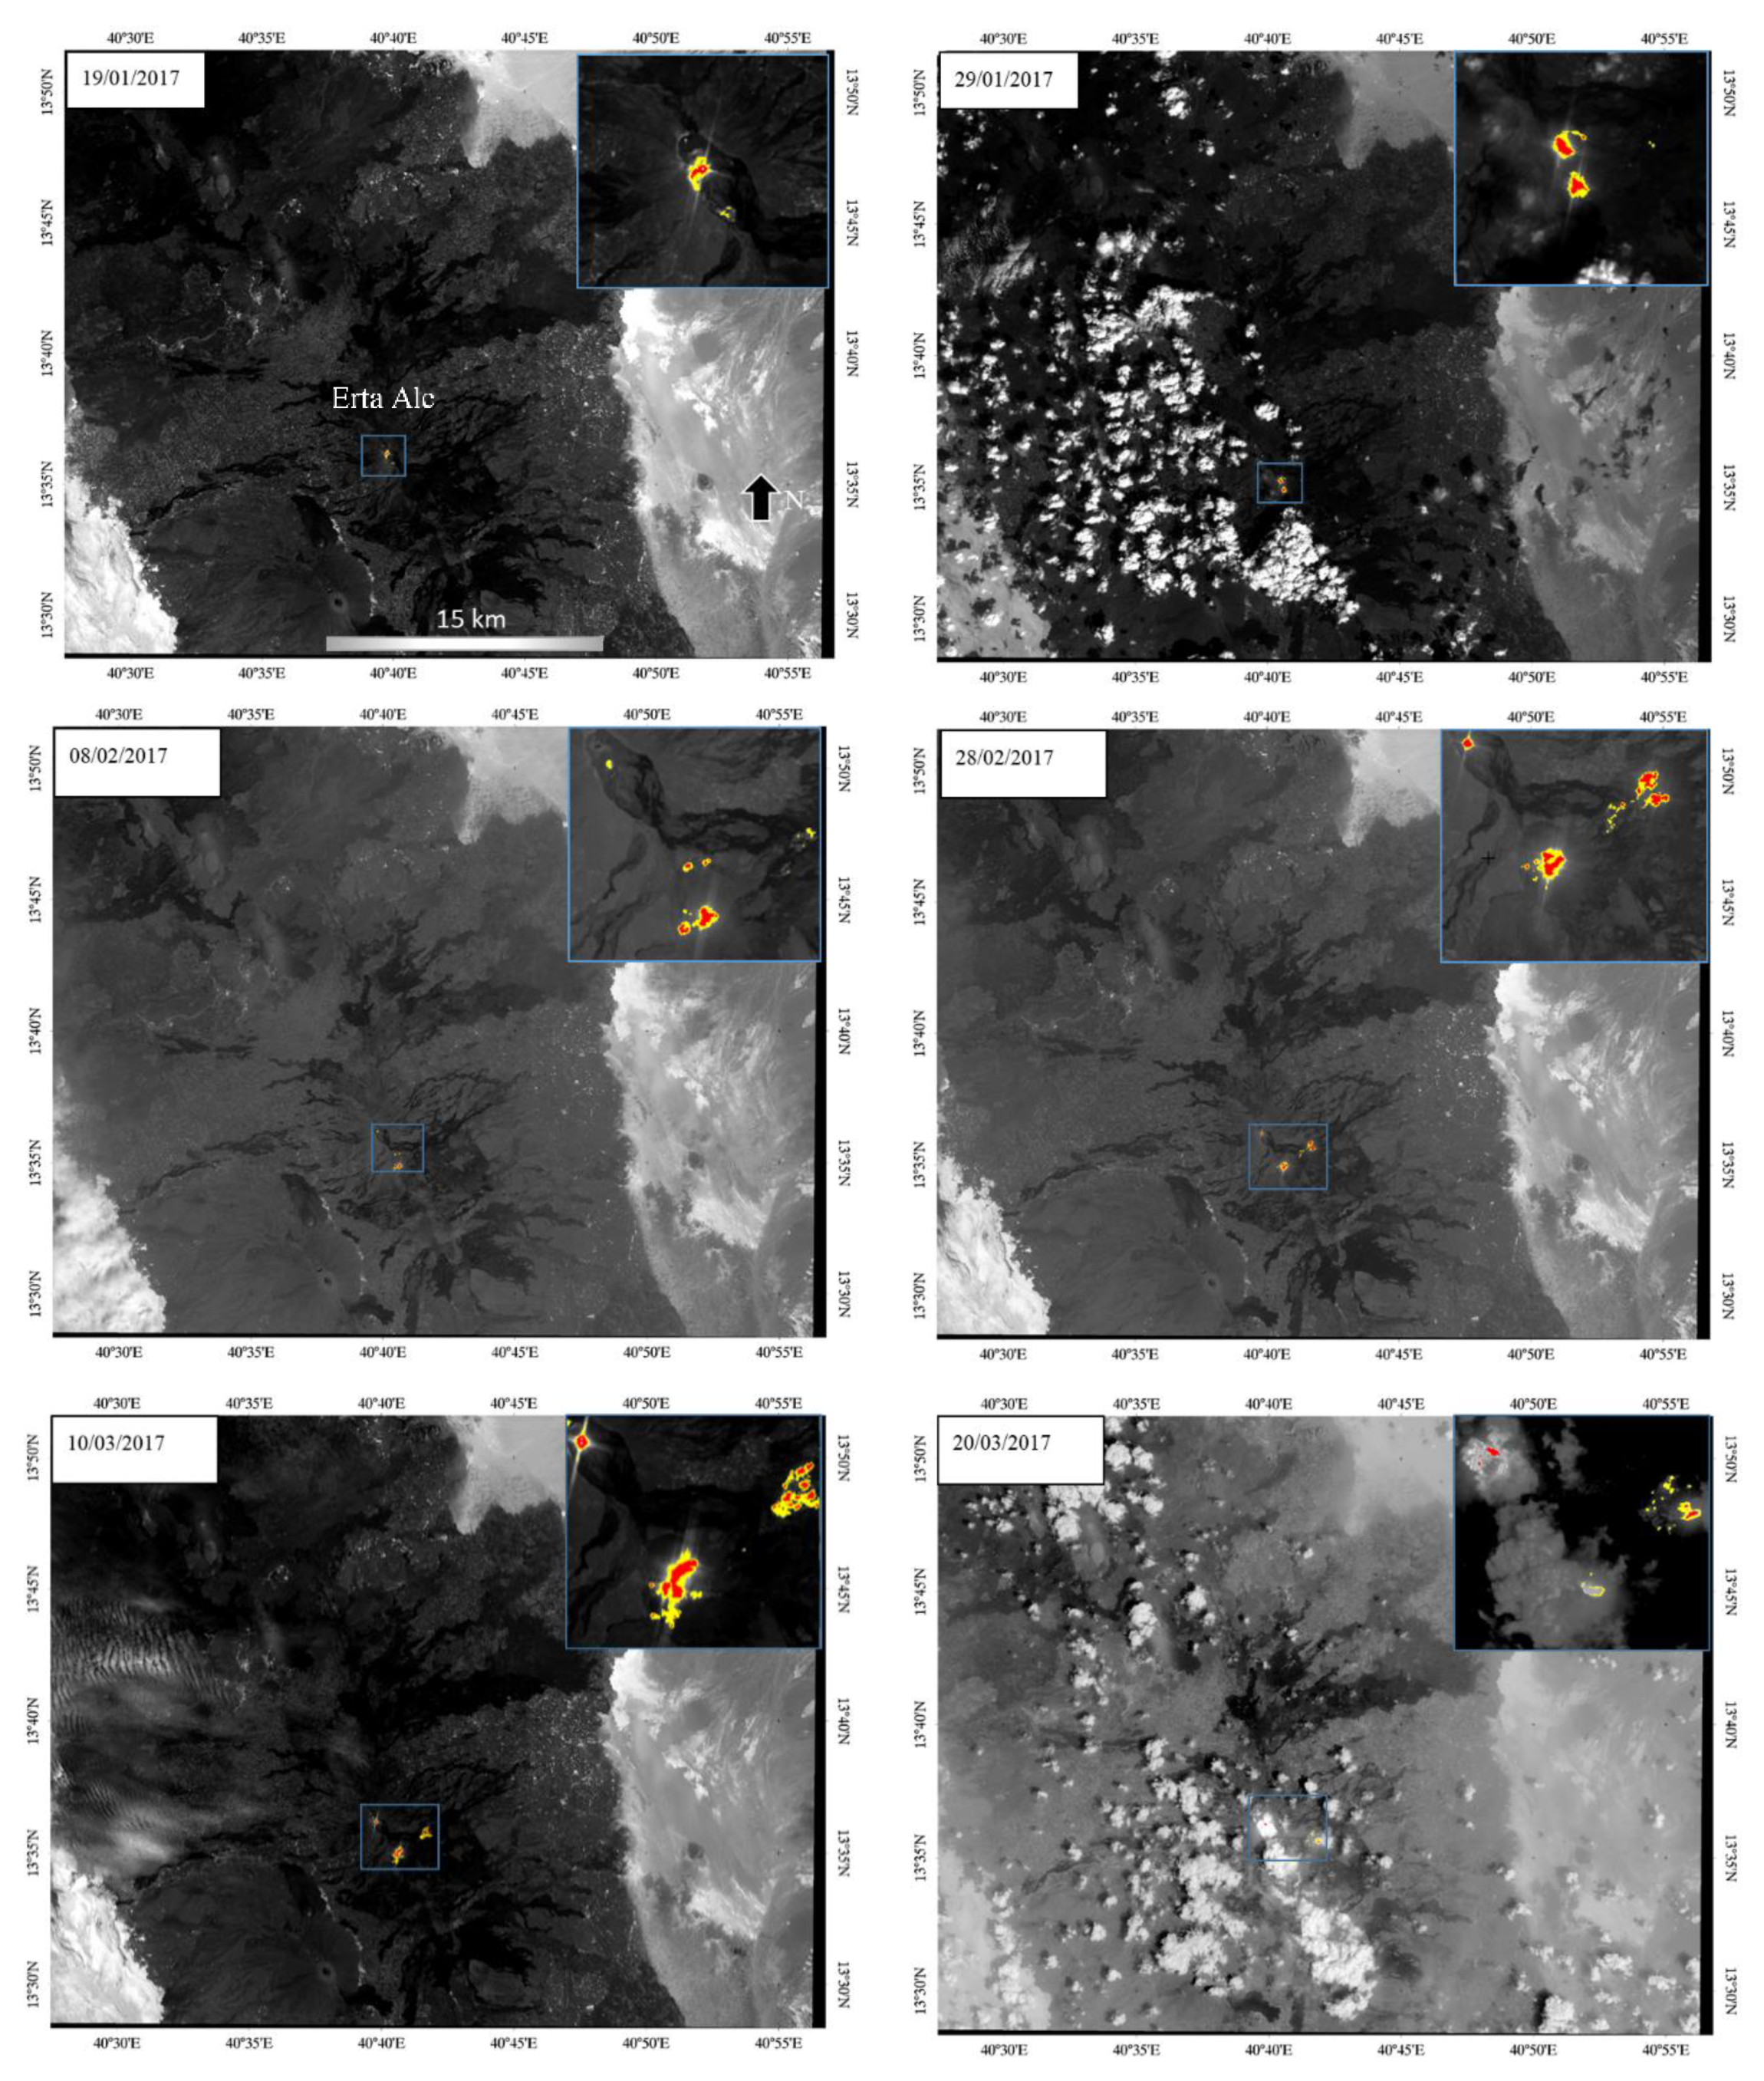
5.3. Erta-Ale Euptions of 2017
5.4. Kilauea Eruptive Activity of March 2018
5.5. Sakurajima Thermal Activity of October 2018
5.6. Popocatépetl Eruptive Activity of March 2019
5.7. Shiveluch Thermal Activity of March 2016–April 2019
5.8. Piton de la Fournaise Lava Effusions of April 2018–June 2019
6. Discussion
7. Conclusions
Author Contributions
Funding
Acknowledgments
Conflicts of Interest
References
- Gawarecki, S.J.; Lyon, R.J.P.; Nordberg, W. Infrared spectral returns and imagery of the Earth from space and their application to geological problems. Sci. Technol. Ser. Am. Astron. Soc. 1965, 4, 13–33. [Google Scholar]
- Williams, R.S., Jr.; Friedman, J.D. Satellite observation of effusive volcanism. Br. Interplanet. Soc. J. 1970, 23, 441–450. [Google Scholar]
- Fiske, R.S.; Sigurdsson, H. Soufriere Volcano, St. Vincent: Observations of its 1979 eruption from the ground, aircraft, and satellites. Science 1982, 216, 1105–1106. [Google Scholar] [CrossRef] [PubMed]
- Oppenheimer, C. Lava flow cooling estimated from Landsat Thematic Mapper infrared data: The Lonquimay eruption (Chile, 1989). J. Geophys. Res. Solid Earth 1991, 96, 21865–21878. [Google Scholar] [CrossRef]
- Rothery, D.A.; Francis, P.W.; Wood, C.A. Volcano monitoring using short wavelength infrared data from satellites. J. Geophys. Res. Solid Earth 1998, 93, 7993–8008. [Google Scholar] [CrossRef]
- Dean, K.; Servilla, M.; Roach, A.; Foster, B.; Engle, K. Satellite monitoring of remote volcanoes improves study efforts in Alaska. EosTrans. Am. Geophys. Union 1998, 79, 413–423. [Google Scholar] [CrossRef]
- Dehn, J.; Dean, K.; Engle, K. Thermal monitoring of North Pacific volcanoes from space. Geology 2000, 28, 755–758. [Google Scholar] [CrossRef]
- Wright, R.; Carn, S.A.; Flynn, L.P. A satellite chronology of the May–June 2003 eruption of Anatahan volcano. J. Volcanol. Geotherm. Res. 2005, 146, 102–116. [Google Scholar] [CrossRef]
- Coppola, D.; Cigolini, C. Thermal regimes and effusive trends at Nyamuragira volcano (DRC) from MODIS infrared data. Bull. Volcanol. 2013, 75, 744. [Google Scholar] [CrossRef]
- Higgins, J.; Harris, A. VAST: A program to locate and analyze volcanic thermal anomalies automatically from remotely sensed data. Comput. Geosci. 1997, 23, 627–645. [Google Scholar] [CrossRef]
- Harris, A.J.; Butterworth, A.L.; Carlton, R.W.; Downey, I.; Miller, P.; Navarro, P.; Rothery, D.A. Low-cost volcano surveillance from space: Case studies from Etna, Krafla, Cerro Negro, Fogo, Lascar and Erebus. Bull. Volcanol. 1997, 59, 49–64. [Google Scholar] [CrossRef]
- Pergola, N.; Marchese, F.; Tramutoli, V. Automated detection of thermal features of active volcanoes by means of infrared AVHRR records. Remote Sens. Environ. 2004, 93, 311–327. [Google Scholar] [CrossRef]
- Wright, R.; Pilger, E. Radiant flux from Earth’s subaerially erupting volcanoes. Int. J. Remote Sens. 2008, 29, 6443–6466. [Google Scholar] [CrossRef]
- Lombardo, V. AVHotRR: Near-real time routine for volcano monitoring using IR satellite data. Geol. Soc. Lond. Spec. Publ. 2016, 426, 73. [Google Scholar] [CrossRef]
- Vicari, A.; Ganci, G.; Behncke, B.; Cappello, A.; Neri, M.; Del Negro, C. Near-real-time forecasting of lava flow hazards during the 12–13 January 2011 Etna eruption. Geophys. Res. Lett. 2011, 38, 47545. [Google Scholar] [CrossRef] [Green Version]
- Wright, R.; Flynn, L.P.; Garbeil, H.; Harris, A.J.; Pilger, E. MODVOLC: Near-real-time thermal monitoring of global volcanism. J. Volcanol. Geotherm. Res. 2004, 135, 29–49. [Google Scholar] [CrossRef]
- Coppola, D.; Laiolo, M.; Cigolini, C.; Delle Donne, D.; Ripepe, M. Enhanced volcanic hot-spot detection using MODIS IR data: Results from the MIROVA system. Geol. Soc. Lond. Spec. Publ. 2016, 426, 181–205. [Google Scholar] [CrossRef]
- Marchese, F.; Filizzola, C.; Genzano, N.; Mazzeo, G.; Pergola, N.; Tramutoli, V. Assessment and improvement of a Robust Satellite Technique (RST) for thermal monitoring of volcanoes. Remote Sens. Environ. 2011, 115, 1556–1563. [Google Scholar] [CrossRef]
- Harris, A.J.L.; Pilger, E.; Flynn, L.P.; Garbeil, H.; Mouginis-Mark, P.J.; Kauahikaua, J.; Thornber, C. Automated, high temporal resolution, thermal analysis of Kilauea volcano, Hawai’i, using GOES satellite data. Int. J. Remote Sens. 2001, 22, 945–967. [Google Scholar] [CrossRef] [Green Version]
- Pergola, N.; Marchese, F.; Tramutoli, V.; Filizzola, C.; Ciampa, M. Advanced satellite technique for volcanic activity monitoring and early warning. Ann. Geophys. 2008, 51, 287–301. [Google Scholar]
- Ferrucci, F.; Theys, N.; Hirn, B.; Clarisse, L.; Valks, P.; Laneve, G.; van der A, R.; Tait, S.; Brenot, H. Operational integration of spaceborne measurements of lava discharge rates and sulfur dioxide concentrations for global volcano monitoring. In Early Warning for Geological Disasters; Springer: Berlin/Heidelberg, Germany, 2014; pp. 307–331. [Google Scholar]
- Marchese, F.; Falconieri, A.; Pergola, N.; Tramutoli, V. A retrospective analysis of the Shinmoedake (Japan) eruption of 26–27 January 2011 by means of Japanese geostationary satellite data. J. Volcanol. Geotherm. Res. 2014, 269, 1–13. [Google Scholar] [CrossRef]
- Kaneko, T.; Takasaki, K.; Maeno, F.; Wooster, M.J.; Yasuda, A. Himawari-8 infrared observations of the June–August 2015 Mt Raung eruption, Indonesia. Earth Planets Space 2018, 70, 1–9. [Google Scholar] [CrossRef] [Green Version]
- Pieri, D.; Abrams, M. ASTER observations of thermal anomalies preceding the April 2003 eruption of Chikurachki volcano, Kurile Islands, Russia. Remote Sens. Environ. 2005, 99, 84–94. [Google Scholar] [CrossRef]
- Pieri, D.; Abrams, M. ASTER watches the world’s volcanoes: A new paradigm for volcanological observations from orbit. J. Volcanol. Geotherm. Res. 2004, 135, 13–28. [Google Scholar] [CrossRef]
- Vaughan, R.G.; Hook, S.J. Using satellite data to characterize the temporal thermal behavior of an active volcano: Mount St. Helens, WA. Geophys. Res. Lett. 2006, 33, 1–4. [Google Scholar] [CrossRef] [Green Version]
- Reath, K.; Pritchard, M.; Poland, M.; Delgado, F.; Carn, S.; Coppola, D.; Baker, S.; Andrews, B.; Ebmeier, S.K.; Rumpf, E.; et al. Thermal, Deformation, and Degassing Remote Sensing Time Series (CE 2000–2017) at the 47 most Active Volcanoes in Latin America: Implications for Volcanic Systems. J. Geophys. Res. Solid Earth 2019, 124, 195–2018. [Google Scholar] [CrossRef] [Green Version]
- Davies, A.G.; Chien, S.; Baker, V.; Doggett, T.; Dohm, J.; Greeley, R.; Ip, C.R.; Cichy, B.; Rabideau, G.; Tran, D.; et al. Monitoring active volcanism with the autonomous sciencecraft experiment on EO-1. Remote Sens. Environ. 2006, 101, 427–446. [Google Scholar] [CrossRef]
- Li, J.; Roy, D.P. A Global Analysis of Sentinel-2A, Sentinel-2B and Landsat-8 Data Revisit Intervals and Implications for Terrestrial Monitoring. Remote Sens. 2017, 9, 902. [Google Scholar]
- Murphy, S.W.; de Souza Filho, C.R.; Wright, R.; Sabatino, G.; Pabon, R.C. HOTMAP: Global hot target detection at moderate spatial resolution. Remote Sens. Environ. 2016, 177, 78–88. [Google Scholar] [CrossRef]
- Mia, M.; Fujimitsu, Y.; Nishijima, J. Thermal activity monitoring of an active volcano using Landsat 8/OLI-TIRS sensor images: A case study at the Aso volcanic area in southwest Japan. Geosciences 2017, 7, 118. [Google Scholar] [CrossRef] [Green Version]
- Mia, M.; Fujimitsu, Y.; Nishijima, J. Monitoring of Thermal Activity at the Hatchobaru–Otake Geothermal Area in Japan Using Multi-Source Satellite Images—With Comparisons of Methods, and Solar and Seasonal Effects. Remote Sens. 2018, 10, 1430. [Google Scholar] [CrossRef] [Green Version]
- Cigolini, C.; Coppola, D.; Yokoo, A.; Laiolo, M. The thermal signature of Aso Volcano during unrest episodes detected from space and ground-based measurements. Earth Planets Space 2018, 70, 1–15. [Google Scholar] [CrossRef]
- Valade, S.; Ley, A.; Massimetti, F.; D’Hondt, O.; Laiolo, M.; Coppola, D.; Loibl, D.; Hellwich, O.; Walter, T.R. Towards Global Volcano Monitoring Using Multisensor Sentinel Missions and Artificial Intelligence: The MOUNTS Monitoring System. Remote Sens. 2019, 11, 1528. [Google Scholar] [CrossRef] [Green Version]
- Marchese, F.; Neri, M.; Falconieri, A.; Lacava, T.; Mazzeo, G.; Pergola, N.; Tramutoli, V. The Contribution of Multi-Sensor Infrared Satellite Observations to Monitor Mt. Etna (Italy) Activity during May to August 2016. Remote Sens. 2018, 10, 1948. [Google Scholar] [CrossRef] [Green Version]
- Gray, D.M.; Burton-Johnson, A.; Fretwell, P.T. Evidence for a lava lake on Mt. Michael volcano, Saunders Island (South Sandwich Islands) from Landsat, Sentinel-2 and ASTER satellite imagery. J. Volcanol. Geotherm. Res. 2019, 379, 60–71. [Google Scholar] [CrossRef]
- Xia, H.; Chen, Y.; Quan, J. A simple method based on the thermal anomaly index to detect industrial heat sources. Int. J. Appl. Earth Obs. Geoinf. 2018, 73, 627–637. [Google Scholar] [CrossRef]
- Neri, M.; Acocella, V.; Behncke, B.; Giammanco, S.; Mazzarini, F.; Rust, D. Structural analysis of the eruptive fissures at Mount Etna (Italy). Ann. Geophys. 2011, 54. [Google Scholar] [CrossRef]
- Global Volcanism Program. Report on Etna (Italy). In Bulletin of the Global Volcanism Network; Crafford, A.E., Venzke, E., Eds.; Smithsonian Institution: Washington, DC, USA, 2018; Volume 43. [Google Scholar] [CrossRef]
- De Novellis, V.; Atzori, S.; De Luca, C.; Manzo, M.; Valerio, E.; Bonano, M.; Cardaci, C.; Castaldo, L.; Di Bucci, D.; Manunta, M.; et al. DInSAR analysis and analytical modeling of Mount Etna displacements: The December 2018 volcano-tectonic crisis. Geophys. Res. Lett. 2019, 46. [Google Scholar] [CrossRef] [Green Version]
- Global Volcanism Program. Report on Etna (Italy). In Bulletin of the Global Volcanism Network; Crafford, A.E., Venzke, E., Eds.; Smithsonian Institution: Washington, DC, USA, 2019; Volume 44. [Google Scholar]
- Ripepe, M.; Delle Donne, D.; Lacanna, G.; Marchetti, E.; Ulivieri, G. The onset of the 2007 Stromboli effusive eruption recorded by an integrated geophysical network. J. Volcanol. Geotherm. Res. 2009, 182, 131–136. [Google Scholar] [CrossRef]
- Calvari, S.; Spampinato, L.; Lodato, L.; Harris, A.J.; Patrick, M.R.; Dehn, J.; Burton, M.R.; Andronico, D. Chronology and complex volcanic processes during the 2002–2003 flank eruption at Stromboli volcano (Italy) reconstructed from direct observations and surveys with a handheld thermal camera. J. Geophys. Res. Solid Earth 2005, 110, 3129. [Google Scholar] [CrossRef] [Green Version]
- Calvari, S.; Bonaccorso, A.; Madonia, P.; Neri, M.; Liuzzo, M.; Salerno, G.; Behncke, B.; Caltabiano, T.; Cristaldi, A.; Giuffrida, G.; et al. Major eruptive style changes induced by structural modifications of a shallow conduit system: The 2007–2012 Stromboli case. Bull. Volcanol. 2014, 76, 841. [Google Scholar] [CrossRef]
- Global Volcanism Program. Report on Stromboli (Italy). In Bulletin of the Global Volcanism Network; Venzke, E., Ed.; Smithsonian Institution: Washington, DC, USA, 2018; Volume 43, p. 8. [Google Scholar]
- Volcano Discovery. The Explosion of Stromboli on 3 July 2019—A Summary. Available online: https://www.volcanodiscovery.com/stromboli/eruptions/3july2019-explosion.html (accessed on 19 November 2019).
- Volcano Discovery. Erta Ale. Available online: https://www.volcanodiscovery.com/it/erta_ale.html (accessed on 19 November 2019).
- Global Volcanism Program. Report on Erta Ale (Ethiopia). In Bulletin of the Global Volcanism Network; Venzke, E., Ed.; Smithsonian Institution: Washington, DC, USA, 2017; Volume 42, p. 7. [Google Scholar]
- Volcano Discovery. Erta Ale, 2017 Rift Eruption-June Update. Available online: https://www.volcanodiscovery.com/erta-ale/news/2017-rift-eruption/june-update.html#top (accessed on 19 November 2019).
- Conway, S.; Wauthier, C.; Fukushima, Y.; Poland, M. A retrospective look at the February 1993 east rift zone intrusion at Kīlauea volcano, Hawaii. J. Volcanol. Geotherm. Res. 2018, 358, 241–251. [Google Scholar] [CrossRef]
- Global Volcanism Program. Report on Kilauea (United States). In Bulletin of the Global Volcanism Network; Venzke, E., Ed.; Smithsonian Institution: Washington, DC, USA, 2018; Volume 43, p. 12. [Google Scholar]
- Neal, C.A.; Brantley, S.R.; Antolik, L.; Babb, J.L.; Burgess, M.; Calles, K.; Chang, J.C.; Conway, S.; Desmither, L.; Dotray, P.; et al. The 2018 rift eruption and summit collapse of Kīlauea Volcano. Science 2018, 363, 367–374. [Google Scholar] [CrossRef] [PubMed]
- Global Volcanism Program. Report on Aira (Japan). In Bulletin of the Global Volcanism Network; Krippner, J.B., Venzke, E., Eds.; Smithsonian Institution: Washington, DC, USA, 2019; Volume 44, p. 1. [Google Scholar]
- Global Volcanism Program. Report on Popocatepetl (Mexico). In Bulletin of the Global Volcanism Network; Venzke, E., Ed.; Smithsonian Institution: Washington, DC, USA, 2018; Volume 43, p. 11. [Google Scholar]
- GARDAWORLD. Mexico: Increased Volcanic Activity Reported at Popocatepetl March 28/Update 1. Available online: https://www.garda.com/crisis24/news-alerts/209421/mexico-popocatepetl-volcano-expels-vapors-and-ashes-march-3 (accessed on 19 November 2019).
- Global Volcanism Program. Report on Popocatepetl (Mexico). In Weekly Volcanic Activity Report; Sennert, S.K., Ed.; Smithsonian Institution: Washington, DC, USA; US Geological Survey: Reston, VA, USA, 2019. [Google Scholar]
- Volcano Discovery. Popocatepetl Volcano News & Eruption Update. Available online: https://www.volcanodiscovery.com/popocatepetl/news/77782/Popocatepetl-Volcano-Volcanic-Ash-Advisory-REMNANT-VA-to-21000-ft-6400-m.html (accessed on 19 November 2019).
- Ramsey, M.S.; Wessels, R.L.; Anderson, S.W. Surface textures and dynamics of the 2005 lava dome at Shiveluch Volcano, Kamchatka. Bulletin 2012, 124, 678–689. [Google Scholar] [CrossRef]
- Kamchatka Volcanic Eruption Response Team (KVERT). Available online: http://www.kscnet.ru/ivs/kvert/about_eng (accessed on 19 November 2019).
- Global Volcanism Program. Report on Sheveluch (Russia). In Bulletin of the Global Volcanism Network; Venzke, E., Ed.; Smithsonian Institution: Washington, DC, USA, 2017; Volume 42, p. 8. [Google Scholar] [CrossRef]
- Middle InfraRed Observation of Volcanic Activity (MIROVA). Near Real Time Volcanic Hotspot Detection System. Available online: http://www.mirovaweb.it/ (accessed on 19 November 2019).
- Global Volcanism Program. Report on Sheveluch (Russia). In Bulletin of the Global Volcanism Network; Venzke, E., Ed.; Smithsonian Institution: Washington, DC, USA, 2019; Volume 44, p. 5. [Google Scholar]
- Volcano Discovery. Piton de la Fournaise Vulcano. Available online: https://www.volcanodiscovery.com/it/pitondelafournaise.html (accessed on 19 November 2019).
- Global Volcanism Program. Report on Piton de la Fournaise (France). In Bulletin of the Global Volcanism Network; Crafford, A.E., Venzke, E., Eds.; Smithsonian Institution: Washington, DC, USA, 2019; Volume 44, p. 7. [Google Scholar]
- Global Volcanism Program. Report on Piton de la Fournaise (France). In Weekly Volcanic Activity Report; Sennert, S.K., Ed.; Smithsonian Institution: Washington, DC, USA; US Geological Survey: Reston, VA, USA, 2018. [Google Scholar]
- Martimort, P.; Fernandez, V.; Kirschner, V.; Isola, C.; Meygret, A. Sentinel-2 MultiSpectral imager (MSI) and calibration/validation. In Proceedings of the 2012 IEEE International Geoscience and Remote Sensing Symposium, Munich, Germany, 22–27 July 2007; pp. 6999–7002. [Google Scholar]
- ESA Sentinel Online. Missions, SENTINEL 2. Available online: https://sentinel.esa.int/web/sentinel/missions/sentinel-2 (accessed on 19 November 2019).
- ESA Sentinel Online. SWAT and Resolution. Available online: https://sentinel.esa.int/web/sentinel/missions/sentinel-2/instrument-payload/resolution-and-swath (accessed on 19 November 2019).
- Copernicus Open Access Hub. Available online: https://scihub.copernicus.eu/dhus/#/home (accessed on 19 November 2019).
- ESA Sentinel Online. User Guides. Level-1C. Available online: https://earth.esa.int/web/sentinel/user-guides/sentinel-2-msi/product-types/level-1c (accessed on 19 November 2019).
- ESA Copernicus. S2 MPC- L1C Data Quality. Available online: https://sentinel.esa.int/documents/247904/685211/Sentinel-2_L1C_Data_Quality_Report (accessed on 19 November 2019).
- U.S. Geological Survey (USGS). Landsat Mission. Available online: https://www.usgs.gov/land-resources/nli/landsat/landsat-satellite-missions?qt-science_support_page_related_con=2#qt-science_support_page_related_con (accessed on 19 November 2019).
- Markham, B.; Barsi, J.; Kvaran, G.; Ong, L.; Kaita, E.; Biggar, S.; Czapla-Myers, J.; Mishra, N.; Helder, D. Landsat-8 Operational Land Imager Radiometric Calibration and Stability. Remote Sens. 2014, 6, 12275–12308. [Google Scholar] [CrossRef] [Green Version]
- Giglio, L.; Csiszar, I.; Restás, Á.; Morisette, J.T.; Schroeder, W.; Morton, D.; Justice, C.O. Active fire detection and characterization with the advanced spaceborne thermal emission and reflection radiometer (ASTER). Remote Sens. Environ. 2008, 112, 3055–3063. [Google Scholar] [CrossRef]
- Laiolo, M.; Ripepe, M.; Cigolini, C.; Coppola, D.; Della Schiava, M.; Genco, R.; Innocenti, L.; Lacanna, G.; Marchetti, E.; Massimetti, F.; et al. Space- and Ground-Based Geophysical Data Tracking of Magma Migration in Shallow Feeding System of Mount Etna Volcano. Remote Sens. 2019, 11, 1182. [Google Scholar] [CrossRef] [Green Version]
- Schroeder, W.; Oliva, P.; Giglio, L.; Quayle, B.; Lorenz, E.; Morelli, F. Active fire detection using Landsat-8/OLI data. Remote Sens. Environ. 2016, 185, 210–220. [Google Scholar] [CrossRef] [Green Version]
- Cicala, L.; Angelino, C.V.; Fiscante, N.; Ullo, S.L. Landsat-8 and Sentinel-2 for fire monitoring at a local scale: A case study on Vesuvius. In Proceedings of the 2018 IEEE International Conference on Environmental Engineering, Milan, Italy, 12–14 March 2018; pp. 1–6. [Google Scholar]
- Donegan, S.J.; Flynn, L.P. Comparison of the response of the Landsat 7 Enhanced Thematic Mapper Plus and the Earth Observing-1 Advanced Land Imager over active lava flows. J. Volcanol. Geotherm. Res. 2004, 135, 105–126. [Google Scholar] [CrossRef]
- Carter, A.J.; Girina, O.; Ramsey, M.S.; Demyanchuk, Y.V. ASTER and field observations of the 24 December 2006 eruption of Bezymianny Volcano, Russia. Remote Sens. Environ. 2008, 112, 2569–2577. [Google Scholar] [CrossRef]
- Wooster, M.J.; Rothery, D.A. Thermal monitoring of Lascar Volcano, Chile, using infrared data from the along-track scanning radiometer: A 1992–1995 time series. Bull. Volcanol. 1997, 58, 566–579. [Google Scholar] [CrossRef]
- Blackett, M. Early analysis of Landsat-8 thermal infrared sensor imagery of volcanic activity. Remote Sens. 2014, 6, 2282–2295. [Google Scholar] [CrossRef] [Green Version]
- Dennison, P.E.; Roberts, D.A. Daytime fire detection using airborne hyperspectral data. Remote Sens. Environ. 2009, 113, 1646–1657. [Google Scholar] [CrossRef]
- Escuin, S.; Navarro, R.; Fernandez, P. Fire severity assessment by using NBR (Normalized Burn Ratio) and NDVI (Normalized Difference Vegetation Index) derived from LANDSAT TM/ETM images. Int. J. Remote Sens. 2008, 29, 1053–1073. [Google Scholar] [CrossRef]
- Global Volcanism Program. Report on Stromboli (Italy). In Weekly Volcanic Activity Report; Sennert, S.K., Ed.; Smithsonian Institution: Washington, DC, USA; US Geological Survey: Reston, VA, USA, 2019. [Google Scholar]
- KVERT Information Releases. Sheveluch Volcano. Available online: http://www.kscnet.ru/ivs/kvert/van/index.php?type=2&name=Sheveluch (accessed on 19 November 2019).
- ASTER Volcano Archive (AVA). Available online: https://ava.jpl.nasa.gov/about.php (accessed on 19 November 2019).
- Pergola, N.; Coviello, I.; Filizzola, C.; Lacava, T.; Marchese, F.; Paciello, R.; Tramutoli, V. A review of RSTVOLC, an original algorithm for automatic detection and near-real-time monitoring of volcanic hotspots from space. Geol. Soc. Lond. Spec. Publ. 2016, 426, 55–72. [Google Scholar] [CrossRef]
- Plank, S.; Marchese, F.; Filizzola, C.; Pergola, N.; Neri, M.; Nolde, M.; Martinis, S. The July/August 2019 lava flows at the Sciara del Fuoco, Stromboli Analysis from multi-sensor infrared satellite imagery. Remote Sens. 2019, in press. [Google Scholar]
- Google Earth Engine, a Planetary-Scale Platform for Earth Science & Data Analysis. Available online: https://earthengine.google.com/ (accessed on 19 November 2019).
- Lacava, T.; Kervyn, M.; Liuzzi, M.; Marchese, F.; Pergola, N.; Tramutoli, V. Assessing performance of the RSTVOLC multi-temporal algorithm in detecting subtle hotspots at Oldoinyo Lengai (Tanzania, Africa) for comparison with MODLEN. Remote Sens. 2018, 10, 1177. [Google Scholar] [CrossRef] [Green Version]
- Tramutoli, V. Robust Satellite Techniques (RST) for Natural and Environmental Hazards Monitoring and Mitigation: Theory and Applications. In Proceedings of the 2007 International Workshop on the Analysis of Multi-temporal Remote Sensing Images, Leuven, Belgium, 18–20 July 2007. [Google Scholar]
- Gorelick, N.; Hancher, M.; Dixon, M.; Ilyushchenko, S.; Thau, D.; Moore, R. Google Earth Engine: Planetary-scale geospatial analysis for everyone. Remote Sens. Environ. 2017, 202, 18–27. [Google Scholar] [CrossRef]


| MSI Spectral Channel | Central Wavelength (nm) | Bandwidth (nm) | Spatial Resolution (m) |
|---|---|---|---|
| 1 | 443 | 20 | 60 |
| 2 | 490 | 65 | 10 |
| 3 | 560 | 35 | 10 |
| 4 | 665 | 30 | 10 |
| 5 | 705 | 15 | 20 |
| 6 | 740 | 15 | 20 |
| 7 | 783 | 20 | 20 |
| 8 | 842 | 115 | 10 |
| 8A | 865 | 20 | 20 |
| 9 | 945 | 20 | 60 |
| 10 | 1375 | 30 | 60 |
| 11 | 1610 | 90 | 20 |
| 12 | 2190 | 180 | 20 |
| OLI Spectral Channel | Central Wavelength (nm) | Bandwidth (nm) | Spatial Resolution (m) |
|---|---|---|---|
| 1 | 443 | 16 | 30 |
| 2 | 482.6 | 60 | 30 |
| 3 | 561.3 | 57 | 30 |
| 4 | 654.6 | 37 | 30 |
| 5 | 864.6 | 28 | 30 |
| 6 | 1609.1 | 85 | 30 |
| 7 | 2201.7 | 187 | 30 |
| 8 | 590 | 172 | 15 |
| 9 | 1373 | 20 | 30 |
© 2019 by the authors. Licensee MDPI, Basel, Switzerland. This article is an open access article distributed under the terms and conditions of the Creative Commons Attribution (CC BY) license (http://creativecommons.org/licenses/by/4.0/).
Share and Cite
Marchese, F.; Genzano, N.; Neri, M.; Falconieri, A.; Mazzeo, G.; Pergola, N. A Multi-Channel Algorithm for Mapping Volcanic Thermal Anomalies by Means of Sentinel-2 MSI and Landsat-8 OLI Data. Remote Sens. 2019, 11, 2876. https://0-doi-org.brum.beds.ac.uk/10.3390/rs11232876
Marchese F, Genzano N, Neri M, Falconieri A, Mazzeo G, Pergola N. A Multi-Channel Algorithm for Mapping Volcanic Thermal Anomalies by Means of Sentinel-2 MSI and Landsat-8 OLI Data. Remote Sensing. 2019; 11(23):2876. https://0-doi-org.brum.beds.ac.uk/10.3390/rs11232876
Chicago/Turabian StyleMarchese, Francesco, Nicola Genzano, Marco Neri, Alfredo Falconieri, Giuseppe Mazzeo, and Nicola Pergola. 2019. "A Multi-Channel Algorithm for Mapping Volcanic Thermal Anomalies by Means of Sentinel-2 MSI and Landsat-8 OLI Data" Remote Sensing 11, no. 23: 2876. https://0-doi-org.brum.beds.ac.uk/10.3390/rs11232876