Article

Temporal Variability of Precipitation and Biomass of Alpine Grasslands on the Northern Tibetan Plateau

1
Lhasa National Ecological Research Station, Key Laboratory of Ecosystem Network Observation and Modelling, Institute of Geographic Sciences and Natural Resources Research, Chinese Academy of Sciences, Beijing 100101, China
2
University of Chinese Academy of Science, Beijing 100049, China
3
Freie Universität Berlin, Institute of Biology, Biodiversity/Theoretical Ecology, 14195 Berlin, Germany
4
Key Laboratory of Watershed Geographic Sciences, Nanjing Institute of Geography and Limnology, Chinese Academy of Sciences, Nanjing 210008, China
5
Department of Land, Environment, Agriculture and Forestry, University of Padova, 35020 Legnaro (PD), Italy
6
Berlin-Brandenburg Institute of Advanced Biodiversity Research (BBIB), 14195 Berlin, Germany
*
Author to whom correspondence should be addressed.
Submission received: 17 January 2019 / Revised: 3 February 2019 / Accepted: 7 February 2019 / Published: 11 February 2019

Abstract

:
The timing regimes of precipitation can exert profound impacts on grassland ecosystems. However, it is still unclear how the peak aboveground biomass (AGBpeak) of alpine grasslands responds to the temporal variability of growing season precipitation (GSP) on the northern Tibetan Plateau. Here, the temporal variability of precipitation was defined as the number and intensity of precipitation events as well as the time interval between consecutive precipitation events. We conducted annual field measurements of AGBpeak between 2009 and 2016 at four sites that were representative of alpine meadow, meadow-steppe, alpine steppe, and desert-steppe. Thus, an empirical model was established with the time series of the field-measured AGBpeak and the corresponding enhanced vegetation index (EVI) (R2 = 0.78), which was used to estimate grassland AGBpeak at the regional scale. The relative importance of the three indices of the temporal variability of precipitation, events, intensity, and time interval on grassland AGBpeak was quantified by principal component regression and shown in a red–green–blue (RGB) composition map. The standardized importance values were used to calculate the vegetation sensitivity index to the temporal variability of precipitation (VSIP). Our results showed that the standardized VSIP was larger than 60 for only 15% of alpine grassland pixels and that AGBpeak did not change significantly for more than 60% of alpine grassland pixels over the past decades, which was likely due to the nonsignificant changes in the temporal variability of precipitation in most pixels. However, a U-shaped relationship was found between VSIP and GSP across the four representative grassland types, indicating that the sensitivity of grassland AGBpeak to precipitation was dependent on the types of grassland communities. Moreover, we found that the temporal variability of precipitation explained more of the field-measured AGBpeak variance than did the total amount of precipitation alone at the site scale, which implies that the mechanisms underlying how the temporal variability of precipitation controls the AGBpeak of alpine grasslands should be better understood at the local scale. We hypothesize that alpine grassland plants promptly respond to the temporal variability of precipitation to keep community biomass production more stable over time, but this conclusion should be further tested. Finally, we call for a long-term experimental study that includes multiple natural and anthropogenic factors together, such as warming, nitrogen deposition, and grazing and fencing, to better understand the mechanisms of alpine grassland stability on the Tibetan Plateau.

1. Introduction

Our planet has experienced drastic global climate change, with accelerating warming and shifting precipitation regimes, in past decades [1,2,3]. Climate change affects ecosystem services and functions by altering vegetation phenology, plant community composition, and biogeochemical cycles [4,5,6]. For example, semiarid grasslands in East Africa are threatened in the context of increasing climate variability and climate extremes, especially in terms of ecosystem productivity and stability [7]. Therefore, for sustainable development, it is crucial to assess how ecosystems respond to climate change [8,9,10].
In dry regions worldwide, grasslands are essential for maintaining the livelihoods of humans and wildlife [8]. Precipitation is the primary factor regulating the community structure and ecosystem functions of grasslands in such areas, as documented by in situ experiments of manipulated precipitation [11,12,13], long-term field observations [7,14,15], and large-scale ecological modelling studies [9,16,17]. Precipitation extremes are predicted to occur more frequently with global warming [1,18]. Therefore, it is urgent to clarify the sensitivity of grasslands to the temporal variability of precipitation at different spatial scales [10,17,19].
Previous studies have shown that grassland productivity (or peak aboveground biomass, AGBpeak) is linearly correlated with mean annual precipitation in temperate grasslands [13,20] because the interannual variability of precipitation can significantly affect the community composition [21,22]. However, such a linear correlation between productivity and precipitation is not universal across biomes and is even non-significant in some water-limited grasslands [23,24]. In previous studies, the varying shape of the productivity–precipitation relationship was attributed to the temporal distribution of precipitation [18,25,26] because soil moisture and nutrient availability match well with the temporal variability of precipitation [12,18,19,20,27].
Generally, the temporal variability of precipitation can be as crucial as the total amount of precipitation in terms of regulating ecological processes in temperate grasslands. Mongolian temperate grasslands are, however, more sensitive to the timing of precipitation rather than to the number of manipulated precipitation events [28]. Decreased precipitation can reduce the rates of ecosystem CO2 and water exchange in semiarid temperate grasslands [5,29]. Extended time intervals between precipitation events can also decrease grassland productivity even if the amount of precipitation remains the same [12]. A stronger precipitation event after a drought event can prompt plants to regrow due to the improvements in soil water and nutrient availability [16,30]. In addition, the intensity of precipitation events can also affect grassland production through altered rates of denitrification and nitrification [31]. However, little is known about the importance of the number and intensity of precipitation events as well as the time interval between precipitation events on alpine grasslands.
Alpine grasslands on the Tibetan Plateau are sensitive and vulnerable to climate change and human disturbances [32,33,34]. Precipitation is more critical than temperature in driving the spatiotemporal dynamics of alpine grasslands on the Tibetan Plateau [35,36,37]. For example, Fu, et al. [38] found that increased precipitation contributed more than experimental warming to the variance of aboveground productivity in the alpine meadows of the central Tibetan Plateau. Due to the high altitudes and low temperatures, the plant growing season is rather short, and herbaceous plants on the Tibetan Plateau can grow only from May to September [34,39]. Moreover, Li, et al. [40] found that alpine herbaceous plants can sense the arrival of monsoon-season precipitation and become ready beforehand for leaf unfolding. This phenomenon might be evidence of why the temporal variability of precipitation is essential for understanding the phenology dynamics of Tibetan grasslands [34,41,42].
Several studies have tried to decompose and assess the sensitivity of vegetation productivity to changes in key climate variables. At the global scale, Seddon, et al. [9] disentangled the sensitivity of global terrestrial ecosystems to the inter-annual variabilities of temperature, precipitation, and cloud cover, and this study used the time series of the enhanced vegetation index (EVI) as the response variable. At the regional scale, Yao, et al. [37] decomposed the proportional contributions of temperature, precipitation, and radiation and found that precipitation was the primary contributor to the dynamics of grassland productivity in Tibet. However, neither study addressed the relative importance of the temporal variability of precipitation events on alpine grassland sensitivity on the Tibetan Plateau. To fill these knowledge gaps, in this study, we primarily aimed to explore the sensitivity of AGBpeak of alpine grasslands on the Tibetan Plateau in repose to the temporal variability of precipitation during the plant growing season, including the number, intensity, and time intervals of precipitation events.

2. Materials and Methods
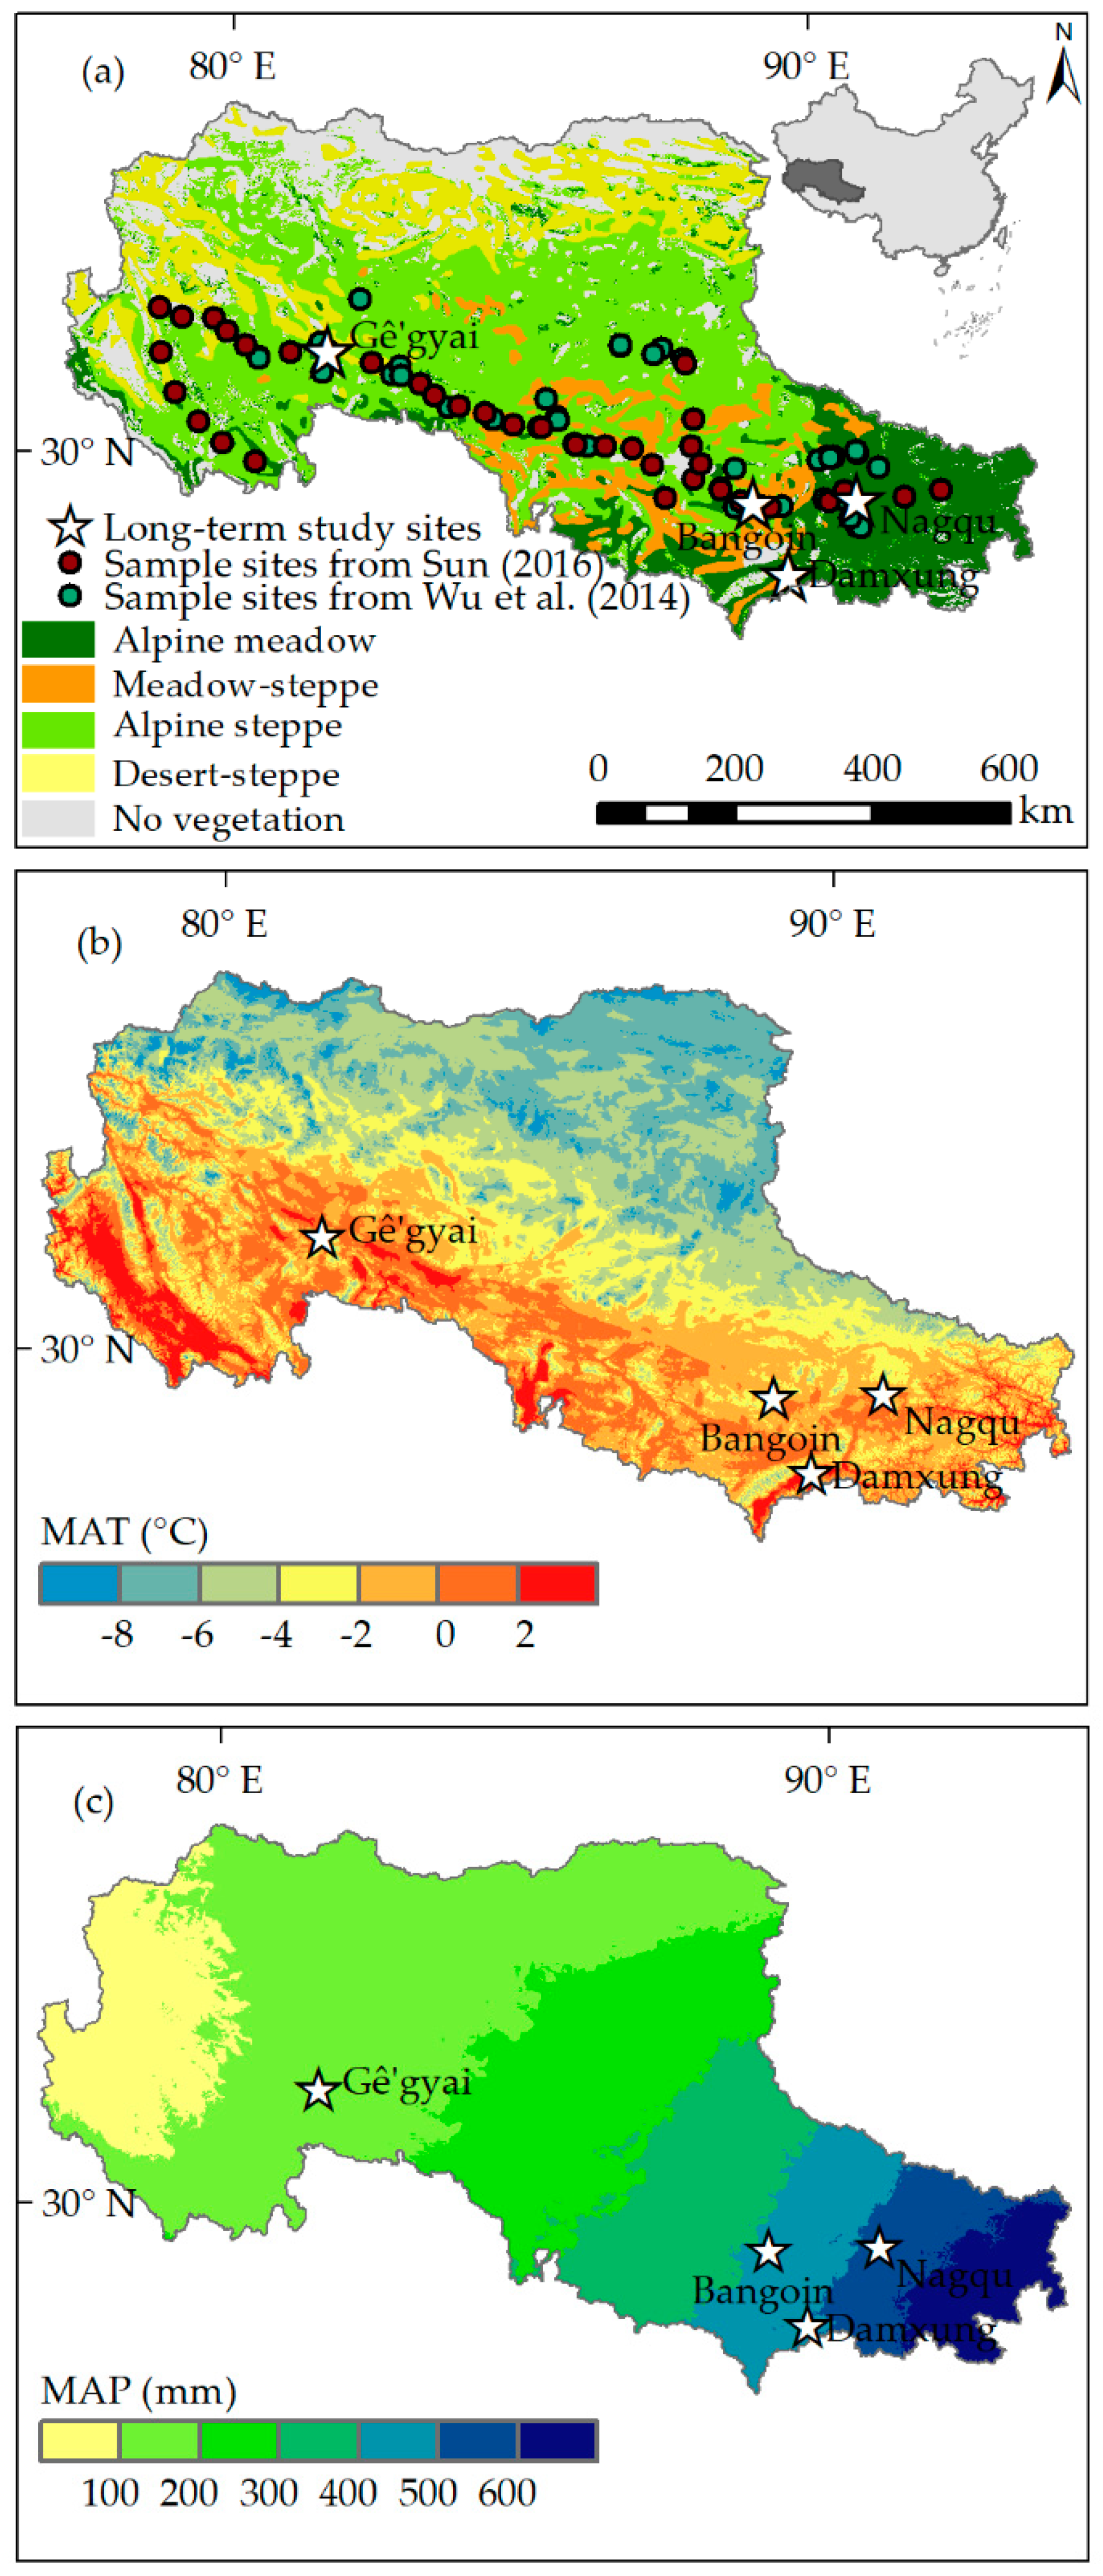
2.1. Study Area

The study region locates in the northern Tibetan Plateau and covers approximately 600,000 km2 of land in total. Alpine grasslands in this region account for more than 50% of the total land area of the Tibetan Autonomous Region, China [43]. The northern Tibetan Plateau is also named ‘Changtang’ by local herdsmen, which is one of the most important and traditional nomadic areas in Tibet [44]. The ‘Changtang National Nature Reserve’, the largest national nature reserve in China for Tibetan antelope conservation, covers approximately 300,000 km2 of land in the center of the northern Tibetan Plateau [45]. The northern Tibetan Plateau is the most sparsely populated region in China, and the average population density is approximately 0.2 persons per square kilometer [43]. All the natural and social regimes mentioned above make the northern Tibetan Plateau an ideal region for research on the vegetation–climate relationship.
The climate of the northern Tibetan Plateau is characterized by an increasing mean annual temperature (MAT) and a decreasing mean annual precipitation (MAP) from east to west (Figure 1b,c). The spatial distribution of the zonal alpine grassland types closely follows such climatic patterns [32,46]: alpine meadows dominated by Kobresia pygmaea are mainly found in the humid southeast areas, with MAPs higher than 400 mm and MATs warmer than −2 °C; alpine meadow steppes co-dominated by K. pygmaea and Stipa capillacea occur in central southern Changtang, with MAPs between 300 and 500 mm and MATs between −4 and 2 °C; alpine steppe dominated by the S. capillacea widely distributed grassland type in the semi-arid central and western areas, with MAPs between 100 and 400 mm and MATs warmer than −6 °C; and desert-steppes co-dominated by S. purpurea and S. glareosa scattered in the warm, arid western areas, with MAPs less than 200 mm and MATs above 0 °C, and with MATs colder than −4 °C and MAPs between 100 and 200 mm in the cold arid northern areas (Figure 1).

2.2. In Situ Long-Term AGBpeak Measurements

Herbaceous plants on the northern Tibetan Plateau start to sprout in early May, peak at their maximum coverage and aboveground biomass in the middle of August and senesce in early September [49]. Therefore, the AGBpeak sampled in August was always used as a proxy of the aboveground net primary productivity in recent studies [34,39]. In this study, we conducted annual aboveground biomass harvests in August from 2009 to 2016 at the four representative sites (Figure 1a), which were located in Damxung, Nagqu, Bangoin, and Gê’gyai counties, respectively, to represent for the zonal grassland types of meadow-steppe, alpine meadow, alpine steppe, and desert-steppe, for a long-term research plan (Table 1).
At each site, we built a permanent plot of 1000 × 1000 m in spring 2009 within a flat area where vegetation and soil were relatively homogeneous. During field surveys, five random 1 × 1 m quadrats were arranged at least 50–200 m intervals from each other in such a permanent plot to match the spatial resolution of the remote sensing data as much as possible. Because of the sparse population and irregular settlements on the northern Tibetan Plateau [43], it is hard to estimate the spatial grazing rates accurately at a pixel scale across such a vast area. Therefore, in the following step, AGBpeak at the regional scale was estimated by an empirical model that was built based on field measurements and the remote sensing data from 2009 to 2016 at the four fenced reprehensive sites.

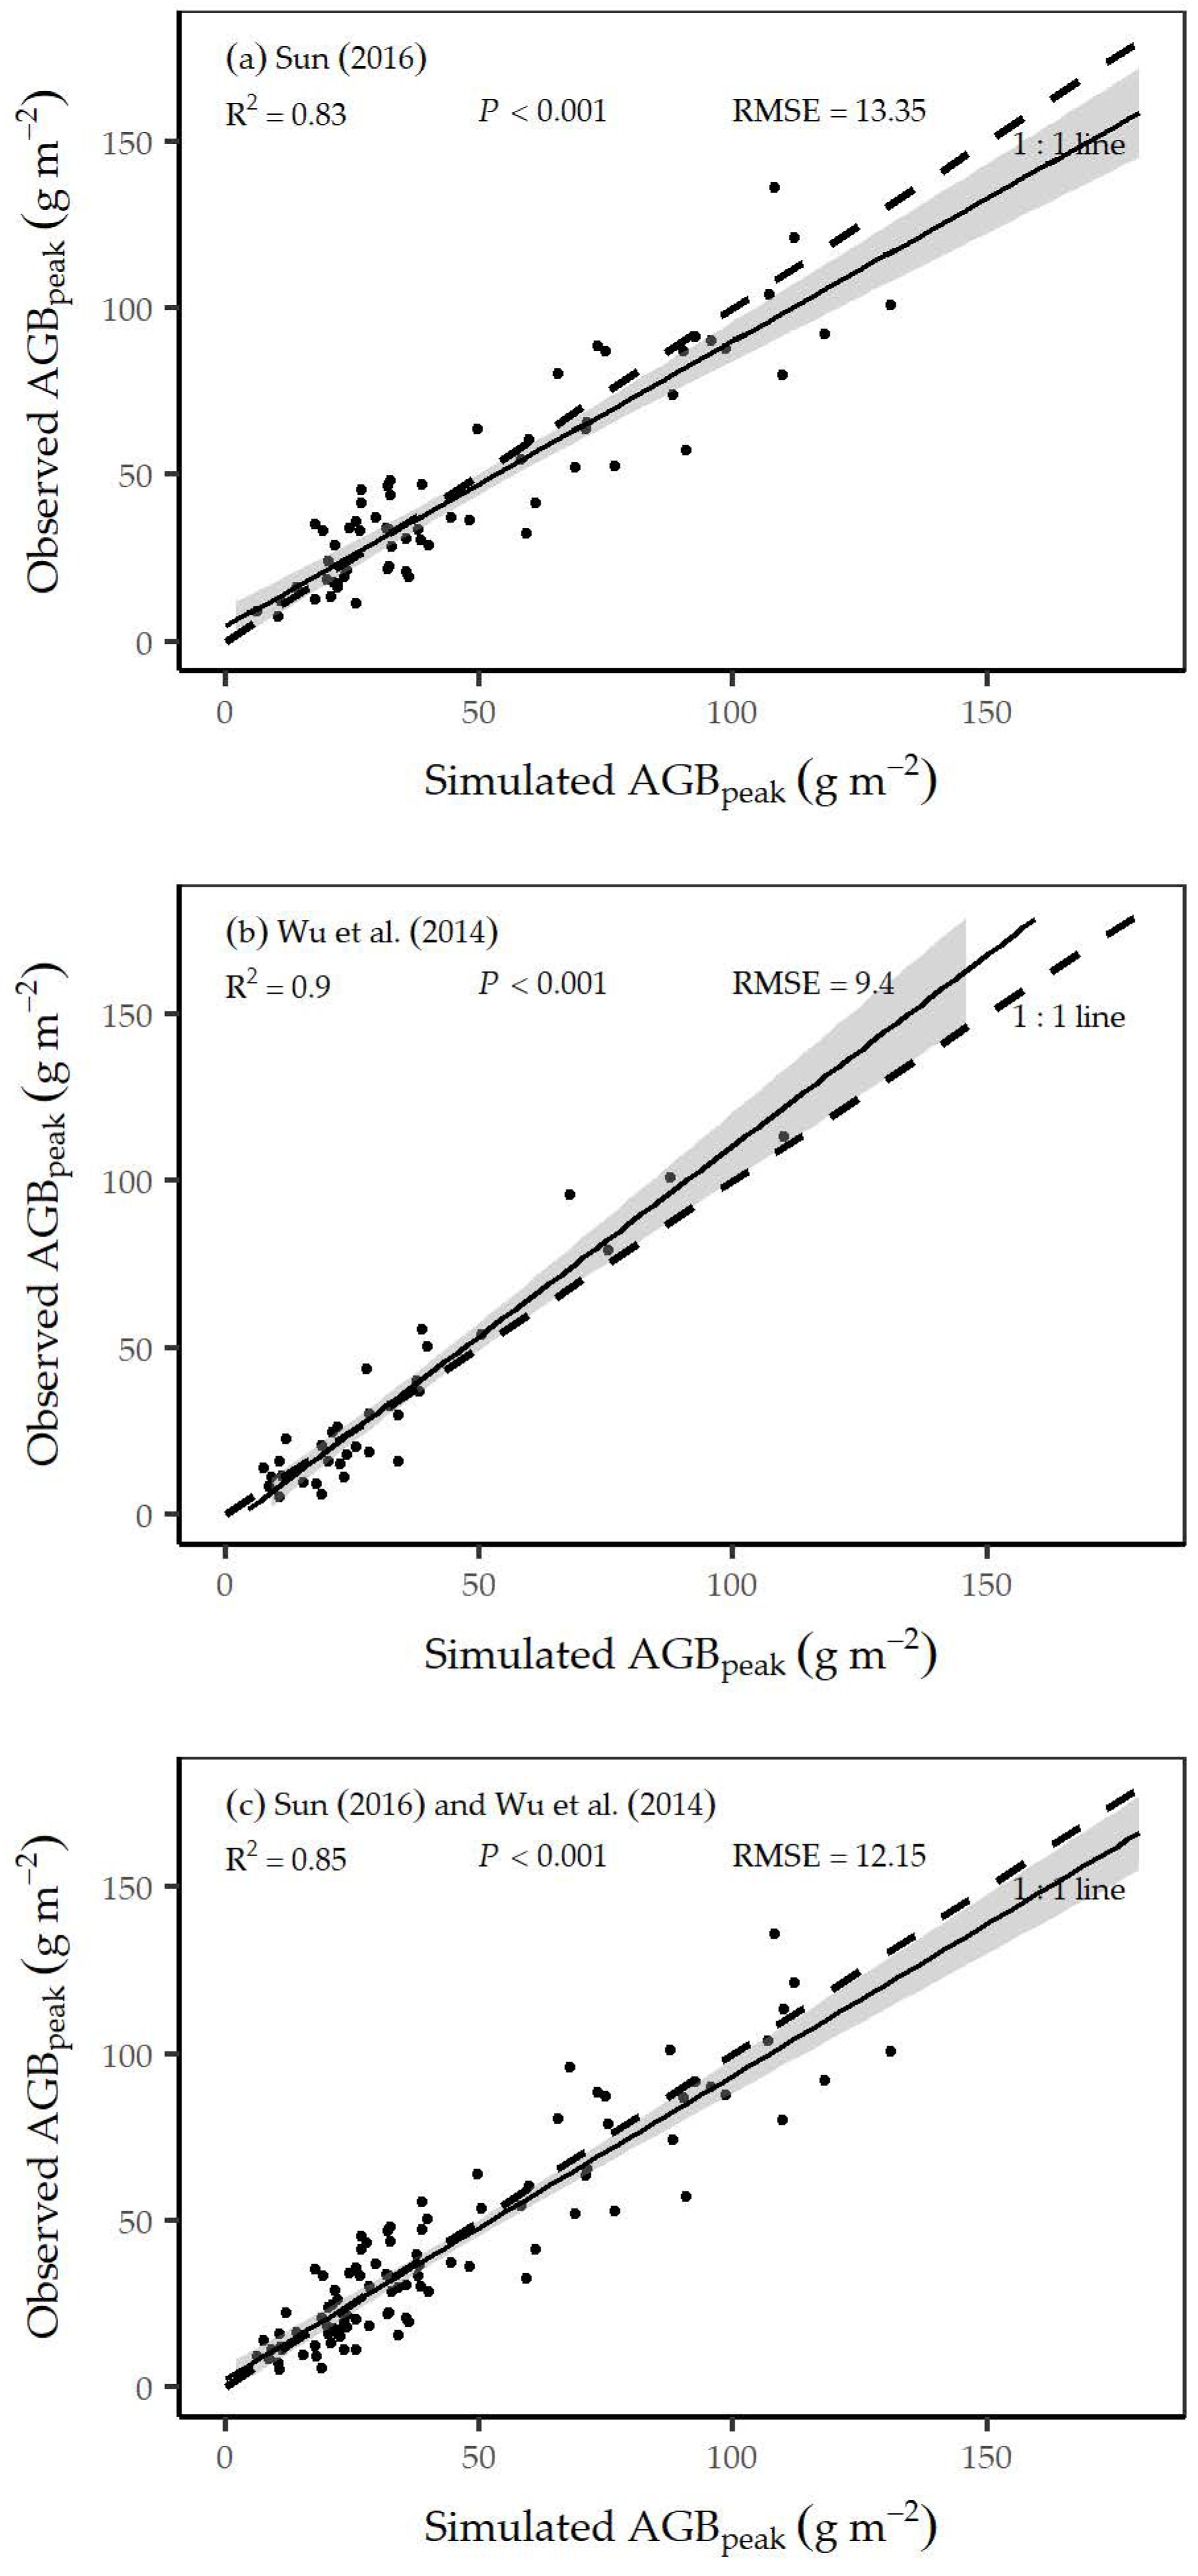
2.3. AGBpeak Estimation at the Regional Scale

To estimate to estimate AGBpeak for the whole study area from 2000 to 2016, we derived the enhanced vegetation index (EVI) data from the sixth version of the Moderate Resolution Imaging Spectroradiometer (MODIS) product (MOD09A1), which was available from the National Aeronautics and Space Administration Agency (http://daac.gsfc.nasa.gov/). The EVI data were with a temporal resolution of eight days and a spatial resolution of 500 m × 500 m. Prior to data analysis, we first used the TIMESAT to smooth and reconstruct the time series EVI, which allows to exclude the effects of cloud, snow and ice contamination and also helps to identify the starting and ending dates of the plant growing season (i.e., from May to September) [50] (see Figure S1 for the smoothed long-term EVI data at the alpine meadow (Nagqu) site). Then, we resampled the EVI data to a spatial resolution of 1 × 1 km using the nearest neighbor interpolation method [51].
We calculated the average EVI during the plant growing season from May to September (GEVI) and extracted the peak EVI value (EVIpeak). We also calculated the average EVI before reaching the peak value (EVIbeforepeak). Thus, we built 12 candidate models between in situ measured AGBpeak and the corresponding GEVI, EVIpeak, and EVIbeforepeak for regional AGBpeak estimation (see details in Table S1 and Figure S2 for model comparison). Finally, the linear relationship between AGBpeak and GEVI, AGBpeak = −21.3 + 545.2 × GEVI (R2 = 0.78, p < 0.001), was confirmed to be the best-fitted model.
To validate its applicability to such a vast area and across grassland types, we collected two independent datasets of AGBpeak measured by Sun [47] and Wu, et al. [48] in the same study area (Figure 1a). We compared the simulated AGBpeak values with their field measurements and calculated the root mean square error (RMSE) between the simulated and observed AGBpeak. Finally, we found that the RMSE values were small, i.e., 13.35 for the data from Sun [47], 9.40 for Wu et al. [48], and 12.15 for their data mixed together (Figure 2), which indicated that the best-fitted linear model can be applied to AGBpeak estimation across the entire study area even though some uncertainties remain. Similar studies that used an empirical model between remote sensing vegetation index and field measured biomass at the local scale to broader spatial scales can also be found on the Tibetan Plateau and other grassland regions of the world [52,53,54,55,56].

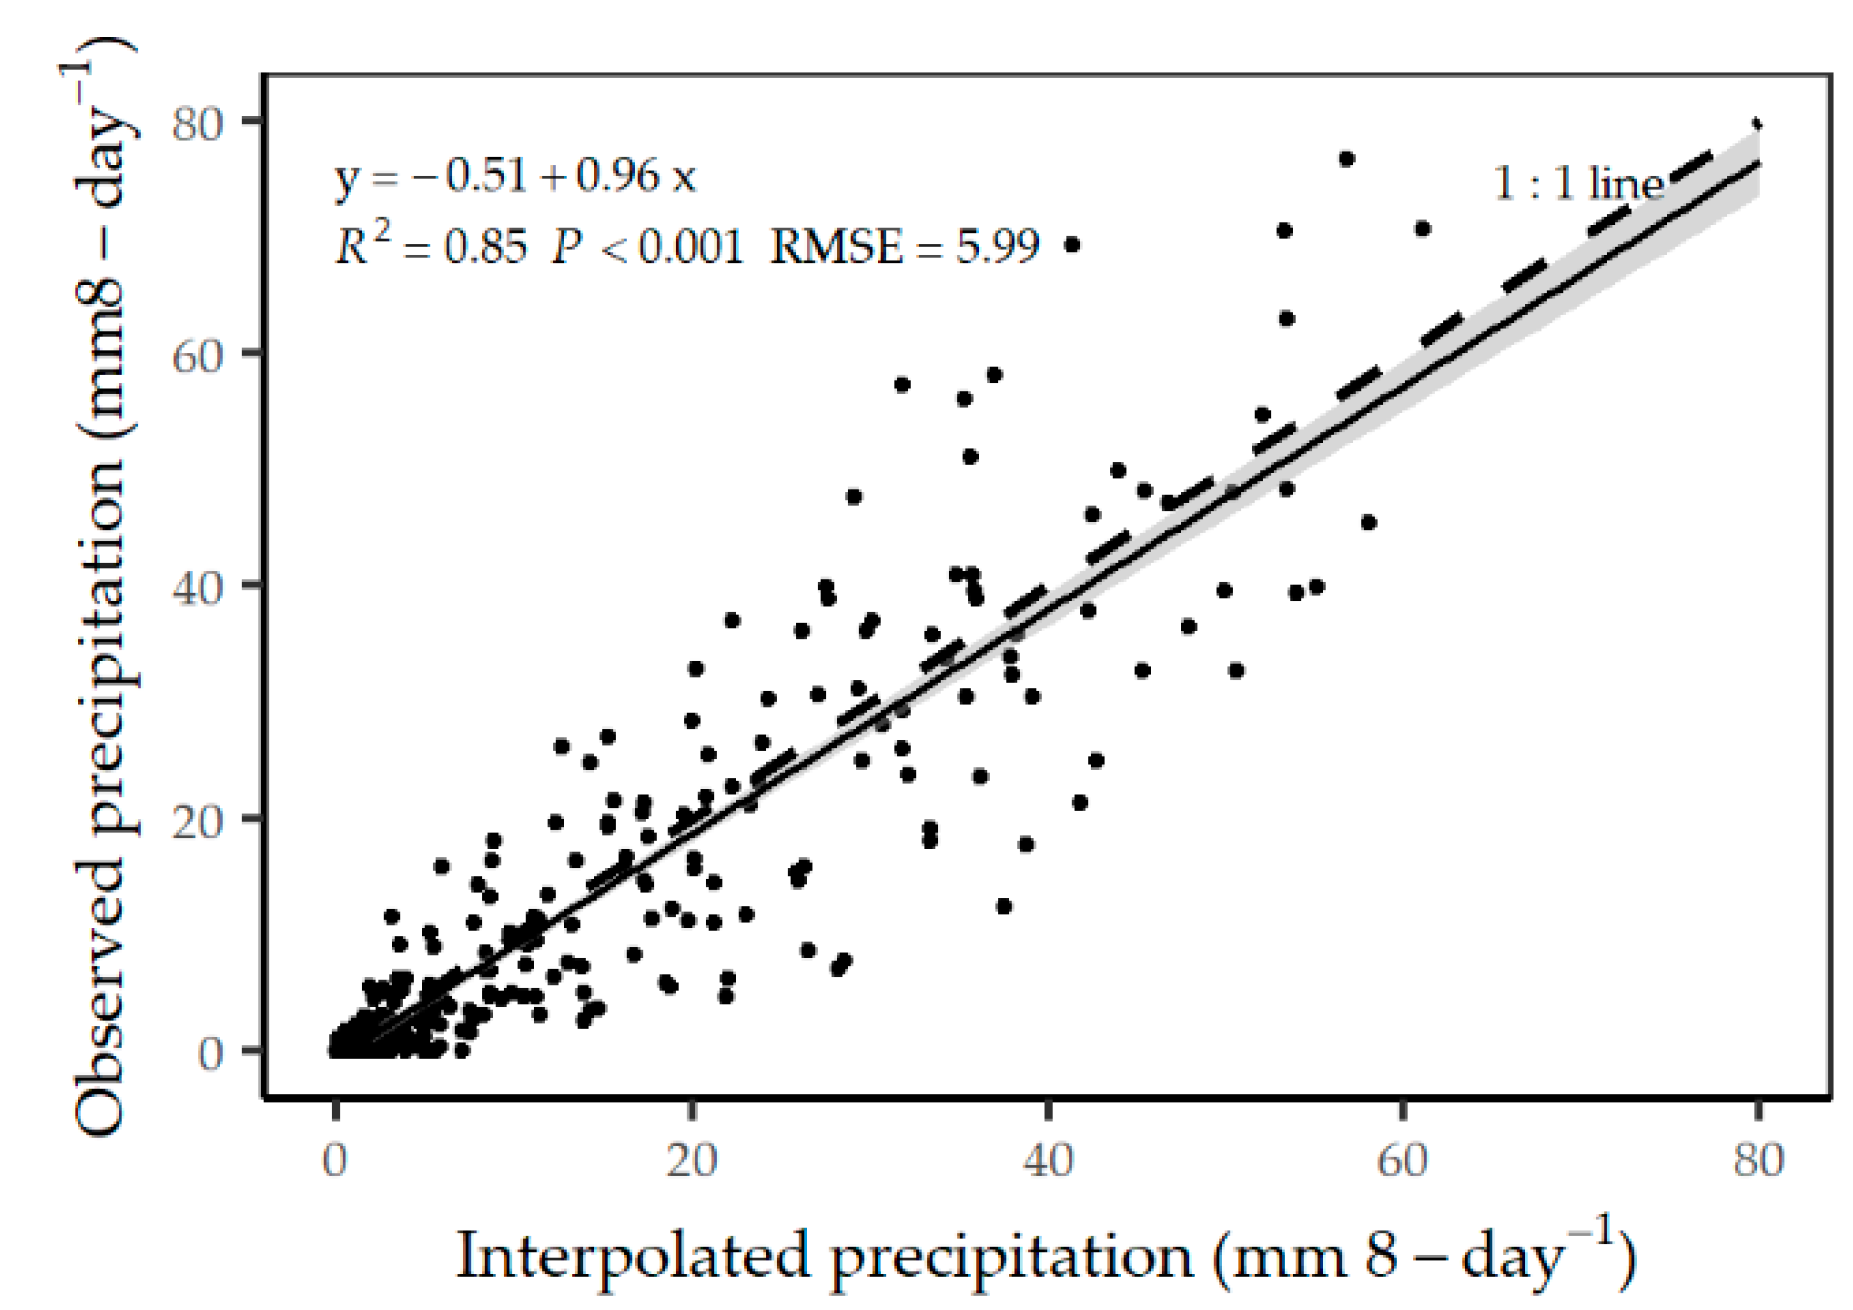
2.4. Temporal Variability of Growing Season Precipitation

To determine the temporal variability of growing season precipitation, we downloaded the daily precipitation records from the China Meteorological Data Service Center (http://data.cma.cn/en) [57]. The precipitation observations from 200 meteorological stations, with long-term (17 years) records within the Qinghai-Tibetan Plateau, were used for spatial interpolation based on the method described in Chen, et al. [58]. To match the remote sensing GEVI data, we first recalculated the daily precipitation records at the same temporal resolution of eight days. Next, we interpolated the precipitation data into raster surfaces at a 1 × 1 km resolution using ANUSPLIN 4.3 [59], which allows to include covariate variables to improve the interpolation accuracy. Here, we selected elevation as the covariate variable and finally found that the interpolated precipitation data matched well with the rainfall records (Figure 3) automatically logged by HOBO weather stations (Onset Computer Corporation), which were set up in spring 2009 at the four representative sites. According to the smoothed annual EVI datasets, plants generally grow from the 16th 8-day period to the 34th 8-day period across the northern Tibetan Plateau. Therefore, the total amount of precipitation during the 16th–34th 8-day period was summed as the yearly growing season precipitation (GSP).
To quantify the effects of the temporal variability of precipitation, we defined a single precipitation event when the amount of rainfall was more than 2 mm at the pixel scale within each 8-day period. This method allowed us to count how many precipitation events occurred during the plant growing season. The total precipitation amount per event was defined as the precipitation intensity, and the time gap between each set of consecutive events was nominated as the time interval. Finally, the number, intensity, and interval of precipitation events were used to quantify the temporal variability of precipitation during the plant growing seasons of 2000–2016. The variations of GSP and its temporal variability across the northern Tibetan Plateau during the study period (2000–2016) were shown in (Table 2).

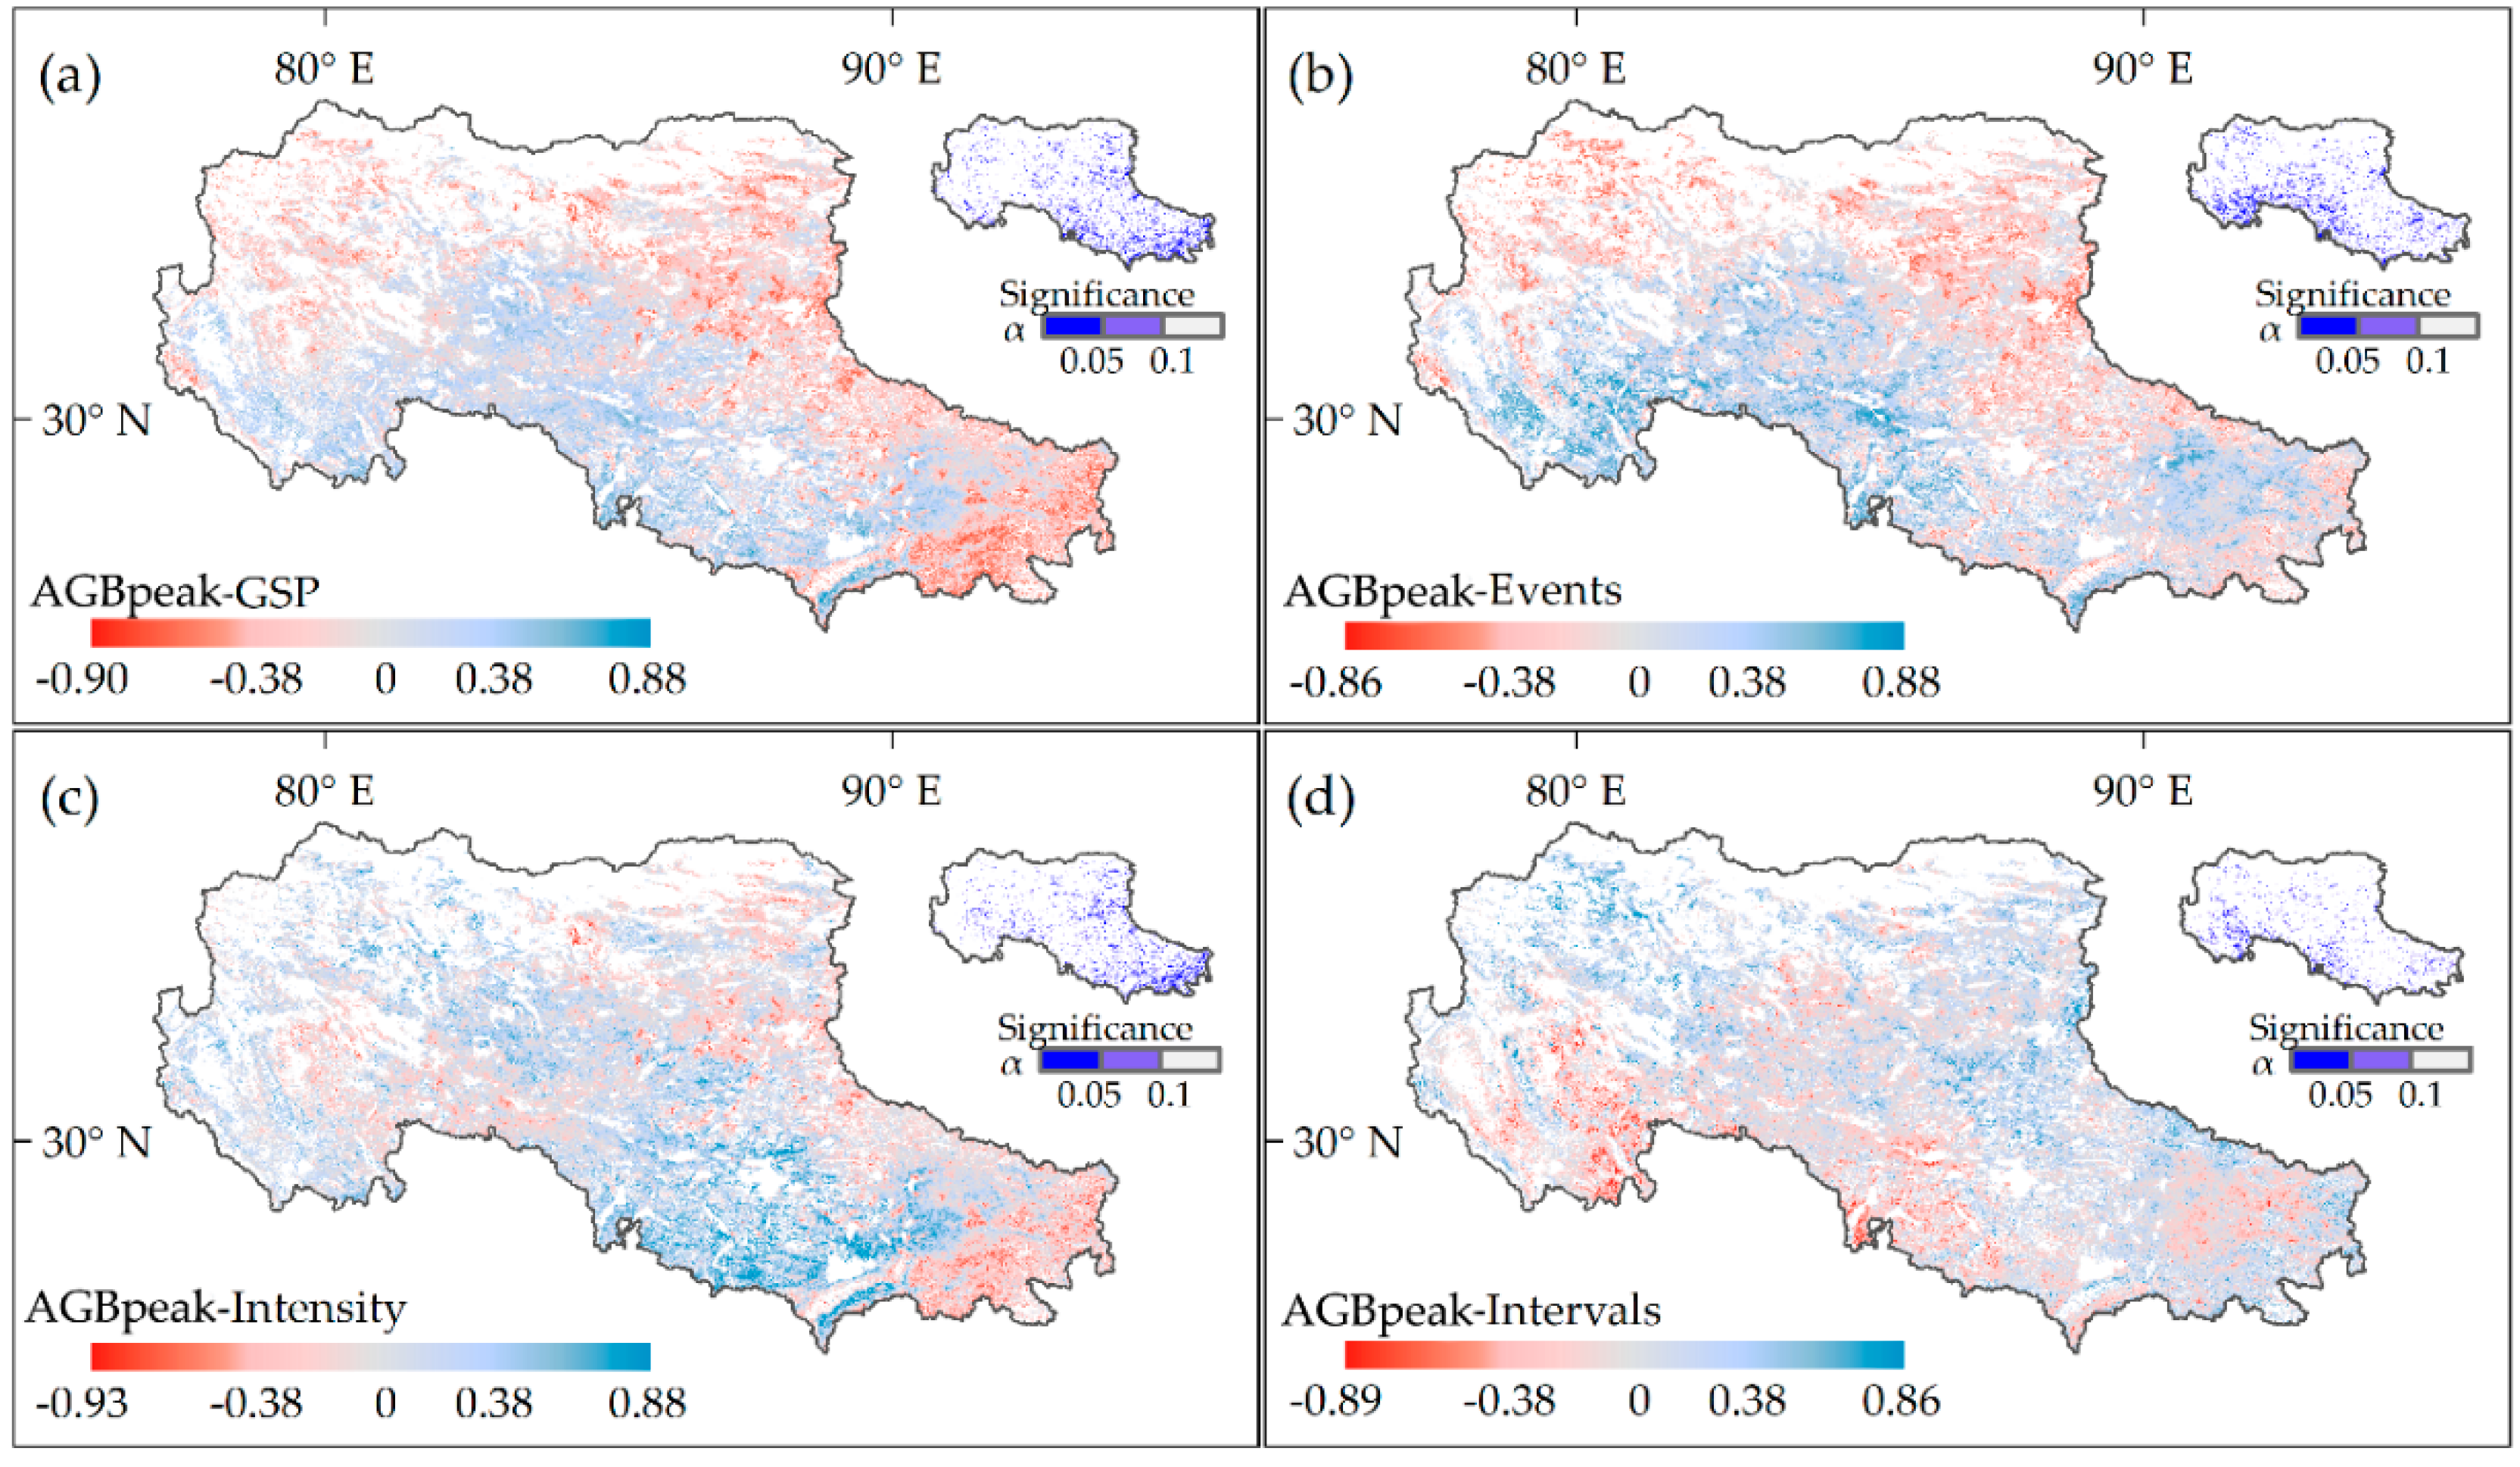
2.5. Relationship between AGBpeak and GSP as well as Its Temporal Variability

First, we examined the relationship of AGBpeak with GSP and its temporal variability at the site level. We observed that AGBpeak exponentially increased with the total precipitation amount, the total number and the intensity of precipitation events during the plant growing season (Figure 4a–c) and exponentially decreased with the time interval between precipitation events (Figure 4d). Then, we conducted Pearson correlation analysis to investigate the relationships between AGBpeak and GSP as well as its temporal variability at the pixel scale across the entire northern Tibetan Plateau [60,61]. In this step, pixels were categorized into three groups—significantly positive, significantly negative, and insignificant correlations at α = 0.1 level for each alpine grassland type on the northern Tibetan Plateau (see Table S2 for summary and Figure 5 for the spatial pattern below in the Result section).

2.6. Sensitivity of Grassland AGBpeak to the Temporal Variability of Precipitation

In this study, we paid much closer attention to the sensitivity of alpine grassland AGBpeak in response to the temporal variability of precipitation during plant growth season, the number and intensity of precipitation events as well as to the time intervals between each set of consecutive events. Seddon et al. [9] developed a set of useful algorithms to decompose the sensitivity of the normalized difference vegetation index (NDVI) to temperature, precipitation, and radiation for global terrestrial ecosystems, and they showed the relative importance of the three climatic factors using a red–green–blue (RGB) composition map. First, we transformed the time series of AGBpeak and three indices of precipitation variability to z-score anomalies using the variable’s mean and standard deviation for further analyses.
Then, we used principal component regression (PCR) to identify the relative importance of each facet of the temporal variability of GSP in driving the annual variations in the estimated AGBpeak for each pixel. The loading score of each facet was multiplied by the PCR coefficients and summed to calculate its relative importance. The absolute mean values of the variable-transformed PCR coefficients are shown in an RGB composition map as in Seddon, et al. [9] and Yao, et al. [37] for the spatial pattern of the relative weights of the temporal variability of precipitation events, intensity, and intervals (noted as Wevents, Wintensity, Winterval, respectively, hereafter). The weights were also rescaled between zero and one before calculating the vegetation sensitivity index in response to the temporal variability of precipitation (VSIP).
Next, the residuals of the exponential models fitted to the mean-variance relationships between the AGBpeak and three timing variability indices of precipitation events, intensity, and intervals (noted as RAGBpeak, Revents, Rintensity, and Rinterval, respectively) were used to calculate the sensitivity metrics. We also standardized the residuals between 0 and 100 for each variable. Finally, the ratios of residuals of AGBpeak and each index of the temporal variability of precipitation were log10-transformed to calculate the sensitivity metrics (Si).
S i = log ( ( R AGBpeak * + 1 ) / ( R i * + 1 ) )
VSIP = i = 1 3 S i × W i
where R*AGBpeak represents the standardized residuals of AGBpeak and R*i represents the standardized residuals of precipitation events, intensity, and intervals, respectively. In this study, VSIP was the sum of the sensitivity metrics (Si) weighted by the corresponding relative weight (Wi) of each index of the temporal variability of precipitation. A higher VSIP value at the pixel scale indicates where alpine grassland AGBpeak is more sensitive to the temporal variability of precipitation during the plant growing season. The relative contributions of precipitation events, intensity, and time interval to different levels of VSIP were summarized in Table S3.

2.7. Mapping the Temporal Trends in Estimated AGBpeak and Precipitation Variability

To examine if AGBpeak kept in step with temporal changes of precipitation at the pixel scale, we compared the trend of AGBpeak with that of each index of the temporal variability of precipitation. We first calculated the z-scores, which are the number of standard deviations (stdev) from the mean, for each variable at the pixel scale. Then, we applied the Theil–Sen slope analysis at the pixel scale, which is a non-parametric median-based method not subjected to linear regression assumptions [26,62]. In a similar study on land degradation in North Africa, Mariano et al. [26] defined the pixels with the Theil–Sen slopes of the leaf area index (LAI) outside the range of one standard deviation around the mean as significant decreasing or increasing trends.
For the alpine grasslands on the northern Tibetan Plateau, however, we can capture the most extreme trends with this threshold. Therefore, we redefined the Theil–Sen slope values beyond the range of mean ± stdev and considered significant trends. Otherwise, the values within the range of one standard deviation around the mean were considered stable without increasing or decreasing trends. In the following step, the Mann–Kendall (MK) non-parametric test was used to examine whether the slope was significant at the pixel scale. The MK test outputs z-statistics and p values, and it considers an increasing trend as a z value higher than 1.96 and a decreasing trend with a z value lower than −1.96, with a significance level of α = 0.05 [26,63].
Finally, we categorized the variations of each variable into five classes, showing significant increasing, insignificant increasing, significant decreasing, and insignificant decreasing trends as well as stability over time at the pixel scale.
All data analyses were performed in R 3.3.3 [64]. Maps were generated using ArcGIS 10.2 (Environmental Systems Research Institute, ESRI).

3. Results

3.1. Correlations of Alpine Grassland AGBpeak with Growing Season Precipitation

Alpine grassland AGBpeak showed different spatial patterns of correlations with the temporal variability of precipitation over the entire study area (Figure 5). Specifically, AGBpeak showed significant correlations with the total precipitation amount during the plant growing season, which was negative for 11.14% and positive for 7.93% of the pixels (Figure 5a). AGBpeak was significantly correlated with the total number of precipitation events, with a positive correlation for 13.52% of the pixels and a negative correlation for 4.77% of the pixels (Figure 5b). The correlation between AGBpeak and the intensity of precipitation events was significantly positive only for 3.90% and negative for 12.02% of the pixels (Figure 5c). The correlation between AGBpeak and the time interval between precipitation events was found to be positive for only 2.97% of the pixels and negative for 7.95% of the pixels (Figure 5d) at the α = 0.1 level.
AGBpeak also showed different correlations with each of the three indices of the temporal variability of precipitation among and within alpine grassland types (Table S2). At the vegetation type level, significant correlations were observed between AGBpeak and total precipitation amount, positively or negatively at the α = 0.1 level, for only 25.89% of alpine meadow, followed by 24.12% of alpine meadow-steppe, 15.47% of alpine steppe, and 13.81% of desert steppe at the pixel scale (Table S2). The correlation between the AGBpeak and intensity of precipitation events was significant for a larger number of pixels in alpine meadow (24.79%) than in the three other grassland types (17.46% in meadow-steppe, 11.85% in alpine steppe, and 13.09% in desert-steppe). Moreover, at each grassland type, AGBpeak showed different correlations with these three indices of the temporal variability of precipitation. For example, AGBpeak of alpine steppe was found to be positively correlated with precipitation events in 17.39% of pixels, negatively with precipitation event intensity in 9.11% of pixels, and negatively with precipitation time interval in 9.14% of pixels (Table S2).

3.2. Sensitivity of Alpine Grassland AGBpeak to the Temporal Variability of Precipitation

The standardized VSIP showed a clear spatial pattern on the northern Tibetan Plateau (Figure 6a) but also indicated that alpine grasslands were not highly sensitive as was expected to the temporal variability of precipitation in this region. Alpine grasslands with VSIP > 80 accounted for only 2.64% of deserts steppe and 10.58% of alpine meadow, respectively. For 32.85% of the pixels over the entire northern Tibetan Plateau, AGBpeak was moderately sensitive (40 < VSIP < 60) to the temporal variability of precipitation. For 59.03% of alpine steppe and 63.04% of alpine meadow steppe pixels, AGBpeak was less sensitive (20 < VSIP < 40) to the temporal variability of precipitation. However, at more than 70% of alpine meadow and 65% of desert steppe pixels, AGBpeak was moderately sensitive (40 < VSIP < 60) or highly sensitive (VSIP > 60) to the temporal variability of precipitation (Figure 6a and Table 3). At the pixel scale, alpine meadow and meadow-steppe in the south-eastern areas were more sensitive to the number of precipitation events and the time interval between precipitation events than to the intensity of precipitation events (Figure 6b). In contrast, alpine steppes in the central areas were more sensitive to the intensity of precipitation events than they were to the other two indices during the plant growing seasons (Figure 6b). Desert steppes in the western and north-western areas were found to be more sensitive to the number of precipitation events and to the time interval between precipitation events (Figure 6b).
Our evidence from field measurements also showed that the three indices of the temporal variability of precipitation explained more variance in plant community AGBpeak than did the total amount of precipitation alone (Figure 7a). The proportions of AGBpeak variance explained by the temporal variability of precipitation in alpine meadow and meadow-steppe sites, respectively, were 4.8 and 1.4 times greater than the proportions of AGBpeak variance explained by the total precipitation amount alone. At the alpine steppe site, the three indices of the temporal variability of precipitation explained 16% as much of the AGBpeak variance compared to the total precipitation amount alone. At the desert steppe site, the three indices explained 7% more of the AGBpeak variance than did the total precipitation amount alone.
We found a U-shaped response between the vegetation sensitivity index and the total growing season precipitation across alpine grassland types (Figure 7b). This response indicates that alpine meadow steppes and steppes might be less sensitive to the total precipitation amount than are alpine meadows and desert steppes. The results of standardized weight medians disentangled that alpine grasslands in this region were most sensitive to the number of precipitation events, moderately sensitive to the time intervals between consecutive precipitation events, and least sensitive to the intensity of precipitation events (Figure 7c and Table S3). However, the standardized weights of the three indices did not change across the different levels of the vegetation-sensitivity index for each grassland type (Table S3).

3.3. Trend Analyses of Alpine Grassland AGBpeak and Growing Season Precipitation

Approximately 61.6% of alpine grasslands showed no changing AGBpeak trends during the study period on the northern Tibetan Plateau (Table 4), which were mainly distributed in the northern areas (Figure 8a). In contrast, the alpine grasslands with a significantly decreasing AGBpeak trend accounted for only 5.5% of the pixels, and these pixels were scattered in the southern and south-eastern areas (Figure 8a). The pixels with significant AGBpeak trends, both increasing and decreasing, consisted of 13.13% alpine meadow, 15.91% alpine meadow-steppe, 22.16% alpine steppe, and 28.81% desert steppe (Table 4).
Regarding the total amount of precipitation during the plant growing season, we did not find any significantly increasing trends at the pixel scale (Figure 8b and Table 4). The pixels showing an insignificant decreasing trend and stability over our study period together accounted for more than 96% of the alpine grasslands of the study area. Only 0.2% of pixels in either alpine meadows or alpine meadow steppes showed significant decreases in the total amount of precipitation during plant growing months in 2000–2016. Increasing but insignificant trends in the total amount of precipitation were found in 4.10% of alpine steppes and 9.83% of desert steppes in the north-western areas.
The number of precipitation events within plant growing months did not show evident changes in more than 50% of alpine grasslands in this region during 2000–20016 (Figure 8c and Table 4). Significant decreases were observed at only 8.50% of alpine grasslands, which consisted of 22.11% alpine meadows, 9.22% alpine meadow steppes, and 3.93% alpine steppes. Insignificant decreasing trends in the number of precipitation events were found in 38.86% of desert steppes.
From 2000 to 2016, the pixels where the intensity of precipitation events during the plant growing season showed insignificant trends accounted for more than 67% of alpine grasslands over the entire northern Tibetan Plateau (Figure 8d and Table 4). We did not observe significant decreasing trends in the intensity of precipitation events at either the grassland type level or the regional scale. Non-significant increases and decreases in the intensity of precipitation events were found in 12.46% and 10.86% of alpine grasslands, respectively, across the entire northern Tibetan Plateau. At the grassland type level, significant increases in the intensity of precipitation events were found in only 14.30% of alpine steppes and 12.26% of desert steppes in the north-western areas.

4. Discussion

As known, alpine grasslands on the Tibetan Plateau are sensitivity to climate changes, especially to precipitation changes over years and across space [34,37]. However, it is still not clear how alpine grassland productivity would respond to the temporal variability of precipitation. In this study, we first documented the manners in which alpine grassland AGBpeak in response to the amount and temporal variability of plant growing season precipitation. Next, we assessed and mapped the relative importance of the temporal variability of precipitation, in terms of the number and intensity of precipitation events as well as the time interval between each set of consecutive events, on AGBpeak of alpine grasslands at both local (site-level) and regional (across-pixel) scales on the northern Tibetan Plateau. Finally, we examined if the trend of AGBpeak kept in consistent with the trends of the three indices of temporal variability of precipitation at the pixel scale during the study period from 2000 to 2016. The potential mechanisms and the uncertainties were discussed below.
First, our finding of AGBpeak increasing with precipitation (Figure 4a) was in good agreement with previous studies on the Tibetan Plateau [65,66,67,68] and Eurasian temperate grasslands [15,25]. A critical step we went further in this study was that we examined relationship of AGBpeak with the temporal variability of precipitation. For example, we found that AGBpeak increased with both the intensity and number of precipitation events while decreased with the extending time gap between consecutive precipitation events (Figure 4c,d). The proportions of variance of AGBpeak explained with bi-variate regressions (Figure 4) with the three indices of the temporal variability of precipitation alone (53% by intensity, 46% by events, and 56% by interval) were comparable to that explained by the total amount of precipitation during the plant growing season (55% by GSP). However, the principal component regression (PCR) results showed that the variance of AGBpeak explained by the total amount of the growing season precipitation alone was less than that explained by the grouped temporal variability of precipitation in terms of the number and intensity of precipitation events as well as the time interval between precipitation events, particularly in the alpine meadow zone (Figure 7a). This finding confirmed that the intra-seasonal precipitation patterns are more important for the growth of alpine grassland plants on the northern Tibetan Plateau, being consistent with previous studies in African [7,69], North American [5,27,70], and Eurasian temperate grasslands [71,72]. For example, a short-term manipulation of precipitation in Mongolian steppe showed that vegetation influenced more by timing than amount of precipitation [28].
Second, we found that the sensitivity of AGBpeak in response to the temporal variability of precipitation differed significantly among the four different zonal alpine grassland types (Figure 7b). Particularly, we found that alpine meadow and desert-steppe were relatively more sensitive than meadow-steppe and alpine steppe in response to the timing variability of precipitation (Figure 7b). These findings of humid alpine meadow being with higher sensitivity to the temporal variability of precipitation than semi-humid meadow-steppe and semi-arid alpine steppe were partly consistent with Byrne et al. [73] who found semi-arid grassland community was less sensitive to precipitation manipulations than sub-humid grassland community. The first reason can be the trends of temporal variability of precipitation during the corresponding period. Thus, the relatively lower sensitivity of semi-humid meadow-steppe and semi-arid alpine steppe was likely due to the less changes in the temporal variability of precipitation during the study years in the central northern Tibetan Plateau (Figure 8c–e). In addition, the finding that arid desert-steppe was also more sensitive than semi-arid alpine steppe and semi-humid meadow-steppe was likely due to the relative evident changes in the intensity, event, and time interval of precipitation in the desert steppe zone in the past years (Figure 8c–e), especially the increased precipitation event intensity (Figure 8d). Li, et al. [40] found that alpine herbaceous plants can sense the arrival of monsoon-season precipitation and become ready beforehand for leaf unfolding.
Therefore, another explanation for the contrasting sensitivity among different alpine grassland types can be the differences of community assembly of plant functional groups and traits as pointed out by Gellesch et al. [74] that plant community composition is a crucial factor in sustaining ecosystem health under precipitation extremes. That is because the dominant species can respond to the altered temporal regimes of precipitation differently between humid and semi-arid grassland communities [70,71,73]. In a previous study, Wu, et al. [67] scored species according to their water-related ecological strategies—i.e., 1-xerophytes, 2-mesophytes, 3-hygrophytes—and found that community composition of the plant species scores weighted by coverage had the same importance to precipitation in terms of explaining the spatial variability of AGBpeak across alpine meadow, steppe, and deserts in the same study area. In another study, Wu, et al. [75] found that plant functional trait diversity indices, i.e., community weighted means of specific leaf area and leaf mass ratio, are as crucial as precipitation in controlling the spatial patterns of AGBpeak along environmental gradients on the northern Tibetan Plateau. All the studies mentioned above have suggested that the structure and functioning of grassland ecosystems can be evidently changed by specific responses to future climate change, especially the temporal and spatial regimes of precipitation.
A third interesting finding was that the relative importance of each index of temporal variability of precipitation on AGBpeak, in terms of the intensity, number and time interval of precipitation events also differed significantly among the four zonal grassland types on the northern Tibetan Plateau (Figure 7c). We found that the standardized weights of both precipitation events and intervals were 40% higher than that of the intensity of precipitation events in alpine meadow community (Figure 7c and Table S3). This result agrees with the fact that more frequent precipitation events benefit plant growth in grasslands [76]. This might partially explain why increased precipitation is more important than experimental warming on alpine meadow productivity in the central Tibetan Plateau [38] and why herbaceous plants in alpine meadows physiologically unfold leaves after the beginning of monsoon-season precipitation [40]. In semi-arid alpine steppes, the standardized weight of the time intervals between precipitation events was lower, but the weight of the intensity of precipitation events was higher relative to the other three grassland types (Figure 7c and Table S3), which is partly consistent with the studies that arid and semi-arid grasslands are sensitive to the size of precipitation pulses and can respond immediately to changes of precipitation [16,27,77,78]. However, whether plants of alpine steppe and desert-steppe communities can promptly respond to altered precipitation regimes on the northern Tibetan Plateau remains unknown.
However, we also found that AGBpeak at the pixel scale was not as sensitive as observed in the fixed sites to the temporal variability of precipitation, and that the pixels with sensitivity value > 60 accounted for only 14.96% of pixels on the study area (Table 3). The inconsistence of AGBpeak sensitivity to temporal variability of precipitation between the site and pixel levels was likely due to the edaphic factors and plant species composition at a very local scale because the shape of the productivity–precipitation relationship varies considerably across study scales over space and time [79,80]. The phenomenon that AGBpeak can be significantly correlated with precipitation at a broad regional scale but may not be at a micro or local scale [14,25,79]. This explained why the proportion of alpine grassland pixels where AGBpeak was significantly correlated with the total amount and the temporal variability of precipitation was small (Figure 5 and Table S2). In addition, our trend analyses over time also showed that significant changes in AGBpeak can be attributed to localized changes in the timing of precipitation regimes at tiny proportions of alpine grasslands on the Tibetan Plateau (Figure 8 and Table 4). Recent studies predicted that the spatial distribution areas of alpine meadows and steppes are likely to shrink [46] under a scenario of decreasing precipitation over the Tibetan Plateau [81,82]. However, the inconsistencies in precipitation–productivity relationships between site observations and model predictions also highlighted the importance of a better understanding of the effects of climate change on ecosystem function and service [83,84].
Last but not least, there still are some uncertainties in this study, (1) the AGBpeak-GEVI relationship is not necessary to be linear because grasslands may nonlinearly respond to variations in precipitation due to the complexity in community assembly of plant species and functional traits [84]. Therefore, it is better to develop specific models for each zonal grassland types with longer observations at more fixed sites in the future; (2) the raster surfaces of the temporal variability of precipitation, in terms of the intensity, number, and time interval of precipitation events should also be validated by independent observations in a further study. The uncertainties of the interpolated climatic raster surfaces, as input variables, may affect the model performance and the result interpretations; (3) the effects of livestock grazing combined with warming and soil nutrient availability in open pastures should be paid more attention in the future, even though it remains a big challenge to quantify and spatialize the grazing rates accurately at a regional scale. Based on the uncertainties and discussions above, we finally suggest a long-term multifactorial experiment with manipulated precipitation, warming, nutrient additions, and stocking rates would be highly beneficial to determine more effective and sustainable management of alpine grasslands on the Tibetan Plateau.

5. Conclusions

We explored the effects of the temporal variability of precipitation on the spatiotemporal variation of AGBpeak estimated from remote sensing EVI datasets and long-term field observations. A U-shaped relationship was found between the sensitivity of AGBpeak in response to temporal variability of precipitation and the total amount of precipitation across the four zonal grassland types. This result indicates that alpine meadow and desert-steppe might be more sensitive than meadow-steppe and alpine steppe to altered precipitation regimes. However, alpine grasslands with sensitivity value > 60 accounted for less than 15% of grasslands at the pixel scale, and more than 60% of alpine grassland pixels in this region showed no evident changes in AGBpeak from 2000 to 2016. Non-significant decreases in growing season precipitation were found in approximately 48% of alpine grassland pixels, while significant changes in the temporal variability of precipitation in terms of the number and intensity of precipitation events and the time interval between precipitation events were found at less than 10% of grassland pixels across the northern Tibetan Plateau. The space-for-time U-shaped relationship between the sensitivity of AGBpeak in response to temporal variability of precipitation and the total amount of precipitation and the RGB composition map indicate that the sensitivity of AGBpeak in response to temporal variability of precipitation differs significantly among different grassland types, likely due to the differences in community composition of plant species and functional traits. More potential contributors—i.e., stocking rate, warming, and nitrogen deposition—should be involved in a long-term factorial experiment for the sustainable management of alpine grasslands on the Tibetan Plateau.

Supplementary Materials

The following are available online at https://0-www-mdpi-com.brum.beds.ac.uk/2072-4292/11/3/360/s1, Figure S1: The dynamic of smoothed enhanced vegetation index (EVI) at the alpine meadow site (Nagqu) from 2009 to 2015. Figure S2: Relationships of peak aboveground biomass (AGBpeak) with the average enhanced vegetation index (EVI) during the plant growing season (GEVI), the average EVI before it reaches the peak value (EVIbeforepeak), and the peak EVI value (EVIpeak) in the plant growing season. Table S1: Parameters and fitness comparisons of the potential models (linear, quadratic, exponential and logarithmic) using the enhanced vegetation index (EVI) for estimating the peak aboveground biomass (AGBpeak, g m−2) of alpine grasslands on the northern Tibetan Plateau. Table S2: Summary of correlations of the peak aboveground biomass (AGBpeak) with the growing season precipitation (GSP), the number of precipitation events (Events), the intensity of precipitation events (Intensity), and the time interval between precipitation events (Interval) within each alpine grassland type on the northern Tibetan Plateau. Table S3: Mean weights of three indices of the temporal variability of precipitation (contributors) at different levels of the standardized vegetation sensitivity index (VSI) in each alpine grassland type on the northern Tibetan Plateau.

Author Contributions

Conceptualization, J.W.; Methodology, M.L. and J.W.; Formal Analysis, M.L. and J.W.; Investigation, J.W.; Data Curation, J.W. and M.L.; Writing-Original Draft Preparation, J.W. and M.L.; Writing-Review & Editing, C.S., Y.H., B.N., G.F., P.T., B.T. and X.Z.; Visualization, M.L. and J.W.; Supervision, X.Z.; Funding Acquisition, X.Z. and J.W. All authors contributed to this work and approved the final manuscript.

Funding

This research was under joint supports from the Ministry of Science and Technology of China (2016YFC0502001), Chinese Academy of Sciences (XDB03030401), and National Natural Sciences Foundation of China (41401070, 41571042). The Alexander von Humboldt Foundation funded J. Wu with a two-year fellowship in Germany.

Conflicts of Interest

The authors declare no conflict of interest. The founding sponsors had no role in the design of the study; in the collection, analyses, or interpretation of data; in the writing of the manuscript; or in the decision to publish the results.

References

  1. IPCC. Climate Change 2014: Impacts, Adaptation, and Vulnerability; Cambridge University Press: Cambridge, UK; New York, NY, USA, 2014. [Google Scholar]
  2. Liu, J.; Wang, B.; Cane, M.A.; Yim, S.Y.; Lee, J.Y. Divergent global precipitation changes induced by natural versus anthropogenic forcing. Nature 2013, 493, 656–659. [Google Scholar] [CrossRef]
  3. Karl, T.R.; Trenberth, K.E. Modern global climate change. Science 2003, 302, 1719–1723. [Google Scholar] [CrossRef] [PubMed]
  4. Ru, J.; Zhou, Y.; Hui, D.; Zheng, M.; Wan, S. Shifts of growing-season precipitation peaks decrease soil respiration in a semiarid grassland. Glob. Chang. Biol. 2018, 24, 1001–1011. [Google Scholar] [CrossRef]
  5. Radu, D.D.; Duval, T.P. Precipitation frequency alters peatland ecosystem structure and co2 exchange: Contrasting effects on moss, sedge, and shrub communities. Glob. Chang. Biol. 2018, 24, 2051–2065. [Google Scholar] [CrossRef]
  6. Siepielski, A.M.; Morrissey, M.B.; Buoro, M.; Carlson, S.M.; Caruso, C.M.; Clegg, S.M.; Coulson, T.; DiBattista, J.; Gotanda, K.M.; Francis, C.D.; et al. Precipitation drives global variation in natural selection. Science 2017, 355, 959–962. [Google Scholar] [CrossRef] [PubMed]
  7. Hawinkel, P.; Thiery, W.; Lhermitte, S.; Swinnen, E.; Verbist, B.; Van Orshoven, J.; Muys, B. Vegetation response to precipitation variability in East Africa controlled by biogeographical factors. J. Geophys. Res-Biogeo. 2016, 121, 2422–2444. [Google Scholar] [CrossRef] [Green Version]
  8. Asner, G.P.; Elmore, A.J.; Olander, L.P.; Martin, R.E.; Harris, A.T. Grazing systems, ecosystem responses, and global change. Annu. Rev. Env. Resour. 2004, 29, 261–299. [Google Scholar] [CrossRef]
  9. Seddon, A.W.; Macias-Fauria, M.; Long, P.R.; Benz, D.; Willis, K.J. Sensitivity of global terrestrial ecosystems to climate variability. Nature 2016, 531, 229–232. [Google Scholar] [CrossRef] [Green Version]
  10. Smith, M.D.; Wilcox, K.R.; Power, S.A.; Tissue, D.T.; Knapp, A.K. Assessing community and ecosystem sensitivity to climate change—Toward a more comparative approach. J. Veg. Sci. 2017, 28, 235–237. [Google Scholar] [CrossRef]
  11. Estiarte, M.; Vicca, S.; Penuelas, J.; Bahn, M.; Beier, C.; Emmett, B.A.; Fay, P.A.; Hanson, P.J.; Hasibeder, R.; Kigel, J.; et al. Few multiyear precipitation-reduction experiments find a shift in the productivity–precipitation relationship. Glob. Chang. Biol. 2016, 22, 2570–2581. [Google Scholar] [CrossRef] [PubMed]
  12. Knapp, A.K.; Fay, P.A.; Blair, J.M.; Collins, S.L.; Smith, M.D.; Carlisle, J.D.; Harper, C.W.; Danner, B.T.; Lett, M.S.; McCarron, J.K. Rainfall variability, carbon cycling, and plant species diversity in a Mesic grassland. Science 2002, 298, 2202–2205. [Google Scholar] [CrossRef] [PubMed]
  13. Bai, Y.; Han, X.; Wu, J.; Chen, Z.; Li, L. Ecosystem stability and compensatory effects in the Inner Mongolia grassland. Nature 2004, 431, 181. [Google Scholar] [CrossRef] [PubMed]
  14. Hu, Z.; Yu, G.; Fan, J.; Zhong, H.; Wang, S.; Li, S. Precipitation-use efficiency along a 4500-km grassland transect. Glob. Ecol. Biogeogr. 2010, 19, 842–851. [Google Scholar]
  15. Bai, Y.; Wu, J.; Xing, Q.; Pan, Q.; Huang, J.; Yang, D.; Han, X. Primary production and rain use efficiency across a precipitation gradient on the Mongolia Plateau. Ecology 2008, 89, 2140–2153. [Google Scholar] [CrossRef] [PubMed]
  16. Petrie, M.D.; Peters, D.P.C.; Yao, J.; Blair, J.M.; Burruss, N.D.; Collins, S.L.; Derner, J.D.; Gherardi, L.A.; Hendrickson, J.R.; Sala, O.E.; et al. Regional grassland productivity responses to precipitation during multiyear above- and below-average rainfall periods. Glob. Chang. Biol. 2018, 24, 1935–1951. [Google Scholar] [CrossRef] [PubMed]
  17. Tietjen, B.; Schlaepfer, D.R.; Bradford, J.B.; Lauenroth, W.K.; Hall, S.A.; Duniway, M.C.; Hochstrasser, T.; Jia, G.; Munson, S.M.; Pyke, D.A.; et al. Climate change-induced vegetation shifts lead to more ecological droughts despite projected rainfall increases in many global temperate drylands. Glob. Chang. Biol. 2017, 23, 2743–2754. [Google Scholar] [CrossRef] [PubMed]
  18. Knapp, A.K.; Beier, C.; Briske, D.D.; Classen, A.T.; Luo, Y.; Reichstein, M.; Smith, M.D.; Smith, S.D.; Bell, J.E.; Fay, P.A.; et al. Consequences of more extreme precipitation regimes for terrestrial ecosystems. BioScience 2008, 58, 811–821. [Google Scholar] [CrossRef]
  19. Craine, J.M.; Nippert, J.B.; Elmore, A.J.; Skibbe, A.M.; Hutchinson, S.L.; Brunsell, N.A. Timing of climate variability and grassland productivity. Proc. Natl. Acad. Sci. USA 2012, 109, 3401–3405. [Google Scholar] [CrossRef] [Green Version]
  20. Nippert, J.B.; Knapp, A.K.; Briggs, J.M. Intra-annual rainfall variability and grassland productivity: Can the past predict the future? Plant Ecol. 2005, 184, 65–74. [Google Scholar] [CrossRef]
  21. Synodinos, A.D.; Tietjen, B.; Lohmann, D.; Jeltsch, F. The impact of inter-annual rainfall variability on african savannas changes with mean rainfall. J. Theor. Biol. 2018, 437, 92–100. [Google Scholar] [CrossRef]
  22. Stampfli, A.; Bloor, J.M.G.; Fischer, M.; Zeiter, M. High land-use intensity exacerbates shifts in grassland vegetation composition after severe experimental drought. Glob. Chang. Biol. 2018, 24, 2021–2034. [Google Scholar] [CrossRef] [Green Version]
  23. Piao, S.; Mohammat, A.; Fang, J.; Cai, Q.; Feng, J. Ndvi-based increase in growth of temperate grasslands and its responses to climate changes in China. Glob. Environ. Chang. 2006, 16, 340–348. [Google Scholar] [CrossRef]
  24. Knapp, A.K.; Smith, M.D. Variation among biomes in temporal dynamics of aboveground primary production. Science 2001, 291, 481–484. [Google Scholar] [CrossRef] [PubMed]
  25. Guo, Q.; Hu, Z.M.; Li, S.G.; Li, X.R.; Sun, X.M.; Yu, G.R. Spatial variations in aboveground net primary productivity along a climate gradient in eurasian temperate grassland: Effects of mean annual precipitation and its seasonal distribution. Glob. Chang. Biol. 2012, 18, 3624–3631. [Google Scholar] [CrossRef]
  26. Mariano, D.A.; Santos, C.A.C.d.; Wardlow, B.D.; Anderson, M.C.; Schiltmeyer, A.V.; Tadesse, T.; Svoboda, M.D. Use of remote sensing indicators to assess effects of drought and human-induced land degradation on ecosystem health in Northeastern Brazil. Remote Sens. Environ. 2018, 213, 129–143. [Google Scholar] [CrossRef]
  27. Heisler-White, J.L.; Knapp, A.K.; Kelly, E.F. Increasing precipitation event size increases aboveground net primary productivity in a semi-arid grassland. Oecologia 2008, 158, 129–140. [Google Scholar] [CrossRef] [PubMed]
  28. Spence, L.A.; Liancourt, P.; Boldgiv, B.; Petraitis, P.S.; Casper, B.B. Short-term manipulation of precipitation in mongolian steppe shows vegetation influenced more by timing than amount of rainfall. J. Veg. Sci. 2016, 27, 249–258. [Google Scholar] [CrossRef]
  29. Zhang, B.; Tan, X.; Wang, S.; Chen, M.; Chen, S.; Ren, T.; Xia, J.; Bai, Y.; Huang, J.; Han, X. Asymmetric sensitivity of ecosystem carbon and water processes in response to precipitation change in a semi-arid steppe. Funct. Ecol. 2017, 31, 1301–1311. [Google Scholar] [CrossRef]
  30. Ma, W.; Liu, Z.; Wang, Z.; Wang, W.; Liang, C.; Tang, Y.; He, J.-S.; Fang, J. Climate change alters interannual variation of grassland aboveground productivity: Evidence from a 22-year measurement series in the Inner Mongolian grassland. J. Plant Res. 2010, 123, 509–517. [Google Scholar] [CrossRef]
  31. Yahdjian, L.; Sala, O.E. Size of precipitation pulses controls nitrogen transformation and losses in an arid Patagonian ecosystem. Ecosystems 2010, 13, 575–585. [Google Scholar] [CrossRef]
  32. Wu, J.S.; Feng, Y.F.; Zhang, X.Z.; Wurst, S.; Tietjen, B.; Tarolli, P.; Song, C.Q. Grazing exclusion by fencing non-linearly restored the degraded alpine grasslands on the tibetan plateau. Sci. Rep. 2017, 7. [Google Scholar] [CrossRef] [PubMed]
  33. Sun, J.; Qin, X.; Yang, J. The response of vegetation dynamics of the different alpine grassland types to temperature and precipitation on the Tibetan Plateau. Environ. Monit. Assess. 2016, 188, 20. [Google Scholar] [CrossRef] [PubMed]
  34. Shen, M.G.; Piao, S.L.; Cong, N.; Zhang, G.X.; Janssens, I.A. Precipitation impacts on vegetation spring phenology on the Tibetan Plateau. Glob. Chang. Biol. 2015, 21, 3647–3656. [Google Scholar] [CrossRef] [PubMed] [Green Version]
  35. Shi, Y.; Wang, Y.; Ma, Y.; Ma, W.; Liang, C.; Flynn, D.F.B.; Schmid, B.; Fang, J.; He, J.S. Field-based observations of regional-scale, temporal variation in net primary production in Tibetan alpine grasslands. Biogeosciences 2014, 11, 2003. [Google Scholar] [CrossRef]
  36. Yang, Y.H.; Fang, J.Y.; Fay, P.A.; Bell, J.E.; Ji, C.J. Rain use efficiency across a precipitation gradient on the Tibetan Plateau. Geophys. Res. Lett. 2010, 37, Artn L15702. [Google Scholar] [CrossRef]
  37. Yao, Y.; Wang, X.; Li, Y.; Wang, T.; Shen, M.; Du, M.; He, H.; Li, Y.; Luo, W.; Ma, M.; et al. Spatiotemporal pattern of gross primary productivity and its covariation with climate in china over the last thirty years. Glob. Chang. Biol. 2018, 24, 184–196. [Google Scholar] [CrossRef] [PubMed]
  38. Fu, G.; Shen, Z.-X.; Zhang, X.-Z. Increased precipitation has stronger effects on plant production of an alpine meadow than does experimental warming in the northern Tibetan Plateau. Agric. For. Meteorol. 2018, 249, 11–21. [Google Scholar] [CrossRef]
  39. Wang, Z.; Luo, T.X.; Li, R.C.; Tang, Y.H.; Du, M.Y. Causes for the unimodal pattern of biomass and productivity in alpine grasslands along a large altitudinal gradient in semi-arid regions. J. Veg. Sci. 2013, 24, 189–201. [Google Scholar] [CrossRef]
  40. Li, R.; Luo, T.; Molg, T.; Zhao, J.; Li, X.; Cui, X.; Du, M.; Tang, Y. Leaf unfolding of Tibetan alpine meadows captures the arrival of monsoon rainfall. Sci. Rep. 2016, 6, 20985. [Google Scholar] [CrossRef] [PubMed]
  41. Cao, R.; Shen, M.; Zhou, J.; Chen, J. Modeling vegetation green-up dates across the Tibetan Plateau by including both seasonal and daily temperature and precipitation. Agric. For. Meteorol. 2018, 249, 17–186. [Google Scholar] [CrossRef]
  42. Zhang, G.; Zhang, Y.; Dong, J.; Xiao, X. Green-up dates in the Tibetan Plateau have continuously advanced from 1982 to 2011. Proc. Natl. Acad. Sci. USA 2013, 110, 4309–4314. [Google Scholar] [CrossRef] [PubMed] [Green Version]
  43. Yu, C.Q.; Zhang, X.Z.; Zhang, J.; Li, S.W.; Song, C.Q.; Fang, Y.Z.; Wurst, S.; Wu, J.S. Grazing exclusion to recover degraded alpine pastures needs scientific assessments across the northern Tibetan Plateau. Sustainability 2016, 8, 1162. [Google Scholar] [CrossRef]
  44. Zhang, Y.; Pan, Y.; Zhang, X.; Wu, J.; Yu, C.; Li, M.; Wu, J. Patterns and dynamics of the human appropriation of net primary production and its components in Tibet. J. Environ. Manag. 2018, 210, 280–289. [Google Scholar] [CrossRef] [PubMed]
  45. Li, S.; Wu, J.; Gong, J.; Li, S. Human footprint in Tibet: Assessing the spatial layout and effectiveness of nature reserves. Sci. Total Environ. 2018, 621, 18–29. [Google Scholar] [CrossRef] [PubMed]
  46. Zhao, D.S.; Wu, S.H.; Yin, Y.H.; Yin, Z.Y. Vegetation distribution on Tibetan Plateau under climate change scenario. Reg. Environ. Chang. 2011, 11, 905–915. [Google Scholar] [CrossRef]
  47. Sun, J. Precipitation and aridity index regulating spatial patterns of vegetation production and species diversity based on alpine grassland transect, Tibetan Plateau. PeerJ 2016, 4, e2495v2491. [Google Scholar]
  48. Wu, J.S.; Zhang, X.Z.; Shen, Z.X.; Shi, P.L.; Yu, C.Q.; Chen, B.X. Effects of livestock exclusion and climate change on aboveground biomass accumulation in alpine pastures across the northern Tibetan Plateau. Chinese Sci. Bull. 2014, 59, 4332–4340. [Google Scholar] [CrossRef]
  49. Zhao, G.; Shi, P.; Wu, J.; Xiong, D.; Zong, N.; Zhang, X. Foliar nutrient resorption patterns of four functional plants along a precipitation gradient on the Tibetan Changtang Plateau. Ecol. Evol. 2017, 7, 7201–7212. [Google Scholar] [CrossRef] [Green Version]
  50. Chen, J.; Jönsson, P.; Tamura, M.; Gu, Z.; Matsushita, B.; Eklundh, L. A simple method for reconstructing a high-quality ndvi time-series data set based on the Savitzky–Golay filter. Remote Sens. Environ. 2004, 91, 332–344. [Google Scholar] [CrossRef]
  51. Zhang, Y.; Wegehenkel, M. Integration of MODIS data into a simple model for the spatial distributed simulation of soil water content and evapotranspiration. Remote Sens. Environ. 2006, 104, 393–408. [Google Scholar] [CrossRef]
  52. Paruelo, J.M.; Epstein, H.E.; Lauenroth, W.K.; Burke, I.C. Anpp estimates from NDVI for the central grassland region of the United States. Ecology 1997, 78, 953–958. [Google Scholar] [CrossRef]
  53. Jin, Y.X.; Yang, X.C.; Qiu, J.J.; Li, J.Y.; Gao, T.; Wu, Q.; Zhao, F.; Ma, H.L.; Yu, H.D.; Xu, B. Remote sensing-based biomass estimation and its spatio-temporal variations in temperate grassland, northern China. Remote Sens. 2014, 6, 1496–1513. [Google Scholar] [CrossRef]
  54. Meng, B.P.; Ge, J.; Liang, T.G.; Yang, S.X.; Gao, J.L.; Feng, Q.S.; Cui, X.; Huang, X.D.; Xie, H.J. Evaluation of remote sensing inversion error for the above-ground biomass of alpine meadow grassland based on multi-source satellite data. Remote Sens. 2017, 9, 372. [Google Scholar] [CrossRef]
  55. Zhang, B.H.; Zhang, L.; Xie, D.; Yin, X.L.; Liu, C.J.; Liu, G. Application of synthetic NDVI time series blended from Landsat and MODIS data for grassland biomass estimation. Remote Sens. 2016, 8, 10. [Google Scholar] [CrossRef]
  56. An, N.; Price, K.P.; Blair, J.M. Estimating above-ground net primary productivity of the tallgrass prairie ecosystem of the central great plains using AVHRR NDVI. Int. J. Remote Sens. 2013, 34, 3717–3735. [Google Scholar] [CrossRef]
  57. China meteorological mata service center. Available online: http://data.cma.cn/en (accessed on 25 May 2018).
  58. Chen, B.X.; Zhang, X.Z.; Tao, J.; Wu, J.S.; Wang, J.S.; Shi, P.L.; Zhang, Y.J.; Yu, C.Q. The impact of climate change and anthropogenic activities on alpine grassland over the Qinghai-Tibet Plateau. Agric. For. Meteorol. 2014, 189, 11–18. [Google Scholar] [CrossRef]
  59. Hutchinson, M.F. Anusplin Version 4.3; Centre for Resource and Environmental Studies, The Australian National University: Canberra, Australia, 2004. [Google Scholar]
  60. Feng, Y.; Wu, J.; Zhang, J.; Zhang, X.; Song, C. Identifying the relative contributions of climate and grazing to both direction and magnitude of alpine grassland productivity dynamics from 1993 to 2011 on the northern Tibetan Plateau. Remote Sens. 2017, 9, 136. [Google Scholar] [CrossRef]
  61. Wessels, K.J.; Prince, S.D.; Frost, P.E.; van Zyl, D. Assessing the effects of human-induced land degradation in the former homelands of northern South Africa with a 1 km AVHRR NDVI time-series. Remote Sens. Environ. 2004, 91, 47–67. [Google Scholar] [CrossRef]
  62. Higginbottom, T.; Symeonakis, E. Assessing land degradation and desertification using vegetation index data: Current frameworks and future directions. Remote Sens. 2014, 6, 9552–9575. [Google Scholar] [CrossRef]
  63. Fensholt, R.; Proud, S.R. Evaluation of earth observation based global long term vegetation trends—Comparing GIMMS and MODIS global NDVI time series. Remote Sens. Environ. 2012, 119, 131–147. [Google Scholar] [CrossRef]
  64. Li, X.L.; Brierley, G.; Shi, D.J.; Xie, Y.L.; Sun, H.Q. Ecological protection and restoration in Sanjiangyuan national nature reserve, Qinghai Province, China. In Perspectives on Environmental Management and Technology in Asian River Basins; Higgitt, D., Ed.; SpringerBriefs in Geography; Springer: Dordrecht, The Netherlands, 2012; pp. 93–120. [Google Scholar]
  65. Yang, Y.H.; Fang, J.Y.; Ji, C.J.; Han, W.X. Above- and belowground biomass allocation in Tibetan grasslands. J. Veg. Sci. 2009, 20, 177–184. [Google Scholar] [CrossRef]
  66. Sun, J.; Cheng, G.W.; Li, W.P. Meta-analysis of relationships between environmental factors and aboveground biomass in the alpine grassland on the Tibetan Plateau. Biogeosciences 2013, 10, 1707–1715. [Google Scholar] [CrossRef]
  67. Wu, J.S.; Shen, Z.X.; Zhang, X.Z. Precipitation and species composition primarily determine the diversity-productivity relationship of alpine grasslands on the northern Tibetan Plateau. Alpine Bot. 2014, 124, 13–25. [Google Scholar] [CrossRef]
  68. Jiang, Y.; Zhang, Y.; Wu, Y.; Hu, R.; Zhu, J.; Tao, J.; Zhang, T. Relationships between aboveground biomass and plant cover at two spatial scales and their determinants in northern Tibetan grasslands. Ecol. Evol. 2017, 7, 7954–7964. [Google Scholar] [CrossRef] [PubMed] [Green Version]
  69. Swemmer, A.M.; Knapp, A.K.; Snyman, H.A. Intra-seasonal precipitation patterns and above-ground productivity in three perennial grasslands. J. Ecol. 2007, 95, 780–788. [Google Scholar] [CrossRef] [Green Version]
  70. Robertson, T.R.; Bell, C.W.; Zak, J.C.; Tissue, D.T. Precipitation timing and magnitude differentially affect aboveground annual net primary productivity in three perennial species in a Chihuahuan desert grassland. New Phytol. 2009, 181, 230–242. [Google Scholar] [CrossRef] [PubMed]
  71. Liu, Y.; Pan, Q.; Zheng, S.; Bai, Y.; Han, X. Intra-seasonal precipitation amount and pattern differentially affect primary production of two dominant species of Inner Mongolia grassland. Acta Oecol. 2012, 44, 2–10. [Google Scholar] [CrossRef]
  72. Peng, S.S.; Piao, S.L.; Shen, Z.H.; Ciais, P.; Sun, Z.Z.; Chen, S.P.; Bacour, C.; Peylin, P.; Chen, A.P. Precipitation amount, seasonality and frequency regulate carbon cycling of a semi-arid grassland ecosystem in Inner Mongolia, China: A modeling analysis. Agric. For. Meteorol. 2013, 178, 46–55. [Google Scholar] [CrossRef]
  73. Byrne, K.M.; Adler, P.B.; Lauenroth, W.K. Contrasting effects of precipitation manipulations in two Great Plains Plant communities. J. Veg. Sci. 2017, 28, 238–249. [Google Scholar] [CrossRef]
  74. Gellesch, E.; Wellstein, C.; Beierkuhnlein, C.; Kreyling, J.; Walter, J.; Jentsch, A. Plant community composition is a crucial factor for heath performance under precipitation extremes. J. Veg. Sci. 2015, 26, 975–984. [Google Scholar] [CrossRef]
  75. Wu, J.; Wurst, S.; Zhang, X. Plant functional trait diversity regulates the nonlinear response of productivity to regional climate change in Tibetan alpine grasslands. Sci. Rep. 2016, 6, 35649. [Google Scholar] [CrossRef] [PubMed]
  76. Fang, J.Y.; Piao, S.L.; Zhou, L.M.; He, J.S.; Wei, F.Y.; Myneni, R.B.; Tucker, C.J.; Tan, K. Precipitation patterns alter growth of temperate vegetation. Geophys. Res. Lett. 2005, 32, Artn L21411. [Google Scholar] [CrossRef]
  77. Huxman, T.E.; Snyder, K.A.; Tissue, D.; Leffler, A.J.; Ogle, K.; Pockman, W.T.; Sandquist, D.R.; Potts, D.L.; Schwinning, S. Precipitation pulses and carbon fluxes in semiarid and arid ecosystems. Oecologia 2004, 141, 254–268. [Google Scholar] [CrossRef] [PubMed]
  78. Fay, P.A.; Kaufman, D.M.; Nippert, J.B.; Carlisle, J.D.; Harper, C.W. Changes in grassland ecosystem function due to extreme rainfall events: Implications for responses to climate change. Glob. Chang. Biol. 2008, 14, 1600–1608. [Google Scholar] [CrossRef]
  79. Lauenroth, W.K.; Sala, O.E. Long-term forage production of North American short grass steppe. Ecol. Appl. 1992, 2, 397. [Google Scholar] [CrossRef] [PubMed]
  80. Huxman, T.E.; Smith, M.D.; Fay, P.A.; Knapp, A.K.; Shaw, M.R.; Loik, M.E.; Smith, S.D.; Tissue, D.T.; Zak, J.C.; Weltzin, J.F.; et al. Convergence across biomes to a common rain-use efficiency. Nature 2004, 429, 651. [Google Scholar] [CrossRef]
  81. Zhang, D.L.; Huang, J.P.; Guan, X.D.; Chen, B.; Zhang, L. Long-term trends of precipitable water and precipitation over the Tibetan Plateau derived from satellite and surface measurements. J. Quant. Spectrosc. Radiat. 2013, 122, 64–71. [Google Scholar] [CrossRef]
  82. Chen, X.; You, Q.; Sielmann, F.; Ruan, N. Climate change scenarios for tibetan plateau summer precipitation based on canonical correlation analysis. Int. J. Climatol. 2017, 37, 1310–1321. [Google Scholar] [CrossRef]
  83. Knapp, A.K.; Ciais, P.; Smith, M.D. Reconciling inconsistencies in precipitation–productivity relationships: Implications for climate change. New Phytol. 2017, 214, 41–47. [Google Scholar] [CrossRef]
  84. Luo, Y.; Jiang, L.; Niu, S.; Zhou, X. Nonlinear responses of land ecosystems to variation in precipitation. New Phytol. 2017, 214, 5–7. [Google Scholar] [CrossRef] [Green Version]
Figure 1. Vegetation and climate on the northern Tibetan Plateau. Panel (a), alpine grassland types; Panel (b), mean annual temperature (MAT) of 1979–2008; Panel (c), mean annual precipitation (MAP) of 1979–2008. The four sites shown with white stars, were chosen in Damxung, Nagqu, Bangoin, and Gê’gyai, which represent for meadow-steppe, alpine meadow, alpine steppe, and desert-steppe, respectively, for a long-term research plan. The long-term AGBpeak dataset measured from 2009 to 2016 at the four sites were used to build a model to estimate AGBpeak at the regional scale. Two more independent datasets of short-term AGBpeak measured by Sun [47] (red circles) and Wu et al. [48] (green circles) were used to validated the best-fitted model.
Remotesensing 11 00360 g001
Figure 2. Validation of the best-fitted linear AGBpeak-GEVI model by comparing the observed AGBpeak from (a) Sun [47], (b) Wu, et al. [48], and (c) both of them (see Figure 1 for site locations) with the simulated AGBpeak values. The coefficients of determination (R2) and the significance level (p values) of the linear relationships between the observed and simulated AGBpeak were given. The root mean square error (RMSE) and the 1:1 line (dashed ones) were also given to show the standard deviation of the simulated values from the observed ones.
Remotesensing 11 00360 g002
Figure 3. Comparison between the interpolated and observed precipitation data. The linear relationship between the observed and simulated precipitation were given with the coefficients of determination (R2) and the significance level (p values). The shade of the solid line represented the 95% confidence intervals. The root mean square error (RMSE) and the 1:1 line (dashed ones) were also given to show the standard deviation of the simulated values from the observed ones.
Remotesensing 11 00360 g003
Figure 4. Relationships of peak aboveground biomass (AGBpeak) with (a) the total amount of growing season precipitation (GSP), (b) the number of precipitation events (Events), (c) the intensity of precipitation events (Intensity), and (d) the time interval between precipitation events (Interval) during the plant growing period at the four zonal sites, alpine meadow, meadow-steppe, alpine steppe, and desert-steppe on the northern Tibetan Plateau (see Figure 1 for site locations).
Remotesensing 11 00360 g004
Figure 5. Spatial patterns of correlation coefficients of peak aboveground biomass (AGBpeak) with (a) growing season precipitation (GSP), (b) number of precipitation events, (c) mean intensity of precipitation events, and (d) time interval between precipitation events in alpine grasslands on the northern Tibetan Plateau.
Remotesensing 11 00360 g005
Figure 6. Spatial patterns of (a) standardized VSIP and (b) relative contribution of the three indicators of precipitation variability to alpine grassland AGBpeak: the number of precipitation events (Events), the intensity of precipitation events (Intensity), and the time interval between consecutive precipitation events (Interval).
Remotesensing 11 00360 g006
Figure 7. Relative contribution of the number and intensity of precipitation events and the time interval between precipitation events to the vegetation sensitivity index of alpine grassland on the northern Tibetan Plateau. (a) The variance in peak aboveground biomass (AGBpeak) explained at the four observation sites. (b) The relationship between the vegetation sensitivity index and growing season precipitation. (c) The standardized weights of the number of precipitation events, intensity of precipitation events, and time interval between precipitation events for alpine meadow (AM), alpine meadow-steppe (AMS), alpine steppe (AS), and desert-steppe (DS), respectively.
Remotesensing 11 00360 g007
Figure 8. Spatial pattern of trends (Theil–Sen slopes) in (a) peak aboveground biomass (AGBpeak, g m−2 yr−1), (b) growing season precipitation (GSP, mm yr−1), (c) number of precipitation events (Events, n yr−1), (d) mean intensity of precipitation events (Intensity, mm yr−1), and (e) time interval between precipitation events (Intervals, n × 8-day yr− 1) of the northern Tibetan Plateau. The map inserted at the top left corner of each panel indicates the Mann–Kendall test for significance at the α = 0.05 level, where |z| − stats ≥ 1.96 indicate significant trends (in blue) at the pixel scale.
Remotesensing 11 00360 g008
Table 1. Location, climate, and vegetation information for each sampling site. MAT, mean annual temperature; MAP, mean annual precipitation; AGBpeak, peak aboveground biomass.
County NameGrassland TypeLongitudeLatitudeAltitudeMATMAPAGBpeak Mean (Range)
(°E)(°N)(m)(°C)(mm)(g/m2)
NagquAlpine meadow92.0131.6446010.19539.07121.04 (91.25–160.01)
DamxungMeadow-steppe91.0730.5043613.74468.0158.94 (39.55–89.43)
BangoinAlpine steppe90.3131.3946320.16426.0348.71 (22.28–78.48)
Gê’gyaiDesert-steppe82.9132.3844612.50147.5213.00 (6.64–19.26)
Table 2. Variability of growing season precipitation (GSP), intensity of precipitation events (Intensity), number of precipitation events (Events), the time interval between each set of consecutive events (Interval) of 2000–2016 on the northern Tibetan Plateau.
VariabilityGSP (mm)Intensity (mm per event)Events (n)Interval (n × 8-day)
Mean24515.715.21.4
Minimum54.67.35.20.1
Maximum63033.518.94
Table 3. Pixel percentage (%) at five different levels of the standardized vegetation sensitive index to precipitation (VSIP) within each alpine grassland type on the northern Tibetan Plateau.
Grassland TypeStandardized VSIP Level
0–2020–4040–6060–8080–100
Alpine meadow5.6623.4436.3823.9410.58
Meadow-steppe11.9463.0423.971.050.00
Alpine steppe9.5959.0327.263.670.46
Desert-steppe2.6929.8748.9315.872.64
Overall7.5044.6932.8511.283.68
Table 4. Percentage of pixels showing different trends in the peak aboveground biomass (AGBpeak), growing season precipitation (GSP), number of precipitation events (Events), mean intensity of precipitation events (Intensity), and time interval between precipitation events (Intervals), either significantly or non-significantly at α= 0.05 significance level within each type of alpine grasslands on the northern Tibetan Plateau.
Grassland TypeTrend of AGBpeakAGBpeakGSPEventsIntensityInterval
Alpine meadowsignificant increasing3.640.000.001.812.30
insignificant increasing7.560.160.012.372.43
significant decreasing9.490.8622.110.000.00
insignificant decreasing12.7188.352.2229.190.17
being stable66.5910.6375.6766.6395.11
Meadow-steppesignificant increasing 4.840.000.000.420.03
insignificant increasing6.610.6929.090.911.26
significant decreasing11.070.009.220.000.00
insignificant decreasing12.560.6919.878.552.19
being stable64.9298.6341.8390.1396.51
Alpine steppesignificant increasing 18.580.000.0014.301.51
insignificant increasing12.314.100.0117.5020.84
significant decreasing3.480.003.930.000.00
insignificant decreasing5.2144.7954.684.882.75
being stable60.4351.1141.3963.3274.90
Desert-steppesignificant increasing 27.420.000.0012.260.98
insignificant increasing14.919.830.1220.8923.03
significant decreasing1.390.000.970.000.00
insignificant decreasing2.1028.2138.863.181.29
being stable54.1861.9560.0563.6774.71
Overallsignificant increasing 14.570.000.009.532.07
insignificant increasing10.863.474.4212.4613.95
significant decreasing5.500.208.500.000.00
insignificant decreasing7.4448.1535.7210.861.90
being stable61.6448.1751.3667.1682.08

