Spatial and Temporal Variability of Open-Ocean Barrier Islands along the Indus Delta Region


1
Earth & Atmospheric Remote Sensing Lab (EARL), Department of Meteorology, COMSATS University Islamabad, Islamabad 45550, Pakistan
2
Key Laboratory of Digital Land and Resources, East China University of Technology, Nanchang 330013, Jiangxi, China
3
National Institute of Oceanography, Karachi 75600, Pakistan
4
Department of Geography, University of Karachi, Karachi 75270, Pakistan
*
Authors to whom correspondence should be addressed.
Remote Sens. 2019, 11(4), 437; https://0-doi-org.brum.beds.ac.uk/10.3390/rs11040437
Submission received: 16 January 2019
/
Revised: 6 February 2019
/
Accepted: 17 February 2019
/
Published: 20 February 2019
(This article belongs to the Special Issue Applications of Remote Sensing in Coastal Areas)
Abstract
:Barrier islands (BIs) have been designated as the first line of defense for coastal human assets against rising sea level. Global mean sea level may rise from 0.21 to 0.83 m by the end of 21st century as predicted by the Intergovernmental Panel on Climate Change (IPCC). Although the Indus Delta covers an area of 41,440 km2 surrounded by a chain of BIs, this may result in an encroachment area of 3750 km2 in Indus Delta with each 1 m rise of sea level. This study has used a long-term (1976 to 2017) satellite data record to study the development, movement and dynamics of BIs located along the Indus Delta. For this purpose, imagery from Landsat Multispectral Scanner (MSS), Thematic Mapper (TM), Enhanced Thematic Mapper Plus (ETM+), and Operational Land Imager (OLI) sensors was used. From all these sensors, the Near Infrared (NIR) band (0.7–0.9 µm) was used for the delineation and extraction of the boundaries of 18 BIs. It was found that the area and magnitude of these BIs is so dynamic, and their movement is so great that changes in their positions and land areas have continuously been changing. Among these BIs, 38% were found to be vulnerable to oceanic factors, 37% were found to be partially vulnerable, 17% remained partially sustainable, and only 8% of these BIs sustained against the ocean controlling factors. The dramatic gain and loss in area of BIs is due to variant sediment budget transportation through number of floods in the Indus Delta and sea-level rise. Coastal protection and management along the Indus Delta should be adopted to defend against the erosive action of the ocean.
1. Introduction
Global warming, being caused by the increase in temperature and atmospheric CO2, acts as a catalyst in the melting of glaciers, expansion of ocean water, increase in sea surface temperature, rise in sea-level, and increase in tropical storms intensity [1,2,3,4,5,6]. Accelerated sea level rise (SLR) threatens human settlements, and environmental and economic assets which have been tremendously developed in the coastal zones over the last five decades. SLR also shows alarming situation to the low lying sandy beaches and barrier islands (BIs) and intensifies erosion along the coastal areas. It has been predicted that, globally, up-to one meter rise in sea-level for the next hundred years can severely increase salinity of estuarine water, disturb coastal sediment budget supply, disrupt marine life, damage sub-surface and surface fresh water supplies, and damage agricultural and industrial areas [7,8,9].
Coastal topography may constantly change with numerous oceanic and physical processes including tidal flooding, SLR, and tsunami effect. This may cause sinking of low-land areas, and erosion of sediments which is a great concern for coastal researchers and investigators [10,11,12,13,14]. Further sediments excavation, river modification and construction along coastal areas also play an important role in coastal areas including the BIs [15,16,17,18,19].
BIs are generally defined as the long offshore sand deposits which are 3 to 160 km in length and 1 to 3 km in width, and are separated but parallel to the main coastal area by the water inlets, bays and inland sea [20]. BIs form a first line of defense for the main-land against high-energy tropical cyclones and rise in sea-level, which would otherwise directly transfer their full energy against the seashore. Provided coastal sand supplies are plentiful, and the gradient of sea-bed is gentle, the main-land is usually bordered by a chain of BIs. The water in the estuaries and bays is continuously exchanged with the water of the open shelf by flow through tidal inlets, water gaps separating BIs from one another [21]. High wave energy is likely to close the tidal inlets while strong tidal flux keeps them open [22]. A recent survey reveals that 20,783 km of coastline is occupied by 2149 BIs, worldwide [23]. Therefore, rise in sea-level poses a considerable risk of 10% to the world’s total population (7.6 billion) living in lowland coastal areas [24]. Furthermore, tropical cyclones hitting BIs and the coastal systems will cause more devastation to the coastal-urban environment and infrastructure, and also disturb the geometries of the BIs [25,26,27]. In order to track the changes in BIs shape, area, and their position, several methods have been adopted. For example, the topographic surveys, aerial photogrammetry, and GPS (Global Positioning System) surveys. Recently, the unmanned airial systems (UAS) have revolutionized the science and have proved their practice in remote sensing for short term change detection of coastal land masses, which include both autonomous and remotely piloted aircraft [28]. Although these methods have high spatial and temporal resolution for coastal assessment of short-term changes as well as long-term trends, but they are labor intensive and expensive for non-funded research projects. Thus, the free availability of the medium spatial resolution satellite data (Landsat and Sentinel) in the last decade has enabled the use of multi-sensor, multi-spectral, and multi-temporal satellite imagery of extensive coastal areas to detect and monitor long-term trends of coastal land masses and coastline changes.
1.1. Background of the Study
Pakistan’s shoreline extends more than 1000 km along the Arabian Sea which is divided into two coastal areas (i.e., coastal areas of Sindh and Makran). More than 10% of the population of Pakistan is living in the locality of coastal zone, about 20% of the coastal area of Pakistan is comparatively developed, and 40% of the country’s industrial areas are located somewhere on or near the shore. The coast of Karachi city is about 70 km long surrounded by a chain of BIs, oriented NW–SE. Currently, 6.8% of the total population of Pakistan (15 million people) is living in the vicinity of the coastal city Karachi of the Indus Delta Region (IDR) which makes it the fifth largest coastal city [29] where a rate of SLR has increased from 1.1 mm/year [30,31] to 1.8 mm/year. IDR is considered as economic hub for Pakistan because Port Qasim and Karachi Port handle about 90% of all external trades. The IDR is stretched more than 200 km and always affected by high southwestern summer monsoon (May–September) winds having average speed of 15 m/s but during the northeastern winter monsoon winds below with an average speed of 5 m/s [32]. Wave measuring at 20 m water depth offshore of Karachi city show a mean significant wave height of 1.8 m during SW monsoon with a mean wave period of 9 s and during the NE monsoon winds, significant wave height is about 1.2 m with a wave period of 6.5 s [33]. The geomorphological changes have occurred at the center of Karachi coast along Bundal and Buddo Islands [34]. IDR is experiencing geomorphological changes in all areas along its major and minor creeks in the form of erosion processes and low deposition rate of sediment budget from Indus River during post-damming era [35]. IDR has been considered as one of the most dynamic deltaic systems which consists of 16 major tidal inlets having 17,000 km2 area with an active tidal flat area of 10,000 km2, significant number of BIs [36] and hosts world’s largest arid mangrove forest [37]. The IDR is ranked as the fourth highest delta in receiving average high wave energy as compared with other famous deltas around the world (e.g., Nile, Mississippi Niger, Ganges, and Ebro deltas) [38]. The soil of IDR is less resistant to ocean hydro dynamics so the deltaic shoreline recede at average rate of 50 m/y along the central delta coast [35]. SLR followed by sea-water intrusion is claiming more land and changing the geomorphology of the low-lying land masses in the Indus Delta [32,39,40]. A SLR of about 1 meter is expected to sink or sea-encroach an area of 3750 km2 in the Indus Delta [30]. The global mean sea-level rose at a mean rate of 1.7 mm/year from 1900 to 2010 and at a rate 3.2 mm/year between 1993 and 2010 [41]. Moreover, Intergovernmental Panel on Climate Change (IPCC) f claimed that globally, sea-level will rise from 0.18 m to 0.59 m by the end of 21st century [42] but in the current scenario it will rise to 0.21 m to 0.8 m [43]. Therefore, if the sea-level rose at considerable rate, these narrow and low-lying landforms (i.e., BIs) would be extremely vulnerable so, they either migrate landward; experience erosion or accretion in its land mass in addition to other oceanic factors, but its overall response is unpredictable.
Several studies have investigated the behavior of BIs under different climatic and geographic setting, i.e., at global scale, Stutz and Pilkey (2011) [23] have studied the influence of sediments depositional settings, ocean climatic system and wave-tide regime on open-ocean BIs distribution and morphology. They revealed that 20,783 km of total worldwide coastal shoreline is occupied by 2149 open-ocean BIs. While at local scales, Madurapperuma et al. (2017) [44] used kite aerial photographs for mapping shoreline vulnerabilities at the Oluvil Harbor in Ampara, Sri Lanka and found that a 2 m rise in sea level inundated 90% area of the harbor. Kundu et al. (2014) [45] carried out shoreline mapping of the Sagar Island in West Bengal, India for the period of 1951 to 2011 using geospatial techniques to estimate morphological change and its future prediction. In a study of nearshore and foreshore influence on over-wash of a BI proposed by Matias et al. (2014) [46], identified and described longshore differences in storm impacts along a BI and evaluated the role of sub-aerial and submerged morphological variations in over-wash events on the western segment of Barreta Island, which is part of the Ria Formosa BI chain, in southern Portugal. Morton (2008) [47] has investigated that the Mississippi-Alabama BIs in the north-central Gulf of Mexico are undergoing rapid systematic land loss and translocation because of disruption of the sand-transport system. Moore et al. (2007) [48] has carried out sensitivity analyses on the outer banks of North Carolina and recommended that if sea-level rose by 0.9 m by the end of 21st century, the outer banks may translocate up to 2.5 times more quickly than at the present rate.
1.2. Purpose of the Study
Land reclamation has been a major anthropogenic factor affecting the Pakistan’s coast and BIs and there has not been any systematic study for the evaluation. Therefore, this study aims at using the satellite remote sensing as a mean for (i) assessing the development, movement and change (morphology) in position of the BI chain along the Indus Delta from 1976 to 2017 and (ii) assessment of the rate of systematic land-loss due to physical processes.
2. Study Area
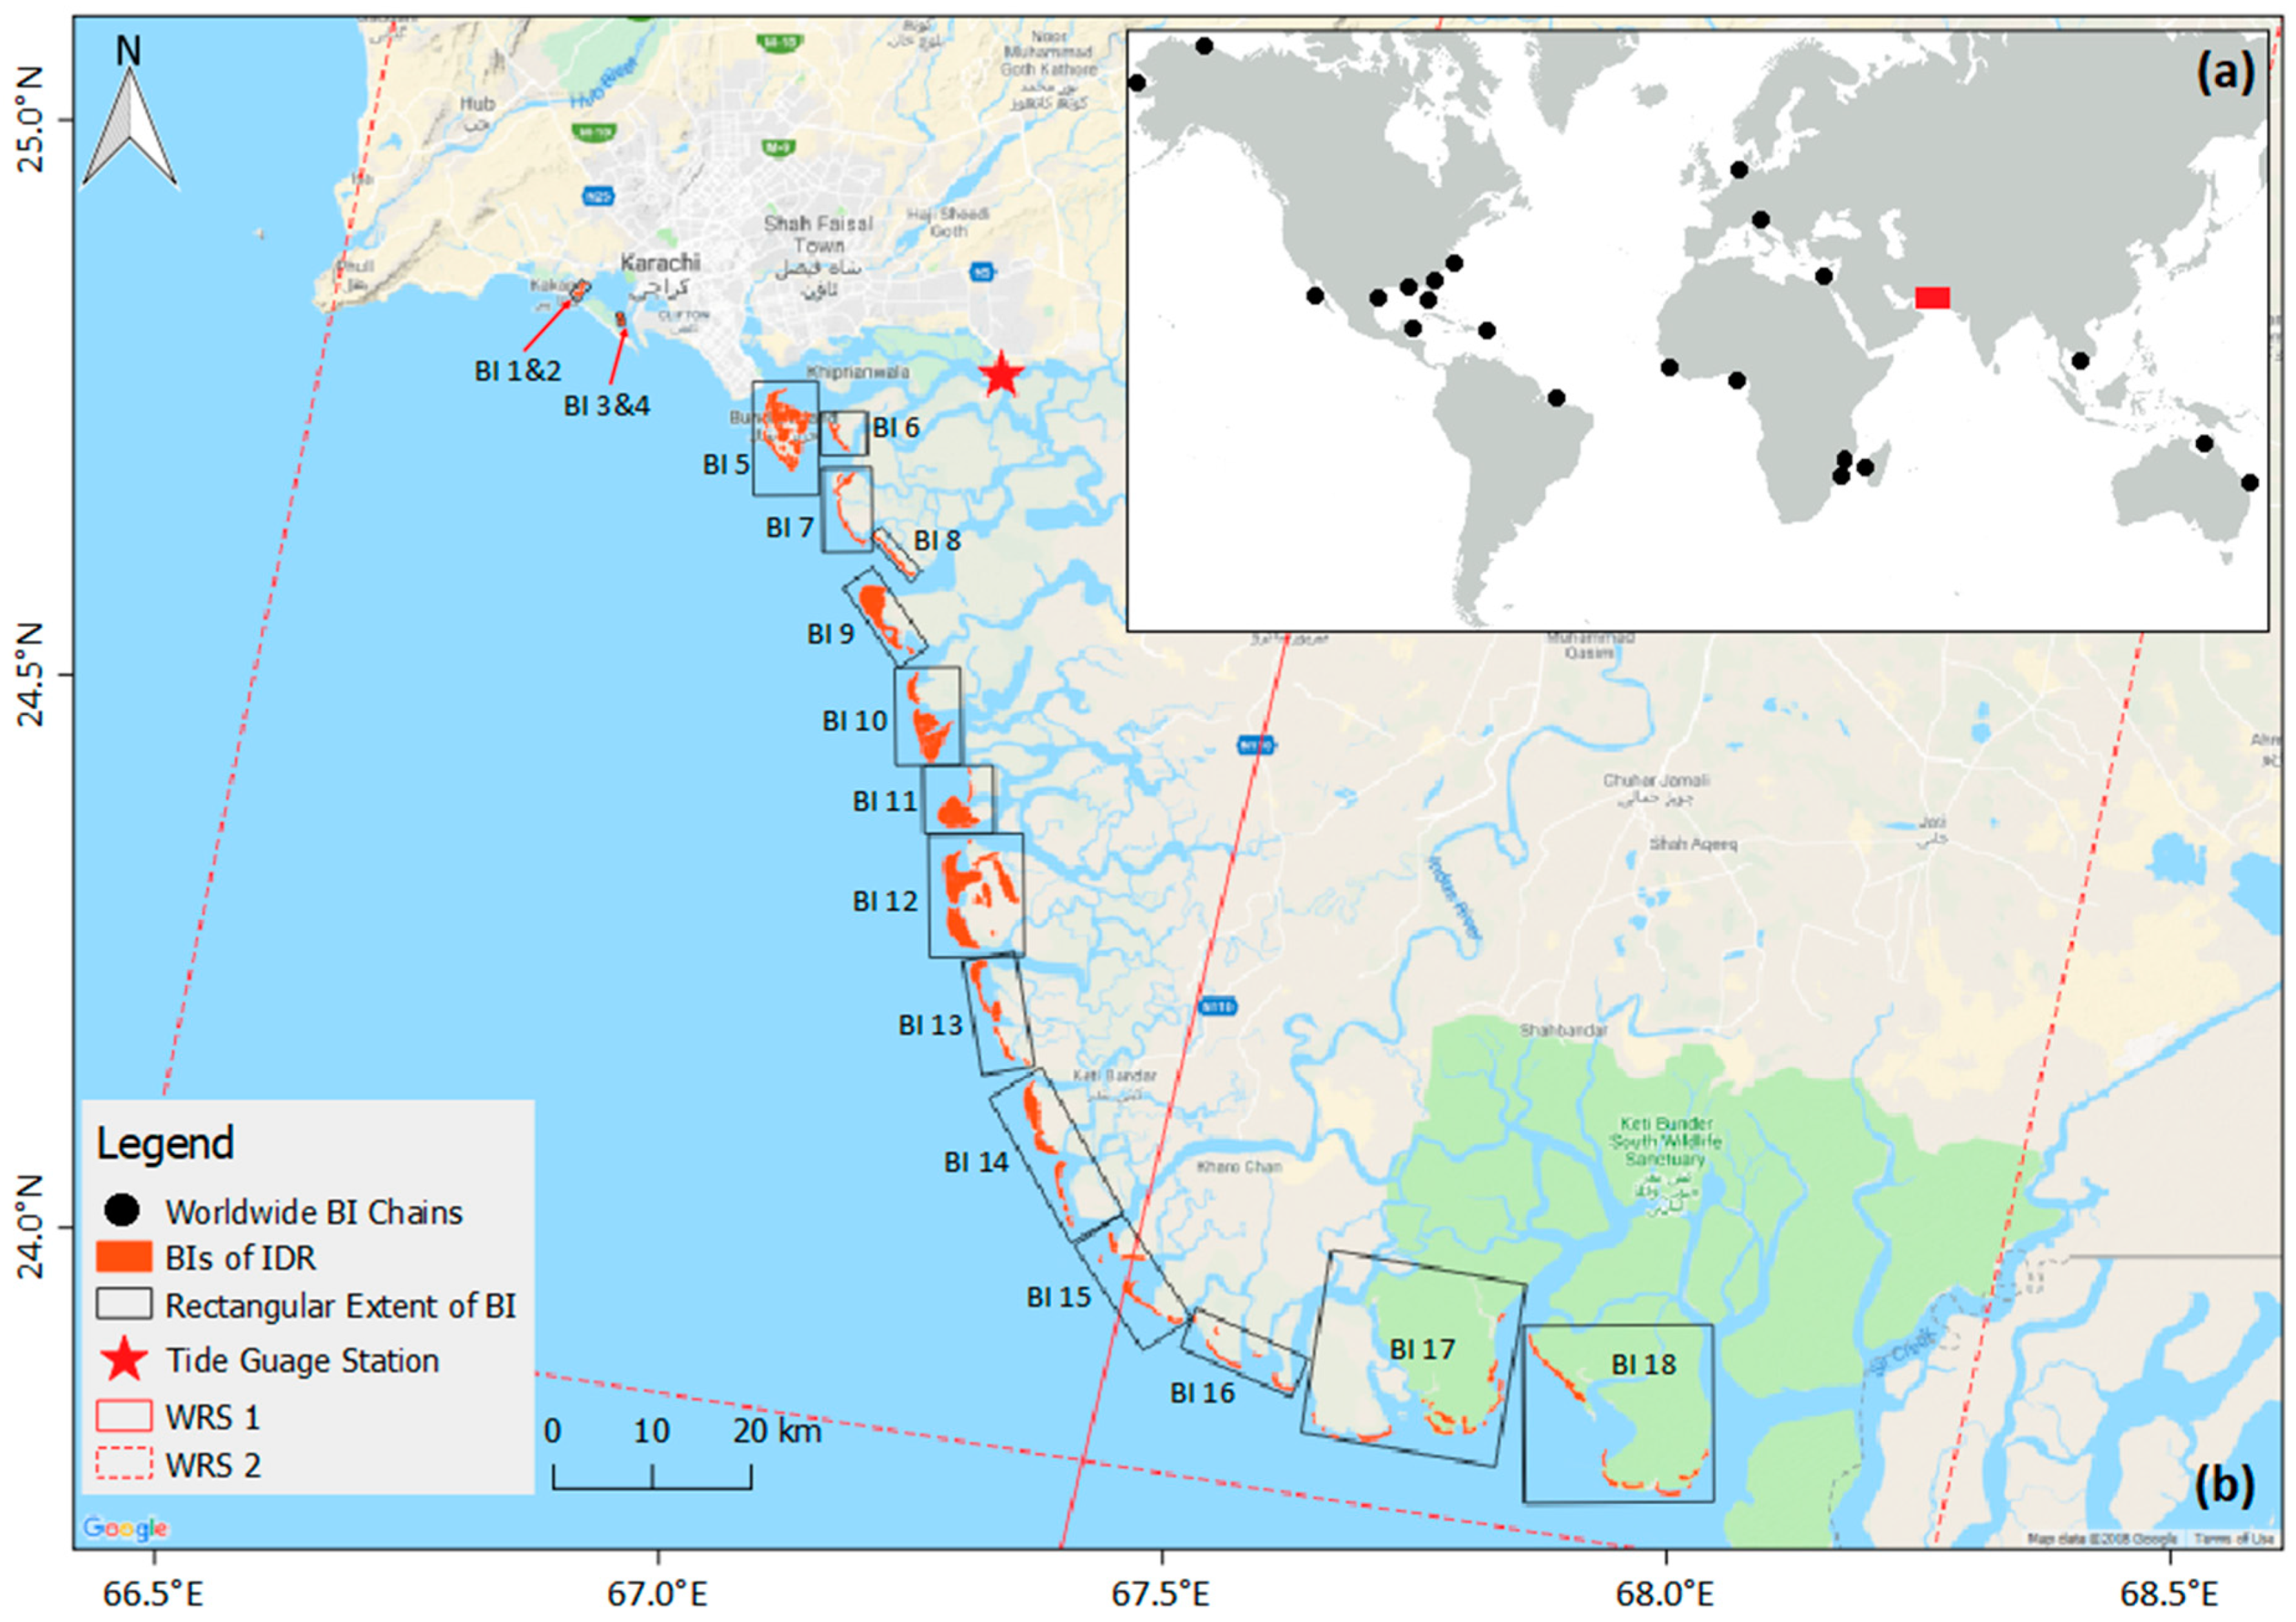
IDR is located between the Indian border along ‘Sir Creek’ on the east to the ‘Hub River’ on the west having length of 320 km and forming IDR (Figure 1). IDR is located at the head of the Arabian Sea, between Korangi Creek and the Rann of Kutch [30,40]. IDR has 22 tidal creeks which supply the sediment budgets to the BI chain. Main creeks of IDR include Phitti, Waddi Khuddi, Dabbo, Hajambro, Wari, Khar, Keti Bunder, Chann, and Khobar connecting Indus River to Indian Ocean [8].
IDR has 2.6% of the world BI with total length of 567 km [23] (Figure 1). Indus Delta is mixed wave dominated delta [23] where continuous accretion and erosion due to waves and tides up to 3 m in height modify the BIs. Bundal Island is a triangular shaped island located at the eastern side of Karachi harbor and at the intersection of the three major creeks, Gizri creek, Korangi creek, and Phitti creek. Its northern side is wide, and the southern side is narrow. Bundal Island has great social-economic importance in the study area because it protects Phitti creek, a navigational channel of Port Bin Qasim, and the human settlements from the high energy wave.
3. Methodology
3.1. Satellite Data
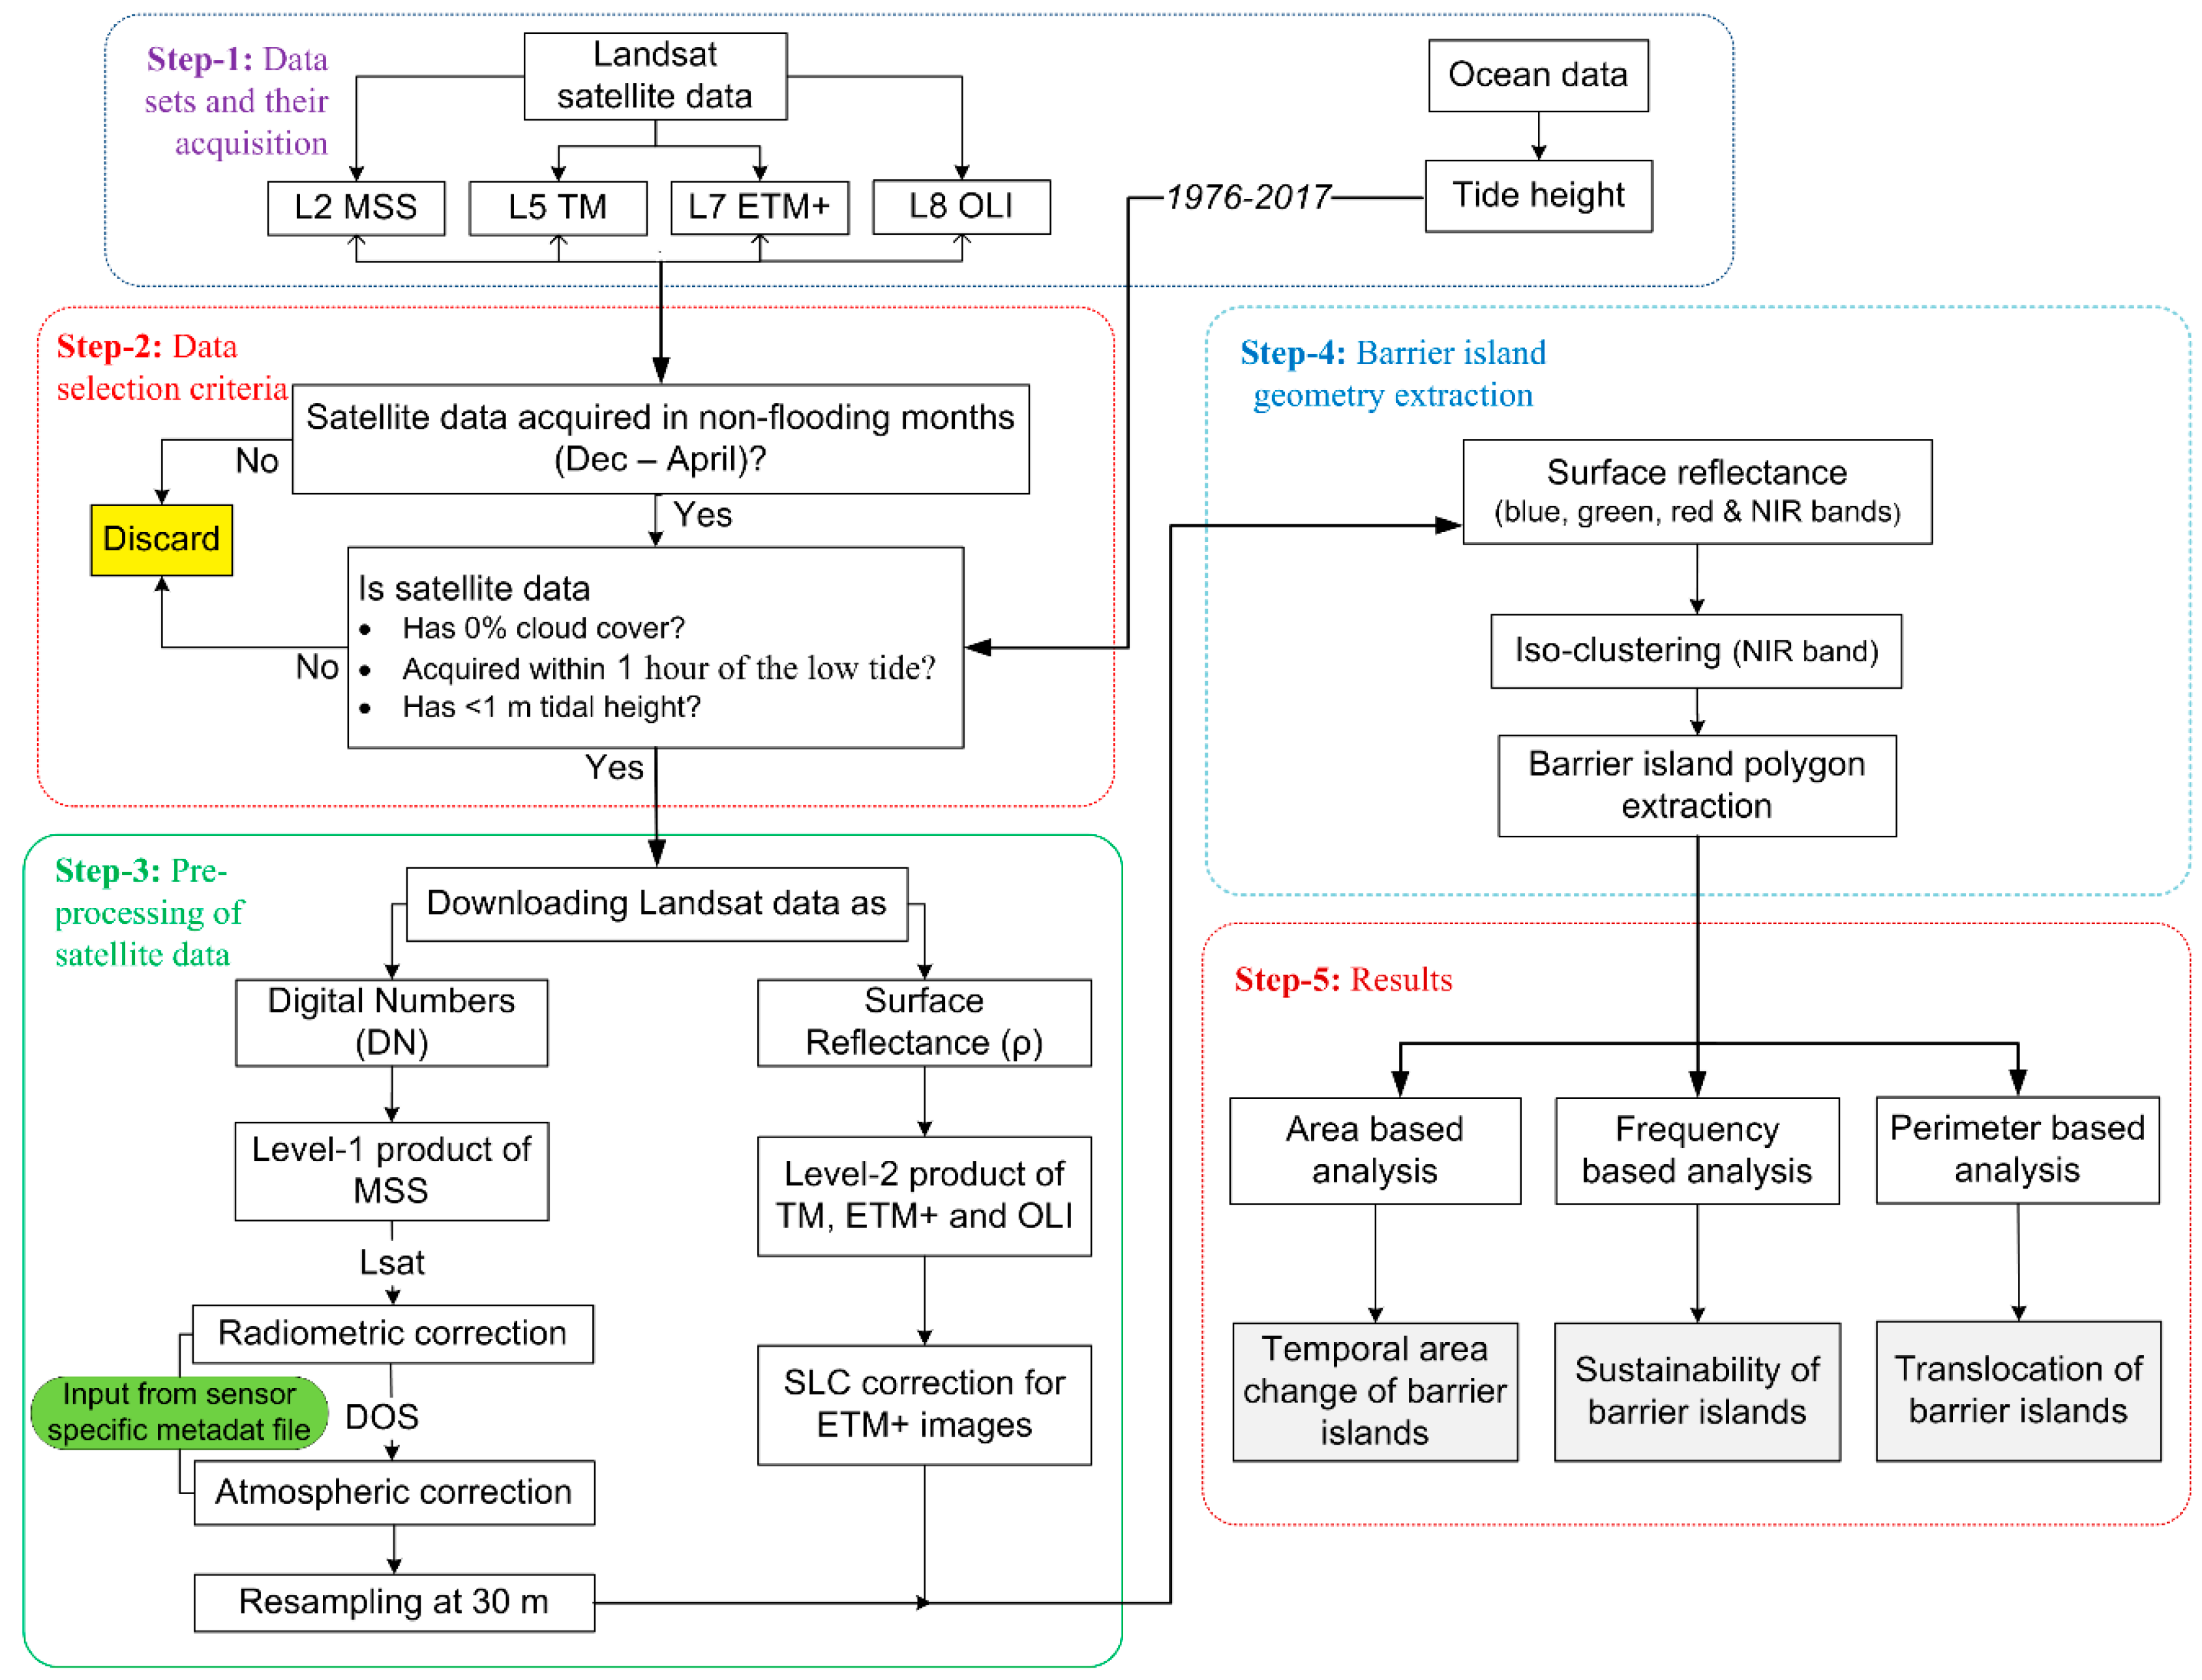
This study has used the archived imagery of Landsat-2 (L2) Multispectral Scanner (MSS), Landsat-5 (L5) Thematic Mapper (TM), Landsat-7 (L7) Enhanced Thematic Mapper Plus (ETM+), and Landsat-8 (L8) Operational Land Imager (OLI). L2, L5, L7, and L8 satellites were launched during January 1975, March 1984, April 1999, and February 2013, respectively. L2 and L5 were decommissioned during July 1983 and January 2013, respectively. The MSS sensor had spatial resolution of 80 m with a revisit frequency of 18 days and acquired the imagery on the Worldwide Reference System-1 (WRS-1), while the TM, ETM+ and OLI sensors have spatial and temporal resolutions of 30 m and 16 days, respectively on Worldwide Reference System-2 (WRS-2). All the images acquired from ETM+ after 31 May 2003 suffer from the Scan Line Corrector (SLC) error which causes 22% loss of the data [49]. Therefore, the SLC error was corrected using the “Fill nodata tool” under the raster tools available in QGIS 2.8.8 software.
Overall, this study has used 10 Landsat Collection 1 (C1) images from 1976 to 2017 acquired through L2 MSS, L5 TM, L7 ETM+, and L8 OLI sensors (Table A1). The Level-1 (radiometrically calibrated and orthorectified) MSS image were obtained from the United States Geological Survey (USGS) Earth Explorer website (http://earthexplorer.usgs.gov/) while the atmospherically corrected Level-2 (surface reflectance) images of TM, ETM+, and OLI were obtained from the USGS Earth Resources Observation and Science (EROS) Center Science Processing Architecture (ESPA) On Demand Interface (https://espa.cr.usgs.gov/). Images from different months of the years enabled the investigation of the morphological changes of the BIs over the study area according to the same oceanic and cloud free condition.
3.2. Tidal Data
Tide height was used in the satellite image selection process for the identification and extraction of geometry of the BIs. Ocean tide height along the coast of Sindh, Pakistan is monitored using a fixed tide gauge located at Port Muhammad Bin Qasim (24.7833°N, 67.3500°E) by National Institute of Oceanography (NIO) Karachi, Pakistan (Figure 1b). The maximum and minimum tide heights recorded at this station are 3.8 m and little less than 0.1 m between 1976 to 2017.
3.3. Satellite Data Selection Criteria
Due to seasonal variations in the ocean controlling factors (wave, tides, sea level rise, storms and sediment budget) and suitable atmospheric conditions, selection of satellite images at the same time of the year is important for studying the morphology of BIs [50]. Therefore, only those Landsat (MSS, TM, ETM+, and OLI) images were selected which had 0% cloud cover over the study area duly verified from the metadata file (.MTL) which is provided along each image. The objective for taking only those scenes with 0% cloud cover is due to the limitation of the optical imagery. This criterion can be relaxed to 10% to 20% provided the studied area (or the specific barrier island) is not affected. This limitation can be overcome by using the Synthetic Aperture Radar (SAR) imagery and authors do not exclude this possibility.
Furthermore, the images from non-flooding months (December to April) were selected because tropical storms affect the coastal areas of Pakistan during May to June and September to November. Only those images were selected which had a tide height of <1 m within a time window of ±1 h before or after the image acquisition time. This image selection criteria (Figure 2) resulted in ten images including one image from L2 MSS, two images from L5 TM, six images from L7 ETM+, and one image from L8 OLI sensor from 1976 to 2017. The selected images were obtained as Level-2 surface reflectance products for the Landsat TM, ETM+ and OLI sensors, due to the unavailability of the surface reflectance product Landsat MSS, surface reflectance was estimated in house using the 6S atmospheric correction method [51] (supplementary materials).
3.4. Barrier Island Identification and Extraction
A BI can be identified based on its association with different features i.e., a BI always has a back-barrier lagoon, a tidal inlet, it faces the shore and it is distant from the land [52]. Taking advantage of the higher reflectivity of land features in the Near Infrared (NIR) wavelength, the NIR band of L2 MSS (0.7–0.8 μm), L5 TM (0.76–0.90 μm), L7 ETM+ (0.77–0.90 μm), and L8 OLI (0.85–0.88 μm) sensors was used for developing water/land mask through Iso-cluster image classification method [53].
The classified images (water/land mask) were then visually examined with their corresponding true color images by displaying at a scale of 1:75,000 for visually identifying the boundary of BIs. Shorelines of the wet marshy sand beaches around the perimeter of BIs are less reliable and vary more with tide level than sandy shorelines of island [54]. So, only elongated sand deposits which fulfill the criteria for BI identification [52] were extracted. The boundaries of the classified BIs were then converted to polygon features by using the raster to vector conversion tool available in QGIS 2.8.8 software. Where necessary, minor edits were made to the boundaries of BIs to extract the more accurate boundary. Small polygons found near the main perimeter of an island were merged to that specific island polygon. Furthermore, polygon areas were calculated and added to the polygon attribute tables. Through this process 18 BIs (Figure 1) were delineated for the whole IDR.
3.5. Pixel by Pixel Frequency of Barrier Island
After finalizing the boundary of each BI from each of the ten selected images (Table A1), raster overlay operation was applied to determine the pixel by pixel frequency of each existing valid pixel of island body. For this purpose, polygon feature of each BI, for each year was converted to a binary raster (with a native grid size of 30 × 30 m) using the vector to raster conversion tool available in QGIS 2.8.8 software where a filled value of 1 was assigned to each pixel of BI, and 0 for each pixel representing any feature(s) other than BI.
The boundary of each BI was different in each of the 10 images but for raster overlay operation, one need to have the same spatial extent for each BI. Therefore, a fixed spatial extent (suitable for all years for each BI) was created by drawing a rectangular polygon to the maximum extent on the east, west, north and south directions of that specific BI (Figure 1—red rectangles). At this point when spatial extent of each BI was same, raster overlay by addition operation was applied, which calculated the frequency value of 1 to 10 for each pixel of the BI. The pixel which shows frequency value of 10, indicates that the island body exists at that pixel (location) in each of the ten rasters (images) while descending number of frequency values (9 to 1) shows that existence of valid island pixels for each image is decreasing.
4. Results
4.1. Boundary Delineation of Barrier Islands
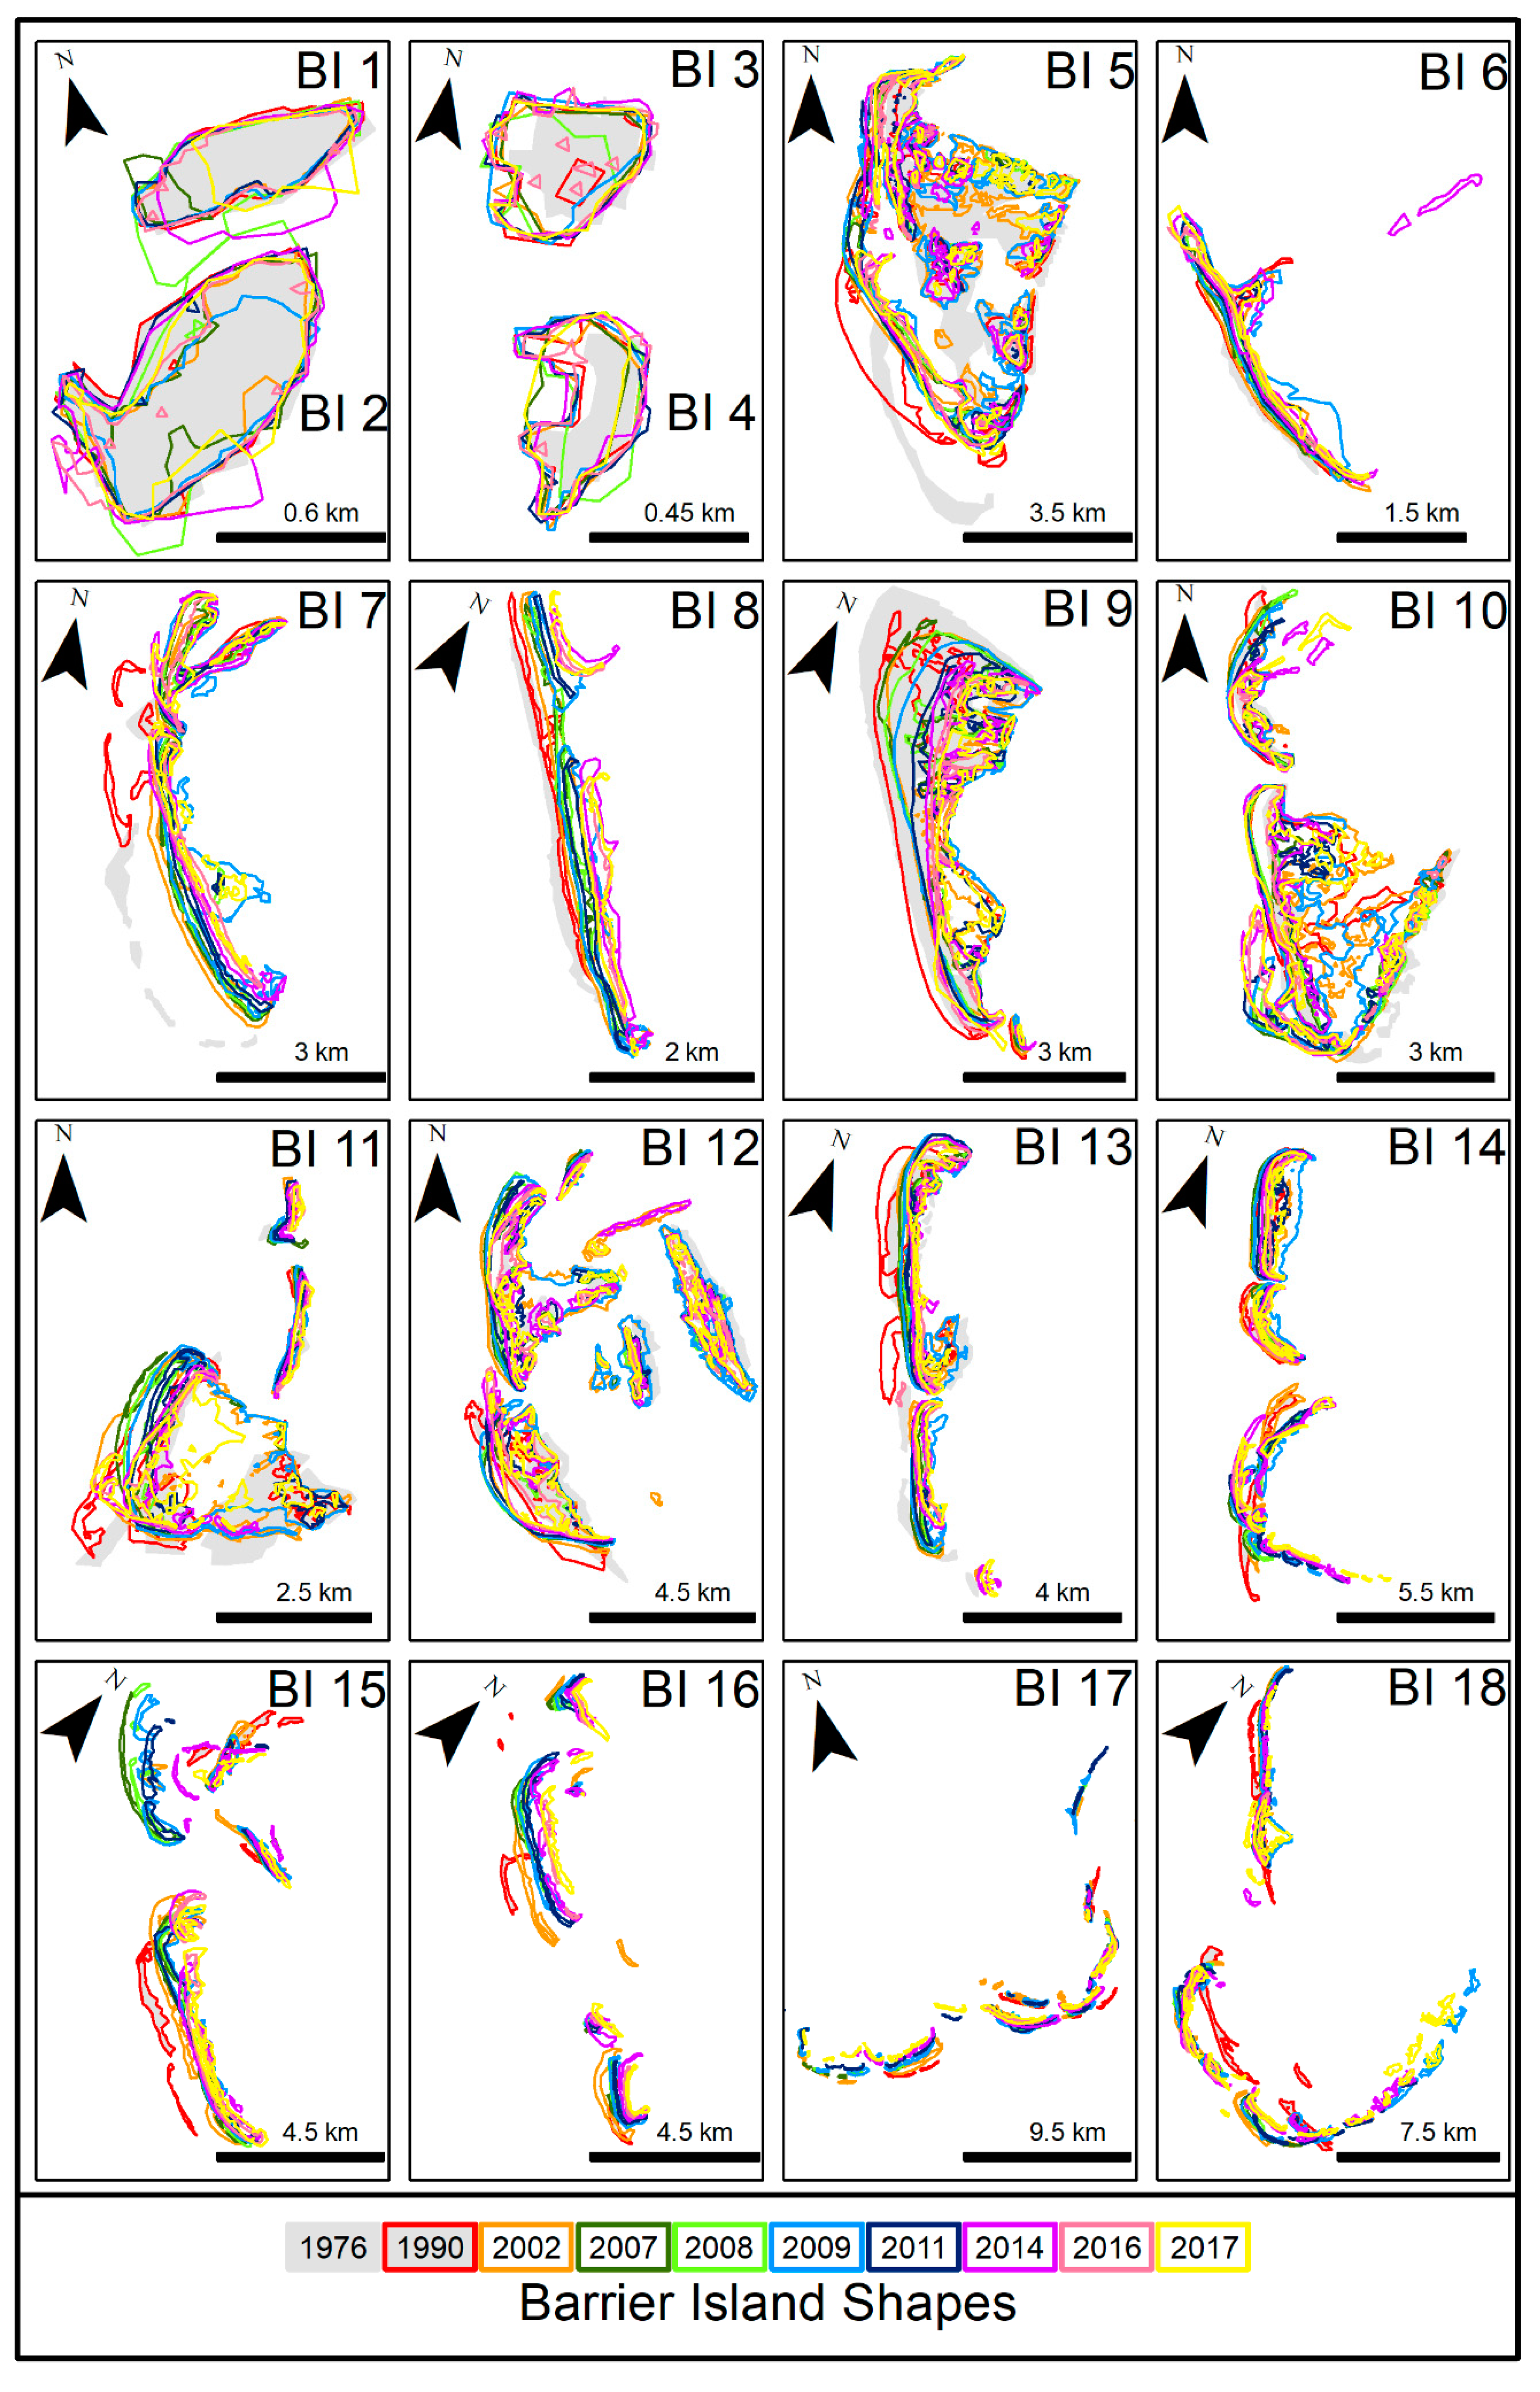
The variant changes observed in the boundary of BIs during study period indicate that generally, there is a retreat of the boundary, and shapes of the BIs have evolved (Figure 3). In Figure 3, the color variations represent the shape of a BI in a specific year. For BIs 1 to 13 the 1976 boundary (filled grey colored polygons) was used as a reference to gauge the movement of the BIs, while it should be noted that for BIs 14 to 18 there is no boundary for the year 1976 which was due to the unavailability of the L2 MSS image satisfying the image selection criteria (Figure 2), hence 1990 boundary (filled grey colored polygons with red outline) was used as a reference. It is evident that, except BIs 1 to 4, 6, and 13, the shape of the BIs has been evolving significantly which can be due to the climatic and oceanic factors. It has been observed that some of the BIs are shrinking while others are expanding in both directions—i.e., oceanside and landside—against the accelerated SLR.
Among all the 18 BIs, BIs 5 and 9 (Figure 3) have lost significant areas and moved towards the land. BI5 also known as Bundal Island (local name) is the largest island located near the most western part of the Indus Delta. In personal communication with the NIO officials we came to know that the island has faced erosion from tidal currents passing through small prolonged tidal inlets on the eastern side and due to the passage of the cargo ships from the southern part of the island at the opening of the Phitti Creek, which produces constant backward and forward ocean currents. The island is abundant in mangroves on the northern side which helps it to retain its northern side. The boundary of the island is shrinking slowly from the eastern and southern sides while expanding from the western side as it is protected from any direct erosive factor (Figure 3). An overall summary of BI wise morphological changes from 1976 to 2017 has been presented in Table 1.
4.2. Sustainability of Barrier Islands
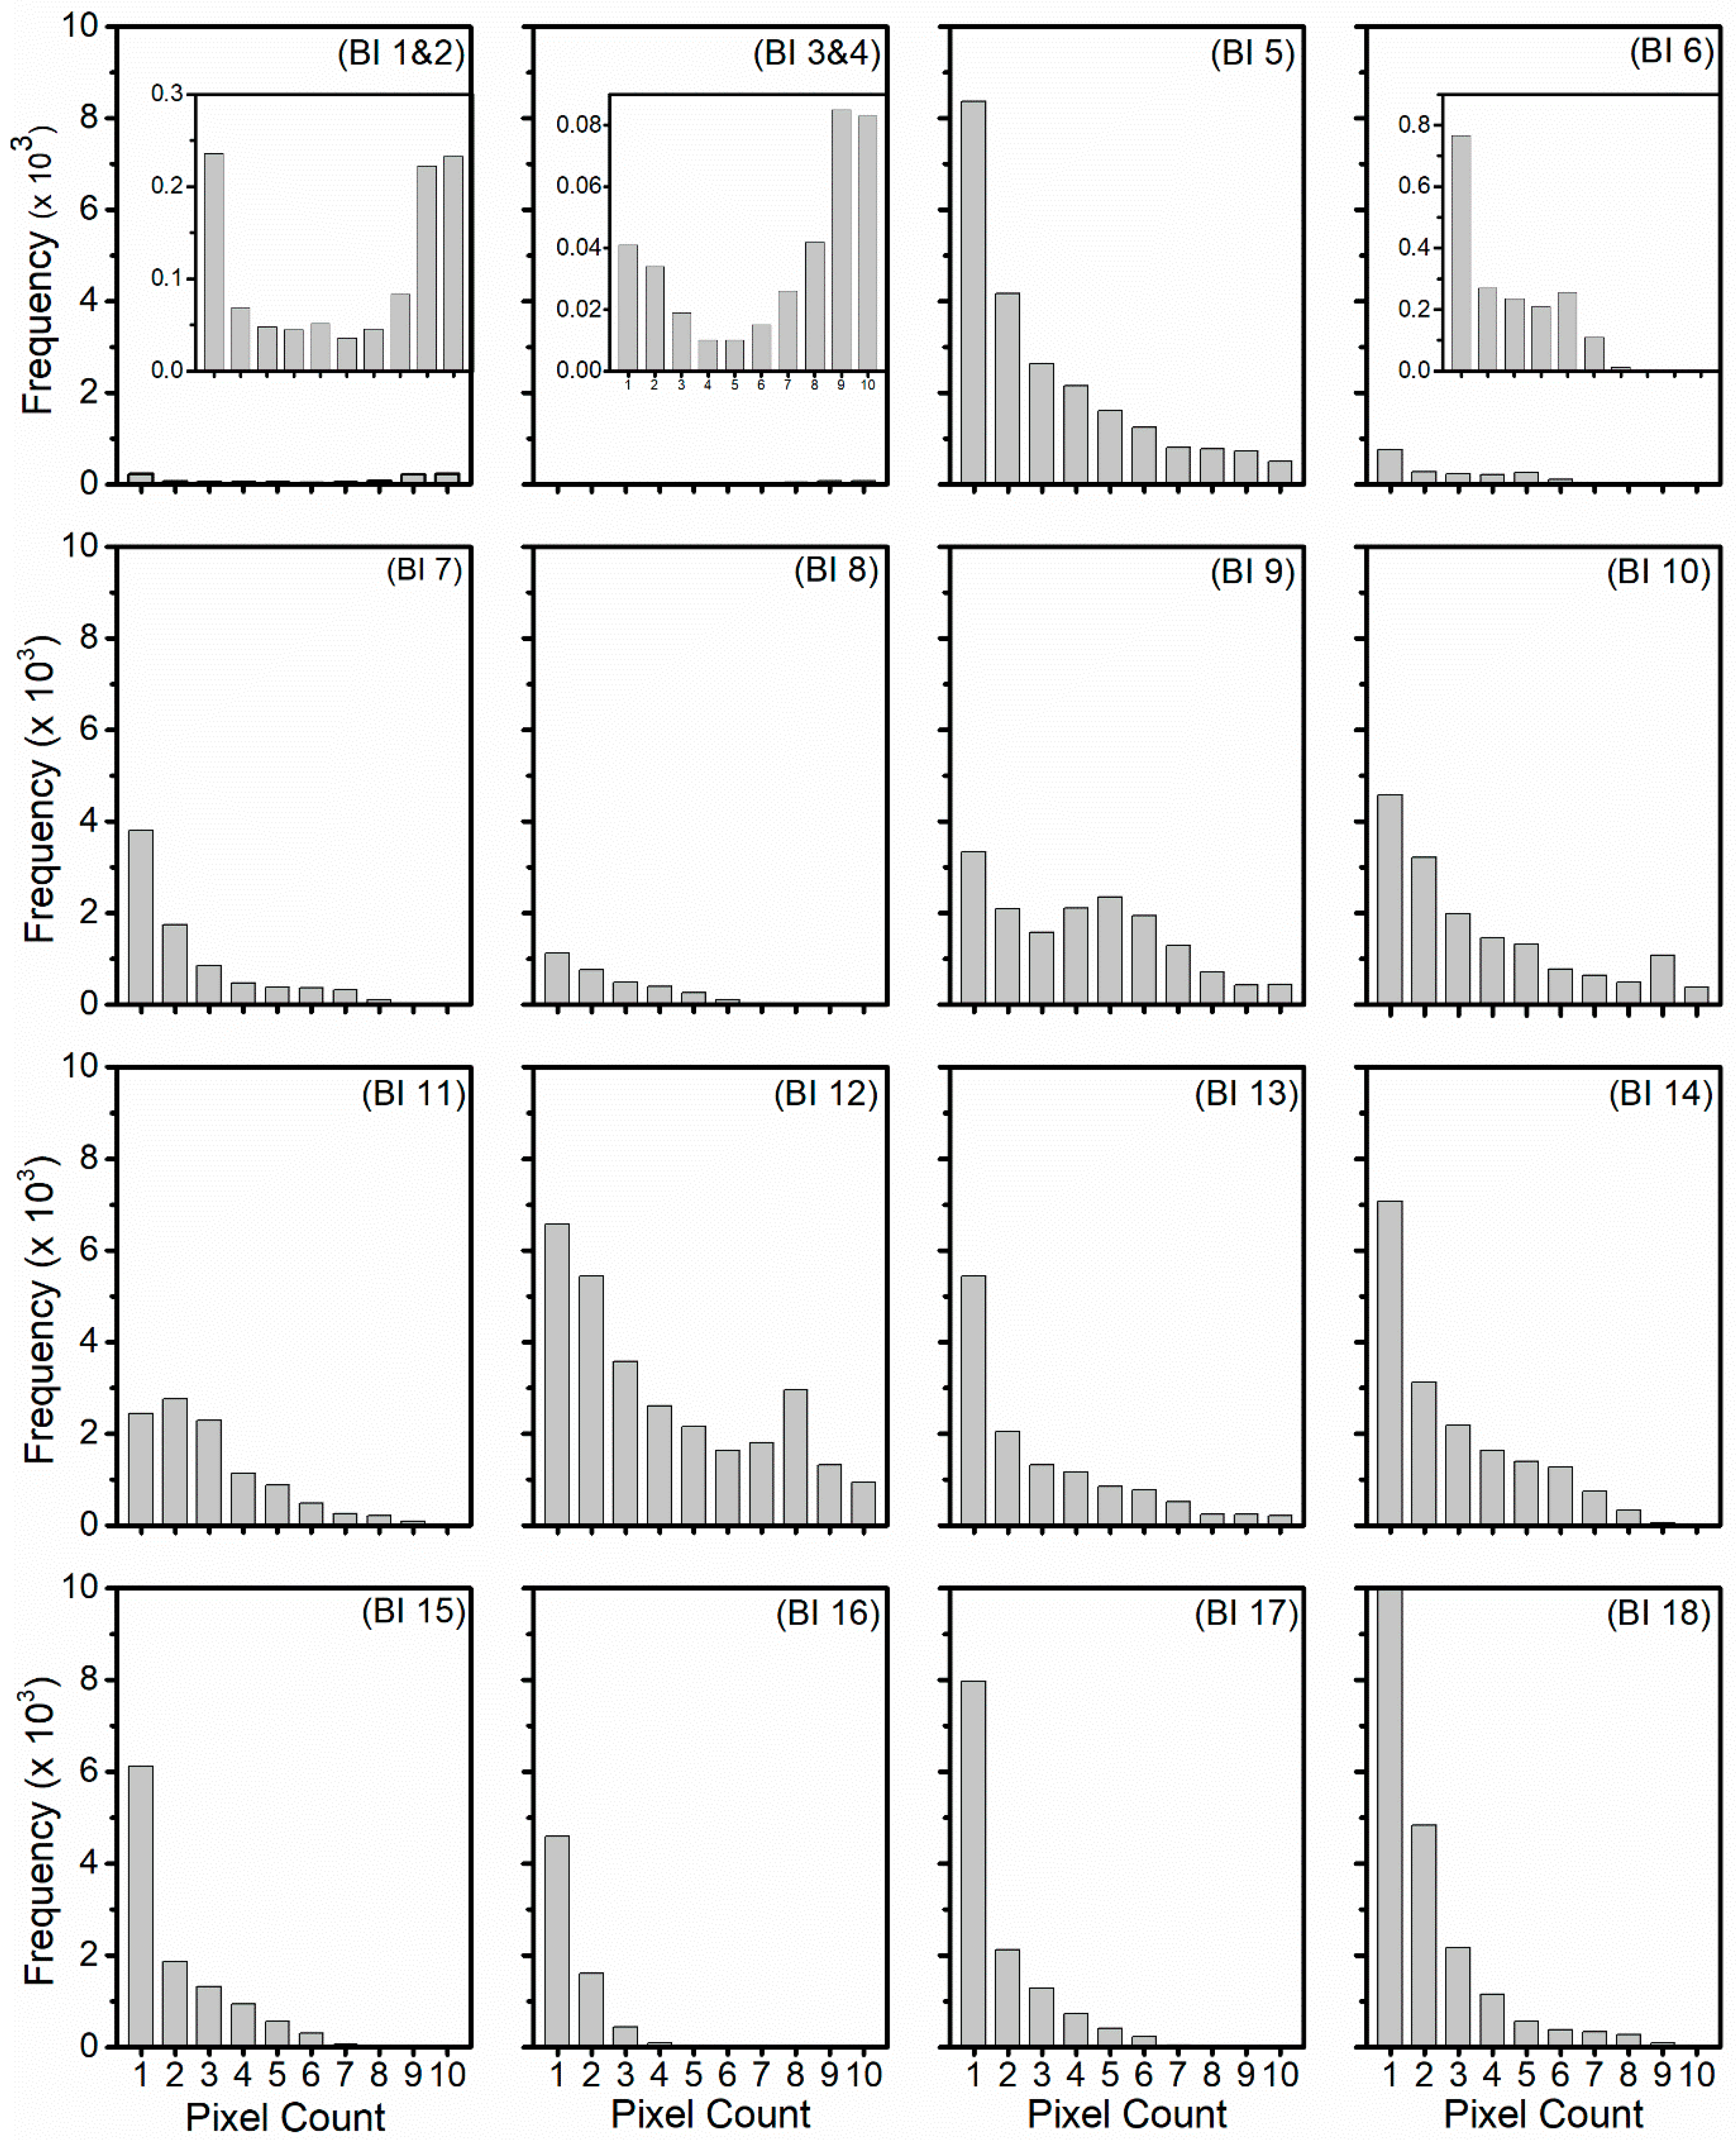
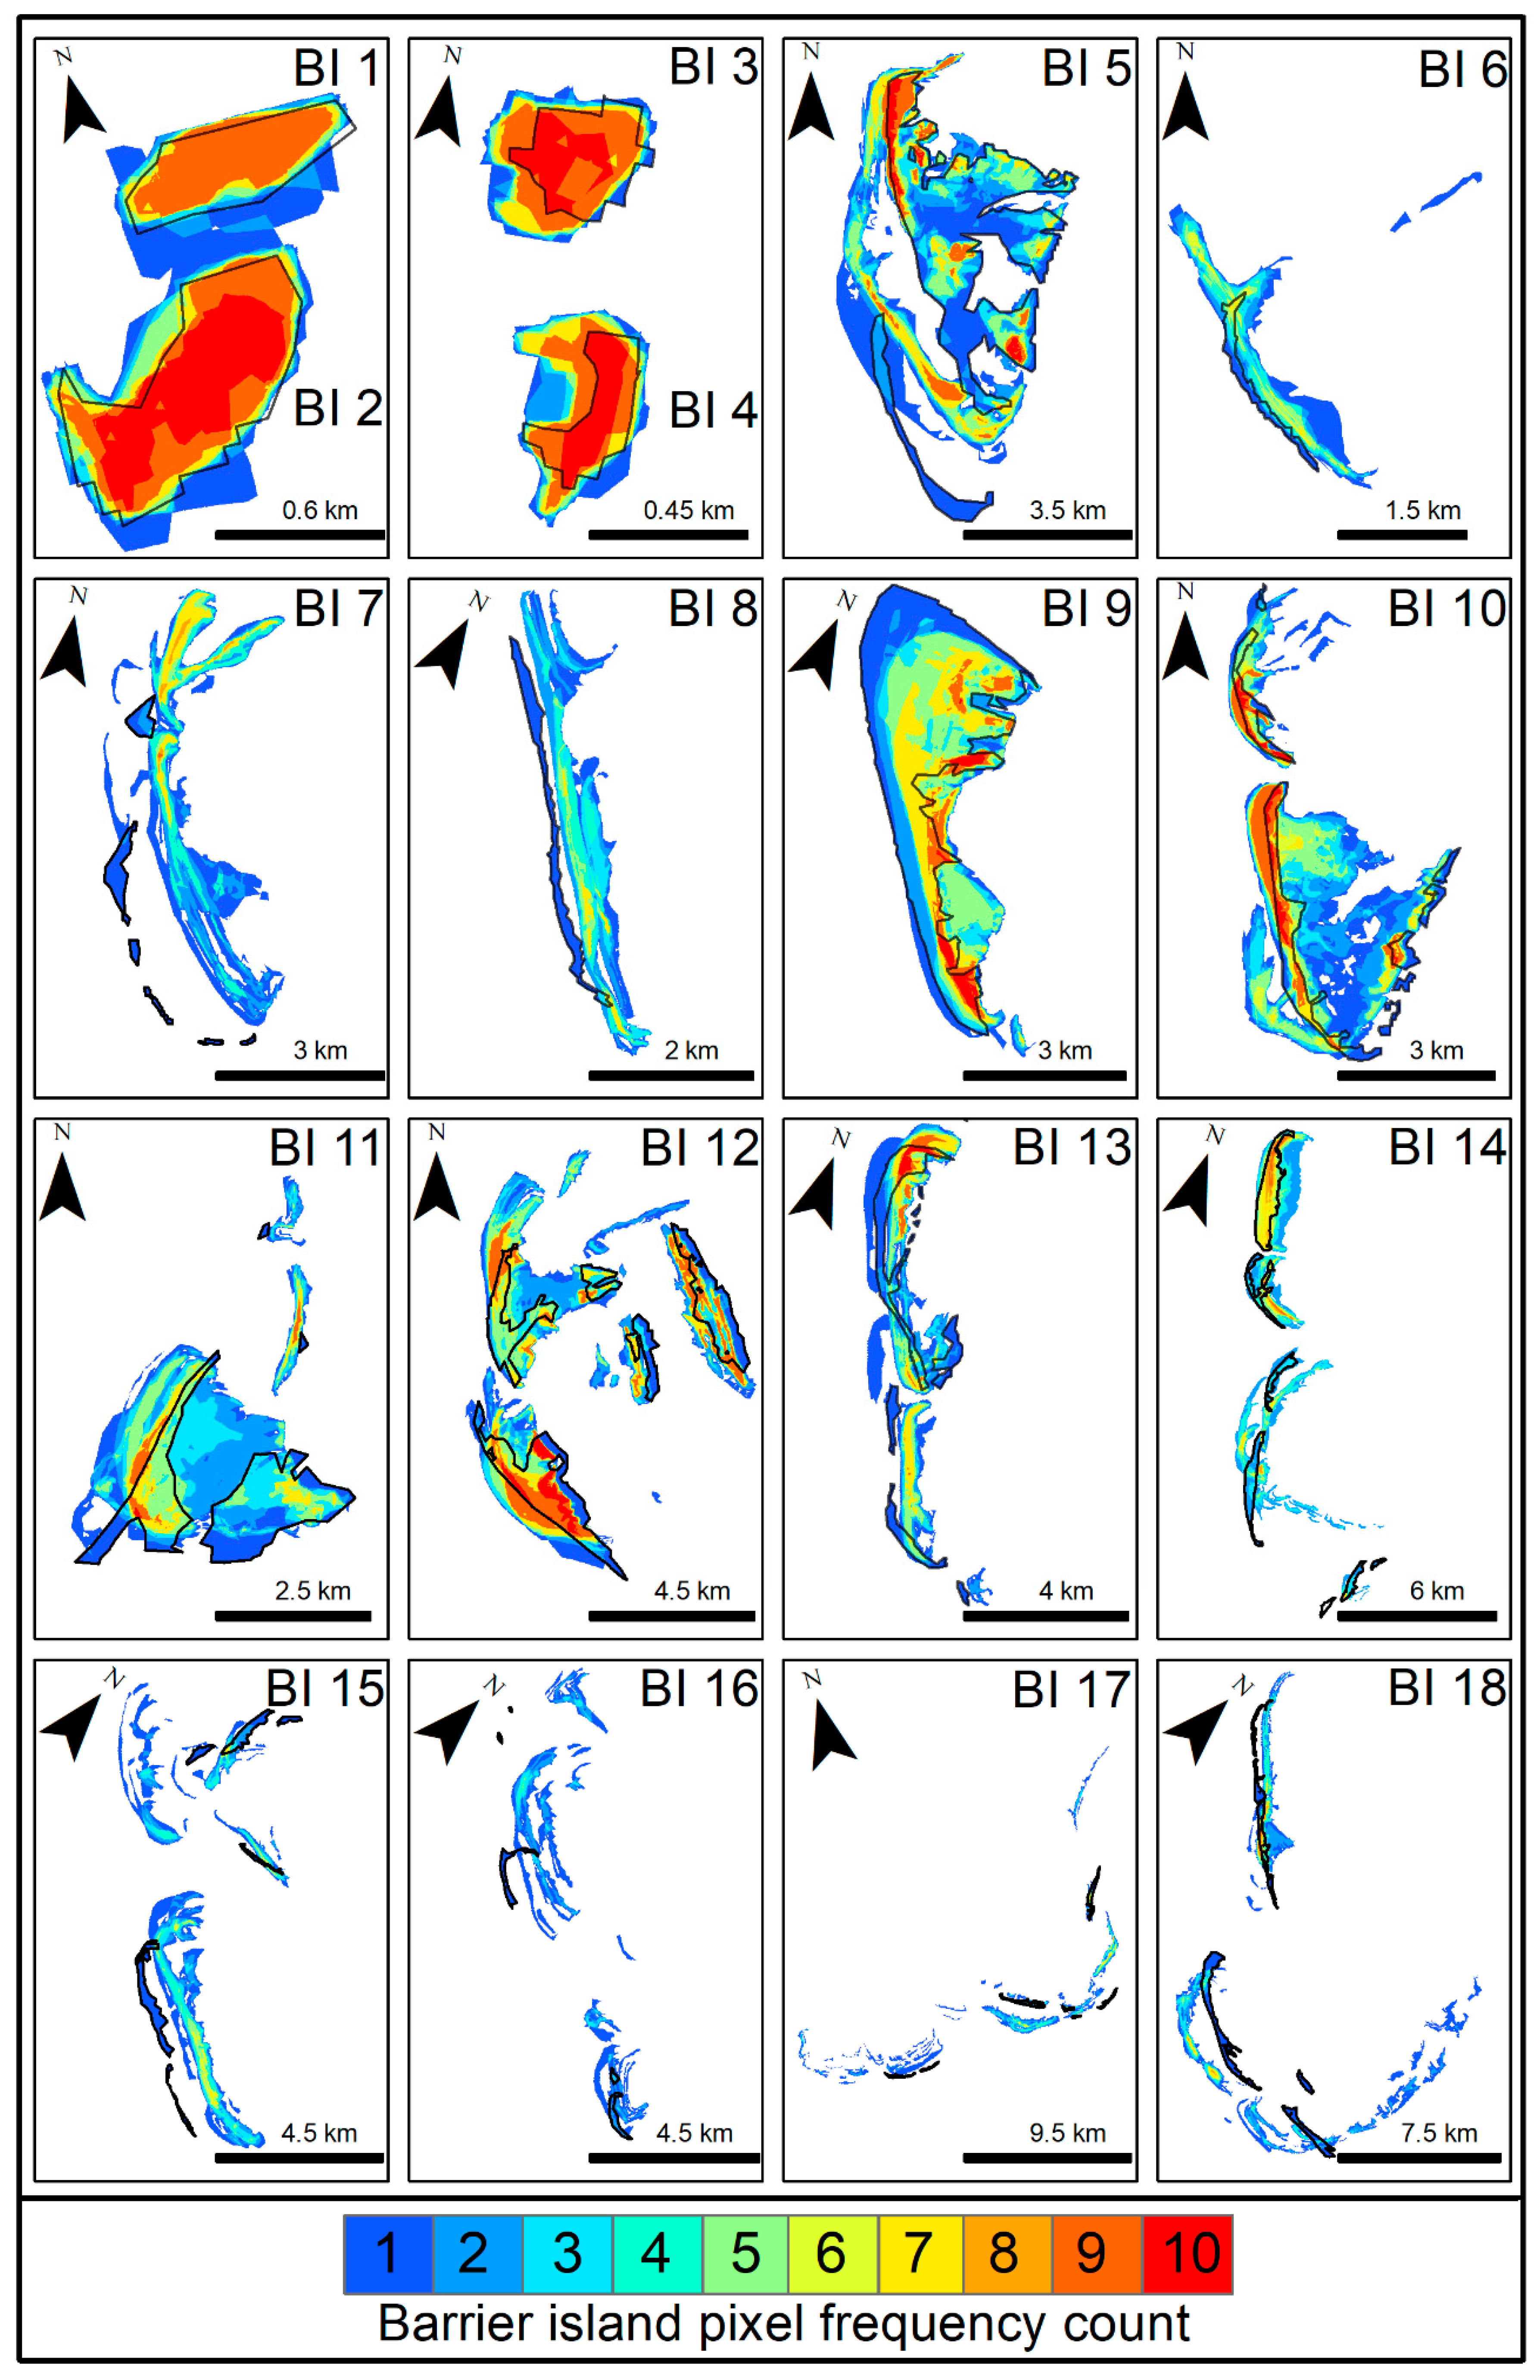
The vulnerability or sustainability of BI over the study period against the climatic and oceanic factors such as storm erosion, reductions in sediment, longshore drift and SLR shows that the BI are mostly vulnerable to greater extent (Figure 4). The pixel frequency values from 1 to 10 for each BI revels about the existence of the island body covering 10 years of study period at that pixel which is important to assess the sustainability of the BI chain of the Indus Delta. Increasing pixel value from 1 to 10 shows more stable part of the island, such that 10 indicates an area present throughout the study period whereas 1 indicates a part of the island that appears only once in study period (Figure 4).
4.3. Change in Area of Barrier Islands
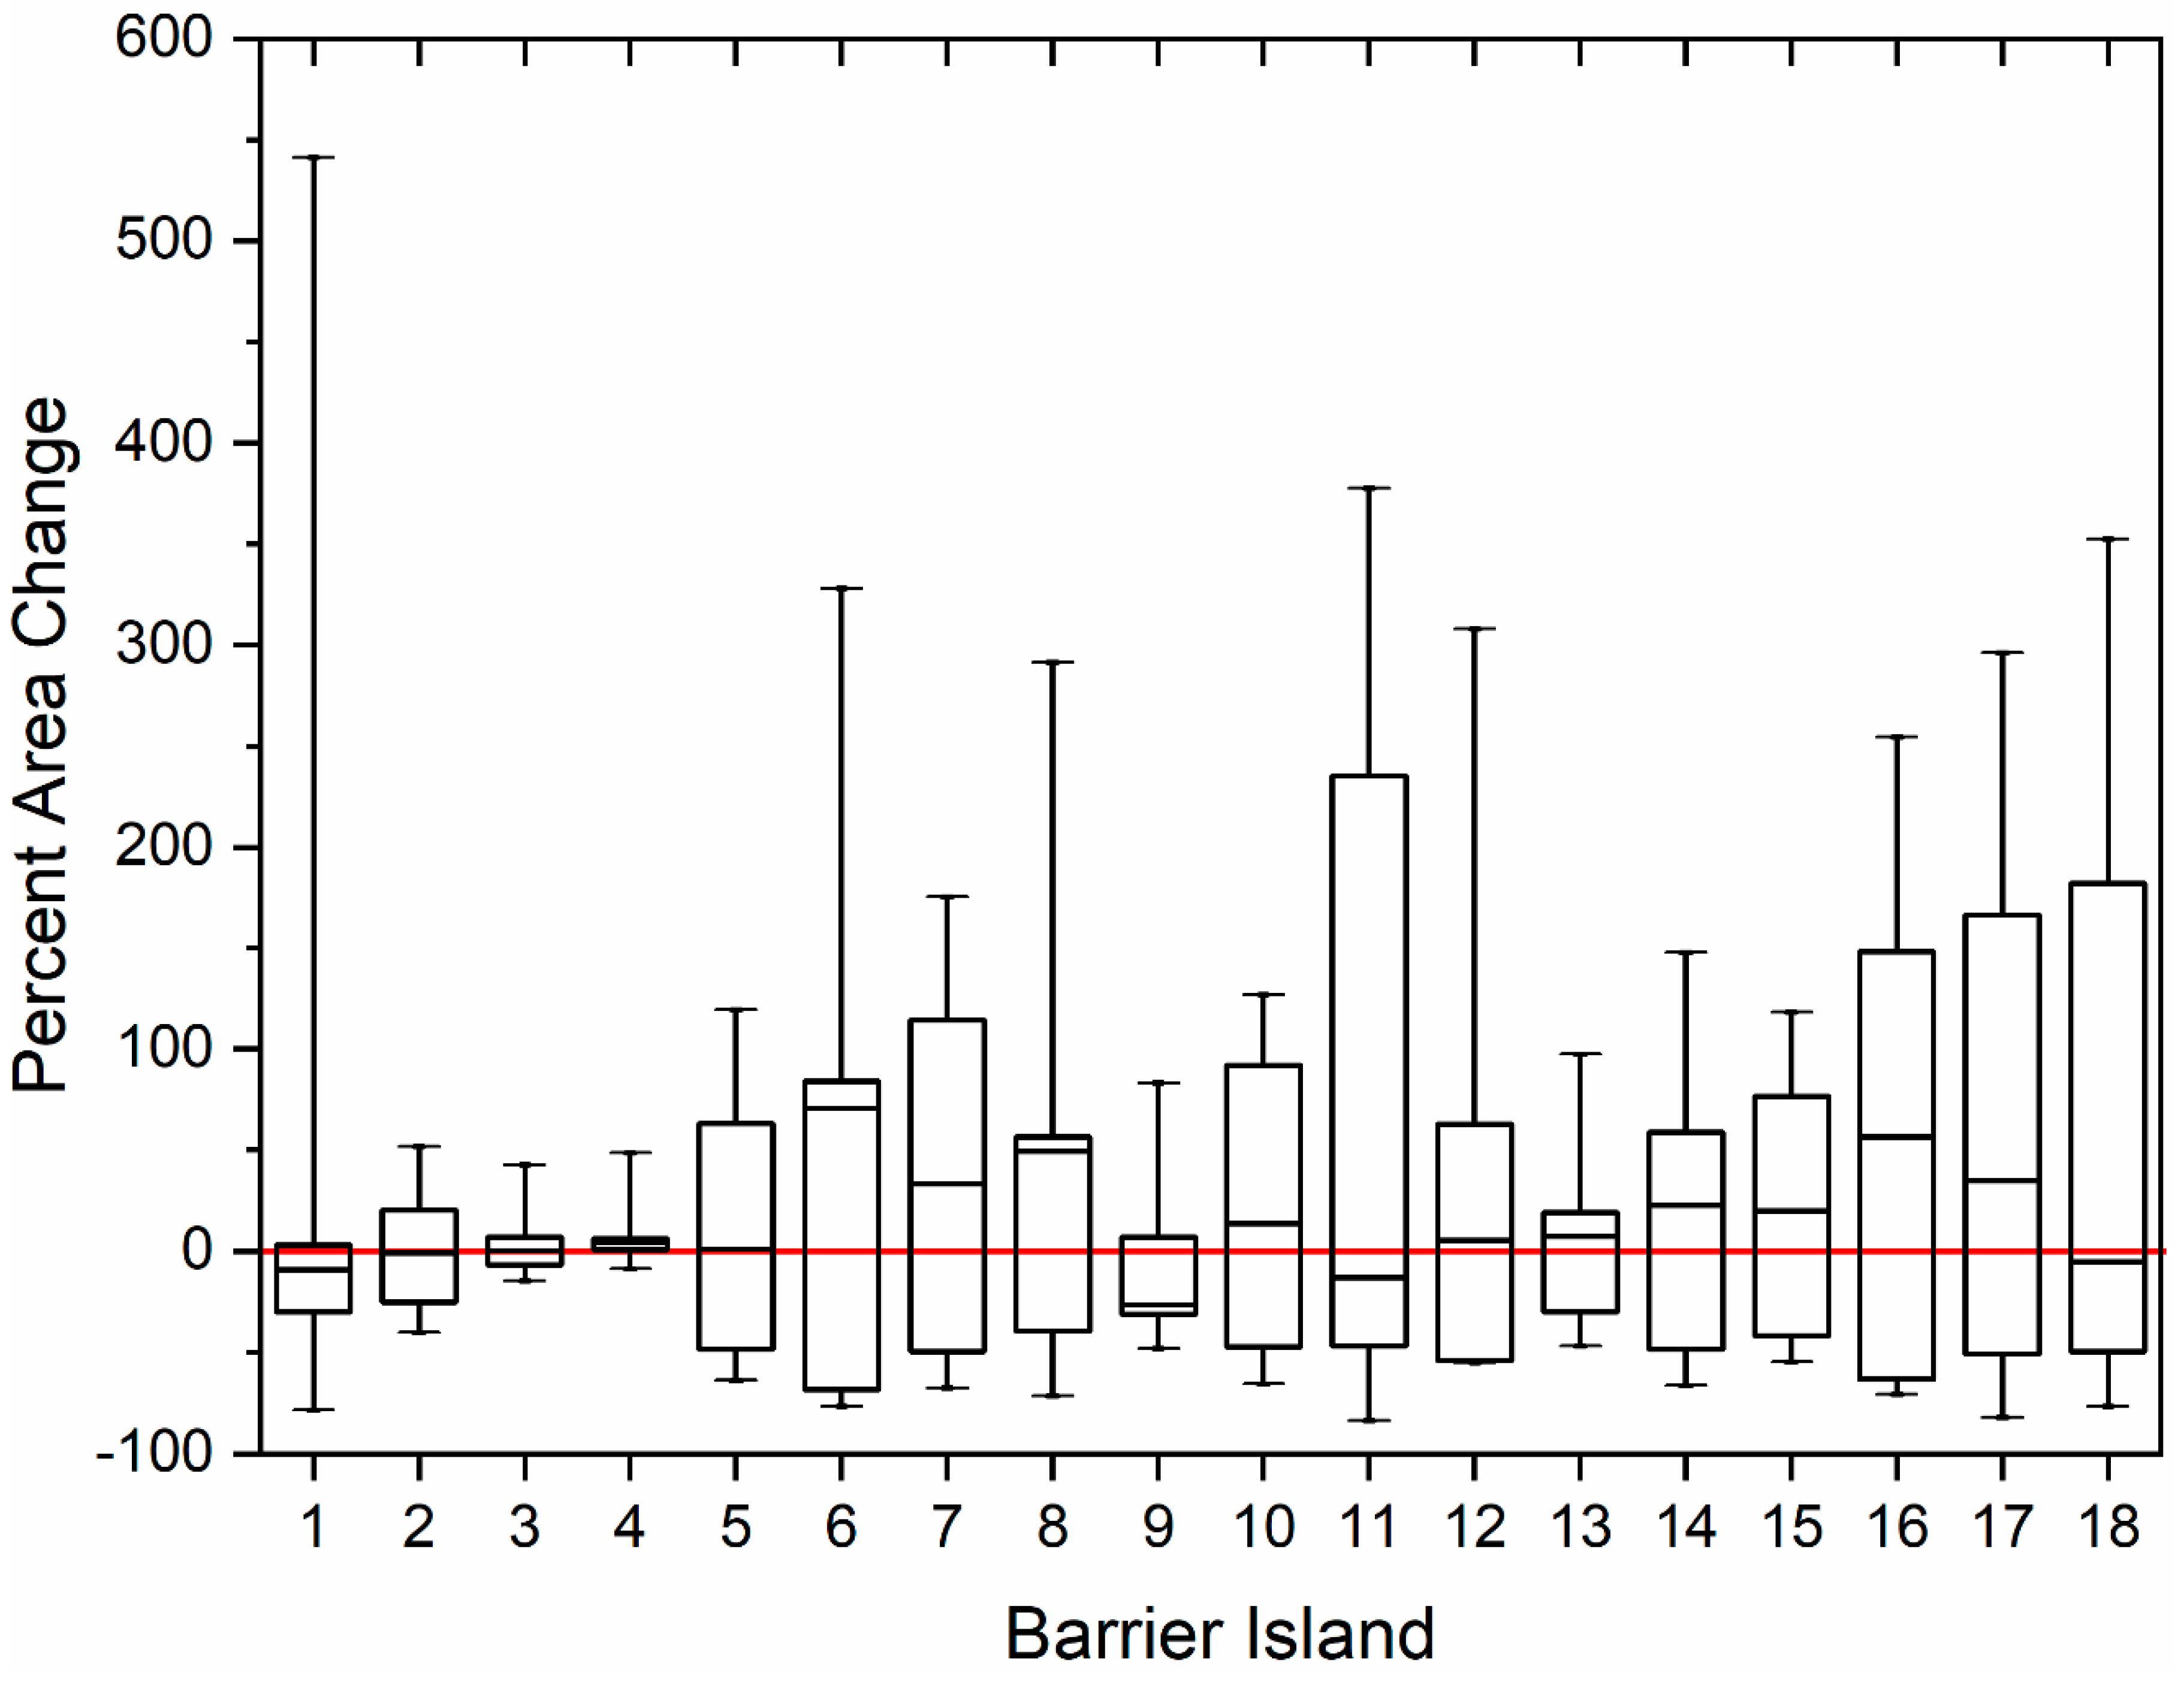
The box and whisker plot (Figure 5) show the percent change in area from 1976 to 2017 (for each BI) on the vertical axis, while the horizontal axis shows the BIs from 1 to 18. The red line shows the zero line of the data distribution. The value above the zero line shows the gain in area of a specific BI while the values below show the loss in area. It can be observed that Island 4 sustained, so we can say that the size of the box varies as there is variant change in area of the BI from 1976 to 2017. The Island 11 (Figure 5) shows the most vigorous change above the median value means the variance in data is higher in the 50th to 75th percentile of the data.
4.4. Translocation of Barrier Islands
The coastal erosion over centuries is a result of natural processes and sea level change. The rate of erosion seems to have increased at some points along the BIs of the Indus Delta. Translocation of BIs was estimated based on the movement of that specific BI relative to the reference shape. The reference shape (Figure 6, black colored polygon) for each BI was the shape delineated from the L2 MSS (from 1976) and L5 TM (from 1990) images for BIs 1 to 13 and 14 to 18, respectively. In Figure 6, the shades of blue and red colors represent less sustainable and highly sustainable pixel of the BIs. Due to the existence of BIs 1 to 4 on the back side of the Manora Beach, they were not significantly migrated or translocated (Figure 6). A significant translocation was observed for Bundal Island (BI 5) which migrated landward approximately 1.5 km (Table 2) from the ocean exposing side of the island between 1976 and 2017 with a rate of 38 m per year due to the action of ocean dynamical factors. BIs 6, 7, 8, 15, 16, and 17 have gained a significant area since 1976 and overall, they have started their development towards the land. While BIs 5, 9, 11, and 12 were found to be highly vulnerable to the oceanic conditions and have lost a significant area.
A BI wise status of its vulnerability or sustainability has been devised based on the frequency of the pixels—i.e., a BI whose pixel frequency count of 1 is high indicates that specific BI is ‘vulnerable’ (V) to oceanic factors, frequency pixel counts of 2 to 4, 5 to 8, and 9 to 10 indicate that specific BI is ‘partially vulnerable’ (PV), ‘partially sustainable’(PS), ‘and sustainable’ (S) during the study period respectively (Table 2). The movement either it is landward, oceanward or in both directions, has also been reported in Table 2 along with the fate of BI whether it is shrinking or expanding. It can be seen that only islands 1 to 4 have more than 40% of their areas which are sustainable, islands 5 to 14 have areas majority of the areas between partially vulnerable to partially sustainable while islands 15 to 18 have more than 50% of their areas which are vulnerable to oceanic factors. Among the 18 BI of the Indus Delta BI chain, majority (11 out of 18) have been found to be moving towards land, a smaller amount (6 out of 18) of BIs has been found which exhibited the mixed behavior of movement (i.e., some parts are moving towards land and some towards ocean) and only 1 out of 18 are found to be moving towards ocean (Table 2). This is an alarming situation and indicates that the sea-level is rising and encroaching the land areas of Indus Delta BI chain. Furthermore, a notable remark is that 10 out of 18 BIs have been found which are expanding while 8 out of 18 BIs are shrinking (Table 2).
5. Discussion
This study attempts to study the historical variability of the barrier islands (BIs) located along the Indus Delta Region by employing the Landsat satellite imagery from 1976 to 2017. Overall, 18 BIs were delineated, and their morphological behavior was studied. The spatial resolution is very important in detection and monitoring of the trends of costal land masses and coastline changes. Therefore, taking the advantage of the medium spatial resolution and free availability of the Landsat imagery, this study has used the Landsat TM, ETM+, and OLI imagery at 30 m spatial resolution (except for MSS sensor which has a spatial resolution of 60 m). In recent years, image acquisition systems with high spatial resolution such as spaceborne sensors and unmanned aircraft systems (UAS) or drones have emerged as an important platform for high spatial resolution data collection [28]. The evaluation of detection accuracy is always the focus of discussion. Therefore, results of this study have been verified by authors themselves during frequent field visits with NIO officials and personal communications with the residents, where applicable.
It was found that BIs 5 and 9 faced significant erosion and moved towards the land. BI 5 also known as Bundal Island (local name) is the largest island located near the most western part of the Indus Delta. This island is of high socio-economic importance for the region as it has human settlements from past three decades. Significant net loss of 61% in the area of the Bundal Island and translocation of about 1.56 km of its boundary landward with a rate of 38 m/year shows vulnerability of the socioeconomic coastal environment associated to the island. Historical morphological changes show maximum of 36% of the Bundle Island was vulnerable to oceanic controlling factors with only 6% of the island sustained throughout the study period. Tidal currents contributed to the erosive and accretion action along the Bundal Island. The tidal inlets with narrow opening at the mouth and a large area from inside the Island let the high tide water enters inside and makes island marshy and erosive. Among the other BIS, BIs 6, 7, 8, 15, 16, and 17 had gained a significant area since 1976 and overall, they had started their development towards the land. While BIs 5, 9, 11, and 12 were found to be highly vulnerable to the oceanic conditions and have lost a significant area.
Results suggested that the BIs 1 to 4, 5 to 14, and 15 to 18, are sustainable, partially sustainable and vulnerable to the oceanic factors, respectively. Majority of the Indus Delta BIs have been found to be moving towards land which alerts the local authorities and indicates that the sea-level is rising and encroaching the land areas of the BIs. Climate change and anthropogenic activities (land reclamation and modification) can trigger extreme climatic events such as flooding, tropical cyclone and SLR along the deltaic regions (e.g., Indus Delta Region) leading to an increased vulnerability of coastal landmarks. Cyclones and storms usually develop in the Arabian sea during pre-monsoon (March–May) and post-monsoon (October–November) seasons with favorable month as October and pushed by the prevailing monsoon winds along their direction. Arabian Sea is in northwest of the Indian ocean and share coast among India, Pakistan, Oman, Iran, Siri-Lanka, Maldives, and Somalia.
6. Conclusions
An archive of Landsat imagery from 1976 to 2017, has been used in this study to explore the morphological changes in the barrier island of the Indus Delta Region (IDR). Unlike global scale assessment of the barrier islands, a regional study allows in depth spatial assessment of the island. In general, it has been found that, accretion is more significant in the most parts of the islands, but erosion has also remarkably increased in most of the islands. The relative rates of change of islands morphology and migration are recorded in the IDR barrier islands chain. The natural future trends of change for the IDR barrier islands will be continued in rapid land mass change, change in perimeter, and migration as a result of accelerated sea level rise, frequent intense storms, and sand budget supply. As a result of global warming which causes the sea level rise increases beyond the expected rate will also likely to increase the land loss of the barrier islands regionally and worldwide. The total percent area of barrier islands relatively changed from 1976 to 2017 was found −16.73%. Overall, 44.4% of the total barrier island are shrunk while the rest of them are expanded due to heavy sediments budget supply. The translocation of the barrier island found about of 66.1% of the total islands moved landward, 5.6% along seaward and the rest of the islands moved along both sides. A major part of these barrier islands chain is vulnerable which is about 38.3% and 36.7% is partially vulnerable while 17.4% is partially sustainable and only 7.6% sustained in the study area against the ocean controlling factors.
Most of the barrier islands along the IDR are still undisturbed by the human intervention. The existence of the barrier islands at a place is mostly determined by the sand supply and sea level change. Protection against the sea level rise is an especially important issue which can damage barrier beaches and coastal system. Coastal protection and coastal management along the IDR should be adopted to defend against the erosive action of the ocean. In future, increase in land loss can be mitigated by placing dredged material on the backshore and shore facing side of the island so the island experiences nourishment and rebuilding.
Supplementary Materials
Author Contributions
This research was conceived by M.I.S and I.Z.; M.W., M.N., and M.I.S. designed the research experiments, analyzed the results, and contributed to writing; M.W. wrote the initial draft and final edits to the manuscript; I.Z. provided review of the draft and final manuscript.
Funding
This research received no external funding.
Acknowledgments
The authors would like to thank USGS for the distribution of Landsat MSS, TM, ETM+ and OLI data products; the QGIS team for the development and support of the QGIS software; the National Institute of Oceanography, Karachi Pakistan for providing the tide height data; Mr. Ghulam Mustafa (CUI Islamabad) for providing access to his space for running data processing; Sana Almas Khan (CUI Islamabad) for sharing her image processing expertise; and three anonymous reviewers for providing constructive comments which improved the quality of this article greatly.
Conflicts of Interest
The authors declare no conflict of interest. The funders had no role in the design of the study; in the collection, analyses, or interpretation of data; in the writing of the manuscript, or in the decision to publish the results.
Appendix A

Table A1.
List of Landsat images used in this study.
| Sr. # | Satellite | Sensor | Scene Identifier | Path/Row | Acquisition Date |
|---|---|---|---|---|---|
| 1 | Landsat-7 | ETM+ | LE07_L1TP_152043_20170219_20170317_01_T1 | 152/43b | 19 Feb 2017 |
| 2 | Landsat-8 | OLI | LC08_L1TP_152043_20160413_20170326_01_T1 | 152/43b | 13 Apr 2016 |
| 3 | Landsat-7 | ETM+ | LE07_L1TP_152043_20140126_20161119_01_T1 | 152/43b | 26 Jan 2014 |
| 4 | Landsat-5 | TM | LT05_L1TP_152043_20110211_20161010_01_T1 | 152/43b | 11 Feb 2011 |
| 5 | Landsat-7 | ETM+ | LE07_L1TP_152043_20090418_20161222_01_T1 | 152/43b | 18 Apr 2009 |
| 6 | Landsat-7 | ETM+ | LE07_L1TP_152043_20080314_20161230_01_T1 | 152/43b | 14 Mar 2008 |
| 7 | Landsat-7 | ETM+ | LE07_L1TP_152043_20070224_20170104_01_T1 | 152/43b | 24 Feb 2007 |
| 8 | Landsat-7 | ETM+ | LE07_L1TP_152043_20021211_20170127_01_T1 | 152/43b | 11 Dec 2002 |
| 9 | Landsat-5 | TM | LT05_L1TP_152043_19900217_20170131_01_T1 | 152/43b | 17 Feb 1990 |
| 10 | Landsat-2 | MSS | LM02_L1TP_163043_19761214_20180425_01_T2 | 163/43a | 14 Dec 1976 |
Note: The superscripts a and b represent the path/row for WRS-1 and WRS-2, respectively.
References
- Emanuel, K.A. The dependence of hurricane intensity on climate. Nature 1987, 326, 483–485. [Google Scholar] [CrossRef]
- Knutson, T.R.; Tuleya, R.E. Impact of CO2-Induced Warming on Simulated Hurricane Intensity and Precipitation: Sensitivity to the Choice of Climate Model and Convective Parameterization. J. Clim. 2004, 17, 3477–3495. [Google Scholar] [CrossRef]
- Emanuel, K. Increasing destructiveness of tropical cyclones over the past 30 years. Nature 2005, 436, 686–688. [Google Scholar] [CrossRef] [PubMed]
- Webster, P.J.; Holland, G.J.; Curry, J.A.; Chang, H.R. Atmospheric science: Changes in tropical cyclone number, duration, and intensity in a warming environment. Science 2005, 309, 1844–1846. [Google Scholar] [CrossRef] [PubMed]
- Mimura, N.; Nurse, L.; McLean, R.F.; Agard, J.; Briguglio, L.; Lefale, P.; Payet, R.; Sem, G. Small islands. In Climate Change 2007: Impacts, Adaptation, and Vulnerability. Contribution of Working Group II to the Fourth Assessment Report of the Intergovernmental Panel on Climate Change; Cambridge University Press: Cambridge, UK, 2007; pp. 687–716. [Google Scholar]
- Knutson, T.R.; McBride, J.L.; Chan, J.; Emanuel, K.; Holland, G.; Landsea, C.; Held, I.; Kossin, J.P.; Srivastava, A.K.; Sugi, M. Tropical cyclones and climate change. Nat. Geosci. 2010, 3, 157–163. [Google Scholar] [CrossRef] [Green Version]
- Romine, B.M.; Fletcher, C.H.; Frazer, L.N.; Genz, A.S.; Barbee, M.M.; Lim, S.-C. Historical Shoreline Change, Southeast Oahu, Hawaii; Applying Polynomial Models to Calculate Shoreline Change Rates. J. Coast. Res. 2009, 256, 1236–1253. [Google Scholar] [CrossRef]
- Shahzad, M.I.; Meraj, M.; Nazeer, M.; Zia, I.; Inam, A.; Mehmood, K.; Zafar, H. Empirical estimation of suspended solids concentration in the Indus Delta Region using Landsat-7 ETM+ imagery. J. Environ. Manag. 2018, 209, 254–261. [Google Scholar] [CrossRef]
- Chu, Z.X.; Sun, X.G.; Zhai, S.K.; Xu, K.H. Changing pattern of accretion/erosion of the modern Yellow River (Huanghe) subaerial delta, China: Based on remote sensing images. Mar. Geol. 2006, 227, 13–30. [Google Scholar] [CrossRef]
- Mills, J.P.; Buckley, S.J.; Mitchell, H.L.; Clarke, P.J.; Edwards, S.J. A geomatics data integration technique for coastal change monitoring. Earth Surf. Process. Landforms 2005, 30, 651–664. [Google Scholar] [CrossRef]
- Marfai, M.A.; Almohammad, H.; Dey, S.; Susanto, B.; King, L. Coastal dynamic and shoreline mapping: Multi-sources spatial data analysis in Semarang Indonesia. Environ. Monit. Assess. 2008, 142, 297–308. [Google Scholar] [CrossRef]
- Ryabchuk, D.; Leont’yev, I.; Sergeev, A.; Nesterova, E.; Sukhacheva, L.; Zhamoida, V. The morphology of sand spits and the genesis of longshore sand waves on the coast of the eastern Gulf of Finland. Baltica 2011, 24, 13–24. [Google Scholar]
- Mujabar, P.S.; Chandrasekar, N. Shoreline change analysis along the coast between Kanyakumari and Tuticorin of India using remote sensing and GIS. Arab. J. Geosci. 2013, 6, 647–664. [Google Scholar] [CrossRef]
- Li, L.; Huang, Z.; Qiu, Q.; Natawidjaja, D.H.; Sieh, K. Tsunami-induced coastal change: Scenario studies for Painan, West Sumatra, Indonesia. Earth Planets Sp. 2012, 64, 799–816. [Google Scholar] [CrossRef]
- Morton, R.A.; Sallenger, A.H., Jr. Morphological Impacts of Extreme Storms on Sandy Beaches and Barriers. J. Coast. Res. 2003, 19, 560–573. [Google Scholar] [CrossRef]
- Forbes, D.L.; Parkes, G.S.; Manson, G.K.; Ketch, L.A. Storms and shoreline retreat in the southern Gulf of St. Lawrence. Mar. Geol. 2004, 210, 169–204. [Google Scholar] [CrossRef]
- Hapke, C.J.; Himmelstoss, E.A.; Kratzmann, M.G.; List, J.H.; Thieler, E.R. National Assessment of Shoreline Change: Historical Shoreline Change along the New England and Mid-Atlantic Coasts; U.S. Geological Survey Open-File Report; U.S. Geological Survey: Reston, VA, USA, 2010; 57p.
- Slott, J.M.; Murray, A.B.; Ashton, A.D. Large-scale responses of complex-shaped coastlines to local shoreline stabilization and climate change. J. Geophys. Res. Atmos. 2010, 115, 1–19. [Google Scholar] [CrossRef]
- Hapke, C.J.; Plant, N.G.; Henderson, R.E.; Schwab, W.C.; Nelson, T.R. Decoupling processes and scales of shoreline morphodynamics. Mar. Geol. 2016, 381, 42–53. [Google Scholar] [CrossRef] [Green Version]
- Trujillo, A.P.; Harold, V. Thurman Essentials of Oceanography, 12th ed.; Pearson: Dallas, TX, USA, 2016; ISBN 9780134073545. [Google Scholar]
- Pinet, P.R. Invitation to Oceanography; Jones & Bartlett: Boston, MA, USA, 2009; ISBN 1449667988. [Google Scholar]
- Godfrey, P.J. Barrier beaches of the east coast. Oceanus 1976, 19, 27–40. [Google Scholar]
- Stutz, M.L.; Pilkey, O.H. Open-ocean barrier islands: Global influence of climatic, oceanographic, and depositional settings. J. Coast. Res. 2011, 27, 207–222. [Google Scholar] [CrossRef]
- McGranahan, G.; Balk, D.; Anderson, B. The rising tide: Assessing the risks of climate change and human settlements in low elevation coastal zones. Environ. Urban. 2007, 19, 17–37. [Google Scholar] [CrossRef]
- Greening, H.; Doering, P.; Corbett, C. Hurricane impacts on coastal ecosystems. Estuar. Coasts 2006, 29, 877–879. [Google Scholar] [CrossRef]
- Mallin, M.; Corbett, C. How hurricane attributes determine the extent of environmental effects: Multiple hurricanes and different coastal systems. Estuar. Coasts 2006, 29, 1046–1061. [Google Scholar] [CrossRef]
- Sallenger, A.H.; Stockdon, H.F.; Fauver, L.; Hansen, M.; Thompson, D.; Wright, C.W.; Lillycrop, J. Hurricanes 2004: An overview of their characteristics and coastal change. Estuari. Coasts 2006, 29, 880–888. [Google Scholar] [CrossRef]
- Lippitt, C.D.; Zhang, S. The impact of small unmanned airborne platforms on passive optical remote sensing: A conceptual perspective. Int. J. Remote Sens. 2018, 39, 4852–4868. [Google Scholar] [CrossRef]
- Martínez, M.L.; Intralawan, A.; Vázquez, G.; Pérez-Maqueo, O.; Sutton, P.; Landgrave, R. The coasts of our world: Ecological, economic and social importance. Ecol. Econ. 2007, 63, 254–272. [Google Scholar] [CrossRef]
- Rabbani, M.M.; Inam, A.; Tabrez, A.R.; Sayed, N.A.; Tabrez, S.M. The impact of sea level rise on Pakistan’s coastal zones—In a climate change scenario. In Proceedings of the 2nd International Maritime Conference, Karachi, Pakistan, 25–27 March 2008. [Google Scholar]
- Ali Khan, T.M.; Razzaq, D.A.; Chaudhry, Q.U.Z.; Quadir, D.A.; Kabir, A.; Sarker, M.A. Sea level variations and geomorphological changes in the coastal belt of Pakistan. Mar. Geod. 2002, 25, 159–174. [Google Scholar] [CrossRef]
- Rasul, G.; Mahmood, A.; Sadiq, A.; Khan, S.I. Vulnerability of the Indus Delta to Climate Change in Pakistan. Pak. J. Meteorol. 2012, 8, 89–107. [Google Scholar]
- Rizvi, S.H.; Ali, A.; Naeem, S.A.; Tahir, M.; Baquer, J.; Saleem, M.; Tabrez, S.M. Comparison of the physical properties of seawater offshore the Karachi coast between the northeast and southwest monsoons. In International Conference of American Institute of Biological Sciences; M. Thompson, N.M.T., Ed.; Marine Science of the Arabian Sea: Washington, DC, USA, 1988. [Google Scholar]
- Siddiqui, M.N.; Maajid, S. Monitoring of geomorphological changes for planning reclamation work in coastal area of Karachi, Pakistan. Adv. Sp. Res. 2004, 33, 1200–1205. [Google Scholar] [CrossRef]
- Giosan, L.; Constantinescu, S.; Clift, P.D.; Tabrez, A.R.; Danish, M.; Inam, A. Recent morphodynamics of the Indus delta shore and shelf. Cont. Shelf Res. 2006, 26, 1668–1684. [Google Scholar] [CrossRef]
- Syvitski, J.P.M.; Kettner, A.J.; Overeem, I.; Giosan, L.; Brakenridge, G.R.; Hannon, M.; Bilham, R. Anthropocene metamorphosis of the Indus Delta and lower floodplain. Anthropocene 2013, 3, 24–35. [Google Scholar] [CrossRef]
- Inam, A.; Clift, P.D.; Giosan, L.; Tabrez, A.R.; Tahir, M.; Rabbani, M.M.; Danish, M. The Geographic, Geological and Oceanographic Setting of the Indus River. In Large Rivers: Geomorphology and Management; John Wiley & Sons Ltd: Chichester, England, 2008; pp. 333–346. ISBN 9780470849873. [Google Scholar]
- Wells, J.T.; Coleman, J.M. Deltaic morphology and sedimentology, with special reference to the Indus River Delta. Mar. Geol. Oceanogr. Arab. Sea Coast. Pak. 1985, 424, 85–100. [Google Scholar]
- Chandio, N.H.; Anwar, M.M.; Chandio, A.A. Degradation of Indus delta, Removal mangroves forestland Its Causes: A Case study of Indus River delta. Sindh Univ. Res. J.Sci. Ser. 2011, 43, 67–72. [Google Scholar]
- Zia, I.; Zafar, H.; Shahzad, M.I.; Meraj, M.; Kazmi, J.H. Assessment of sea water inundation along Daboo creek area in Indus Delta Region, Pakistan. J. Ocean Univ. China 2017, 16, 1055–1060. [Google Scholar] [CrossRef]
- Hay, C.C.; Morrow, E.; Kopp, R.E.; Mitrovica, J.X. Probabilistic reanalysis of twentieth-century sea-level rise. Nature 2015, 517, 481–484. [Google Scholar] [CrossRef] [PubMed]
- Bindoff, N.L.; Willebrand, J.; Artale, V.; Cazenave, A.; Gregory, J.M.; Gulev, S.; Hanawa, K.; Le Quere, C.; Levitus, S.; Nojiri, Y.; et al. Observations: Oceanic climate change and sea level. Changes 2007, AR4, 385–432. [Google Scholar]
- Church, J.A.; Clark, P.U.; Cazenave, A.; Gregory, J.M.; Jevrejeva, S.; Levermann, A.; Merrifield, M.A.; Milne, G.A.; Nerem, R.; Nunn, P.D.; et al. Sea level change. In Climate Change 2013: The Physical Science Basis. Contribution of Working Group I to the Fifth Assessment Report of the Intergovernmental Panel on Climate Change; Cambridge University Press: Cambridge, UK, 2013; pp. 1137–1216. [Google Scholar]
- Madurapperuma, B.D.; Dellysse, J.E.; Iyoob, A.L.; Resources, W.; Secretariat, D.; Lanka, S. Mapping shoreline vulnerabilities using kite aerial photographs at Oluvil harbour in Ampara. In Proceedings of the 7th International Symposium, Oluvil, Sri Lanka, 7–8 December 2017; pp. 197–204. [Google Scholar]
- Kundu, S.; Mondal, A.; Khare, D.; Mishra, P.K.; Shukla, R. Shifting shoreline of Sagar Island Delta, India. J. Maps 2014, 10, 612–619. [Google Scholar] [CrossRef] [Green Version]
- Matias, A.; Carrasco, A.R.; Loureiro, C.; Almeida, S.; Ferreira, Ó. Nearshore and foreshore influence on overwash of a barrier island. J. Coast. Res. 2014, 70, 675–680. [Google Scholar] [CrossRef]
- Morton, R.A. Historical Changes in the Mississippi-Alabama Barrier-Island Chain and the Roles of Extreme Storms, Sea Level, and Human Activities. J. Coast. Res. 2008, 246, 1587–1600. [Google Scholar] [CrossRef]
- Moore, L.J.; List, J.H.; Williams, S.J.; Stolper, D. Modelling barrier island response to sea-level rise in the outer banks, North Carolina. In Proceedings of the Sixth International Symposium on Coastal Engineering and Science of Coastal Sediment Process, New Orleans, LA, USA, 13–17 May 2007; pp. 1153–1164. [Google Scholar]
- Chander, G.; Markham, B.L.; Helder, D.L. Summary of current radiometric calibration coefficients for Landsat MSS, TM, ETM+, and EO-1 ALI sensors. Remote Sens. Environ. 2009, 113, 893–903. [Google Scholar] [CrossRef] [Green Version]
- Ozturk, D.; Sesli, F.A. Shoreline change analysis of the Kizilirmak Lagoon Series. Ocean Coast. Manag. 2015, 118, 290–308. [Google Scholar] [CrossRef]
- Nazeer, M.; Nichol, J.E.; Yung, Y.K. Evaluation of atmospheric correction models and Landsat surface reflectance product in an urban coastal environment. Int. J. Remote Sens. 2014, 35, 6271–6291. [Google Scholar] [CrossRef]
- Oertel, G.F. The barrier island system. Marine Geolog. 1985, 63, 1–18. [Google Scholar] [CrossRef]
- Armenakis, C.; Leduc, F.; Cyr, I.; Savopol, F.; Cavayas, F. A comparative analysis of scanned maps and imagery for mapping applications. ISPRS J. Photogramm. Remote Sens. 2003, 57, 304–314. [Google Scholar] [CrossRef]
- Guy, B.K.K.; Jewell, S. Barrier Island Shorelines Extracted from Landsat Imagery; U.S. Geological Survey: Reston, VA, USA, 2015.
- Masek, J.G.; Vermote, E.F.; Saleous, N.E.; Wolfe, R.; Hall, F.G.; Huemmrich, K.F.; Gao, F.; Kutler, J.; Lim, T.K. A landsat surface reflectance dataset for North America, 1990-2000. IEEE Geosci. Remote Sens. Lett. 2006, 3, 68–72. [Google Scholar] [CrossRef]
- U.S. Geological Survery. Landsat 4-7 Surface reflectance (LEDAPS) product guide (version 1.0); 2018. Available online: https://landsat.usgs.gov/sites/default/files/documents/ledaps_product_guide.pdf (accessed on 19 February 2019).
- U.S. Geological Survery. Landsat 8 Surface Reflectance Code (LaSRC) product guide (version 1.0); 2018. Available online: https://landsat.usgs.gov/sites/default/files/documents/lasrc_product_guide.pdf (accessed on 19 February 2019).
- Chávez, P.S.J. Image-based atmospheric corrections - revisited and improved. Photogramm. Eng. Remote Sensing 1996, 62, 1025–1036. [Google Scholar] [CrossRef]
- Mahiny, A.; Turner, B. A comparison of four common atmospheric correction methods. Photogramm. Eng. Remote Sens. 2007, 73, 361–368. [Google Scholar] [CrossRef]
Figure 1.
(a) Location of study area (filled red rectangle) and worldwide Barrier Island (BI) chains (black dots) derived from [23] and (b) barrier islands located within Indus Delta Region (IDR).
Figure 1.
(a) Location of study area (filled red rectangle) and worldwide Barrier Island (BI) chains (black dots) derived from [23] and (b) barrier islands located within Indus Delta Region (IDR).

Figure 2.
Flowchart of the methodology for the morphological change detection in the IDR barrier islands.
Figure 2.
Flowchart of the methodology for the morphological change detection in the IDR barrier islands.

Figure 3.
Barrier islands shapes as delineated from 1976 to 2017 from Landsat images.

Figure 4.
Frequency pixel count of Barrier Island. The inset views for BI 1&2, BI 3&4, and BI 6 show the frequency of the data between 0 and 1 × 10³.
Figure 4.
Frequency pixel count of Barrier Island. The inset views for BI 1&2, BI 3&4, and BI 6 show the frequency of the data between 0 and 1 × 10³.

Figure 5.
Barrier island percent area change from 1976 to 2017.

Figure 6.
Pixel by pixel frequency. The black colored polygons show the extent of a barrier island in 1976 (for barrier islands 1 to 14) and 1990 (for barrier islands 14 to 18).
Figure 6.
Pixel by pixel frequency. The black colored polygons show the extent of a barrier island in 1976 (for barrier islands 1 to 14) and 1990 (for barrier islands 14 to 18).

Table 1.
Morphological changes in barrier islands with respect to area and perimeter from 1976 to 2017 in different temporal periods.
Table 1.
Morphological changes in barrier islands with respect to area and perimeter from 1976 to 2017 in different temporal periods.
| Area Change (%) During Period | Sum | Net Change (%) in | ||||||||||
|---|---|---|---|---|---|---|---|---|---|---|---|---|
| BI# | 1976–1990 | 1990–2002 | 2002–2007 | 2007–2008 | 2008–2009 | 2009–2011 | 2011–2014 | 2014–2016 | 2016–2017 | Area | Perimeter | |
| 1 | 3 | −11 | −79 | 541 | −30 | 1 | 47 | −35 | −9 | 429 | −22 | −17 |
| 2 | 20 | −26 | −1 | 42 | −40 | 52 | 13 | −25 | −1 | 34 | −5 | −3 |
| 3 | 33 | −7 | −3 | −15 | 43 | 0 | 7 | −11 | 1 | 48 | 40 | 4 |
| 4 | 49 | 6 | 5 | 5 | 2 | 8 | −1 | −9 | 0 | 64 | 71 | −1 |
| 5 | −49 | 63 | −64 | 29 | 119 | −48 | 1 | −52 | 82 | 82 | −61 | 6 |
| 6 | 18 | 170 | −76 | 84 | 328 | −68 | 71 | −74 | 76 | 528 | 46 | 63 |
| 7 | −5 | 149 | −50 | 114 | 175 | −67 | 54 | −50 | 33 | 354 | 134 | 142 |
| 8 | −39 | 292 | −72 | 52 | 146 | −64 | 56 | −39 | 49 | 382 | 30 | 5 |
| 9 | −27 | 7 | −31 | −2 | 54 | −48 | −27 | −45 | 83 | −37 | −69 | 8 |
| 10 | 101 | 79 | −65 | 8 | 127 | −48 | 14 | −47 | 92 | 260 | 82 | 49 |
| 11 | −46 | 243 | −84 | 13 | 378 | −75 | −13 | −47 | 235 | 604 | −37 | 57 |
| 12 | −54 | 308 | −55 | 16 | 97 | −48 | 5 | −55 | 63 | 276 | −24 | 54 |
| 13 | −12 | 37 | −39 | 19 | 97 | −47 | 7 | −30 | 10 | 42 | −25 | −9 |
| 14 | - | 55 | −66 | 53 | 148 | −48 | −8 | −49 | 62 | 147 | −22 | 44 |
| 15 | - | 113 | −55 | 40 | 118 | −39 | 4 | −45 | 36 | 172 | 40 | 39 |
| 16 | - | 183 | −71 | 40 | 255 | −62 | 73 | −64 | 113 | 467 | 106 | 87 |
| 17 | - | 195 | −82 | 76 | 296 | −47 | −6 | −55 | 138 | 514 | 98 | 63 |
| 18 | - | −15 | −45 | 4 | 275 | −56 | 27 | −64 | 243 | 370 | 28 | 59 |
| Sum | −6 | 1841 | −933 | 1120 | 2588 | −706 | 323 | −797 | 1306 | |||
Note: Net area change, and net perimeter change for barrier island 1 to 13 and barrier islands 14 to 18 are with reference to the year 1976 and 1990, respectively.
Table 2.
Net translocation, translocation rate, vulnerability/sustainability status, movement and the fate of barrier islands.
Table 2.
Net translocation, translocation rate, vulnerability/sustainability status, movement and the fate of barrier islands.
| BI# | Net Translocation | Translocation Rate | V | PV | PS | S | Movement | Fate |
|---|---|---|---|---|---|---|---|---|
| (km) | (m/year) | (%) | (%) | (%) | (%) | |||
| 1&2 | 0.06 | 1.30 | 22 | 15 | 20 | 43 |  | − |
| 3&4 | 0.05 | 1.20 | 11 | 17 | 26 | 46 | ↑ | + |
| 5 | 1.56 | 38.05 | 36 | 39 | 19 | 6 | ↑ | − |
| 6 | 0.20 | 4.88 | 41 | 39 | 20 | 0 | ↑ | + |
| 7 | 1.15 | 28.05 | 47 | 38 | 15 | 0 | ↑ | + |
| 8 | 0.51 | 12.34 | 36 | 52 | 12 | 0 | ↑ | + |
| 9 | 1.55 | 37.80 | 21 | 35 | 39 | 5 | ↑ | − |
| 10 | 0.50 | 12.20 | 29 | 42 | 20 | 9 | ↓ | + |
| 11 | 0.80 | 19.51 | 23 | 59 | 17 | 1 | | − |
| 12 | 0.50 | 12.20 | 22 | 40 | 30 | 8 | | − |
| 13 | 0.50 | 12.20 | 42 | 35 | 19 | 4 | ↑ | − |
| 14 | 0.40 | 14.81 | 40 | 39 | 21 | 0 | ↑ | − |
| 15 | 0.80 | 29.63 | 55 | 37 | 8 | 0 | ↑ | + |
| 16 | 1.10 | 40.73 | 68 | 32 | 0 | 0 | ↑ | + |
| 17 | 0.90 | 33.33 | 62 | 32 | 6 | 0 | | + |
| 18 | 1.40 | 51.85 | 57 | 35 | 7 | 1 | | + |
Notes: (1) Net translocation and translocation rate for barrier island 1 to 13 and barrier islands 14 to 18 are with reference to the periods 1976 to 2017 and 1990 to 2017, respectively. (2) V, PV, PS, and S represent vulnerable, partially vulnerability, partially sustainability and sustainable status of barrier islands, respectively and the signs ‘−’, ‘+’, ‘↑’, ‘↓’ and ‘ ![Remotesensing 11 00437 i001]() ’ represent shrinkage, expansion, landward movement, oceanward movement, and movement in both directions, respectively.
’ represent shrinkage, expansion, landward movement, oceanward movement, and movement in both directions, respectively.
’ represent shrinkage, expansion, landward movement, oceanward movement, and movement in both directions, respectively.© 2019 by the authors. Licensee MDPI, Basel, Switzerland. This article is an open access article distributed under the terms and conditions of the Creative Commons Attribution (CC BY) license (http://creativecommons.org/licenses/by/4.0/).
Share and Cite
MDPI and ACS Style
Waqas, M.; Nazeer, M.; Shahzad, M.I.; Zia, I. Spatial and Temporal Variability of Open-Ocean Barrier Islands along the Indus Delta Region. Remote Sens. 2019, 11, 437. https://0-doi-org.brum.beds.ac.uk/10.3390/rs11040437
AMA Style
Waqas M, Nazeer M, Shahzad MI, Zia I. Spatial and Temporal Variability of Open-Ocean Barrier Islands along the Indus Delta Region. Remote Sensing. 2019; 11(4):437. https://0-doi-org.brum.beds.ac.uk/10.3390/rs11040437
Chicago/Turabian StyleWaqas, Muhammad, Majid Nazeer, Muhammad Imran Shahzad, and Ibrahim Zia. 2019. "Spatial and Temporal Variability of Open-Ocean Barrier Islands along the Indus Delta Region" Remote Sensing 11, no. 4: 437. https://0-doi-org.brum.beds.ac.uk/10.3390/rs11040437
Note that from the first issue of 2016, this journal uses article numbers instead of page numbers. See further details here.