Multi-Feature Based Ocean Oil Spill Detection for Polarimetric SAR Data Using Random Forest and the Self-Similarity Parameter


Abstract
:
1. Introduction
1.1. Background
1.2. Related Works
1.3. The Proposed Approach
2. Methodology
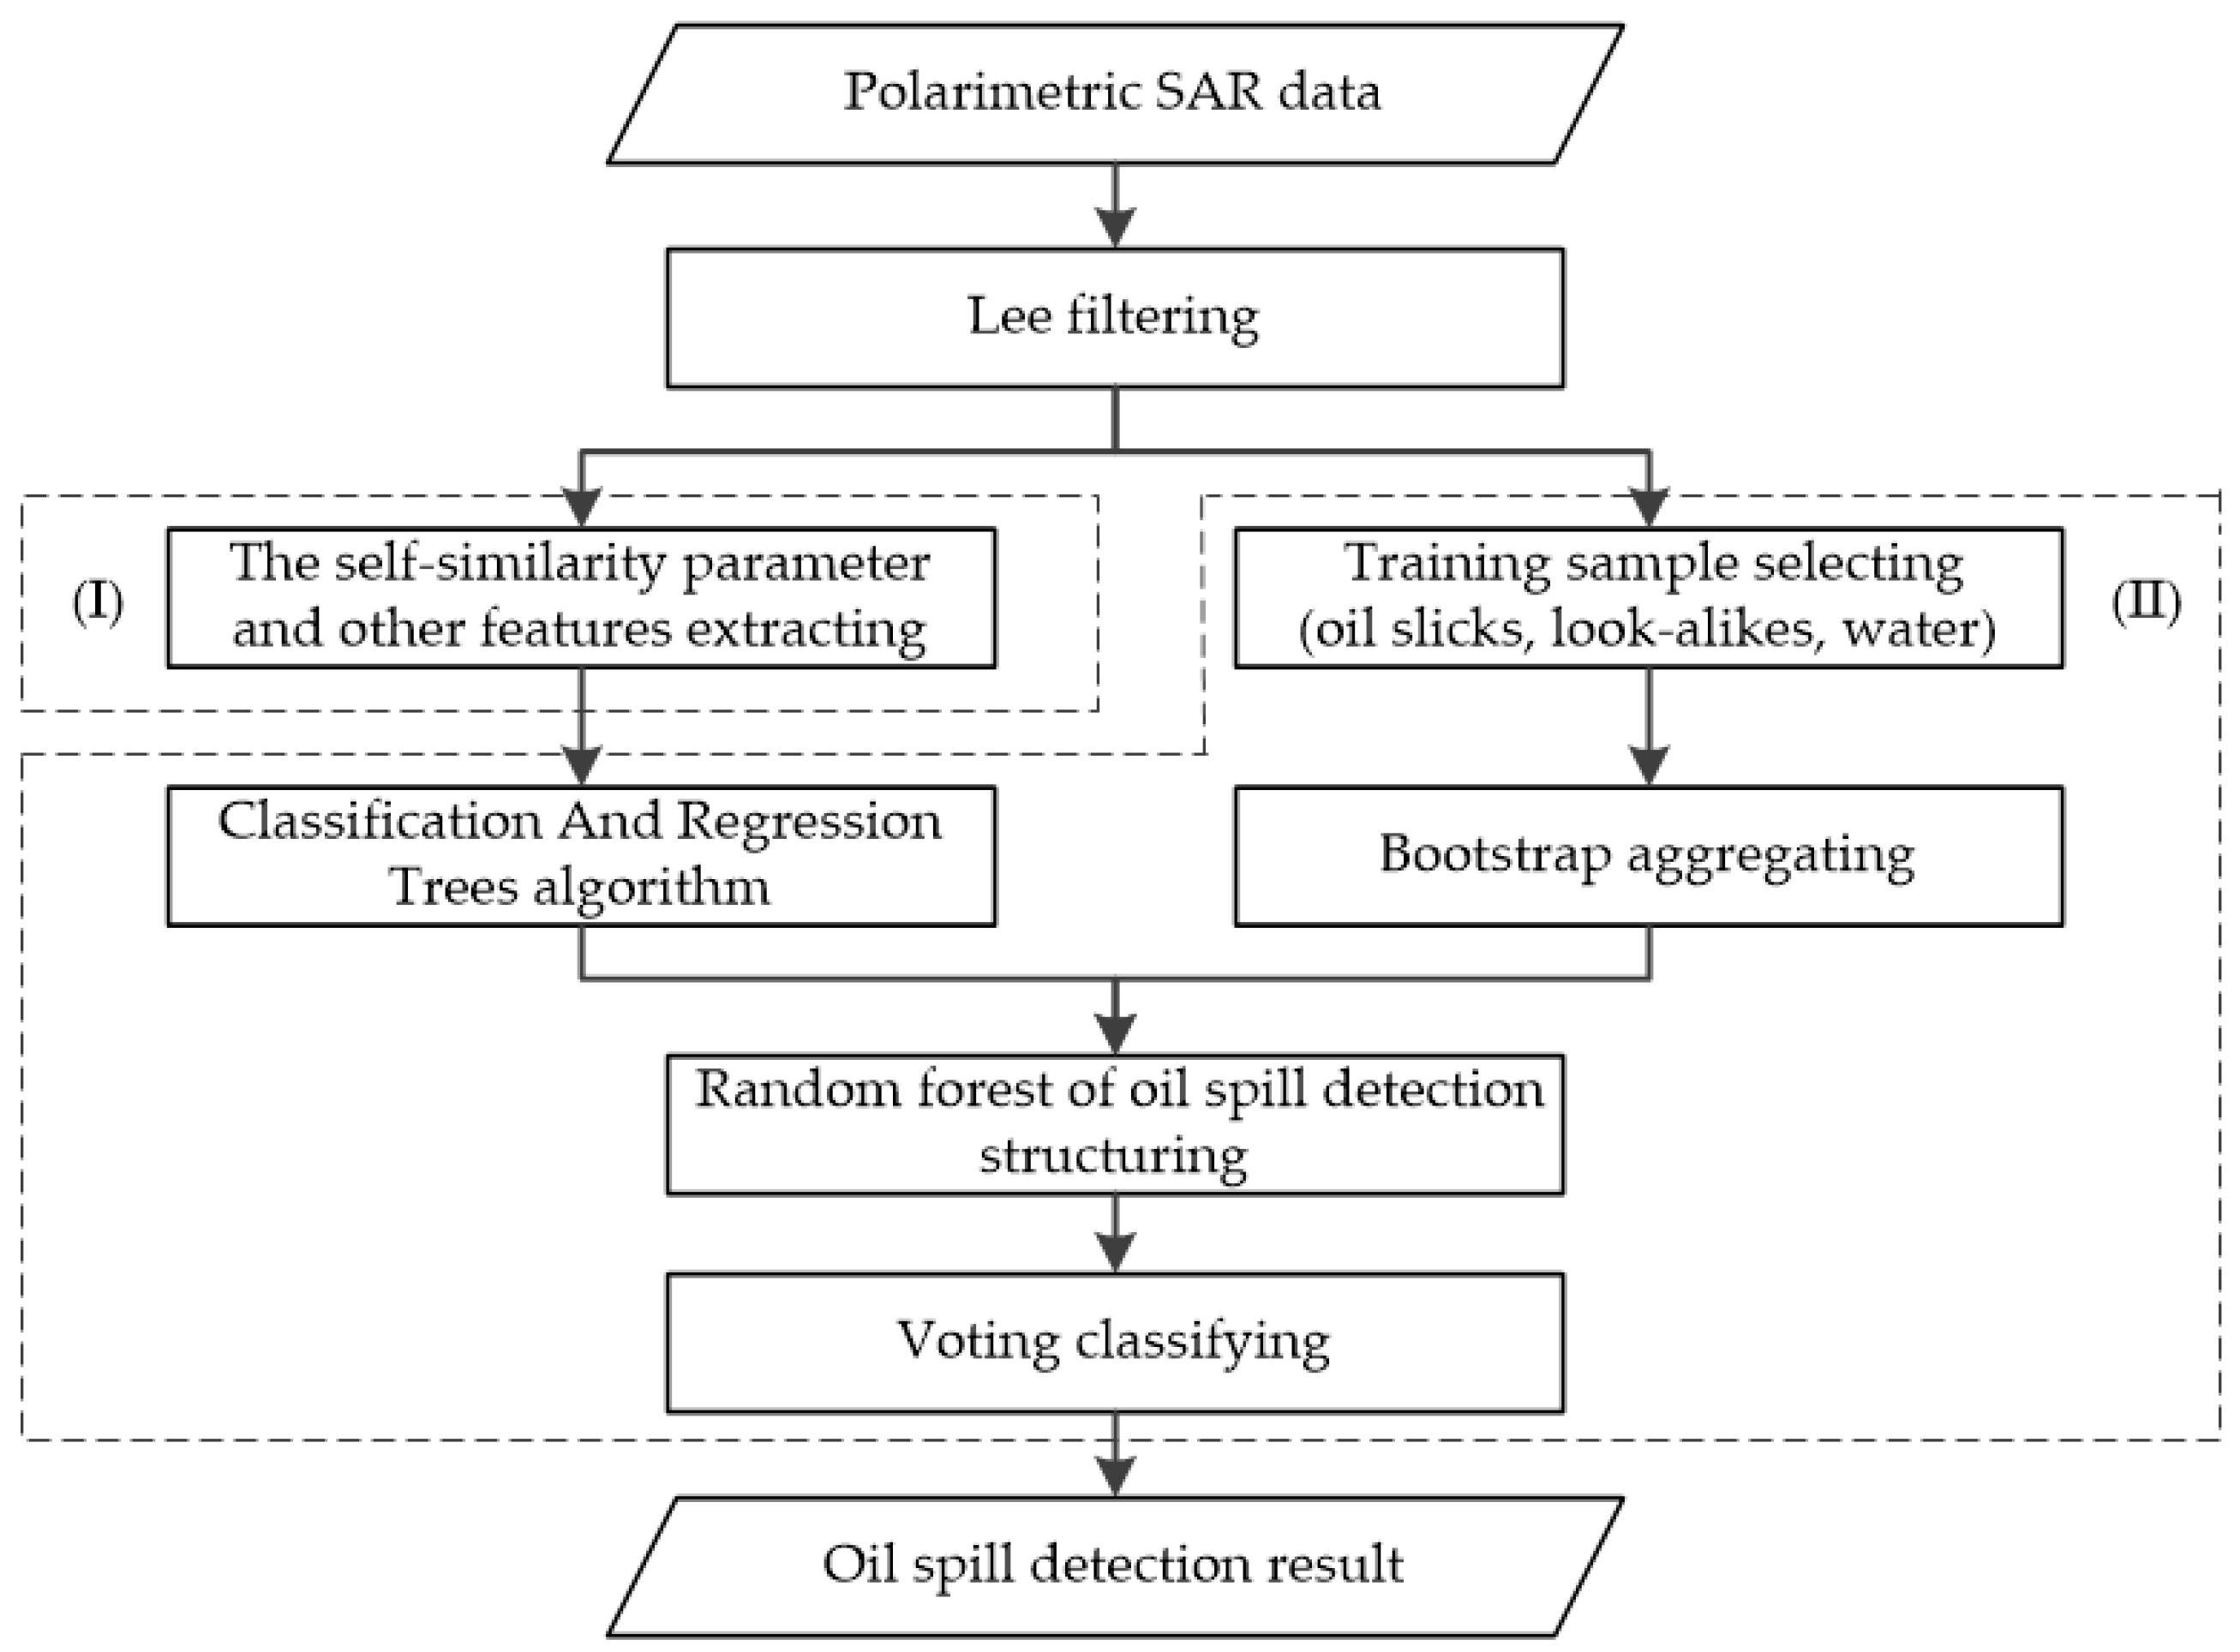
2.1. Method Frame for Oil Spill Detection
2.2. Using Self-Similarity Parameters to Describe Oil Slicks
2.3. Oil Spill Detection Based on RF Classification
3. Experiment and Results
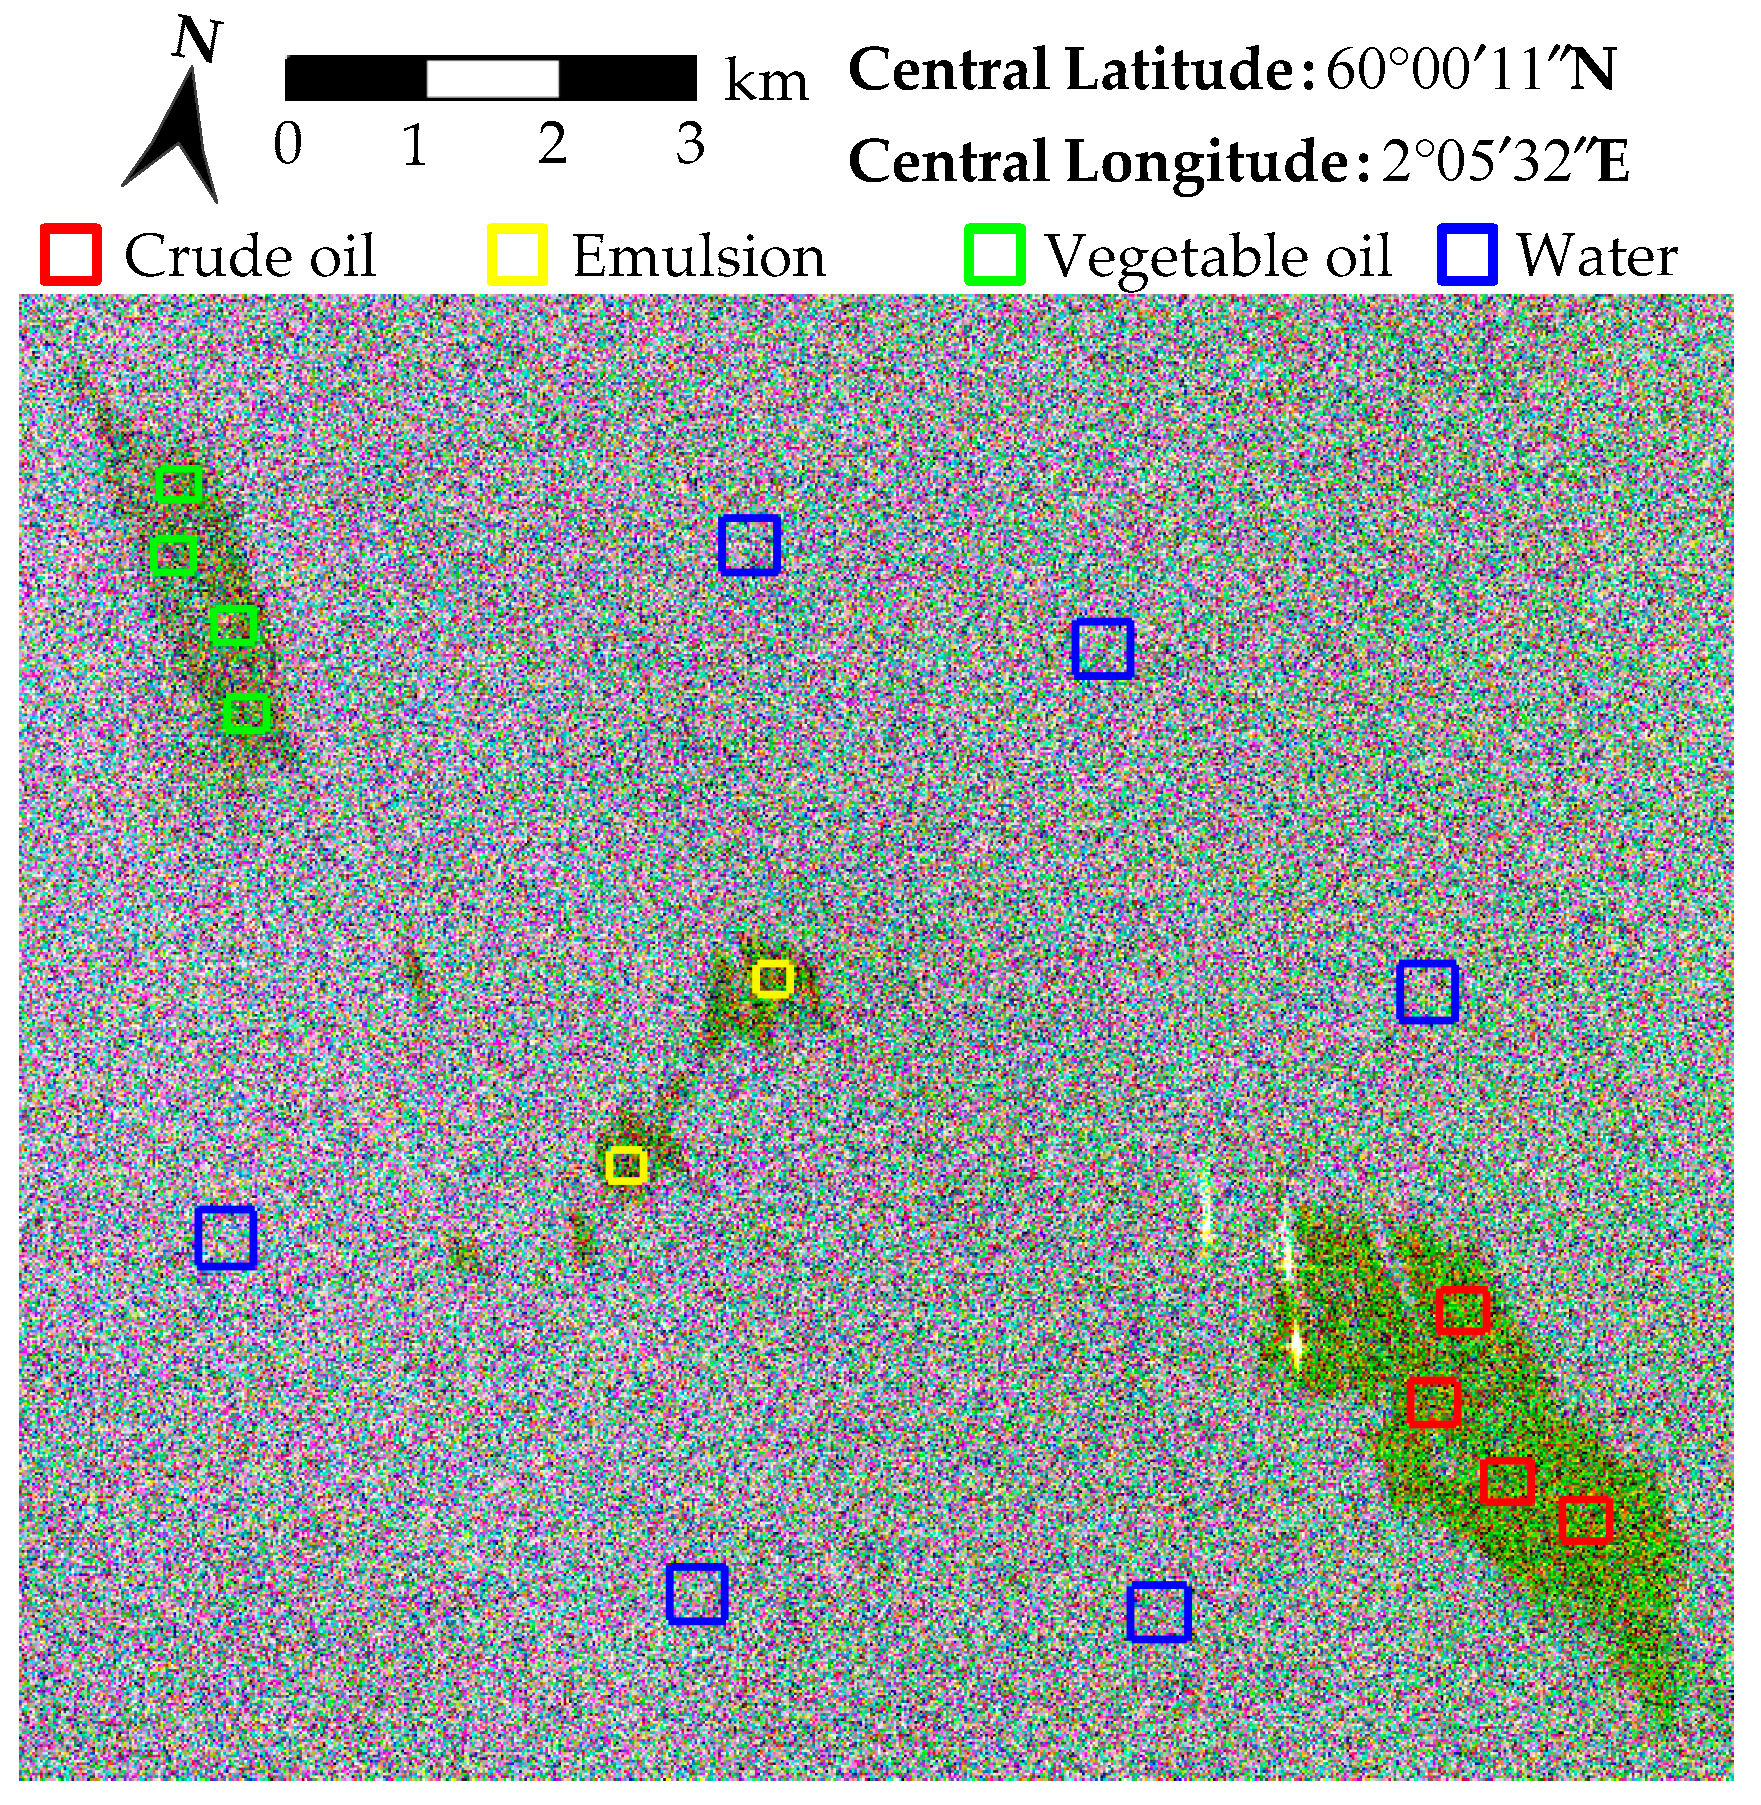
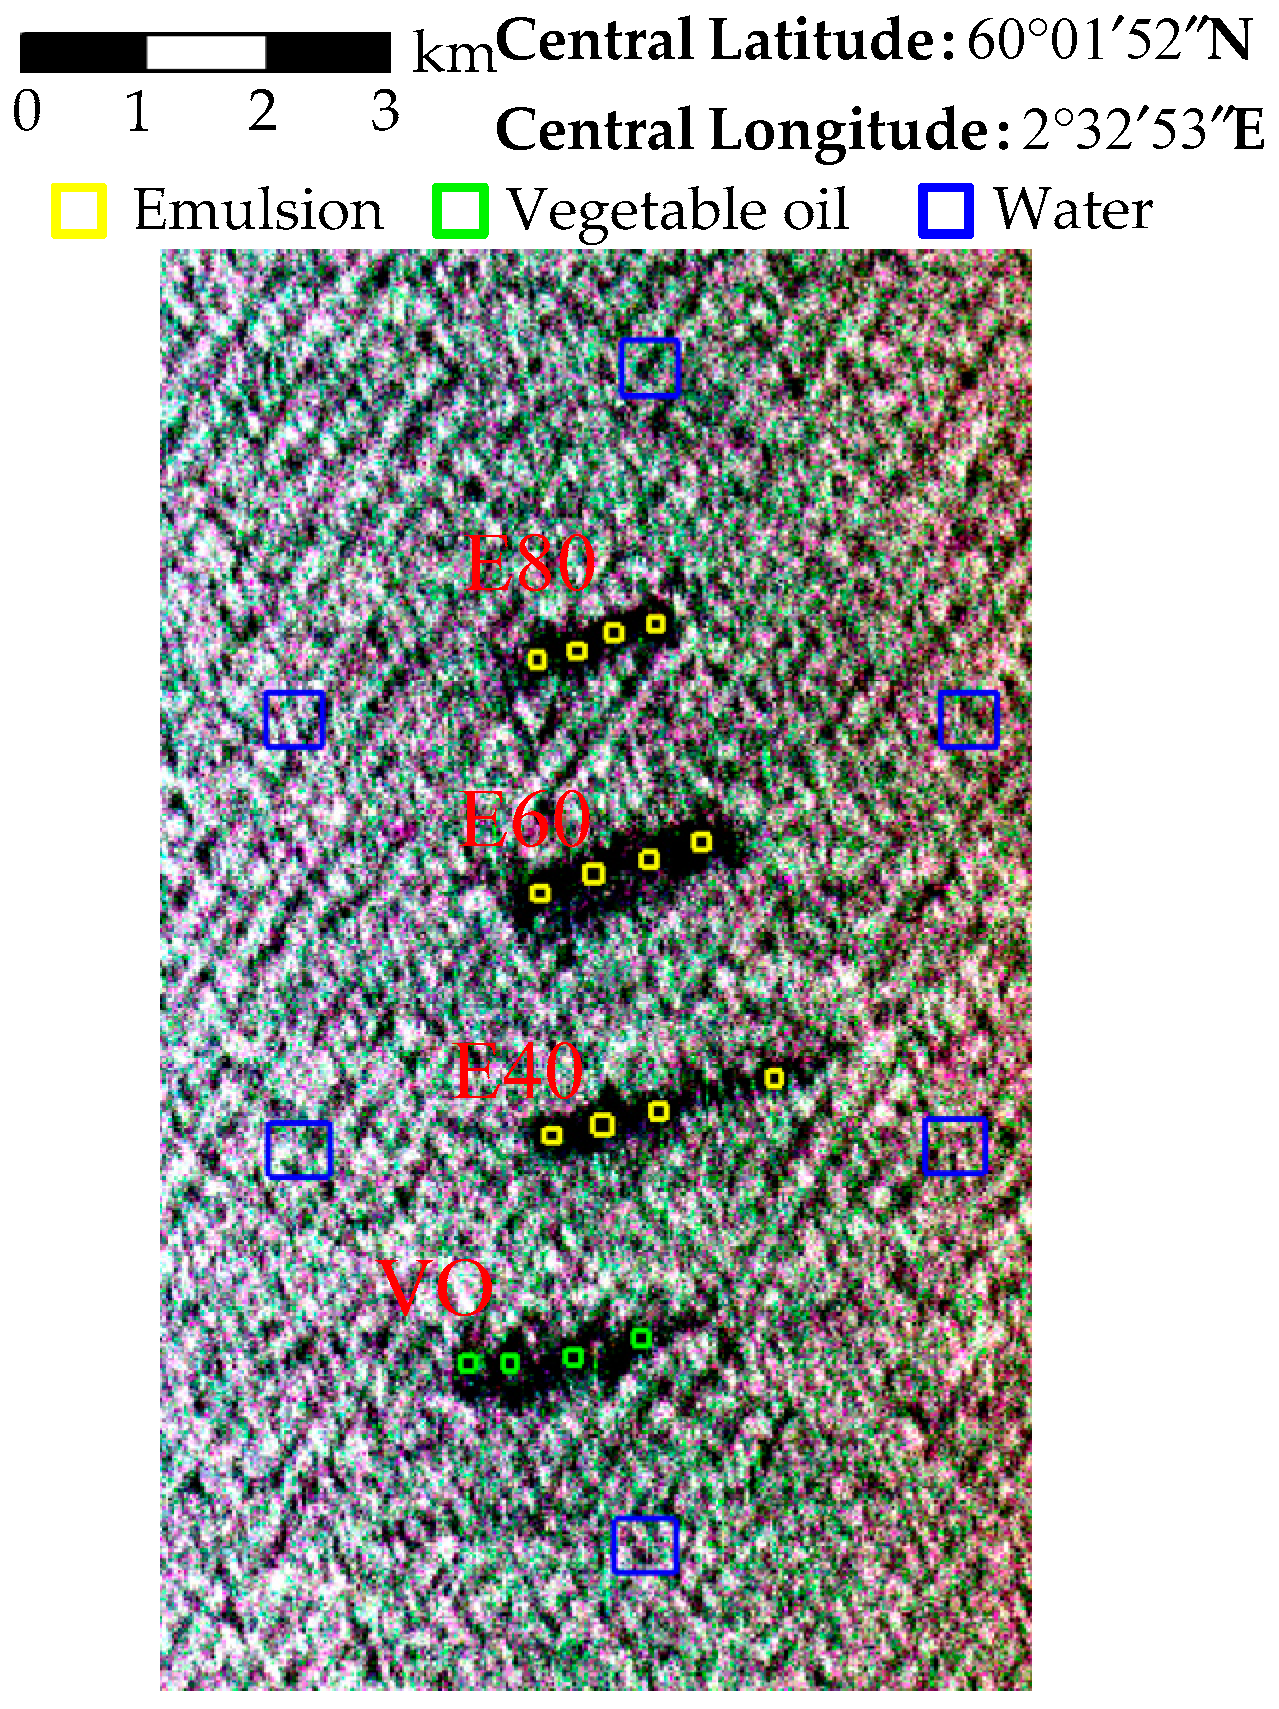
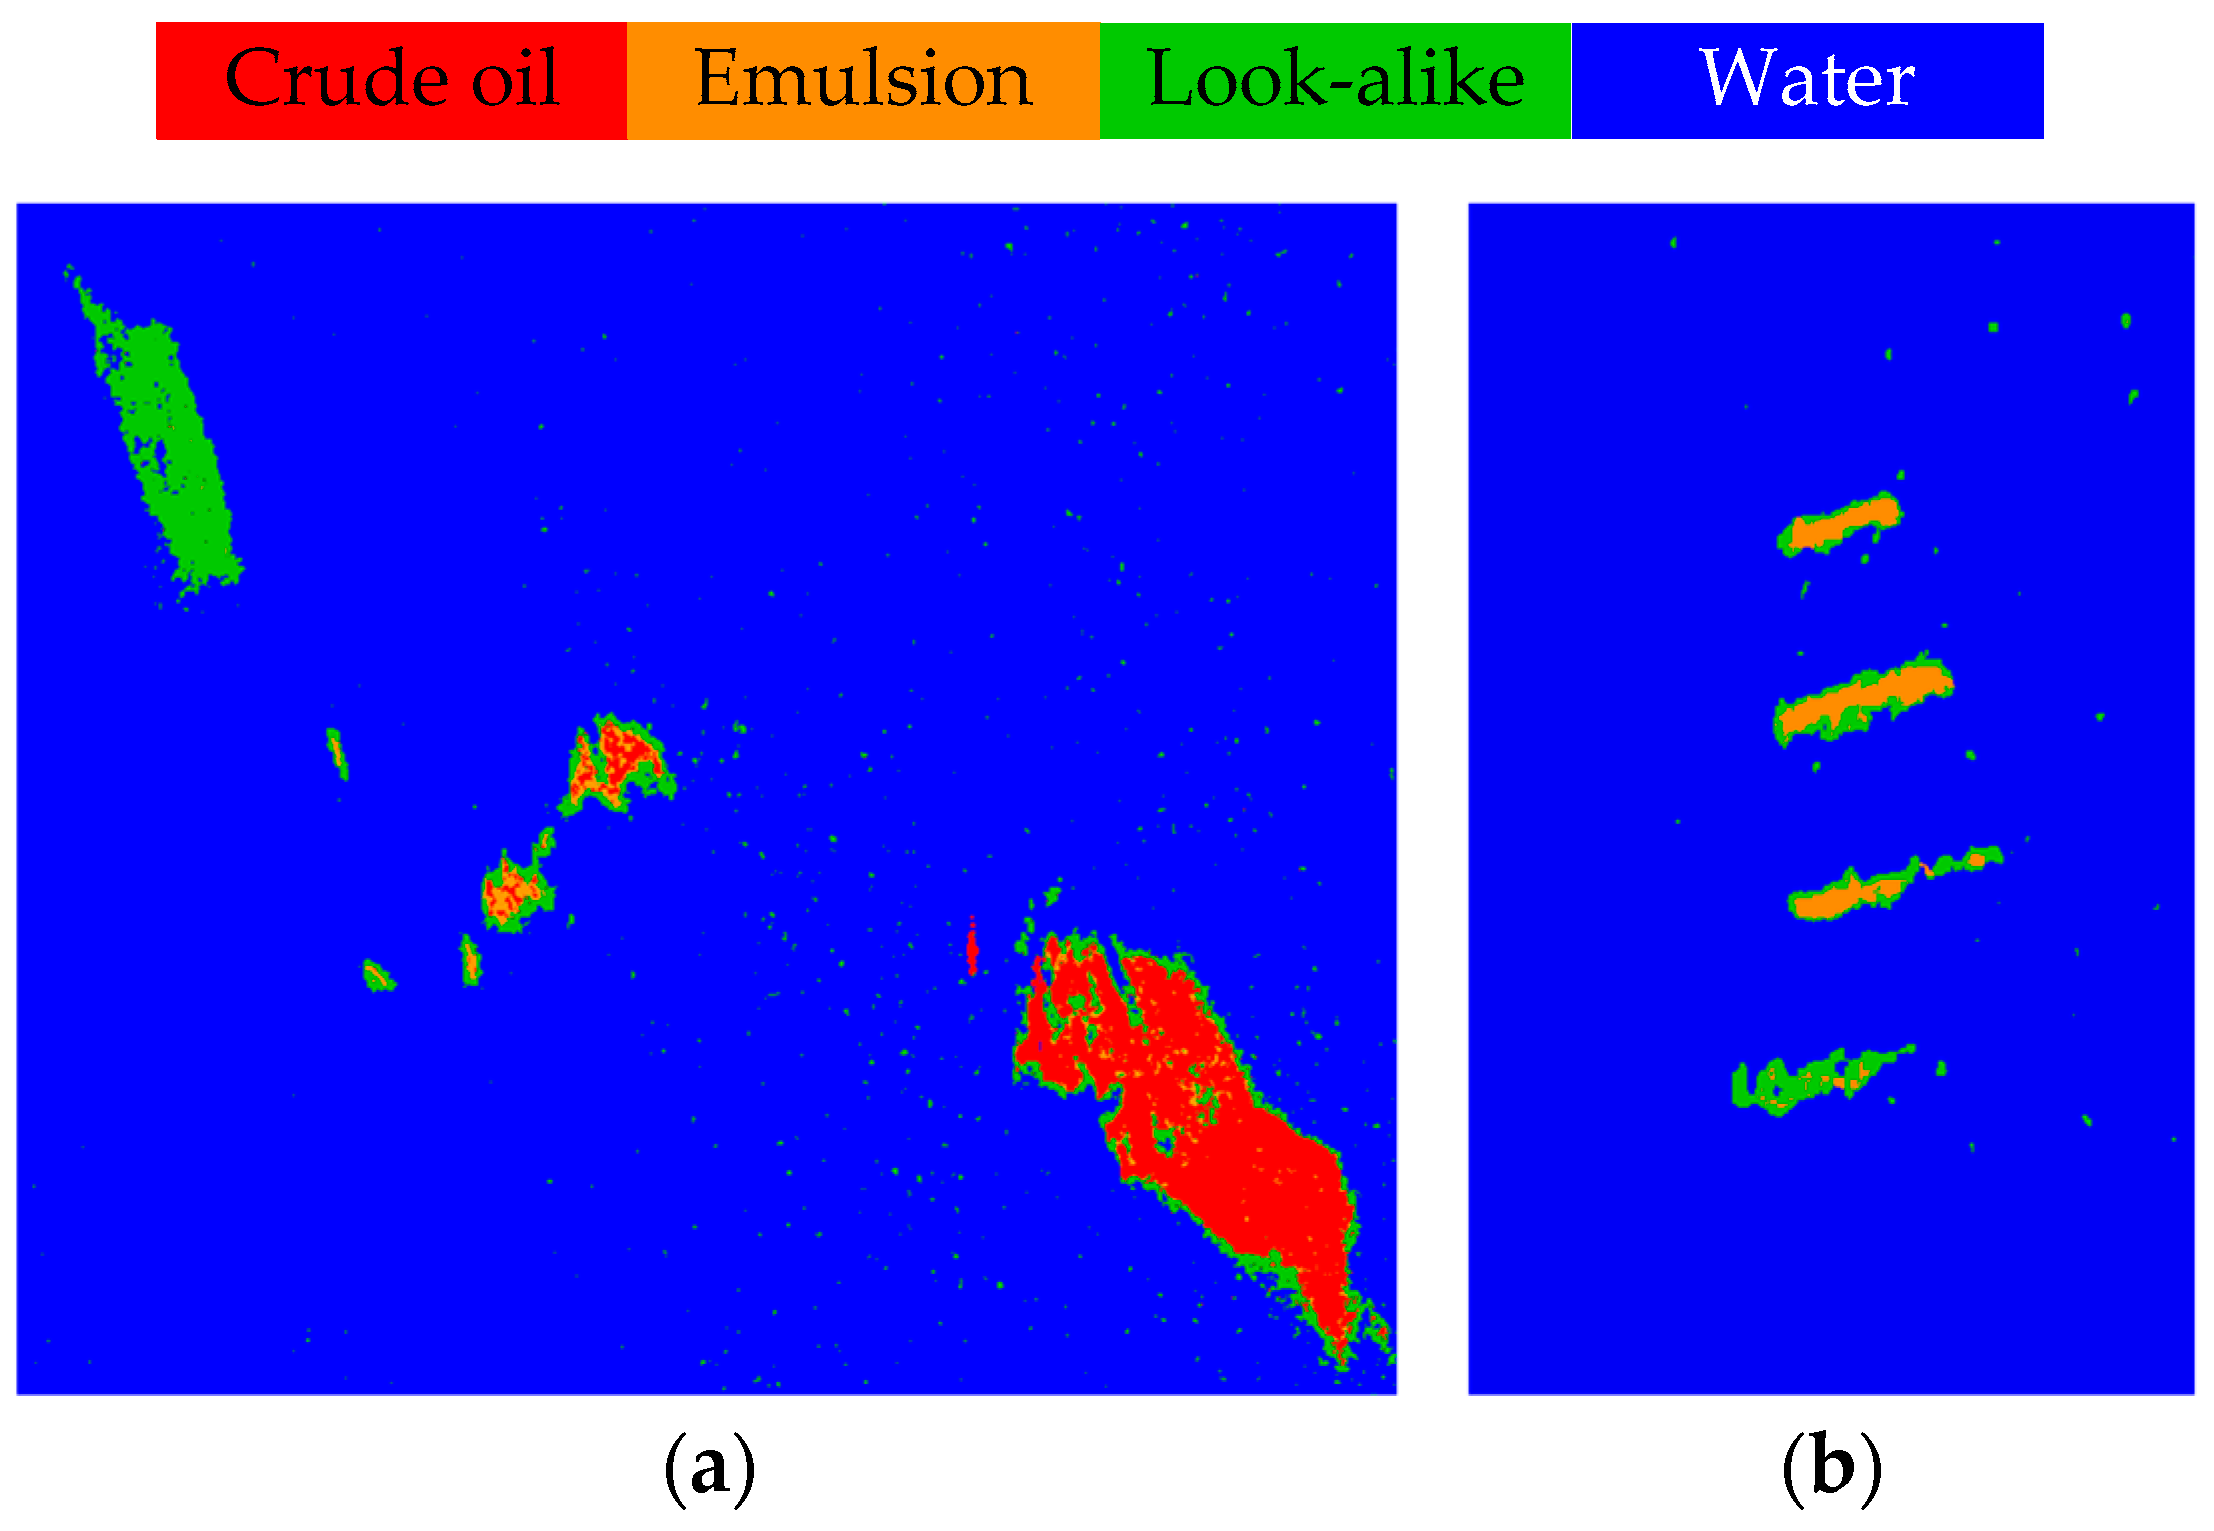
3.1. Experimental Data
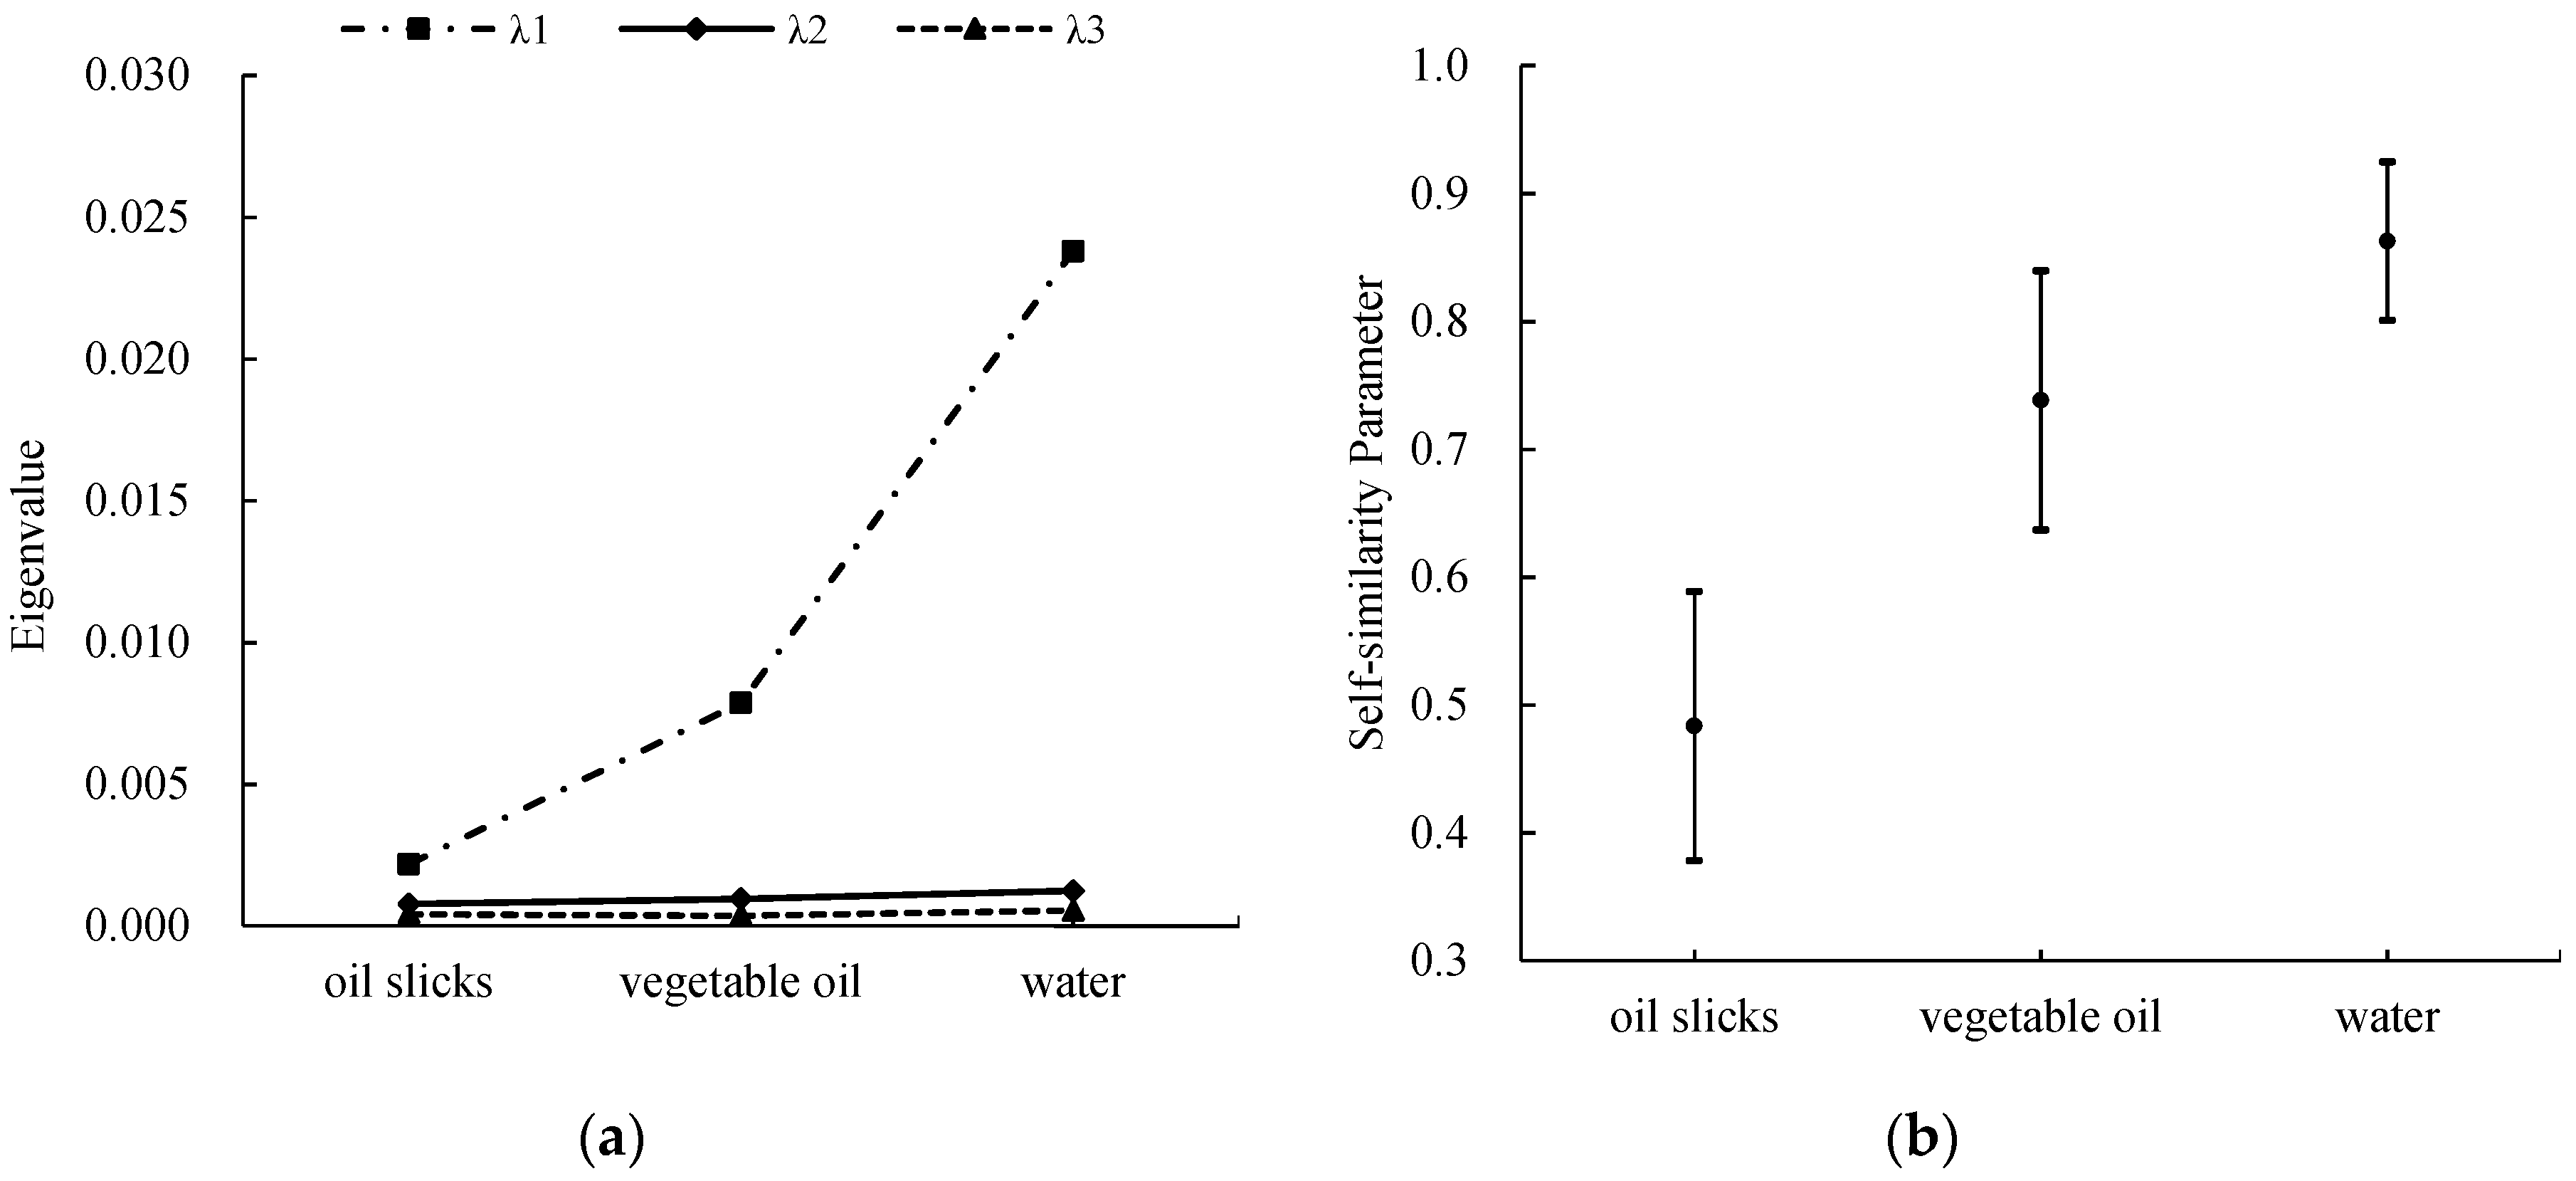
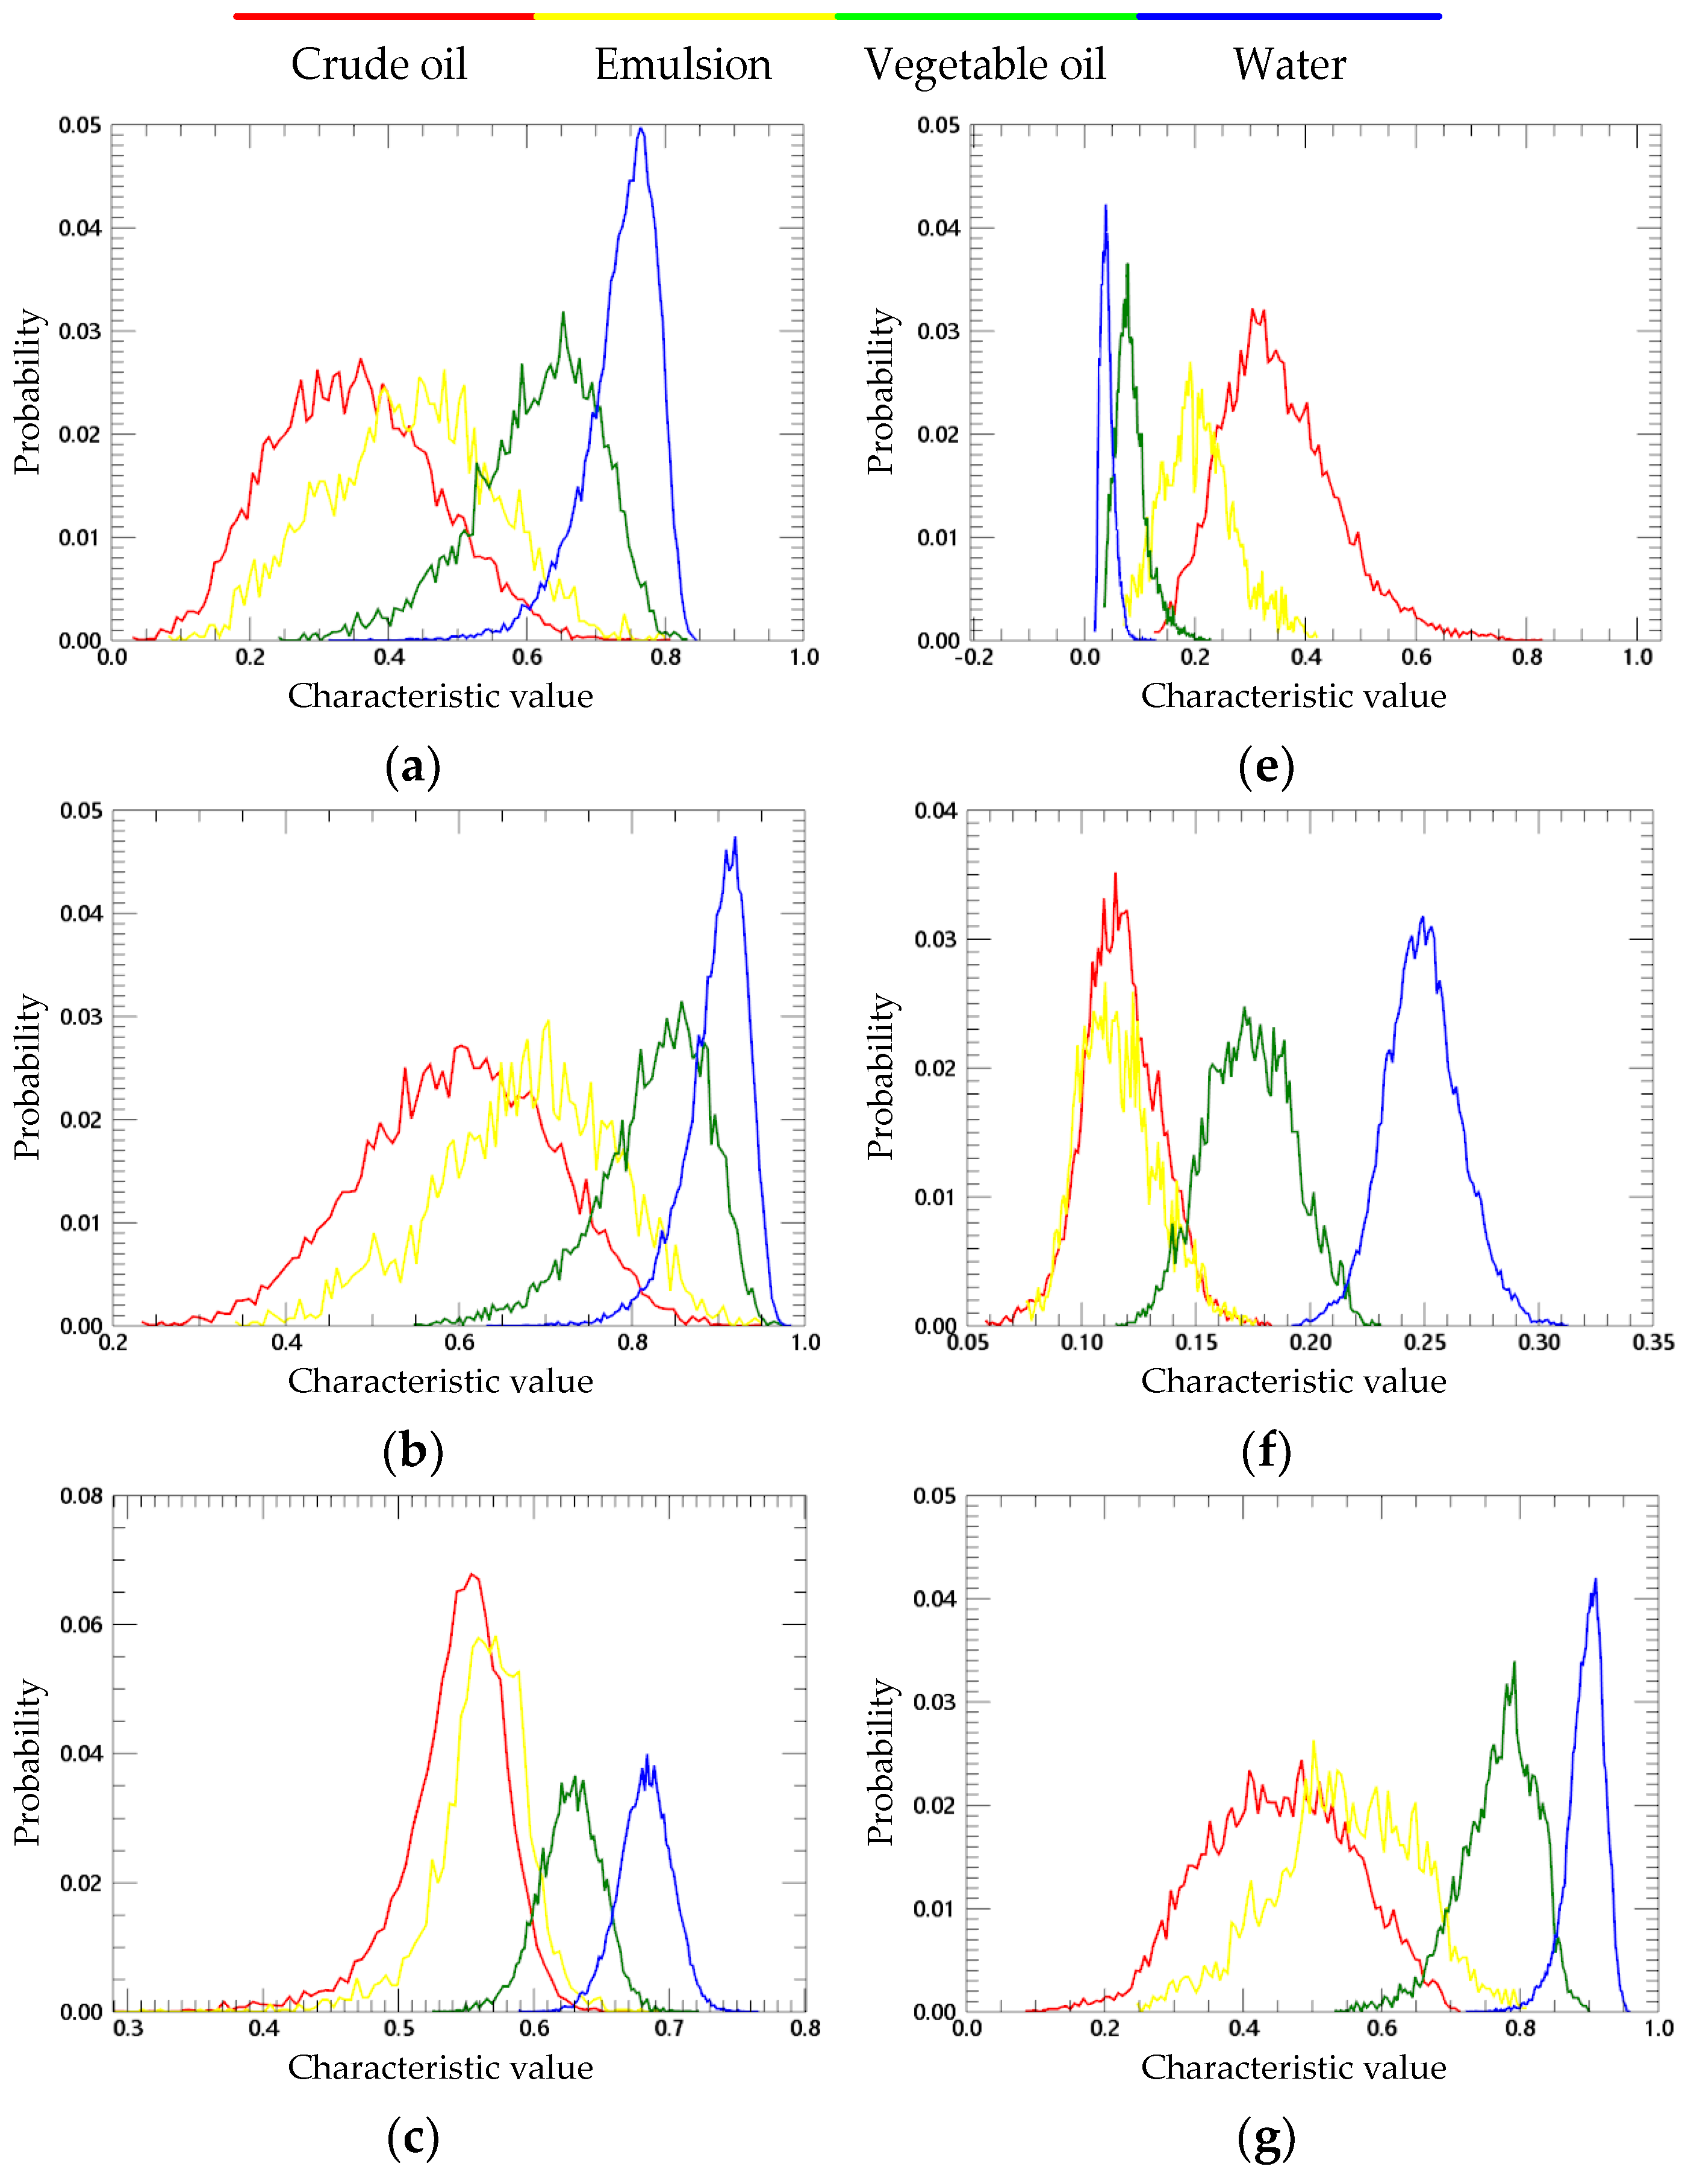
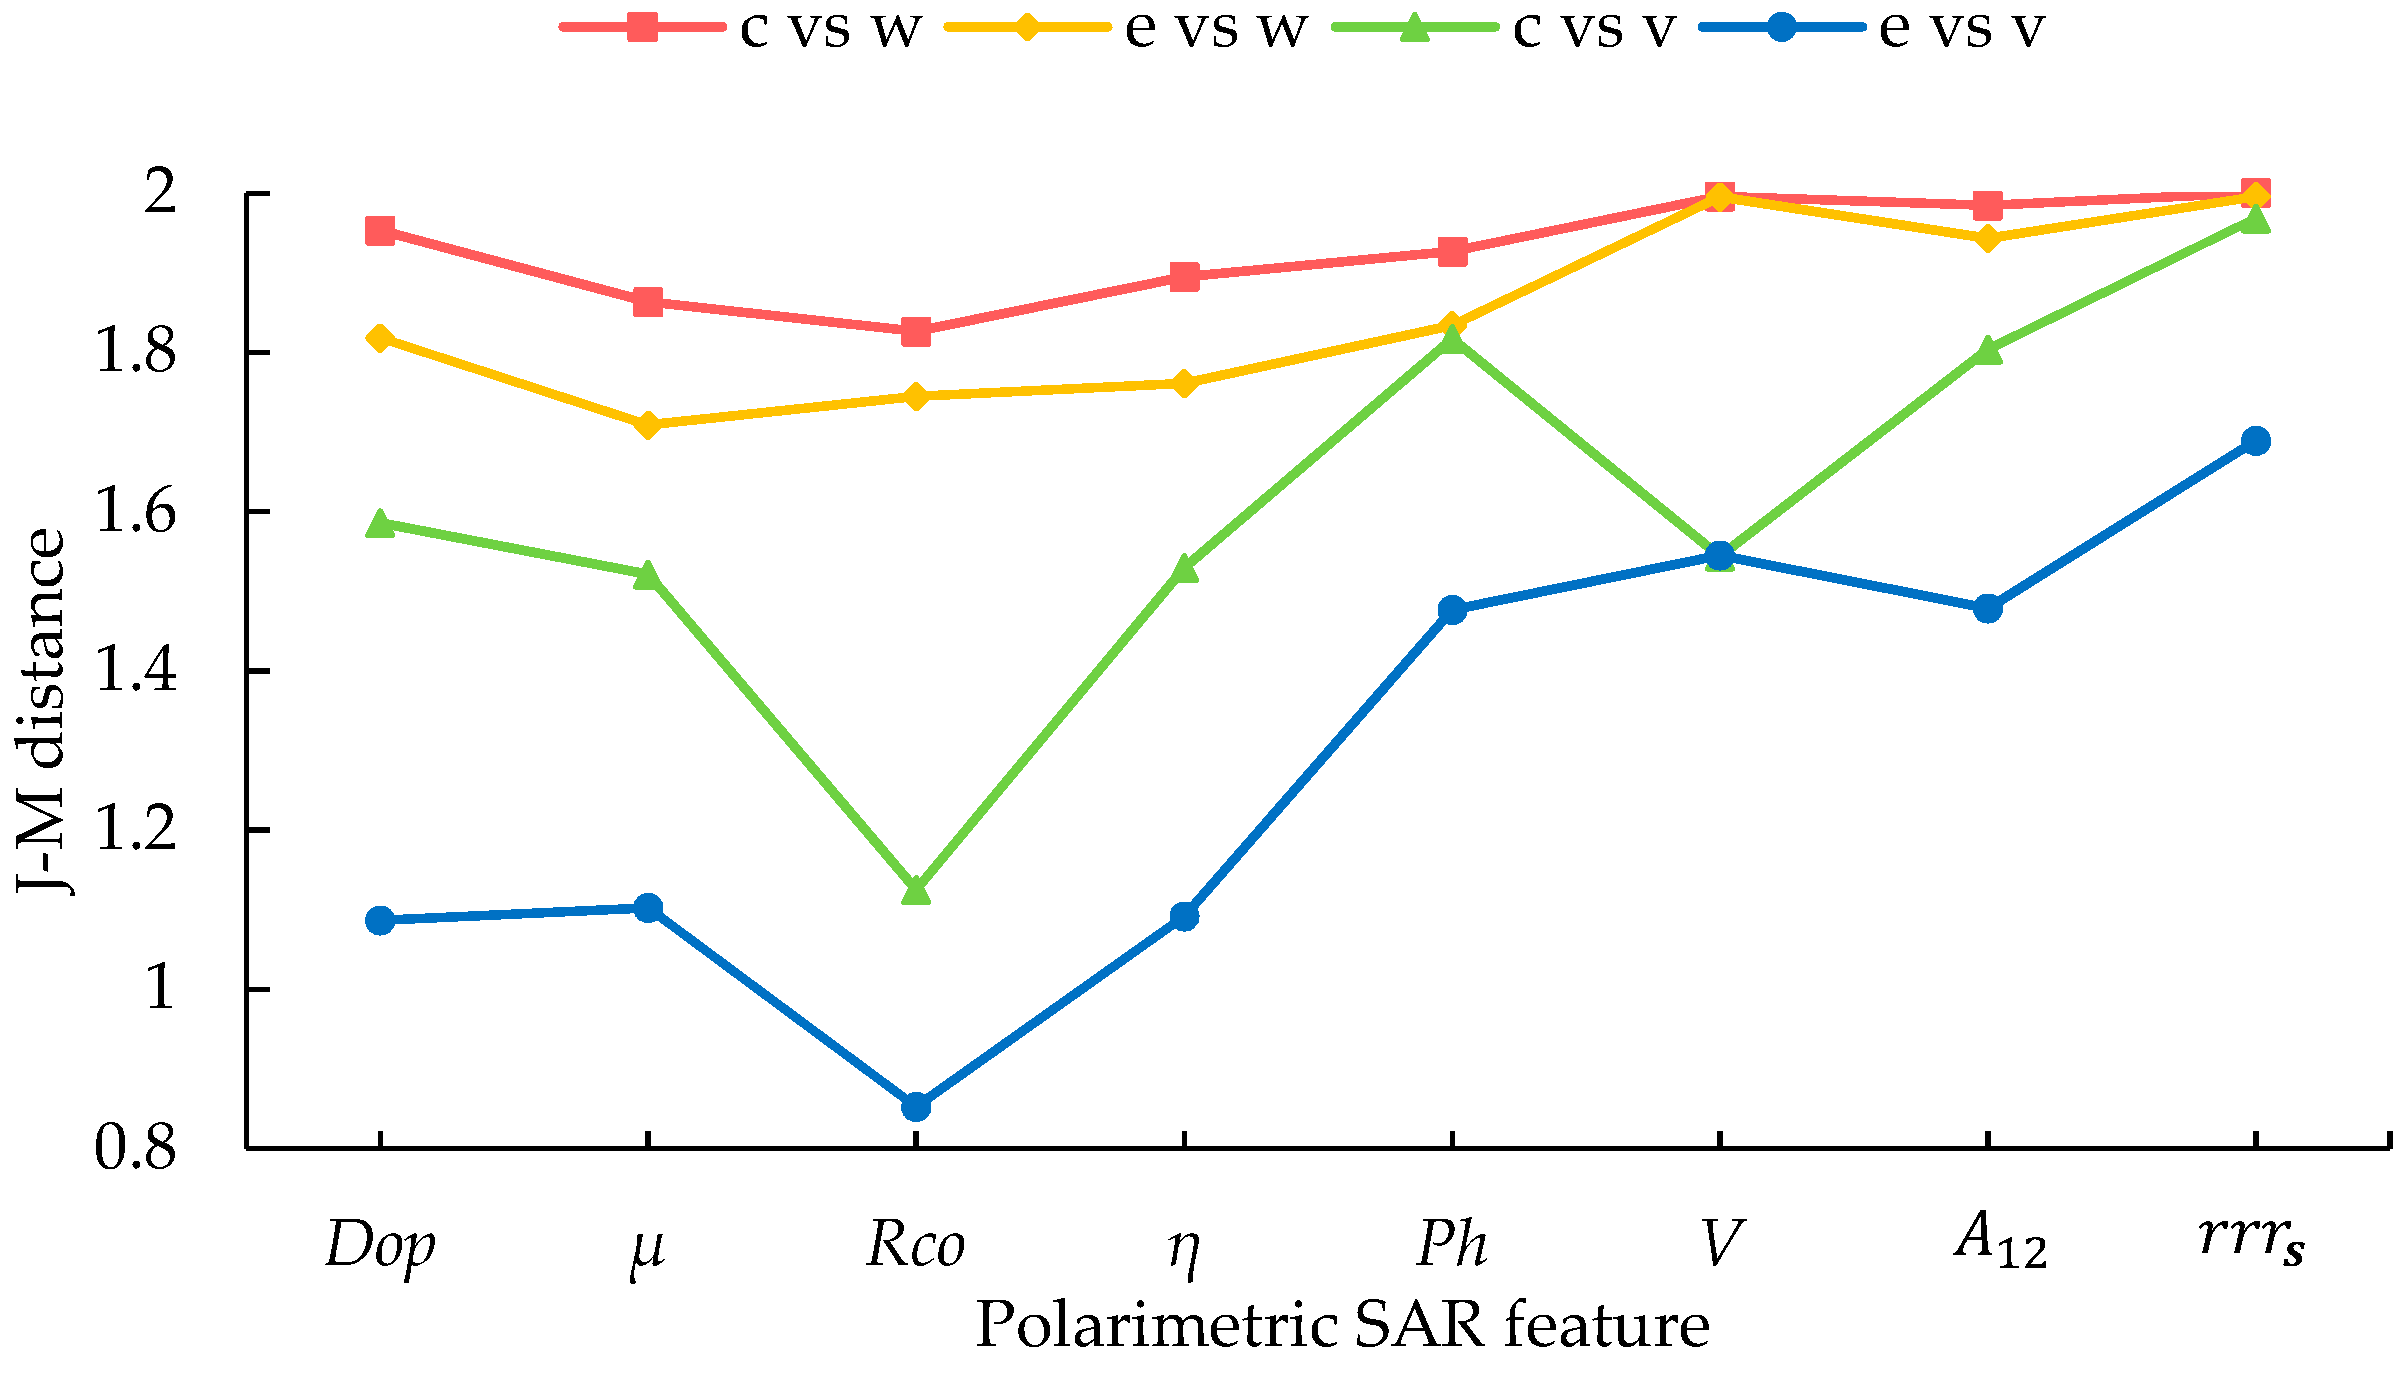
3.2. Oil Spill Detection Ability Analysis of the Self-Similarity Parameter
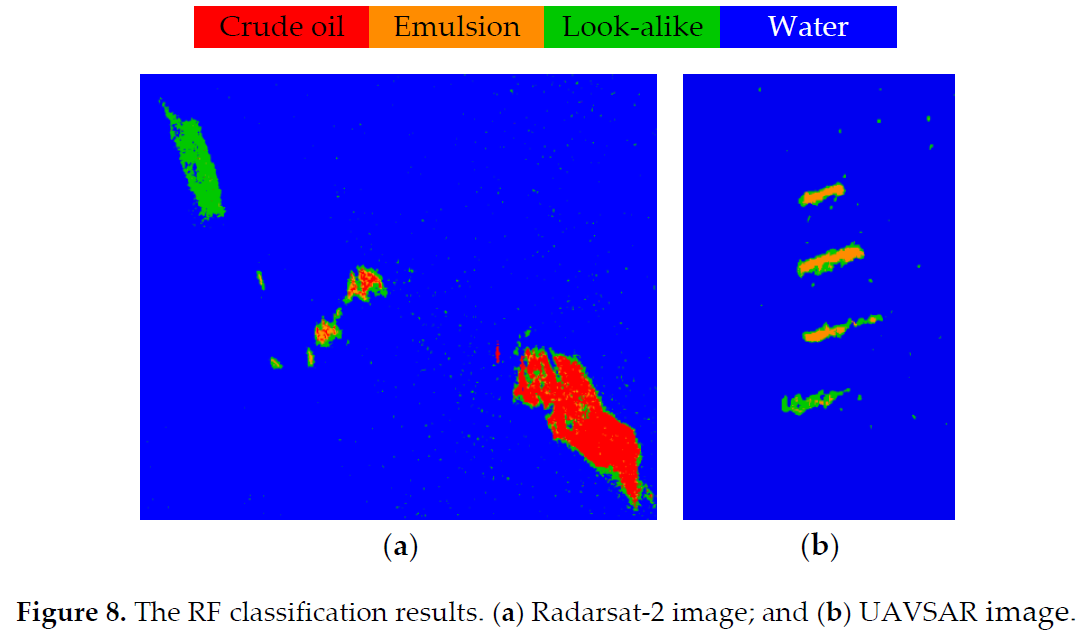
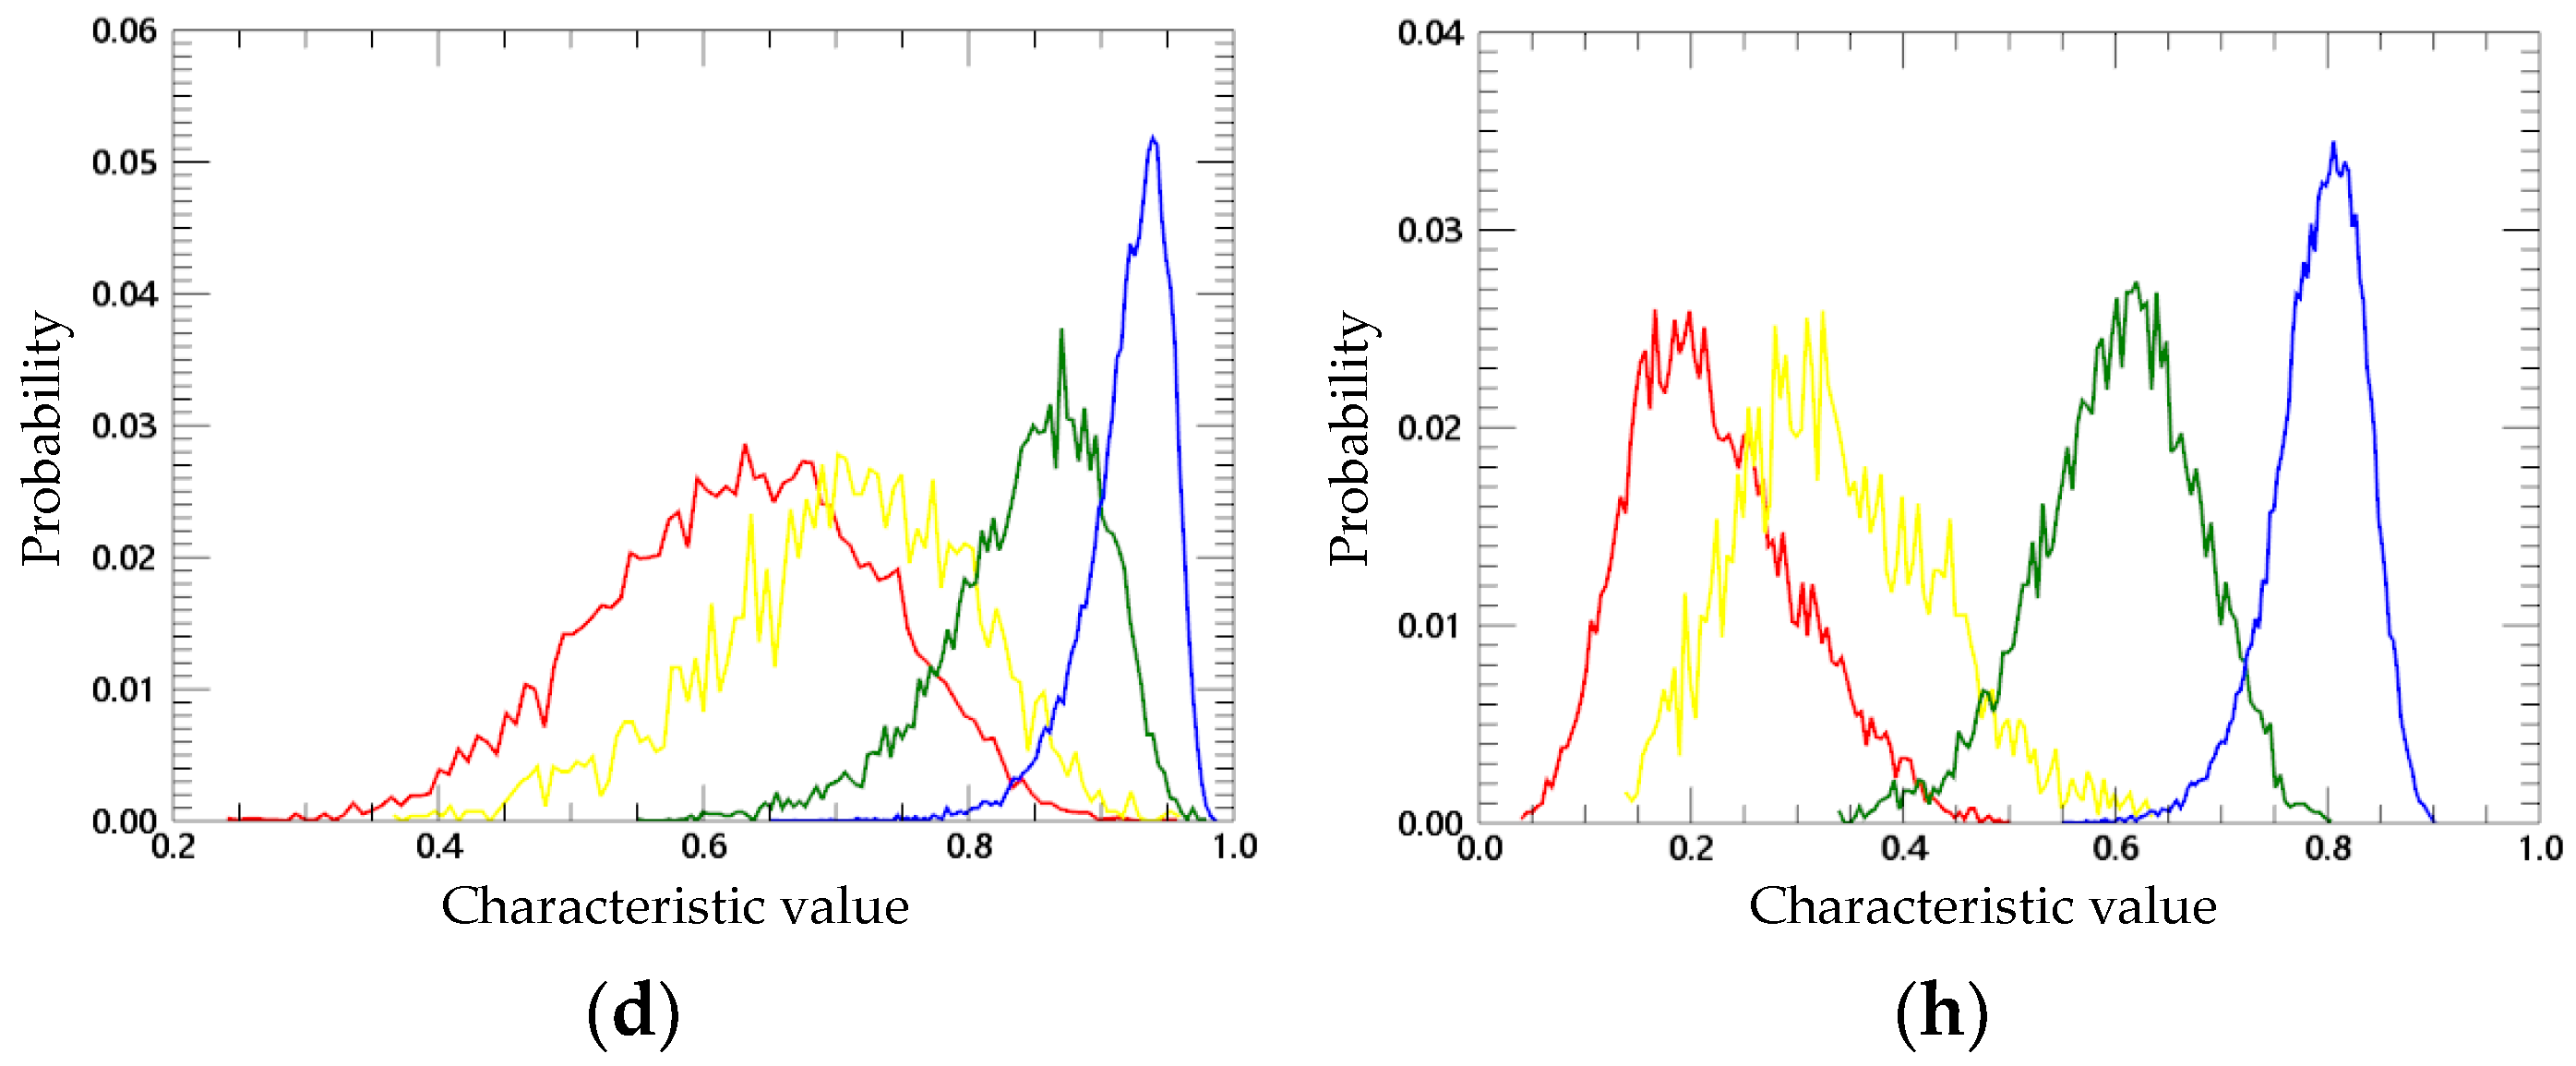
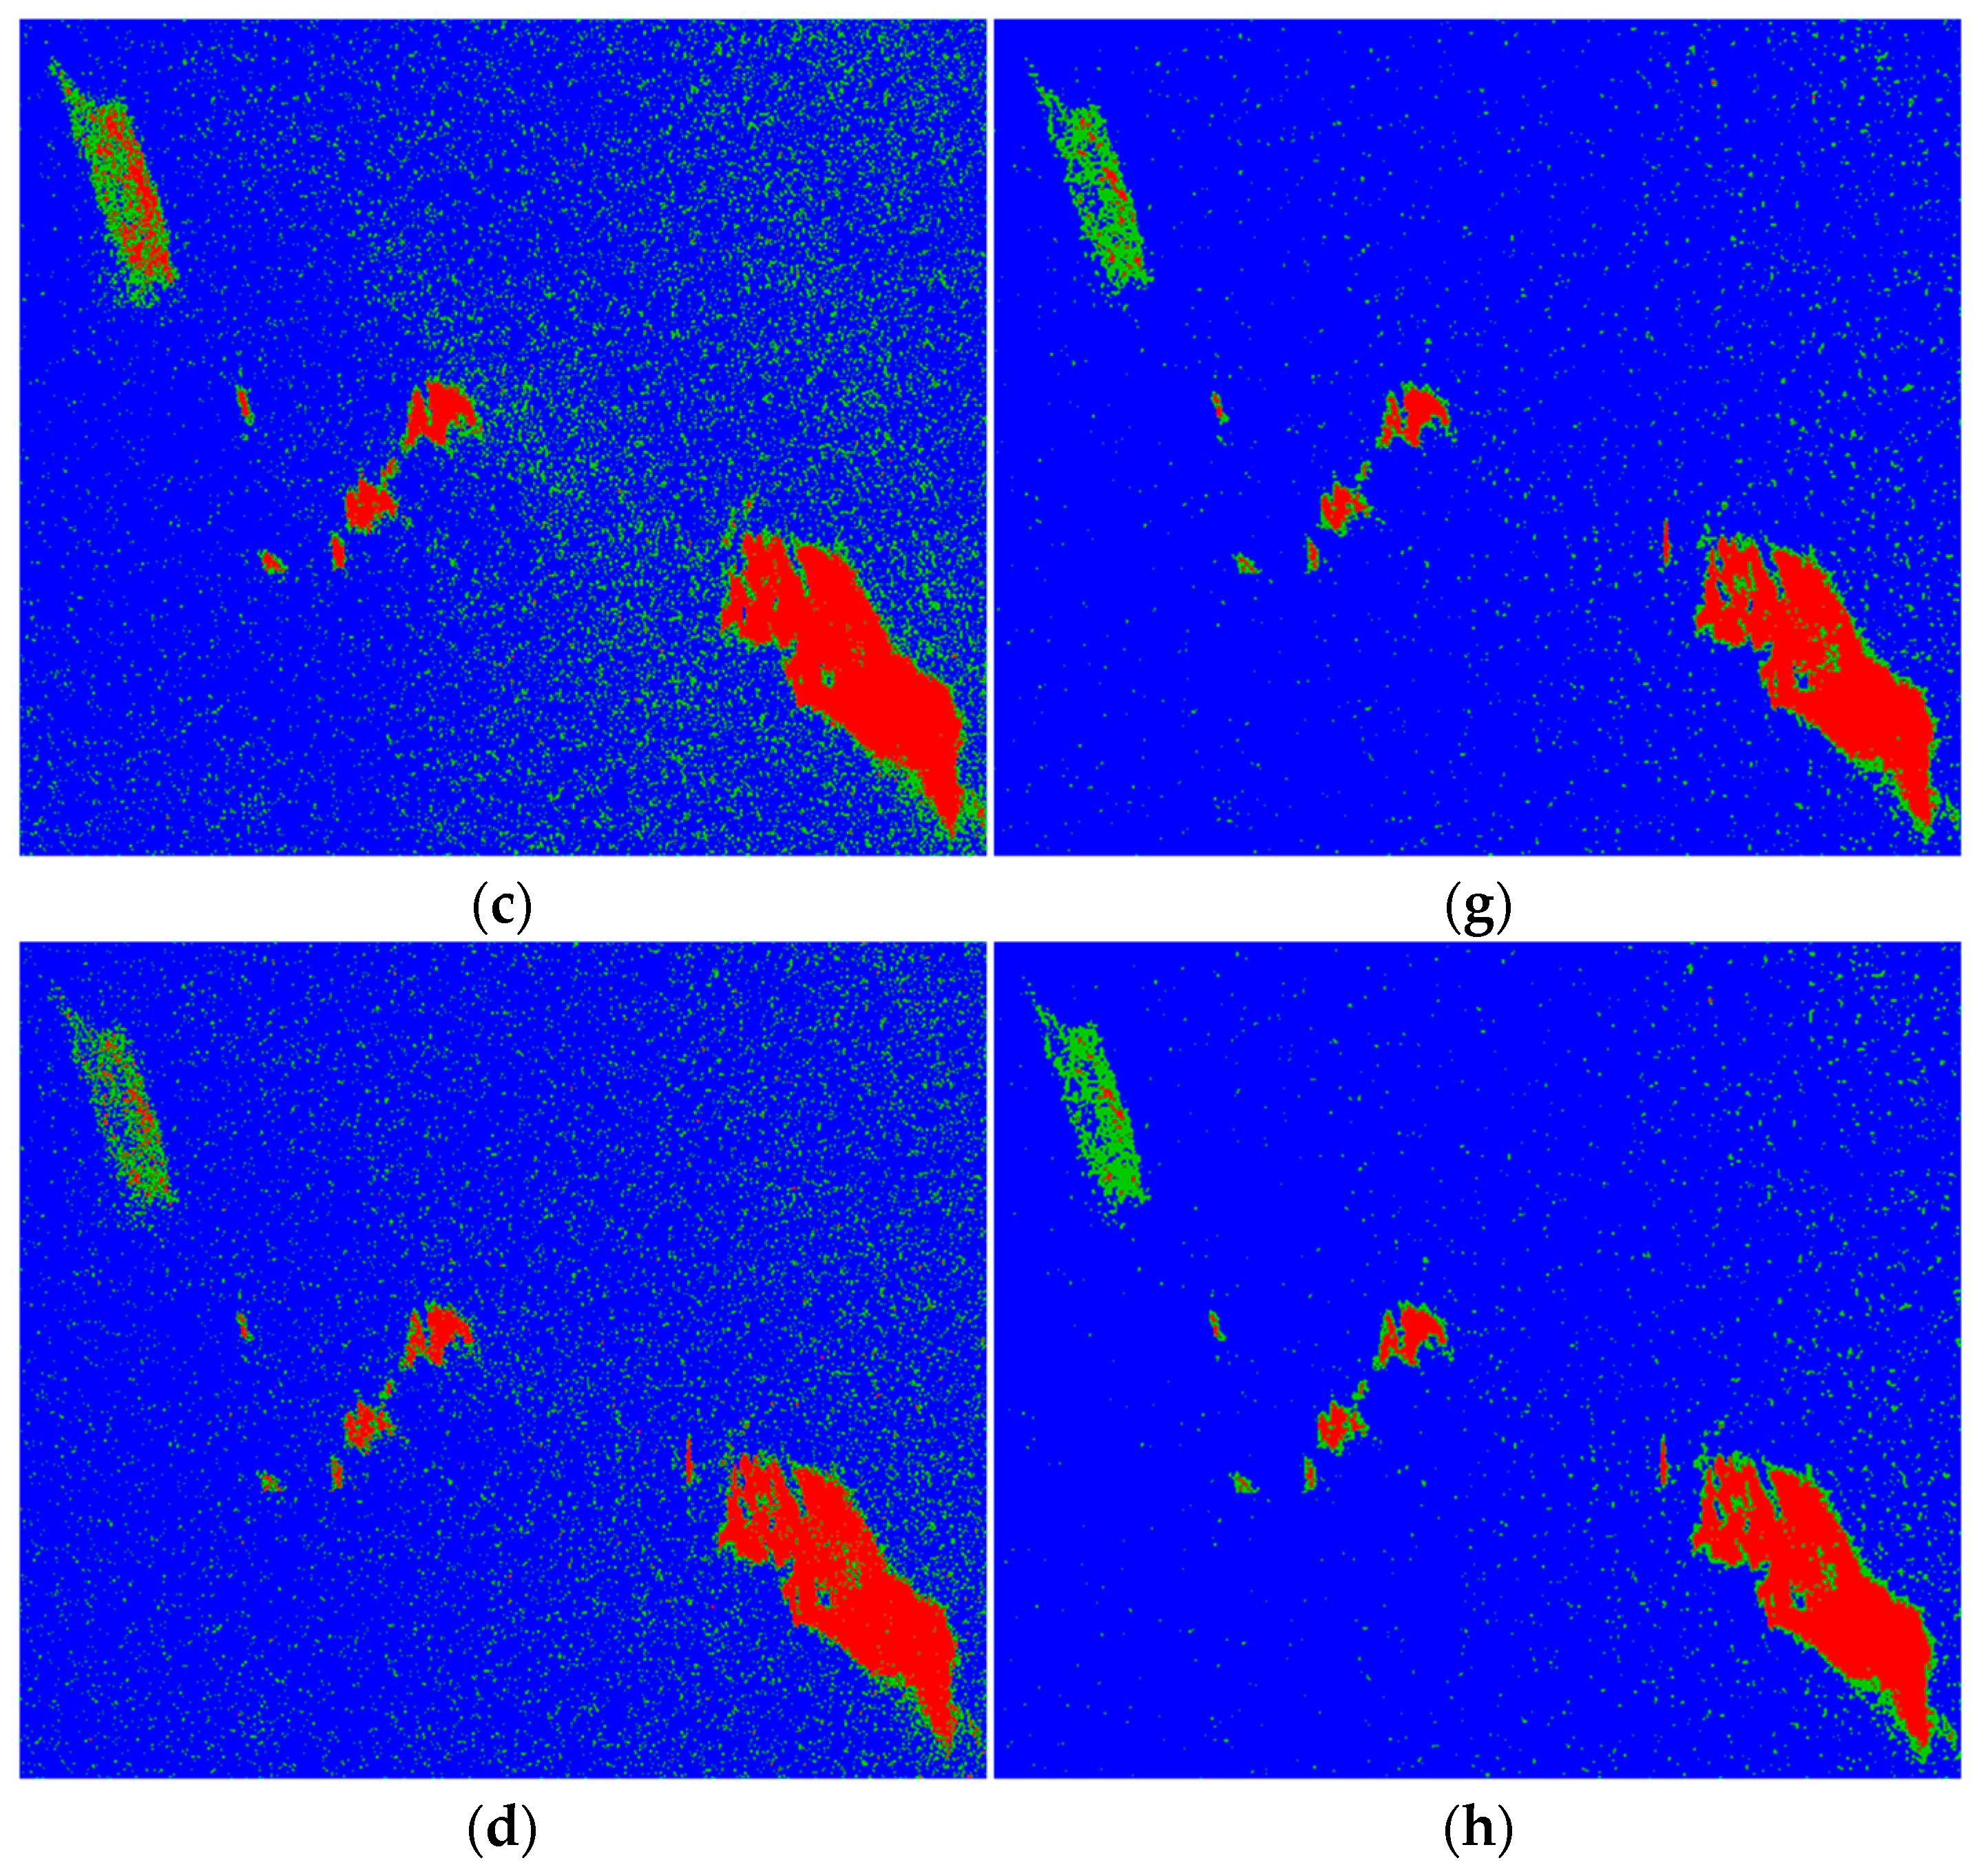
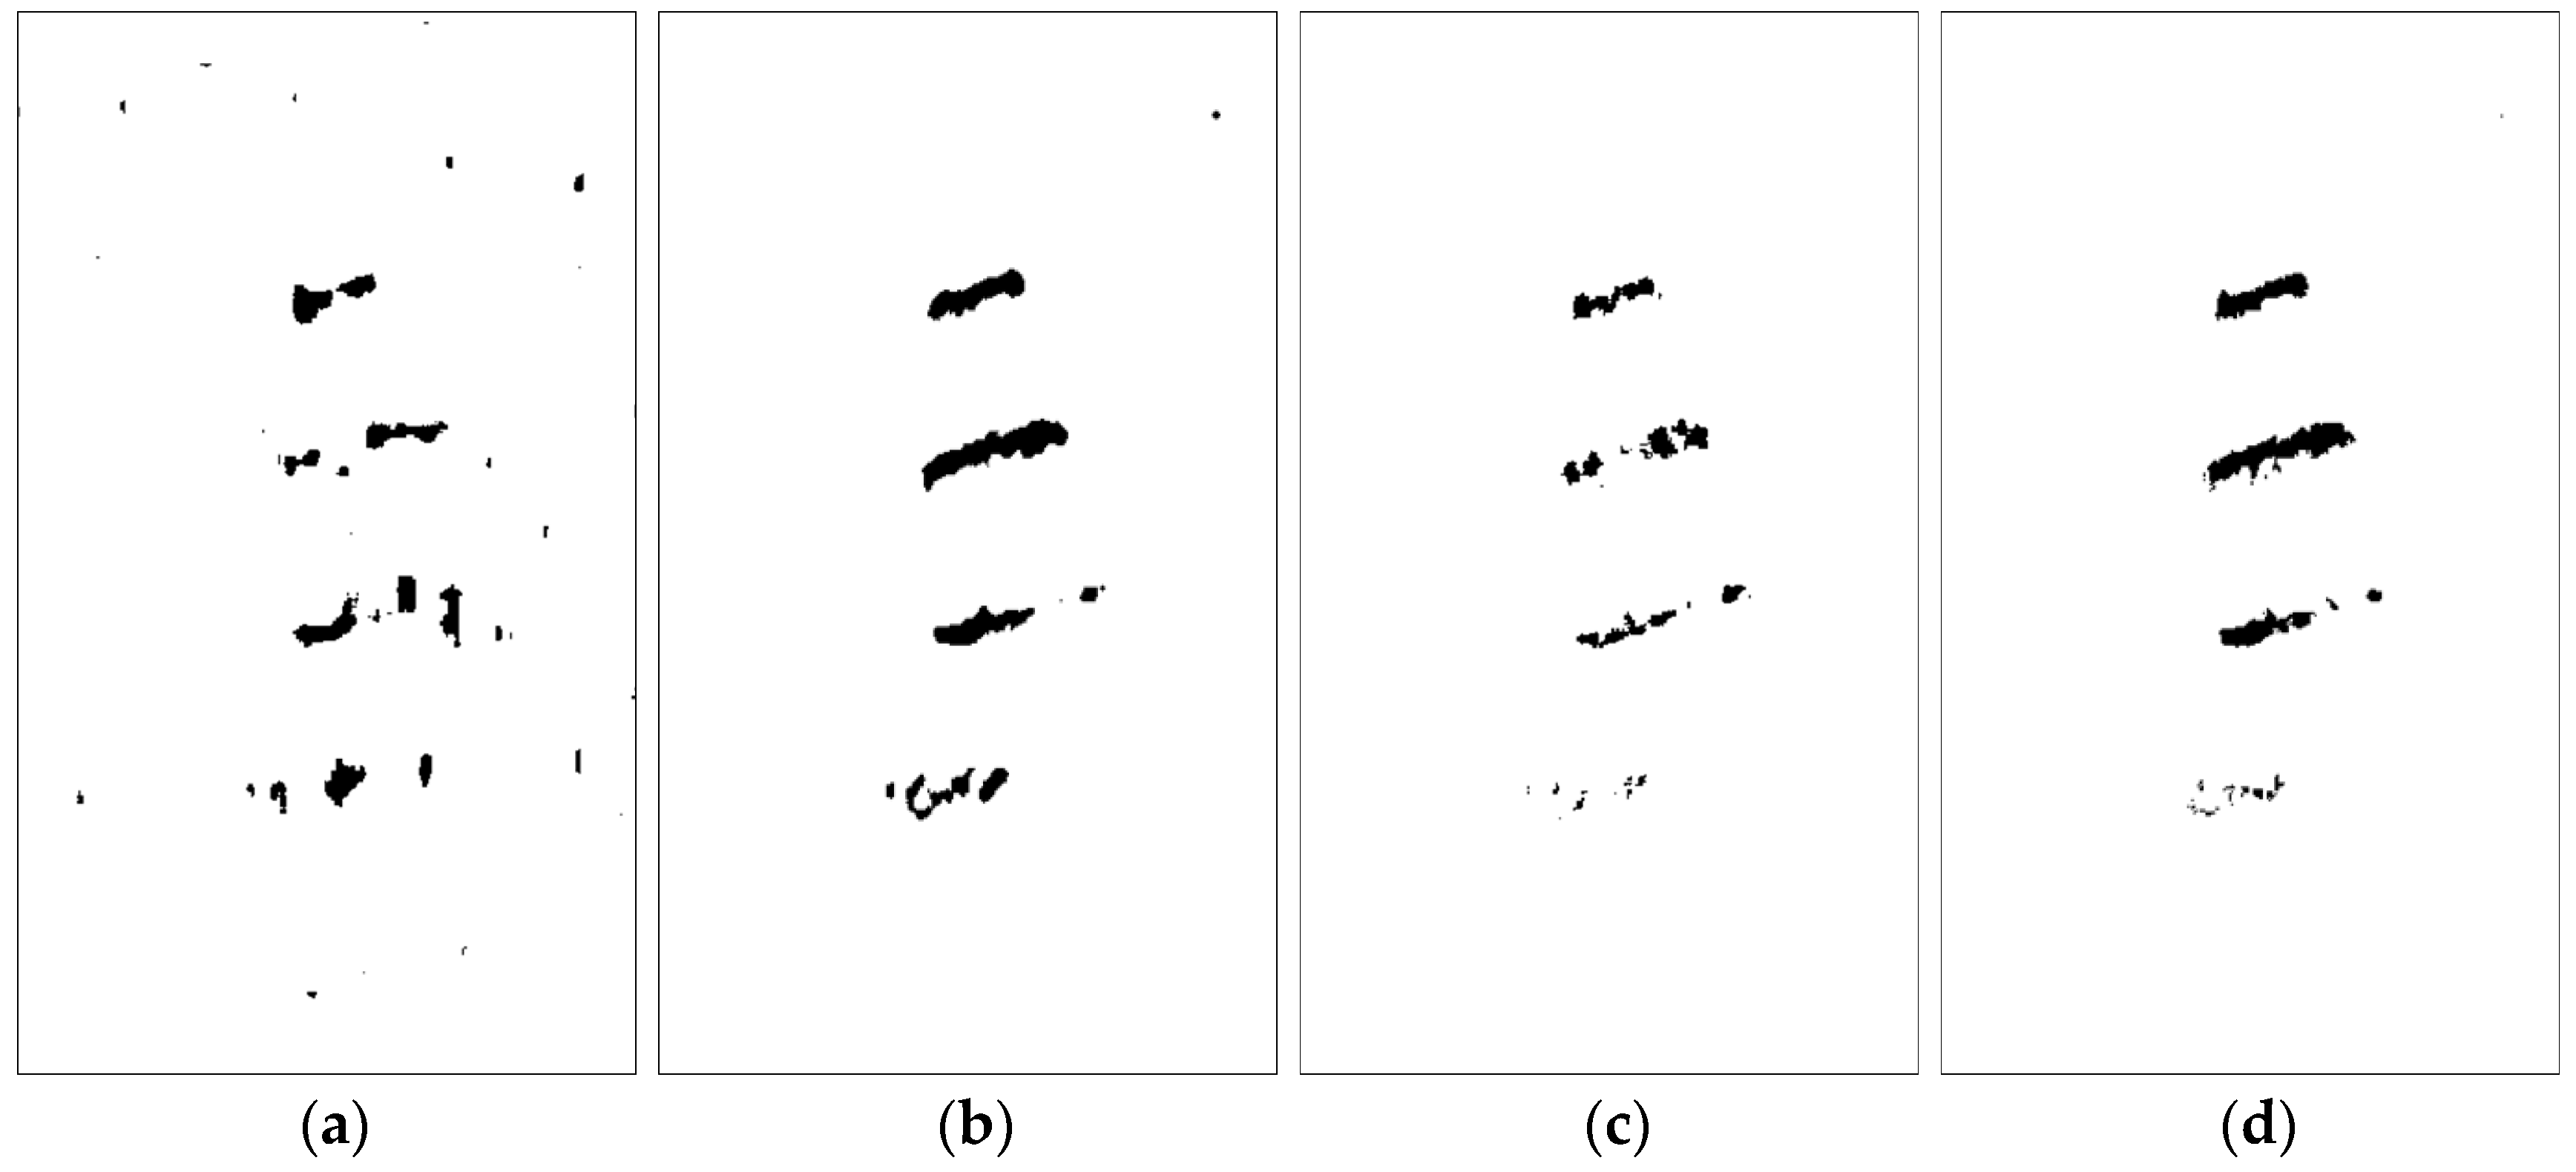
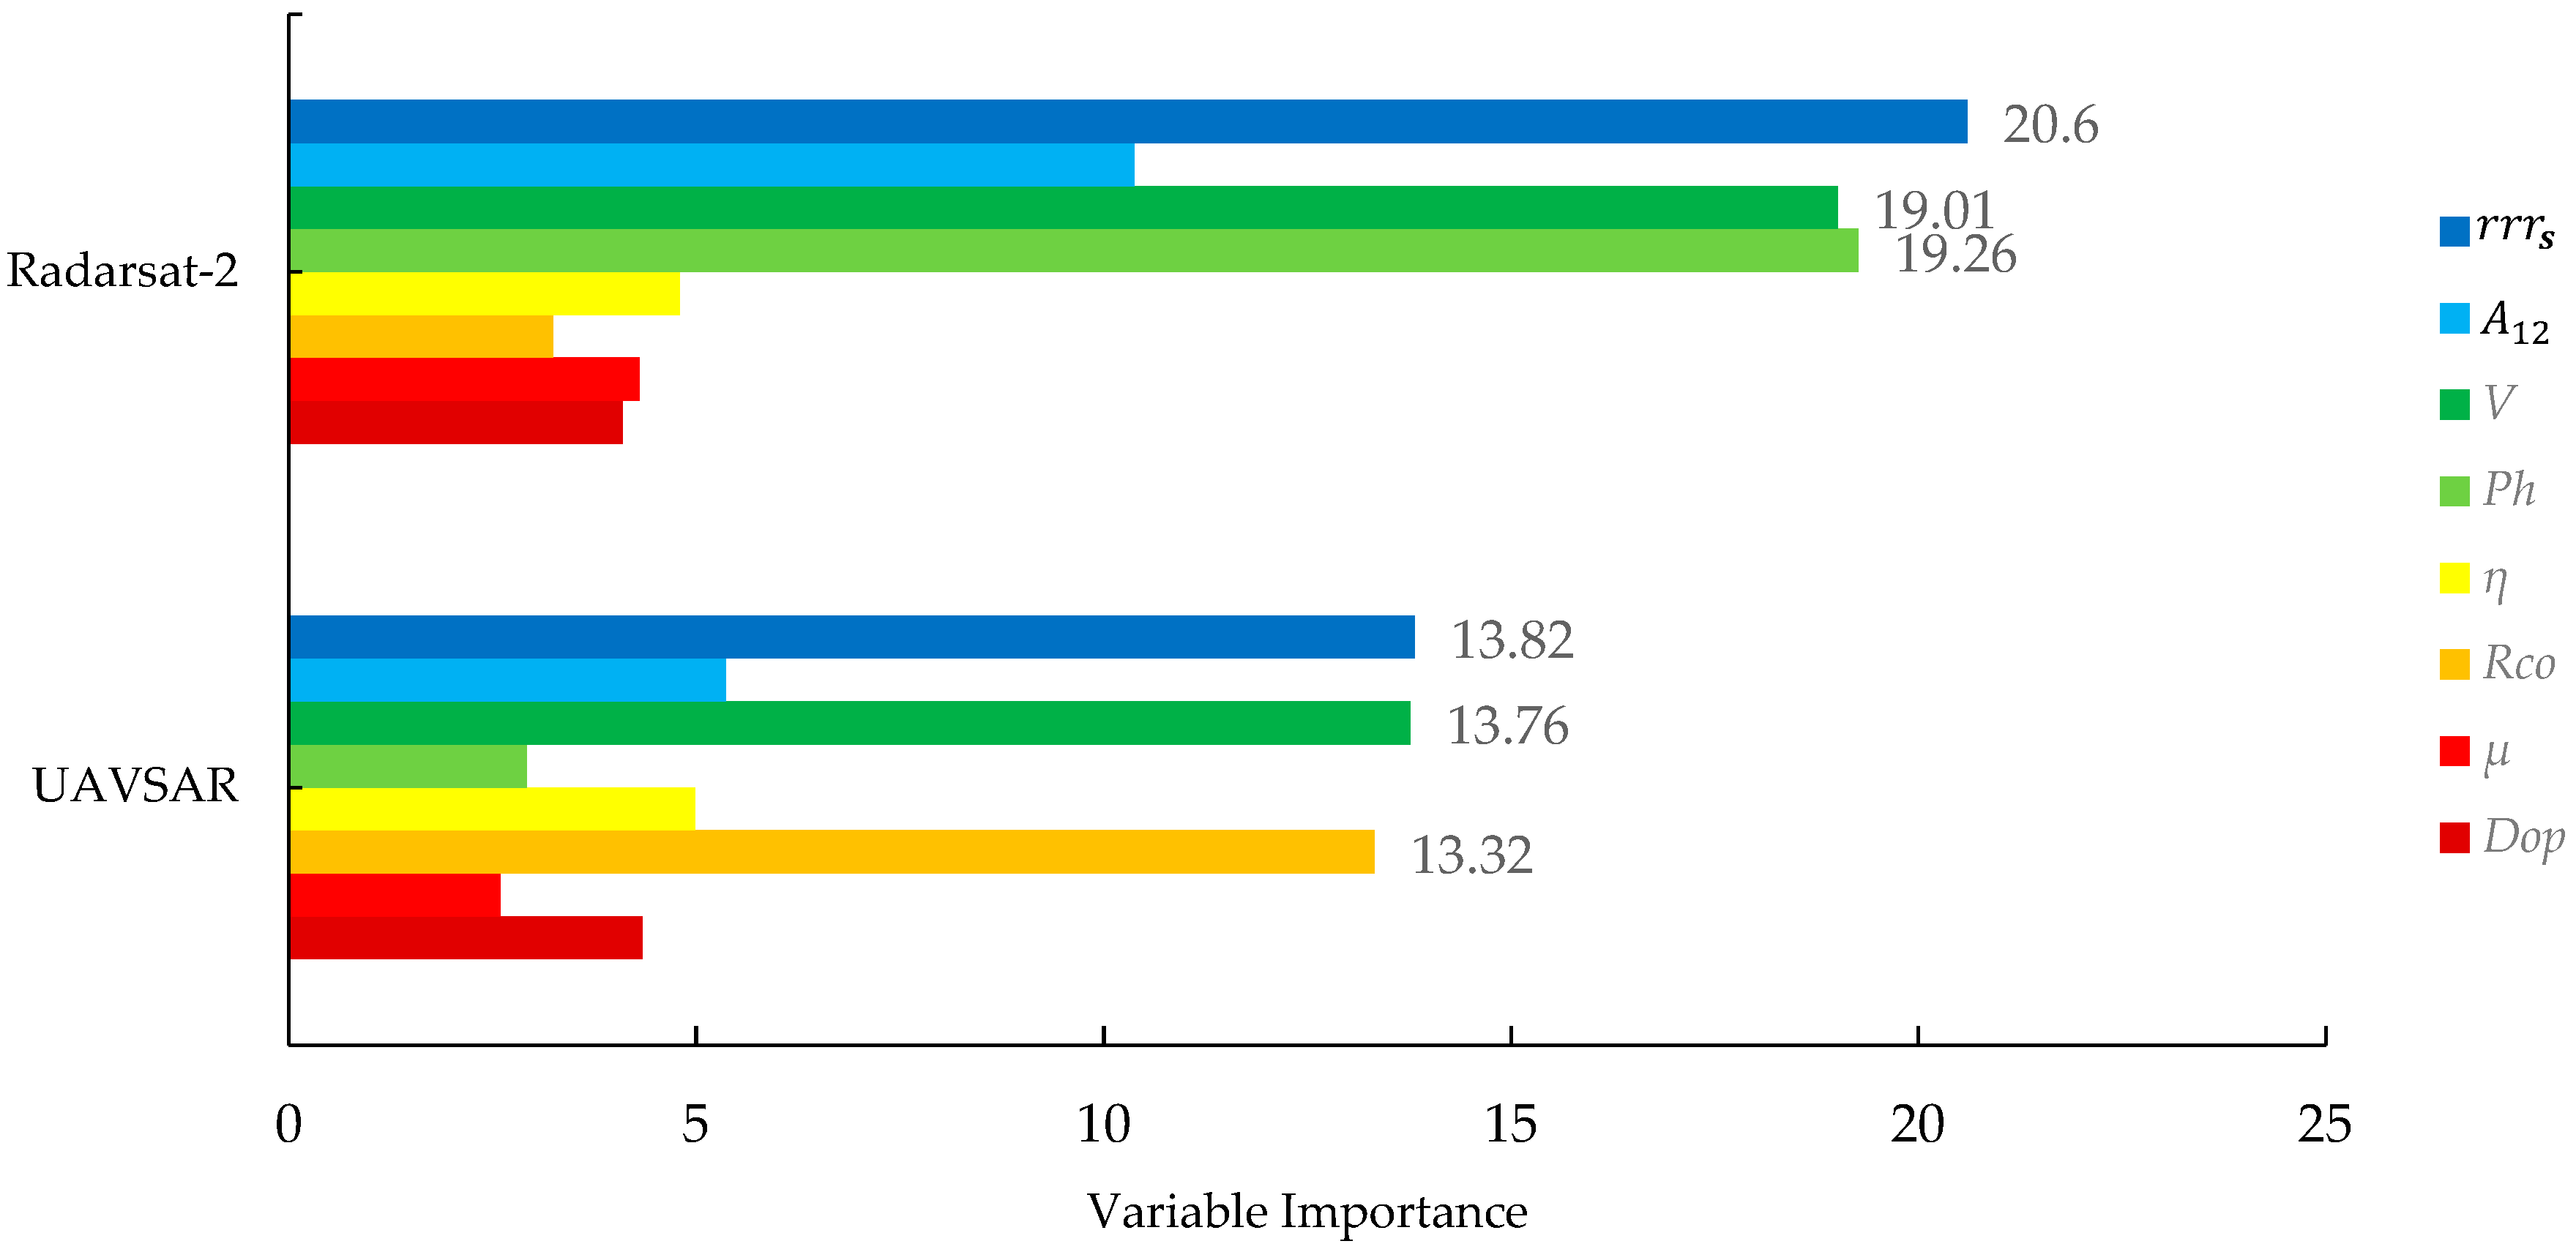
3.3. Evaluation and Comparison
4. Discussion
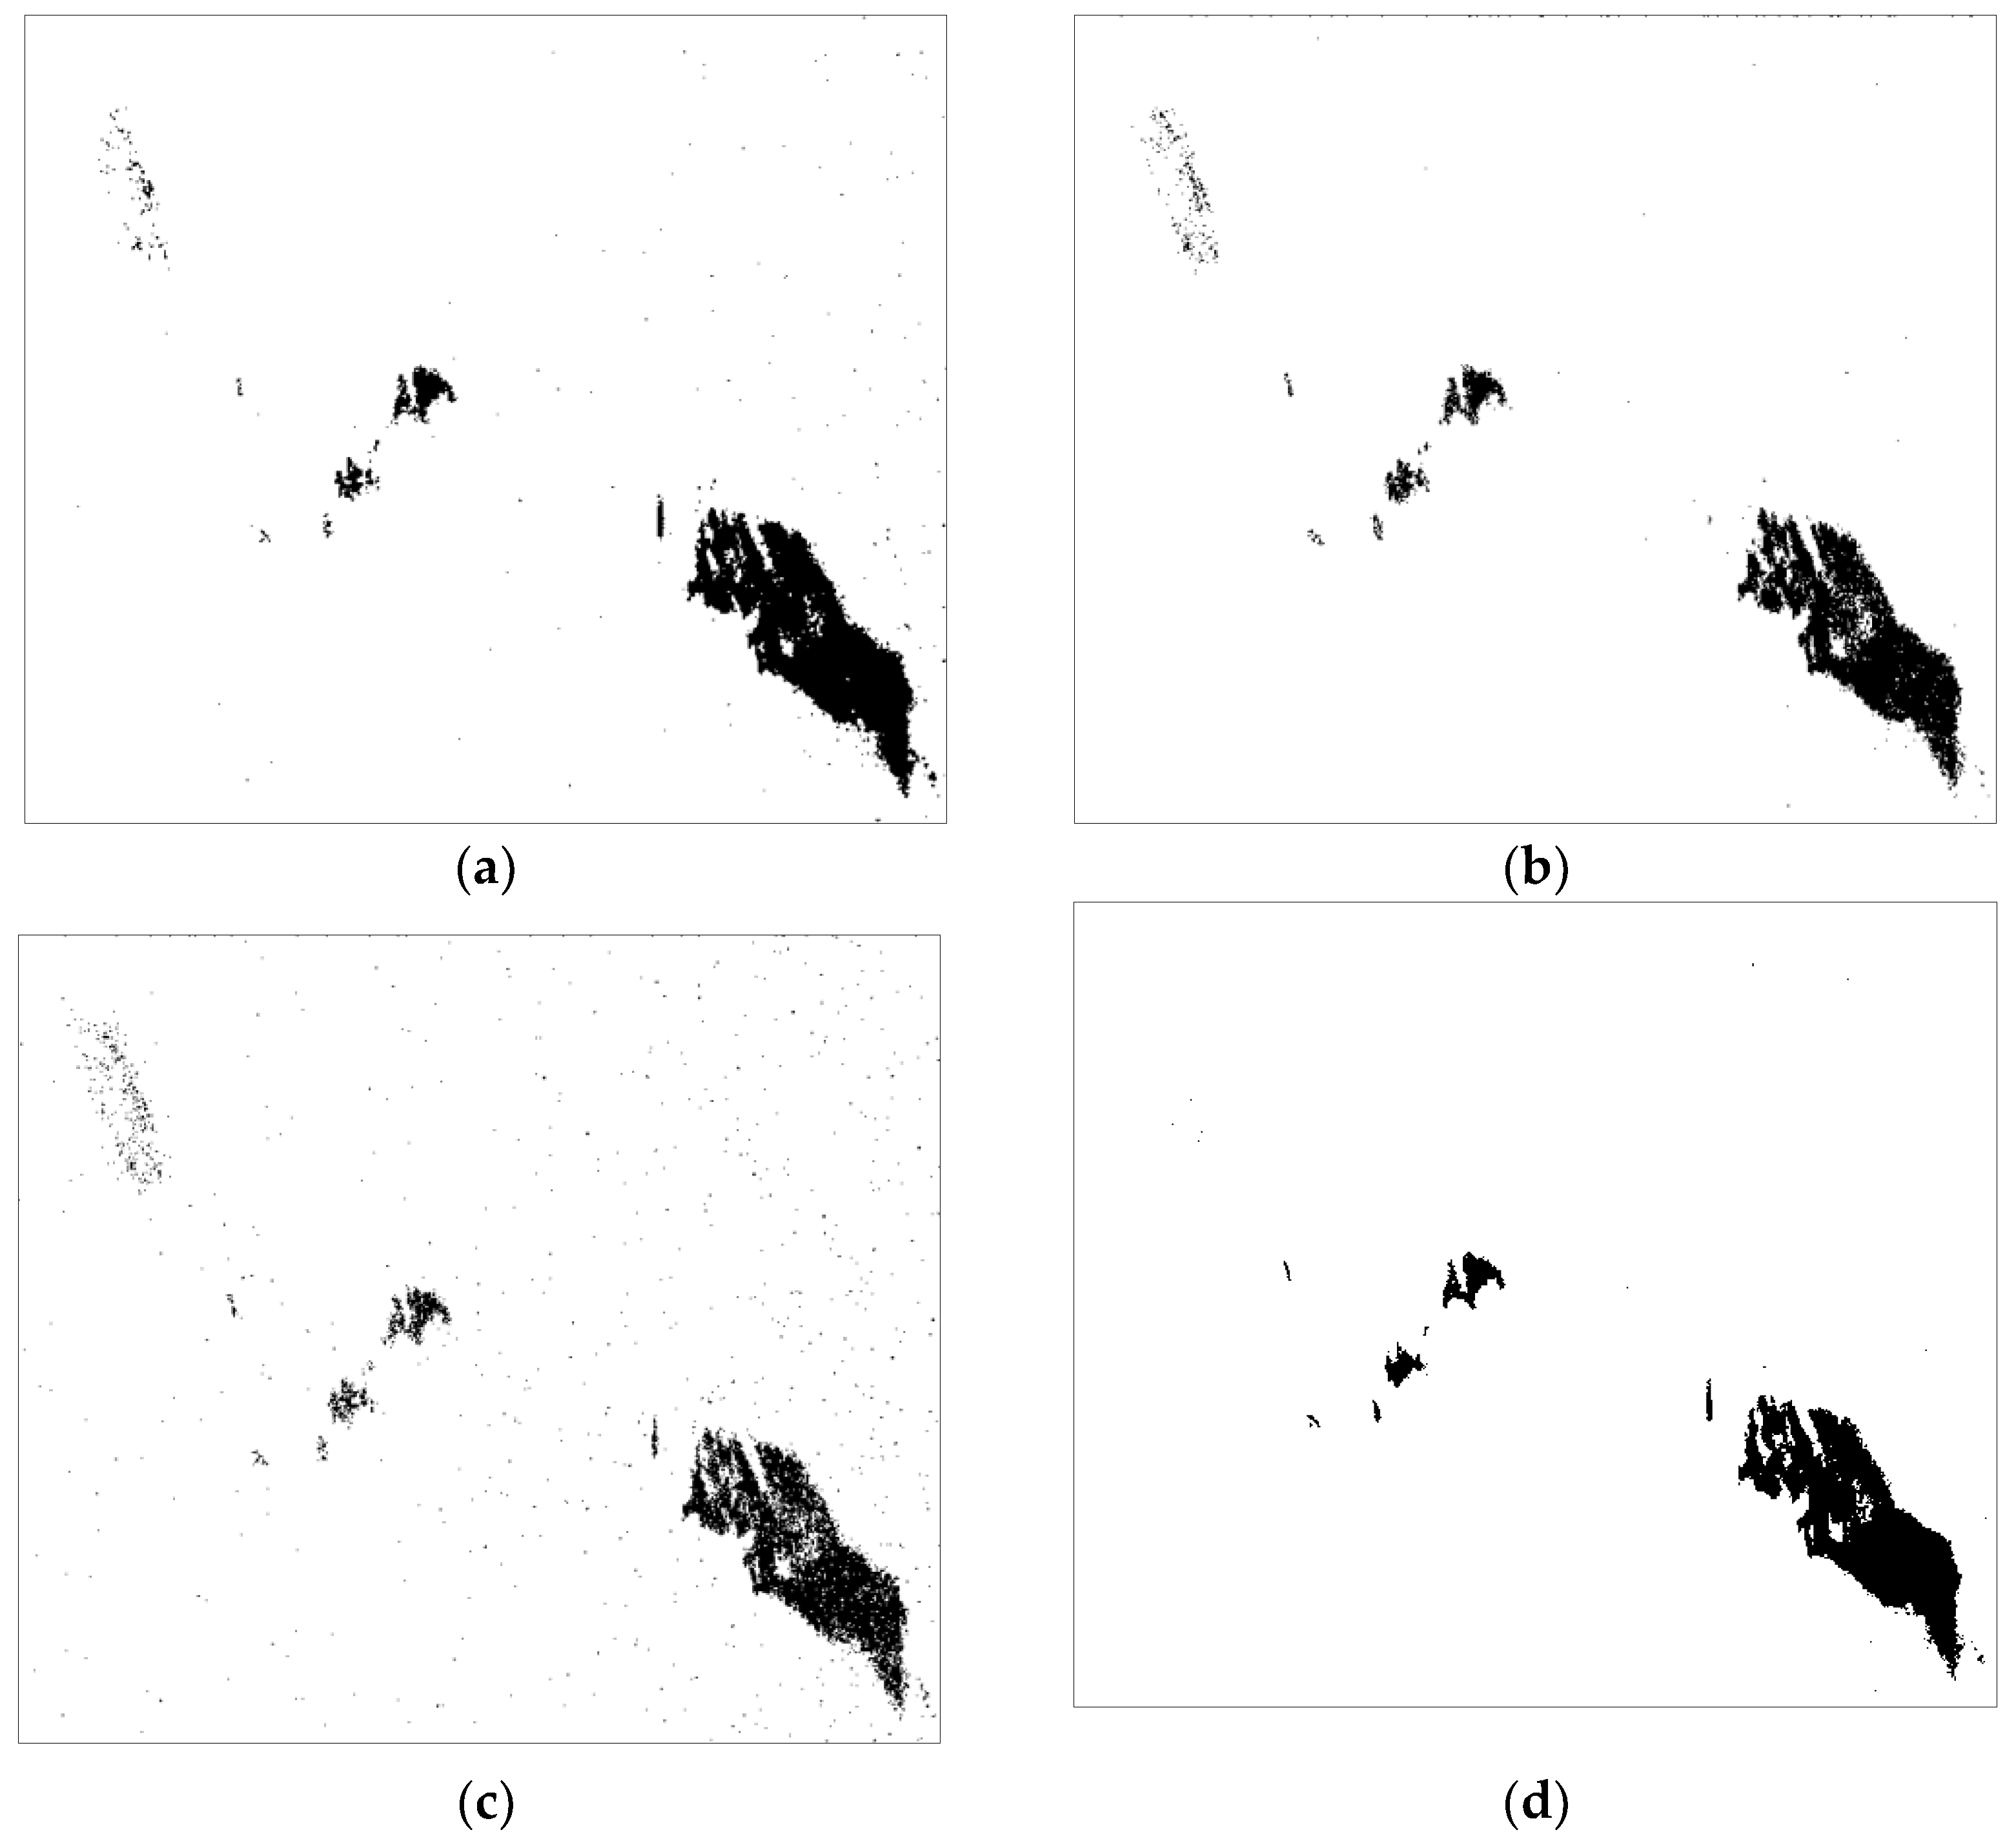
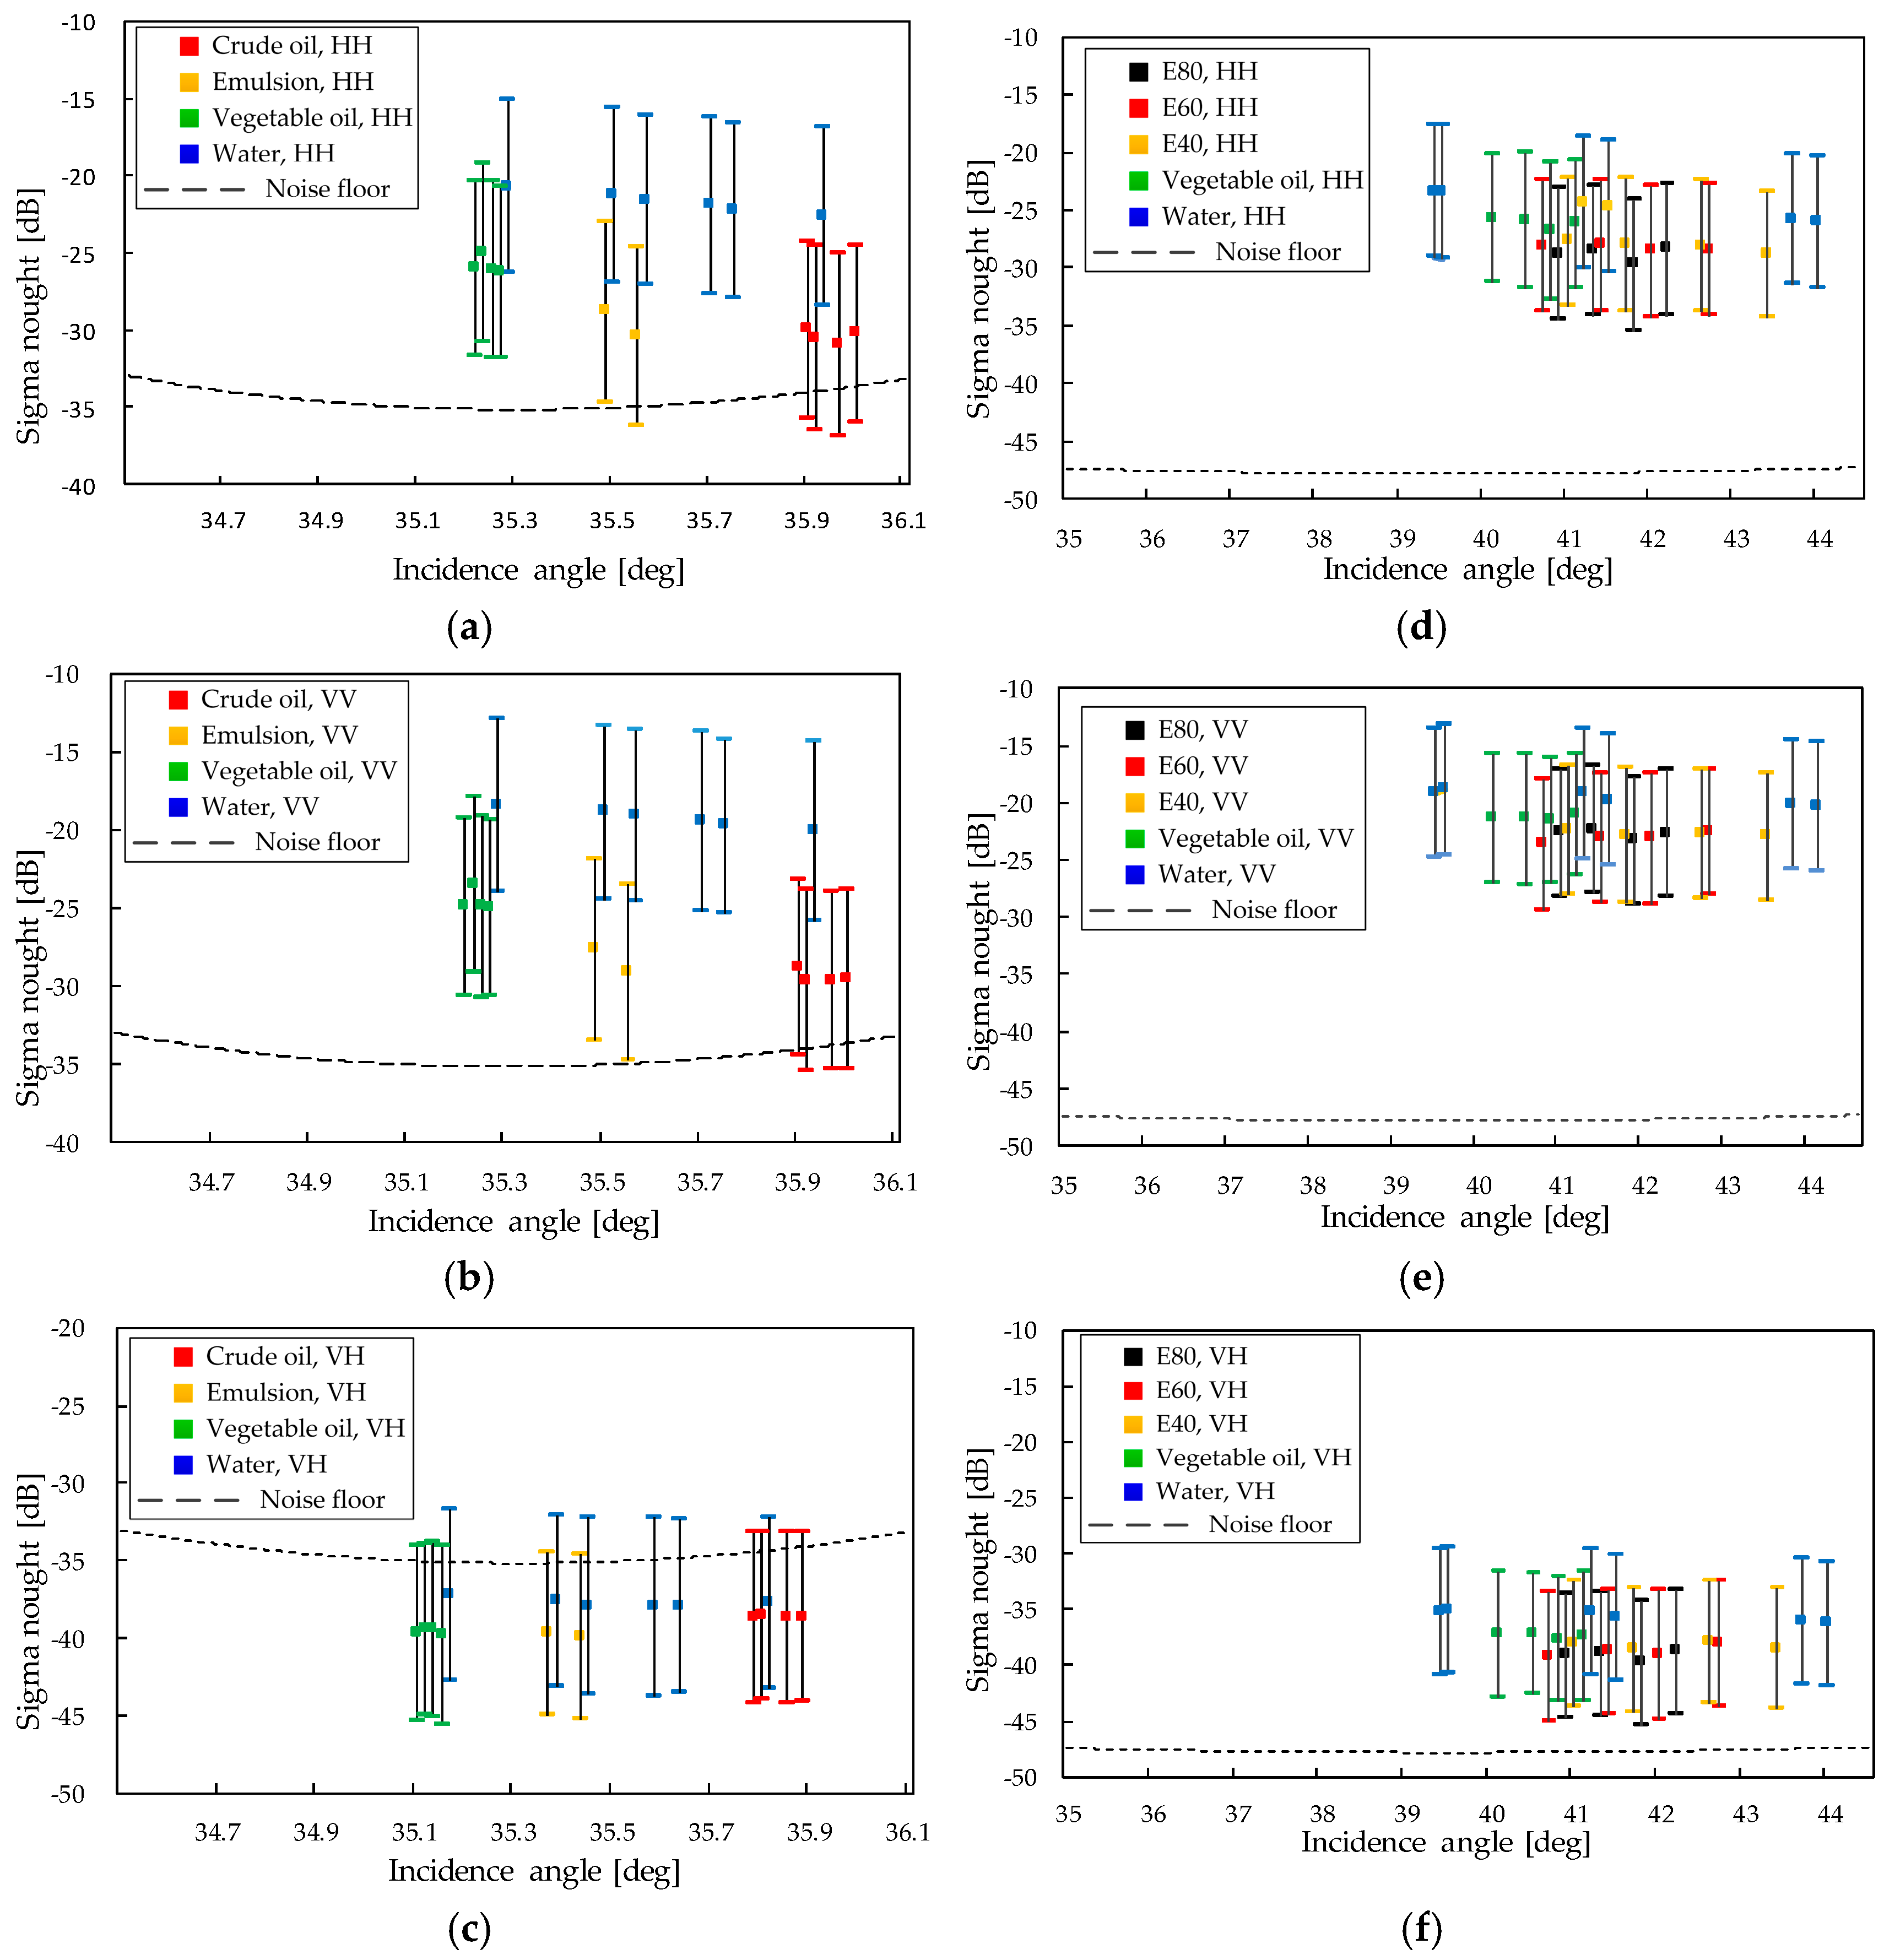
4.1. Noise Analysis
4.2. Analysis of Oil Spill Detection Ability of Self-Similarity Parameter under Different Imaging Conditions
4.2.1. The Look Direction Relative to the Wind
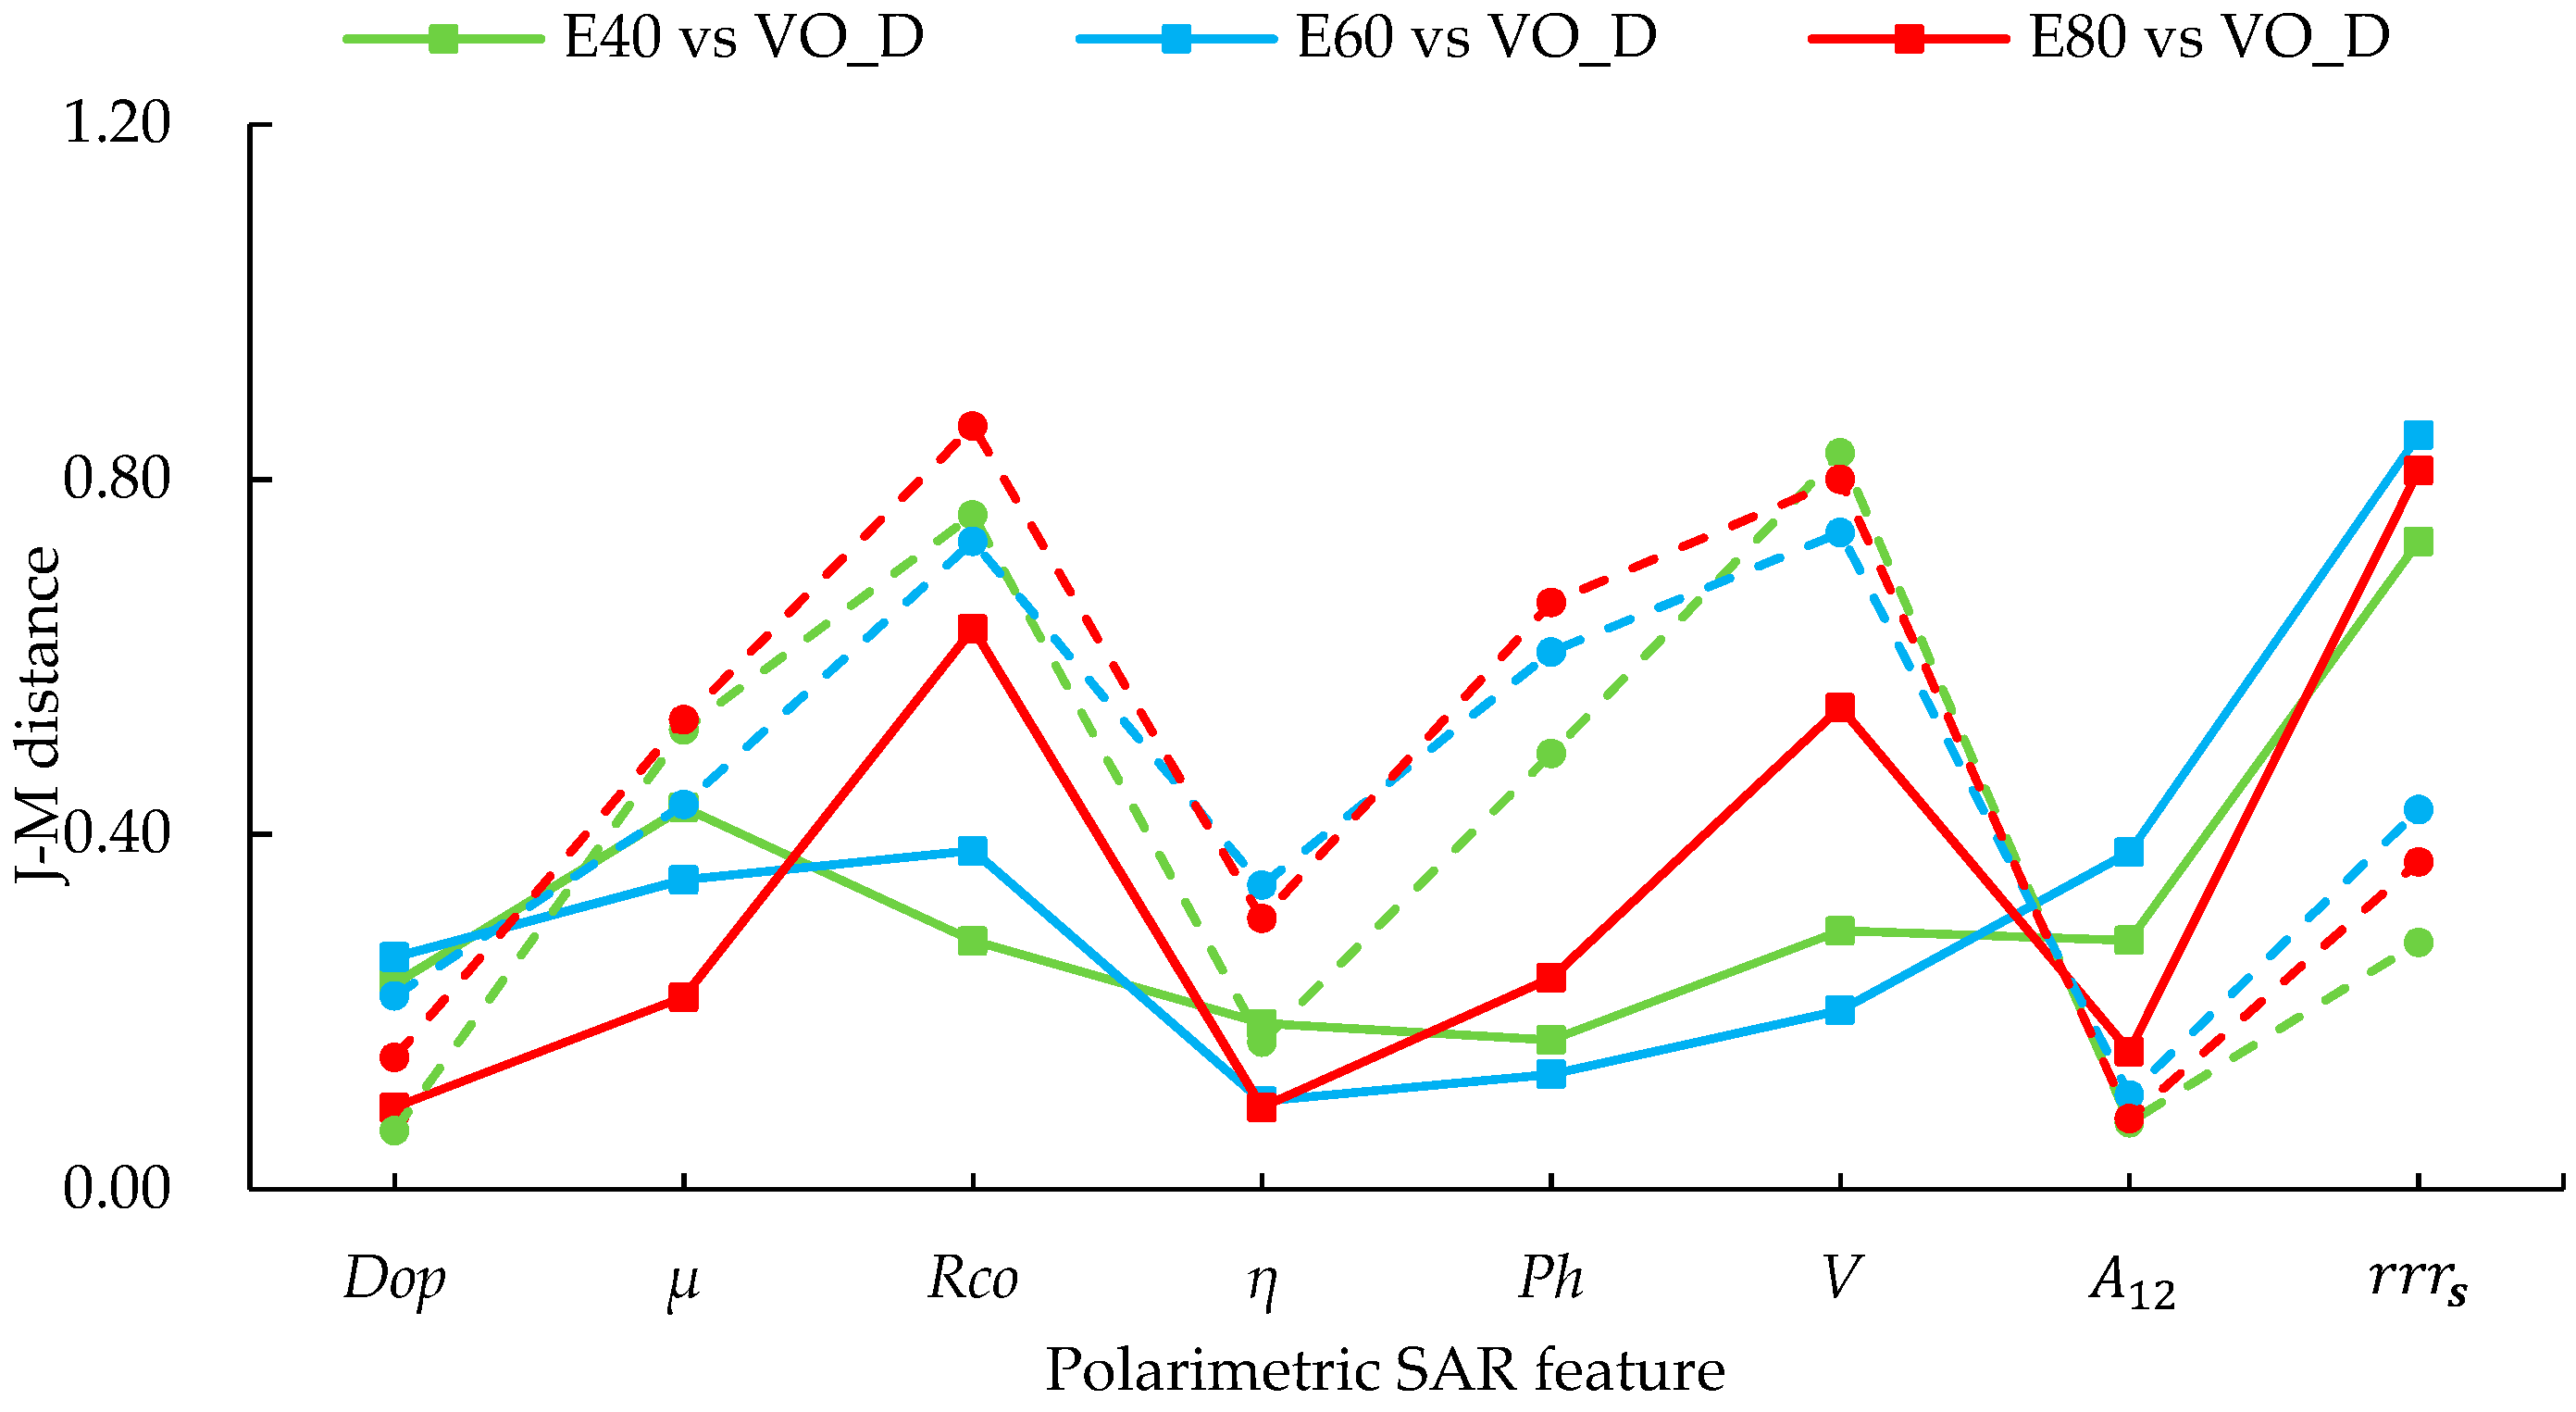
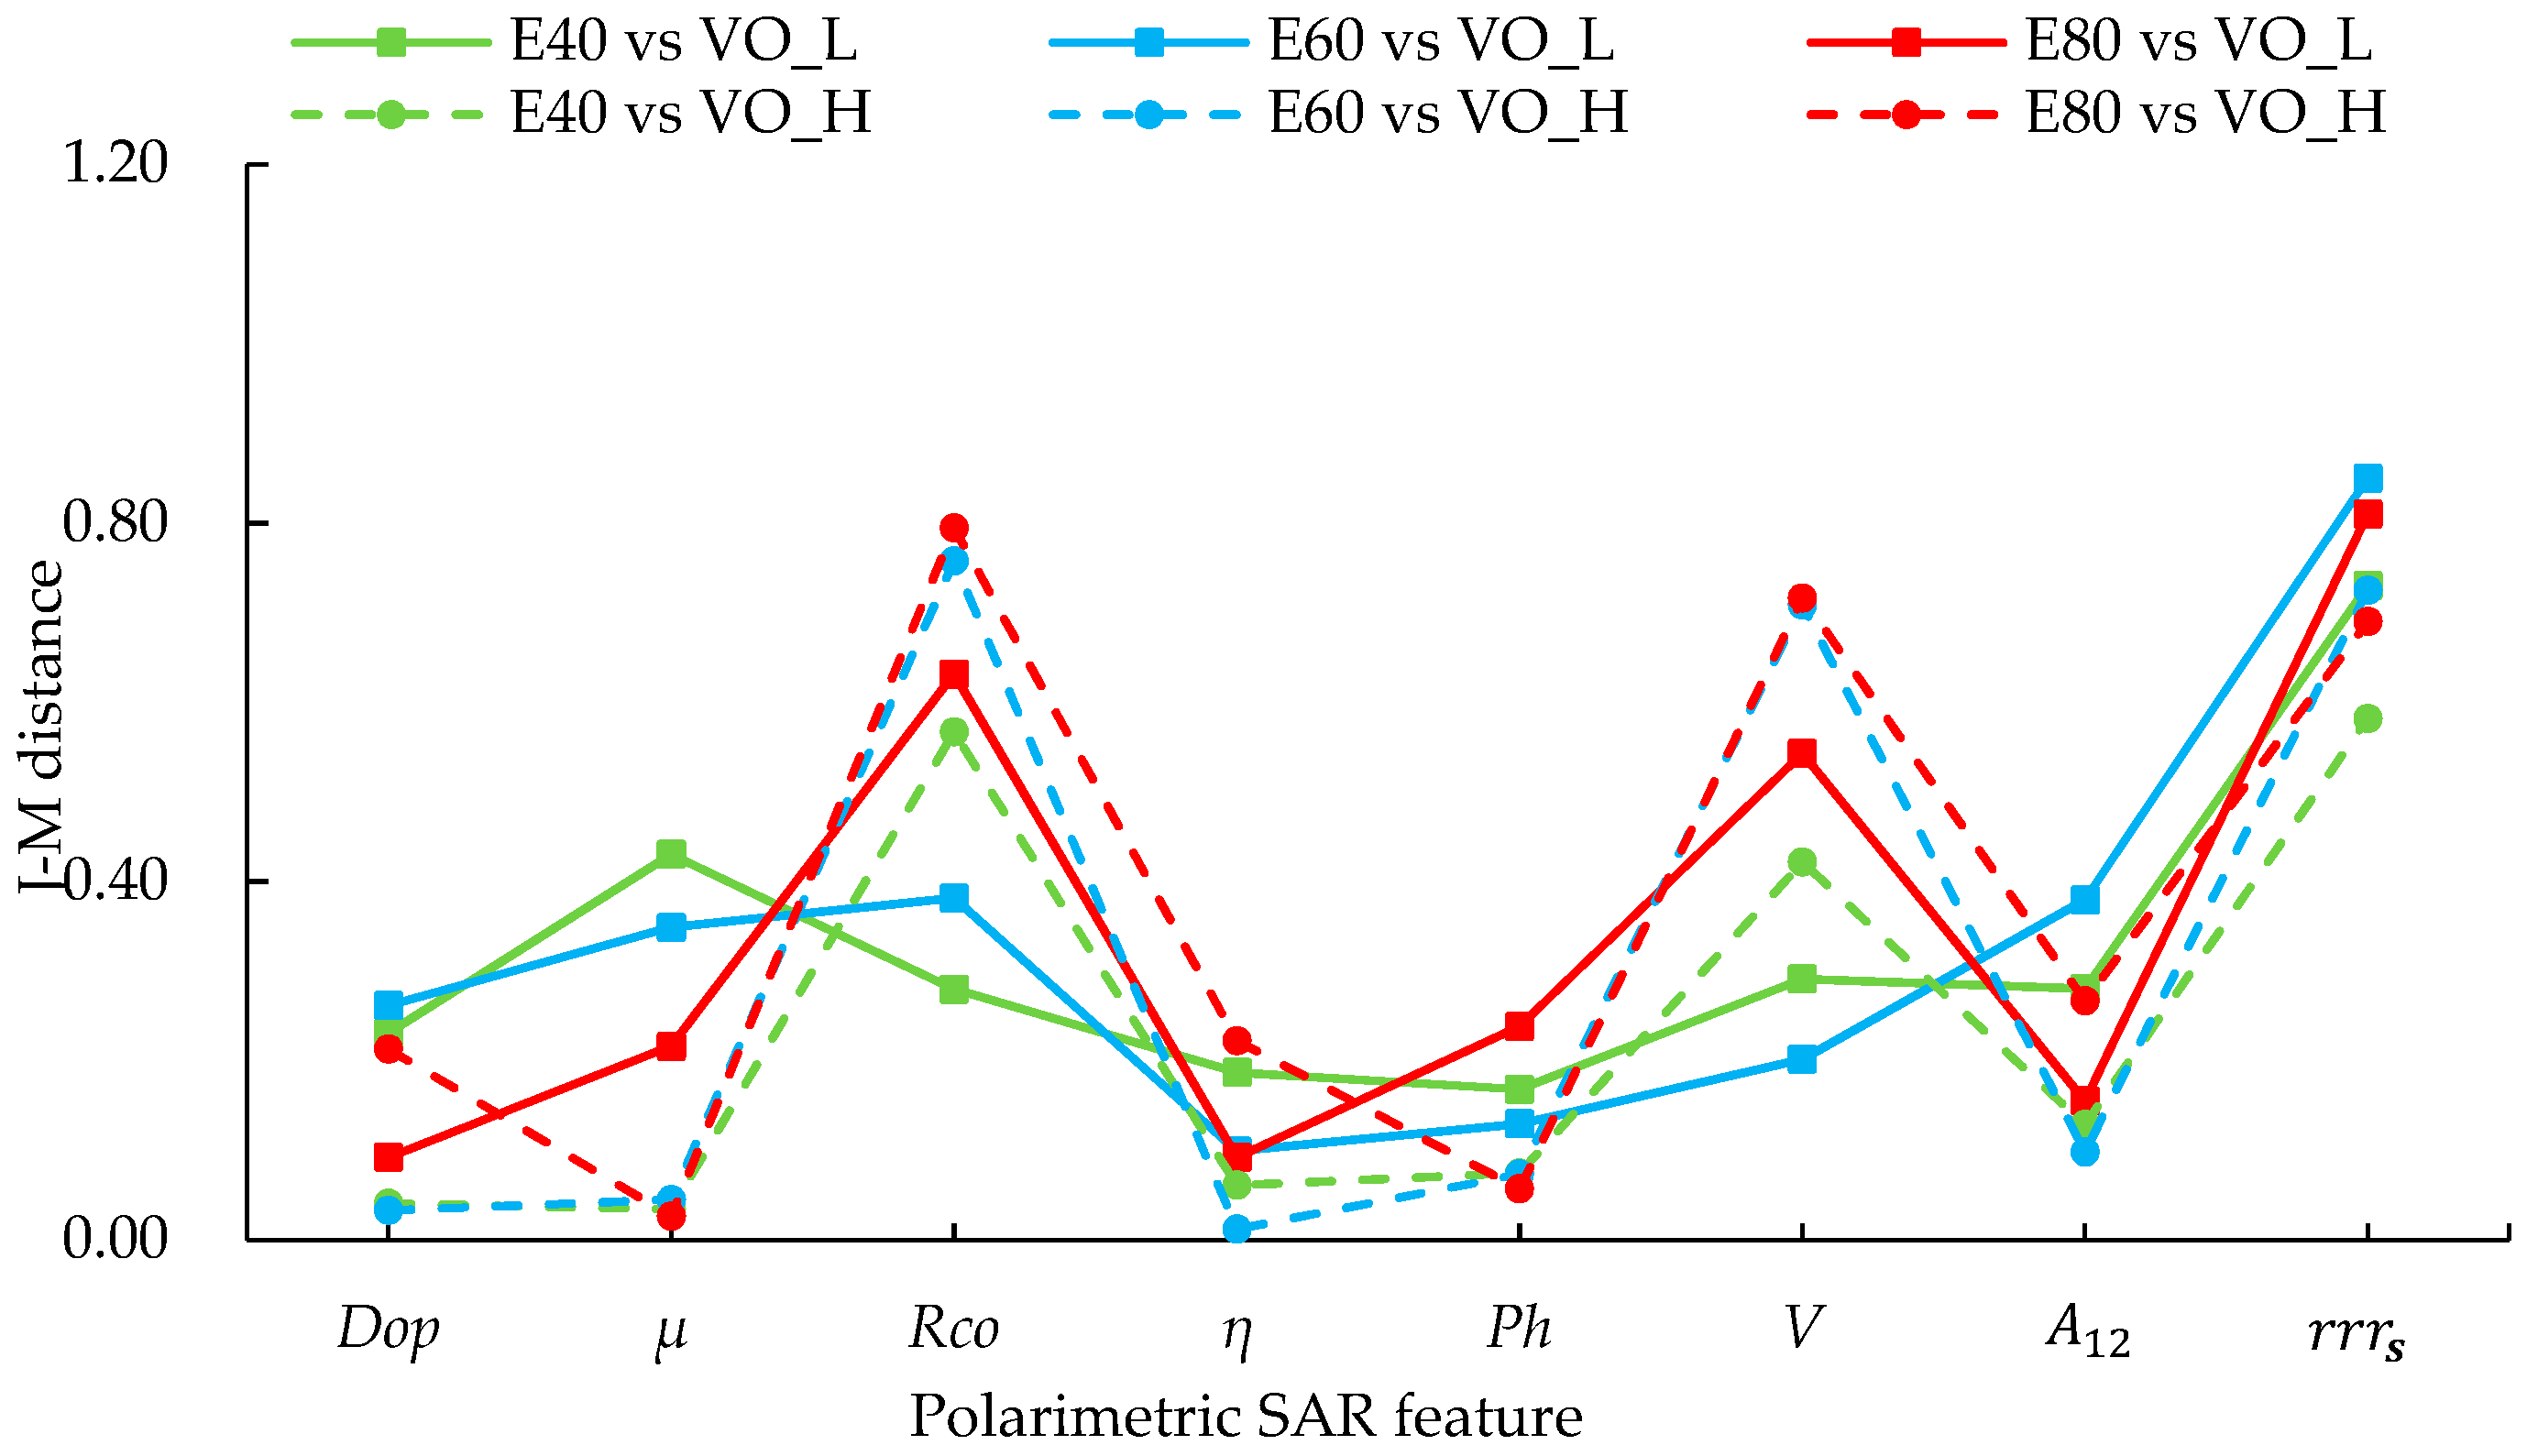
4.2.2. The Sensor Incidence Angle
4.3. Accuracies, Errors, and Uncertainties
5. Conclusions
Author Contributions
Funding
Acknowledgments
Conflicts of Interest
References
- Fingas, M.; Brown, C.E. Handbook of Oil Spill Science and Technology; John Wiley and Sons: Hoboken, NJ, USA, 2015. [Google Scholar]
- Brekke, C.; Solberg, A.H.S. Oil spill detection by satellite remote sensing. Remote Sens. Environ. 2005, 95, 1–13. [Google Scholar] [CrossRef]
- Nunziata, F.; Migliaccio, M.; Gambardella, A. Pedestal height for sea oil slick observation. IET Radar. Sonar. Nav. 2011, 5, 103. [Google Scholar] [CrossRef]
- Migliaccio, M.; Nunziata, F.; Gambardella, A. On the Copolarised Phase Difference for Oil Spill Observation. Int. J. Remote Sens. 2007, 6, 1587–1602. [Google Scholar]
- Kubat, M.; Holte, R.C.; Matwin, S. Machine Learning for the Detection of Oil Spills in Satellite Radar Images. Mach. Learn. 1998, 30, 195–215. [Google Scholar] [CrossRef] [Green Version]
- Migliaccio, M.; Tranfaglia, M.; Ermakov, S.A. A physical approach for the observation of oil spills in SAR images. IEEE J. Oceanic Eng. 2005, 30, 496–507. [Google Scholar] [CrossRef]
- Migliaccio, M.; Gambardella, A.; Tranfaglia, M. SAR Polarimetry to Observe Oil Spills. IEEE Trans. Geosci. Remote Sens. 2007, 45, 506–511. [Google Scholar] [CrossRef]
- Latini, D.; Del Frate, F.; Jones, C.E. Multi-frequency and polarimetric quantitative analysis of the Gulf of Mexico oil spill event comparing different SAR systems. Remote Sens. Environ. 2016, 183, 26–42. [Google Scholar] [CrossRef]
- Liu, P.; Zhao, C.; Li, X.; He, M.; Pichel, W. Identification of ocean oil spills in SAR imagery based on fuzzy logic algorithm. Int. J. Remote Sens. 2010, 31, 4819–4833. [Google Scholar] [CrossRef]
- Buono, A.; Nunziata, F.; Migliaccio, M.; Li, X. Polarimetric Analysis of Compact-Polarimetry SAR Architectures for Sea Oil Slick Observation. IEEE Trans. Geosci. Remote Sens. 2016, 54, 5862–5874. [Google Scholar] [CrossRef]
- Song, D.; Ding, Y.; Li, X.; Zhang, B.; Xu, M. Ocean Oil Spill Classification with RADARSAT-2 SAR Based on an Optimized Wavelet Neural Network. Remote Sens. 2017, 9, 799. [Google Scholar] [CrossRef]
- Salberg, A.; Larsen, S.O. Classification of Ocean Surface Slicks in Simulated Hybrid-Polarimetric SAR Data. IEEE Trans. Geosci. Remote Sens. 2018, 56, 7062–7073. [Google Scholar] [CrossRef]
- Migliaccio, M.; Nunziata, F.; Buono, A. SAR polarimetry for sea oil slick observation. Int. J. Remote Sens. 2015, 36, 3243–3273. [Google Scholar] [CrossRef] [Green Version]
- Liu, P.; Li, X.; Qu, J.J.; Wang, W.; Zhao, C.; Pichel, W. Oil spill detection with fully polarimetric UAVSAR data. Mar. Pollut Bull. 2011, 62, 2611–2618. [Google Scholar] [CrossRef] [PubMed]
- Ramsey, E., III; Rangoonwala, A.; Suzuoki, Y.; Jones, C.E. Oil Detection in a Coastal Marsh with Polarimetric Synthetic Aperture Radar (SAR). Remote Sens. 2011, 3, 2630–2662. [Google Scholar] [CrossRef] [Green Version]
- Skrunes, S.; Brekke, C.; Eltoft, T. Characterization of Marine Surface Slicks by Radarsat-2 Multipolarization Features. IEEE Trans. Geosci. Remote Sens. 2014, 52, 5302–5319. [Google Scholar] [CrossRef] [Green Version]
- Fan, Y.; Jian, Y.; Yin, J.; Jian, S. Spill detection based on polarimetric SAR decomposition models. J. Tsinghua Univ. 2015, 854–859. [Google Scholar]
- Zhang, B.; Perrie, W.; Li, X.; Pichel, W.G. Mapping sea surface oil slicks using RADARSAT-2 quad-polarization SAR image. Geophys Res. Lett. 2011, 38, 415–421. [Google Scholar] [CrossRef]
- Skrunes, S.; Brekke, C.; Eltoft, T.; Kudryavtsev, V. Comparing Near-Coincident C- and X-Band SAR Acquisitions of Marine Oil Spills. IEEE Trans. Geosci. Remote Sens. 2014, 53, 1958–1975. [Google Scholar] [CrossRef]
- Nunziata, F.; Gambardella, A.; Migliaccio, M. On the degree of polarization for SAR sea oil slick observation. ISPRS J. Photogramm. Remote Sens. 2013, 78, 41–49. [Google Scholar] [CrossRef]
- Kumar, L.J.V.; Kishore, J.K.; Rao, P.K. Decomposition methods for detection of oil spills based on Risat-1 SAR images. Int. J. Remote Sens. Geosci. 2014, 3, 1–10. [Google Scholar]
- Alpers, W.; Holt, B.; Zeng, K. Oil spill detection by imaging radars: Challenges and pitfalls. Remote Sens. Environ. 2017, 201, 133–147. [Google Scholar] [CrossRef]
- Zhang, B.; Li, X.; Perrie, W.; Garcia-Pineda, O. Compact Polarimetric Synthetic Aperture Radar for Marine Oil Platform and Slick Detection. IEEE Trans. Geosci. Remote Sens. 2017, 55, 1–17. [Google Scholar] [CrossRef]
- Li, Y.; Lin, H.; Zhang, Y.; Chen, J. Comparisons of Circular Transmit and Linear Receive Compact Polarimetric SAR Features for Oil Slicks Discrimination. J. Sens. 2015, 2015, 1–14. [Google Scholar] [CrossRef]
- Shirvany, R.; Chabert, M.; Tourneret, J.Y. Ship and Oil-Spill Detection Using the Degree of Polarization in Linear and Hybrid/Compact Dual-Pol SAR. IEEE J.-Stars. 2012, 5, 885–892. [Google Scholar] [CrossRef] [Green Version]
- Yin, J.; Yang, J.; Zhou, Z.; Song, J. The Extended Bragg Scattering Model-Based Method for Ship and Oil-Spill Observation Using Compact Polarimetric SAR. IEEE J.-Stars. 2015, 8, 3760–3772. [Google Scholar] [CrossRef]
- Guo, H.; Wu, D.; An, J. Discrimination of Oil Slicks and Lookalikes in Polarimetric SAR Images Using CNN. Sensors 2017, 17, 1837. [Google Scholar] [CrossRef] [PubMed]
- Mahdianpari, M.; Salehi, B.; Mohammadimanesh, F.; Motagh, M. Random forest wetland classification using ALOS-2 L-band, RADARSAT-2 C-band, and TerraSAR-X imagery. ISPRS J. Photogramm. Remote Sens. 2017, 130, 13–31. [Google Scholar] [CrossRef]
- Wang, W.; Yang, X.; Li, X.; Chen, K.; Liu, G.; Li, Z.; Gade, M. A Fully Polarimetric SAR Imagery Classification Scheme for Mud and Sand Flats in Intertidal Zones. IEEE Trans. Geosci. Remote Sens. 2017, 55, 1734–1742. [Google Scholar] [CrossRef]
- Chen, W.; Li, X.; He, H.; Wang, L. Assessing Different Feature Sets’ Effects on Land Cover Classification in Complex Surface-Mined Landscapes by ZiYuan-3 Satellite Imagery. Remote Sens. 2017, 10, 23. [Google Scholar] [CrossRef]
- Chen, W.; Li, X.; He, H.; Wang, L. A Review of Fine-Scale Land Use and Land Cover Classification in Open-Pit Mining Areas by Remote Sensing Techniques. Remote Sens. 2017, 10, 15. [Google Scholar] [CrossRef]
- Li, D.; Zhang, Y. Random Similarity Between Two Mixed Scatterers. IEEE Geosci. Remote Sens Lett. 2015, 12, 2468–2472. [Google Scholar]
- Tong, S.; Chen, Q.; Liu, X. Sea oil spill detection using self-similarity parameter of polarimetric sar data. Int. Arch. Photogramm. Remote Sens. Spat. Inform. Sci. 2018, 42, 1661–1666. [Google Scholar]
- Breiman, L. Random Forests. Mach. Learn. 2001, 45, 5–32. [Google Scholar] [CrossRef] [Green Version]
- Yang, J.; Peng, Y.N.; Lin, S.M. Similarity between two scattering matrices. Electron. Lett. 2001, 37, 193–194. [Google Scholar] [CrossRef]
- Chen, Q.; Jiang, Y.M.; Zhao, L.J.; Kuang, G.Y. Polarimetric Scattering Similarity Between a Random Scatterer and a Canonical Scatterer. IEEE Geosci. Remote Sens Lett. 2010, 7, 866–869. [Google Scholar] [CrossRef]
- Nunziata, F.; Sobieski, P.; Migliaccio, M. The Two-Scale BPM Scattering Model for Sea Biogenic Slicks Contrast. IEEE Trans. Geosci. Remote Sens. 2009, 47, 1946–1956. [Google Scholar] [CrossRef]
- Nunziata, F.; Gambardella, A.; Migliaccio, M. On the Mueller Scattering Matrix for SAR Sea Oil Slick Observation. IEEE Geosci. Remote Sens Lett. 2008, 5, 691–695. [Google Scholar] [CrossRef]
- Zou, T.; Yang, W.; Dai, D.; Sun, H. Polarimetric SAR Image Classification Using Multifeatured Combination and Extremely Randomized Clustering Forests. Eurasip J. Adv. Signal Pr. 2009, 2010, 1–9. [Google Scholar]
- Zhao, L.; Yang, J.; Li, P.; Huang, X.; Shi, L.; Zhang, L. Characterization of the coherent scattering induced by ridging patterns in agriculture by the use of polarimetric SAR imagery. Int. J. Remote Sens. 2017, 38, 3502. [Google Scholar] [CrossRef]
- Houborg, R.; Mccabe, M.F. A hybrid training approach for leaf area index estimation via Cubist and random forests machine-learning. ISPRS J. Photogramm. Remote Sens. 2017, 135, 173–188. [Google Scholar] [CrossRef]
- Rossel, R.A.V.; Behrens, T.; Guerrero, C.; Viscarra Rossel, R.A.; Mouazen, A.M. Using data mining to model and interpret soil diffuse reflectance spectra. Geoderma 2010, 158, 46–54. [Google Scholar] [CrossRef]
- Espeseth, M.M.; Skrunes, S.; Jones, C.E.; Brekke, C.; Holt, B.; Doulgeris, A.P. Analysis of Evolving Oil Spills in Full-Polarimetric and Hybrid-Polarity SAR. IEEE Trans. Geosci. Remote Sens. 2017, 55, 1–21. [Google Scholar] [CrossRef]
- Dabboor, M.; Howell, S.; Shokr, M.; Yackel, J. The Jeffries–Matusita distance for the case of complex Wishart distribution as a separability criterion for fully polarimetric SAR data. Int J. Remote Sens. 2014, 35, 6859–6873. [Google Scholar]
- Powers, D.M.W. Evaluation: From Precision, Recall and F-Factor to ROC, Informedness, Markedness & Correlation. J. Mach. Learn. Technol. 2011, 2, 2229–3981. [Google Scholar]
- Li, G.; Li, Y.; Liu, B.; Hou, Y.; Fan, J. Analysis of Scattering Properties of Continuous Slow-Release Slicks on the Sea Surface Based on Polarimetric Synthetic Aperture Radar. Isprs Int. J. Geo-Inf. 2018, 7, 237. [Google Scholar] [CrossRef]
- Skrunes, S.; Brekke, C.; Jones, C.E.; Holt, B. A Multi-sensor Comparison of Experimental Oil Spills in Polarimetric SAR for High Wind Conditions. IEEE J.-Stars. 2016, 9, 4948–4961. [Google Scholar]
- Skrunes, S.; Brekke, C.; Jones, C.E.; Espeseth, M.M.; Holt, B. Effect of wind direction and incidence angle on polarimetric SAR observations of slicked and unslicked sea surfaces. Remote Sens. Environ. 2018, 213, 73–91. [Google Scholar] [CrossRef]
- Minchew, B.; Jones, C.E.; Holt, B. Polarimetric Analysis of Backscatter from the Deepwater Horizon Oil Spill Using L-Band Synthetic Aperture Radar. IEEE Trans. Geosci. Remote Sens. 2012, 50, 3812–3830. [Google Scholar] [CrossRef]
- Buono, A.; Nunziata, F.; de Macedo, C.R.; Velotto, D.; Migliaccio, M. A Sensitivity Analysis of the Standard Deviation of the Copolarised Phase Difference for Sea Oil Slick Observation. IEEE Trans. Geosci. Remote Sens. 2018, 1–9. [Google Scholar] [CrossRef]


| Categories | Polarimetric Features | Oil Slicks | Look-Alikes |
|---|---|---|---|
| Backscattered energy | Low | High | |
| Low | High | ||
| Correlation between different channels | Low | High | |
| Low | High | ||
| Scattering mechanism or polarized state | Low | High | |
| High | Low | ||
| Low | High |
| Sensor | Number | Date, Time UTC | Relative Direction | Wind Speed | Incidence Angle |
|---|---|---|---|---|---|
| Radarsat-2 | / | 8 June 2011 17:27 | / | 1.6–3.3 m/s | 35.1–35.9° |
| UAVSAR | #1 | 10 June 2015 06:13 | Downwind | 9–11 m/s | 39.6–43.5° |
| #2 | 10 June 2015 07:05 | Downwind | 9–11 m/s | 29.7–34.4° | |
| #3 | 10 June 2015 07:17 | Upwind | 9–11 m/s | 28.9–34.2° |
| Method | DR | FAR | |
|---|---|---|---|
| FOS | 88.62% | 9.99% | 89.31% |
| GRK | 83.44% | 6.38% | 88.23% |
| EBM | 75.71% | 14.15% | 80.46% |
| SRF | 90.54% | 4.43% | 92.99% |
| Method | DR | FAR | |
|---|---|---|---|
| FOS | 45.63% | 40.70% | 51.57% |
| GRK | 76.96% | 20.74% | 78.09% |
| EBM | 46.01% | 7.45% | 61.46% |
| SRF | 74.47% | 8.15% | 82.25% |
© 2019 by the authors. Licensee MDPI, Basel, Switzerland. This article is an open access article distributed under the terms and conditions of the Creative Commons Attribution (CC BY) license (http://creativecommons.org/licenses/by/4.0/).
Share and Cite
Tong, S.; Liu, X.; Chen, Q.; Zhang, Z.; Xie, G. Multi-Feature Based Ocean Oil Spill Detection for Polarimetric SAR Data Using Random Forest and the Self-Similarity Parameter. Remote Sens. 2019, 11, 451. https://0-doi-org.brum.beds.ac.uk/10.3390/rs11040451
Tong S, Liu X, Chen Q, Zhang Z, Xie G. Multi-Feature Based Ocean Oil Spill Detection for Polarimetric SAR Data Using Random Forest and the Self-Similarity Parameter. Remote Sensing. 2019; 11(4):451. https://0-doi-org.brum.beds.ac.uk/10.3390/rs11040451
Chicago/Turabian StyleTong, Shengwu, Xiuguo Liu, Qihao Chen, Zhengjia Zhang, and Guangqi Xie. 2019. "Multi-Feature Based Ocean Oil Spill Detection for Polarimetric SAR Data Using Random Forest and the Self-Similarity Parameter" Remote Sensing 11, no. 4: 451. https://0-doi-org.brum.beds.ac.uk/10.3390/rs11040451