Article

Source Parameter Estimation of the 2009 Ms6.0 Yao’an Earthquake, Southern China, Using InSAR Observations

1
College of Geology Engineering and Geomatics, Chang’an University, Xi’an 710054, China
2
Department of Earth Sciences, Southern Methodist University, Dallas, TX 75275, USA
3
Second Monitoring Center, China Earthquake Administration, Xi’an 710054, China
*
Author to whom correspondence should be addressed.
Submission received: 23 January 2019 / Revised: 17 February 2019 / Accepted: 20 February 2019 / Published: 23 February 2019
(This article belongs to the Special Issue Remote Sensing of Tectonic Deformation)

Abstract

:
On 9 July 2009, an Ms6.0 earthquake occurred in mountainous area of Yao’an in Yunnan province of Southern China. Although the magnitude of the earthquake was moderate, it attracted the attention of many Earth scientists because of its threat to the safety of the population and its harm to the local economy. However, the source parameters remain poorly understood due to the sparse distribution of seismic and GNSS (Global Navigation Satellite System) stations in this mountainous region. Therefore, in this study, the two L-band ALOS (Advanced Land Observing Satellite-1) PALSAR (Phased Array type L-band Synthetic Aperture Radar) images from an ascending track is used to investigate the coseismic deformation field, and further determine the location, fault geometry and slip distribution of the earthquake. The results show that the Yao’an earthquake was a strike-slip event with a down-dip slip component. The slip mainly occurred at depths of 3–8 km, with a maximum slip of approximately 70 cm at a depth of 6 km, which is shallower than the reported focal depth of ~10 km. An analysis of the seismic activity and tectonics of the Yao’an area reveals that the 9 July 2009 Yao’an earthquake was the result of regional stress accumulation, which eventually led to the rupture of the northwestern most part of the Maweijing fault.

Graphical Abstract

1. Introduction

An Ms6.0 earthquake occurred in Yao’an of Yunnan province of Southern China on 9 July 2009. The hypocenter was approximately located 25.33°N, 101.03°E at a depth of ~10 km. The earthquake caused ~345 injuries and affected ~800,000 people, with direct economic losses of ~0.3 billion USD [1].
In recent years, many geophysical and geological studies have revealed various important aspects of the Yao’an earthquake. The aftershock sequence and three-dimensional velocity structure of the source were explored [2]. Pre-earthquake gravity changes lasting ~three years in the western part of the epicenter were studied using mobile gravity data from 2005 to 2009 [3]. Cao and Mao comprehensively probed the structural, focal mechanism and seismicity, and suggested that the 2009 earthquake is a northwestern extension of the rupture of the fault responsible for the 2000 Yao’an Ms6.5 earthquake [4]. Variations of seismic surface wave velocity in Yunnan before the 2009 earthquake were investigated using the ambient noise interferometry [5]. Li and Wang acquired seismic phase data of the earthquake sequence using the sliding fitting method, and reported that the seismic fault is a high angle dextral strike slip fault with NW strike and NE dip [6]. Cao and Mao also investigated the characteristics of the earthquake precursors and macroscopic anomalies and suggested that the Yao’an earthquake corresponds well to the tectonic background of frequent earthquakes in Yunnan province [7].
Previous studies have applied different methods to determine the aftershock sequence [2], focal mechanism [3], and the seismic phase data of the earthquake sequence of the Yao’an earthquake [6]. Additionally, the Earth’s structure of the Yao’an region has been studied, such as the three-dimensional velocity structure of the source [2], gravity changes before the earthquake [3], deep structures [4], seismic surface wave velocity [5], and earthquake precursors and macroscopic anomalies [7]. These investigations revealed preliminary geometric features and underground structures of the earthquake. Overall, they are of importance for better understanding of the geodynamic context of the region and the regional tectonics. However, some important issues still remain to be resolved, such as the spatial characteristics of the coseismic deformation field, and the distribution of slip on fault. Addressing these issues is of high significance for determining the mechanism of the Yao’an earthquake.
Coseismic deformation fields caused by the Yao’an earthquake are unknown because of the sparseness of geodetic arrays in this remote area. Therefore, using satellite-based monitoring techniques, such as InSAR (Interferometric Synthetic Aperture Radar), is very suitable in this case [8,9]. Interferometric Synthetic Aperture Radar has been well known for imaging coseismic displacements and estimating source parameters since the 1992 Mw7.3 Landers earthquake ([10,11,12,13,14,15]). In this study, the InSAR technique was used to measure the coseismic deformation characteristics of the Yao’an earthquake. Under the constraints of the observed surface deformation patterns from InSAR, source geometries were estimated and inversions were subsequently performed to retrieve the slip distributions. Finally, the characteristics of the earthquake derived from InSAR inversion are discussed along with the results of geological and geophysical, Coulomb stress modeling, and the regional tectonics of frequent earthquakes in Yao’an area studies.

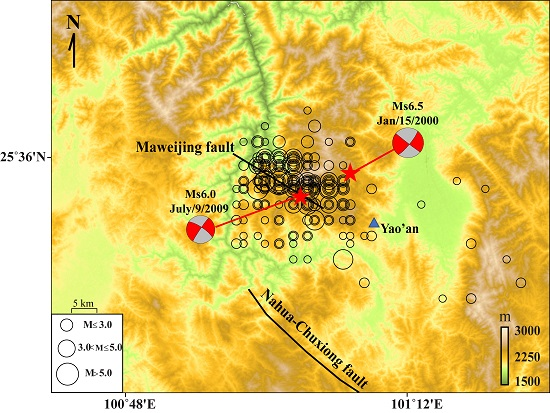
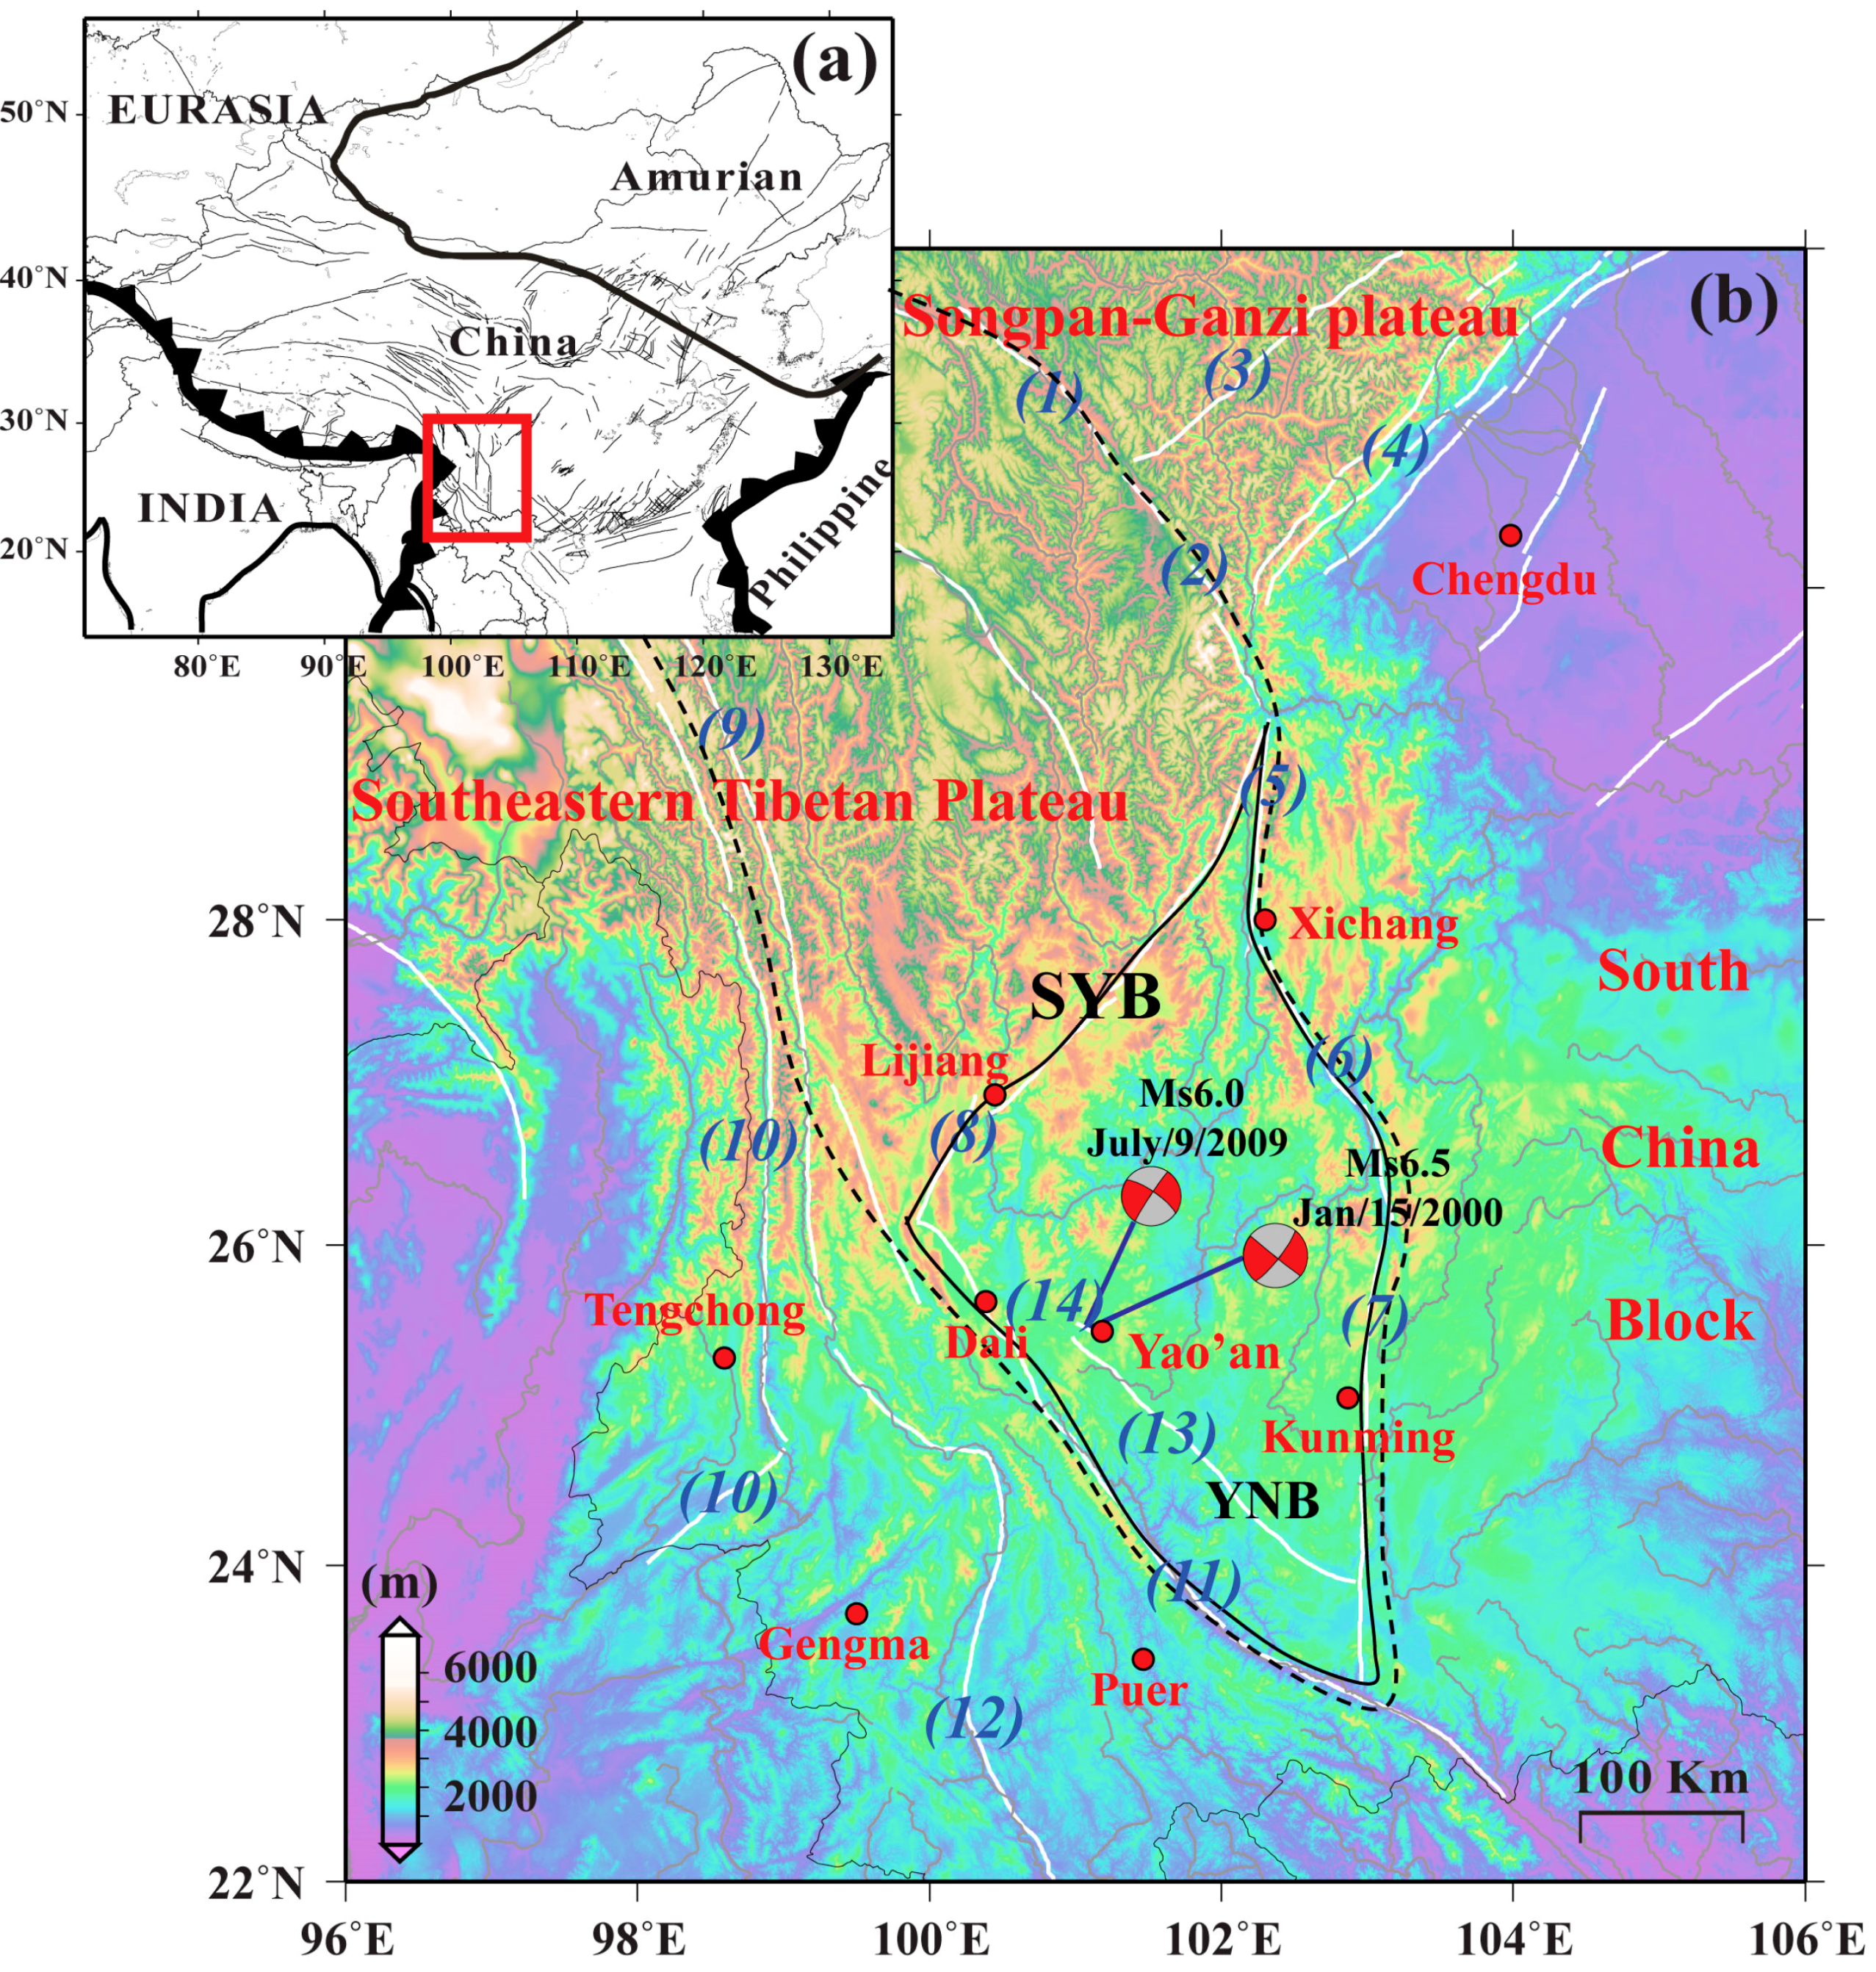
2. General Tectonic Background

The 2009 Ms6.0 Yao’an earthquake occurred in the southern part of the Yunnan block, part of the Sichuan-Yunnan block [16]. This region is tectonically active and shows strong crustal deformation, as well as differential tectonic deformation patterns [16]. The seismicity and tectonics of this area are also complex [17,18].
The Sichuan–Yunnan block is enclosed by several faults, such as the Lijiang–Xiaojinhe, Anninghe, Xiaojiang, and Red River faults, as shown in Figure 1. The strike-slip rates of these major faults have been studied through geological observations. The right-lateral strike slip rates of the Lijiang–Xiaojinhe, Red River faults are 3.8 ± 0.7 mm/year and 3.5 ± 1.5 mm/year, respectively [18,19,20]. The left-lateral strike slip rates of the Anninghe and Xiaojiang faults are about 6.5 ± 1.0 mm/y and 10 ± 2.0 mm/year, respectively [21,22]. The occurrence of frequent earthquakes is also typically associated with these active faults. For example, historical earthquake records reveal that almost 20 earthquakes (M > 6) have occurred along the Xiaojiang fault zone over the past 500 years [21,23,24,25]. Recent earthquakes occurring within the Sichuan–Yunnan block include the 2000 Ms6.5 Yao’an, 2001 Ms6.0 Yongsheng, 2003 Ms6.2 Dayao, and 2009 Ms6.0 Yao’an earthquakes. The 2009 Ms6.0 Yao’an earthquake occurred along the Maweiqing fault, which is located on southwestern Yunnan block, parallel to the Red River fault [6].
In addition to the strong crustal deformation and seismic activities, volcanism is also frequent in this region. Geological and geophysical studies have shown that eruptions occurred around the southwestern Yunnan block around the Quaternary period [17,26], which were controlled by faults [27,28,29].

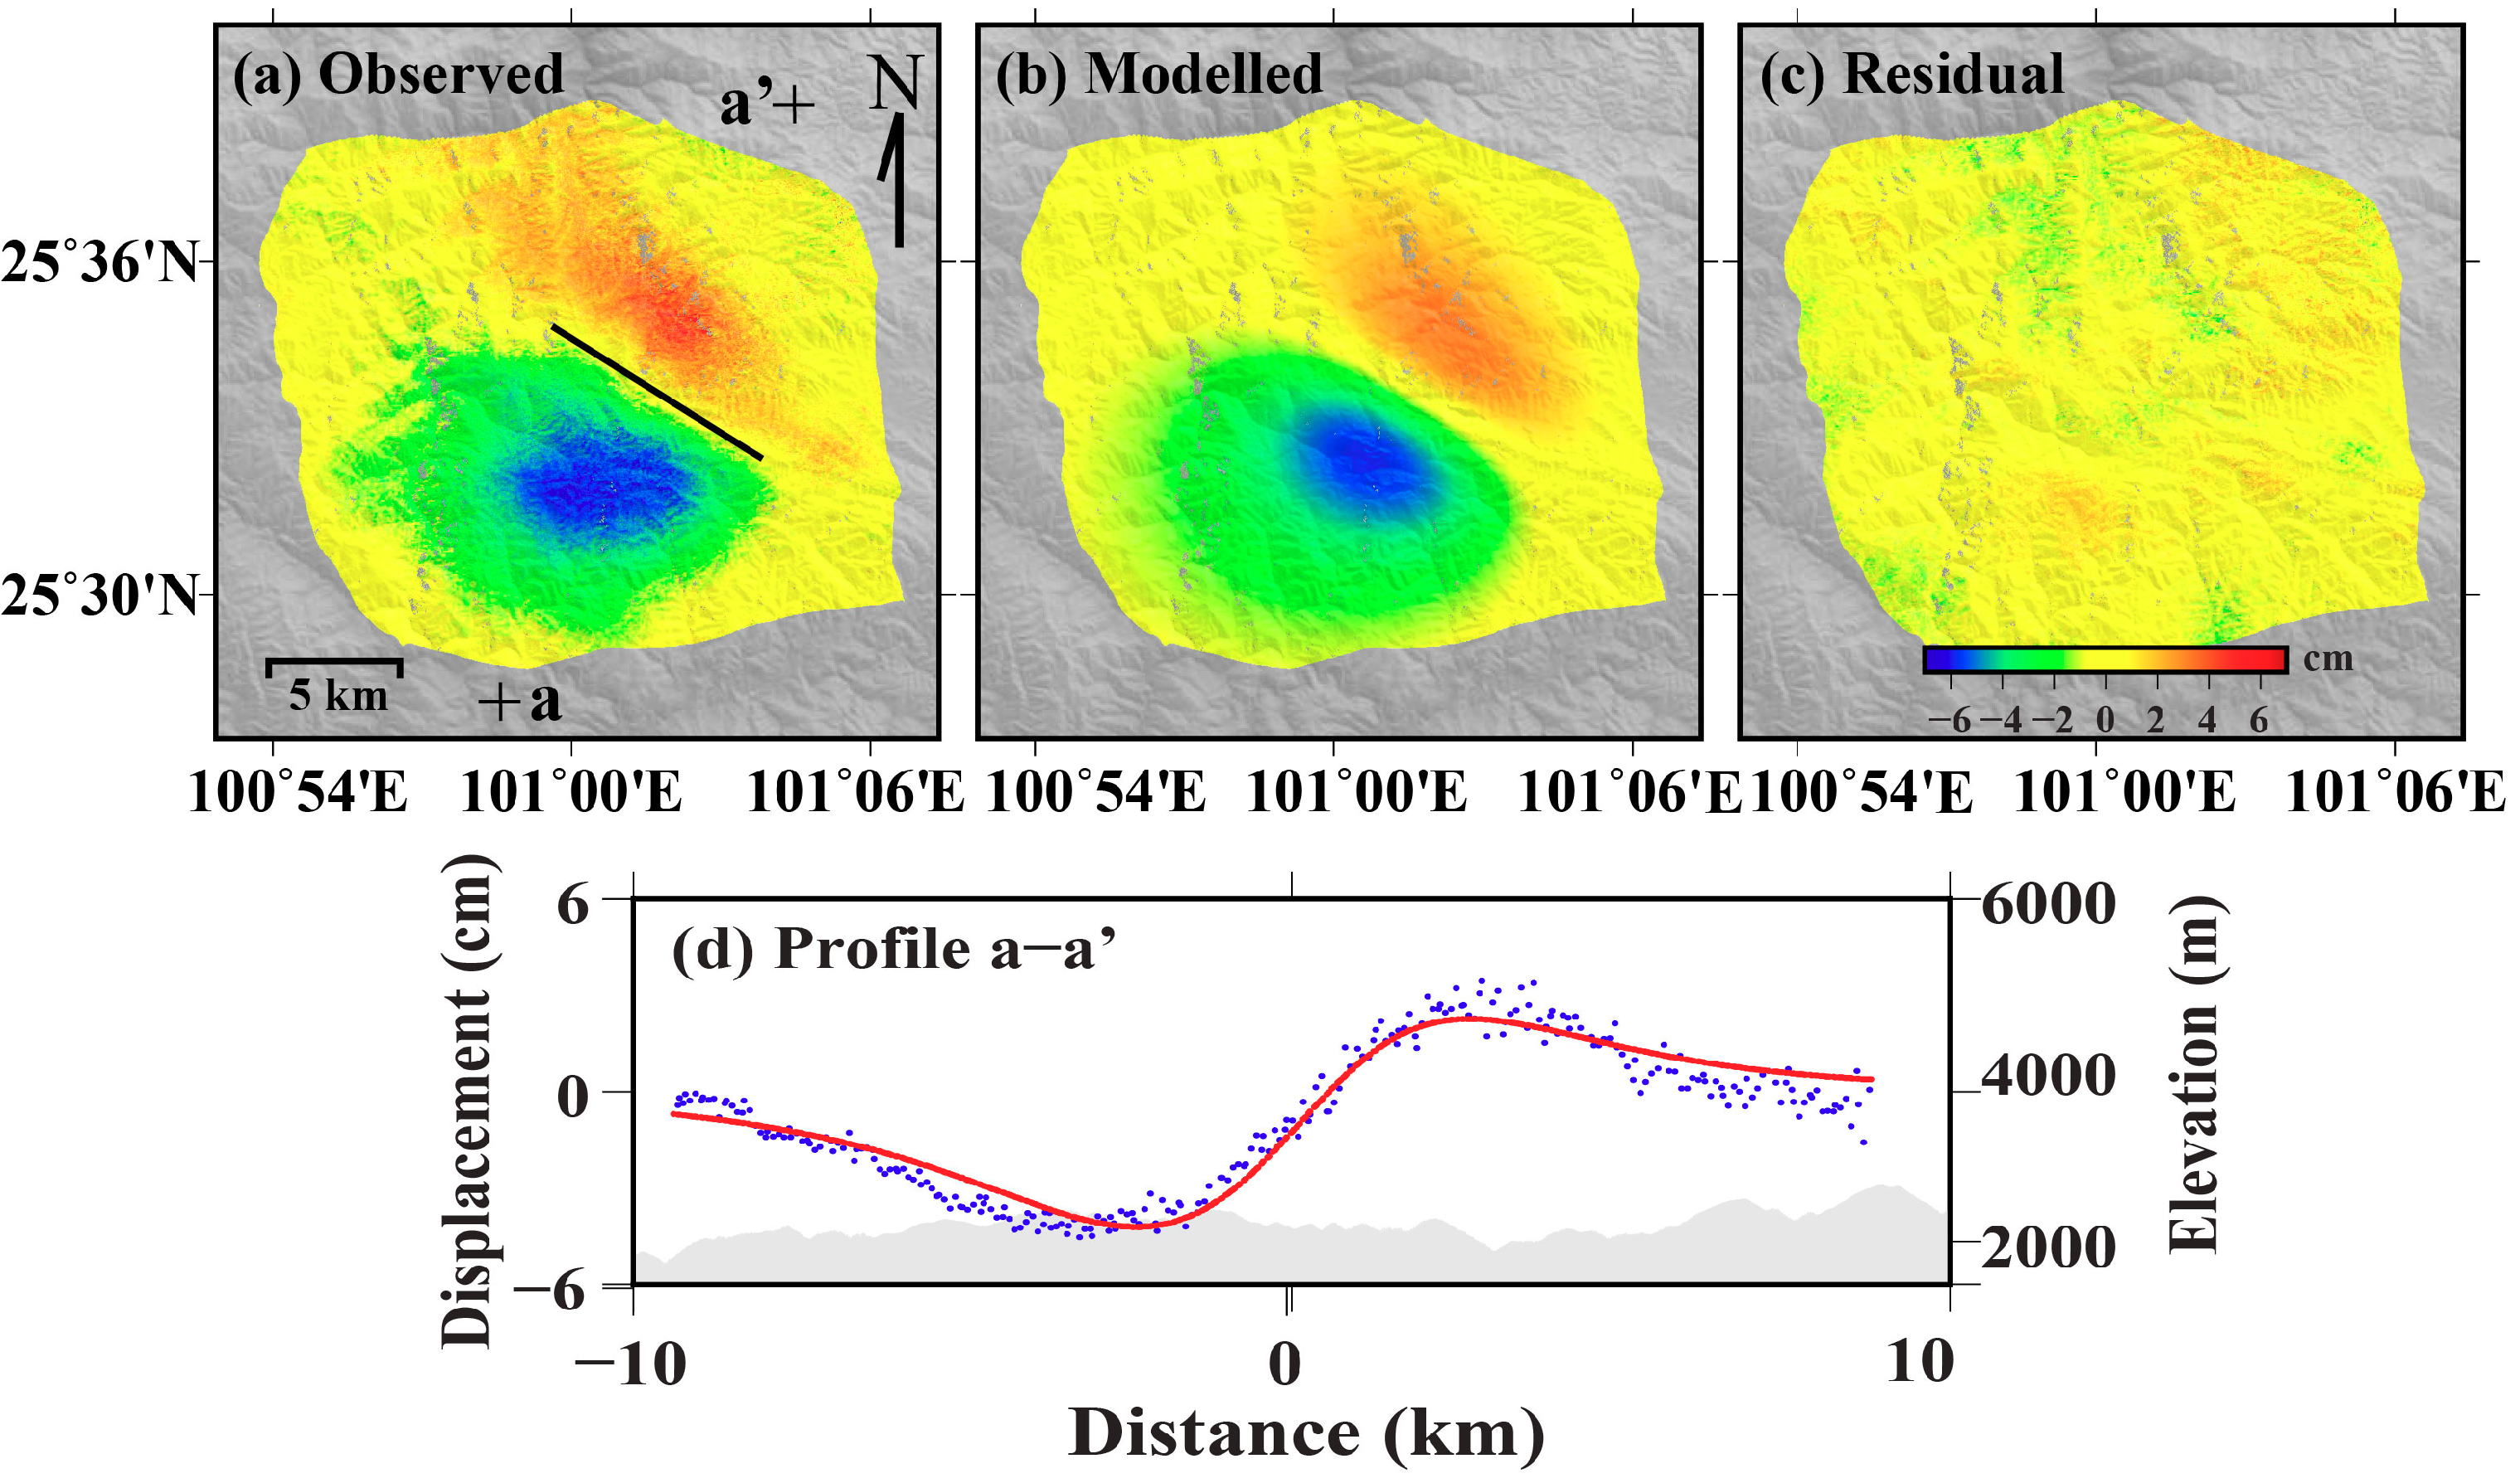
3. Interferometric Synthetic Aperture Radar Data and Analysis

In this study, two overlapping frames of L-band ALOS PALSAR images from an ascending track acquired on 19 October 2008 and 22 July 2009 were selected. Detailed parameters of the produced interferogram (Figure 2) are shown in Table 1.
The two-pass InSAR approach using ALOS PALSAR data was applied to generate the interferogram containing ground surface deformation during the seismic event based on GAMMA software [31]. The Shuttle Radar Topography Mission (SRTM) 1-arcsec (~30 m) data were used to remove topographic phase from the interferogram. An adaptive filtering method was used to reduce phase noise. Phase unwrapping was performed using the minimum cost flow algorithm [32]. Residual orbit errors and ionosphere-related noises were corrected by a 2nd order polynomial based on the assumption that the InSAR phase in the far field is negligible [33,34].
Figure 2 shows the interferogram, mapping the coseismic deformation pattern for the 9 July 2009 event. Two significant small-scale, oval-shaped deformation lobes are observable. The oval-shaped signals display both positive and negative displacement reaching up to 7 cm along the line-of-sight (LOS). The up lobe and down lobe represent displacement moving away from and towards the satellite, respectively. Based on spatial and temporal coincidence with the seismic event from GCMT (Global Centroid Moment Tensor) catalogue, we infer that the local, oval-shaped signal was caused by the earthquake that occurred on 9 July 2009.

4. Source Modeling and Inversion Analysis

Earthquakes occur when the stress exceeds the frictional resistance of the fault, resulting in fault dislocation. In order to further understand the tectonics of the Yao’an region, a reasonable source model based on InSAR observations is required. Taking computation efficiency and inversion feasibility into consideration, we first used a quadtree sampling approach [35] to produce a manageable data set of appropriate spatial resolution. However, this fails to capture the main deformation pattern at a sufficiently high resolution. Instead, we sample the near-field area with a dense regular spacing grid and the far-field area with a sparse regular spacing grid. The modeling was executed in two steps. First, the fault is regarded as a uniform slip plane to establish a uniform model, and then the best-fit fault parameters are obtained. Second, the fault is further divided into several patches to establish a distribution model based on the fault geometry from the uniform model, and the slip on each patch is estimated with a slip distribution model.

4.1. Uniform Slip Model

Based on the results of previous geological and geophysical investigations, we can obtain the approximate geometric structure of the fault, i.e., the location, length, strike angle, and dip angle [1,2,6]. The results of these investigations will be used to determine intervals for parameter inversion (Table 2). Referring to the pattern of the observed deformation, we assume that fault could be interpreted as a single rectangular plane with a uniform slip embedded in a homogeneous, isotropic, elastic half-space [36]. The single rectangular plane could be defined according to nine parameters: Length, width, depth, strike, dip, slip magnitude (dip- and strike-slip along the fault) and location (two parameters). To find the optimal parameters and their uncertainties, the nine parameters were determined by minimizing the squared misfits between the observed and predicted LOS deformations using the downhill simplex method and Monte Carlo simulations [37]. Here, the root mean square error (RMSE) was employed as the prediction-fit criterion. Table 2 shows the modeled parameters determined from 106 independent runs of the open-source Geodetic Bayesian Inversion Software (https://comet.nerc.ac.uk/downloadgbis/).
The observed, modeled, and residual interferograms of the uniform model are shown in Figure 3. The uniform model fits the observed interferogram reasonably well. Table 2 shows the optimal solutions of the nine parameters and their standard deviation values. According to the uncertainties of the parameters and the good consistency between the simulation and observation, we consider that the parameters of the inversion are reasonable. The optimal rectangular plane is vertical and strikes along the northwest-southeast, and both of which are fixed in the follow-on inversion of distributed slip.

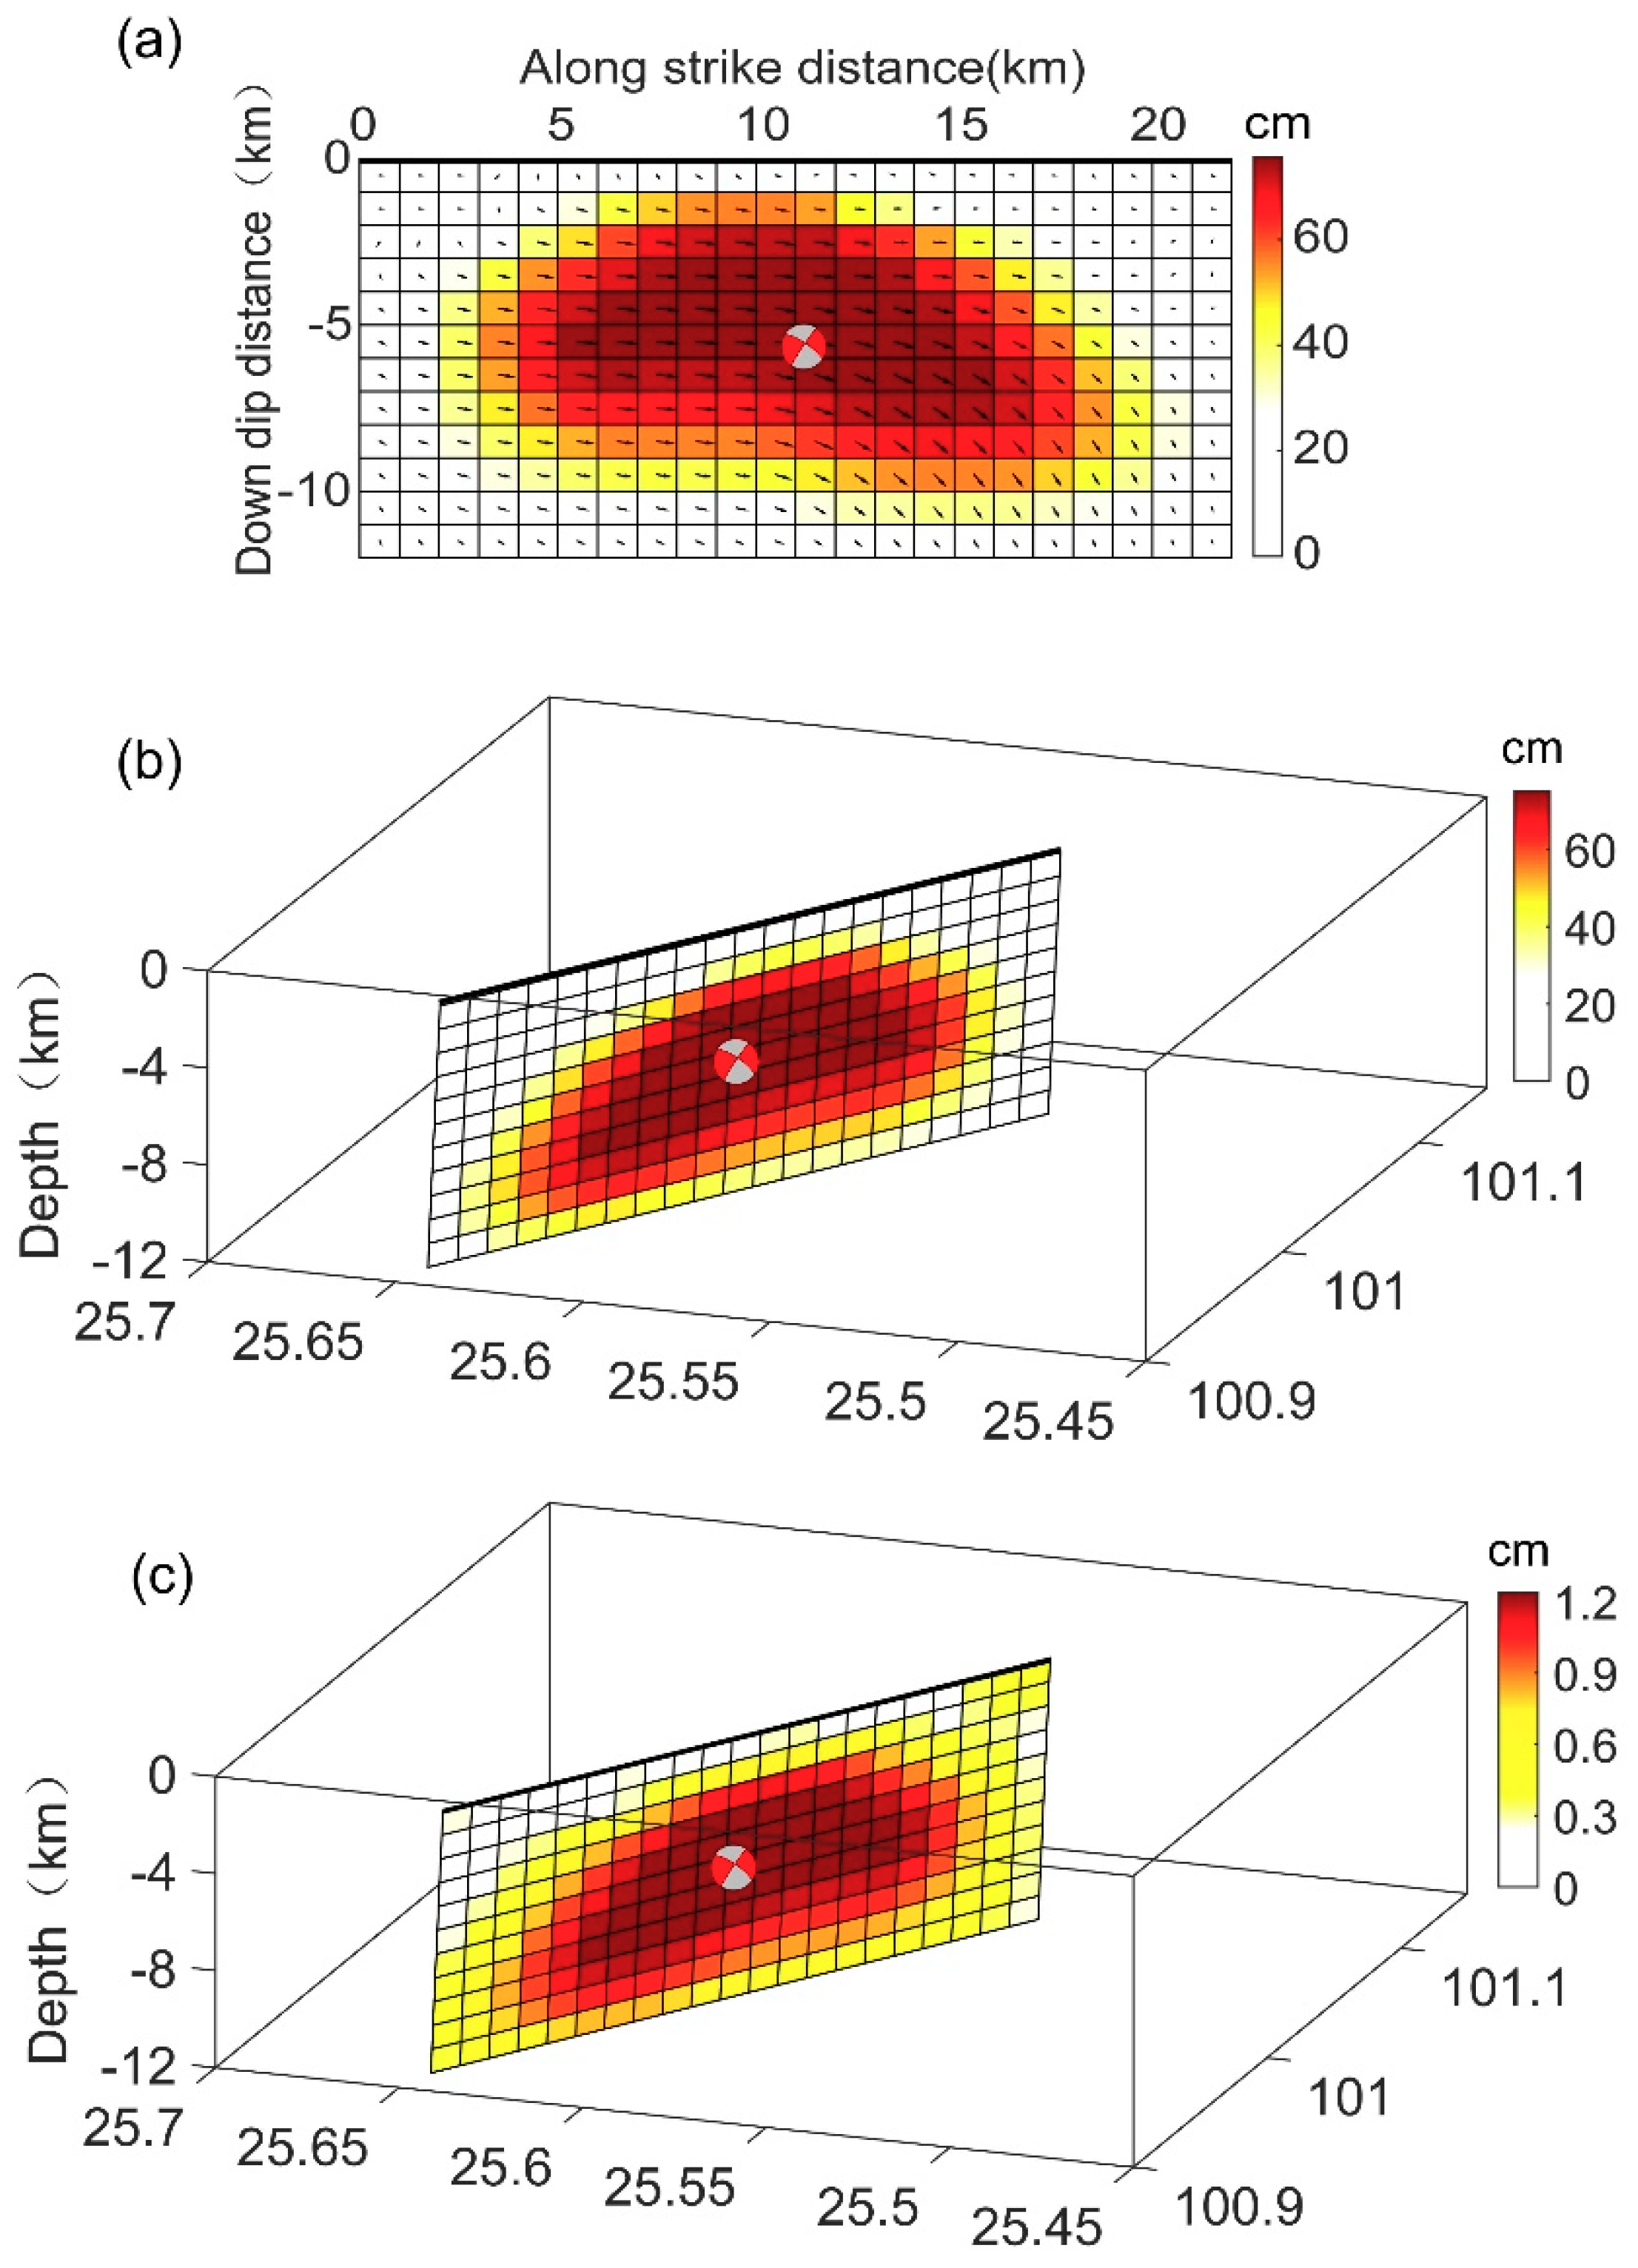
4.2. Distribution Slip Model

Although the uniform slip model can provide a first-order fit to the observed deformation pattern (optimal strike angle and dip angle), the real physical activity properties of a tectonic fault should not reflect a homogeneous slip on a sharply bounded fault plane. Therefore, we further established a more realistic model that discretized the fault into several sub-faults to describe the uneven slip at different depths and locations of fault planes. Here, we adopted the Steepest Decent Method (SDM) geodetic inversion code developed by the authors of Reference [38] to establish the distribution models, which has been successfully applied to many fault inversion analyses (e.g., [39,40,41,42,43]). In the process of the inversion, a smoothing constraint on the slip was applied between adjacent sub-faults to stabilize the inversion. Figure 4 shows an optimal smoothing factor, which was determined using the compromise curve between the roughness of the dislocation model and the relative fitting residuals. It should be noted there is other ways to determine the smoothing factor such as the one based on strop drop [44]. Moreover, we used CRUST1.0 [45] to characterize the stratification of the crust in Yao’an area.
Using the fault geometry (optimal strike angle and dip angle) determined through the uniform slip modeling, we extended the fault plane along the strike and down-dip by increasing its total length to 22 km and its down-dip width to 12 km. The fault plane is discretized into 1 km sub-faults in the along-strike and down-dip directions. Then, the slip on all of the small sub-faults was calculated using the SDM (Steepest Decent Method) inversion code [38].
Surface displacements simulated from the distribution slip model are shown in Figure 5b and their comparisons against the InSAR observations are shown in Figure 5a. The deformation predicted by the distribution model was more consistent with the InSAR observations than the uniform slip modeling result (Figure 3b). The residual between the observed and modeled was small (Figure 5c). The 3D slip distribution is shown in Figure 6. Slips on the fault planes are smooth and do not exhibit much complexity. Most of the slip occurred at depths of 3 to 8 km, with a maximum slip of approximately 70 cm at a depth of 6 km. The seismic moment based on the distributed slip is 5.56 × 10¹⁷ Nm, corresponding to Mw5.8, which is comparable to seismological estimates of Mw5.7 (from USGS, United States Geological Survey). In order to estimate the uncertainty of the slip distribution, we adopted the Monte Carlo Method by adding random noise to the inversions. Error analysis with 1σ uncertainty showed that the maximum standard deviation is ~1.2 cm, which indicates that the distribution slip was well retrieved (Figure 6c).

5. Discussions

5.1. Seismic Activity in Yao’an Area

The displacement profile in Figure 2 does not show any discontinuity, implying that the fault did not break the surface. This phenomenon is consistent with the results from field investigation showing the absence of significant seismic ruptures at the surface after the Yao’an earthquake [1]. The optimal strike angle and dip angle determined by the rectangular dislocation model constrained by InSAR observations are similar to the results of previous geological and geophysical investigations (Table 3).
During the period from 2000 to 2009, five Ms > 6.0 earthquakes occurred within the Yunnan block [6]. It should be noted that on 15 January 2000, an Ms6.5 earthquake occurred in the Yao’an area, towards the NEE of the 2009 Yao’an earthquake (Figure 7). The focal mechanisms of the 2000 and 2009 Yao’an earthquakes are similar, suggesting that the two earthquakes have occurred on the same fault, namely the Maweijing fault with a NW-trending high-angle dextral strike-slip [6,46]. However, the epicenter of 2000 Ms6.5 earthquake is about 5 km away from the Maweijing fault, suggesting a possible error in the reported earthquake location. The NW-striking fault plane of the 2009 Yao’an earthquake is approximately consistent with distribution of the aftershocks [6,46] (Figure 7). It should be noted that the aftershock data are from the China Seismic Network. The seismic monitoring stations were sparse and the observation accuracy was relatively poor in 2009. Therefore, the aftershock locations, especially the depth, have large uncertainties, while the number of earthquakes should be accurate. Hence we only analyzed the approximate distribution of the aftershocks with respect to the fault geometry of the 2009 Yao’an earthquake inferred from InSAR. We did not analyze the information related to the aftershock depth because the depth estimates were extremely unreliable. The geological survey, aerial image interpretation of the earthquake zone, source distribution, and the focal mechanism solution of the earthquake sequence all indicate that the 2009 Ms6.0 Yao’an earthquake ruptured the Maweijing fault [6,46]. The reported hypocenter depth of the 2009 Ms6.0 earthquake is about 10 km [6,46,47,49]. However, the slip distribution from the inversion of the InSAR displacement field suggests that most of the slip took place at depth shallower than 10 km.
It should be noted that we only have one ascending track L-band ALOS PALSAR images to study the 2009 Ms6.0 Yao’an earthquake. This single imaging geometry, together with the complex structure in this mountainous region limit our ability to obtain optimal fault geometry and slip distribution of the 2009 earthquake. Nevertheless, the coseismic slip distribution of this earthquake is obtained for the first time. This is important to better evaluate the seismic hazards in the region.

5.2. Tectonic Dynamics Mechanism

The occurrence of the 2009 Yao’an earthquake is the result of the regional tectonic stress field. The collision between the Indian plate and the Eurasian plate causes the Qinghai–Tibet plateau to move eastward. However, the eastward motion is blocked by the South China block, causing the extrusion of crustal materials towards the southeast [50]. As a result, the Sichuan-Yunnan block is rotated clockwise around the eastern Himalayan tectonic belt [50]. Eastern faults of the Sichuan-Yunnan block are dominated by left-lateral strike-slip activity, whereas western faults are dominated by right-lateral strike-slip activity [51]. The 2009 Yao’an earthquake occurred on the Maweijing fault in the southwestern boundary of the Yunnan block. This fault also has dextral strike-slip, which is consistent with the fault movement of the southwestern part of the Yunnan block. Therefore, it can be concluded that the 2009 Yao’an Ms6.0 earthquake was a result of regional stress accumulation which eventually led to the rupture of the Maweijing fault.
The stress p-axis of the 2009 Yao’an earthquake are approximately in the NNW–SSE direction, which is consistent with the regional tectonic stress field [46]. The Yao’an earthquake and most of its aftershocks occurred in a transition region between low and high velocity zones in the crust [52]. In addition, with the impact of the collision and convergence between the Indian and Eurasian plates, deformation of the Sichuan–Yunnan block is accommodated by complex internal tectonic deformation, southeastward crustal extrusion, and rotation [53,54]. The upper crust of the Sichuan–Yunnan block shows lateral extrusion to the southeast and clockwise rotation around the eastern Himalayan syntaxis. Additionally, the lower crust underlying the Sichuan–Yunnan block deforms by plastic flow [55]. This mechanism drives deformation and fault activity in the upper crust, leading to strain accumulation. The accumulated strain will then be released by frequent earthquakes in the region.

6. Conclusions

The 2009 Ms6.0 Yao’an earthquake occurred in a mountainous area that lacks dense seismic and GPS networks. Therefore, the source parameters, particularly the coseismic deformation characteristics and the distribution of the slip along the fault, remain unknown. The InSAR technology provides important constraints on the source parameters and slip distribution. The inversion results have revealed that the Yao’an earthquake was dominated by right-lateral slip with a down-slip component. The source parameters from the dislocation model indicate that most of the slip occurred at depths of 3–8 km, with a maximum slip of approximately 70 cm at a depth of 6 km.
This study further indicates that InSAR can provide reliable source parameters of shallow, moderate-sized earthquakes in areas that lack dense seismic networks. More importantly, the Yao’an area is an earthquake-prone region, and thus continuous attention should be given to seismic activities in this region. Moreover, with the development of satellite technologies (e.g., GNSS and InSAR), more high-precision observations with better temporal and spatial resolutions could be used to study earthquakes in the mountain area in more detail.

Author Contributions

All the authors participated in editing and reviewing the manuscript. W.Q., Z.L., and J.W.K. conceived and designed the experiments; W.Q., B.Z., J.W. and Z.L. processed the InSAR data and performed the experiments. W.Q., B.Z., and Y.G. inverted the slip model; W.Q., Q.Z., M.H., W.Z. and F.Q analyzed and interpreted the results.

Funding

This study was supported by the National Key Research and Development Program of China (No: 2018YFC1503604), the Nature Science Fund of China (NSFC) (Nos: 41674001, 41731066, 41874017, 41790440, 41504005, 41604001, and 41202189), Natural Science Basic Research Plan in Shaanxi Province of China (No. 2016JM4005), and Special Fund for Basic Scientific Research of Central Universities (Nos. CHD300102268204, CHD310826172202).

Acknowledgments

The Shuler-Foscue Endowment at Southern Methodist University. Some figures were prepared using the public domain Generic Mapping Tools GMT. The SAR images used in this research were provided by the Japanese Aerospace Exploration Agency (JAXA), and the ownership of PALSAR data belongs to METI (Ministry of Economy, Trade and Industry) and JAXA. Prof. Jianjun Wang, from Wuhan University, provides help. Constructive comments from three anonymous reviewers improved the manuscript.

Conflicts of Interest

The authors declare no conflict of interest.

References

  1. Zhang, J.G.; He, B.F.; Zhang, Y.S. Analysis of focal process and disaster features of July 9, 2009 Yao’an Ms 6.0 earthquake, Yunnan, China. Geol. Bull. Chin. 2011, 30, 151–158, (In Chinese with English abstract). [Google Scholar]
  2. Wang, C.Z.; Wu, J.P.; Fang, L.H.; Wang, W.L.; Ming, Y.H.; Zhang, T.Z. Fine Location of Yao’an Earthquake Sequence in 2009 and 3-D P-wave Velocity Structure in Source Area. In Proceedings of the China Geophysical Annual Meeting, Ningbo, China, 17–20 October 2010. (In Chinese). [Google Scholar]
  3. Shen, C.Y.; Tan, H.B.; Hao, H.T.; Li, H.; Yang, G.L.; Xuan, S.B. Mechanism of precursory gravity change before Yao’an Ms6.0 earthquake in 2009. J. Geod. Geodyn. 2011, 31, 17–22, (In Chinese with English abstract). [Google Scholar]
  4. Cao, X.L.; Mao, D.P. Analysis on characteristics of precursory anomalies before Yao’an M 6.5 Earthquake in 2009 in Yunnan Province. Plat. Earthq. Res. 2012, 24, 30–35, (In Chinese with English abstract). [Google Scholar]
  5. Yang, W.; Liu, J.; Shi, H.X.; Zhou, L.Q.; SU, Y.J. Study of surface wave velocity changes before strong earthquake in Yunnan region using ambient noise tomography. Earthquake 2011, 31, 103–111, (In Chinese with English abstract). [Google Scholar]
  6. Li, J.; Wang, Q.C. Seismogenic faults and stress field characteristics of Ms 6.0 Yao’an earthquake sequence in 2009. Acta Seismol. Sin. 2016, 38, 199–207, (In Chinese with English abstract). [Google Scholar]
  7. Cao, X.L.; Mao, D.P. Partial anomalous features before the Ms6.0 earthquake occurred in Yao’an, Yunnan Province. Seism. Geomag. Obs. Res. 2012, 33, 55–61. [Google Scholar]
  8. Massonnet, D.; Feigl, K. Radar interferometry and its application to changes in the Earth’s surface. Rev. Geophys. 1998, 36, 441–500. [Google Scholar] [CrossRef]
  9. Rosen, P.A.; Hensley, S.; Joughin, I.R.; Li, F.K.; Madsen, S.N.; Rodriguez, E.; Goldstein, R.M. Synthetic aperture radar interferometry. Proc. IEEE 2000, 88, 333–380. [Google Scholar] [CrossRef]
  10. Massonnet, D.; Rossi, M.; Carmona, C.; Adragna, F.; Peltzer, G.; Feigl, K.; Rabaute, T. The displacement field of the Landers earthquake mapped by radar interferometry. Nature 1993, 364, 138–142. [Google Scholar] [CrossRef]
  11. Wright, T.J.; Lu, Z.; Wicks, C. Constraining the slip distribution and fault geometry of the Mw 7.9, 3 November 2002, Denali fault earthquake with interferometric synthetic aperture radar and global positioning system data. Bull. Seismol. Soc. Am. 2004, 94, S175–S189. [Google Scholar] [CrossRef]
  12. Biggs, J.; Nissen, E.; Craig, T.; Jackson, J.; Robinson, D.P. Breaking up the hanging wall of a rift-border fault: The 2009 Karonga earthquakes, Malawi. Geophys. Res. Lett. 2010, 37. [Google Scholar] [CrossRef] [Green Version]
  13. Li, Z.; Elliott, J.; Feng, W.; Jackson, J.; Parsons, B.; Walters, R. The 2010 MW 6.8 Yushu (Qinghai, China) earthquake: Constraints provided by InSAR and body wave seismology. J. Geophys. Res. 2011, 116, B10302. [Google Scholar] [CrossRef]
  14. Elliott, J.; Nissen, E.; England, P.; Jackson, J.; Lamb, S.; Li, Z.; Oehlers, M.; Parsons, B. Slip in the 2010–2011 Canterbury earthquakes, New Zealand. J. Geophys. Res. 2012, 117, B03401. [Google Scholar] [CrossRef]
  15. Wen, Y.; Xu, C.; Liu, Y.; Jiang, G. Deformation and source parameters of the 2015 Mw 6.5 earthquake in Pishan, western China, from Sentinel-1A and ALOS-2 Data. Remote Sens. 2016, 8, 134. [Google Scholar] [CrossRef]
  16. Hao, M.; Wang, Q.L.; Shen, Z.K.; Cui, D.X.; Ji, L.Y.; Li, Y.H.; Qin, S.L. Present day crustal vertical movement inferred from precise leveling data in eastern margin of Tibetan Plateau. Tectonophysics 2014, 632, 281–292. [Google Scholar] [CrossRef]
  17. Wang, F.; Peng, Z.; Zhu, R.; He, H.; Yang, L. Petrogenesis and magma residence time of lavas from Tengchong volcanic field (China): Evidence from U series disequilibria and 40Ar/39Ar dating. Geochem. Geophys. Geosyst. 2006, 7, 1–15. [Google Scholar] [CrossRef]
  18. Xu, X.M.; Ding, Z.F.; Shi, D.N.; Li, X.F. Receiver function analysis of crustal structure beneath the eastern Tibetan Plateau. J. Asian Earth Sci. 2013, 73, 121–127. [Google Scholar] [CrossRef]
  19. Ma, B.Q.; Su, G.; Hou, Z.H. Late quaternary slip rate in the central part of the Longmenshan fault zone from terrace deformation along the Minjiang river. Seism. Geol. 2005, 27, 234–242. (In Chinese) [Google Scholar]
  20. Zhou, R.J.; Li, Y.; Densmore, A.L.; Ellis, M.A. Active tectonics of the eastern margin of the Tibetan Plateau. J. Min.Petr. 2006, 26, 40–51. (In Chinese) [Google Scholar]
  21. Song, F.; Wang, Y.; Yu, W.; Cao, Z.; Shen, X.; Shen, J. The Xiaojiang Active Fault Zone; Seismological Press: Beijing, China, 1998; p. 237. (In Chinese) [Google Scholar]
  22. Xu, X.W.; Wen, X.Z.; Zheng, R.Z.; Ma, W.; Song, F.; Yu, G. Pattern of latest tectonic motion and its dynamics for active blocks in Sichuan-Yunnan region, China. Sci. China Ser. D 2003, 46 (Suppl.2), 210–226. [Google Scholar]
  23. Shen, J.; Wang, Y.; Song, F. Characteristics of the active Xiaojiang fault zone in Yunnan, China: A slip boundary for the southeastward escaping Sichuan-Yunnan blocks of the Tibet Plateau. J. Asian Earth Sci. 2003, 21, 1085–1096. [Google Scholar]
  24. Wen, X.; Ma, S.; Xu, X.; He, Y. Historical pattern and behavior of earthquake ruptures along the eastern boundary of the Sichuan-Yunnan faulted-block, southwestern China. Phys. Earth Planet. Inter. 2008, 168, 16–36. [Google Scholar] [CrossRef]
  25. Xie, Y.; Cai, M. Compilation of Historical Materials of Chinese Earthquake, vol.III-2; Seismological Press: Beijing, China, 1987; p. 1427. (In Chinese) [Google Scholar]
  26. Jiang, C. Distribution characteristics of Tengchong area, Yunnan province. J. Seismol. Res. 1998, 8, 107–120. (In Chinese) [Google Scholar]
  27. Chen, X.; Li, J.; Zhao, J. The basement structural characteristic of Sanjiang structure belt and its relationship with strong earthquakes. In Advances in Solid Earth Geophysics in China; Chen, Y.T., Kan, R.J., Teng, J.W., Eds.; Oceanic Press: Beijing, China, 1994; pp. 41–54. (In Chinese) [Google Scholar]
  28. Wang, C.; Huangfu, G. Crustal structure in Tengchong volcanic-geothermal area, western Yunnan, China. Tectonophysics 2004, 380, 69–87. [Google Scholar] [CrossRef]
  29. Yin, A.; Harrison, T.M. Geologic evolution of the Himalayan-Tibetan orogen. Annu. Rev. Earth Planet. Sci. 2000, 28, 211–280. [Google Scholar] [CrossRef]
  30. Zhang, P.Z.; Gan, W.J.; Shen, Z.K. A coupling model of rigid-block movement and continuous deformation: Patterns of the present-day deformation of China’s continent and its vicinity. Acta Geol. Sin. 2005, 79, 748–756. [Google Scholar]
  31. Werner, C.; Wegmüller, U.; Strozzi, T.; Wiesmann, A. GAMMA SAR and interferometric processing software. In Proceedings of the ERS-Envisat Symposium, Gothenburg, Sweden, 16–20 October 2000. [Google Scholar]
  32. Costantini, M.; Rosen, P.A. A generalized phase unwrapping approach for sparse data. In Proceedings of the IEEE 1999 International Geoscience and Remote Sensing Symposium. IGARSS’99, Hamburg, Germany, 28 June–2 July 1999; pp. 267–269. [Google Scholar]
  33. Rosen, P.A.; Hensley, S.; Zebker, H.; Webb, F.H.; Fielding, E.J. Surface deformation and coherence measurements of Kilauea Volcano, Hawaii, from SIR-C radar interferometry. J. Geophys. Res. 1996, 101, 23109–23125. [Google Scholar] [CrossRef]
  34. Lu, Z.; Dzurisin, D. InSAR Imaging of Aleutian Volcanoes: Monitoring a Volcanic Arc from Space; Springer: Chichester, UK, 2014; p. 390. [Google Scholar]
  35. Jonsson, S.; Zebker, H.; Segall, P.; Amelung, F. Fault slip distribution of the Mw 7.2 Hector Mine earthquake estimated from satellite radar and GPS measurements. Bull. Seismol. Soc. Am. 2002, 92, 1377–1389. [Google Scholar] [CrossRef]
  36. Okada, Y. Surface deformation due to shear and tensile faults in a half-space. Bull. Seismol. Soc. Am. 1985, 75, 1135–1154. [Google Scholar]
  37. Press, W.; Teukolsky, S.; Vetterling, W.; Flannery, B. Numerical Recipes in C, the Art of Scientific Computing; Cambridge University Press: New York, NY, USA, 1992; p. 994. [Google Scholar]
  38. Wang, R.; Diao, F.; Hoechner, A. SDM—A geodetic inversion code incorporating with layered crust structure and curved fault geometry. In Proceedings of the EGU General Assembly 2013, Vienna, Austria, 7–12 April 2013. [Google Scholar]
  39. Wang, L.; Wang, R.; Roth, F.; Enescu, B.; Hainzl, S.; Ergintav, S. Afterslip and viscoelastic relaxation following the 1999 M7.4 Izmit earthquake from GPS measurement. Geophys. J. Int. 2009, 178, 1220–1237. [Google Scholar] [CrossRef]
  40. Xu, C.; Liu, Y.; Wen, Y.; Wang, R. Coseismic slip distribution of the 2008 Mw 7.9 Wenchuan earthquake from joint inversion of GPS and InSAR data. Bull. Seismol. Soc. Am. 2010, 100, 2736–2749. [Google Scholar] [CrossRef]
  41. Motagh, M.; Bahroudi, A.; Haghighi, M.H.; Samsonov, S.; Fielding, E.; Wetzel, H.U. The 18 August 2014 Mw 6.2 Mormori, Iran, Earthquake: A thin-skinned faulting in the Zagros Mountain inferred from InSAR measurements. Seismol. Res. Lett. 2015, 86, 775–782. [Google Scholar] [CrossRef]
  42. Ji, L.Y.; Xu, J.; Zhao, Q.; Yang, C.S. Source parameters of the 2003-2004 bange earthquake sequence, central Tibet, China, estimated from InSAR data. Remote Sens. 2016, 8, 516. [Google Scholar] [CrossRef]
  43. Ji, L.Y.; Wang, Q.L.; Xu, J.; Ji, C.W. The July 11, 1995 Myanmar–China earthquake: A representative event in the bookshelf faulting system of southeastern Asia observed from JERS-1 SAR images. Int. J. Appl. Earth Obs. Geoinf. 2017, 55, 43–51. [Google Scholar] [CrossRef]
  44. Adams, M.; Twardzik, C.; Ji, C. Exploring the uncertainty range of coseismic stress drop estimations of large earthquakes using finite fault inversions. Geophys. J. Int. 2017, 1, 86–100. [Google Scholar]
  45. Laske, G.; Masters, G.; Ma, Z.; Pasyanos, M. Update on CRUST 1.0-A1-degree global model of earth’s crust. In Proceedings of the EGU General Assembly 2013, Vienna, Austria, 7–12 April 2013. [Google Scholar]
  46. Qin, S.L.; Zhang, J.G.; Liao, L.X. Analysis on focal mechanism and seismogenic structures of Yao’an earthquake with Ms6.0 2009. Inland Earthq. 2012, 26, 52–61, (In Chinese with English abstract). [Google Scholar]
  47. Zhang, J.G.; Liu, L.F.; Li, X.; Xie, Y.Q. Preliminary study on the seismotectonics of Yao’an and Dayao moderate strong earthquake area. Seismolog. Geol. 2009, 31, 536–543, (In Chinese with English abstract). [Google Scholar]
  48. Pan, R.; Sheng, S.Z.; Wan, Y.G. Seismic fault plane parameters estimating of 2009 Yao’an earthquake. North China Earthq. Sci. 2015, 33, 63–68, (In Chinese with English abstract). [Google Scholar]
  49. Hao, P.; Tian, Q.J.; Fu, Z.X.; Chen, Z.G.; Liu, G.P. Study of Stress Triggering of Strong Aftershocks Following the Yao’ an MS 6.5 Earthquake on January 15, 2000. J. Seismolog. Res. 2004, 27, 246–251. [Google Scholar]
  50. Yao, H.J.; van der Hilst, R.D.; Montagner, J.-P. Heterogeneity and anisotropy of the lithosphere of SE Tibet from surface wave array tomography. J. Geophys. Res. 2010, 115, B12307. [Google Scholar] [CrossRef]
  51. Wang, Y.Z.; Wang, E.N.; Shen, Z.K.; Wang, M.; Gan, W.J.; Qiao, X.J.; Meng, G.J.; Li, T.M.; Tao, W.; Yang, Y.L.; et al. Inversion of current activity rate of major faults in Sichuan-Yunnan region constrained by GPS data. Chinese Sci. D Ser. Earth Sci. 2008, 38, 582–597, (In Chinese with English abstract). [Google Scholar]
  52. Wang, C.Z.; Wu, J.P.; Fang, L.H.; Wang, W.L. Relocation of aftershock s of the 2009 Yaoan Ms6.0 earthquake and 3-D P-wave velocity structure around its source region. Acta Seismol. Sin. 2011, 33, 123–133, (In Chinese with English abstract). [Google Scholar]
  53. Wang, S.; Xu, X.Y.; Hu, J.F. Review on the study of crustal structure and geodynamics models for the southeast margin of the Tibetan Plateau. Chinese J. Geophys. 2015, 58, 4235–4253, (In Chinese with English abstract). [Google Scholar]
  54. Wang, Y.Z.; Wang, E.N.; Shen, Z.K.; Wang, M.; Gan, W.J.; Qiao, X.J.; Meng, G.J.; Li, T.M.; Tao, W.; Yang, Y.L.; et al. GPS-constrained inversion of present-day slip rats along major faults of the Sichuan–Yunnan region. Sci. China Ser. D Earth Sci. 2008, 51, 1267–1283. [Google Scholar] [CrossRef]
  55. Zhang, P.Z. The present tectonic deformation, strain distribution and deep dynamic process in the western Sichuan-Tibet Plateau. Sci. China Ser. D Earth Sci. 2008, 38, 1041–1056. (In Chinese) [Google Scholar]
Figure 1. (a) Tectonic location of the Yao’an and its surroundings in China, as well as the major plate boundaries in and near mainland China. The red box indicates Yao’an and its adjacent tectonic belts (b). The white solid lines represent major active faults [30]. The small red circles represent major cities. The red star indicates Yao’an. The focal mechanism balls represent the 2009 Yao’an Ms6.0 earthquake and 2000 Yao’an Ms6.5 earthquake (GCMT). The characters in italics represent the major faults of the region, such as Ganzi-Yushu (1), Xianshuihe (2), Longriba (3), Longmenshan (4), Anninghe (5), Zemuhe (6), Xiaojinghe (7), Lijiang–Xiaojinhe (8), Jinshajiang (9), Nujiang (10), Red River (11), Lancangjiang (12), Nahua-Chuxiong (13), and Maweijing (14). The block surrounded by the black dotted line is Sichuan-Yunnan block (SYB), which is also called Chuandian Block. The rhombic block enclosed by the black thin solid line is the Yunnan block (YNB), which is also called Diandong Block.
Remotesensing 11 00462 g001
Figure 2. Coseismic interferogram (a) and resampled image (b) of the 2009 Yao’an earthquake.
Remotesensing 11 00462 g002
Figure 3. Coseismic deformation and model for uniform slip inversion of the Yao’an earthquake; (a) Observed coseismic interferogram (the black line represents the modeled fault trace); (b) model synthetic interferogram; (c) residual interferogram between observation and modeling; (d) a–a’ is a profile across the fault trace and the profile of line-of-sight (LOS) displacement (blue dots), model LOS displacement (red dots) and topography (grey).
Remotesensing 11 00462 g003
Figure 4. Trade-off curve between roughness and relative fitting residuals. The cross represents the location of the smooth factor used in modeling.
Remotesensing 11 00462 g004
Figure 5. Coseismic deformation and model for distribution slip inversion of the Yao’an earthquake; (a) Observed coseismic deformation; (b) modeled deformation for distributed slip models; and (c) Residual, which is the difference between (a) and (b).
Remotesensing 11 00462 g005
Figure 6. (a) Slip distributions for a fault plane of 22 km length, 12 km downdip width, and 87° dip; (b) 3-D view of the fault from WSW; (c) 1σ uncertainty in fault slip estimated through a Monte Carlo process with 100 inversions. The thick black line in the top of each subfigure represent the projection of fault trace on the surface.
Remotesensing 11 00462 g006
Figure 7. The focal mechanisms of the 2000 Ms6.5 Yao’an earthquake and 2009 Ms6.0 Yao’an earthquake [47,49], and the earthquake sequence of 2009 Ms6.0 Yao’an earthquake. The blue solid triangle represents the major city.
Remotesensing 11 00462 g007
Table 1. Parameters of the SAR (Synthetic Aperture Radar) interferogram used in this study.
Imaging TimeObservation SatelliteObservation ModelRadar FrequencyPolarization ModePerpendicular BaselineTrack No.
19/10/2008ALOS PALSARStripmap (Fine-beam)L-bandHH728 m482
22/07/2009
Table 2. Source fault parameters and their 2-standard deviations for the 9 July, 2009 Yao’an earthquake.
Parameter (Unit)Intervals of Parameters2009 Ms6.0 Yao’an Earthquake
Length (km)(0–15 km)6.8 ± 1.5
Width (km)(0–10 km)1.1 ± 0.0
Depth (km)(2–6 km)4.0 ± 0.7
Strike (°)(0–360°)301.4 ± 4.3
Dip (°)(−89.9–−0.1°)−87.9 ± 0.8
Strike slip (m)(−2 m–2 m)0.7 ± 0.4
Dip slip (m)(−3–0 m)−0.9 ± 0.4
X (km)(10–17 km)14.1 ± 0.7 *
Y (km)(1–6 km)3.1 ± 0.6 *
* The X-coordinate/Y-coordinate location is the mid-point of top edge of the modeled fault (the magnitude of the dip angle is negative). The longitude and latitude of reference point of the X- and Y-positions are 101.083° and 25.535°, respectively.
Table 3. Comparison of source parameters of the 2009 Ms6.0 Yao’an earthquake
Fault PlaneDifference in Strike (°)Difference in Dip (°)Source
Strike (°)Dip (°)
294.0087.00−7.36−5.1USGS a
294.0087.00−7.36−5.1GCMT b
296.0077.00−5.36−15.1Qin et al. [46]
304.4575.523.09−16.58Zhang et al. [47]
296.6086.60−4.76−5.5Pan et al. [48]
293.0088.00−8.36−4.1Li et al. [6]
301.36−87.9 This study
a United States Geological Survey. b Global Centroid Moment Tensor Catalogue.

