Changes in Snow Phenology from 1979 to 2016 over the Tianshan Mountains, Central Asia


1
State Key Laboratory of Desert and Oasis Ecology, Xinjiang Institute of Ecology and Geography, Chinese Academy of Sciences, 818 South Beijing Road, Urumqi 830011, China
2
University of Chinese Academy of Sciences, Beijing 100049, China
3
Department of Civil and Environmental Engineering and Construction, University of Nevada Las Vegas, 4505 S. Maryland Parkway, Las Vegas, NV 89154-4015, USA
4
CAS Research Center for Ecology and Environment of Central Asia, 818 South Beijing Road, Urumqi 830011, China
5
Ili Station for Watershed Ecosystem Research, Chinese Academy of Sciences, 818 South Beijing Road, Urumqi 830011, China
6
Xinjiang Regional Center of Resources and Environmental Science Instrument, Chinese Academy of Sciences, 818 South Beijing Road, Urumqi 830011, China
*
Author to whom correspondence should be addressed.
Remote Sens. 2019, 11(5), 499; https://0-doi-org.brum.beds.ac.uk/10.3390/rs11050499
Submission received: 2 January 2019
/
Revised: 15 February 2019
/
Accepted: 25 February 2019
/
Published: 1 March 2019
(This article belongs to the Section Remote Sensing in Geology, Geomorphology and Hydrology)
Abstract
:Snowmelt from the Tianshan Mountains (TS) is a major contributor to the water resources of the Central Asian region. Thus, changes in snow phenology over the TS have significant implications for regional water supplies and ecosystem services. However, the characteristics of changes in snow phenology and their influences on the climate are poorly understood throughout the entire TS due to the lack of in situ observations, limitations of optical remote sensing due to clouds, and decentralized political landscapes. Using passive microwave remote sensing snow data from 1979 to 2016 across the TS, this study investigates the spatiotemporal variations of snow phenology and their attributes and implications. The results show that the mean snow onset day (Do), snow end day (De), snow cover duration days (Dd), and maximum snow depth (SDmax) from 1979 to 2016 were the 78.2nd day of hydrological year (DOY), 222.4th DOY, 146.2 days, and 16.1 cm over the TS, respectively. Dd exhibited a spatial distribution of days with a temperature of <0 °C derived from meteorological station observations. Anomalies of snow phenology displayed the regional diversities over the TS, with shortened Dd in high-altitude regions and the Fergana Valley but increased Dd in the Ili Valley and upper reaches of the Chu and Aksu Rivers. Increased SDmax was exhibited in the central part of the TS, and decreased SDmax was observed in the western and eastern parts of the TS. Changes in Dd were dominated by earlier De, which was caused by increased melt-season temperatures (Tm). Earlier De with increased accumulation of seasonal precipitation (Pa) influenced the hydrological processes in the snowmelt recharge basin, increasing runoff and earlier peak runoff in the spring, which intensified the regional water crisis.
1. Introduction
Snow plays a critical role in regional and global water cycles, as well as in climate systems [1,2,3]. Snow cover influences land surface energy budgets and atmospheric circulation patterns due to its high surface albedo and good thermal insulation [4,5,6,7,8]. Snow phenology, i.e., the snow onset day, snow end day, and snow cover duration, is essential in the representation of snow variability and has direct implications on the growth of vegetation, snowmelt timing, freshwater supply, and irrigation in snowmelt-dominated basins [5,9,10,11,12,13,14]. Therefore, it is necessary and meaningful to investigate the spatiotemporal variability of snow phenology.
Compared with the sparse observations of meteorological stations, remote sensing is an effective way to monitor snow dynamics of past decades on regional and global scales [4,8,15,16,17]. Optical remote sensing uses the normalized difference snow index (NDSI) to identify the snow cover extent with a high resolution [18,19]. Snow phenology conditions are mainly influenced by the variability of the snow cover extent [8,20,21]. Increasing temperatures have shortened the snow cover duration (Dd) [6,22], delayed the snow onset day (Do) [23], and resulted in an earlier snow end day (De) [24]. In contrast, enhanced mid-latitude westerlies have caused an enlarged snow cover extent in High Asia and Tibet with prolonged Dd, earlier Do, and later De [25,26,27]. However, the cloud mask and lack of snow depth detection methods limit the application of snow products from optical remote sensing [28,29,30,31]. Passive microwave remote sensing based on the microwave spectral gradient method provides a potential way to monitor the spatiotemporal variations of snow depth and snow cover under cloudy conditions [32,33,34]. The snow depth products retrieved from passive microwave sensors have been successfully applied in vegetation phenology [35,36,37], snow climatology, and snow hydrology [12,31,38,39,40].
Situated in inland Eurasia and far away from the oceans, the Tianshan Mountains (TS) are called the water tower of Central Asia. The main rivers that are recharged by glacier/snow melt water (e.g., the Ili River, Syr Darya River, Amu Darya River, Tarim River, and Chu River) originate from the TS, forming one of the largest irrigated zones in the world [41,42,43]. Previous studies indicated that the TS have experienced a significant warming trend over the past few decades [44,45,46]. The snowfall/precipitation ratio showed a decreasing trend accompanied by increasing temperatures in the TS [47], which intensified glacier and snow melt [2], leading to increasing runoff and earlier peak runoff from glacier/snow melt in these recharging river basins [45,48,49,50]. Several studies have investigated the impact of glacier change on water resources in the TS [42,51,52,53], but only a few studies have addressed the snow cover changes with optical remote sensing [54,55]. In addition, different moisture sources cause diverse climate zones in the TS [56,57], but most studies have focused on only a part of the TS, especially on the areas within China [43,58]. Research on the snow phenology concerning the entire TS and its response to the different climate types in the sub-regions is lacking. Therefore, it is necessary to survey the spatiotemporal variability of snow phenology and its potential influencing factors throughout the entire TS.
This study investigated the variability of snow phenology from 1979 to 2016 based on passive microwave snow depth data from the TS. The objectives of this study were as follows: (1) to derive snow phenology, including Do, De, Dd, and SDmax from daily snow depth data; (2) to analyze the spatiotemporal distributions and trends of snow phenology, as well as their potential influencing factors; and (3) to discuss the potential impact of the changes of snow phenology on water resources. This is the first study to describe snow phenology using passive microwave snow depth data for the entire TS. The results will help to improve the understanding of snow phenology and lead to better management of the regional water resources.
2. Data and Method
2.1. Study Area
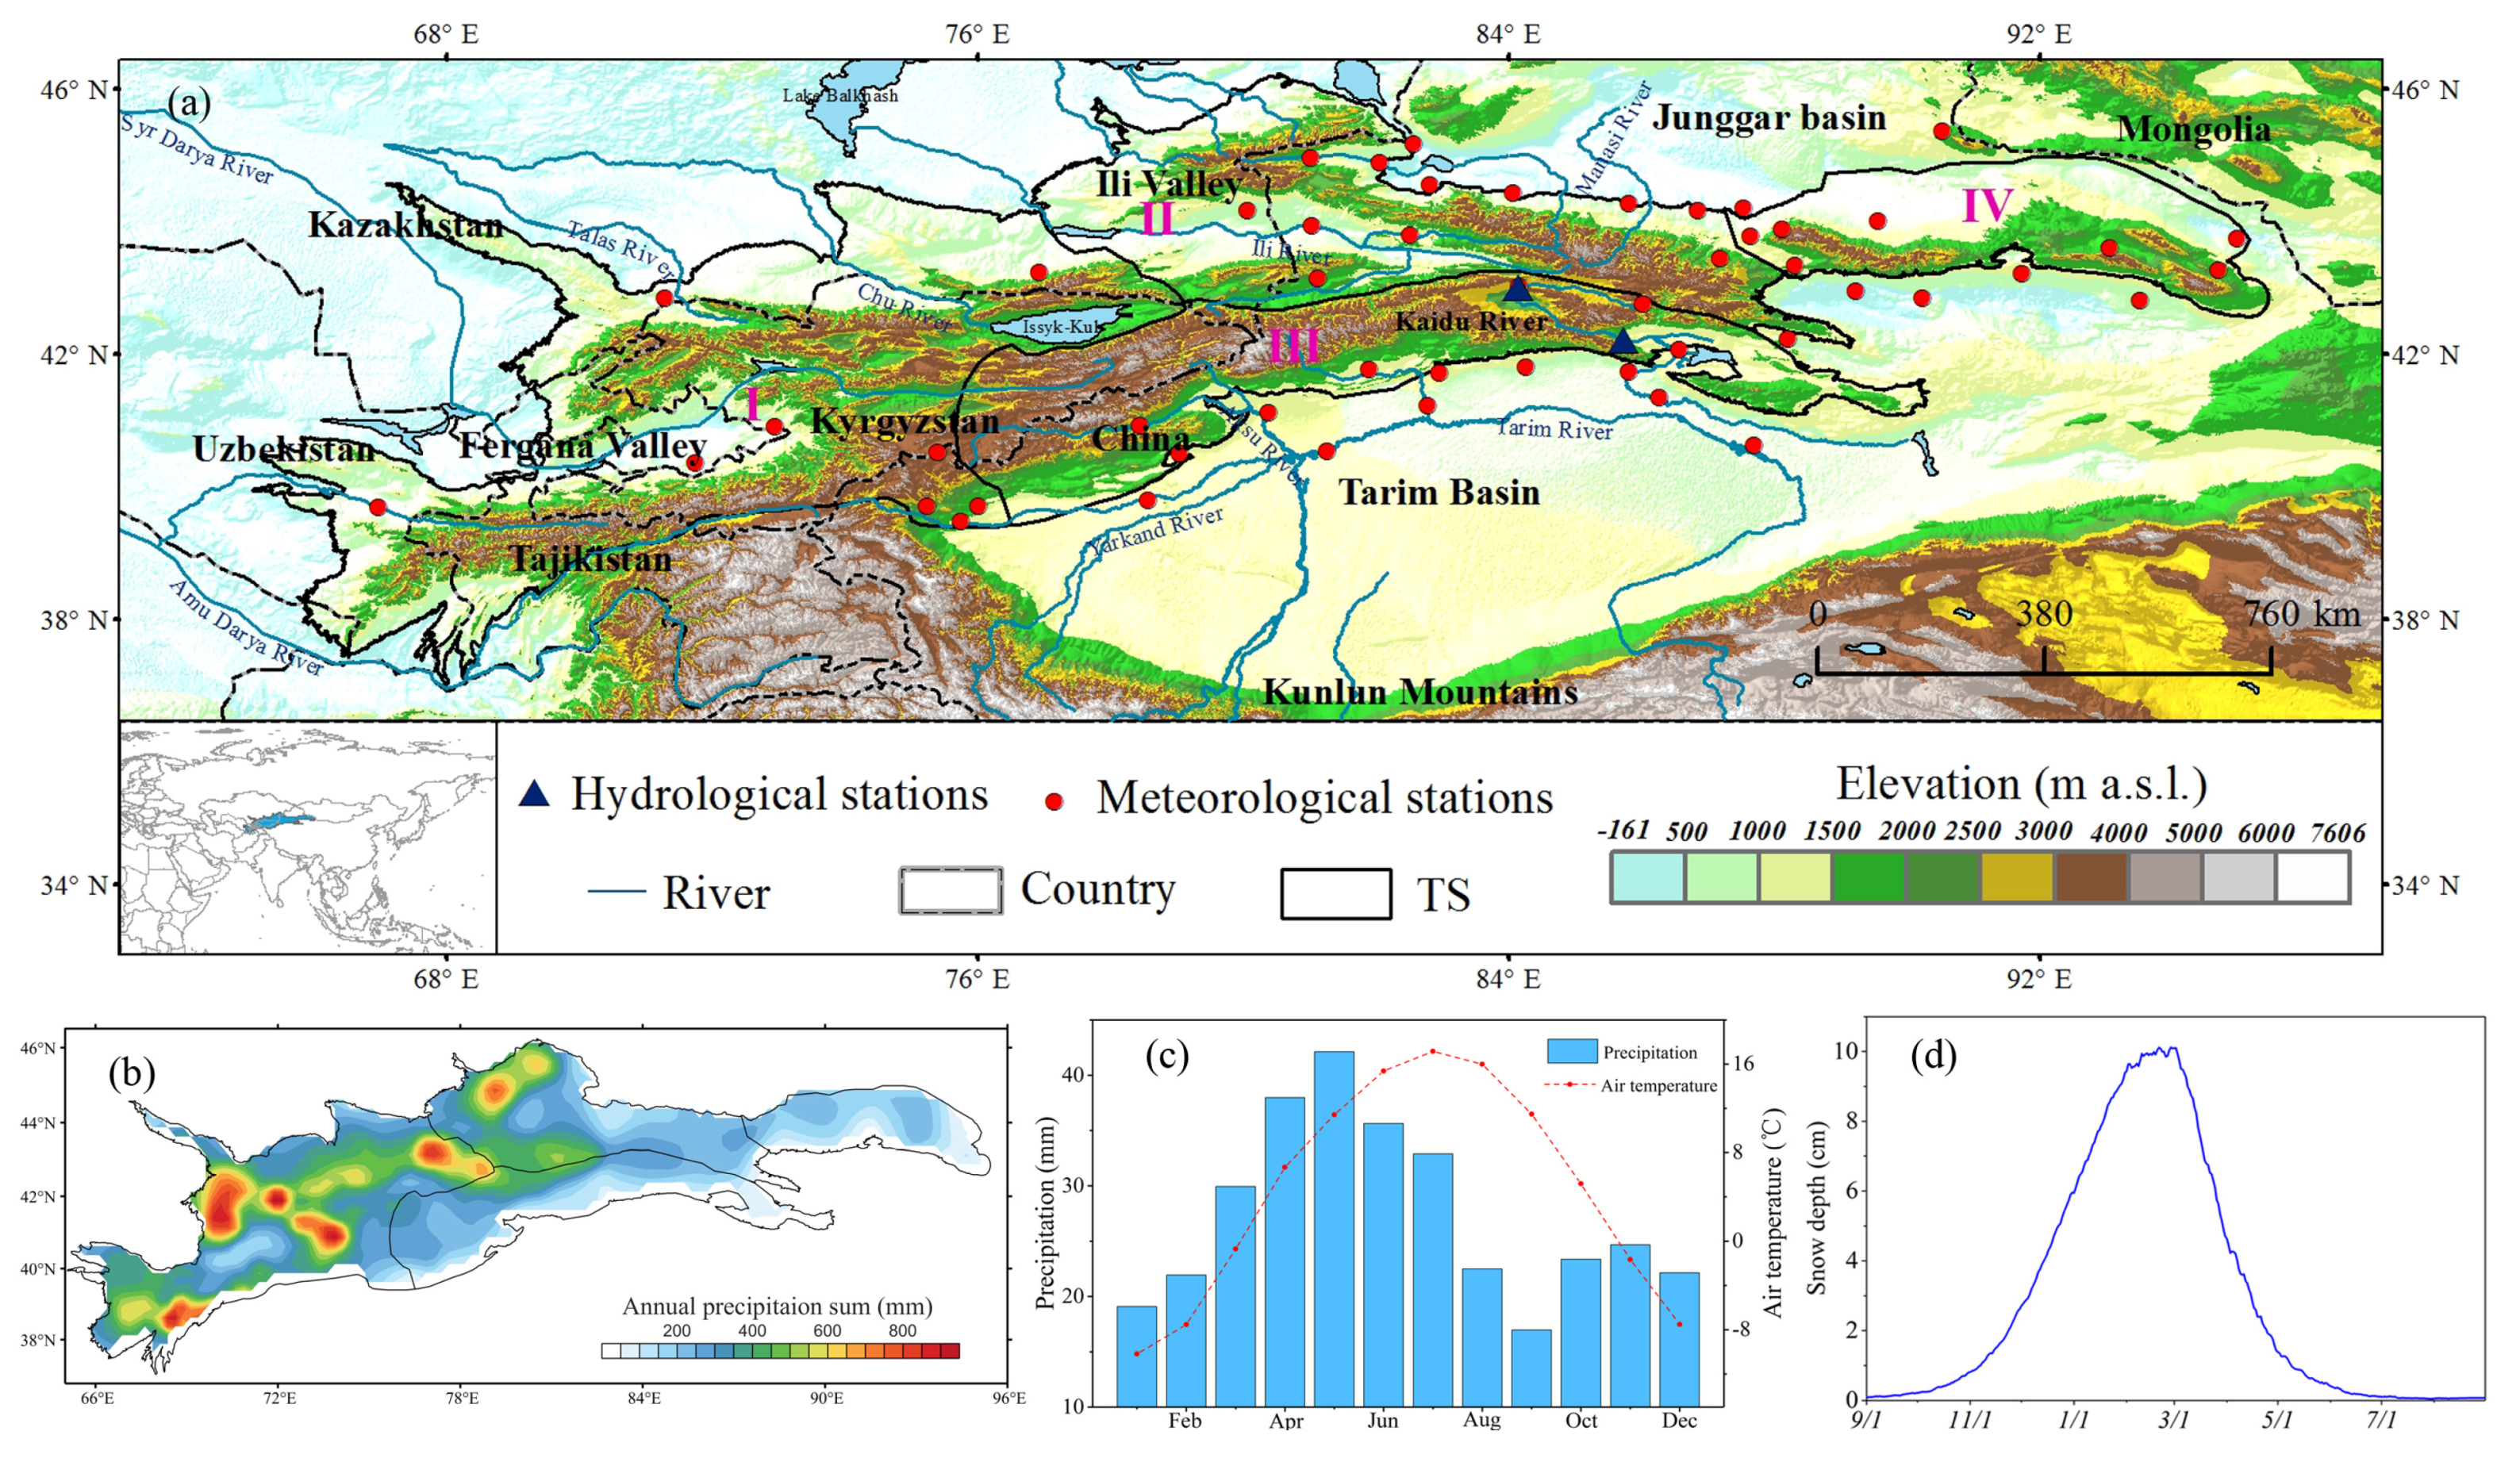
As the largest mountain system in Central Asia, the TS are approximately 250–350 km wide and over 2500 km long, spanning from Uzbekistan to Kyrgyzstan, southeastern Kazakhstan, and Xinjiang (China) with 800,000 km2 (Figure 1a) [59]. The TS have abundant precipitation due to westerly circulation and unique topography, exhibiting heavily glaciated and snow-covered regions [42,60]. The people living in the surrounding areas are heavily dependent on glacier/snow melt water for their fresh water supply [41,61,62]. The TS are geographically divided into four parts: I. the Western Tianshan Mountains (WTS), II. The Northern Tianshan Mountains (NTS), III. The Central Tianshan Mountains (CTS), and IV. The Eastern Tianshan Mountains (ETS) [41,43]. The annual mean precipitation across the TS is 329.3 mm, which is concentrated between April and June, and the annual mean temperature is 4.6 °C (Figure 1c). The WTS and NTS are characterized by a relatively humid climate, while the CTS and ETS have a typical continental climate [63]. The maximum precipitation in the NTS and ETS occurs in the spring and early summer, which is later than that in the WTS (from late winter to early spring) but earlier than that in the CTS (summer) [59].
2.2. Datasets
2.2.1. Remote Sensing Snow Depth Products
The passive microwave snow depth dataset, within the range from 60–140°E and 15–55°N at 25 km spatial resolution (http://westdc.westgis.ac.cn), which is derived from the brightness temperature data from the National Snow and Ice Data Center (NSIDC), including the scanning multichannel radiometer (SMMR) (1978–1987), special sensor microwave/imager (SSM/I) (1987–2007), and special sensor microwave imager/sounder (SSMI/S) (2008–2016), was employed in this study. The time consistency of this dataset was improved by cross calibration of the light temperatures of different sensors [64]. This daily database was developed through a modified Chang algorithm, which was based on the in situ snow data of China, taking the impact of forest cover, liquid water content in snow layer, and surface water body into consideration [11,30,64,65]. Compared with the snow depth from SSM/I and SSMI/S, this dataset has high accuracy and low biases in China [65] and allows the successful investigation of snow depth in China, the Tibetan Plateau, northeastern China, and Xinjiang [11,27,30,31].
2.2.2. Precipitation and Temperature Datasets
The daily surface air temperature and precipitation data from 50 meteorological stations in the TS for 1979–2016 were collected from the China Meteorological Administration (CMA) (http://data.cma.cn) and National Climate Data Center (NCDC) (https://www.ncdc.noaa.gov). The data from meteorological stations were applied to analyze the number of days during which the temperature was below 0 °C in the study area. Monthly gridded surface air temperature (1979–2016) was derived from the Global Historical Climatology Network 2 and Climate Anomaly Monitoring System (GHCN_CAMS, http://www.esrl.noaa.gov/psd/). The gridded 2 m temperature datasets were merged from two large individual datasets of station observations with 0.5° × 0.5° spatial resolution [66]. The gridded surface air temperature data were resampled to 0.25° × 0.25° spatial resolution for resolution consistency. The Global Precipitation Climatology Centre products (GPCC, https://www.dwd.de/EN/ourservices/gpcc/gpcc.html) were more suitable for precipitation research in Central Asia when compared with the climatic research unit (CRU) and Willmott and Matsuura (WM) precipitation data [67]. Therefore, monthly precipitation gridded data at 0.25° × 0.25° spatial resolution from 1979 to 2016 were derived from the GPCC (V2018), which were based on data from more than 79,000 stations [68]. The gridded data concerning air temperature and precipitation were used to investigate the relationship between snow phenology changes and climate variations in the TS. As a typical snowmelt-dominated river in the TS, the Kaidu River was chosen to discuss the variability of snow phenology impacts on water resources. The daily runoff data in the Kaidu River from 1979 to 2011 were collected from the Xinjiang Hydrological Bureau.
2.3. Methodology
2.3.1. Snow Phenology Calculation
To investigate the variability of snow phenology over the TS, this study defined the period from September to the following August as a snow hydrological year. The snow cover onset day (Do) for the hydrological year was defined as the first day of the first five consecutive snow cover days on each grid to reduce the influence of instantaneous snow on the snow phenology computations [27]. The snow cover end day (De) for the hydrological year was defined as the last day of the last five consecutive snow cover days on each grid. The snow cover duration (Dd) for the hydrological year was calculated from Do to De. The period from September to the following February was defined as the accumulation season, and the period from March to August was defined as the melt season, with the maximum snow depth (SDmax) peaking around March (Figure 1d).
2.3.2. Sensitivity Analysis of Snow Phenology
The mean monthly air temperature (Ta) and total monthly precipitation (Pa) during the accumulation season, maximum snow depth (SDmax), mean monthly air temperature (Tm), and total monthly precipitation (Pm) during the melt season were applied to quantify their contributions to snow phenology over the TS. According to Peng et al. [1,69] and Chen et al. [1,69], a multiple linear regression model (Equation (1)) can be used to analyze the variability of Do, which was mainly driven by Ta and Pa.
where the regression coefficients β1 and β2 were defined as the sensitivity of Do to Ta and the sensitivity of Do to Pa, respectively.
De was mainly determined by the Tm and SDmax, and the SDmax in the snow season was dependent on Ta and Pa [1,69]. Thus, Equations (2) and (3) were employed in the sensitivity analysis of SDmax and De, respectively.
The regression coefficients β4 and β5 in Equation (2) were defined as the sensitivity of SDmax to Ta and SDmax to Pa. Similarly, the regression coefficients β7 and β8 in Equation (3) were defined as the sensitivity of De to Tm and De to SDmax. β3, β6, and β9 are the residual error. Therefore, the sensitivity analysis was performed based on Equations (1)–(3) to detect the attributes of the snow phenology changes over the TS.
2.3.3. Trend Analysis and Statistical Analysis
The trends in snow phenology, air temperature, and precipitation were calculated by the Mann–Kendall (M-K) test [70,71], which is a nonparametric method of monotonic trends that has successfully been applied to detect trends in a time series [72,73]. The Sen method was used to estimate the slope of the trend [74]. The significance of a trend was assumed if the Z (M-K) value was unequal to zero with a significance level of less than 0.05. The variations in snow phenology and its relationship with air temperature and precipitation were investigated by correlation analysis and linear regression.
2.3.4. Contributions of Do and De to Dd
The standardized z-score was used to quantify the contributions of Do and De to Dd anomalies. The standard score of a raw score x [75] can be defined as follows:
where μ is the mean of Do, De, and Dd over the TS from 1979 to 2016 and σ is the standard deviation of Do, De, and Dd in the corresponding period. By regressing the z-scores of Dd against the z-scores of Do and De, the contributions of Do and De to Dd anomalies can be derived from the regression coefficients.
3. Results
3.1. Climatology of Snow Phenology over the TS
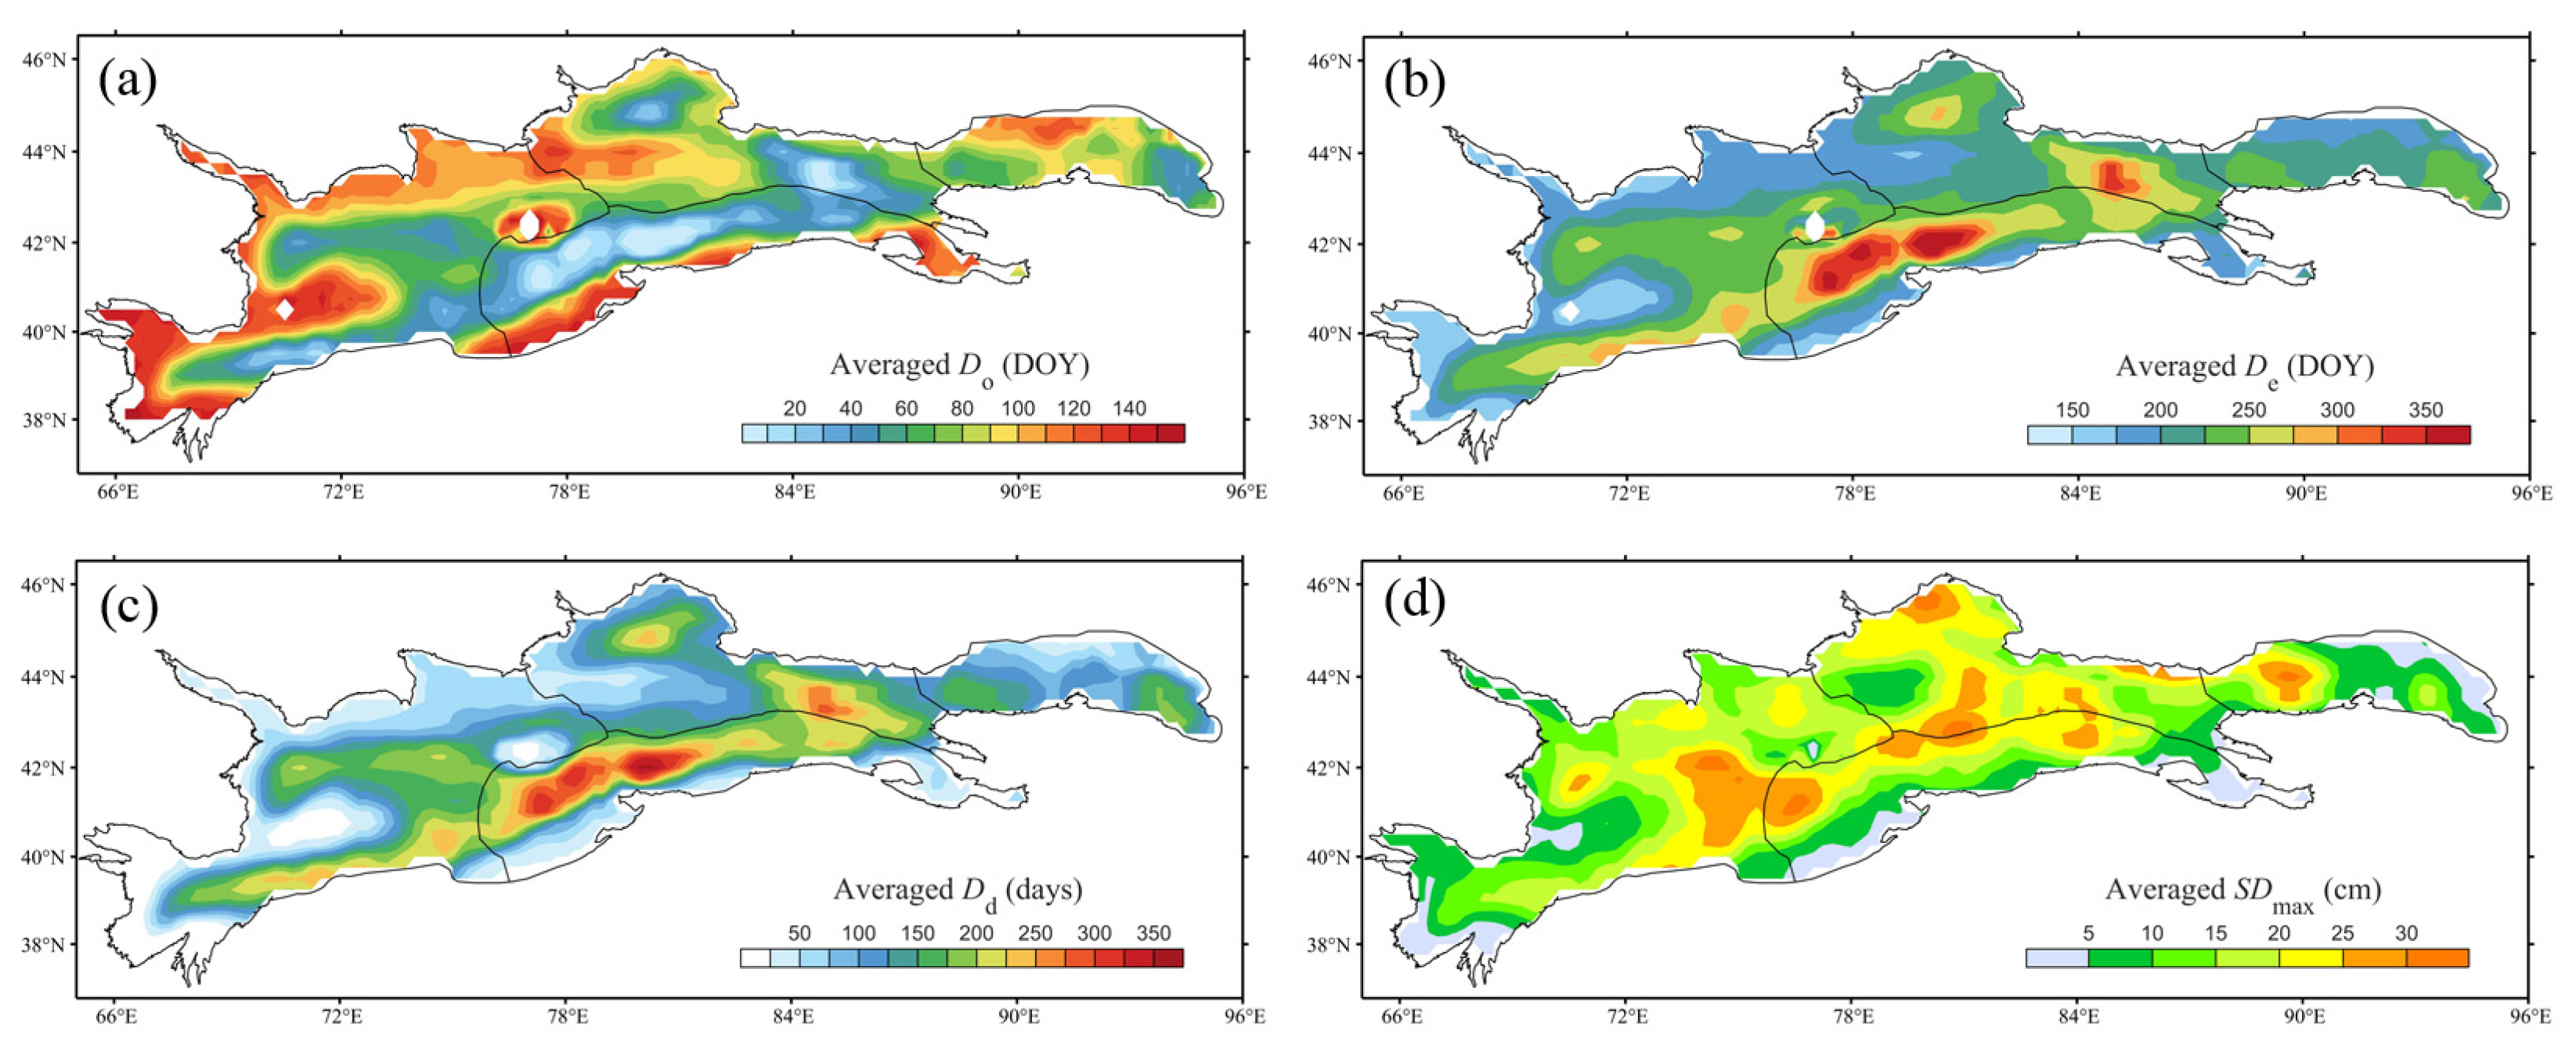
Spatial distributions of Do, De, Dd, and SDmax over the TS during 1979–2016 are shown in Figure 2. The mean Do, De, Dd, and SDmax across the TS during 1979–2016 were the 78.2nd day of the hydrological year (DOY; i.e., 17 November), 222.4th DOY (i.e., 10 April), 146.2 days, and 16.1cm, respectively. Snow cover appeared earlier in the upper reaches of the Syr Darya, Aksu, Kaidu, and Ili Rivers and later in the Ili Valley, Fergana Valley, and edge of the TS (Figure 2a). On the other hand, the spatial distribution of De was opposite to the pattern of Do (Figure 2b): later De corresponded to earlier Do, and vice versa. Combining the patterns of Do and De, the spatial distribution of Dd displayed a longer period in the upper reaches of the Aksu and the Kaidu Rivers, but a shorter period in the Ili Valley, Fergana Valley, and edge of the TS (Figure 2c). The large values in SDmax occurred in the upper reaches of the Syr Darya, Aksu, and Kaidu Rivers, as well as the Ili Valley, while the small values occurred in the Fergana Valley, southern edge of the TS, eastern ETS, and lower part of the Ili Valley (Figure 2d).
3.2. Changes in Snow Phenology over the TS
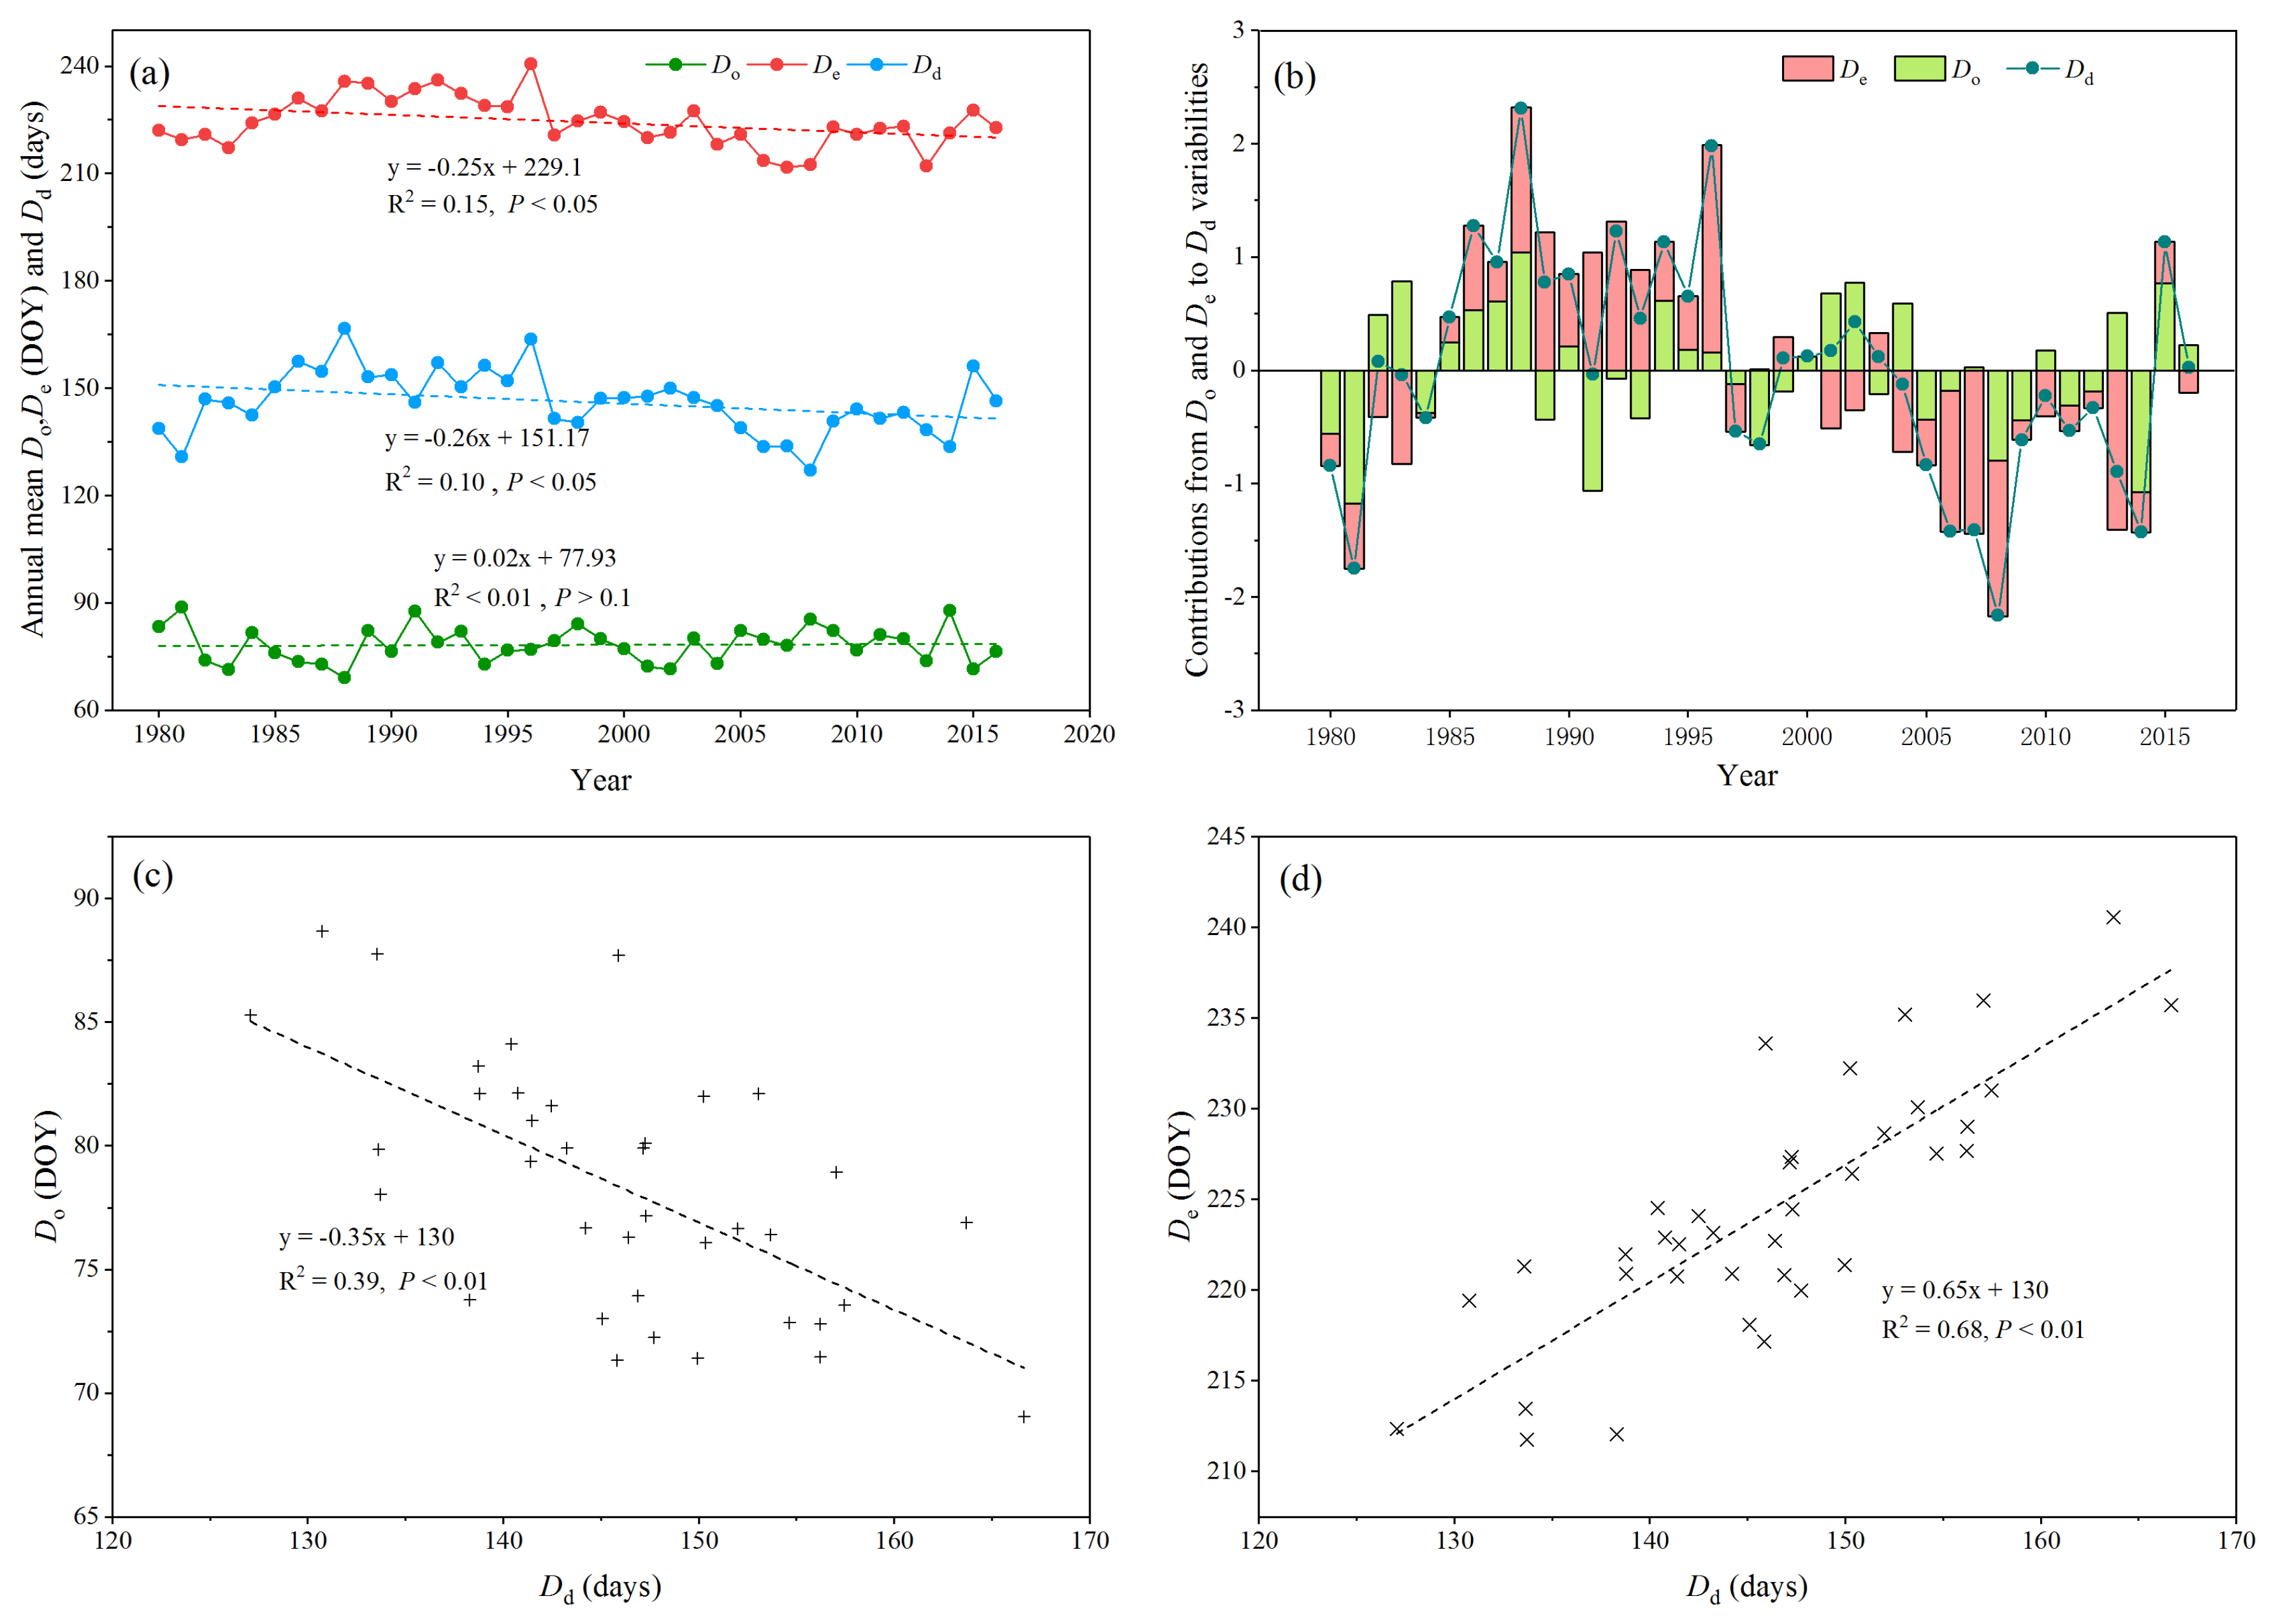
De and Dd in the TS experienced a significant downward trend at the 0.05 significance level (Figure 4a). Spatial distributions of temporal trends in mean Do, De, Dd, and SDmax over the TS during 1979–2016 are displayed in Figure 3. Do was earlier in the Ili Valley and the upper reaches of the Chu and Syr Darya Rivers but delayed on the southern slope of the TS; in particular, it was significantly later in the high-altitude regions of the Aksu, Kaidu, and Ili Rivers, the ETS, and the Fergana Valley (Figure 3a). Compared with the changes in Do, De was earlier across almost all of the TS; in particular, it was significantly earlier in the high-altitude regions of the Aksu, Kaidu, and Ili Rivers, the ETS, and the Fergana Valley but delayed in sporadic regions (Figure 3b). Combined with the variations of Do and De, Dd decreased in the high-altitude regions of the Aksu, Kaidu, and Ili Rivers, the northern slope of the ETS, and the Fergana Valley but increased in the upper reaches of the Chu River and the Ili Valley (Figure 3c). The SDmax in the upper reaches of the Kaidu, Ili, and Syr Darya Rivers, and the eastern ETS showed a significant downward trend (Figure 3d). The areas with a significant increase in SDmax were located in the Ili Valley and the upper reaches of the Aksu and Chu Rivers.
3.3. Contributions of Do and De to Dd
The contributions of Do and De to Dd were estimated by their normalized values over the TS from 1979 to 2016 (Figure 4). Changes in De accounted for 52.8% of changes in Dd over the TS during 1979–2016 (Figure 4b), while changes in Do accounted for 47.2% of the changes in Dd. In addition, the correlation analysis between Do, De and Dd indicated that both Do and De had a significant (at 0.01 significance level) relationship with Dd (Figure 4c,d) during the period of 1979–2016. However, this relationship between De and Dd (R2 = 0.68) was more significant than that between Do and Dd (R2 = 0.39). The above results revealed that changes in De caused the most variations in the snow season over the TS during 1979–2016.
3.4. Spatiotemporal Variations of Temperature and Precipitation over the TS
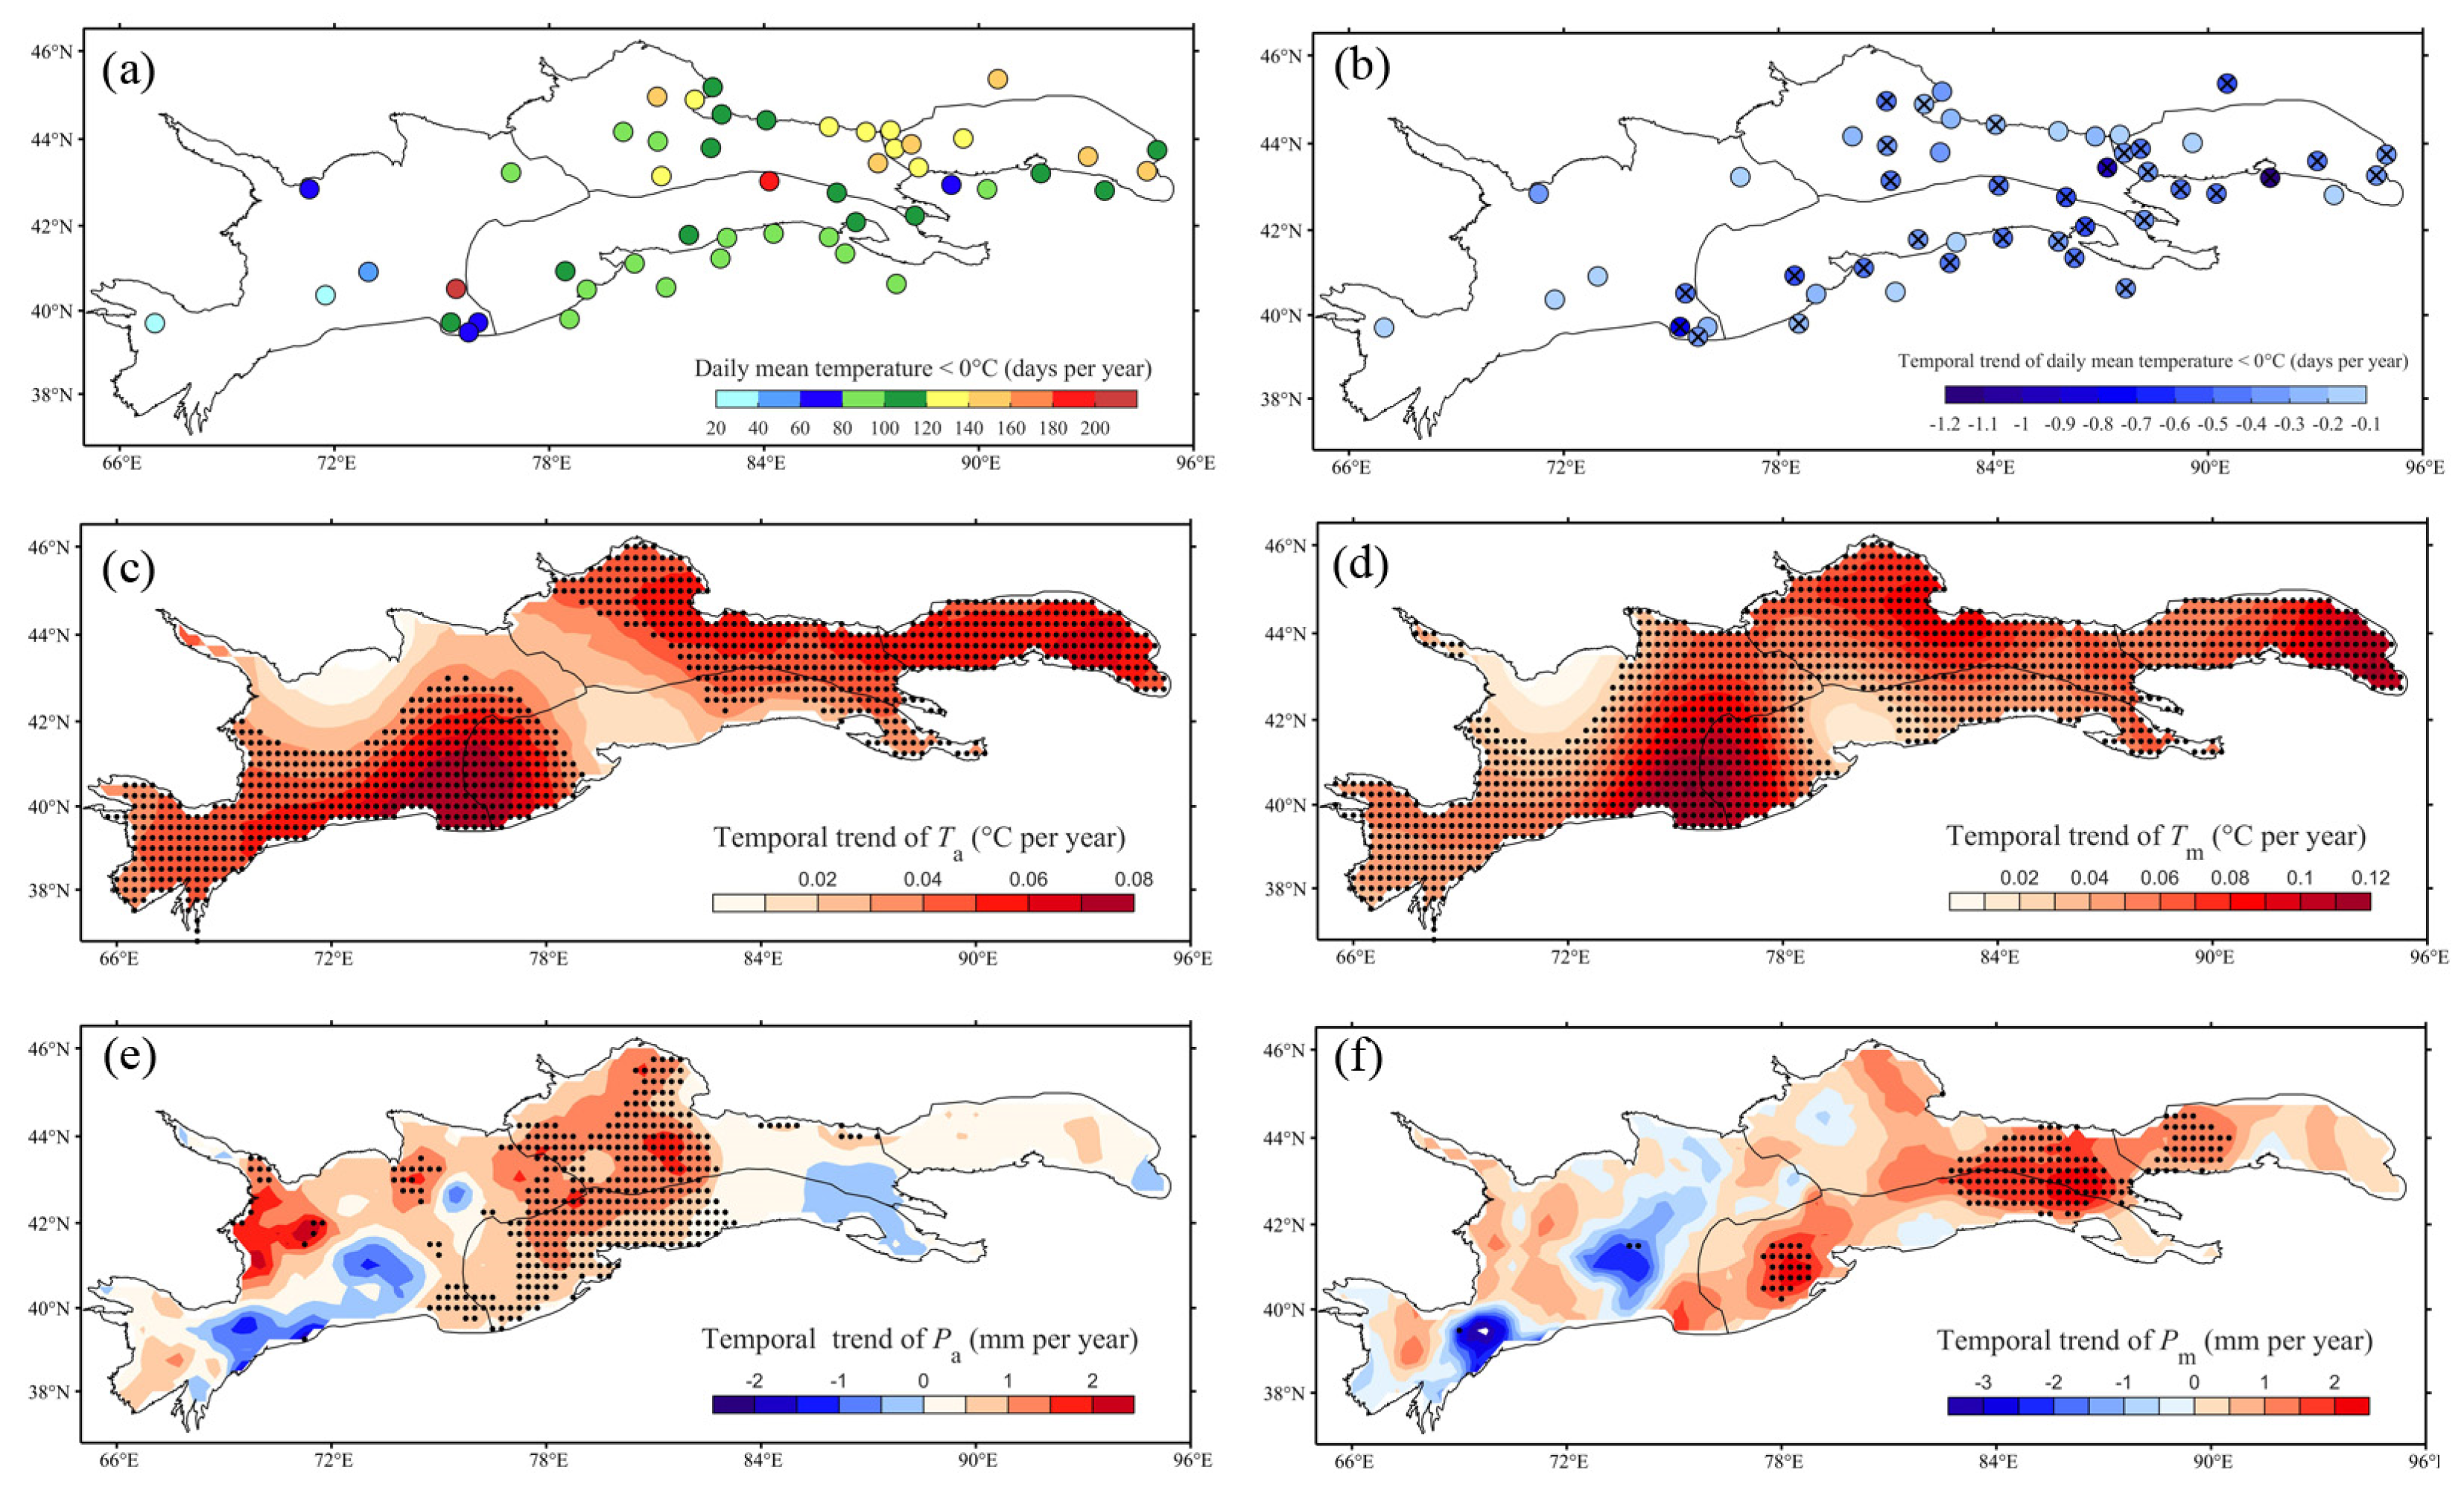
This study calculated the number of days with mean air temperatures below 0 °C from meteorological station observations over the TS from 1979 to 2016 to compare the results of Dd derived from passive microwave instruments. Small values for days with a mean air temperature <0 °C occurred (<120 days) at the southern edge of the TS, in the Ili Valley, and in the WTS (Figure 5a). This pattern was generally consistent with the spatial distribution of Dd (Figure 2c). Days with a mean air temperature <0 °C at all the stations showed a downward trend, and the significantly decreasing (significance level at 0.05) stations were located in the Aksu and Kaidu Rivers, Ili Valley, and ETS (Figure 5b).
As displayed in Figure 5c,d, the Ta and Tm experienced a significant increase in almost all of the regions over the TS (significance level at 0.05). Moreover, both the rising rates of Ta and Tm in the upper reaches of the Syr Darya, Aksu River, NTS, and ETS reached 0.07 °C per year. The increasing rate in Tm was larger than that in Ta over the TS. Pa and Pm in all regions over the TS from 1979–2016 showed an upward trend, except for the upper reaches of the Syr Darya River (Figure 5e,f). Pa with significant increase was observed in the upper reaches of the Aksu River, Ili Valley, and the northern WTS, where the increase rate was above 1 mm per year. In contrast to Pa, Pm showed significant increase in the western area of the ETS and the upper reaches of the Aksu, Ili, and Kaidu Rivers. Although significantly increased winter temperatures over the TS were reported [43,44,47], strengthened westerlies brought more air moisture flux [25,76,77] and increased snowfall, which was beneficial to snow cover accumulation [47,78]. The increasing rate of precipitation was more profound in the west TS during winter and spring and in the east TS during summer [43].
3.5. Sensitivity Analysis of Snow Phenology over the TS
Sensitivity analysis was performed based on Equations (1)–(3) to detect the attributes of the snow phenology changes over the TS, and the results are shown in Figure 6. The results showed a positive sensitivity of Do to Ta at 0.91 days °C−1 across the TS from 1979 to 2016, which indicated that the Do would be delayed 0.91 days, with Ta increased by 1 °C. In contrast, the significant negative sensitivity of Do to Pa was −0.11 days mm−1 (significance level at 0.01), which indicated that Do would be advanced 0.11 days, with Pa increased by 1 mm. The results indicated that the increased Ta would hinder the increase of SDmax (−0.67 cm °C−1), but the increased Pa would promote the significant increase of SDmax (0.04 cm mm−1, significance level at 0.05). Compared with the sensitivity of De to SDmax (0.29 days cm−1), the magnitude of sensitivity of De to Tm (−5.36 days °C−1, significance level at 0.01) was significantly larger (Figure 6e,f).
4. Discussion
4.1. Factors Driving Snow Phenology Changes over the TS
Changes in air temperature and precipitation played a key role in the variations in the snow phenology over the TS. Do was more sensitive to Ta than Pa, which could be explained by the delayed Do over the TS (Figure 4a). Do was earlier in the Ili Valley and the upper reaches of the Chu and Syr Darya Rivers due to the significantly increased Pa and negative sensitivity of Do to Pa (Figure 3a, Figure 5e and Figure 6b). The significantly increased Ta and highly positive sensitivity of Do to Ta caused the significantly delayed Do in the high-altitude regions of the Aksu, Kaidu, and Ili Rivers, the ETS, and the Fergana Valley (Figure 3a, Figure 5e and Figure 6a). The significantly increased Tm and highly negative sensitivity of De to Tm resulted in the significantly earlier De over the TS, especially in high altitude regions of the Aksu, Kaidu, and Ili Rivers, the northern ETS, and the Fergana Valley. The significantly increased SDmax and highly positive sensitivity of De to SDmax promoted the delayed De. Previous studies proved that high net radiation with thin snow cover in spring across the Northern Hemisphere created a high sensitivity of De to temperature, which resulted in earlier De over Eurasia [6,69,79].
Although the magnitude of sensitivity of SDmax to Ta was larger than Pa (Figure 6c,d), the increased rate of Pa was larger than Ta (Figure 5c,e). For example, areas with significantly increased SDmax, such as the central part of the ETS and the east of the WTS, as well as the west of the NTS and CTS, were caused by the significantly increased Pa and highly positive sensitivity of SDmax to Pa (Figure 3d, Figure 5e and Figure 6d). The significantly increased Ta and highly negative sensitivity of SDmax to Ta were attributed to the significantly decreased SDmax in the eastern ETS and the upper reaches of the Kaidu, Ili, and Syr Darya Rivers (Figure 3d, Figure 5c and Figure 6c).
The increased SDmax and earlier Do caused longer Dd in the upper reaches of the Chu River and the Ili Valley (Figure 3c). The significantly increased Tm advanced the De and subsequently shortened Dd in the high-altitude regions of the Aksu, Kaidu, and Ili Rivers, the northern ETS, and the Fergana Valley. De dominated the snow season variations due to the higher Tm across the TS, which was coincidental with the studies in the Northern Hemisphere [6,69,79]. However, the Do in the Tibetan Plateau controlled the variability of snow phenology [27]. In contrast, decreased Ta, which was driven by the Pacific Ocean’s surface cooling in winter and amplified Arctic warming effects [80,81,82], resulted in earlier Do in the Tibetan Plateau (2001–2014) [27,79].
4.2. Potential Impact of Snow Phenology Changes on Water Resources
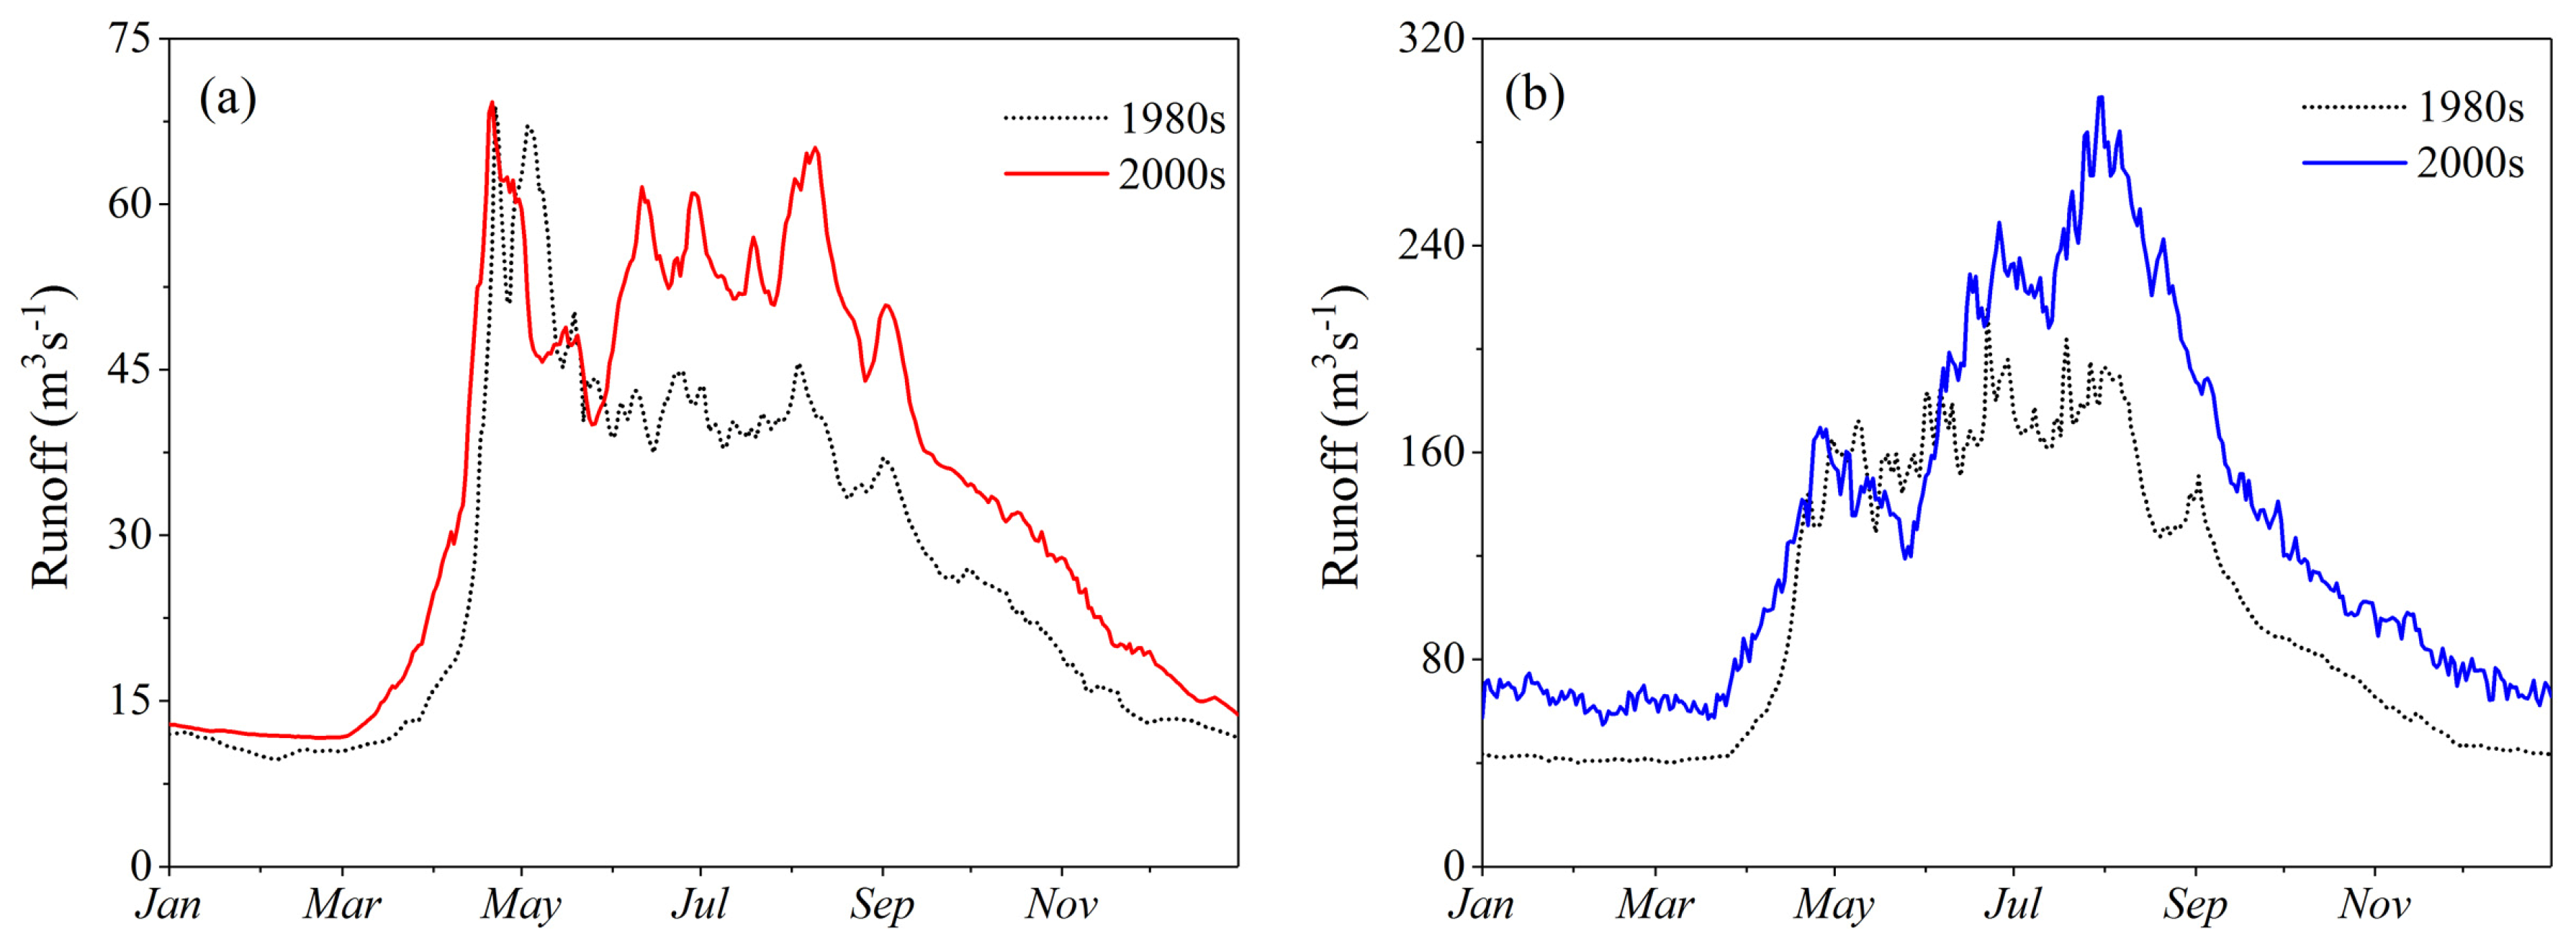
Snow melt is an important recharge source for the TS rivers [83], which means that the variability of snow phenology significantly impacted the local runoff regimes. The Kaidu River is a typical snowmelt runoff river in the TS [48,84], where spring runoff from the Bayanbulak and Dashankou stations increased by 36.5% and 11.21%, respectively, and the runoff peak advanced between the 1980s and 2000s (Figure 7a,b). Although Dd and SDmax showed downward trends in the Kaidu River, the increased Pm and advanced De caused runoff changes. The advanced De, with increased precipitation in the upper reaches of the Aksu, Syr Darya, Kaidu, and the Ili Rivers contributed to increased snowmelt earlier in spring. The maximum runoff peak in the snowmelt-dominated rivers over the TS showed an advanced trend, but the runoff in summer changed insignificantly [45]. The runoff pattern of the Syr Darya River shifted from spring and early summer to late winter and early spring due to climate warming [45]. In the Toshkan River, an important tributary of the Aksu River, snowmelt runoff in the cold season increased by 65% and 56% due to the rising temperatures during the periods from 1960 to 1997 and from 1998 to 2015 [45,85], respectively. In addition, some studies indicated that the snowfall/precipitation ratio was expected to decrease in the 21st century over the TS, which could reduce the snow cover area and aggravate snow melt [1,86]. The runoff shift in snowmelt-dominated rivers has a big impact on water resource management, which may increase the risk of spring flooding and cause a time mismatch between irrigation watering and crop growth, considering population growth and climate warming.
4.3. Limitation and Outlook
The passive microwave data could provide effective and long series of daily snow depth data to monitor the snow phenology over the TS from 1979 to 2016. However, there is uncertainty in snow depth retrieval at high-altitude regions in the study area where in situ observations are lacking. This uncertainty also leads to limitations in the separation of the snow accumulation season and snow melt season by the maximum snow depth in high-altitude regions. Several studies pointed out that passive microwave remote sensing has a limited ability to detect wet snow during the snow melt season, which may underestimate the Dd [87,88,89,90]. Meanwhile, misclassification and error in deriving snow cover were attributed to relatively coarse spatial resolution, as well as the complexity of snow characteristics and topography [91,92,93,94]. Combined with optical remote sensing, passive microwave remote sensing and a land surface model can effectively improve the monitoring accuracy of snow phenology and snow depth [95]. In addition, five consecutive snow cover days in each grid for calculating Do and De can reduce the influence of instantaneous snow on snow phenology computations. However, this method may also cause later Do and earlier De, consequently underestimating the Dd. It neglects the spatial heterogeneity of snow by using a fixed day to define the snow melt season and snow accumulation season in each grid, bringing uncertainty into the sensitivity analysis of the snow phenology. Sensitivity analysis based on the monthly precipitation and air temperature cannot discriminate between the effect of snow and rain on snow phenology due to the insufficient daily in situ observations. A comprehensive equation, which considers the change rate for sensitivity analysis based on the daily data, will be more quantitatively capable of describing the change in the snow phenology parameters over the years. The daily data from the climate model simulations and satellite products can be used for further study. Other climate variables (such as relative humidity and wind) and complex topography also have an important impact on snow, which require intensive observation networks and large amounts of field survey data. Alpine vegetation plays a crucial role in a mountain ecosystem, so the variability of snow phenology and snow depth have been reported to significantly influence vegetation growth [24,96,97]. For example, a shorter Dd would lead to an earlier start and longer growing season on the Tibetan Plateau [10,37]. The snow water equivalent and Dd play an equal role in the growth of grassland and sparse vegetation [98]. Moreover, the mean snow depth significantly regulates desert vegetation growth by persistently impacting soil moisture [36]. The TS has plenty of vegetation and well-developed animal husbandry [99]. Therefore, the relationships between the variations in snow phenology and vegetation growth over the TS need further research.
5. Conclusions
This study investigated the spatiotemporal variability of snow phenology and snow depth over the TS using a passive microwave daily snow depth dataset from 1979 to 2016, as well as exploring the impacts and attributes of snow changes. The main findings of the study are as follows:
- The snow end day and snow cover duration across the TS experienced a significant decrease, and the snow end day dominated the variability of snow season. The snow end day was earlier across the TS with increasing air temperatures during the melt season, especially in the high-altitude regions and the Fergana Valley.
- Increasing precipitation during the accumulation season may result in increased maximum snow depth in the Ili Valley and the upper reaches of the Aksu and Chu Rivers, subsequently causing a longer snow cover duration. The snow cover duration was shortened in the upper reaches of the Kaidu River basin, high-altitude regions of the Aksu and Ili Rivers, northern ETS, and Fergana Valley due to the fact that the increasing temperatures delayed the snow onset day and caused the occurrence of an earlier snow end day.
- The earlier snow end day with increased precipitation during the accumulation season in the snowmelt-dominated river basins contributed to increased snowmelt and advanced the runoff peak to earlier in spring. The increased snowmelt will increase the risk of floods. The shifted runoff peak will introduce temporal mismatch between the water supply and the crop-growing season, increasing the difficulties of the regional reservoir and agriculture management and intensifying contradictions for the planning and utilization of water in neighboring countries.
Author Contributions
T.Y. and L.L. conceived of the original design of the work. T.Y. and L.L. wrote the paper. T.Y. and Q.L. analyzed all of the data and created all the figures. S.A. and H.Z. provided comments on the paper.
Funding
This study was supported by a project of the National Natural Science Foundation of China (NSFC Grant U1703241), the Strategic Priority Research Program of the Chinese Academy of Sciences, the Pan-Third Pole Environment Study for a Green Silk Road (Pan-TPE) (No. XDA2004030202), the Key International cooperation project of Chinese Academy of Sciences (No: 121311KYSB20160005), and the CAS Instrumental development project of Automatic Meteorological Observation System with Multifunctional Modularization (No: Y634241001).
Acknowledgments
The authors greatly thank the National Engineering Laboratory for Integrated Aero-Space-Ground-Ocean Big Data Application Technology of Northwestern Polytechnical University for its remarkable assistance in the data collection and processing and Linxi Li from Ontario Veterinary Medical Association for her linguistic assistance during the revision of this manuscript.
Conflicts of Interest
The authors declare no conflict of interest.
References
- Barnett, T.P.; Adam, J.C.; Lettenmaier, D.P. Potential impacts of a warming climate on water availability in snow-dominated regions. Nature 2005, 438, 303–309. [Google Scholar] [CrossRef] [PubMed]
- Berghuijs, W.R.; Woods, R.A.; Hrachowitz, M. A precipitation shift from snow towards rain leads to a decrease in streamflow. Nat. Clim. Chang. 2014, 4, 583–586. [Google Scholar] [CrossRef] [Green Version]
- Musselman, K.N.; Clark, M.P.; Liu, C.; Ikeda, K.; Rasmussen, R. Slower snowmelt in a warmer world. Nat. Clim. Chang. 2017, 7, 214–219. [Google Scholar] [CrossRef]
- Malmros, J.K.; Mernild, S.H.; Wilson, R.; Tagesson, T.; Fensholt, R. Snow cover and snow albedo changes in the central Andes of Chile and Argentina from daily MODIS observations (2000–2016). Remote Sens. Environ. 2018, 209, 240–252. [Google Scholar] [CrossRef]
- Trishchenko, A.P.; Wang, S. Variations of climate, surface energy budget, and minimum snow/ice extent over Canadian Arctic landmass for 2000-16. J. Clim. 2018, 31, 1155–1172. [Google Scholar] [CrossRef]
- Choi, G.; Robinson, D.A.; Kang, S. Changing northern hemisphere snow seasons. J. Clim. 2010, 23, 5305–5310. [Google Scholar] [CrossRef]
- Bradley, R.S.; Vuille, M.; Diaz, H.F.; Vergara, W. Tropical Andes. Nature 2006, 312, 1755–1756. [Google Scholar]
- Brown, R.D.; Robinson, D.A. Northern Hemisphere spring snow cover variability and change over 1922-2010 including an assessment of uncertainty. Cryosphere 2011, 5, 219–229. [Google Scholar] [CrossRef]
- Li, L.; Simonovic, S.P. System dynamics model for predicting floods from snowmelt in north American prairie watersheds. Hydrol. Process. 2002, 16, 2645–2666. [Google Scholar] [CrossRef]
- Wang, X.; Wu, C.; Peng, D.; Gonsamo, A.; Liu, Z. Snow cover phenology affects alpine vegetation growth dynamics on the Tibetan Plateau: Satellite observed evidence, impacts of different biomes, and climate drivers. Agric. For. Meteorol. 2018, 256–257, 61–74. [Google Scholar] [CrossRef]
- Che, T.; Dai, L.; Zheng, X.; Li, X.; Zhao, K. Estimation of snow depth from passive microwave brightness temperature data in forest regions of northeast China. Remote Sens. Environ. 2016, 183, 334–349. [Google Scholar] [CrossRef]
- Zhang, Y.; Ma, N. Spatiotemporal variability of snow cover and snow water equivalent in the last three decades over Eurasia. J. Hydrol. 2018, 559, 238–251. [Google Scholar] [CrossRef]
- Butt, M.J. Characteristics of snow cover in the hindukush, karakoram and himalaya region using landsat satellite data. Hydrol. Process. 2012, 26, 3689–3698. [Google Scholar] [CrossRef]
- Iwata, Y.; Nemoto, M.; Hasegawa, S.; Yanai, Y.; Kuwao, K.; Hirota, T. Influence of rain, air temperature, and snow cover on subsequent spring-snowmelt infiltration into thin frozen soil layer in northern Japan. J. Hydrol. 2011, 401, 165–176. [Google Scholar] [CrossRef]
- Derksen, C.; Toose, P.; Rees, A.; Wang, L.; English, M.; Walker, A.; Sturm, M. Development of a tundra-specific snow water equivalent retrieval algorithm for satellite passive microwave data. Remote Sens. Environ. 2010, 114, 1699–1709. [Google Scholar] [CrossRef]
- Foster, J.L.; Hall, D.K.; Kelly, R.E.J.; Chiu, L. Seasonal snow extent and snow mass in South America using SMMR and SSM/I passive microwave data (1979–2006). Remote Sens. Environ. 2009, 113, 291–305. [Google Scholar] [CrossRef] [Green Version]
- Takala, M.; Luojus, K.; Pulliainen, J.; Derksen, C.; Lemmetyinen, J.; Kärnä, J.P.; Koskinen, J.; Bojkov, B. Estimating northern hemisphere snow water equivalent for climate research through assimilation of space-borne radiometer data and ground-based measurements. Remote Sens. Environ. 2011, 115, 3517–3529. [Google Scholar] [CrossRef]
- Hall, D.K.; Riggs, G.A.; Salomonson, V.V.; DiGirolamo, N.E.; Bayr, K.J. MODIS snow-cover products. Remote Sens. Environ. 2002, 83, 181–194. [Google Scholar] [CrossRef] [Green Version]
- Hall, D.K.; Riggs, G.A. Accuracy assessment of the MODIS snow products. Hydrol. Process. 2007, 21, 1534–1547. [Google Scholar] [CrossRef]
- Derksen, C.; Brown, R. Spring snow cover extent reductions in the 2008–2012 period exceeding climate model projections. Geophys. Res. Lett. 2012, 39, 1–6. [Google Scholar] [CrossRef]
- IPCC. Summary for Policymakers; IPCC: Geneva, Switzerland, 2014; ISBN 9789291691432. [Google Scholar]
- Whetton, P.H.; Haylock, M.R.; Galloway, R. Climate change and snow-cover duration in the Australian Alps. Clim. Chang. 1996, 32, 447–479. [Google Scholar] [CrossRef]
- Wang, L.; Derksen, C.; Brown, R.; Markus, T. Recent changes in pan-Arctic melt onset from satellite passive microwave measurements. Geophys. Res. Lett. 2013, 40, 522–528. [Google Scholar] [CrossRef]
- Wang, T.; Peng, S.; Lin, X.; Chang, J. Declining snow cover may affect spring phenological trend on the Tibetan Plateau. Proc. Natl. Acad. Sci. 2013, 110, E2854–E2855. [Google Scholar] [CrossRef] [PubMed] [Green Version]
- Mölg, T.; Maussion, F.; Scherer, D. Mid-latitude westerlies as a driver of glacier variability in monsoonal High Asia. Nat. Clim. Chang. 2014, 4, 68–73. [Google Scholar] [CrossRef]
- Chen, X.; Liang, S.; Cao, Y. Satellite observed changes in the Northern Hemisphere snow cover phenology and the associated radiative forcing and feedback between 1982 and 2013. Environ. Res. Lett. 2016, 11. [Google Scholar] [CrossRef]
- Chen, X.; Long, D.; Hong, Y.; Hao, X.; Hou, A. Climatology of snow phenology over the Tibetan plateau for the period 2001-2014 using multisource data. Int. J. Climatol. 2018, 1–12. [Google Scholar] [CrossRef]
- Dariane, A.B.; Khoramian, A.; Santi, E. Investigating spatiotemporal snow cover variability via cloud-free MODIS snow cover product in Central Alborz Region. Remote Sens. Environ. 2017, 202, 152–165. [Google Scholar] [CrossRef]
- Huang, Y.; Liu, H.; Yu, B.; Wu, J.; Kang, E.L.; Xu, M.; Wang, S.; Klein, A.; Chen, Y. Improving MODIS snow products with a HMRF-based spatio-temporal modeling technique in the Upper Rio Grande Basin. Remote Sens. Environ. 2018, 204, 568–582. [Google Scholar] [CrossRef]
- Dai, L.; Che, T.; Wang, J.; Zhang, P. Snow depth and snow water equivalent estimation from AMSR-E data based on a priori snow characteristics in Xinjiang, China. Remote Sens. Environ. 2012, 127, 14–29. [Google Scholar] [CrossRef]
- Huang, X.; Deng, J.; Ma, X.; Wang, Y.; Feng, Q.; Hao, X.; Liang, T. Spatiotemporal dynamics of snow cover based on multi-source remote sensing data in China. Cryosphere 2016, 10, 2453–2463. [Google Scholar] [CrossRef] [Green Version]
- Kelly, R.E.; Chang, A.T.; Tsang, L.; Foster, J.L. A prototype AMSR-E global snow area and snow depth algorithm. IEEE Trans. Geosci. Remote Sens. 2003, 41, 230–242. [Google Scholar] [CrossRef] [Green Version]
- Pulliainen, J. Mapping of snow water equivalent and snow depth in boreal and sub-arctic zones by assimilating space-borne microwave radiometer data and ground-based observations. Remote Sens. Environ. 2006, 101, 257–269. [Google Scholar] [CrossRef]
- Vander Jagt, B.J.; Durand, M.T.; Margulis, S.A.; Kim, E.J.; Molotch, N.P. The effect of spatial variability on the sensitivity of passive microwave measurements to snow water equivalent. Remote Sens. Environ. 2013, 136, 163–179. [Google Scholar] [CrossRef]
- Yu, Z.; Liu, S.; Wang, J.; Sun, P.; Liu, W.; Hartley, D.S. Effects of seasonal snow on the growing season of temperate vegetation in China. Glob. Chang. Biol. 2013, 19, 2182–2195. [Google Scholar] [CrossRef] [PubMed]
- Peng, S.; Piao, S.; CIAIS, P.; Fang, J.; Wang, X. Change in winter snow depth and its impacts on vegetation in China. Glob. Chang. Biol. 2010, 16, 3004–3013. [Google Scholar] [CrossRef]
- Wang, X.; Wang, T.; Guo, H.; Liu, D.; Zhao, Y.; Zhang, T.; Liu, Q.; Piao, S. Disentangling the mechanisms behind winter snow impact on vegetation activity in northern ecosystems. Glob. Chang. Biol. 2018, 24, 1651–1662. [Google Scholar] [CrossRef] [PubMed]
- Bulygina, O.N.; Groisman, P.Y.; Razuvaev, V.N.; Korshunova, N.N. Changes in snow cover characteristics over Northern Eurasia since 1966. Environ. Res. Lett. 2011, 6. [Google Scholar] [CrossRef]
- Demaria, E.M.C.; Roundy, J.K.; Wi, S.; Palmer, R.N. The effects of climate change on seasonal snowpack and the hydrology of the Northeastern and Upper Midwest United States. J. Clim. 2016, 29, 6527–6541. [Google Scholar] [CrossRef]
- Immerzeel, W.W.; Droogers, P.; de Jong, S.M.; Bierkens, M.F.P. Large-scale monitoring of snow cover and runoff simulation in Himalayan river basins using remote sensing. Remote Sens. Environ. 2009, 113, 40–49. [Google Scholar] [CrossRef]
- Farinotti, D.; Longuevergne, L.; Moholdt, G.; Duethmann, D.; Mölg, T.; Bolch, T.; Vorogushyn, S.; Güntner, A. Substantial glacier mass loss in the Tien Shan over the past 50 years. Nat. Geosci. 2015, 8, 716–722. [Google Scholar] [CrossRef]
- Sorg, A.; Bolch, T.; Stoffel, M.; Solomina, O.; Beniston, M. Climate change impacts on glaciers and runoff in Tien Shan (Central Asia). Nat. Clim. Chang. 2012, 2, 725–731. [Google Scholar] [CrossRef]
- Chen, Y.; Li, W.; Deng, H.; Fang, G.; Li, Z. Changes in Central Asia’s Water Tower: Past, Present and Future. Sci. Rep. 2016, 6, 1–12. [Google Scholar] [CrossRef] [PubMed]
- Hu, Z.; Zhang, C.; Hu, Q.; Tian, H. Temperature changes in central Asia from 1979 to 2011 based on multiple datasets. J. Clim. 2014, 27, 1143–1167. [Google Scholar] [CrossRef]
- Chen, Y.; Li, Z.; Fang, G.; Li, W. Large Hydrological Processes Changes in the Transboundary Rivers of Central Asia. J. Geophys. Res. Atmos. 2018, 123, 5059–5069. [Google Scholar] [CrossRef]
- Feng, R.; Yu, R.; Zheng, H.; Gan, M. Spatial and temporal variations in extreme temperature in Central Asia. Int. J. Climatol. 2017, 38, 388–400. [Google Scholar] [CrossRef]
- Guo, L.; Li, L. Variation of the proportion of precipitation occurring as snow in the Tian Shan Mountains, China. Int. J. Climatol. 2015, 35, 1379–1393. [Google Scholar] [CrossRef]
- Zhang, F.; Ahmad, S.; Zhang, H.; Zhao, X.; Feng, X.; Li, L. Simulating low and high streamflow driven by snowmelt in an insufficiently gauged alpine basin. Stoch. Environ. Res. Risk Assess. 2016, 30, 59–75. [Google Scholar] [CrossRef]
- Zhang, F.; Bai, L.; Li, L.; Wang, Q. Sensitivity of runoff to climatic variability in the northern and southern slopes of the Middle Tianshan Mountains, China. J. Arid Land 2016, 8, 681–693. [Google Scholar] [CrossRef]
- Shen, Y.J.; Shen, Y.; Fink, M.; Kralisch, S.; Brenning, A. Unraveling the Hydrology of the Glacierized Kaidu Basin by Integrating Multisource Data in the Tianshan Mountains, Northwestern China. Water Resour. Res. 2018, 54, 557–580. [Google Scholar] [CrossRef]
- Xu, M.; Wu, H.; Kang, S. Impacts of climate change on the discharge and glacier mass balance of the different glacierized watersheds in the Tianshan Mountains, Central Asia. Hydrol. Process. 2018, 32, 126–145. [Google Scholar] [CrossRef]
- Wang, X.; Ding, Y.; Liu, S.; Jiang, L.; Wu, K.; Jiang, Z.; Guo, W. Changes of glacial lakes and implications in Tian Shan, central Asia, based on remote sensing data from 1990 to 2010. Environ. Res. Lett. 2013, 8. [Google Scholar] [CrossRef]
- Liu, Q.; Liu, S. Response of glacier mass balance to climate change in the Tianshan Mountains during the second half of the twentieth century. Clim. Dyn. 2016, 46, 303–316. [Google Scholar] [CrossRef]
- Dietz, A.J.; Conrad, C.; Kuenzer, C.; Gesell, G.; Dech, S. Identifying changing snow cover characteristics in central Asia between 1986 and 2014 from remote sensing data. Remote Sens. 2014, 6, 12752–12775. [Google Scholar] [CrossRef]
- Tang, Z.; Wang, X.; Wang, J.; Wang, X.; Li, H.; Jiang, Z. Spatiotemporal variation of snow cover in Tianshan Mountains, Central Asia, based on cloud-free MODIS fractional snow cover product, 2001–2015. Remote Sens. 2017, 9, 1045. [Google Scholar] [CrossRef]
- Wang, S.; Zhang, M.; Crawford, J.; Hughes, C.E.; Du, M.; Liu, X. The effect of moisture source and synoptic conditions on precipitation isotopes in arid central Asia. J. Geophys. Res. 2017, 122, 2667–2682. [Google Scholar] [CrossRef]
- Kong, Y.; Pang, Z. A positive altitude gradient of isotopes in the precipitation over the Tianshan Mountains: Effects of moisture recycling and sub-cloud evaporation. J. Hydrol. 2016, 542, 222–230. [Google Scholar] [CrossRef]
- Li, Q.; Yang, T.; Zhang, F.; Qi, Z.; Li, L. Snow depth reconstruction over last century: Trend and distribution in the Tianshan Mountains, China. Glob. Planet. Chang. 2018, 173, 73–82. [Google Scholar] [CrossRef]
- Aizen, V.B.; Aizen, E.M.; Melack, J.M.; Dozier, J. Climatic and hydrologic changes in the Tien Shan, central Asia. J. Clim. 1997, 10, 1393–1404. [Google Scholar] [CrossRef]
- Aizen, V.B.; Kuzmichenok, V.A.; Surazakov, A.B.; Aizen, E.M. Glacier changes in the Tien Shan as determined from topographic and remotely sensed data. Glob. Planet. Chang. 2007, 56, 328–340. [Google Scholar] [CrossRef]
- Gan, R.; Luo, Y.; Zuo, Q.; Sun, L. Effects of projected climate change on the glacier and runoff generation in the Naryn River Basin, Central Asia. J. Hydrol. 2015, 523, 240–251. [Google Scholar] [CrossRef] [Green Version]
- Luo, Y.; Arnold, J.; Liu, S.; Wang, X.; Chen, X. Inclusion of glacier processes for distributed hydrological modeling at basin scale with application to a watershed in Tianshan Mountains, northwest China. J. Hydrol. 2013, 477, 72–85. [Google Scholar] [CrossRef]
- Avouac, J.P.; Tapponnier, P. Kinematic Model of Active Deformation in Central-Asia. Geophys. Res. Lett. 1993, 20, 895–898. [Google Scholar] [CrossRef]
- Che, T.; Li, X.; Jin, R.; Armstrong, R.L.; Zhang, T. Snow depth derived from passive microwave remote sensing data in China. Ann. Glaciol. 2008, 49, 145–154. [Google Scholar] [CrossRef]
- Dai, L.; Che, T.; Ding, Y. Inter-calibrating SMMR, SSM/I and SSMI/S data to improve the consistency of snow-depth products in China. Remote Sens. 2015, 7, 7212–7230. [Google Scholar] [CrossRef]
- Fan, Y.; van den Dool, H. A global monthly land surface air temperature analysis for 1948-present. J. Geophys. Res. Atmos. 2008, 113, 1–18. [Google Scholar] [CrossRef]
- Hu, Z.; Zhou, Q.; Chen, X.; Li, J.; Li, Q.; Chen, D.; Liu, W.; Yin, G. Evaluation of three global gridded precipitation data sets in central Asia based on rain gauge observations. Int. J. Climatol. 2018, 38, 3475–3493. [Google Scholar] [CrossRef]
- Reinert, D.; Prill, F.; Frank, H.; Zängl, G. ICON Database Reference Manual; Deutscher Wetterdienst: Offenbach am Main, Germany, 2016; Volume 1891, p. 2000.
- Peng, S.; Piao, S.; Ciais, P.; Friedlingstein, P.; Zhou, L.; Wang, T. Change in snow phenology and its potential feedback to temperature in the Northern Hemisphere over the last three decades. Environ. Res. Lett. 2013, 8. [Google Scholar] [CrossRef]
- Mann, H.B. Nonparametric tests against trend. Econometrica 1945, 13, 245–259. [Google Scholar] [CrossRef]
- Kendall, M.G. Rank Correlation Methods; Griffin: London, UK, 1975. [Google Scholar]
- Wang, W.; Chen, X.; Shi, P.; Van Gelder, P.H.A.J.M. Detecting changes in extreme precipitation and extreme streamflow in the Dongjiang River Basin in southern China. Hydrol. Earth Syst. Sci. 2008, 12, 207–221. [Google Scholar] [CrossRef] [Green Version]
- Li, X.; Jiang, F.; Li, L.; Wang, G. Spatial and temporal variability of precipitation concentration index, concentration degree and concentration period Xinjiang, China. Int. J. Climatol. 2011, 31, 1679–1693. [Google Scholar] [CrossRef]
- Sen, P.K. Journal of the American Statistical Estimates of the Regression Coefficient Based on Kendall’s Tau. J. Am. Stat. Assoc. 1968, 63, 1379–1389. [Google Scholar] [CrossRef]
- Aas, K.S.; Gisnås, K.; Westermann, S.; Berntsen, T.K. A Tiling Approach to Represent Subgrid Snow Variability in Coupled Land Surface–Atmosphere Models. J. Hydrometeorol. 2017, 18, 49–63. [Google Scholar] [CrossRef]
- Yao, T.; Thompson, L.; Yang, W.; Yu, W.; Gao, Y.; Guo, X.; Yang, X.; Duan, K.; Zhao, H.; Xu, B.; et al. Different glacier status with atmospheric circulations in Tibetan Plateau and surroundings. Nat. Clim. Chang. 2012, 2, 663–667. [Google Scholar] [CrossRef]
- Peng, D.; Zhou, T. Why was the arid and semiarid northwest China getting wetter in the recent decades? J. Geophys. Res. Atmos. 2017, 122, 9060–9075. [Google Scholar] [CrossRef]
- Xu, M.; Kang, S.; Wu, H.; Yuan, X. Detection of spatio-temporal variability of air temperature and precipitation based on long-term meteorological station observations over Tianshan Mountains, Central Asia. Atmos. Res. 2018, 203, 141–163. [Google Scholar] [CrossRef]
- Chen, X.; Liang, S.; Cao, Y.; He, T.; Wang, D. Observed contrast changes in snow cover phenology in northern middle and high latitudes from 2001–2014. Sci. Rep. 2015, 5, 1–9. [Google Scholar] [CrossRef] [PubMed]
- Kosaka, Y.; Xie, S.P. Recent global-warming hiatus tied to equatorial Pacific surface cooling. Nature 2013, 501, 403–407. [Google Scholar] [CrossRef] [PubMed] [Green Version]
- Cohen, J.L.; Furtado, J.C.; Barlow, M.A.; Alexeev, V.A.; Cherry, J.E. Arctic warming, increasing snow cover and widespread boreal winter cooling. Environ. Res. Lett. 2012, 7. [Google Scholar] [CrossRef]
- Cohen, J.; Screen, J.A.; Furtado, J.C.; Barlow, M.; Whittleston, D.; Coumou, D.; Francis, J.; Dethloff, K.; Entekhabi, D.; Overland, J.; et al. Recent Arctic amplification and extreme mid-latitude weather. Nat. Geosci. 2014, 7, 627–637. [Google Scholar] [CrossRef] [Green Version]
- Unger-Shayesteh, K.; Vorogushyn, S.; Farinotti, D.; Gafurov, A.; Duethmann, D.; Mandychev, A.; Merz, B. What do we know about past changes in the water cycle of Central Asian headwaters? A review. Glob. Planet. Chang. 2013, 110, 4–25. [Google Scholar] [CrossRef]
- Li, Q.; Yang, T.; Qi, Z.; Li, L. Spatiotemporal Variation of Snowfall to Precipitation Ratio and Its Implication on Water Resources by a Regional Climate Model over Xinjiang, China. Water 2018, 10, 1463. [Google Scholar] [CrossRef]
- Duethmann, D.; Bolch, T.; Farinotti, D.; Kriegel, D.; Vorogushyn, S.; Merz, B.; Pieczonka, T.; Jiang, T.; Su, B.; Güntner, A. Attribution of streamflow trends in snow-and glacier melt dominated catchments of the Tarim River, Central Asia. Water Resour. Res. 2015, 51, 4727–4750. [Google Scholar] [CrossRef]
- Yang, J.; Fang, G.; Chen, Y.; De-Maeyer, P. Climate change in the Tianshan and northern Kunlun Mountains based on GCM simulation ensemble with Bayesian model averaging. J. Arid Land 2017, 9, 622–634. [Google Scholar] [CrossRef]
- Walker, A.E.; Goodison, B.E. Discrimination of a wet snow cover using passive microwave satellite data. Ann. Glaciol. 1993, 17, 307–311. [Google Scholar] [CrossRef] [Green Version]
- Vuyovich, C.M.; Jacobs, J.M.; Hiemstra, C.A.; Deeb, E.J. Effect of spatial variability of wet snow on modeled and observed microwave emissions. Remote Sens. Environ. 2017, 198, 310–320. [Google Scholar] [CrossRef]
- Singh, P.; Gan, T. Retrieval of Snow Water Equivalent Using Passive Microwave Brightness Temperature Data. Remote Sens. Environ. 2000, 74, 275–286. [Google Scholar] [CrossRef]
- Chen, X.; Long, D.; Liang, S.; He, L.; Zeng, C.; Hao, X.; Hong, Y. Developing a composite daily snow cover extent record over the Tibetan Plateau from 1981 to 2016 using multisource data. Remote Sens. Environ. 2018, 215, 284–299. [Google Scholar] [CrossRef]
- Yao, H.; Field, T.; McConnell, C.; Beaton, A.; James, A.L. Comparison of five snow water equivalent estimation methods across categories. Hydrol. Process. 2018, 32, 1894–1908. [Google Scholar] [CrossRef]
- Dai, L.; Che, T.; Ding, Y.; Hao, X. Evaluation of snow cover and snow depth on the Qinghai–Tibetan Plateau derived from passive microwave remote sensing. Cryosphere 2017, 11, 1933–1948. [Google Scholar] [CrossRef] [Green Version]
- Xiao, X.; Zhang, T.; Zhong, X.; Shao, W.; Li, X. Support vector regression snow-depth retrieval algorithm using passive microwave remote sensing data. Remote Sens. Environ. 2018, 210, 48–64. [Google Scholar] [CrossRef]
- Zhang, R.; Liang, T.; Feng, Q.; Huang, X.; Wang, W.; Xie, H.; Guo, J. Evaluation and Adjustment of the AMSR2 Snow Depth Algorithm for the Northern Xinjiang Region, China. IEEE J. Sel. Top. Appl. Earth Obs. Remote Sens. 2017, 10, 3892–3903. [Google Scholar] [CrossRef]
- Che, T.; Li, X.; Jin, R.; Huang, C. Assimilating passive microwave remote sensing data into a land surface model to improve the estimation of snow depth. Remote Sens. Environ. 2014, 143, 54–63. [Google Scholar] [CrossRef]
- Knowles, J.F.; Blanken, P.D.; Williams, M.W. Wet meadow ecosystems contribute the majority of overwinter soil respiration from snow-scoured alpine tundra. J. Geophys. Res. G Biogeosci. 2016, 121, 1118–1130. [Google Scholar] [CrossRef]
- Wang, S.; Wang, X.; Chen, G.; Yang, Q.; Wang, B.; Ma, Y.; Shen, M. Complex responses of spring alpine vegetation phenology to snow cover dynamics over the Tibetan Plateau, China. Sci. Total Environ. 2017, 593–594, 449–461. [Google Scholar] [CrossRef] [PubMed]
- Xie, J.; Kneubühler, M.; Garonna, I.; Notarnicola, C.; De Gregorio, L.; De Jong, R.; Chimani, B.; Schaepman, M.E. Altitude-dependent influence of snow cover on alpine land surface phenology. J. Geophys. Res. Biogeosci. 2017, 122, 1107–1122. [Google Scholar] [CrossRef] [Green Version]
- Zhao, W.Y.; Li, J.L.; Qi, J.G. Changes in vegetation diversity and structure in response to heavy grazing pressure in the northern Tianshan Mountains, China. J. Arid Environ. 2007, 68, 465–479. [Google Scholar] [CrossRef]
Figure 1.
(a) Location of the Tianshan Mountains (TS) and the distribution of the meteorological stations. (b) Annual precipitation over the TS from 1979 to 2016 (Global Precipitation Climatology Centre products (GPCC)). (c) Monthly distribution of precipitation and temperature in the TS during 1979–2016 (GPCC and Global Historical Climatology Network 2 and Climate Anomaly Monitoring System (GHCN_CAMS)). (d) Averaged snow depth time series over the TS during 1979–2016.

Figure 2.
Averaged snow phenology over the period of 1979–2016: (a) snow onset day Do, (b) snow end day De, (c) snow cover duration Dd, and (d) maximum snow depth SDmax.
Figure 2.
Averaged snow phenology over the period of 1979–2016: (a) snow onset day Do, (b) snow end day De, (c) snow cover duration Dd, and (d) maximum snow depth SDmax.

Figure 3.
Temporal trends in snow phenology: (a) snow onset day Do, (b) snow end day De, (c) snow cover duration Dd, and (d) maximum snow depth SDmax. The black dots in Figure 3 indicate that the trends were significant (significance level at 0.05).
Figure 3.
Temporal trends in snow phenology: (a) snow onset day Do, (b) snow end day De, (c) snow cover duration Dd, and (d) maximum snow depth SDmax. The black dots in Figure 3 indicate that the trends were significant (significance level at 0.05).

Figure 4.
(a) Annual variations of snow onset day Do, snow end day De, and snow cover durations Dd from 1979 to 2016 over the TS; (b) Contributions from Do and De to Dd across the TS during 1979–2016 (normalized values); (c) Relationship between Do and Dd; (d) Relationship between De and Dd. R2 is the coefficient of determination.

Figure 5.
Spatial distribution of changes in temperature and precipitation over the TS from 1979 to 2016. The spatial pattern of (a) days with a mean temperature of <0 °C and (b) changes from meteorological observations. The variations of (c) annual mean Ta, (d) Tm, (e) Pa, and (f) Pm. The black crosses and dots in Figure 5 indicate that the trends were significant (significance level at 0.05).

Figure 6.
(a) Sensitivity of Do to Ta (days °C−1), (b) sensitivity of Do to Pa (days mm−1), (c) sensitivity of SDmax to Ta (cm °C−1), (d) sensitivity of SDmax to Pa (cm mm−1), (e) sensitivity of De to Tm (days °C−1), and (f) sensitivity of De to SDmax (days cm−1). The black dots in Figure 6 indicate that the correlation was significant (significance level at 0.05).

Figure 7.
Runoff time series from (a) Bayanbulak hydrological station (84°08′, 43°01′) and (b) Dashankou hydrological station (85°44′, 42°13′) in the Kaidu River. The 1980s and 2000s represent the average of the periods of 1980–1989 and 2000–2009, respectively.
Figure 7.
Runoff time series from (a) Bayanbulak hydrological station (84°08′, 43°01′) and (b) Dashankou hydrological station (85°44′, 42°13′) in the Kaidu River. The 1980s and 2000s represent the average of the periods of 1980–1989 and 2000–2009, respectively.

© 2019 by the authors. Licensee MDPI, Basel, Switzerland. This article is an open access article distributed under the terms and conditions of the Creative Commons Attribution (CC BY) license (http://creativecommons.org/licenses/by/4.0/).
Share and Cite
MDPI and ACS Style
Yang, T.; Li, Q.; Ahmad, S.; Zhou, H.; Li, L. Changes in Snow Phenology from 1979 to 2016 over the Tianshan Mountains, Central Asia. Remote Sens. 2019, 11, 499. https://0-doi-org.brum.beds.ac.uk/10.3390/rs11050499
AMA Style
Yang T, Li Q, Ahmad S, Zhou H, Li L. Changes in Snow Phenology from 1979 to 2016 over the Tianshan Mountains, Central Asia. Remote Sensing. 2019; 11(5):499. https://0-doi-org.brum.beds.ac.uk/10.3390/rs11050499
Chicago/Turabian StyleYang, Tao, Qian Li, Sajjad Ahmad, Hongfei Zhou, and Lanhai Li. 2019. "Changes in Snow Phenology from 1979 to 2016 over the Tianshan Mountains, Central Asia" Remote Sensing 11, no. 5: 499. https://0-doi-org.brum.beds.ac.uk/10.3390/rs11050499
Note that from the first issue of 2016, this journal uses article numbers instead of page numbers. See further details here.