Damage Detection and Analysis of Urban Bridges Using Terrestrial Laser Scanning (TLS), Ground-Based Microwave Interferometry, and Permanent Scatterer Interferometry Synthetic Aperture Radar (PS-InSAR)

Abstract
:
1. Introduction
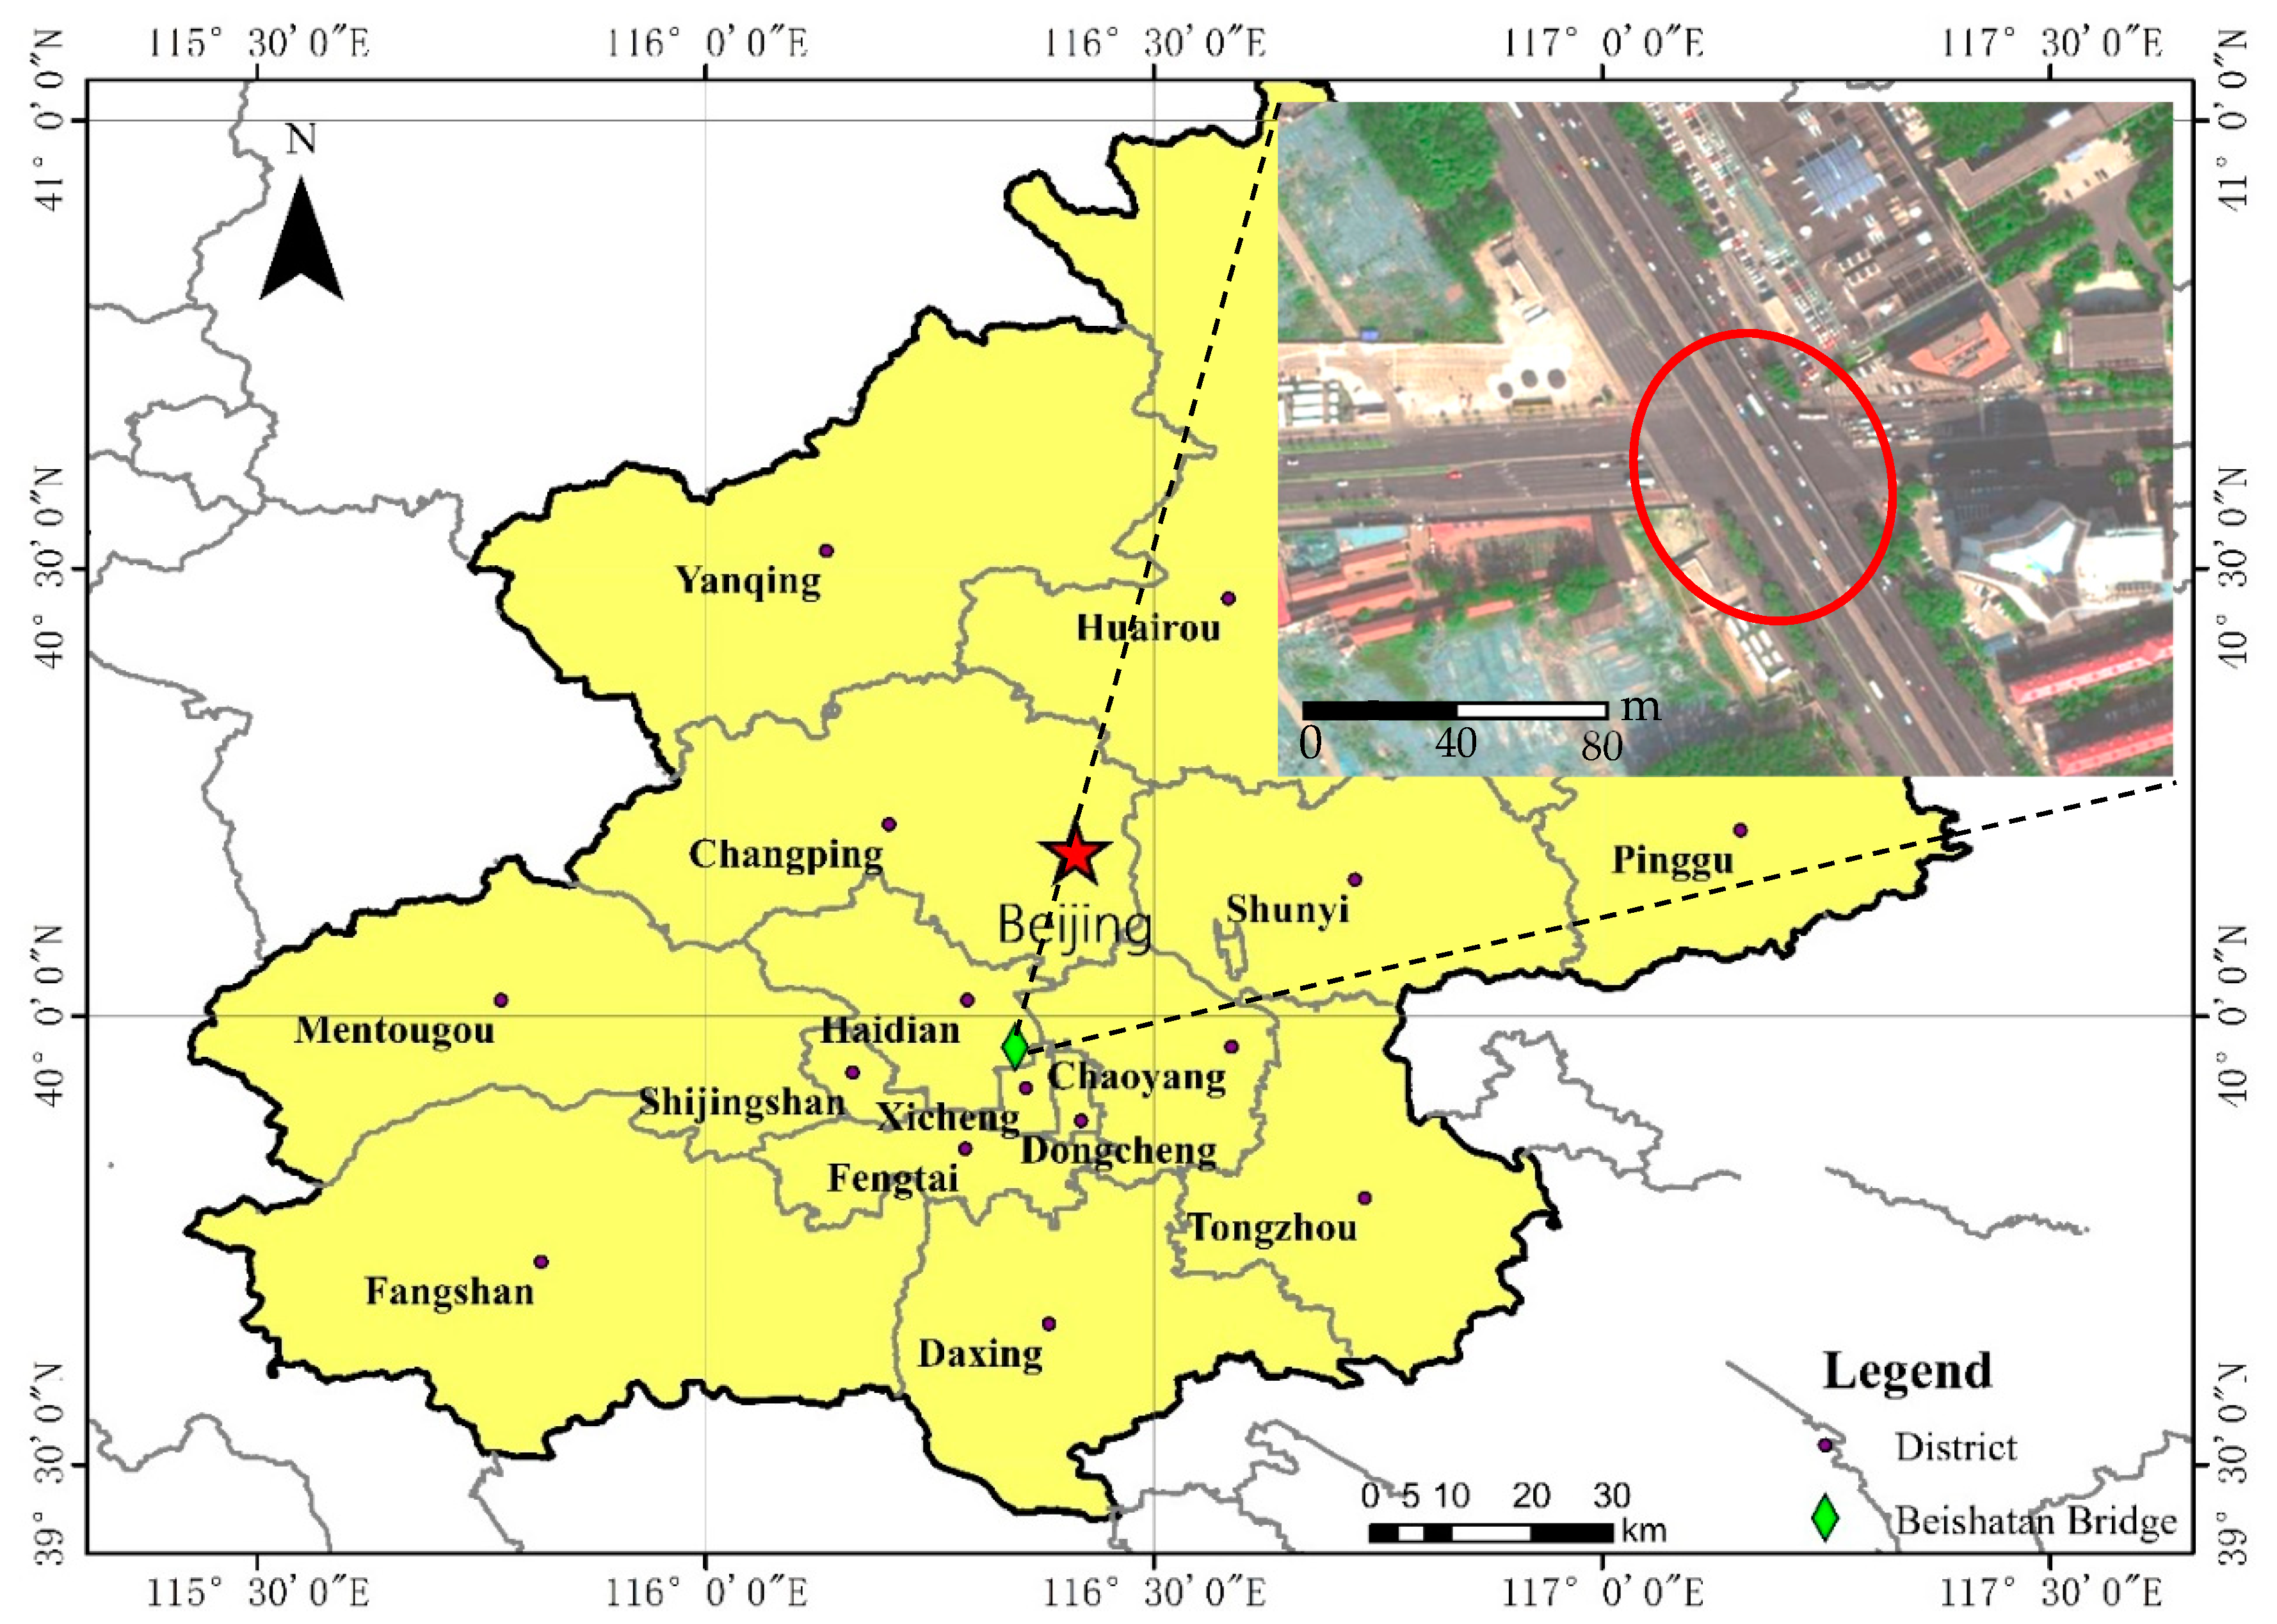
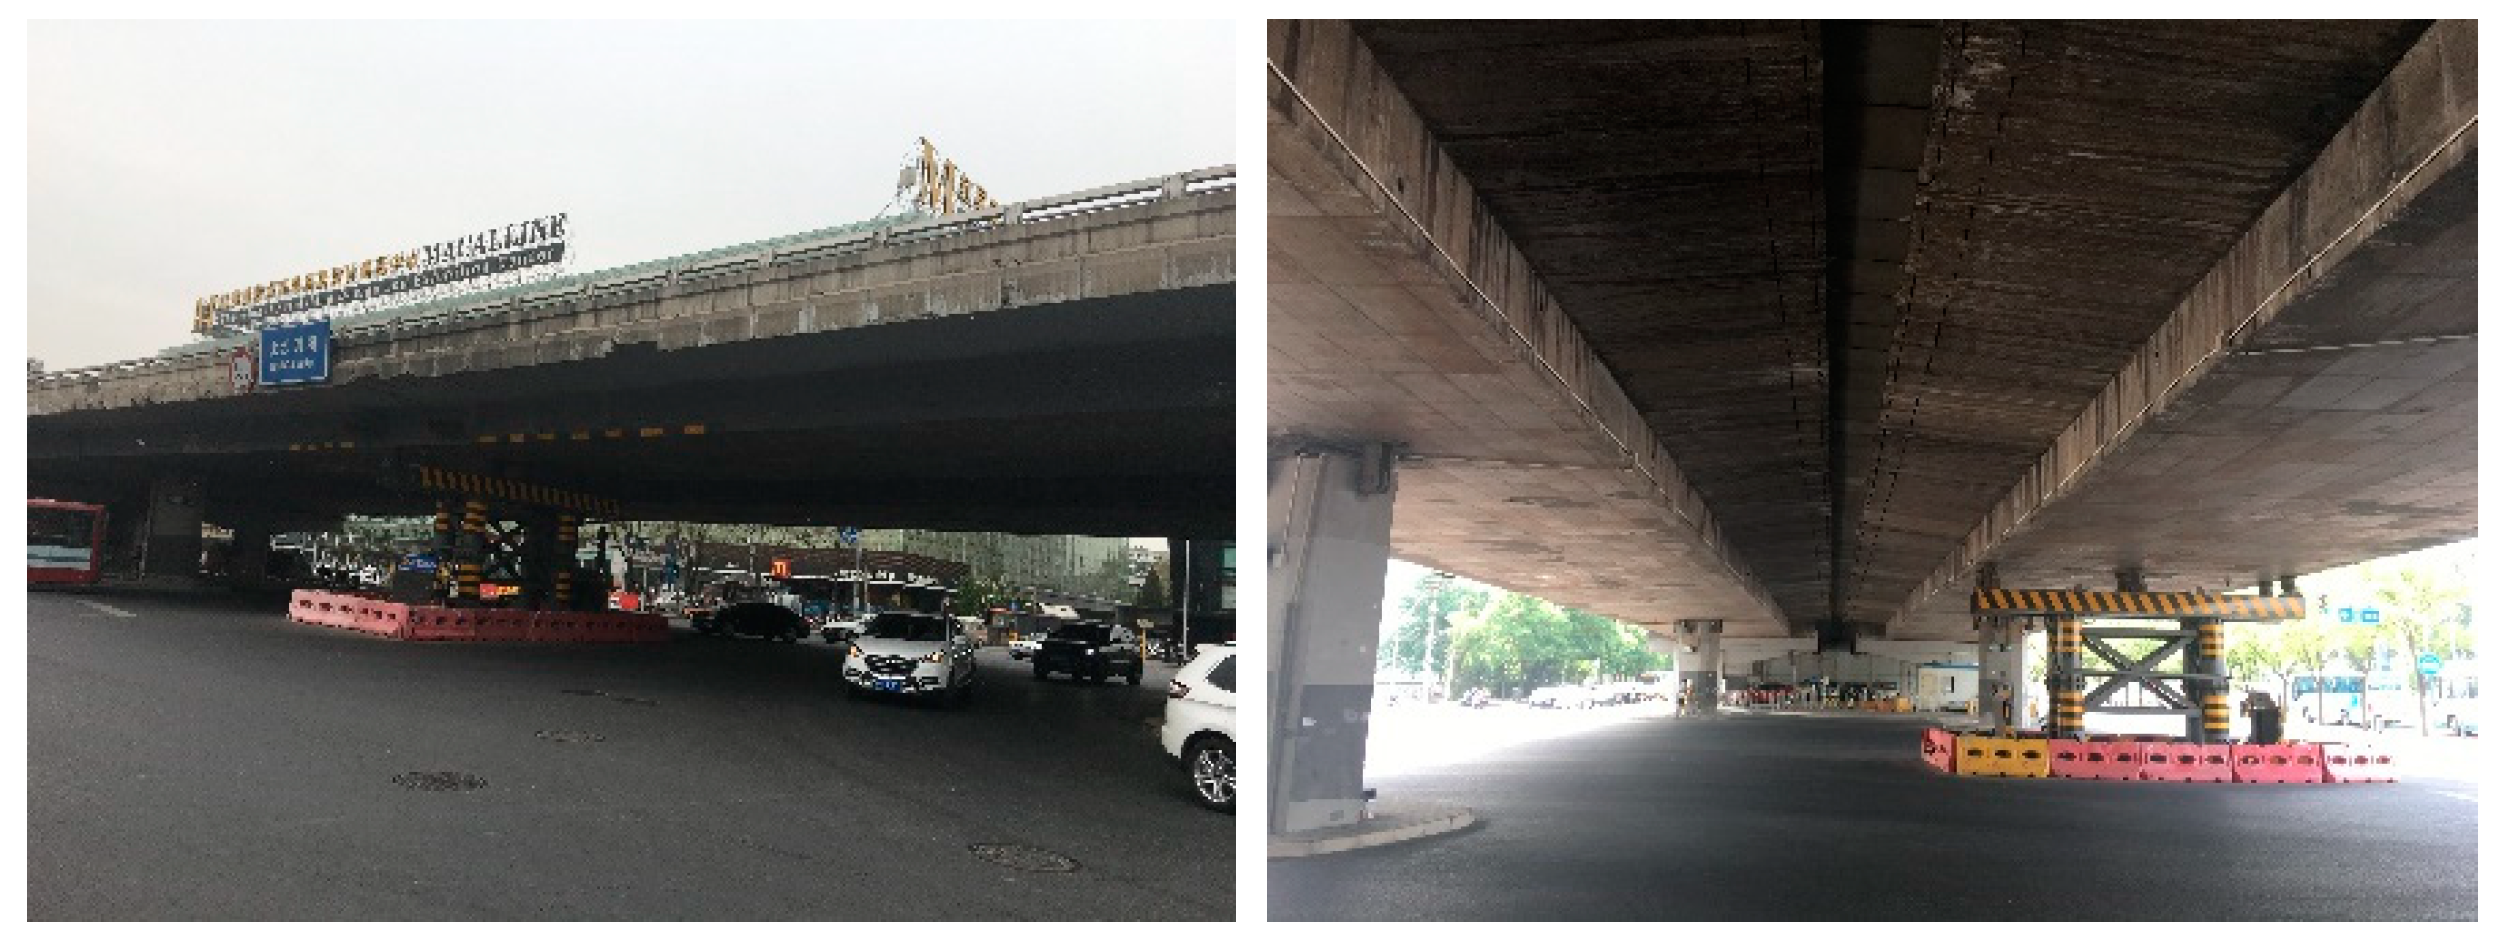
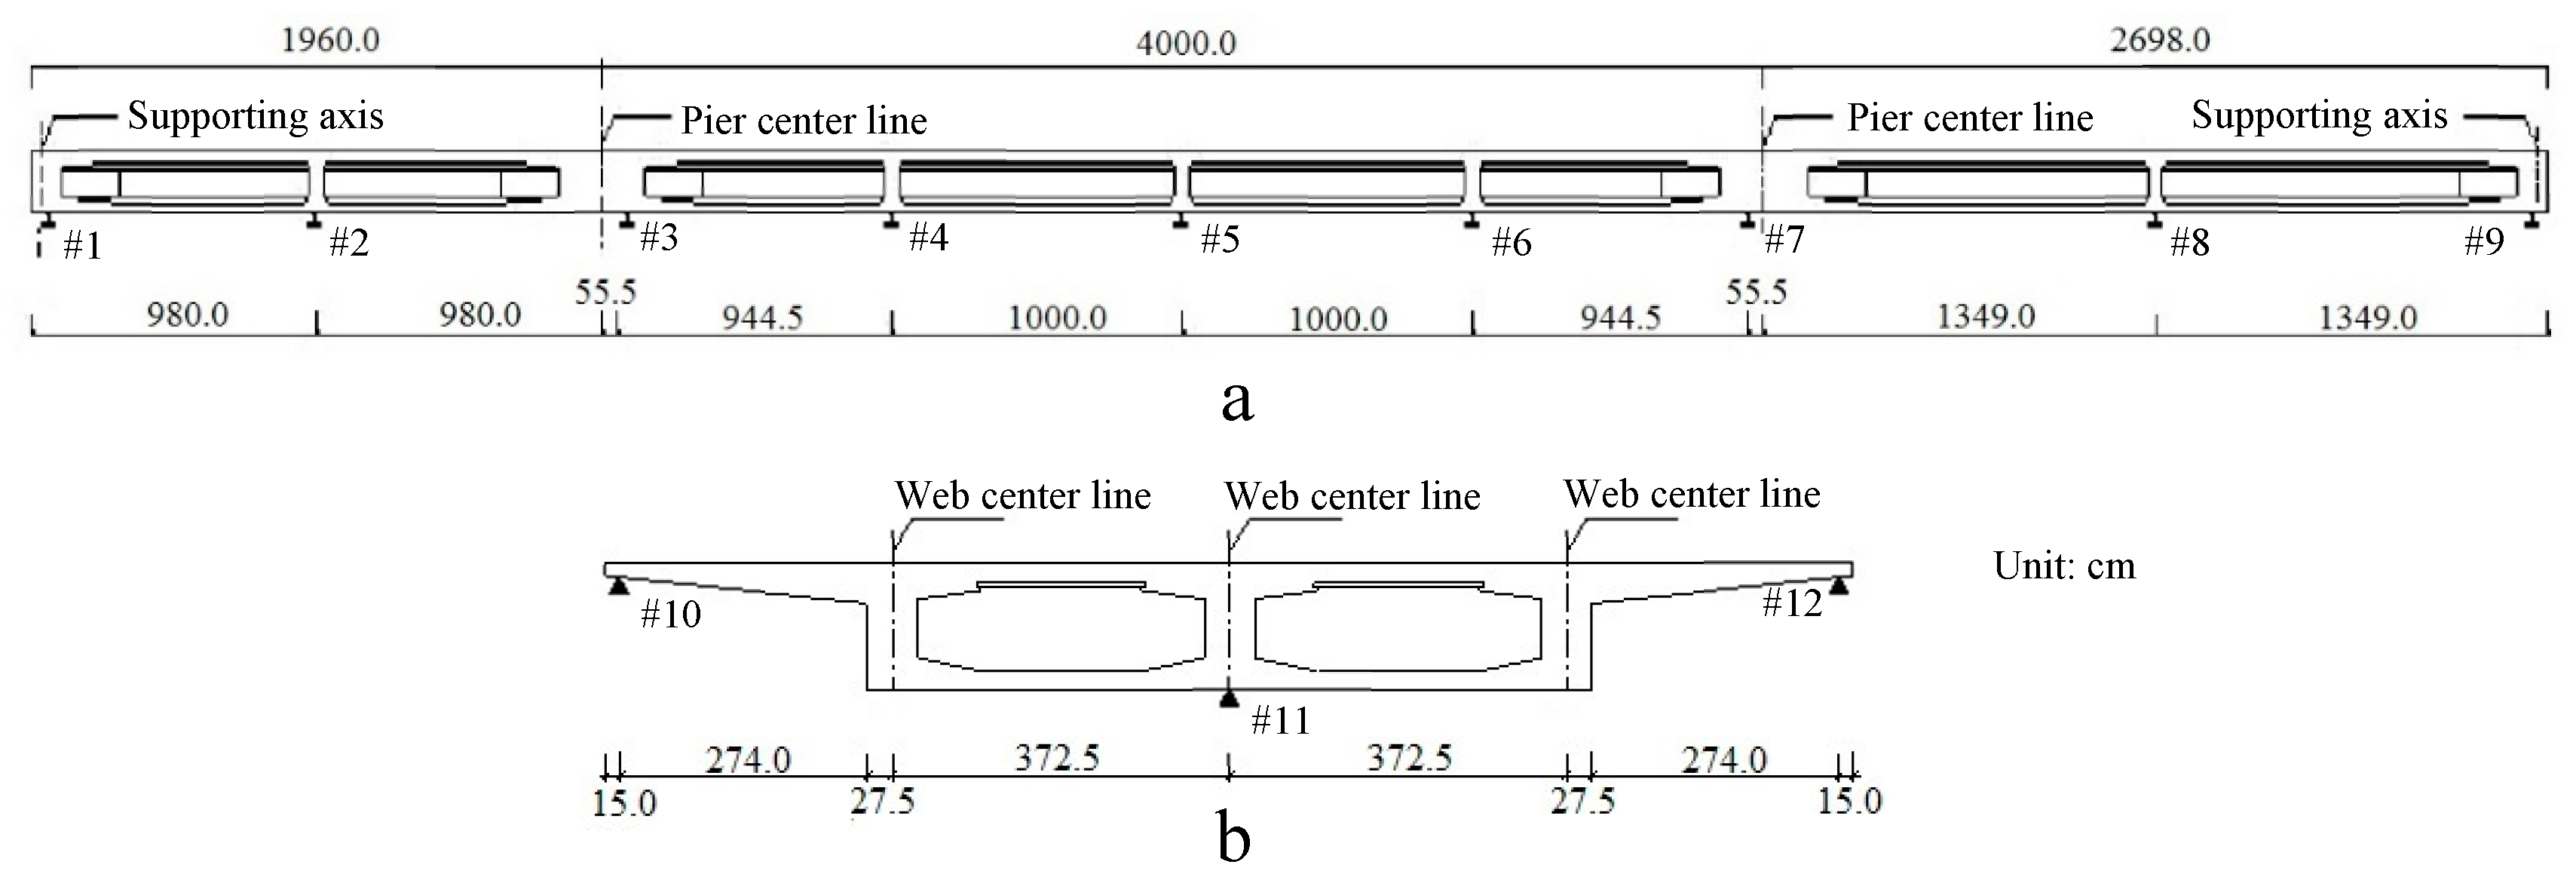
2. Study Site
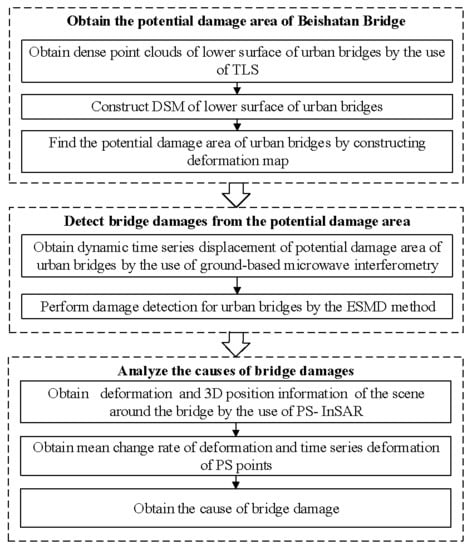
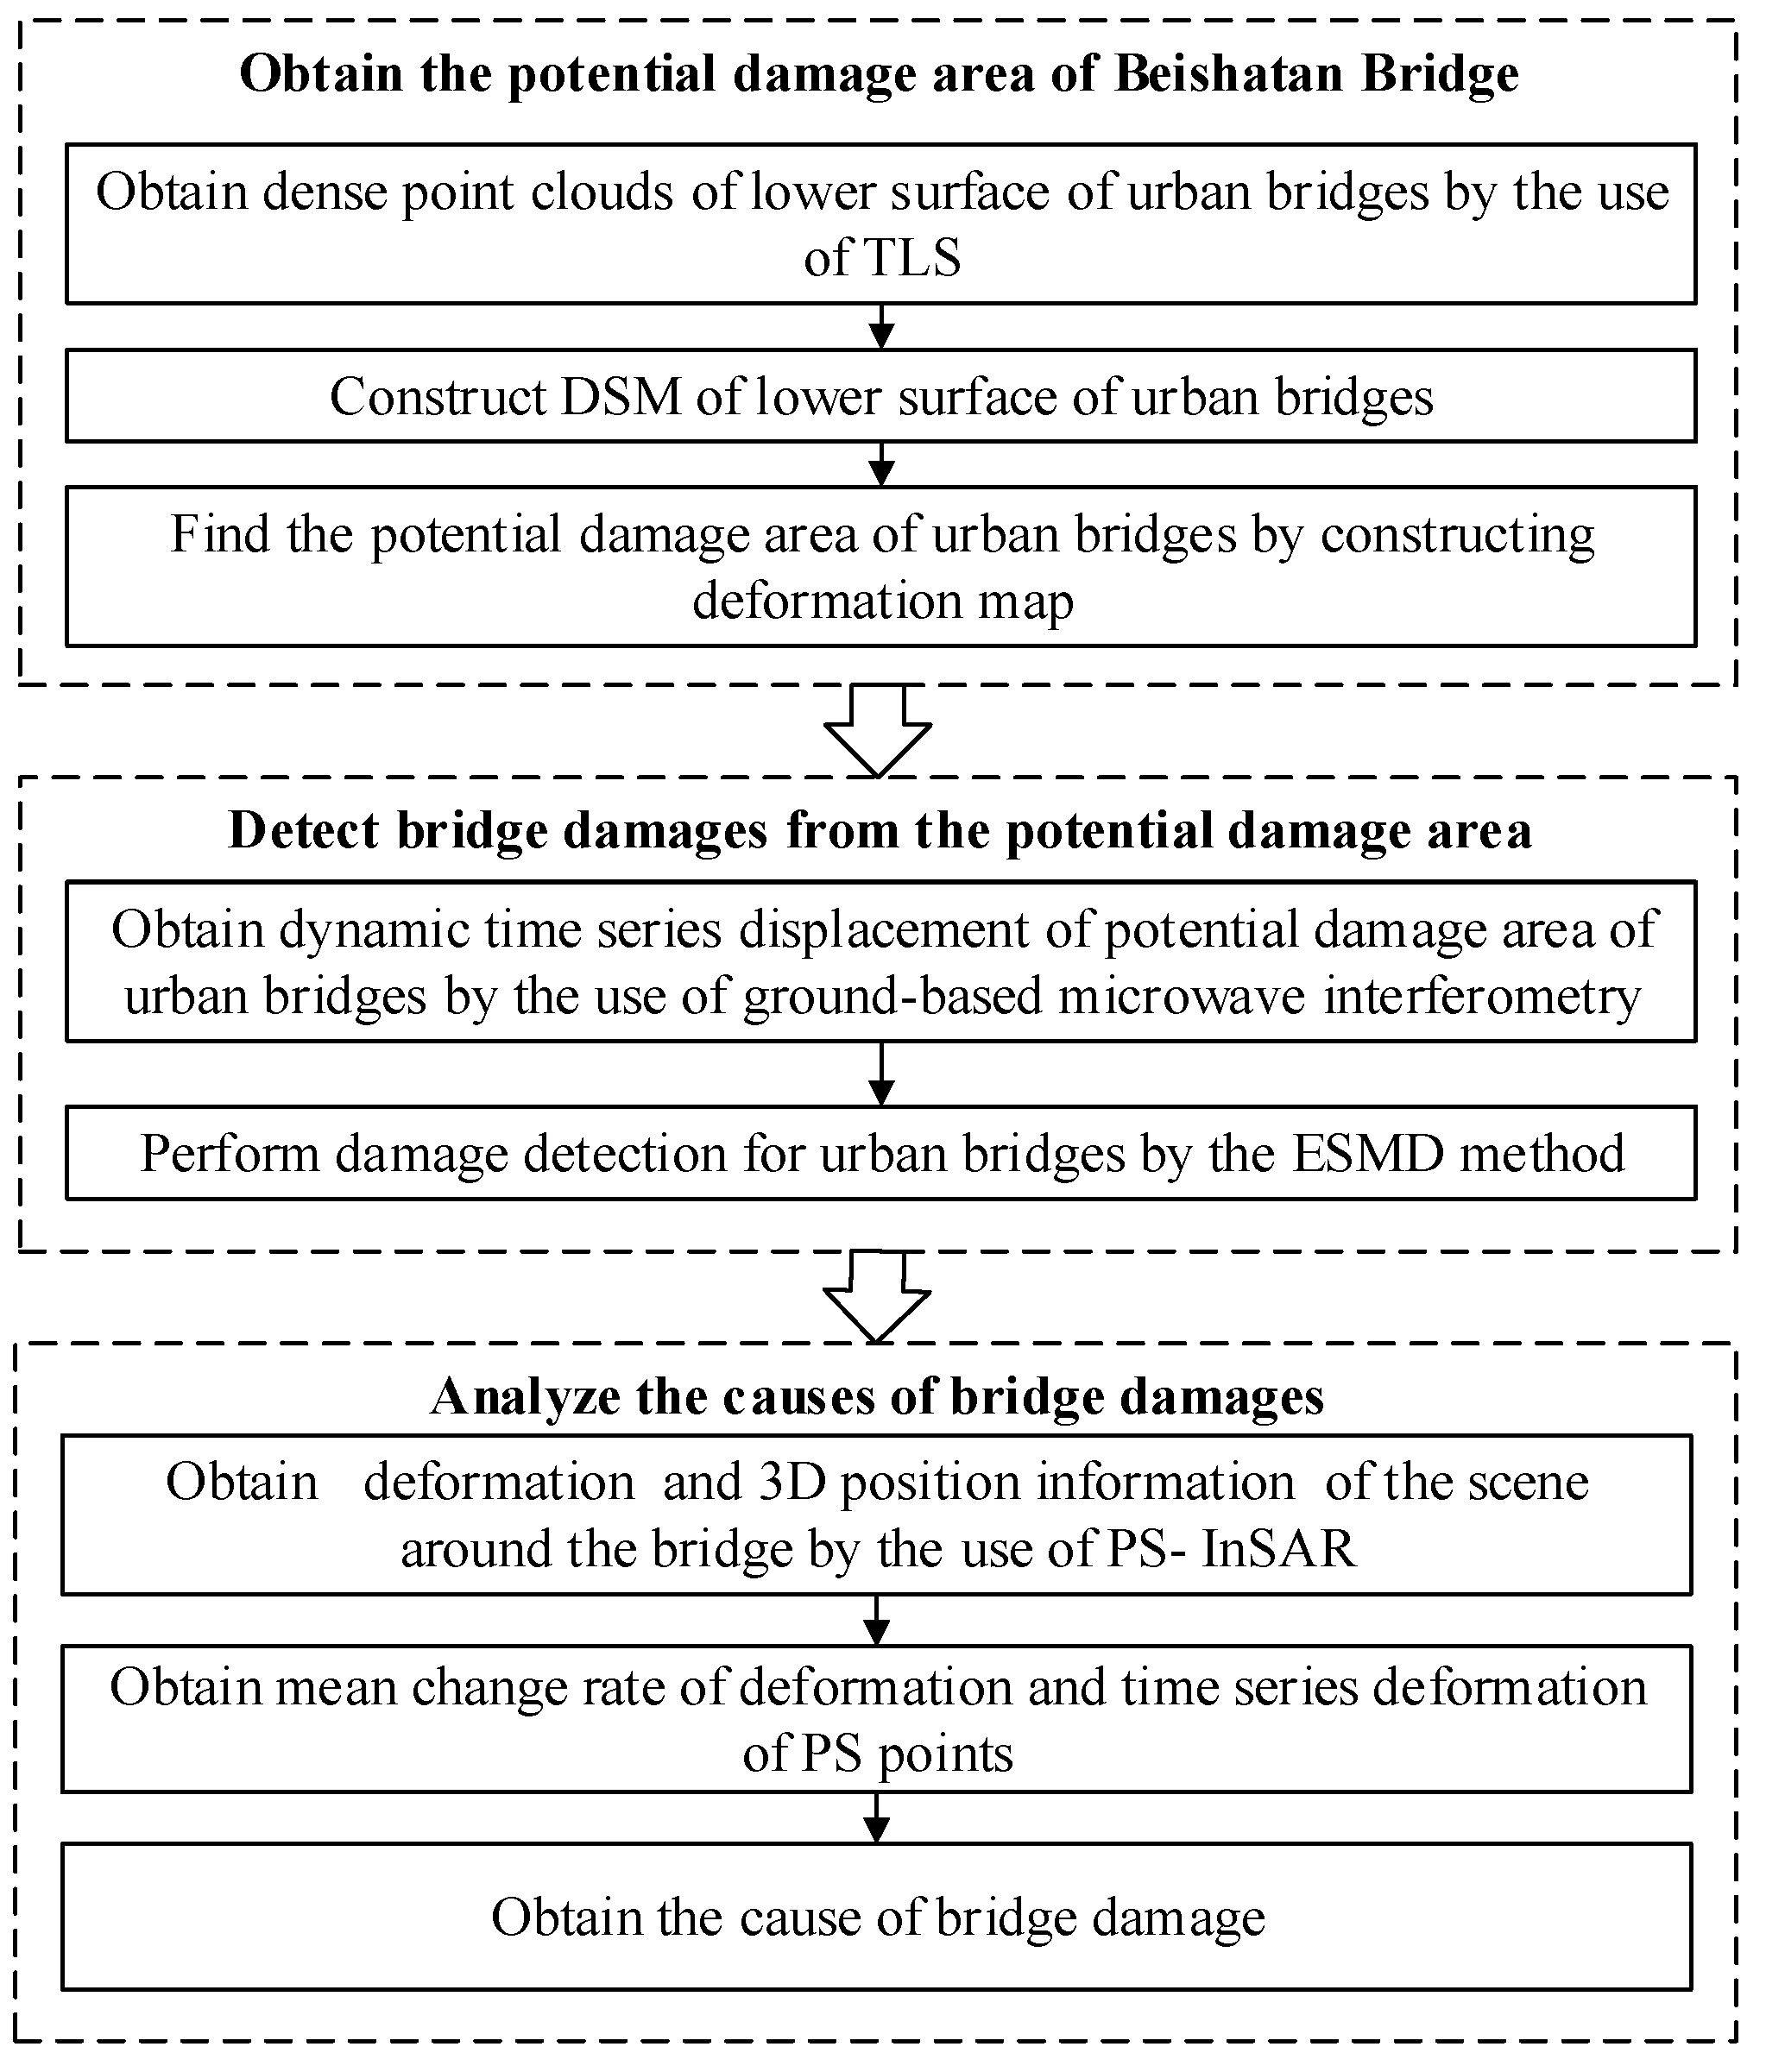
3. Methods
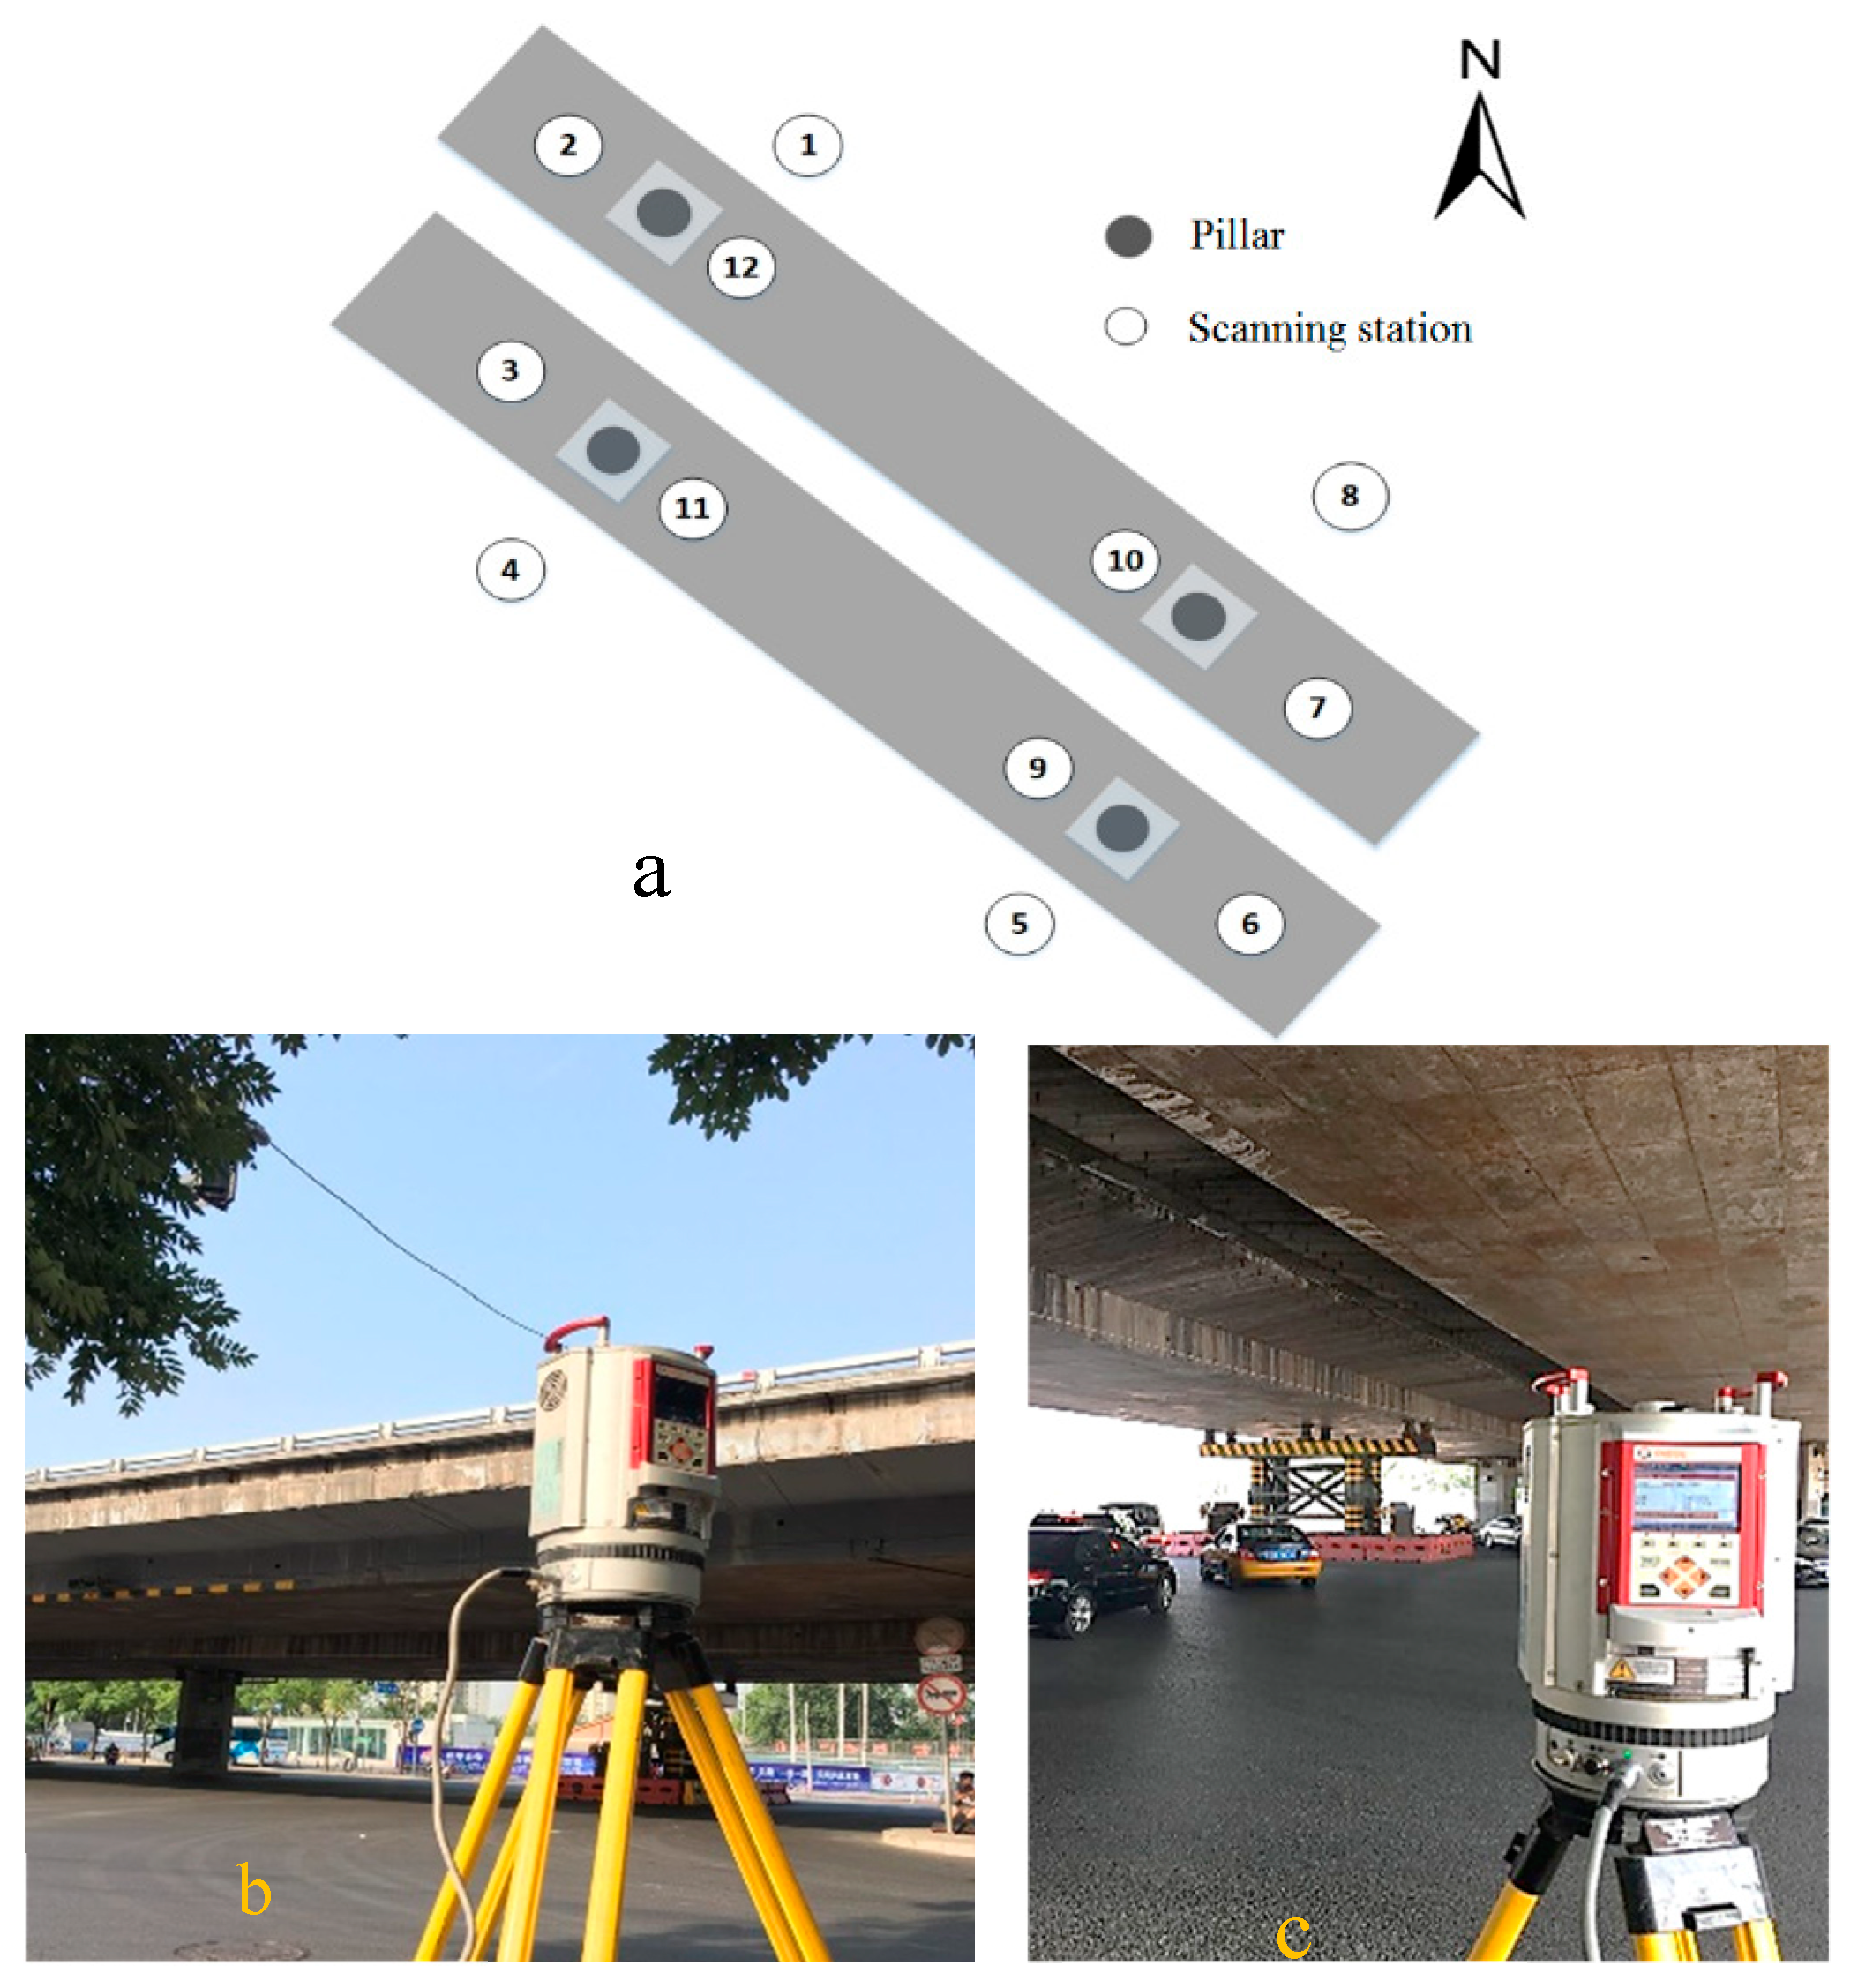
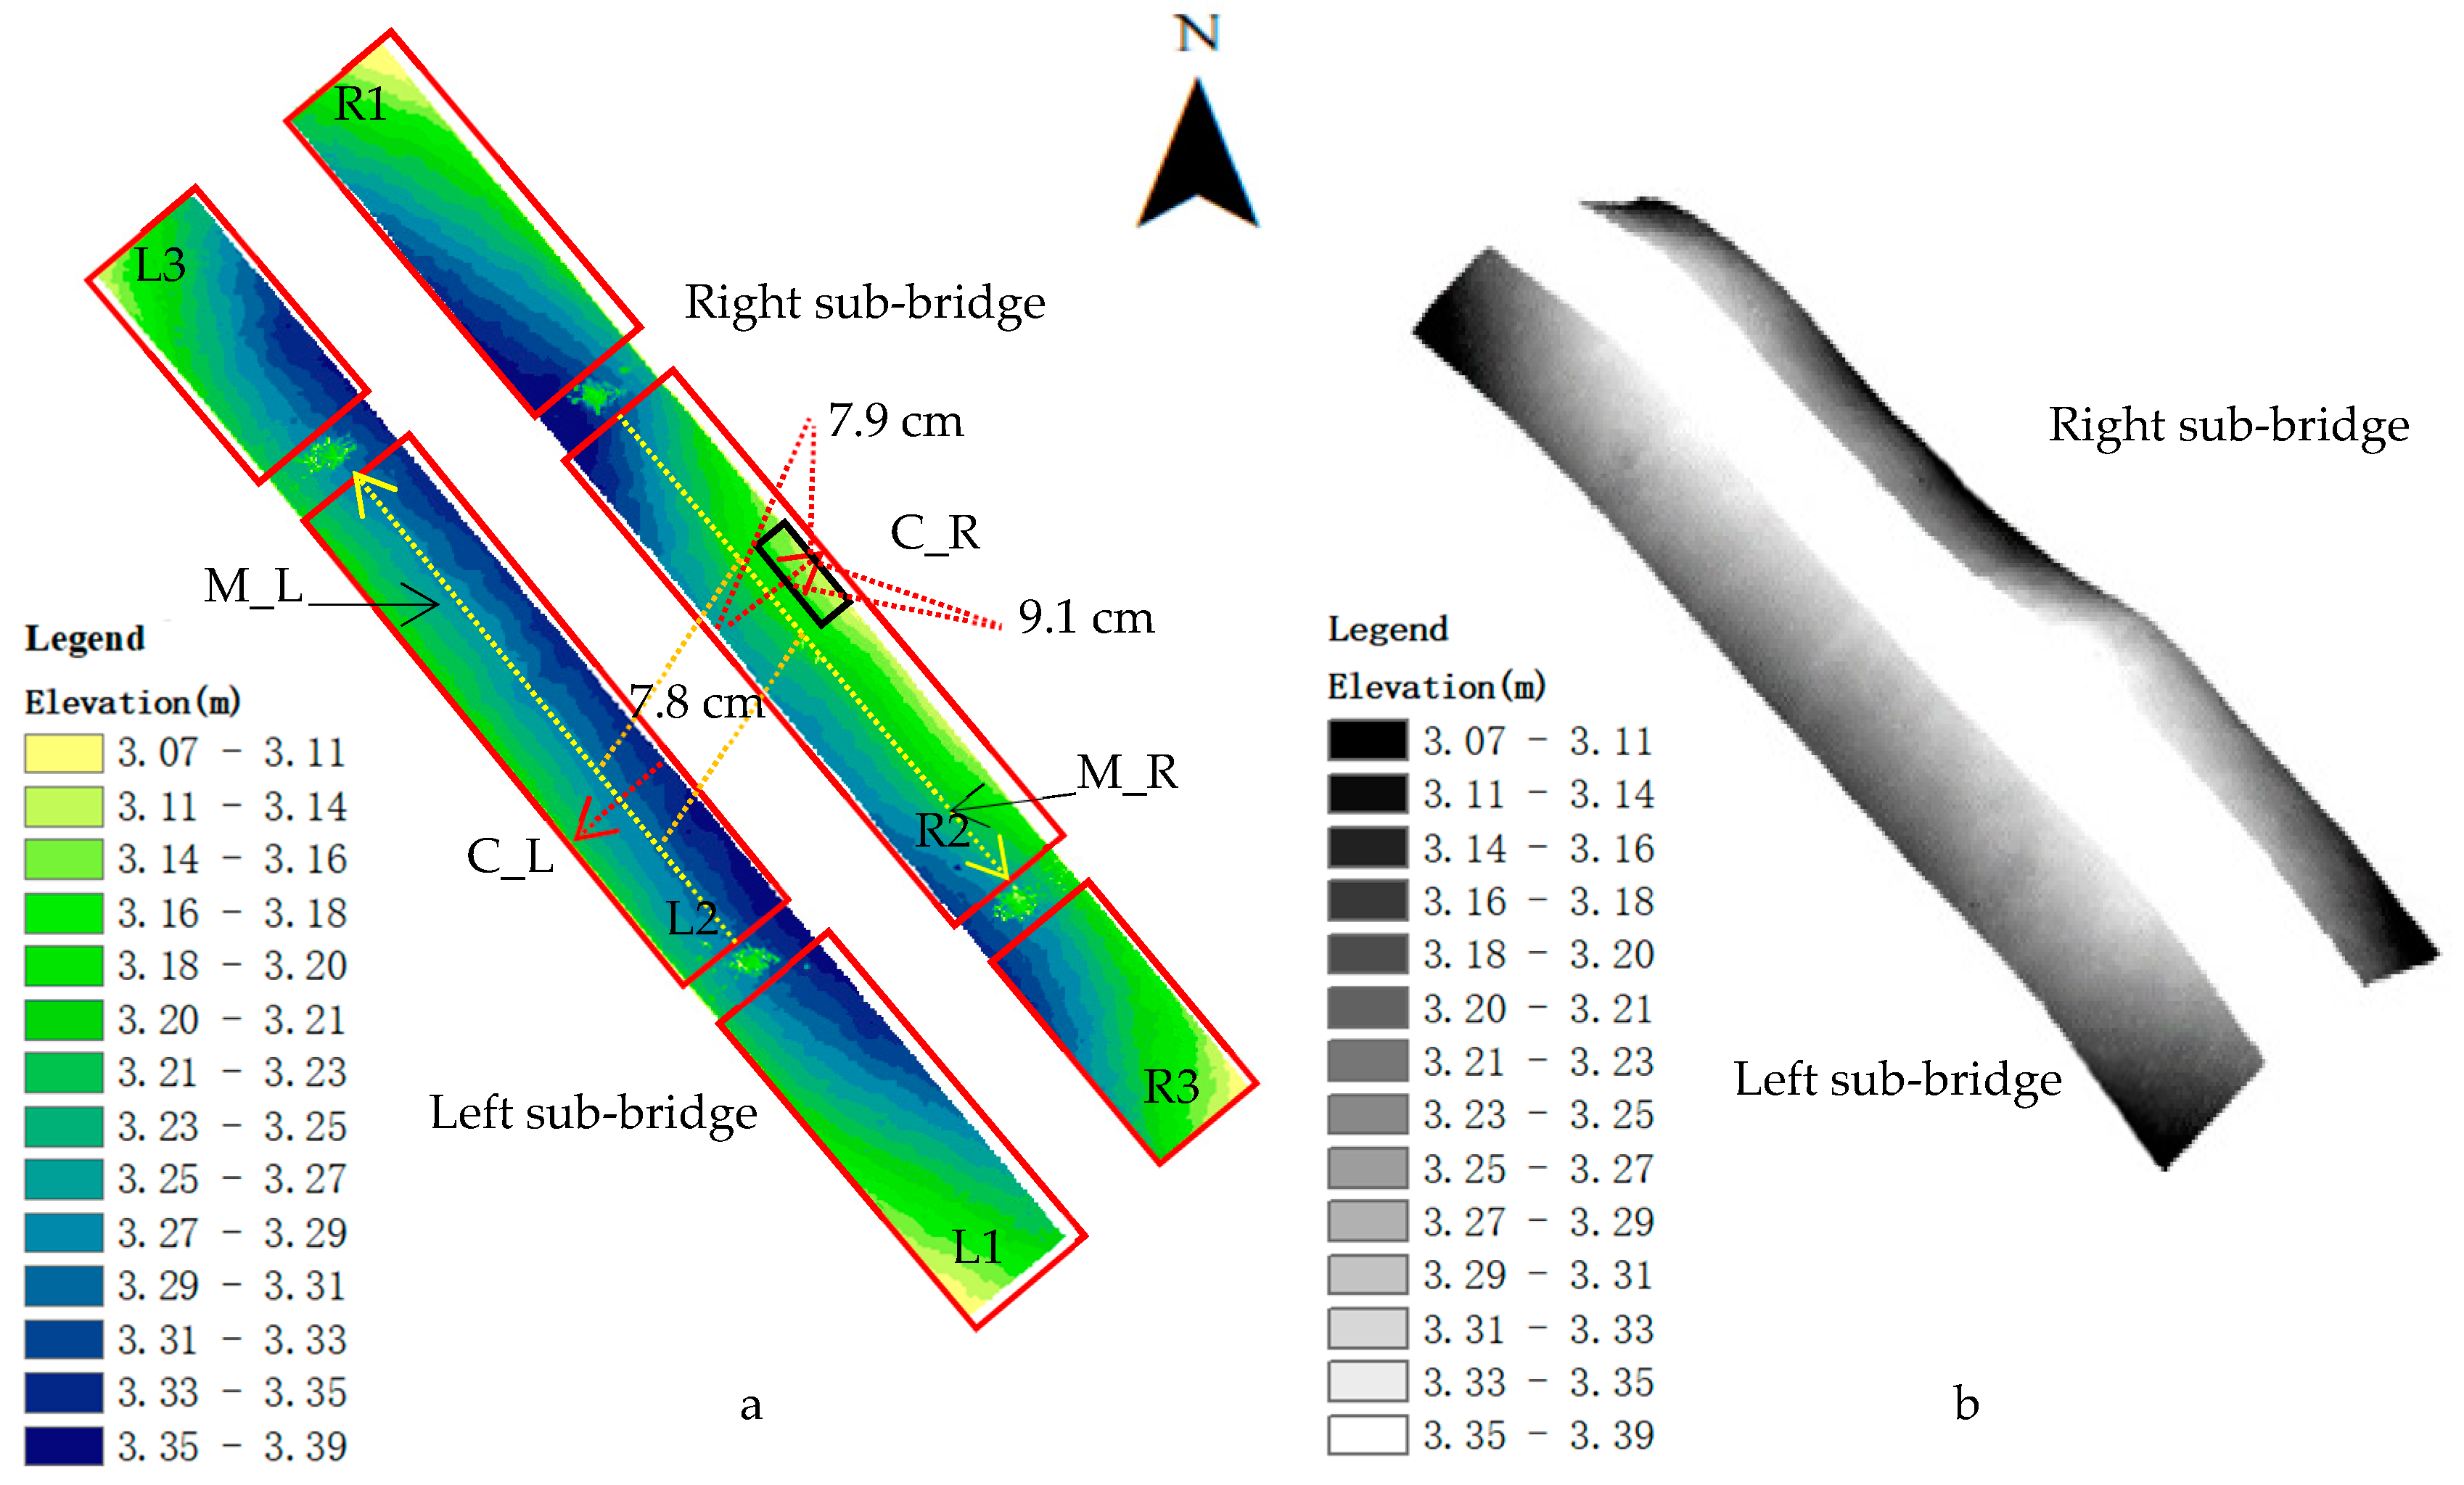
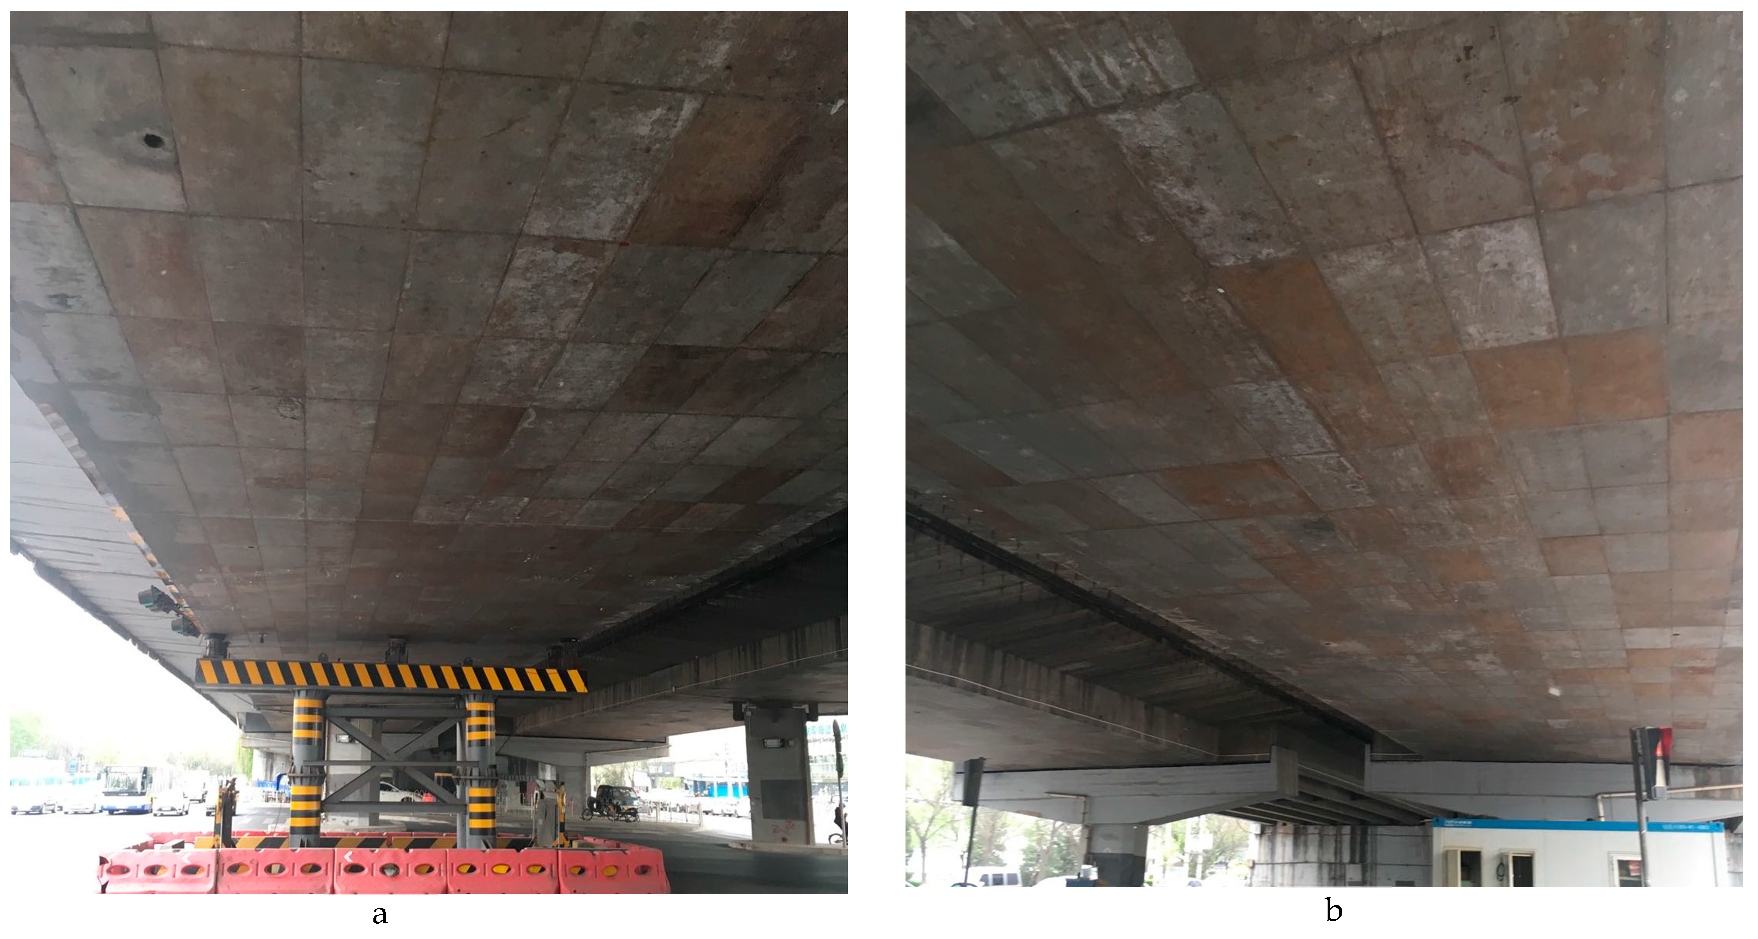
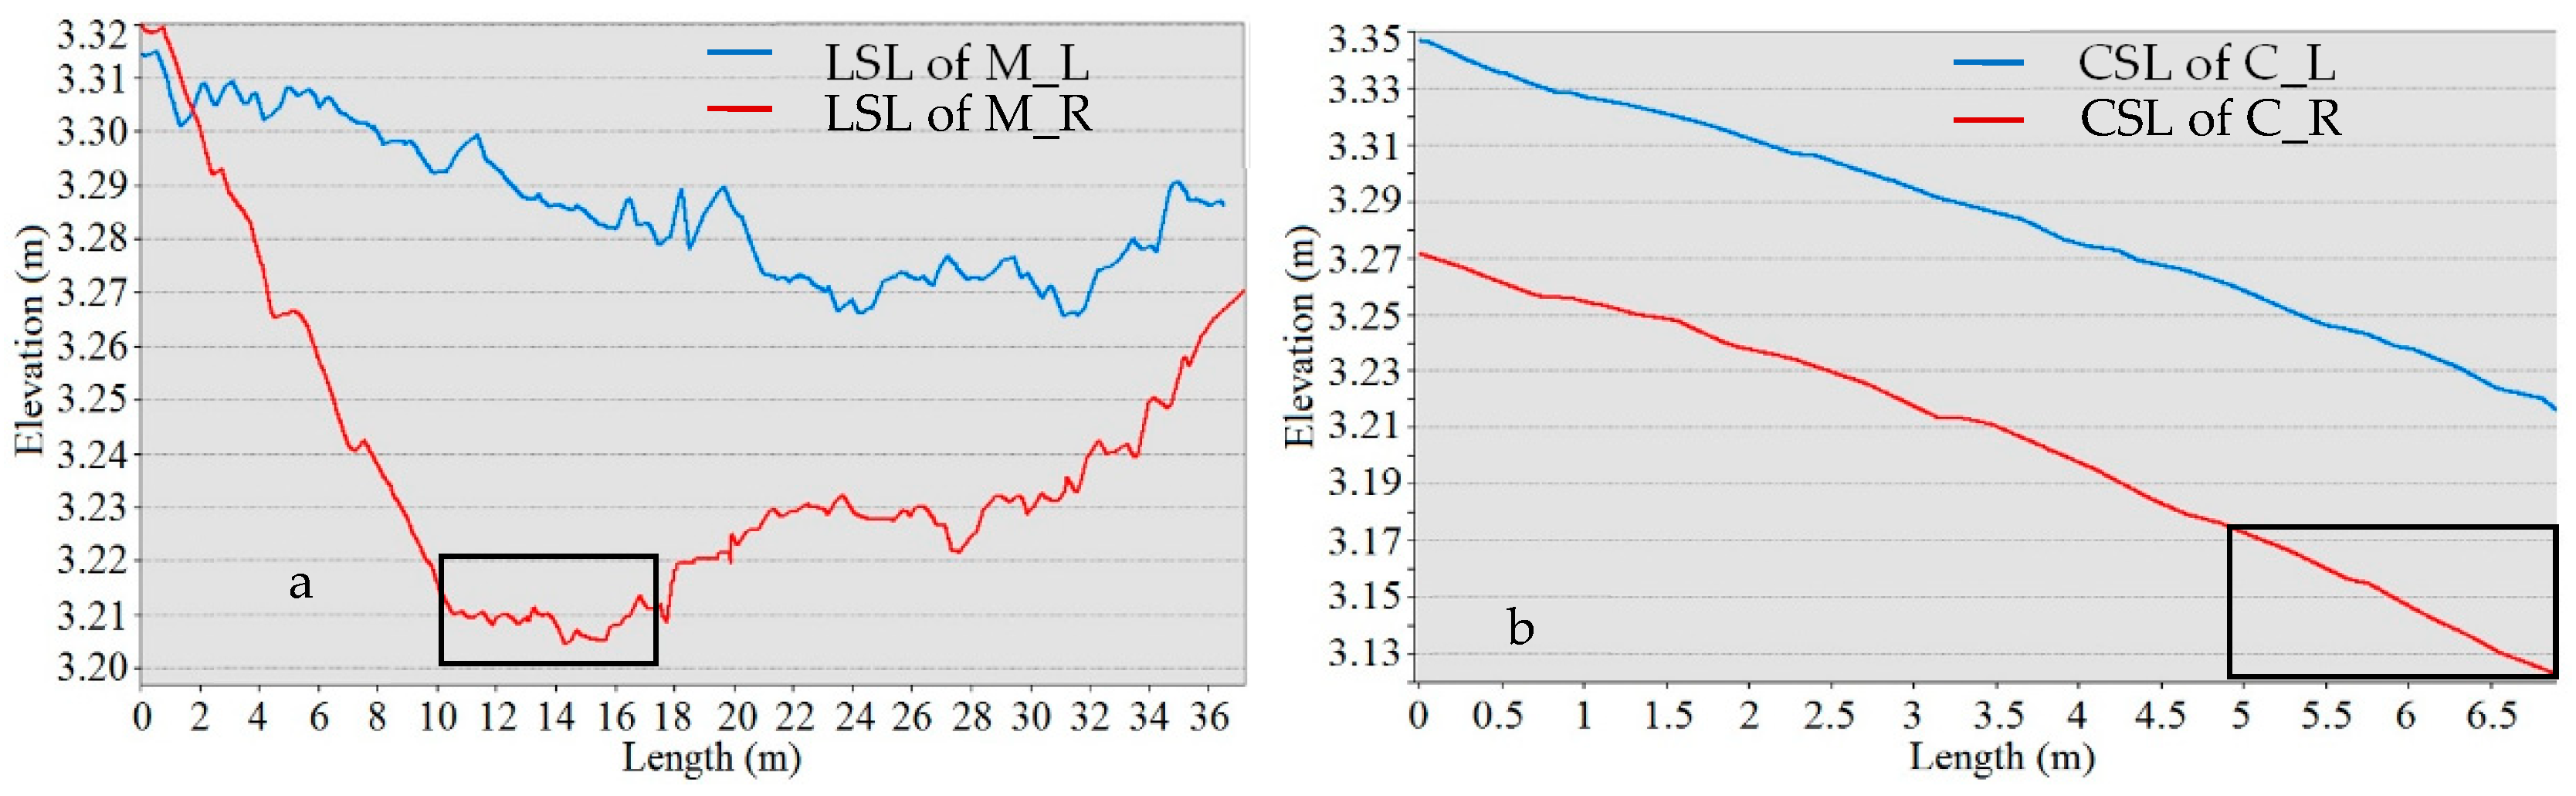
3.1. Potential Damage Area Acquired by Using TLS
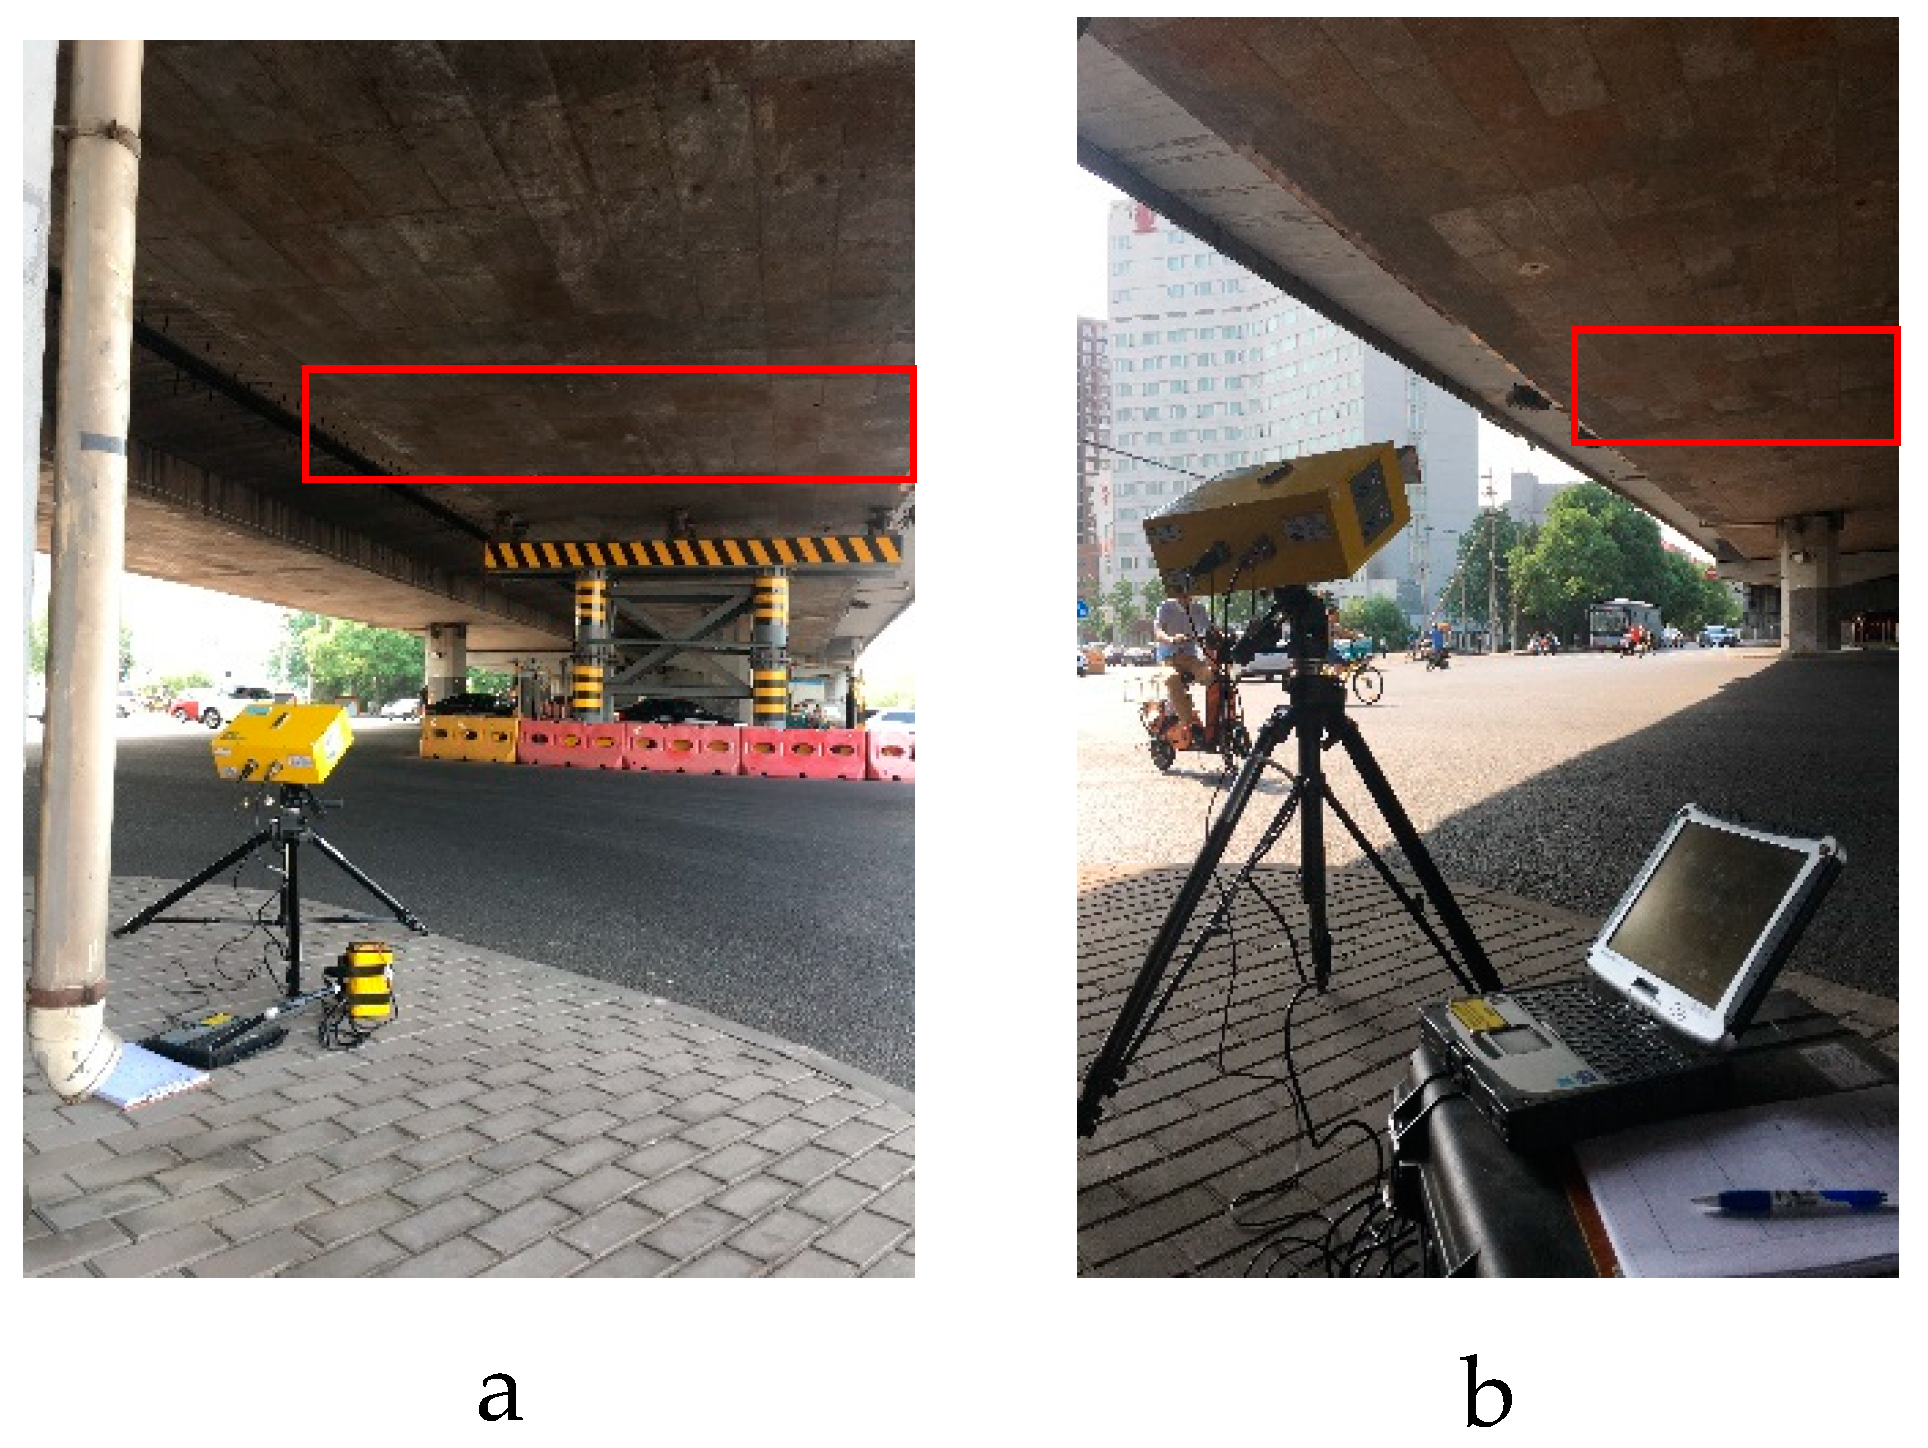
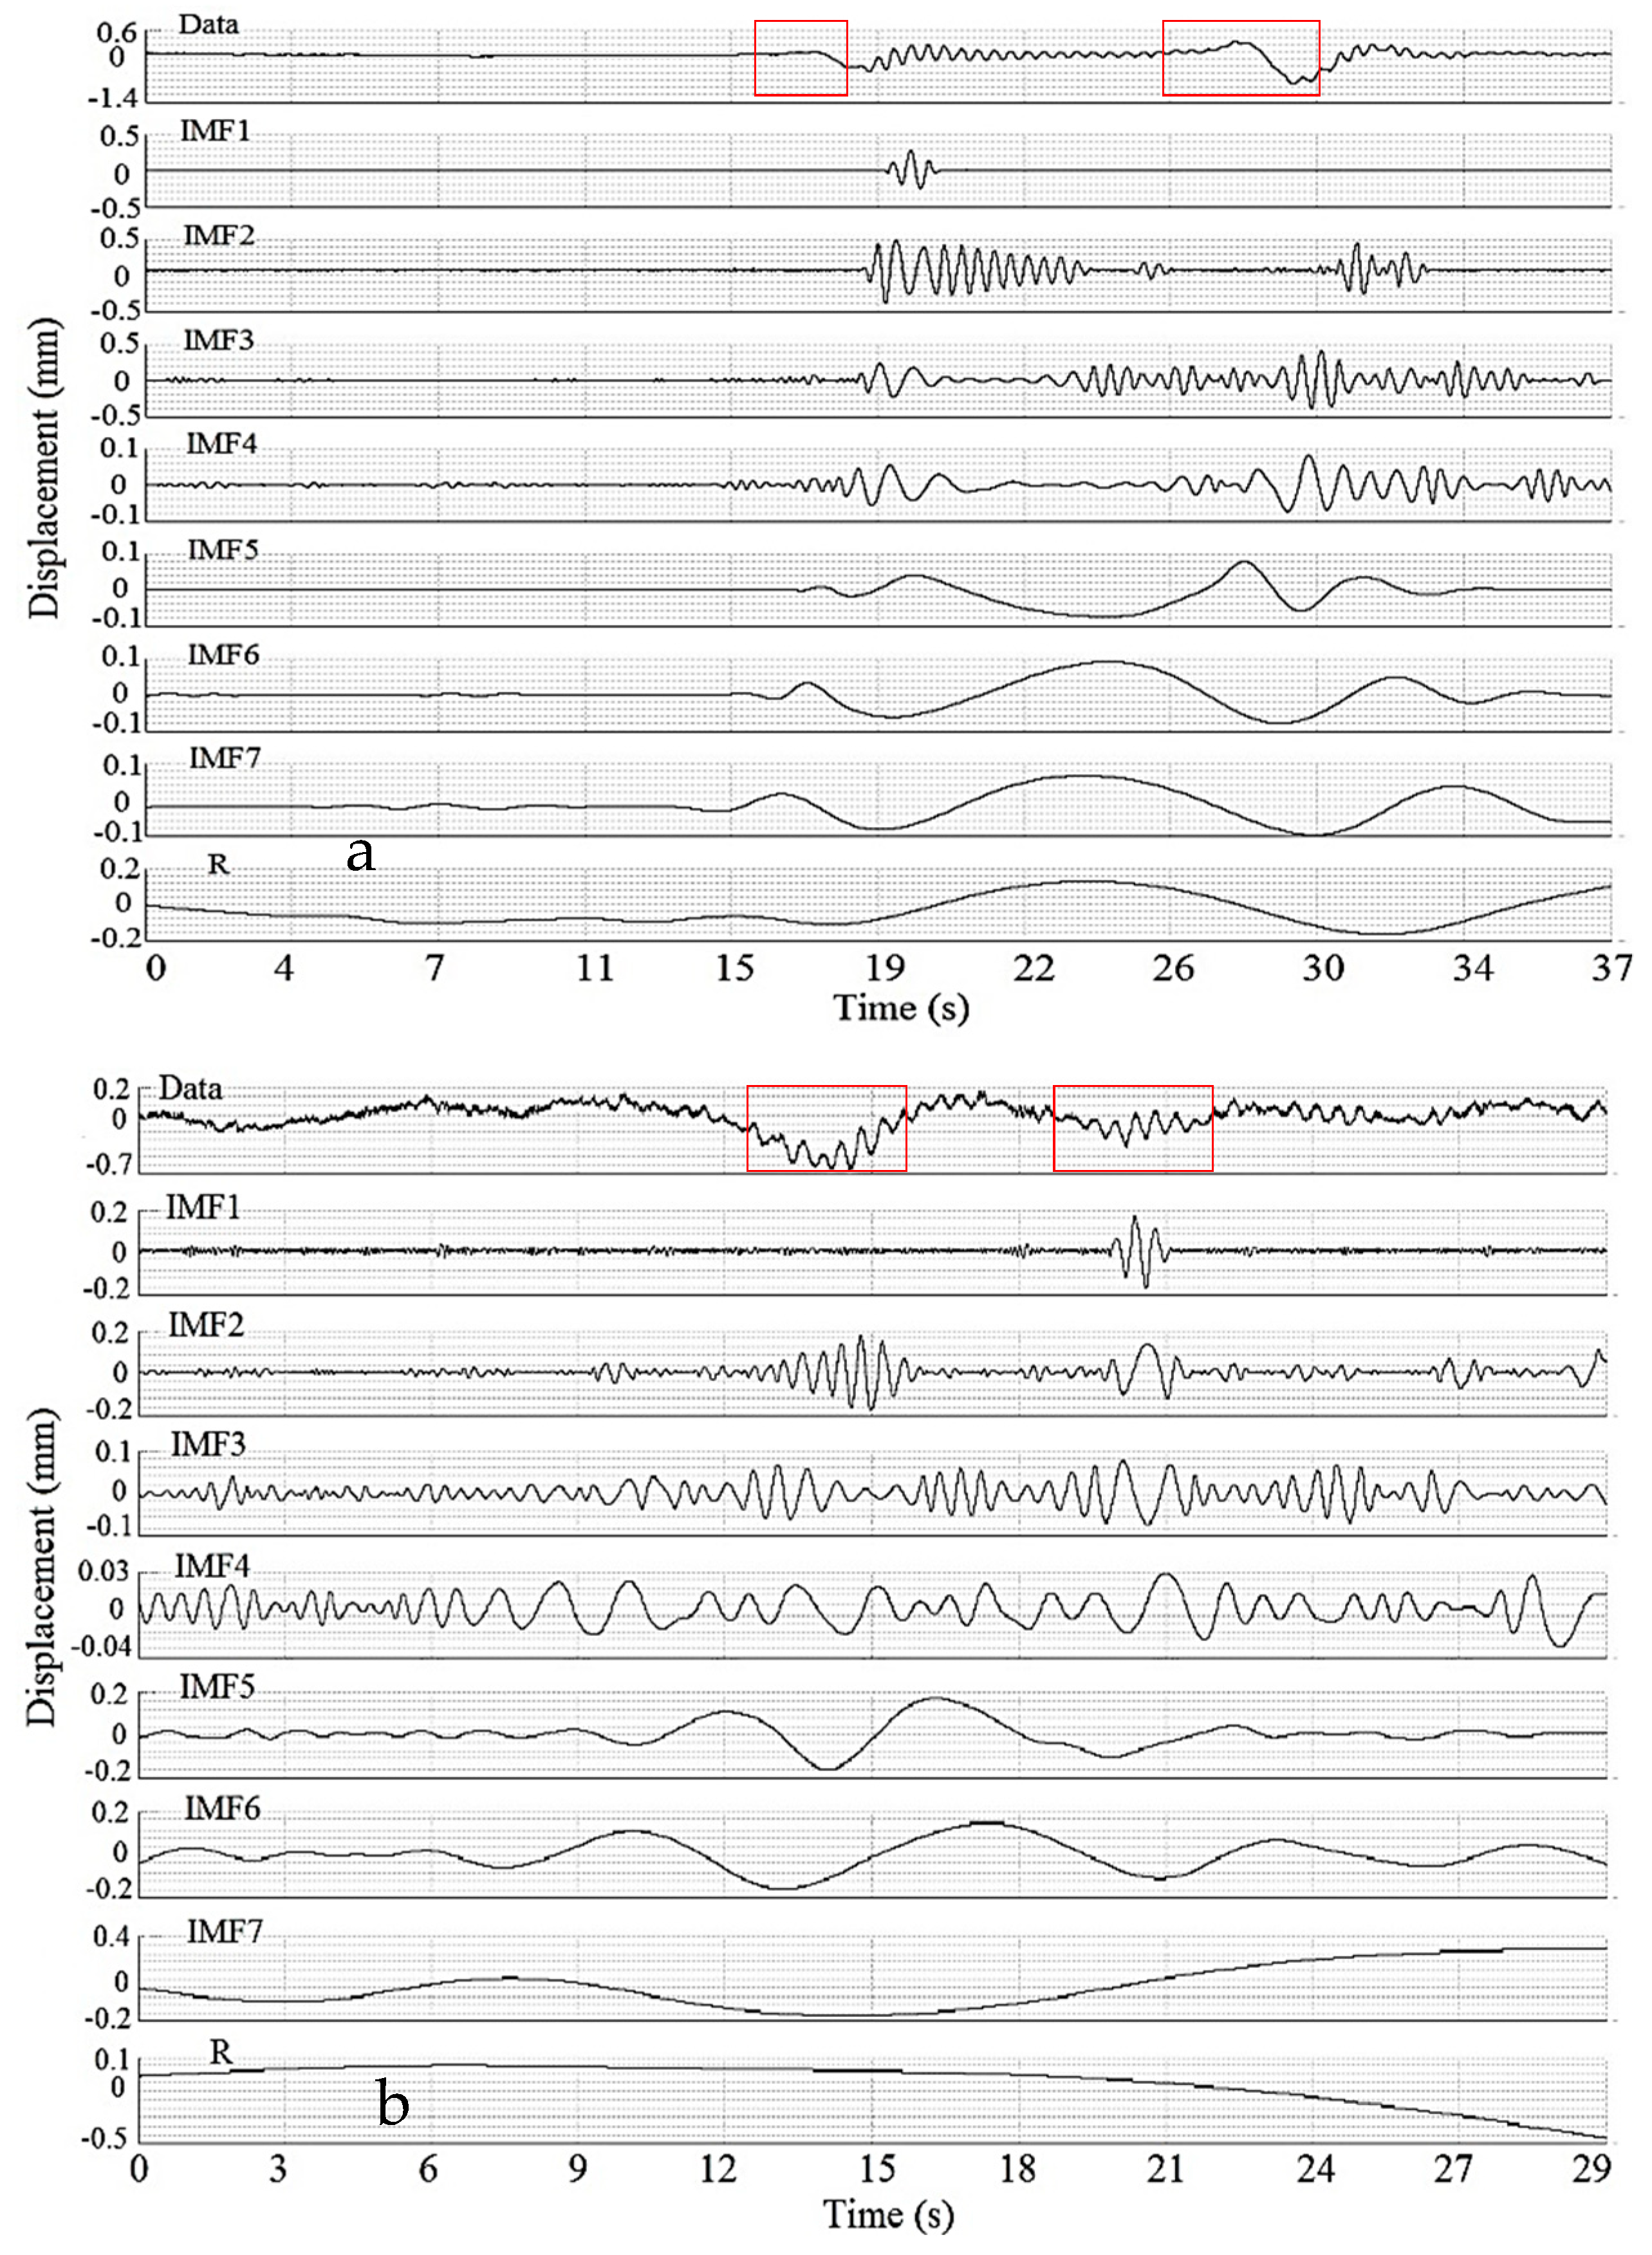
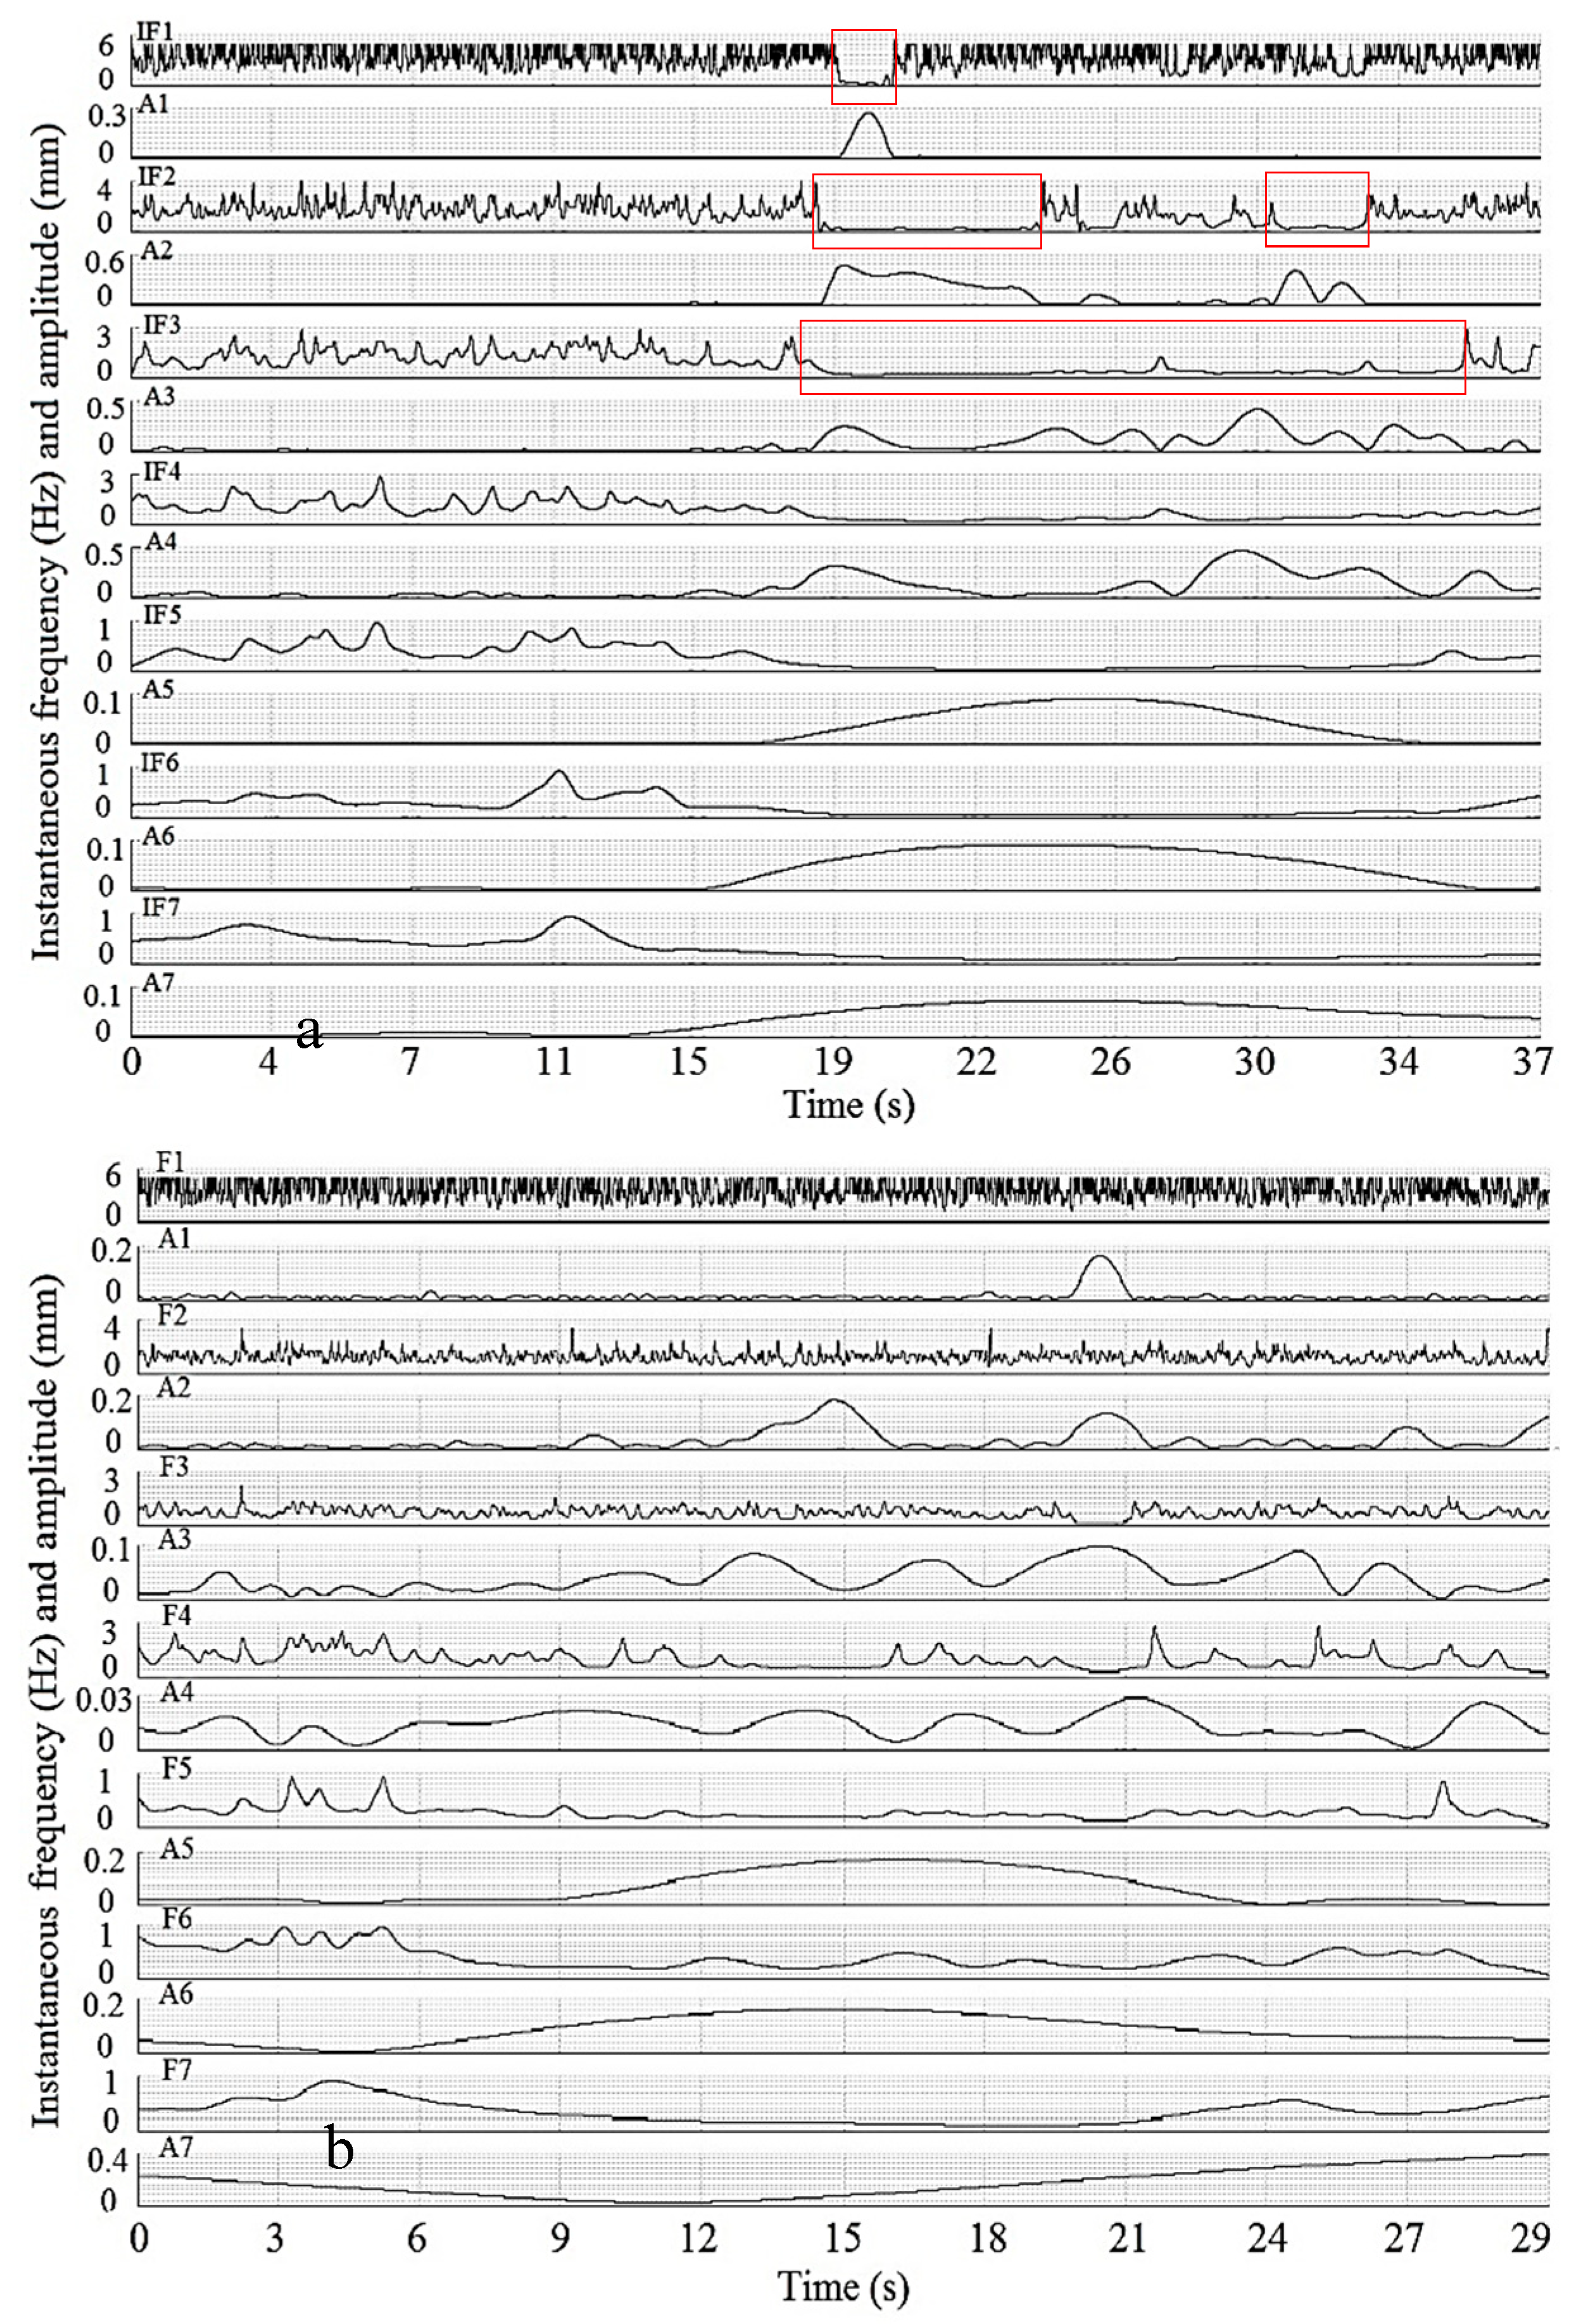
3.2. Damage Detection Based on Time-Series Displacement by Ground-Based Microwave Interferometry
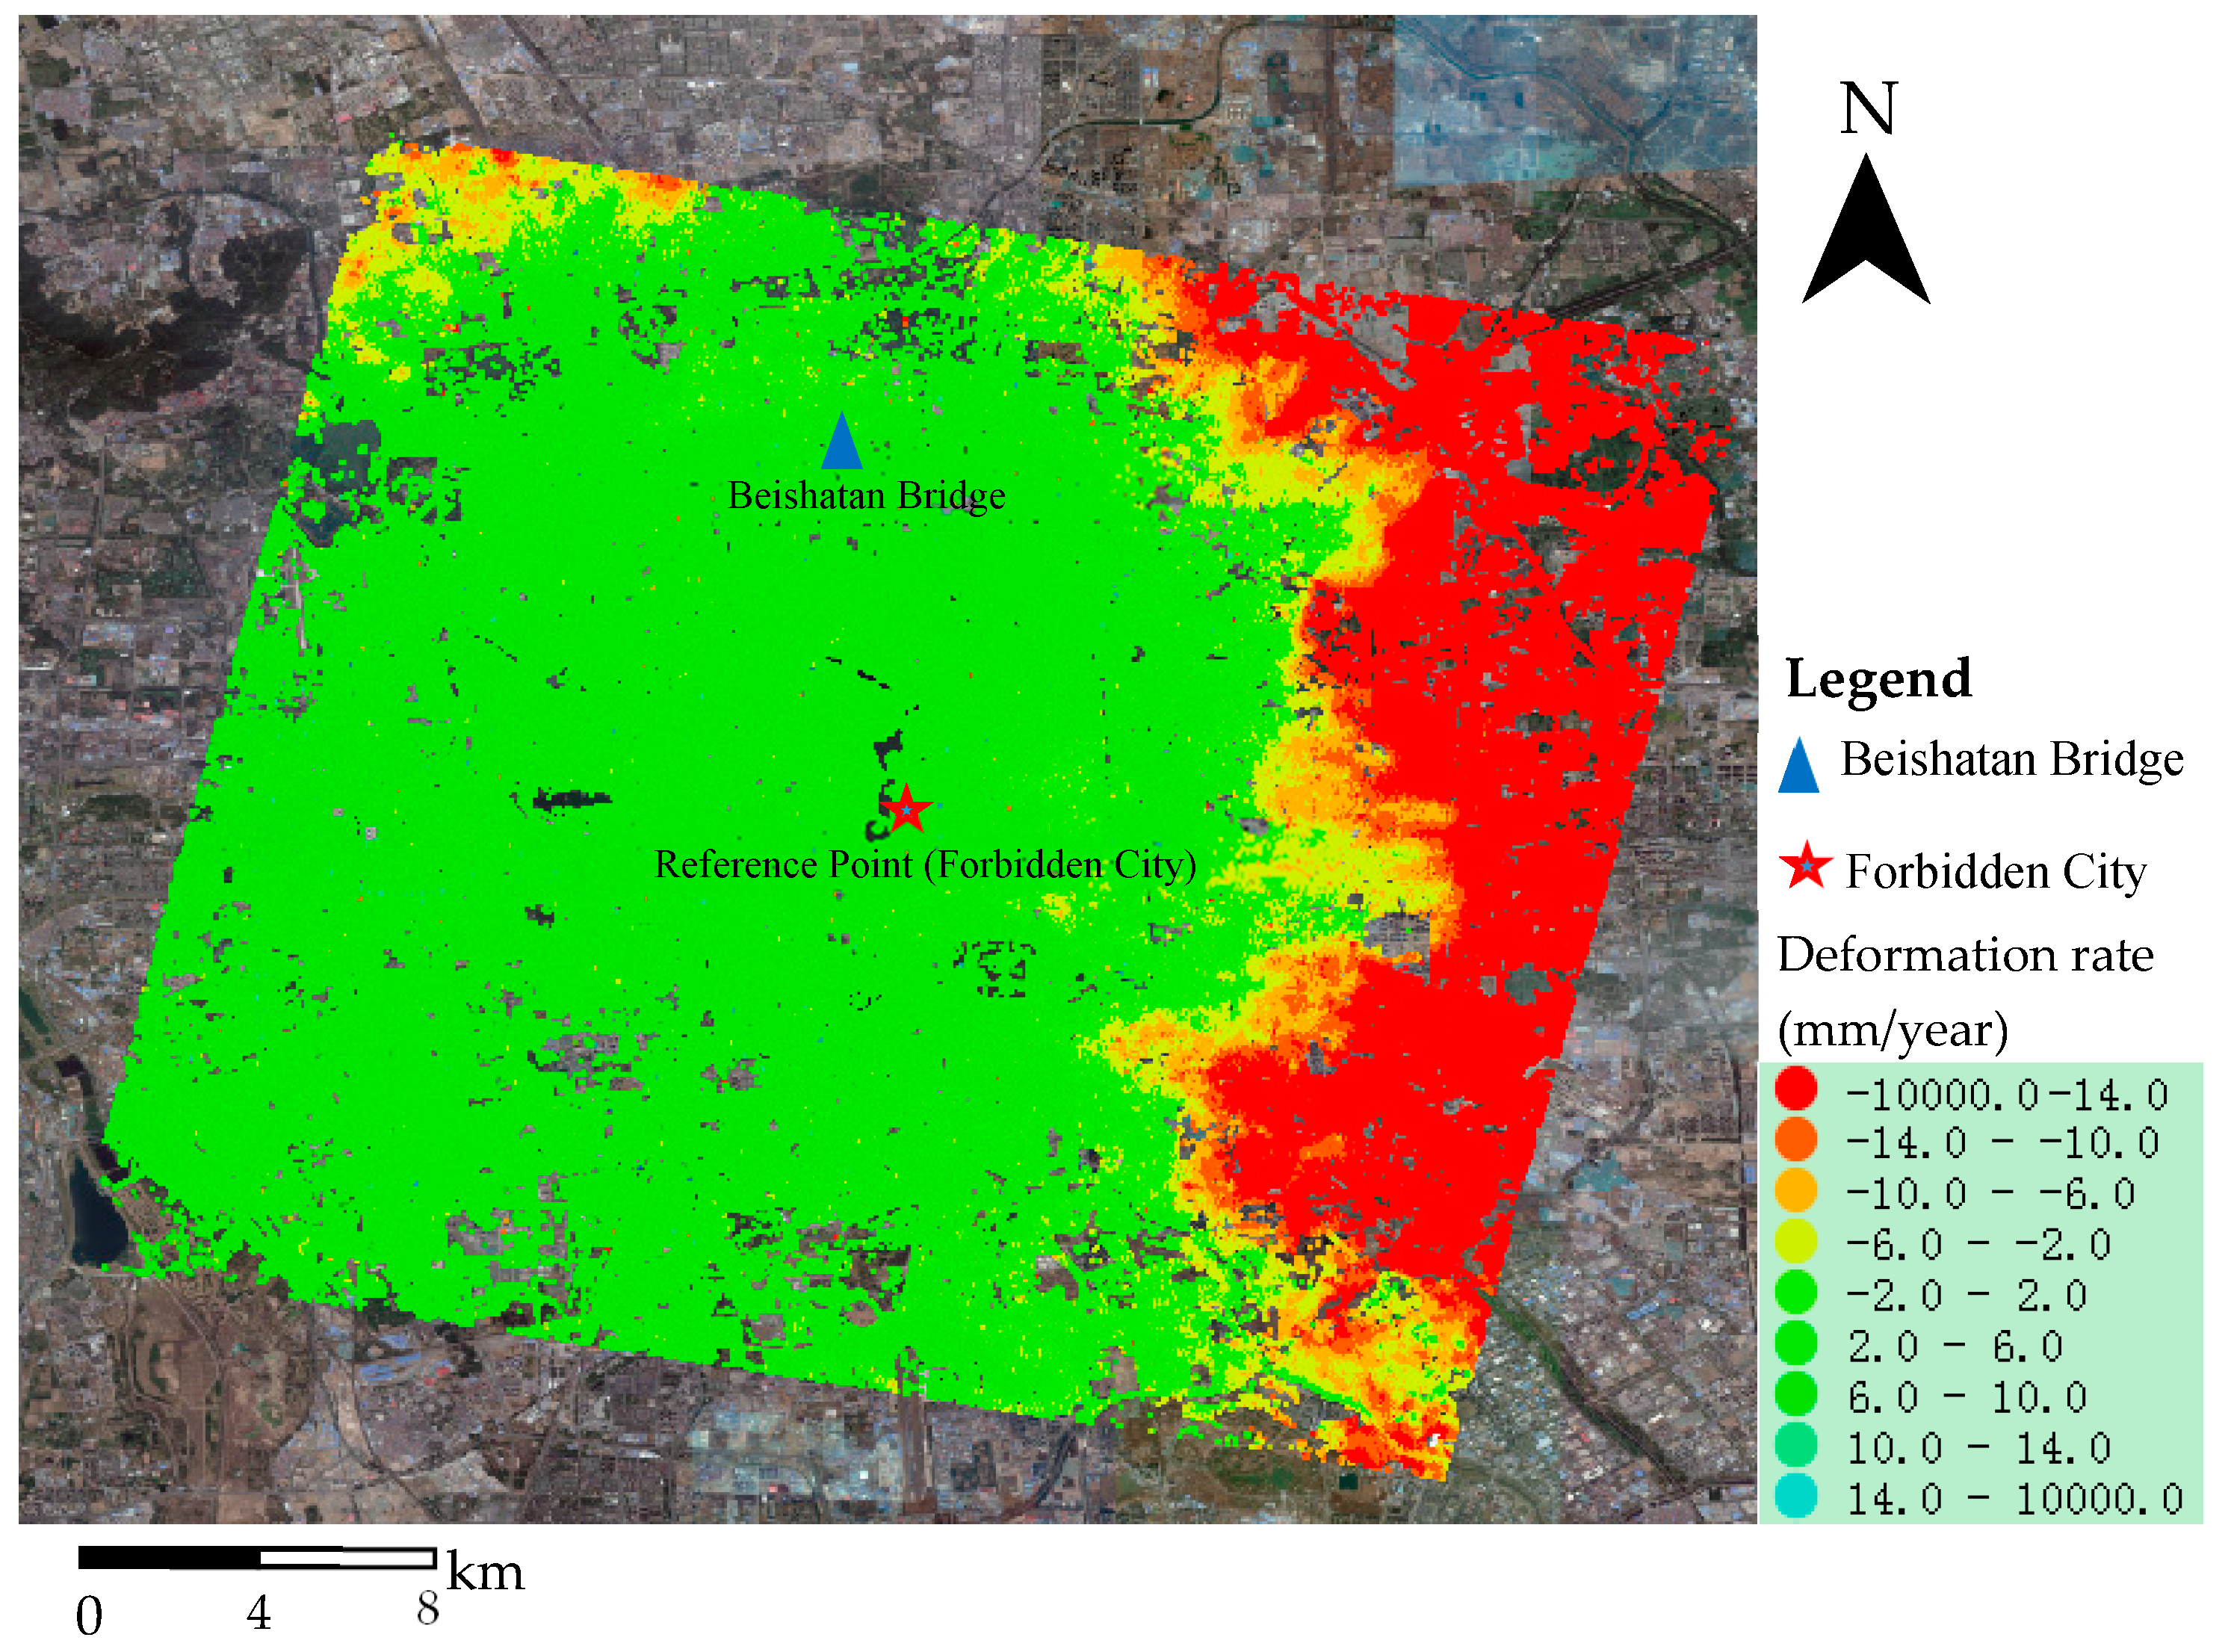
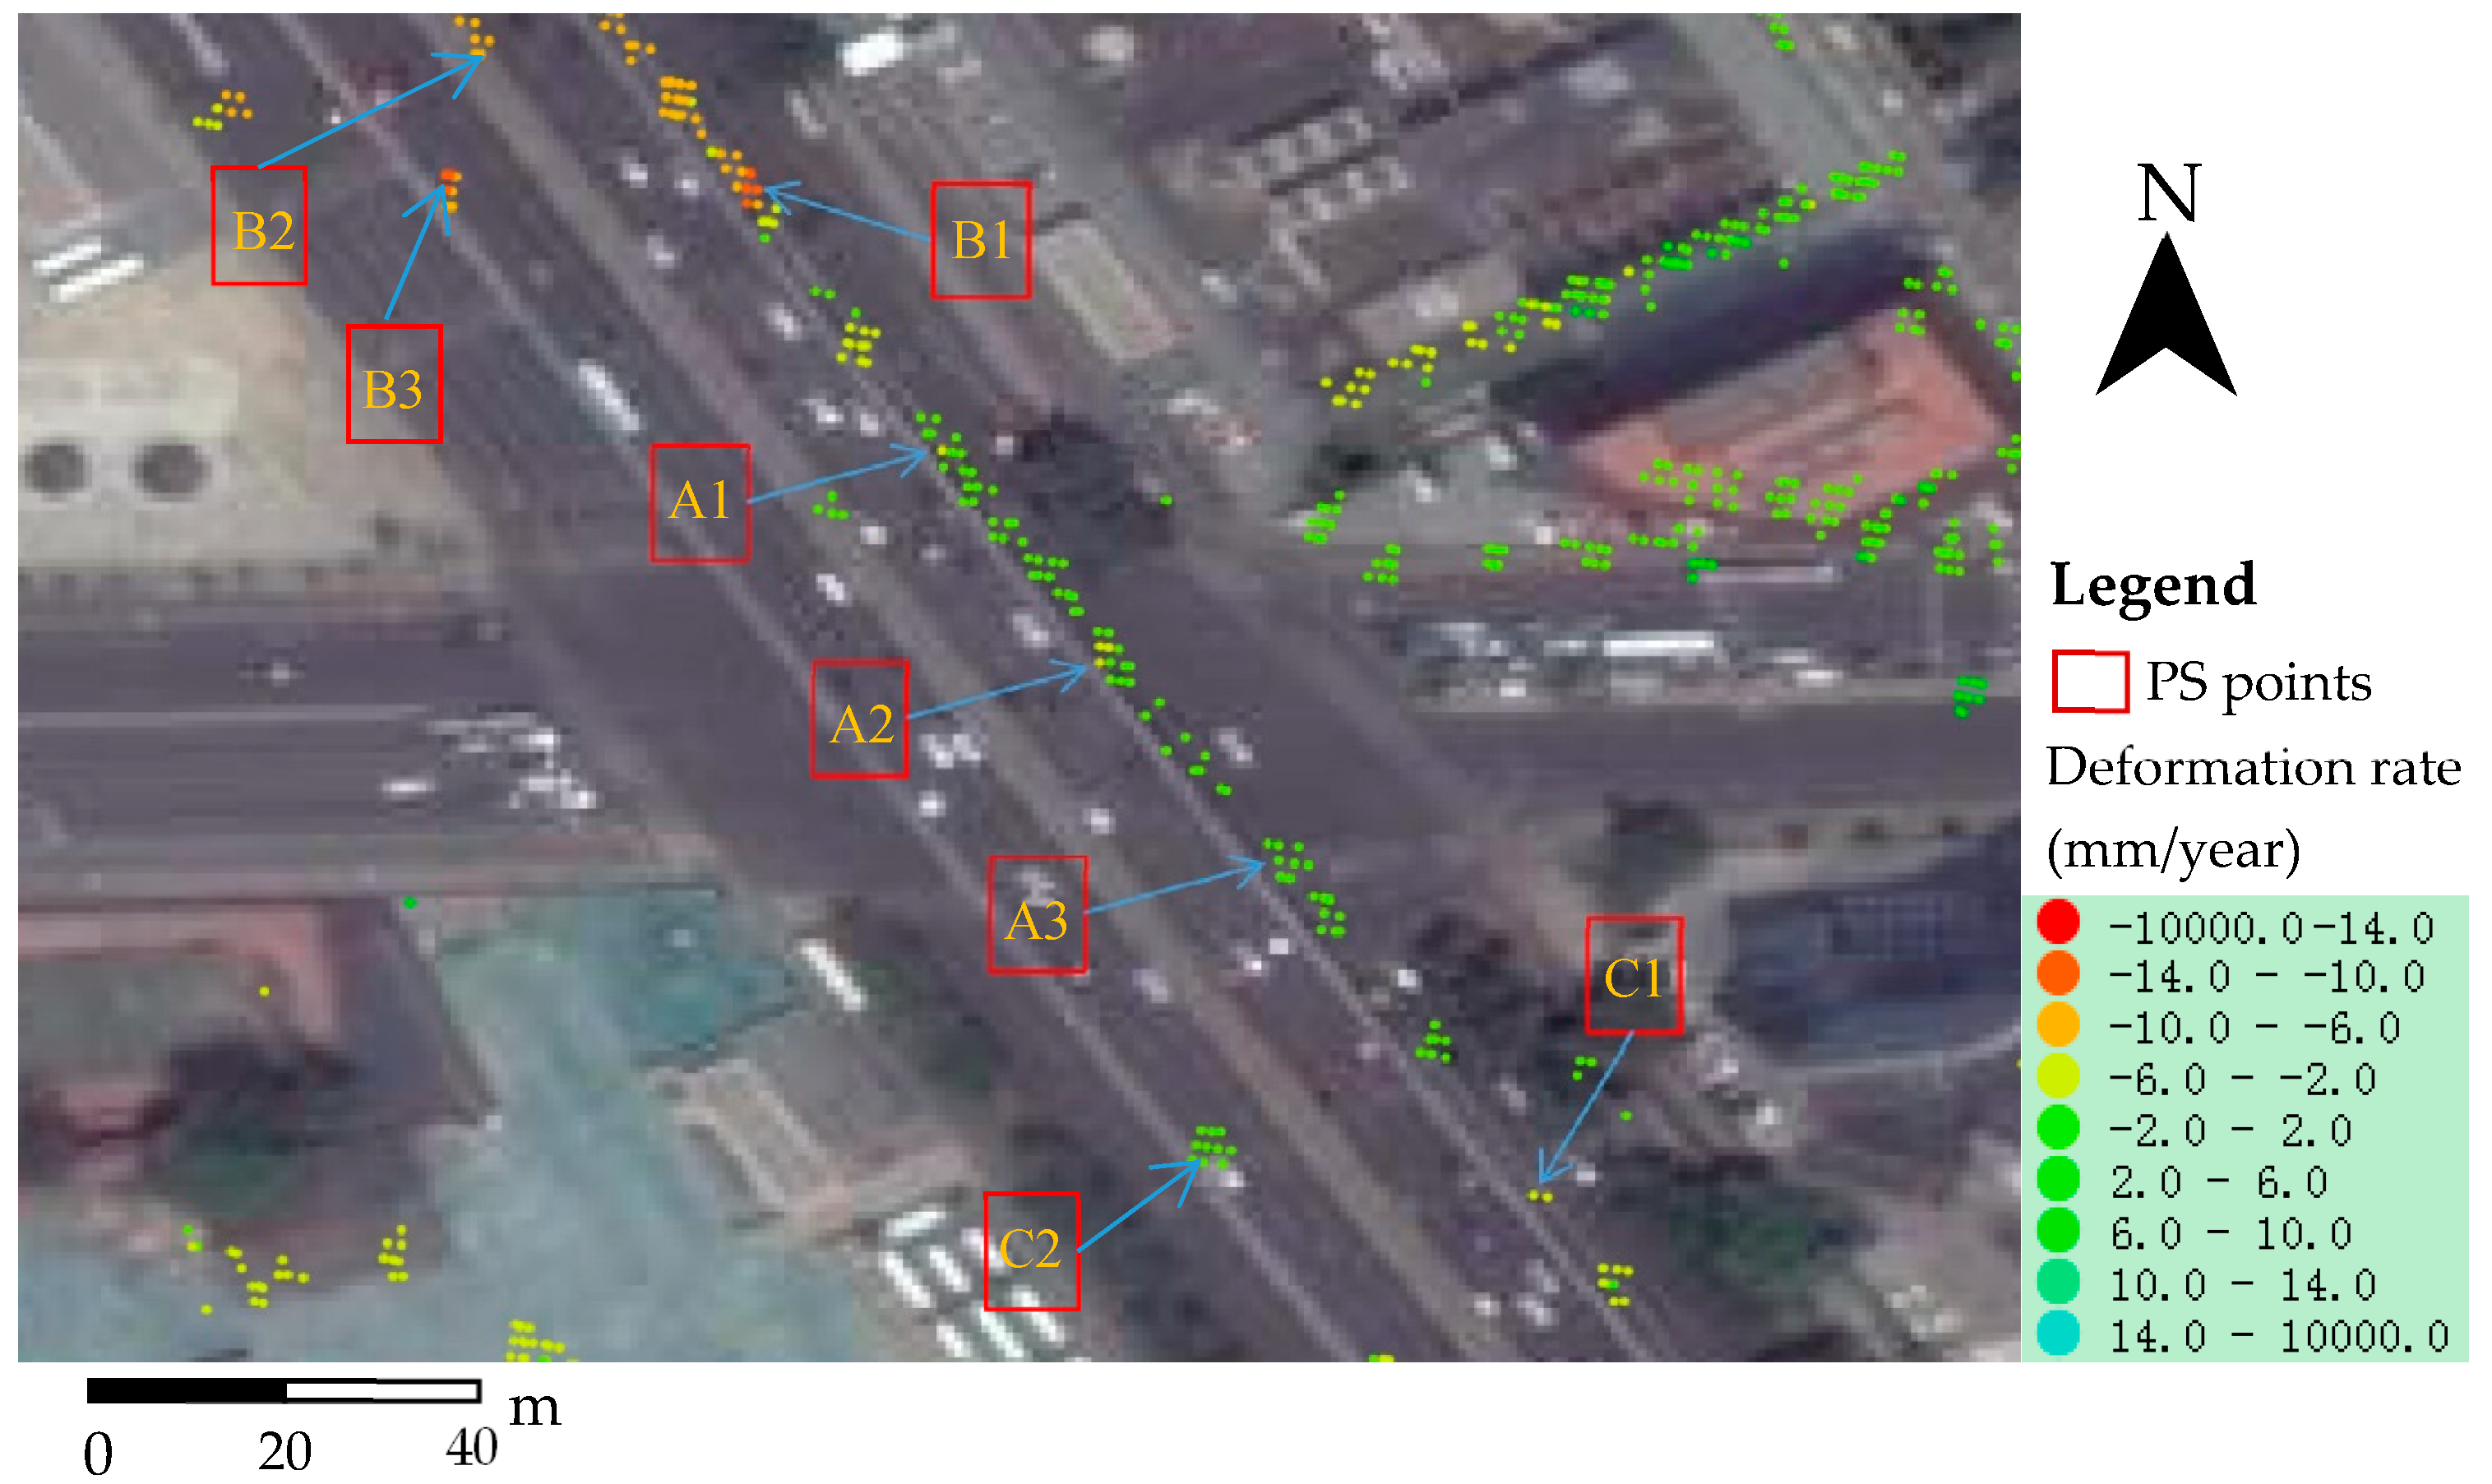
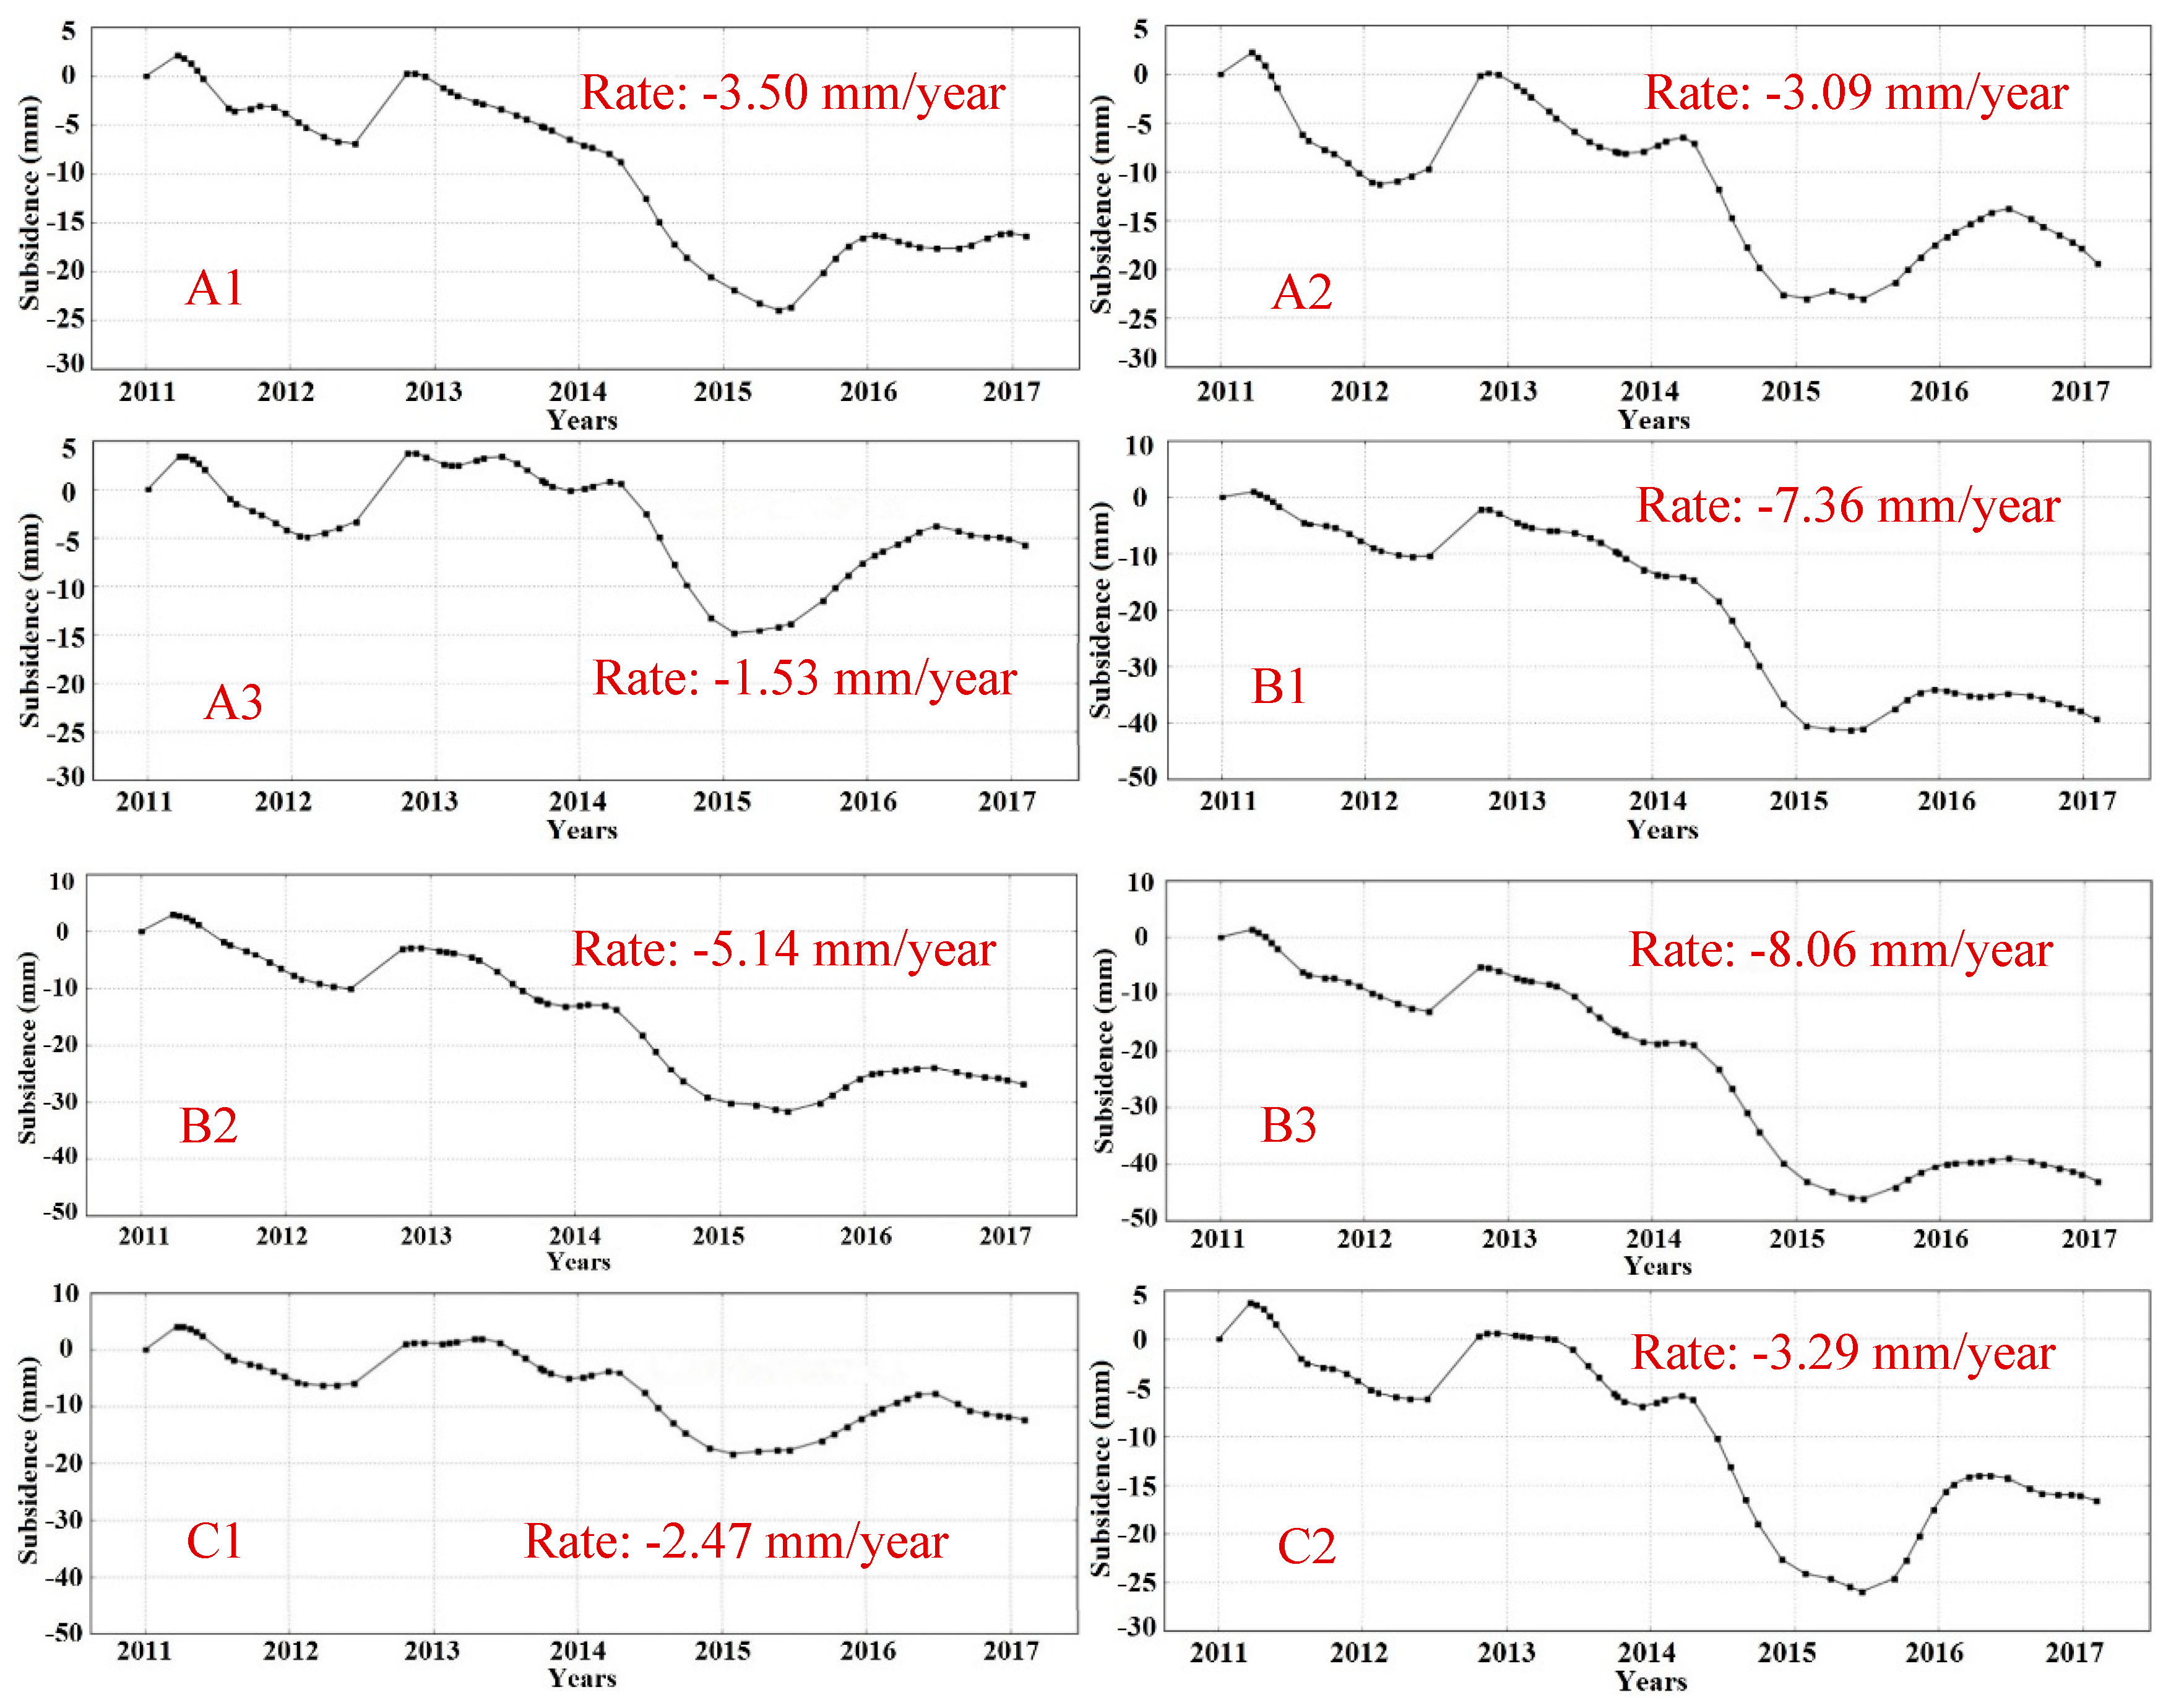
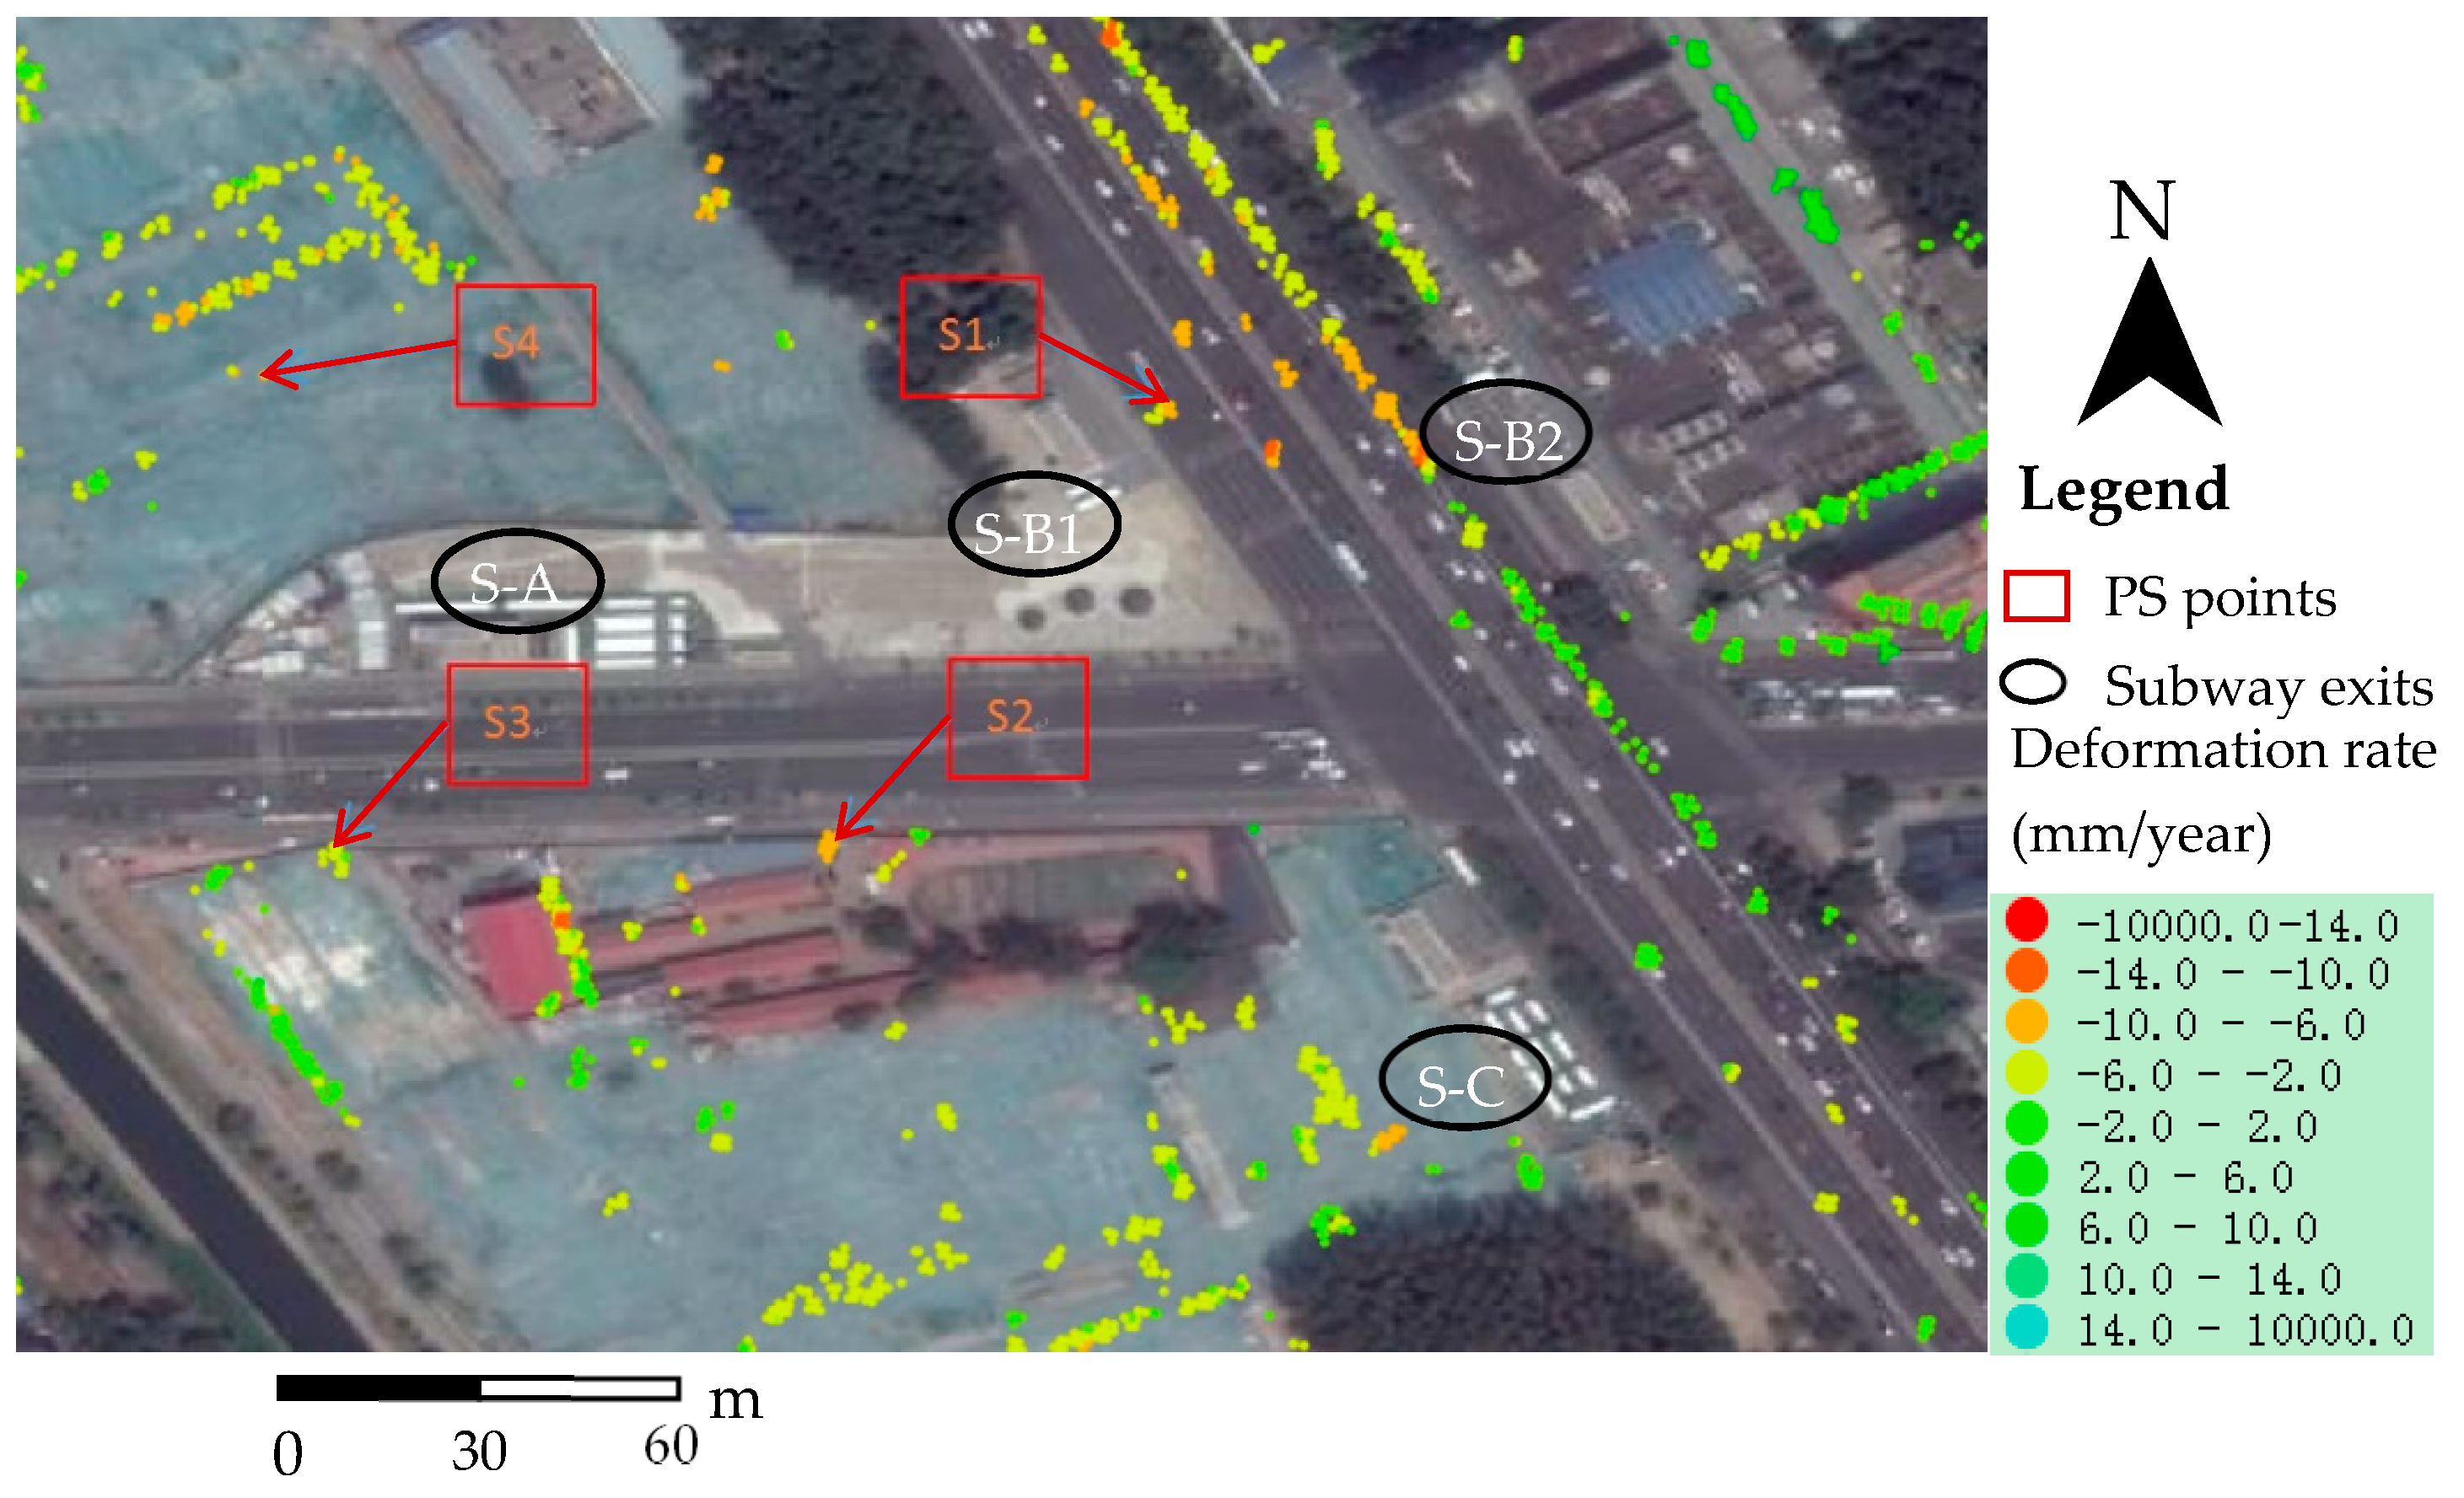
3.3. Damage Analysis by PS-InSAR
4. Experimental Results and Discussions
4.1. Results and Analysis of Bridge Deformation
4.2. Damage Detection Analysis and Discussion
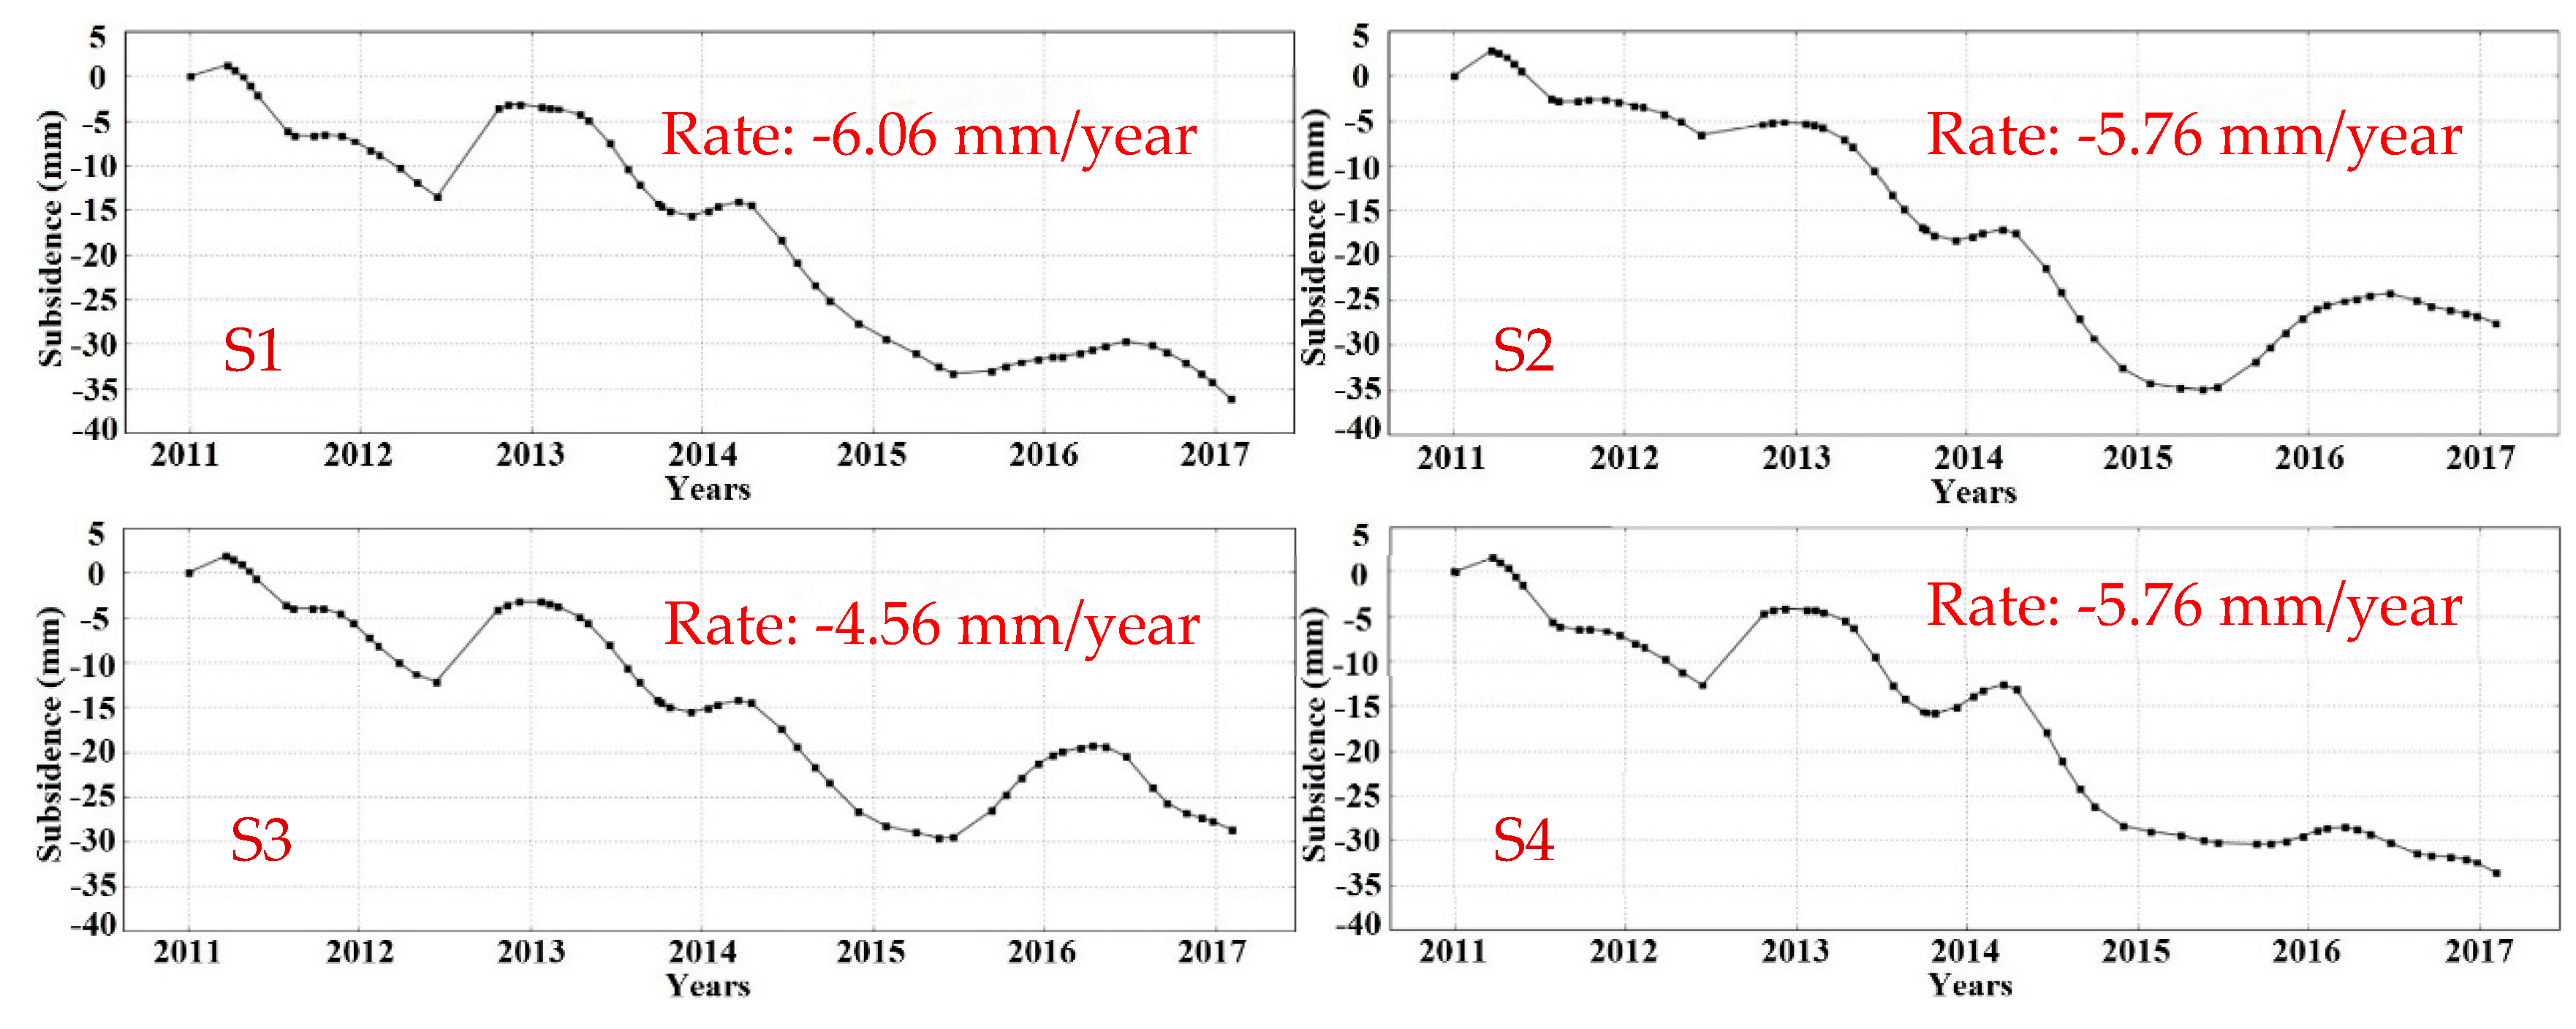
4.3. Subsidence Analysis and Discussion
5. Conclusions
Author Contributions
Funding
Conflicts of Interest
References
- Kavvadas, M.J. Monitoring ground deformation in tunnelling: Current practice in transportation tunnels. Eng. Geol. 2005, 79, 93–113. [Google Scholar] [CrossRef]
- Park, H.S.; Lee, H.M.; Adeli, H.; Lee, I. A new approach for health monitoring of structures: Terrestrial laser scanning. Comput.-Aided Civ. Inf. C 2007, 22, 19–30. [Google Scholar] [CrossRef]
- Riveiro, B.; González-Jorge, H.; Varela, M.; Jáuregui, D.V. Validation of terrestrial laser scanning and photogrammetry techniques for the measurement of vertical underclearance and beam geometry in structural inspection of bridges. Measurement 2013, 46, 784–794. [Google Scholar] [CrossRef]
- Alani, A.M.; Aboutalebi, M.; Kilic, G. Applications of ground penetrating radar (GPR) in bridge deck monitoring and assessment. J. Appl. Geophys. 2013, 97, 45–54. [Google Scholar] [CrossRef]
- Roveri, N.; Carcaterra, A. Damage detection in structures under traveling loads by Hilbert–Huang transform. Mech. Syst. Signal Process. 2012, 28, 128–144. [Google Scholar] [CrossRef]
- Kai, H.H.; Halling, M.W.; Barr, P.J. Overview of vibrational structural health monitoring with representative case studies. J. Bridge Eng. 2006, 11, 707–715. [Google Scholar]
- Gentile, C.; Bernardini, G. An interferometric radar for non-contact measurement of deflections on civil engineering structures: Laboratory and full-scale tests. Struct. Infrastruct. E 2010, 6, 521–534. [Google Scholar] [CrossRef]
- Pieraccini, M.; Fratini, M.; Parrini, F.; Atzeni, C. Dynamic monitoring of bridges using a high-speed coherent radar. IEEE Trans. Geosci. Remote Sens. 2006, 44, 3284–3288. [Google Scholar] [CrossRef]
- Moschas, F.; Psimoulis, P.A.; Stiros, S.C. GPS/RTS data fusion to overcome signal deficiencies in certain bridge dynamic monitoring projects. Smart Struct. Syst. 2013, 12, 251–269. [Google Scholar] [CrossRef]
- Jiang, R.; Jauregui, D.V. Development of a digital close-range photogrammetric bridge deflection measurement system. Measurement 2010, 43, 1431–1438. [Google Scholar] [CrossRef]
- Pieraccini, M.; Fratini, M.; Parrini, F.; Atzeni, C.; Partoli, G. Interferometric radar vs. accelerometer for dynamic monitoring of large structures: An experimental comparison. NDT E Int. 2008, 41, 258–264. [Google Scholar] [CrossRef]
- Gentile, C.; Bernardini, G. Output-only model identification of a reinforced concrete bridge from radar-based measurements. NDT E Int. 2008, 41, 544–553. [Google Scholar] [CrossRef]
- Gökdağ, H.; Kopmaz, O. A new damage detection approach for beam-type structures based on the combination of continuous and discrete wavelet transforms. J. Sound. Vib. 2009, 324, 1158–1180. [Google Scholar] [CrossRef]
- Gentile, C. Application of microwave remote sensing to dynamic testing of stay-cables. Remote Sens. 2010, 2, 36–51. [Google Scholar] [CrossRef]
- Stabile, T.A.; Perrone, A.; Gallipoli, M.R.; Ditommaso, R.; Ponzo, F.C. Dynamic survey of the Musmeci bridge by joint application of ground-based microwave radar interferometry and ambient noise standard spectral ratio techniques. IEEE Geosci. Remote Sens. Lett. 2013, 10, 870–874. [Google Scholar] [CrossRef]
- Liu, X.; Tong, X.; Ding, K.; Zhao, X.; Zhu, L.; Zhang, X.D. Measurement of Long-Term Periodic and Dynamic Deflection of the Long-Span Railway Bridge Using Microwave Interferometry. IEEE J. Sel. Top. Appl. Earth Observ. Remote Sens. 2015, 8, 4531–4538. [Google Scholar] [CrossRef]
- Lovas, T.; Barsi, A.; Detrekoi, A.; Dunai, L.; Csak, Z.; Polgar, A.; Berenyi, A.; Kibedy, Z.; Szocs, K. Terrestrial laser scanning in deformation measurements of structures. ISPRS J. Photogramm. 2008, 37, 527–532. [Google Scholar]
- Luhmann, T. Close range photogrammetry for industrial applications. ISPRS J. Photogramm. 2010, 65, 558–569. [Google Scholar] [CrossRef]
- Ahmadabadian, A.H.; Robson, S.; Boehm, J.; Shortis, M.; Wenzel, K.; Fritsch, D. A comparison of dense matching algorithms for scaled surface reconstruction using stereo camera rigs. ISPRS J. Photogramm. 2013, 78, 157–167. [Google Scholar] [CrossRef]
- Jiang, R.; Jáuregui, D.V.; White, K.R. Close-range photogrammetry applications in bridge measurement: Literature review. Measurement 2008, 41, 823–834. [Google Scholar] [CrossRef]
- González-Jorge, H.; González-Aguilera, D.; Rodríguez-Gonzálvez, P.; Arias, P. Monitoring biological crusts in civil engineering structures using intensity data from terrestrial laser scanners. Constr. Build. Mater. 2012, 31, 119–128. [Google Scholar] [CrossRef]
- Monserrat, O.; Crosetto, M. Deformation measurement using terrestrial laser scanning data and least squares 3D surface matching. ISPRS J. Photogramm. 2008, 63, 142–154. [Google Scholar] [CrossRef]
- Teza, G.; Galgaro, A.; Moro, F. Contactless recognition of concrete surface damage from laser scanning and curvature computation. NDT E Int. 2009, 42, 240–249. [Google Scholar] [CrossRef]
- Abellán, A.; Oppikofer, T.; Jaboyedoff, M.; Rosser, N.J.; Lim, M.; Lato, M.J. Terrestrial laser scanning of rock slope instabilities. Earth Surf. Proc. Land. 2014, 39, 80–97. [Google Scholar] [CrossRef]
- Yang, H.; Omidalizarandi, M.; Xu, X.; Neumann, I. Terrestrial laser scanning technology for deformation monitoring and surface modeling of arch structures. Compos. Struct. 2016, 169, 173–179. [Google Scholar] [CrossRef]
- Huang, Y.; Jiang, X. Field-observed phenomena of seismic liquefaction and subsidence during the 2008 Wenchuan earthquake in China. Nat. Hazard. 2010, 54, 839–850. [Google Scholar] [CrossRef]
- Milillo, P.; Giardina, G.; DeJong, M.J.; Perissin, D.; Milillo, G. Multi-Temporal InSAR Structural Damage Assessment: The London Crossrail Case Study. Remote Sens. 2018, 10, 287. [Google Scholar] [CrossRef]
- Hamling, I.J.; Hreinsdóttir, S.; Clark, K. Complex multifault rupture during the 2016 Mw 7.8 Kaikōura earthquake, New Zealand. Science 2017, 356, 7194. [Google Scholar] [CrossRef]
- Ferretti, A.; Prati, C.; Rocca, F. Permanent scatterers in SAR interferometry. IEEE Trans. Geosci. Remote 2001, 39, 8–20. [Google Scholar] [CrossRef] [Green Version]
- Liu, G.; Jia, H.; Zhang, R. Exploration of Subsidence Estimation by Persistent Scatterer InSAR on Time Series of High Resolution TerraSAR-X Images. IEEE J. Sel. Top. Appl. Earth Observ. Remote Sens. 2011, 4, 159–170. [Google Scholar] [CrossRef]
- Gernhardt, S.; Bamler, R. Deformation monitoring of single buildings using meter-resolution SAR data in PSI. ISPRS J. Photogramm. 2012, 73, 68–79. [Google Scholar] [CrossRef]
- Fornaro, G.; Reale, D.; Verde, S. Bridge Thermal Dilation Monitoring with Millimeter Sensitivity via Multidimensional SAR Imaging. IEEE Geosci. Remote Sci. 2012, 10, 677–681. [Google Scholar] [CrossRef]
- Sousa, J.J.; Bastos, L. Multi-temporal SAR interferometry reveals acceleration of bridge sinking before collapse. Nat. Hazard. Earth Syst. 2013, 13, 659–667. [Google Scholar] [CrossRef] [Green Version]
- Gernhardt, S.; Auer, S.; Eder, K. Persistent scatterers at building facades evaluation of appearance and localization accuracy. ISPRS J. Photogramm. 2015, 100, 92–105. [Google Scholar] [CrossRef]
- Hu, Q.W.; Wang, S.H.; Fu, C.W.; Ai, M.Y.; Yu, D.B.; Wang, W. Fine surveying and 3D modeling approach for wooden ancient architecture via multiple laser scanner integration. Remote Sens. 2016, 8, 270. [Google Scholar] [CrossRef]
- Huang, H.; Li, Z.; Gong, P.; Cheng, X.; Clinton, N.; Cao, C.; Wang, L. Automated methods for measuring DBH and tree heights with a commercial scanning lidar. Photogramm. Eng. Remote Sci. 2011, 77, 219–227. [Google Scholar] [CrossRef]
- Noferini, L.; Pieraccini, M.; Mecatti, D.; Luzi, G.; Atzeni, C.; Tamburini, A.; Broccolato, M. Permanent scatterers analysis for atmospheric correction in ground-based SAR interferometry. IEEE Trans. Geosci. Remote Sens. 2005, 43, 1459–1471. [Google Scholar] [CrossRef]
- Negulescu, C.; Luzi, G.; Crosetto, M.; Raucoules, D.; Roullé, A.; Monfort, D.; Pujades, L.; Colas, B.; Dewez, T. Comparison of seismometer and radar measurements for the modal identification of civil engineering structures. Eng. Struct. 2013, 51, 10–22. [Google Scholar] [CrossRef]
- Montuori, A.; Luzi, G.; Bignami, C.; Gaudiosi, I.; Stramondo, S.; Crosetto, M.; Buongiorno, M.F. The Interferometric Use of Radar Sensors for the Urban Monitoring of Structural Vibrations and Surface Displacements. IEEE J. Sel. Top. Appl. Earth Observ. Remote Sens. 2016, 9, 3761–3776. [Google Scholar] [CrossRef]
- Beben, D. Application of the interferometric radar for dynamic tests of corrugated steel plate (CSP) culvert. NDT E Int. 2011, 44, 405–412. [Google Scholar] [CrossRef]
- Salawu, O.S. Detection of structural damage through changes in frequency: A review. Eng. Struct. 1997, 19, 718–723. [Google Scholar] [CrossRef]
- Crosetto, M.; Monserrat, O.; Luzi, G.; Cuevas-Gonzalez, M.; Devanthery, N. A noninterferometric procedure for deformation measurement using GB-SAR imagery. IEEE Geosci. Remote Sens. Lett. 2013, 11, 34–38. [Google Scholar] [CrossRef]
- Wang, J.L.; Li, Z.J. Extreme-Point Symmetric Mode Decomposition Method for Data Analysis. Adv. Adapt. Data Anal. 2013, 5, 1137. [Google Scholar] [CrossRef]
- Liu, X.; Tang, Y.; Lu, Z.; Huang, H.; Tong, X.; Ma, J. ESMD-based stability analysis in the progressive collapse of a building model: A case study of a reinforced concrete frame-shear wall model. Measurement 2018, 120, 34–42. [Google Scholar] [CrossRef]
- Liu, X.; Lu, Z.; Yang, W.; Huang, M.; Tong, X. Dynamic Monitoring and Vibration Analysis of Ancient Bridges by Ground-Based Microwave Interferometry and the ESMD Method. Remote Sens. 2018, 10, 770. [Google Scholar] [CrossRef]
- Chen, H.G.; Yan, Y.J.; Jiang, J.S. Vibration-based damage detection in composite wingbox structures by HHT. Mech. Syst. Signal Process. 2007, 21, 307–321. [Google Scholar] [CrossRef]
- Wang, T.; Liao, M.; Perissin, D. InSAR coherence-decomposition analysis. IEEE Geosci. Remote Sens. Lett. 2010, 7, 156–160. [Google Scholar] [CrossRef]


| Item | Value |
|---|---|
| Satellite | COSMO-SkyMed |
| Coverage area | 40 × 40 km2 |
| Imaging mode | Stripmap |
| Ground resolution | 3 m × 3 m |
| Polarization mode | HH |
| Incident angle | ~20.07 ° |
| View direction/orbit | Right view/descending orbit |
| Amount of data | 61 |
| Time span | January 2011–February 2017 |
© 2019 by the authors. Licensee MDPI, Basel, Switzerland. This article is an open access article distributed under the terms and conditions of the Creative Commons Attribution (CC BY) license (http://creativecommons.org/licenses/by/4.0/).
Share and Cite
Liu, X.; Wang, P.; Lu, Z.; Gao, K.; Wang, H.; Jiao, C.; Zhang, X. Damage Detection and Analysis of Urban Bridges Using Terrestrial Laser Scanning (TLS), Ground-Based Microwave Interferometry, and Permanent Scatterer Interferometry Synthetic Aperture Radar (PS-InSAR). Remote Sens. 2019, 11, 580. https://0-doi-org.brum.beds.ac.uk/10.3390/rs11050580
Liu X, Wang P, Lu Z, Gao K, Wang H, Jiao C, Zhang X. Damage Detection and Analysis of Urban Bridges Using Terrestrial Laser Scanning (TLS), Ground-Based Microwave Interferometry, and Permanent Scatterer Interferometry Synthetic Aperture Radar (PS-InSAR). Remote Sensing. 2019; 11(5):580. https://0-doi-org.brum.beds.ac.uk/10.3390/rs11050580
Chicago/Turabian StyleLiu, Xianglei, Peipei Wang, Zhao Lu, Kai Gao, Hui Wang, Chiyu Jiao, and Xuedong Zhang. 2019. "Damage Detection and Analysis of Urban Bridges Using Terrestrial Laser Scanning (TLS), Ground-Based Microwave Interferometry, and Permanent Scatterer Interferometry Synthetic Aperture Radar (PS-InSAR)" Remote Sensing 11, no. 5: 580. https://0-doi-org.brum.beds.ac.uk/10.3390/rs11050580