Automatic Estimation of Urban Waterlogging Depths from Video Images Based on Ubiquitous Reference Objects


1
Smart City Research Center, Hangzhou Dianzi University, Hangzhou 310012, China
2
Smart City Collaborative Innovation Center of Zhejiang Province, Hangzhou 310012, China
3
Key Laboratory of Virtual Geographic Environment, Ministry of Education, Nanjing Normal University, Nanjing 210023, China
4
Jiangsu Center for Collaborative Innovation in Geographical Information Resource Development and Application, Nanjing 210023, China
5
State Key Laboratory of Earth Surface Processes and Resource Ecology, Beijing Normal University, Beijing 100875, China
6
Key Laboratory of Environmental Change and Natural Disaster, Beijing Normal University, Beijing 100875, China
*
Author to whom correspondence should be addressed.
Remote Sens. 2019, 11(5), 587; https://0-doi-org.brum.beds.ac.uk/10.3390/rs11050587
Submission received: 8 February 2019
/
Revised: 4 March 2019
/
Accepted: 7 March 2019
/
Published: 11 March 2019
(This article belongs to the Special Issue Urban Environments Modeling using Very-High-Resolution Imagery and Crowdsourced Geospatial Data)
Abstract
:Video supervision equipment, which is readily available in most cities, can record the processes of urban floods in video form. Ubiquitous reference objects, which often appear in videos, can be used to indicate urban waterlogging depths. This makes video images a valuable data source for obtaining waterlogging depths. However, the urban waterlogging information contained in video images has not been effectively mined and utilized. In this paper, we present a method to automatically estimate urban waterlogging depths from video images based on ubiquitous reference objects. First, reference objects from video images are detected during the flooding and non-flooding periods using an object detection model with a convolutional neural network (CNN). Then, waterlogging depths are estimated using the height differences between the detected reference objects in these two periods. A case study is used to evaluate the proposed method. The results show that our proposed method could effectively mine and utilize urban waterlogging depth information from video images. This method has the advantages of low economic cost, acceptable accuracy, high spatiotemporal resolution, and wide coverage. It is feasible to promote this proposed method within cities to monitor urban floods.

1. Introduction
As one of the most frequent and serious disasters in cities, urban floods have caused considerable loss of life and property [1,2]. To mitigate the damage of urban floods, continuous waterlogging depth information with wide coverage and high resolution is required for early warning and emergency response [3,4].
Currently, there are four main types of data sources for urban flood depth extraction, including water level sensors [5], remote sensing [6,7,8,9], social-media/crowdsourcing data [3,10], and video surveillance data [4]. Among these data sources, video surveillance data can record the entire process of urban flooding and has the advantages of continuity in time, high resolution, wide coverage in space, and low cost, which makes it the most attractive data source. Video images provide innovative means for monitoring urban waterlogging depths. However, the urban waterlogging information contained in video has not been effectively mined and utilized. It is necessary to extract urban waterlogging depth information from video images.
To extract waterlogging depths from video images, ubiquitous reference objects (e.g., traffic buckets, pavement fences, and post boxes) could be used as “rulers”. Waterlogging depths can be estimated according to the interfaces between the reference objects and water or the parts of the reference object above the water level. However, current research relies on manual estimation based on specific reference objects [11,12,13], which is time-consuming and laborious. The necessary data may not be immediately available or continuous during urban flooding events. How to automatically estimate waterlogging depth information from video images using ubiquitous reference objects should be explored.
There are two potential methods to automatically estimate waterlogging depths from video images based on reference objects: edge detection methods and object detection methods. The reference/water interfaces can be detected by edge detection methods, such as the Hough transform, Sobel operator, and Canny operator. These types of methods have been applied to estimate water levels or water depths of rivers, lakes, pipelines, etc. [14,15]. The edge detection methods show some promise for estimating urban waterlogging depths. However, these methods are usually designed for some specific types of reference objects that rarely appear in the video images of cities, and they cannot be directly used for other types of reference objects. Moreover, these methods require pre-/post-processing work and some empirical parameters (e.g., thresholds) set by trial and error. A tremendous amount of effort would be required to perform this type of work for each camera and each type of reference object. Therefore, it would be inappropriate and difficult to promote these methods in cities.
Object detection models can detect various types of ubiquitous reference objects and parts of ubiquitous reference objects above water levels. There are two types of object detection models, namely, traditional models and models with convolutional neural networks (CNNs). Traditional object detection models are based on hand-designed features, e.g., scale invariant feature transform (SIFT) and histogram of oriented gradient (HOG) [16,17]. Object detection models based on features using a CNN are state-of-the-art models and exhibit higher performance than traditional models [18,19]. More importantly, these methods are easy to use and require no professional skills. Therefore, object detection models with CNNs are promising for the estimation of urban waterlogging depths.
The objective of this paper is to propose a method for automatically estimating waterlogging depths based on ubiquitous reference objects by using object detection models with CNNs. We studied how to detect ubiquitous reference objects from video images and how to estimate the waterlogging depths using the detected reference objects. The main contributions of this paper are two-fold:
- (1)
- Ubiquitous reference objects in video images, instead of one particular type of reference object, are used to estimate the waterlogging depths, which makes the proposed method widely applicable.
- (2)
- The state-of-the-art deep object detection method with a CNN is utilized to automatically detect ubiquitous reference objects from images, which is more accurate and flexible than traditional object detection methods.
2. Methodology
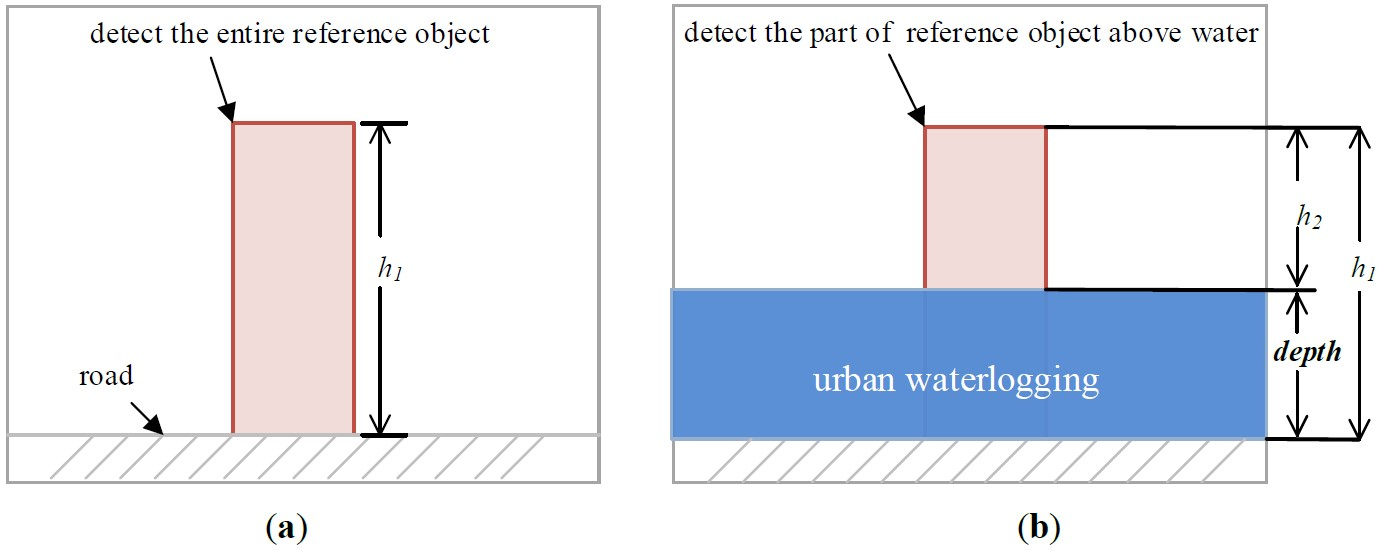
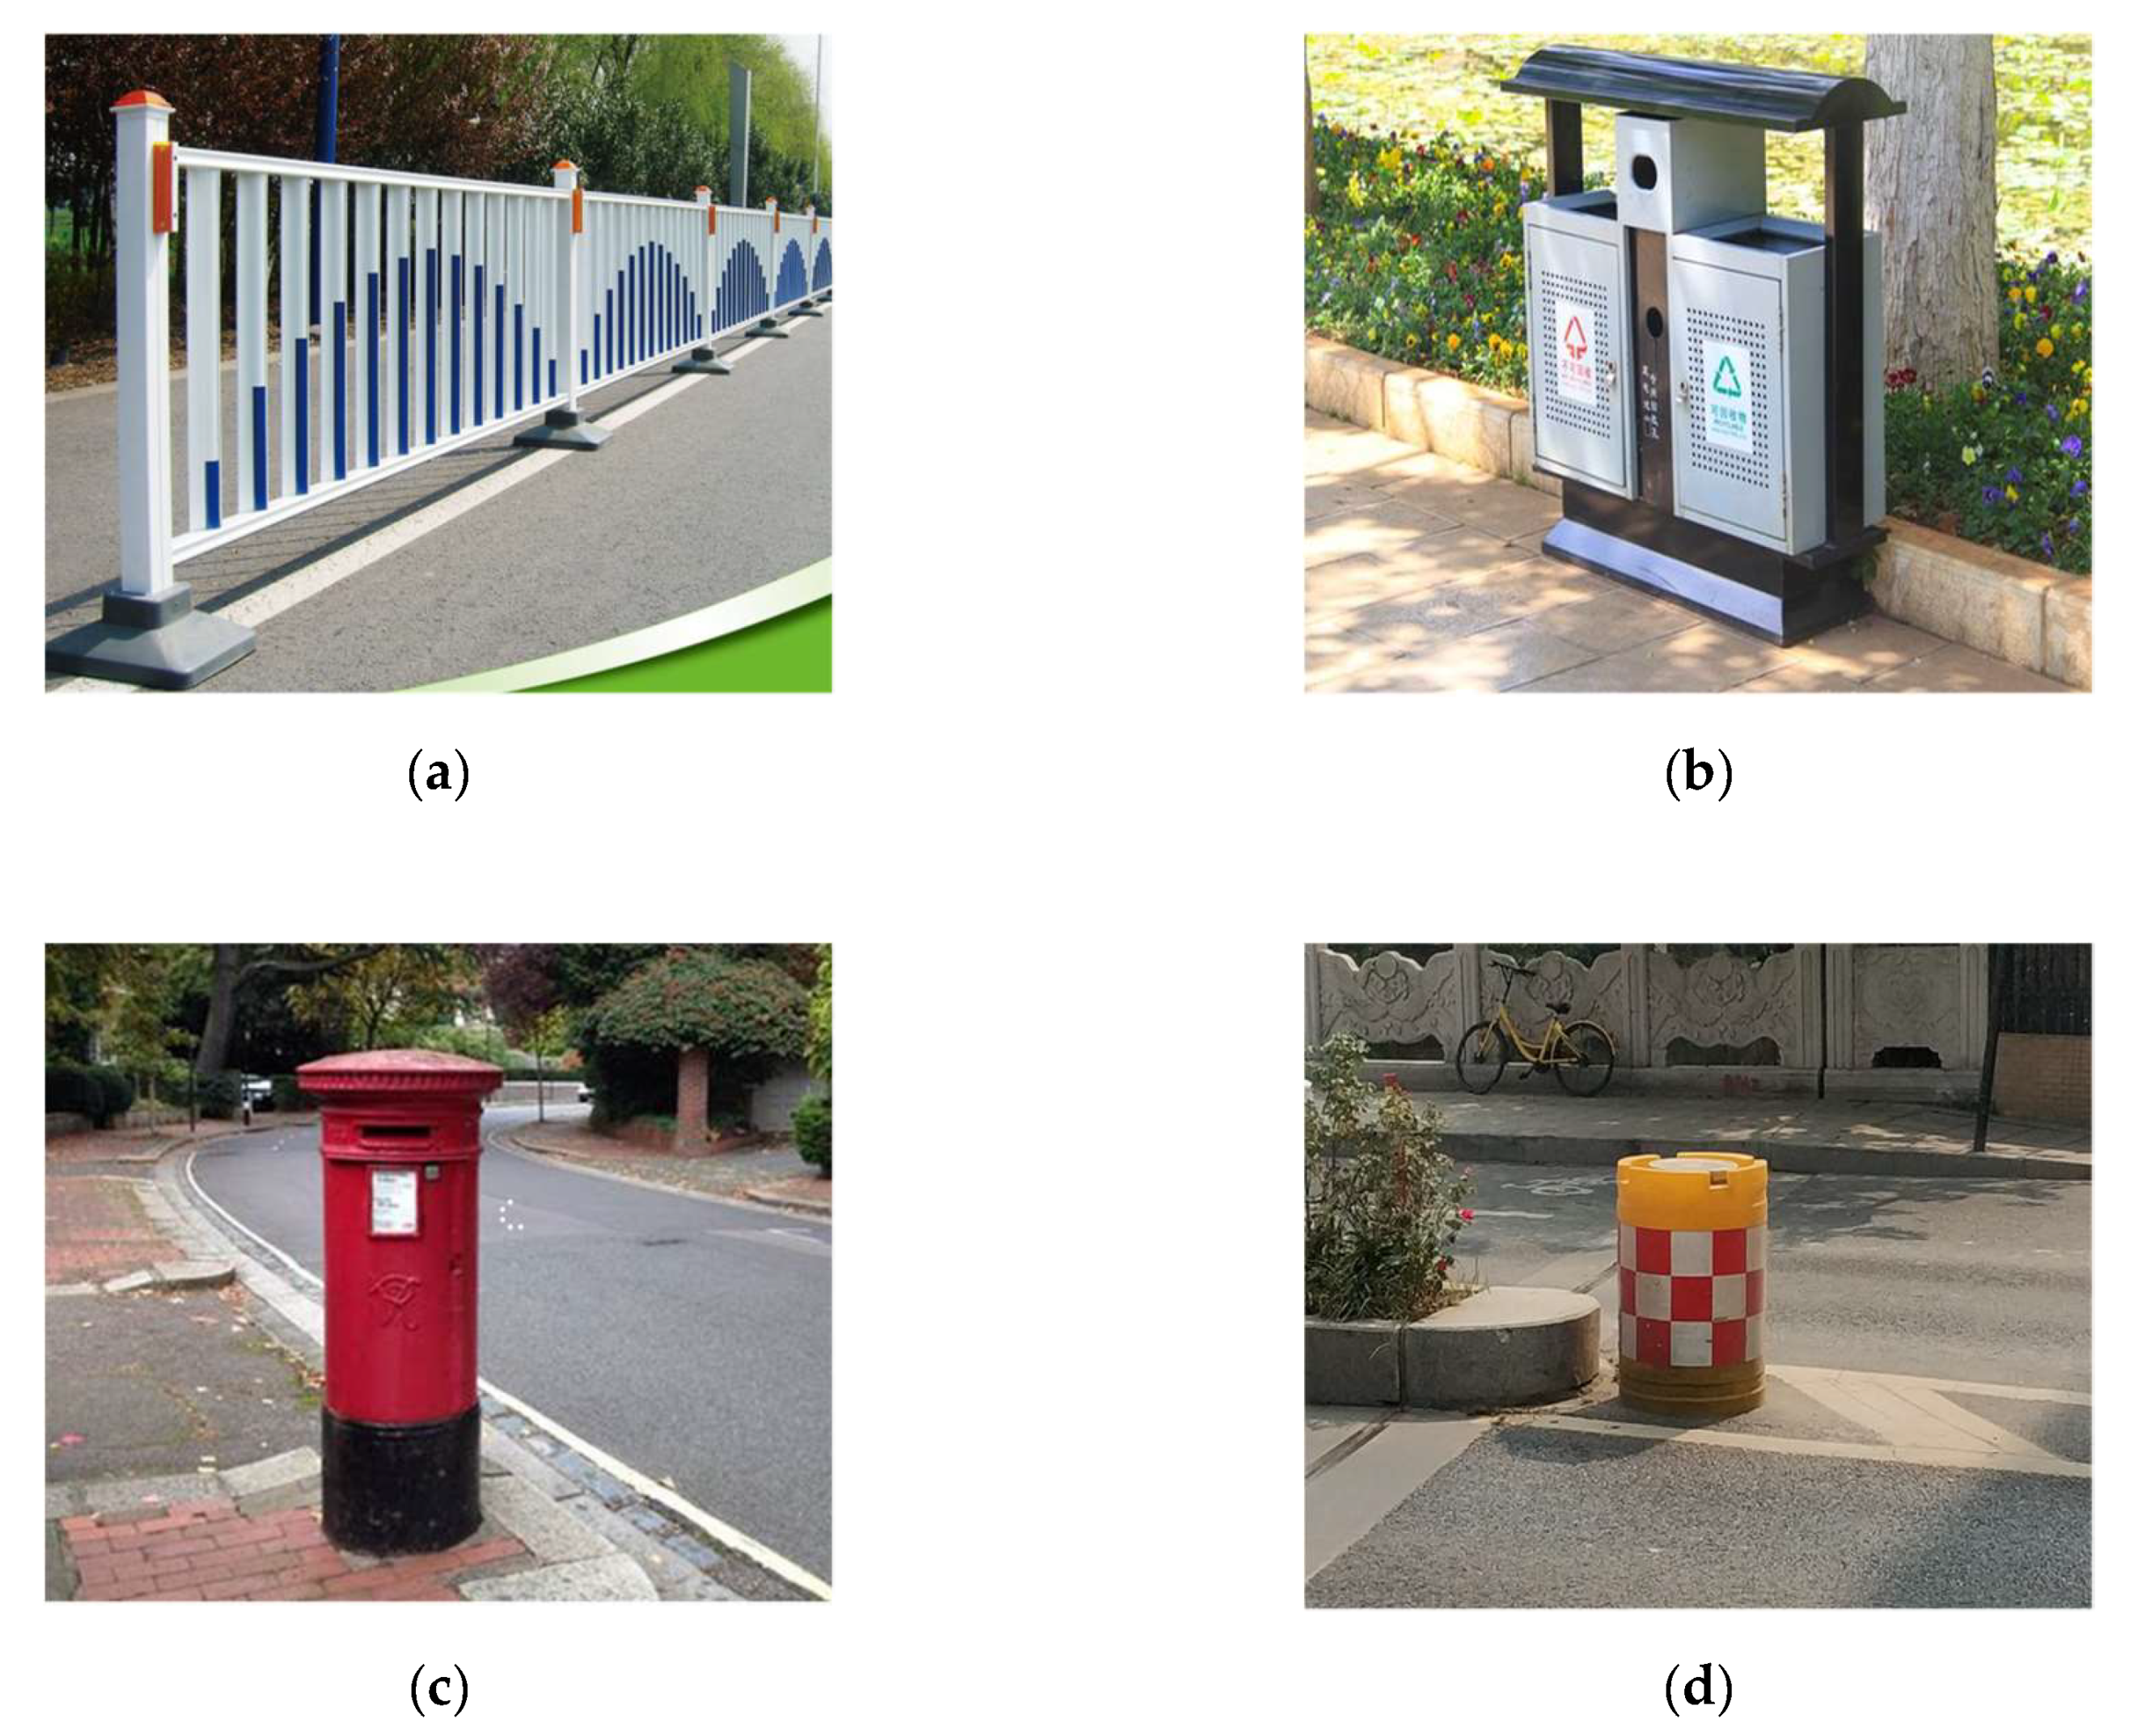
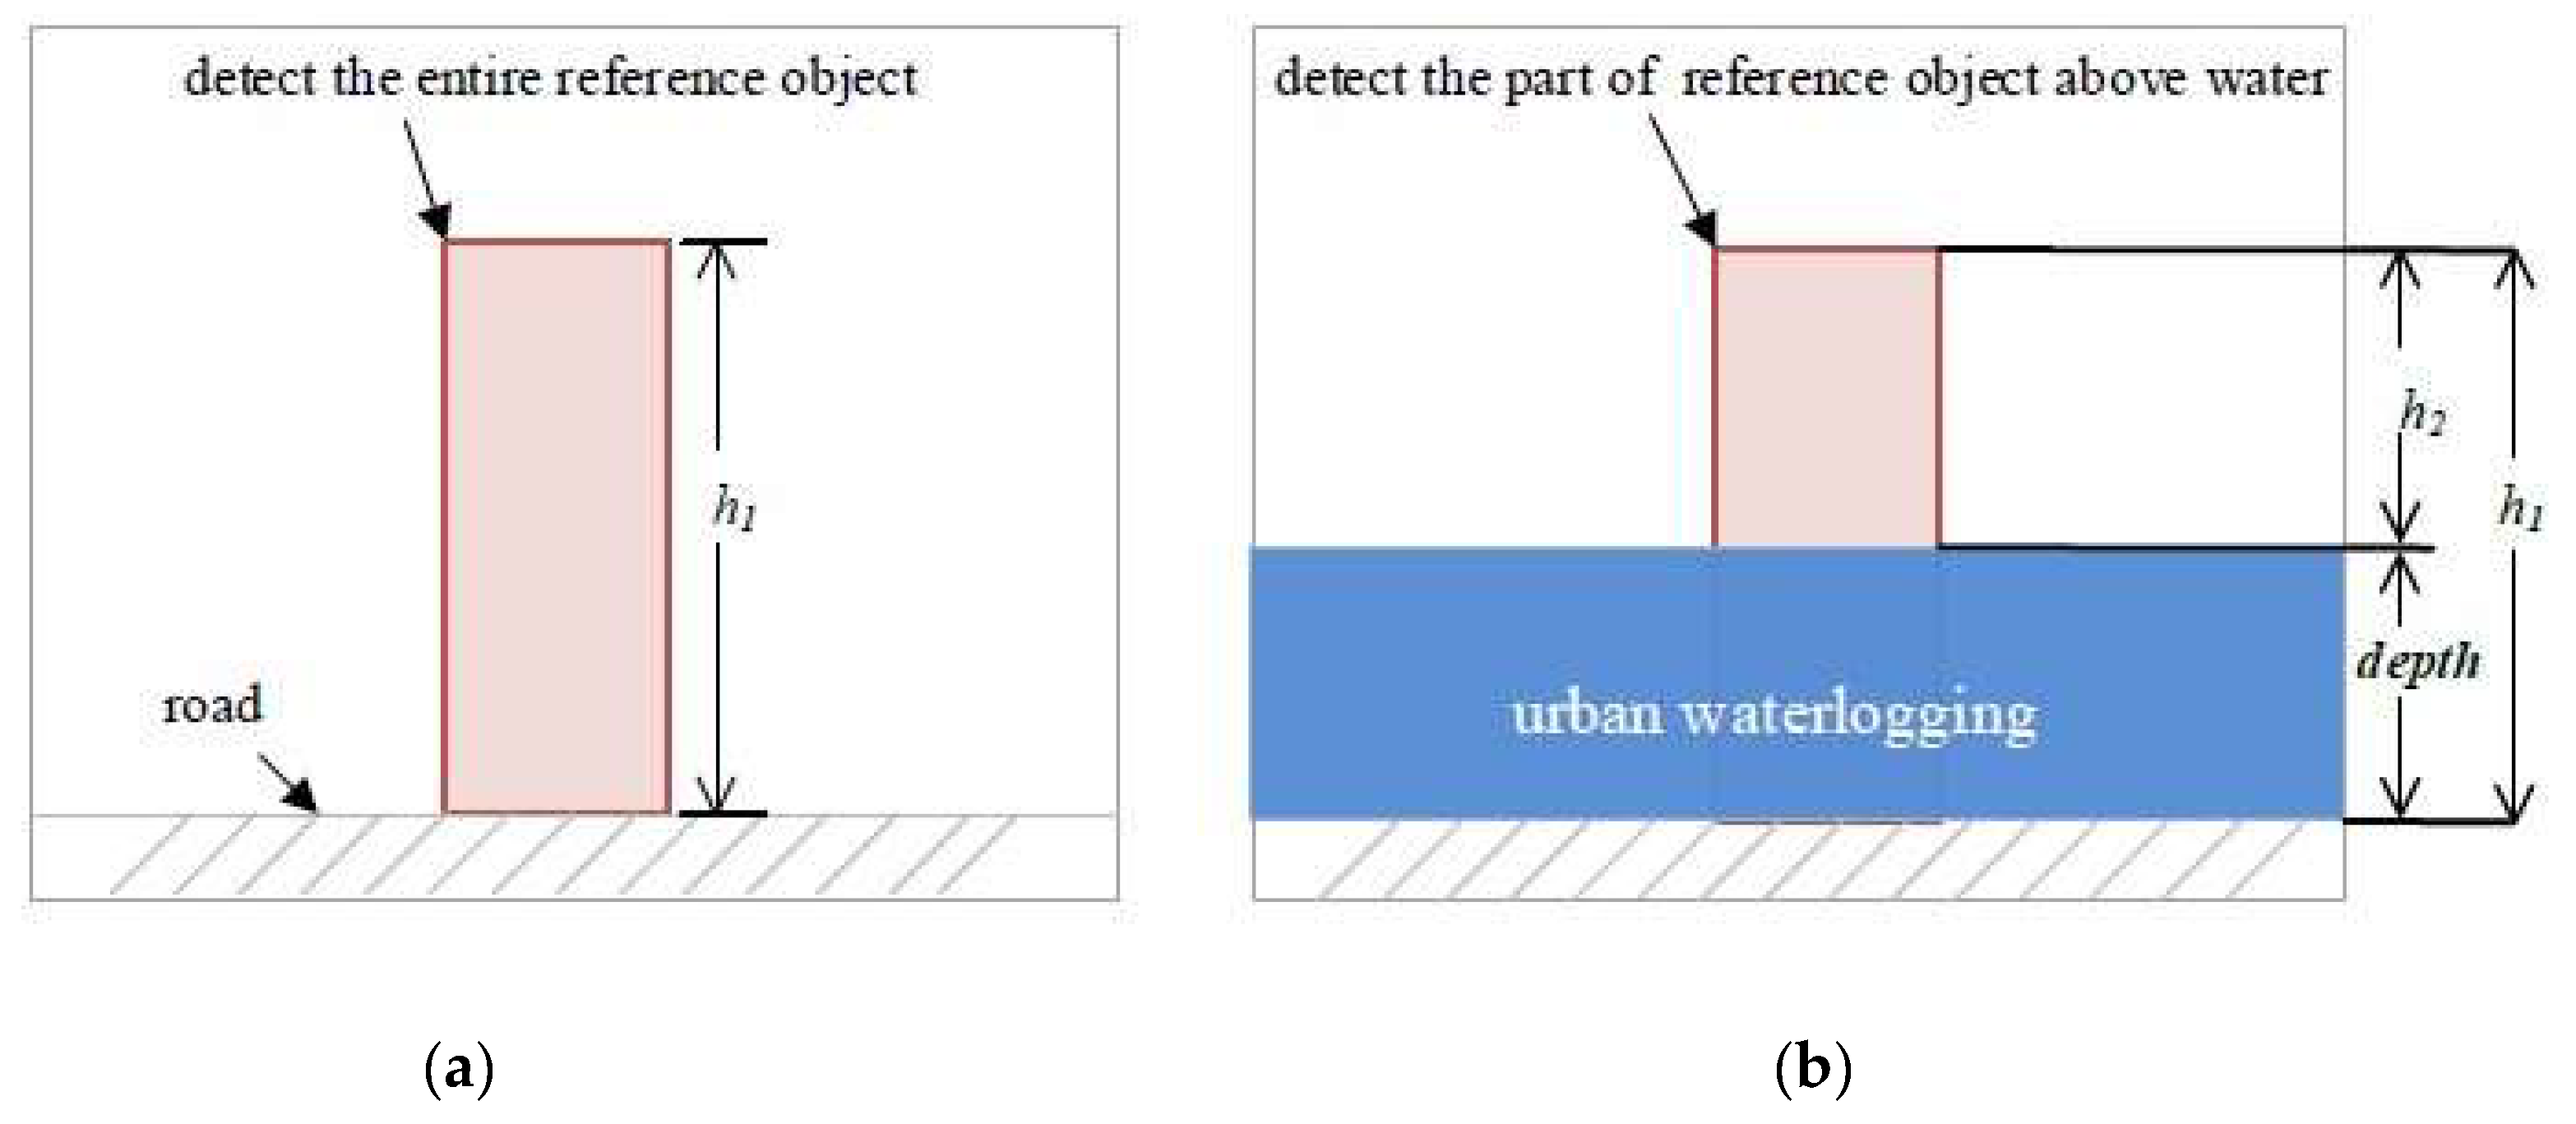
Ubiquitous reference objects, such as traffic buckets, pavement fences, and post boxes, have fixed positions and known heights and often appear in video data of cities (Figure 1). These objects can be used to indicate waterlogging depths as rulers. In non-flooding periods, the entire reference object can be detected, while in flooding periods, only the part of the object above the water level can be detected. The height difference between the detected reference object in non-flooding periods and the one in flooding periods can be treated as the waterlogging depth (Figure 2). The proposed methodology consists of two main steps in sequence.
- (1)
- Detect the reference objects from video images during the flooding and non-flooding periods by an object detection model with a CNN.
- (2)
- Estimate the waterlogging depths using the height differences between the detected reference object during non-flooding periods and the object during flooding periods.
2.1. Detection of Reference Objects Using an Object Detection Model with a Convolutional Neural Network (CNN)
In recent years, several object detection models with CNNs have been proposed, including region-based convolutional neural network (R-CNN) [18], single shot detector (SSD) [19], faster region-based convolutional neural network (Faster R-CNN) [20], region-based fully convolutional network (R-FCN) [21], and you only look once (YOLO) [22].
Among these object detection models, the SSD is one of the top object detection models in terms of both accuracy and speed. This model is a fast, single-shot object detector that can predict the bounding boxes and the class probabilities at once. Moreover, the SSD is robust to scale variations because feature maps from the convolutional layers at different positions of the network are used for object detection. The SSD works as follows:
- (1)
- Pass images, which consist of target objects and backgrounds, through a series of convolutional layers to yield feature maps at different scales;
- (2)
- Obtain multiple prior boxes of target objects on each of the feature maps;
- (3)
- Predict the bounding box offset and class probabilities for each box;
- (4)
- Use non-maximum suppression (NMS) to select the final bounding box for target objects.
More details regarding the SSD are described in reference [19]. In this study, a specific SSD, i.e., SSD with MobileNet-V1, was used to detect the reference objects from video images during the non-flooding and flooding periods, respectively. The class name and bounding box of each reference object were output by the SSD.
2.2. Estimation of Waterlogging Depths
2.2.1. Calculation of the Heights of Detected Reference Objects in the Flooding and Non-Flooding Periods
The height of a detected reference object can be calculated based on its bounding boxes.
Here, H is the height of the detected reference object in pixel units, Ymax is the maximum value of the bounding box in the y-axis in pixel units, and Ymin is the minimum value of the bounding box in the y-axis in pixel units. The full height of the entire reference object can be calculated from images in the non-flooding periods, while the height of the part of the reference object above water level can be calculated from images in the flooding periods.
2.2.2. Estimation of Waterlogging Depths
The waterlogging depth can be estimated by the following Equation (2):
Here, D is the waterlogging depth, Hp is the full height of the reference object in pixel units, HFp is the height of the part of the reference object above water level in pixel units, and Hr is the actual height of the entire reference object.
3. Case Study
3.1. Data Set and Computing Environment
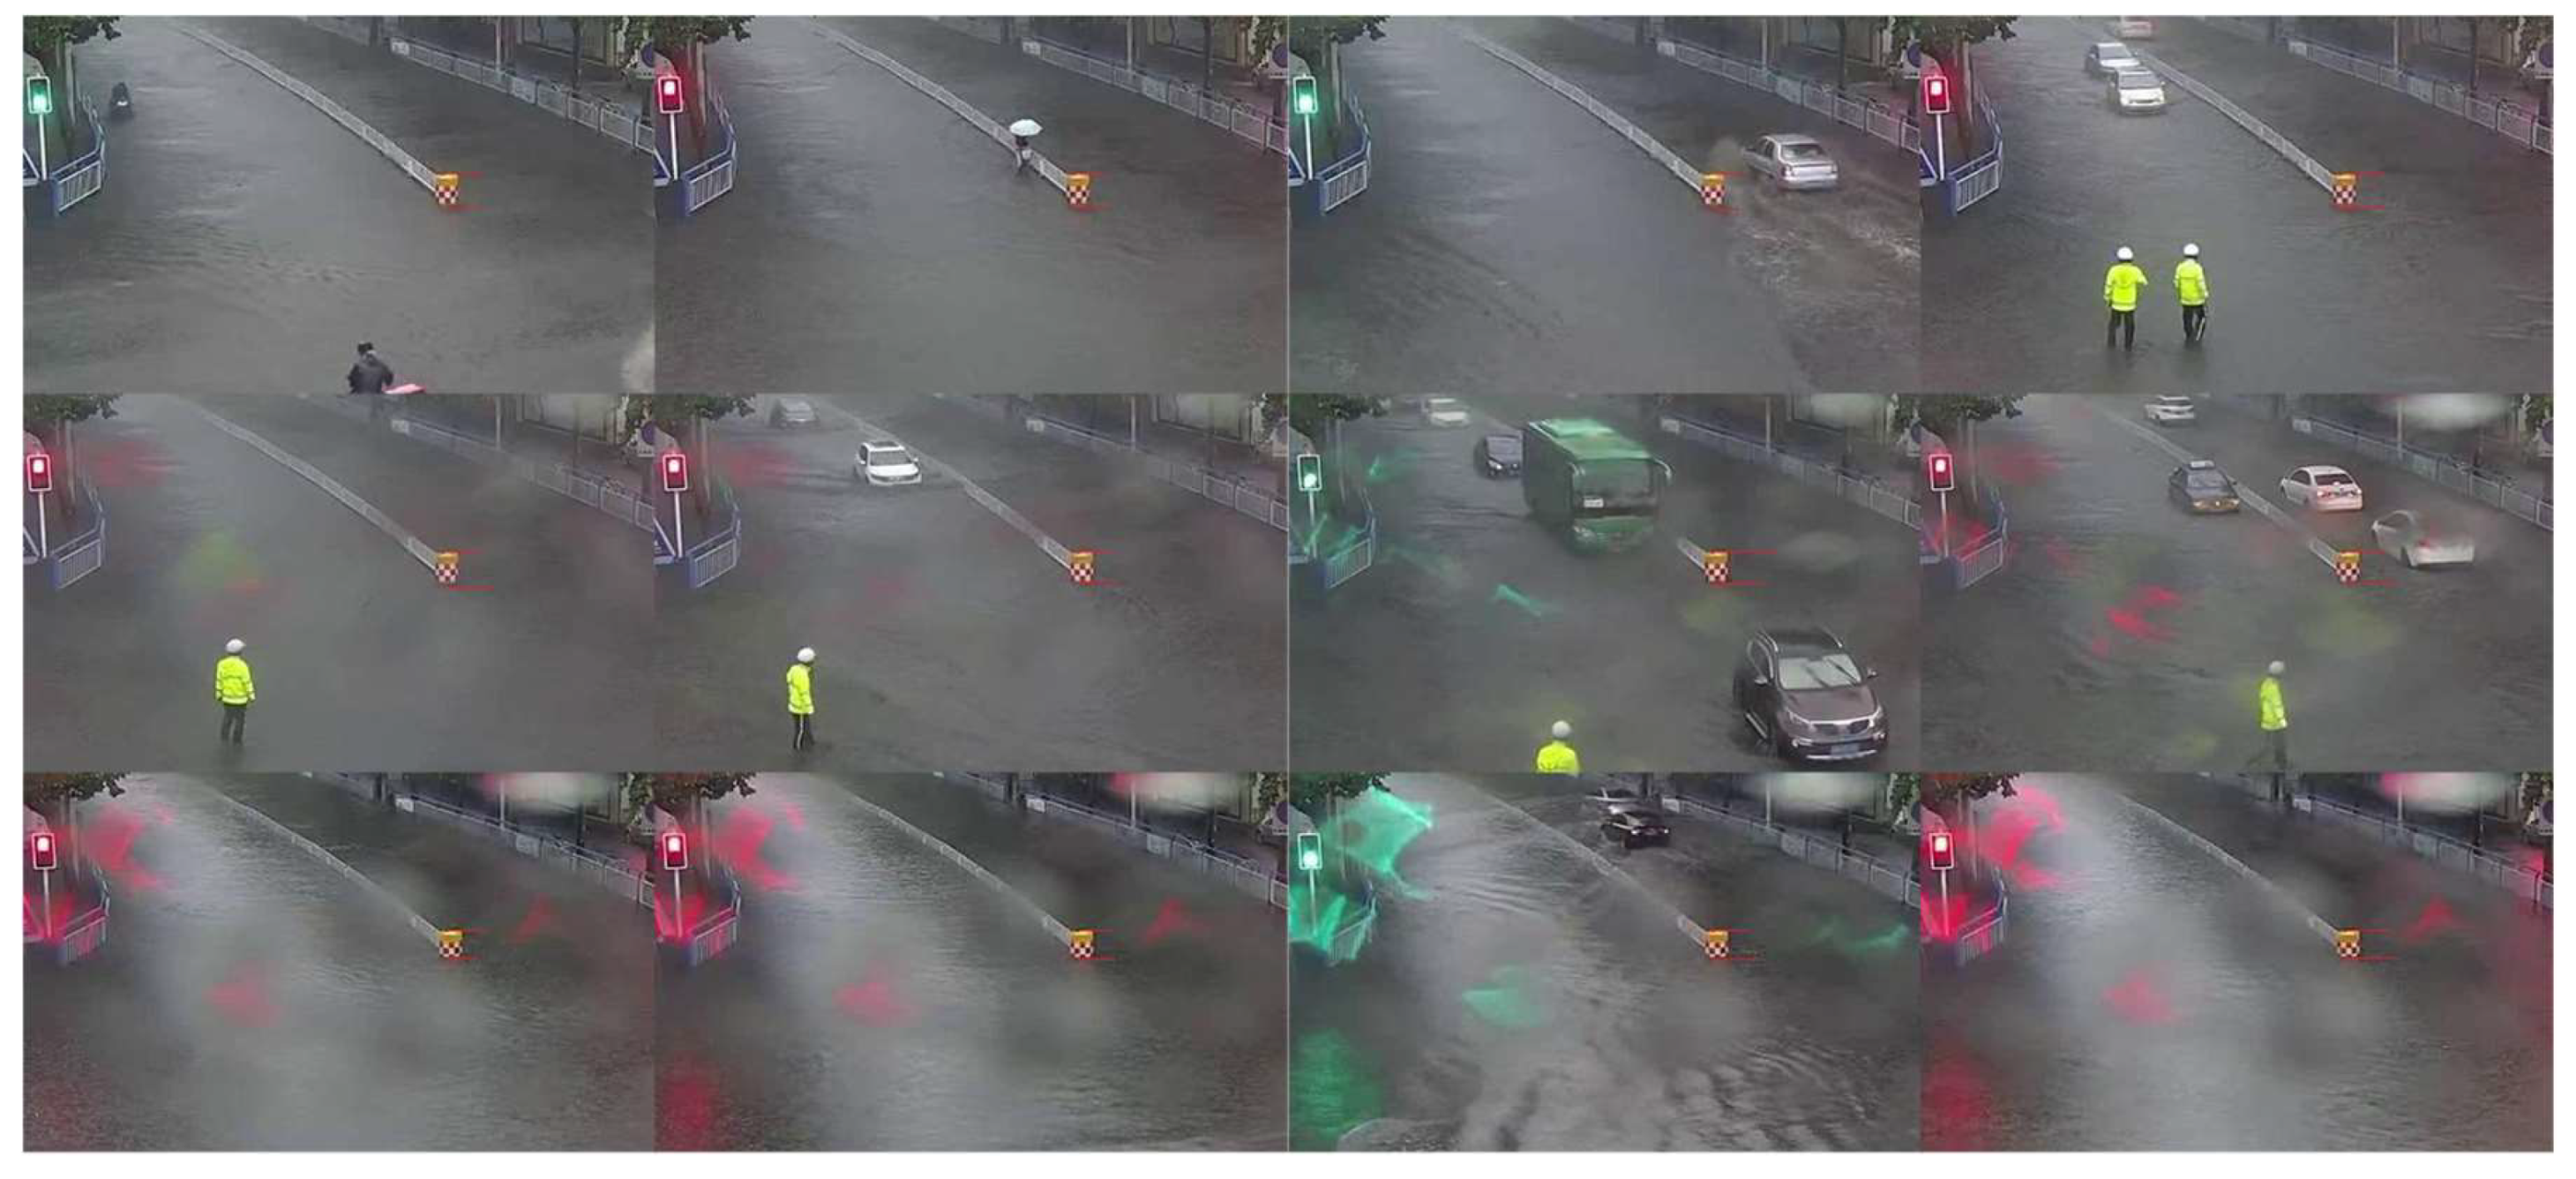
A video data set from a city in Hebei Province, China was used to evaluate the effectiveness of the proposed method (Figure 3). The video recorded a pluvial event caused by a heavy rainfall on 21 July 2017. The video was converted into 190 images in the joint photographic experts group (JPEG) format. The original resolution of these video images was 1280 × 720 pixels. These images were cropped into small-sized images according to the specific region of interest (RoI).
In this study, traffic buckets were used as reference objects to estimate the waterlogging depths from video images. The height of traffic buckets is usually unified within a city (e.g., 825 mm in this case study). The traffic buckets of each image were labelled using LabelImg software. These images with annotations were randomly divided into a training set of 150 images and a testing set of 40 images. For the training of the SSD with MobileNet-V1, the video images of the training data set and corresponding annotation files (including the bounding box of each reference object in the images) were used. For the testing of the SSD, the video images of the testing data set were inputted into the trained the SSD to predict the bounding box of each detected reference object.
The calculation time of the training phase and the testing phase was measured using a NVIDIA Corporation GM200GL [Tesla M40] and NVIDIA UNIX x86_64 Kernel Module 384.66 on a Linux system (i.e., Ubuntu 5.4.0-6ubuntu1~16.04.5) with an Intel(R) Xeon(R) CPU E5-2682 v4 @ 2.50 GHz.
3.2. Results
3.2.1. Detection of Reference Objects from Images
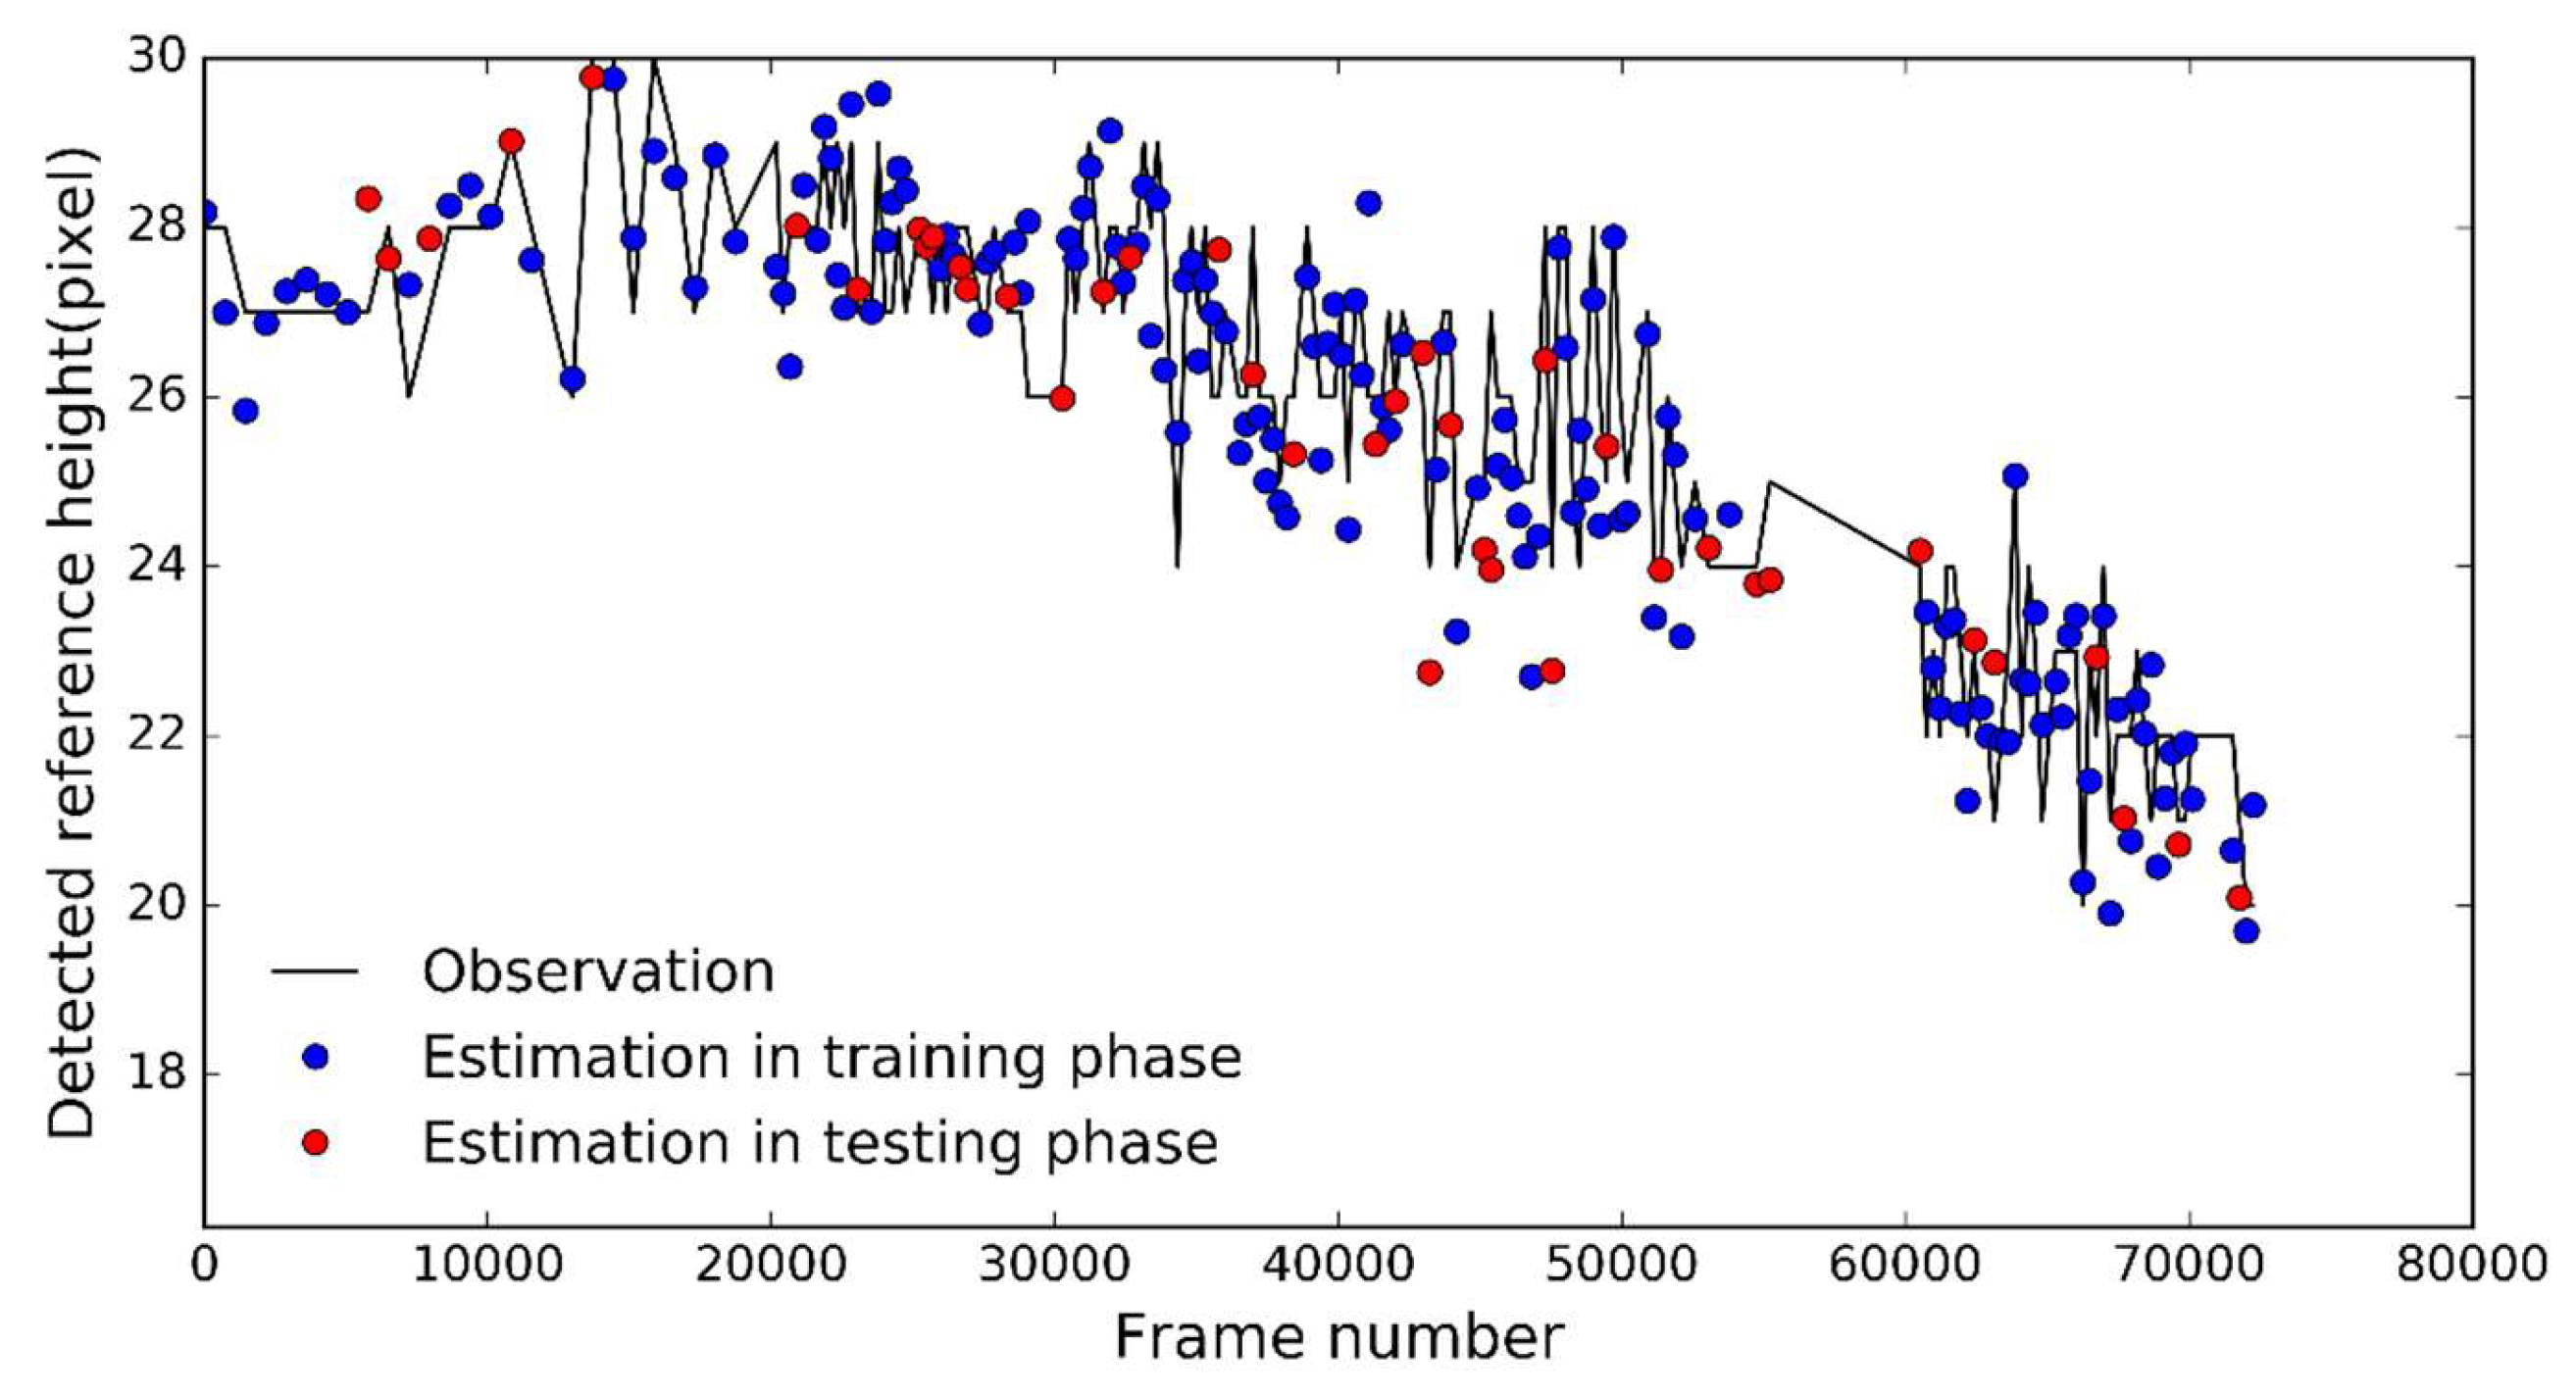
The SSD was used to detect traffic buckets from the images. All traffic buckets in the images were detected by the SSD. The heights of the bounding boxes detected by handwork were treated as the “observations”, and the heights detected by the SSD were treated as the “estimations”. Overall, it was found that the estimations agreed well with the observations (Figure 4). The root mean square error (RMSE) and the mean absolute percentage error (MAPE) were used to evaluate the accuracy of the heights of the detected reference objects. During the training phase, the RMSE value and the MAPE value were 0.847 pixels and 2.677%, respectively. During the testing phase, the RMSE value and the MAPE value were 0.958 pixels and 2.765%, respectively.
3.2.2. Accuracy of the Estimated Waterlogging Depths
The above heights of bounding boxes of the reference objects detected by handwork and the SSD model were used to estimate the waterlogging depths according to Equation (2), respectively. The waterlogging depths estimated by hand were treated as the “observations”, and the depths estimated by the SSD were treated as the “estimations”. Figure 5 shows acceptable agreement between the observations and the estimations.
The RMSE and the MAPE were used to evaluate the accuracy of the estimated waterlogging depths. During the training phase, the RMSE value and the MAPE value were 0.023 m and 19.945%, respectively. During the testing phase, the RMSE value and the MAPE value were 0.026 m and 19.968%, respectively.
3.2.3. Computational Efficiency
The average training time and average testing time were used to evaluate the efficiency of the method in the aforementioned computing environment. The average training time was 1.853 min, and the average testing time was 0.406 s.
4. Discussion
4.1. Advantages and Disadvantages
The video supervision equipment, which is readily available in cities, is treated as a new data sources to obtain waterlogging depths. The use of this equipment means that the cost of data acquisition will be greatly reduced for the proposed method. The input data of training object detection models with a CNN are images with annotations, which can be easily accomplished by persons without professional knowledge. It is feasible to promote our proposed method within cities. Video cameras distributed in urban areas usually have high resolutions, which is conducive to obtaining high-resolution and accurate waterlogging depth information. The temporal resolution of video data is very high, which is important for the detailed analysis of urban flooding. Moreover, this proposed method could obtain a wide coverage of urban flooding information in cities with a high density of cameras.
Compared with the existing methods, the proposed method achieves a balance between accuracy and cost. More importantly, it can obtain waterlogging information over large regions in real-time and low-cost ways using readily available video supervision equipment in most cities. The comparison with existing methods is discussed in the following. Water level sensors have high monitoring accuracy [5], but they are expensive. Usually only a small number of sensors are distributed in limited urban areas [3]. Although the proposed method has lower accuracy than water level sensors, especially when waterlogging is shallow, it is very cheap and could have a wide monitoring coverage. The remote sensing method can monitor urban flooding with wide coverage [9]. However, remote sensing images are usually affected by weather and occlusion, and often have low spatiotemporal resolutions [3,9]. Compared with the remote sensing method, this proposed method has higher spatiotemporal resolution and accuracy, and it is less prone to be affected by weather and occlusion, but monitoring coverage may be smaller due to the limitation of camera distributions. The method based on social media/crowdsourcing data can obtain urban flooding information with a wide coverage. However, the necessary data may not be immediately available during flood events, and the monitoring accuracy still needs to be improved [3,10]. Compared with this method, the proposed method is more accurate and reliable, but monitoring locations are fixed. So, our proposed method has the advantages of low economic cost, acceptable accuracy, high spatiotemporal resolution, and wide coverage.
Although the RMSE values in this study were small, when waterlogging is shallow, the relative error may be large. For example, the waterlogging depth observation from the third video image in the testing step was 0.083 m, and the waterlogging depth estimation was 0.053 m, the relative error was about 36%. The proposed method can be used in urban areas where video data and ubiquitous reference objects are available. In the urban areas where video data set or ubiquitous reference objects are unavailable, the proposed method would be inapplicable.
The computational time required to extract the waterlogging depths from one image was relatively short (e.g., the average time was 0.406 s using the SSD in our computation environment). However, extracting the real-time waterlogging depths from hundreds of thousands of images within a city requires a large amount of computational power. Additionally, it takes a long time to train the models with a very large amount of data. Cloud computing technology and faster, real-time object detection models should be used to meet this challenge.
4.2. Error Sources
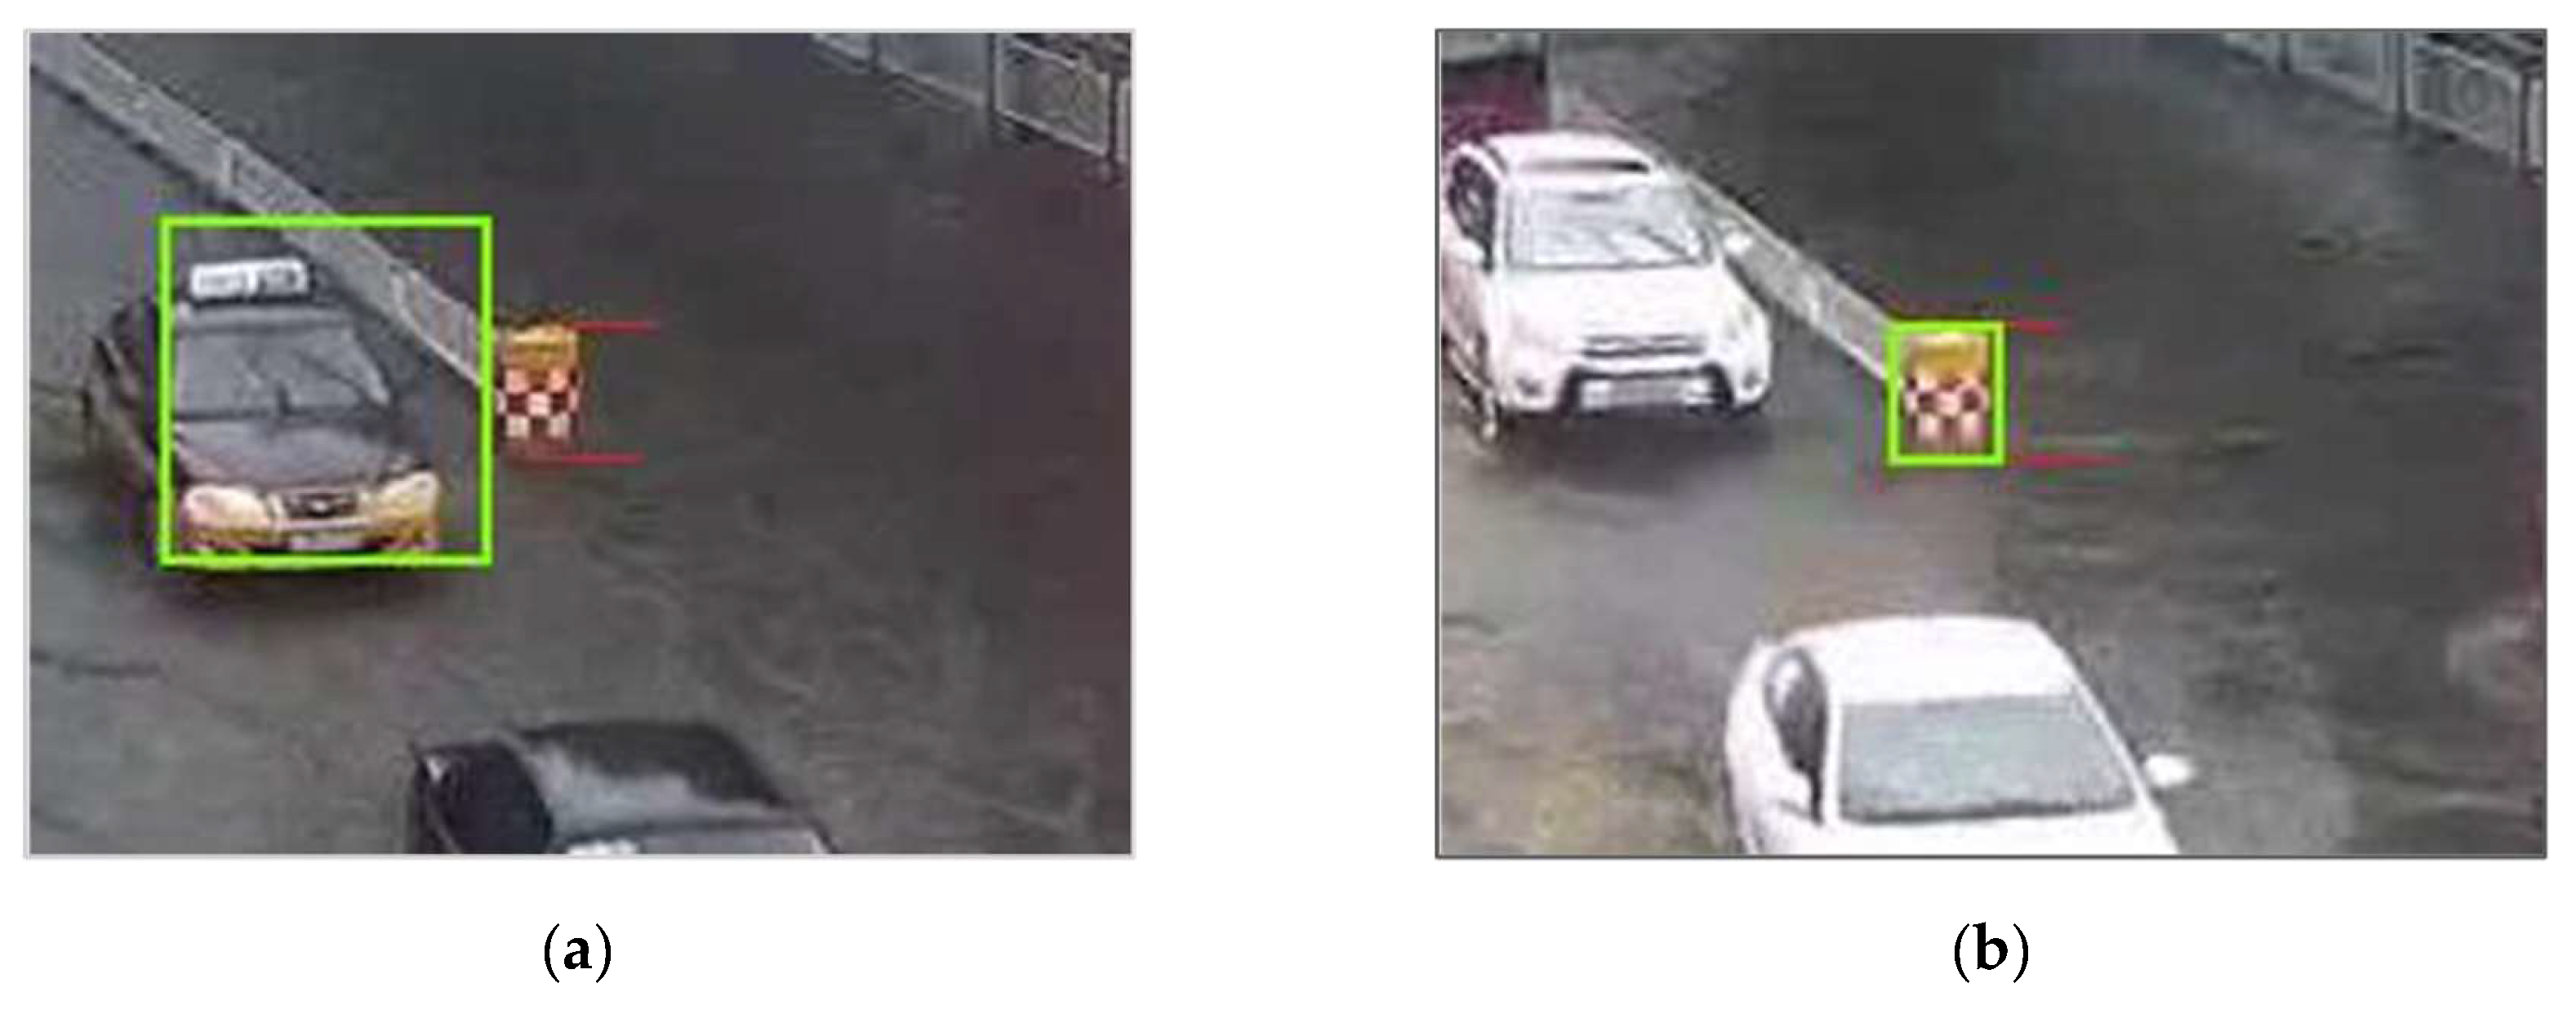
There are usually vehicles, pedestrians, and other objects in video images, which may affect the results of reference object detection. To alleviate this impact, the part of images within a specific RoI was used instead of the entire image. However, if the size of the RoI was relatively large, then the results of reference object detection could be unsatisfactory because other objects may be recognized as reference objects by mistake. For example, as shown in Figure 6, it was found that vehicles could be mistakenly recognized as reference objects (i.e., traffic buckets) by the SSD using a relatively large size of the RoI. This mistake will lead to incorrect bounding boxes for the reference objects, which then leads to an incorrect waterlogging depth. The above problem causes the estimated waterlogging depths to change sharply, which can be captured and removed or estimated according to the trend in previous periods.
Training object detection models with a CNN depends on manual image annotations. However, there may be some errors during the process of manual image annotations, which may affect the accuracy of the detection of reference objects. The pixel dimension of images is also an important factor that affects the accuracy of estimating waterlogging depths. The real height of the traffic bucket was 0.825 m in this case study. The traffic bucket heights detected by hand work and the SSD were 30 and 29.773 in pixel units, respectively. The dimension of the pixel in meters by hand work and the SSD were both about 0.028 m/pixel, respectively. The dimension of the pixel was comparable with the RMSE value in this study. The smaller the pixel dimension is, the smaller the RMSE value will be. The accuracy of the estimated waterlogging depths will be improved when video images of higher resolution are used. In addition, the metric extent of the field of view and distortions introduced by camera lenses may also affect the accuracy.
5. Conclusions and Future Work
In this paper, we presented a method to automatically estimate urban waterlogging depths from video images based on ubiquitous reference objects. First, reference objects were detected from video images during flooding and non-flooding periods by an object detection model with a CNN. Then, waterlogging depths were estimated using the height differences between the detected reference object in the non-flooding period and the object in the flooding period. In the case study, traffic buckets were used as ubiquitous reference objects to estimate waterlogging depths, and a state-of-the-art object detection model with a CNN, i.e., SSD, was employed to detect the traffic buckets in video images. The RMSE value and MAPE value of the estimated waterlogging depths were 0.026 m and 19.968%, respectively during the testing phase. The average computational time was 0.406 s during the testing phase. The results showed that video is a valuable data source for monitoring urban floods, and our proposed method could effectively mine and utilize urban waterlogging depth information from video images. The proposed method has the advantages of low economic cost, acceptable accuracy, high spatiotemporal resolution, and wide coverage. However, this proposed method would result in large relative errors when water depth values are very small.
It is feasible to promote our proposed method within cities. On one hand, city managers do not need to spend a lot of money to install monitoring sensors, on the other hand, they can keep abreast of urban flooding situations in an intelligent way. This proposed method could complement the existing means for monitoring urban flooding. Moreover, this proposed method can be further applied to the early warning and forecast of urban flooding, validation, and data assimilation of hydraulic models. It is also helpful for urban drainage scheduling and traffic administration in times of rainstorms. This method can be extended to monitor water levels or depths of other types of water bodies (e.g., lakes, rivers, and reservoirs).
It should be noted that only one video data set was used because of the data sharing policy of the local government. We would like to evaluate this proposed method by using more video datasets in our future work. In addition to traffic buckets, other types of ubiquitous reference objects with fixed positions and known heights (e.g., pavement fences and post boxes) can also be utilized to estimate waterlogging depths by our proposed method. Many other types of objects with unfixed positions (e.g., vehicles and pedestrians) often appear in video images and could be treated as common reference objects. We would attempt to utilize multiple objects to extract waterlogging depths in the future so that the accuracy and applicability of this method can be improved.
Author Contributions
Conceptualization, J.J.; Methodology, J.J. and J.L.; Software, J.J. and J.H.; Validation, J.J., J.L. and C.C.; Formal Analysis, J.L.; Investigation, J.J.; Resources, L.J. and C.C.; Writing—Original Draft Preparation, J.J.; Writing—Review & Editing, J.L., C.C. and A.X.; Funding Acquisition, J.J. and L.J.
Funding
This research was funded by the National Natural Science Foundation of China (41601423; 41601413), the National Basic Research Program of China (2015CB954102), and the Outstanding Innovation Team in Colleges and Universities in Jiangsu Province.
Acknowledgments
The authors thank the Outstanding Innovation Team in Colleges and Universities in Jiangsu Province for providing data in this study. The authors also thank Yamin Miao for the help in the model training. The authors would like to thank the reviewers and editors for their constructive comments and insightful suggestions.
Conflicts of Interest
The authors declare no conflict of interest.
References
- Xie, J.; Chen, H.; Liao, Z.; Gu, X.; Zhu, D.; Zhang, J. An integrated assessment of urban flooding mitigation strategies for robust decision making. Environ. Modell. Softw. 2017, 95, 143–155. [Google Scholar] [CrossRef]
- Miller, J.D.; Hutchins, M. The impacts of urbanisation and climate change on urban flooding and urban water quality: A review of the evidence concerning the United Kingdom. J. Hydrol. 2017, 12, 345–362. [Google Scholar] [CrossRef] [Green Version]
- Wang, R.Q.; Mao, H.; Wang, Y.; Rae, C.; Shaw, W. Hyper-resolution monitoring of urban flooding with social media and crowdsourcing data. Comput. Geosci. 2018, 111, 139–147. [Google Scholar] [CrossRef]
- Jiang, J.; Liu, J.; Qin, C.Z.; Wang, D. Extraction of urban waterlogging depth from video images using transfer learning. Water 2018, 10, 1485. [Google Scholar] [CrossRef]
- Crabit, A.; Colin, F.; Bailly, J.S.; Ayroles, H.; Garnier, F. Soft water level sensors for characterizing the hydrological behaviour of agricultural catchments. Sensors 2011, 11, 4656–4673. [Google Scholar] [CrossRef] [PubMed]
- Feng, Q.; Liu, J.; Gong, J. Urban flood mapping based on unmanned aerial vehicle remote sensing and random forest classifier—A case of Yuyao, China. Water 2015, 7, 1437–1455. [Google Scholar] [CrossRef]
- Perks, M.T.; Russell, A.J.; Large, A.R. Advances in flash flood monitoring using unmanned aerial vehicles (UAVs). Hydrol. Earth Syst. Sci. 2016, 20, 4005–4015. [Google Scholar] [CrossRef]
- Ticehurst, C.; Guerschman, J.P.; Chen, Y. The strengths and limitations in using the daily MODIS open water likelihood algorithm for identifying flood events. Remote Sens. 2014, 6, 11791–11809. [Google Scholar] [CrossRef]
- Schumann, G.J. Preface: Remote sensing in flood monitoring and management. Remote Sens. 2015, 7, 17013–17015. [Google Scholar] [CrossRef]
- Rosser, J.F.; Leibovici, D.G.; Jackson, M.J. Rapid flood inundation mapping using social media, remote sensing and topographic data. Nat. Hazards 2017, 87, 103–120. [Google Scholar] [CrossRef] [Green Version]
- Fohringer, J.; Dransch, D.; Kreibich, H.; Schröter, K. Social media as an information source for rapid flood inundation mapping. Nat. Hazards Earth Syst. Sci. 2015, 15, 2725–2738. [Google Scholar] [CrossRef] [Green Version]
- Liu, L.; Liu, Y.; Wang, X.; Yu, D.; Hu, G. Developing an effective 2-d urban flood inundation model for city emergency management based on cellular automata. Nat. Hazards Earth Syst. Sci. 2015, 15, 381–391. [Google Scholar] [CrossRef]
- Wang, Y.; Chen, A.S.; Fu, G.; Djordjević, S.; Zhang, C.; Savić, D.A. An integrated framework for high-resolution urban flood modelling considering multiple information sources and urban features. Environ. Modell. Softw. 2018, 107, 85–95. [Google Scholar] [CrossRef]
- Nguyen, L.S.; Schaeli, B.; Sage, D.; Kayal, S.; Rossi, L. Vision-based system for the control and measurement of wastewater flow rate in sewer systems. Water Sci. Technol. 2009, 60, 2281–2289. [Google Scholar] [CrossRef] [PubMed] [Green Version]
- Gilmore, T.E.; Birgand, F.; Chapman, K.W. Source and magnitude of error in an inexpensive image-based water level measurement system. J. Hydrol. 2013, 496, 178–186. [Google Scholar] [CrossRef]
- Lowe, D.G. Distinctive image features from scale-invariant keypoints. Int. J. Comput. Vis. 2004, 60, 91–110. [Google Scholar] [CrossRef]
- Dalal, N.; Triggs, B. Histograms of oriented gradients for human detection. In Proceedings of the 2005 IEEE Computer Society Conference on Computer Vision and Pattern Recognition, San Diego, CA, USA, 20–25 June 2005; pp. 886–893. [Google Scholar]
- Girshick, R.; Donahue, J.; Darrell, T.; Malik, J. Rich feature hierarchies for accurate object detection and semantic segmentation. In Proceedings of the 2014 IEEE Conference on Computer Vision and Pattern Recognition, Columbus, OH, USA, 23–28 June 2014; pp. 580–587. [Google Scholar]
- Liu, W.; Anguelov, D.; Erhan, D.; Szegedy, C.; Reed, S.; Fu, C.Y.; Berg, A.C. SSD: Single shot multibox detector. In Proceedings of the Computer Vision–European conference on computer vision 2016, Amsterdam, The Netherlands, 11–14 October 2016; pp. 21–37. [Google Scholar]
- Ren, S.; He, K.; Girshick, R.; Sun, J. Faster R-CNN: Towards real-time object detection with region proposal networks. IEEE Trans. Pattern Anal. Mach. Intell. 2017, 39, 1137–1149. [Google Scholar] [CrossRef] [PubMed]
- Dai, J.; Li, Y.; He, K.; Sun, J. R-FCN: Object detection via region-based fully convolutional networks. In Proceedings of the 30th Conference on Neural Information Processing Systems, Barcelona, Spain, 5–10 December 2016; pp. 379–387. [Google Scholar]
- Redmon, J.; Divvala, S.; Girshick, R.; Farhadi, A. You only look once: Unified, real-time object detection. In Proceedings of the 2016 IEEE Conference on Computer Vision and Pattern Recognition, Las Vegas, NV, USA, 27–30 June 2016; pp. 779–788. [Google Scholar]
Figure 1.
Some types of ubiquitous reference objects, e.g., pavement fence (a), ashbin (b), post box (c), and traffic bucket (d).
Figure 1.
Some types of ubiquitous reference objects, e.g., pavement fence (a), ashbin (b), post box (c), and traffic bucket (d).

Figure 2.
The video image in the non-flooding period (a), and the video image in the flooding period (b). h1 is the height of the entire reference object, h2 is the height of the part of the reference object above water, and depth is the waterlogging depth.
Figure 2.
The video image in the non-flooding period (a), and the video image in the flooding period (b). h1 is the height of the entire reference object, h2 is the height of the part of the reference object above water, and depth is the waterlogging depth.

Figure 3.
Sample partial images of the video data set.

Figure 4.
The height of the reference object detected by handwork (i.e., observations) and the height detected by the single shot detector (SSD) (i.e., estimations).
Figure 4.
The height of the reference object detected by handwork (i.e., observations) and the height detected by the single shot detector (SSD) (i.e., estimations).

Figure 5.
Waterlogging depths estimated by handwork (i.e., observations) and the depths estimated by the single shot detector (SSD) (i.e., estimations).
Figure 5.
Waterlogging depths estimated by handwork (i.e., observations) and the depths estimated by the single shot detector (SSD) (i.e., estimations).

Figure 6.
An example of one car being mistakenly recognized as a traffic bucket (a), and an example of the traffic bucket being correctly detected (b) using a relatively large size for the region of interest (RoI). The green box is the bounding box. Due to the low resolution of available video data, these images are not very clear.

© 2019 by the authors. Licensee MDPI, Basel, Switzerland. This article is an open access article distributed under the terms and conditions of the Creative Commons Attribution (CC BY) license (http://creativecommons.org/licenses/by/4.0/).
Share and Cite
MDPI and ACS Style
Jiang, J.; Liu, J.; Cheng, C.; Huang, J.; Xue, A. Automatic Estimation of Urban Waterlogging Depths from Video Images Based on Ubiquitous Reference Objects. Remote Sens. 2019, 11, 587. https://0-doi-org.brum.beds.ac.uk/10.3390/rs11050587
AMA Style
Jiang J, Liu J, Cheng C, Huang J, Xue A. Automatic Estimation of Urban Waterlogging Depths from Video Images Based on Ubiquitous Reference Objects. Remote Sensing. 2019; 11(5):587. https://0-doi-org.brum.beds.ac.uk/10.3390/rs11050587
Chicago/Turabian StyleJiang, Jingchao, Junzhi Liu, Changxiu Cheng, Jingzhou Huang, and Anke Xue. 2019. "Automatic Estimation of Urban Waterlogging Depths from Video Images Based on Ubiquitous Reference Objects" Remote Sensing 11, no. 5: 587. https://0-doi-org.brum.beds.ac.uk/10.3390/rs11050587
Note that from the first issue of 2016, this journal uses article numbers instead of page numbers. See further details here.