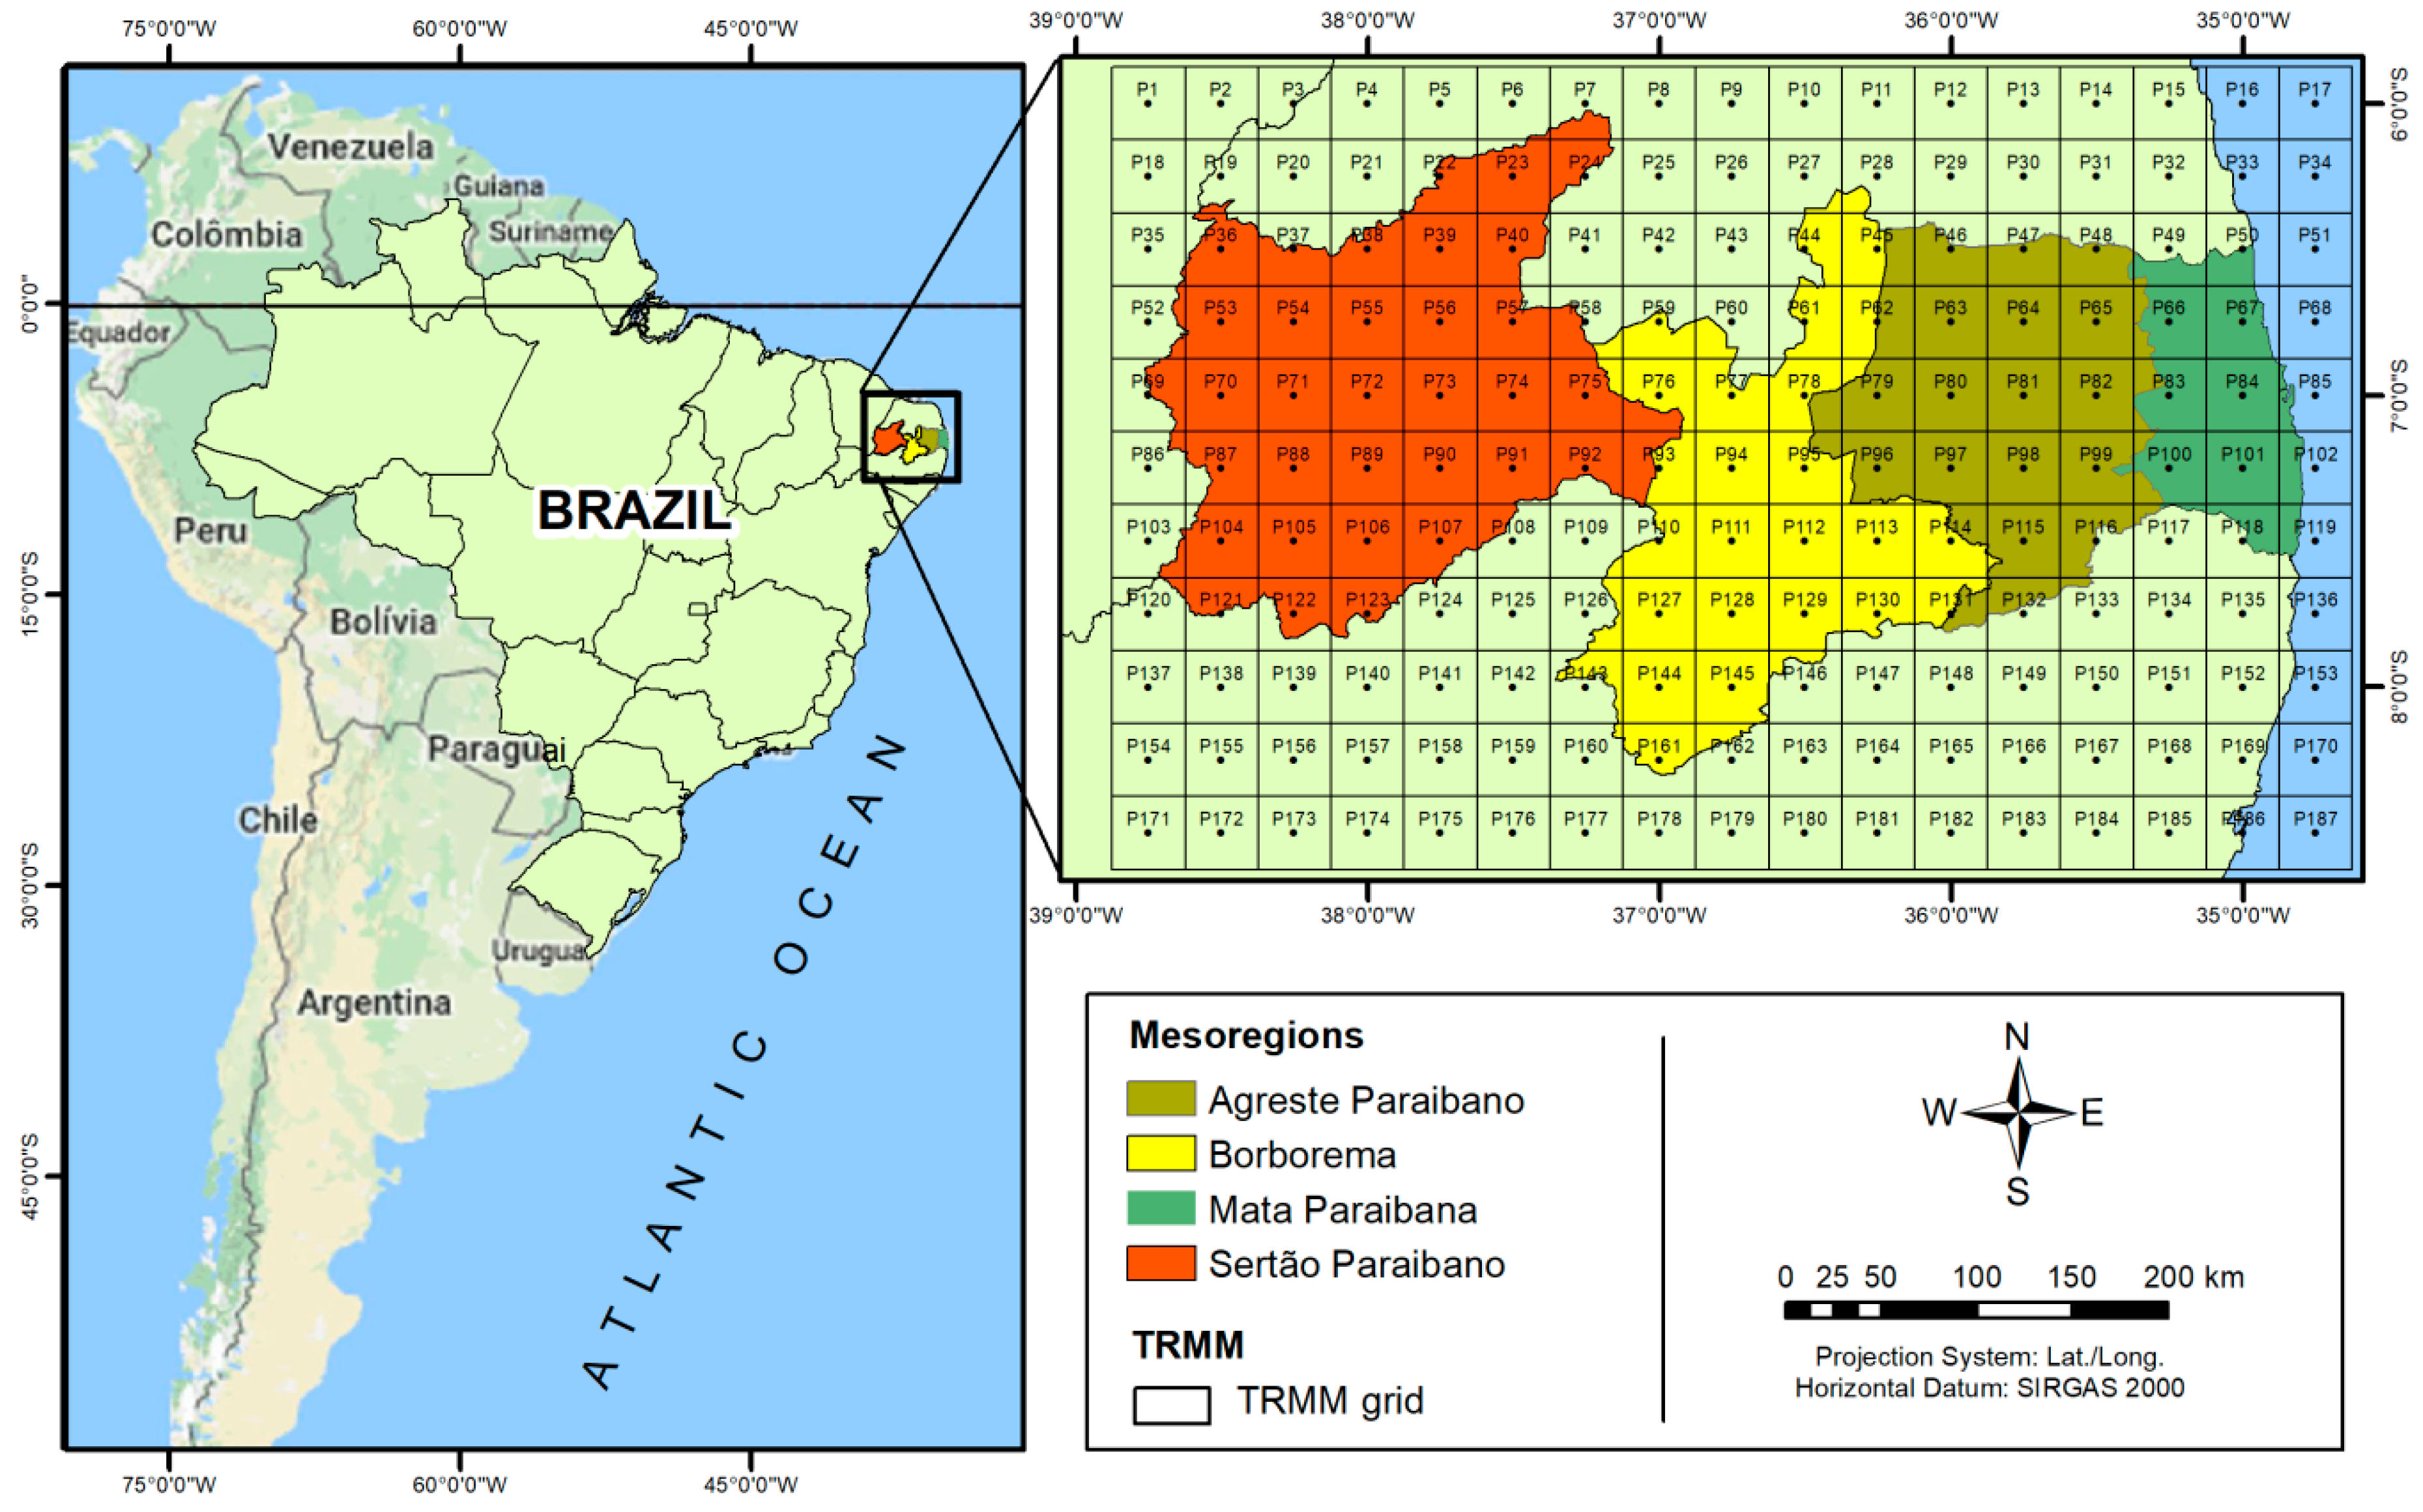
1. Introduction
Precipitation is considered the most important meteorological variable for farming, water supply, and human life; therefore, understanding the spatiotemporal behavior of that variable has attracted the attention of various researchers who conduct studies to identify the occurrence of extreme phenomena such as droughts and floods. Regarding droughts, the arid and semiarid regions need further research [
1,
2,
3,
4] because they are susceptible to natural disasters caused by droughts and climate change. According to Farhangi et al. [
5], the main problem in these regions is not necessarily the rainfall deficit but rather its high spatial and temporal variability as well as its intensity and duration.
In South America, the northeastern region of Brazil has been historically affected by water shortages, especially in its semiarid region [
6,
7,
8]. The semiarid region of Brazil is the most populous in the world, having more than 24 million inhabitants and a high population density [
9], and is considered among the areas most vulnerable to recurrent droughts worldwide [
10]. The drought from 2011 to 2017 was one of the most severe in recent decades in this region, affecting approximately 9 million people [
11]. In addition, Cunha et al. [
10] identified that in the period 1982–2016, three of the five most severe drought events over the semiarid region of Brazil (1997–1998, 2007–2008, and 2012–2015) occurred in the period 1998–2015. Therefore, it is important to evaluate the rainfall patterns in this specific period over Paraíba state for social development and to mitigate the damaging effects of the droughts.
Paraíba state is almost fully located in the semiarid region of northeastern Brazil and is frequently affected by droughts [
4]. In this region, subsistence farming is carried out, which provides food for and economically supports small farmers, especially in less developed areas. Thus, considering the harmful effects of droughts that frequently affect the population of the semiarid region of Brazil, several statistical methods combined with the geographic information system and remote-sensing products have been developed and used to analyze the spatiotemporal trends of precipitation.
Among the statistical methods used to investigate the spatiotemporal variations of climatological variables, application of multivariate techniques by cluster analysis to delimitate homogeneous regions and to identify regional and global climate patterns has been increasing in recent years [
12]. The application of this tool is among the most used approaches in the literature on clustering processes (e.g., [
13,
14,
15,
16]), and the relevance of this technique is closely related not only to the quality and types of variables that can be grouped under different aspects but also to the identification of similarity and dissimilarity patterns among study variables. Thus, due to the flexibility of combinations of similarity methods and metrics, hierarchical cluster analysis is suitable for different purposes and situations, which makes its application comprehensive and effective for different types of variables and studies.
In the study conducted by Unal et al. [
13], for example, different hierarchical clustering methods were tested using precipitation and temperature data to define climate zones in Turkey, and seven different climate regions were found. In Brazil, Lyra et al. [
14] analyzed the rainfall in the state of Alagoas, which is also located in northeastern Brazil, using hierarchical cluster analysis and spatiotemporal rainfall patterns based on 36 precipitation time series. The results indicated that the cluster analysis method adequately identified five homogeneous regions as well as precipitation trends and active climate systems in each region. In the central region of Brazil, Teodoro et al. [
17] analyzed the spatiotemporal variability in rainfall by hierarchical cluster analysis to identify the meteorological systems that affect the rainfall regime of biomes in the state of Mato Grosso do Sul. The results were also effective, identifying five different homogeneous regions regarding the rainfall trends in the study area. For example, such identification of homogeneous regions, based on precipitation records, would be useful to assist decision-making regarding the adoption of plans to be applied to the water management in cities and reservoirs within the same cluster. Thus, each cluster would have a specific plan to combat the implications of drought.
However, long, consistent, and faultless data series capable of capturing the rainfall regime and climatic variations of these regions are necessary to apply clustering methods to meteorological variables. Accordingly, among the products most often used to analyze the precipitation trends are those derived from the Tropical Rainfall Measuring Mission (TRMM), which is known for generating uninterrupted estimates of precipitation data since 1998, making them available through different products and spatiotemporal resolutions for the tropics [
18,
19,
20]. Among many satellite-based precipitation products, e.g., the Precipitation Estimation from Remotely Sensed Information using Artificial Neural Networks (PERSIANN), the Climate Prediction Center (CPC) Morphing (CMOPRH) and Global Precipitation Measurement Mission (GPM), the TRMM multisatellite precipitation analysis (TMPA) precipitation estimates were reported to perform the best among them in the TRMM era [
21,
22].
The main advantage of using TRMM products in the present analysis is because it provides long, consistent, faultless, and uniformly distributed precipitation time series throughout Paraíba state [
4]. Precipitation estimates generated by the TRMM satellite have been validated with rainfall data in Brazil and worldwide and are already being used as a database for the development of several studies in the field of water resources [
23,
24,
25]. For example, Islam and Uyeda [
26] recently determined the climate characteristics of rainfall over Bangladesh, and Santos et al. [
4] evaluated the short-, medium-, and long-term drought conditions and trends in Paraíba state using TRMM data.
Cattani et al. [
15] evaluated six satellite-derived precipitation products over East Africa to investigate precipitation seasonality from 2001 to 2009 in the region. Based on the results, eight different areas (clusters) were delimitated, and the 3B42 product of the TRMM satellite was the most notable for its performance. In a similar study, Corporal-Lodangco and Leslie [
16] used TRMM satellite data to apply cluster analysis and to determine the optimal number of homogeneous clusters to identify climate zones in the Philippines.
As discussed by Omranian and Sharif [
27] on a study evaluating three different GPM products over a region of Texas, the change in spatiotemporal resolution of satellite precipitation products directly affects the accuracy of the satellite estimates. In general, the longer the data accumulation period and the less refined the spatial resolution are, the accuracy of the precipitation estimates obtained by remote sensing is better. In Paraíba, Soares et al. [
28] have already tested the accuracy between TRMM satellite and rain gauges data for identifying rainfall regimes over time, using some statistical metrics, e.g., bias, root mean squared, and correlation coefficient. The results for different spatiotemporal scales showed that especially on a monthly scale, which is the timescale used in this study to cluster regions with homogeneous characteristics, the TRMM 3B42 product presented good statistical accuracy (correlation coefficient > 0.8). However, despite the usefulness of knowing the spatiotemporal patterns of precipitation, no study is known to have assessed in more detail the spatiotemporal precipitation trends in this region of Brazil by cluster analysis, and the zoning proposed in this study is important for the development of further studies related to water resources in the region.
Some studies reported in the literature could not analyze in depth the spatial variation of the monthly precipitation due to its complexity. In the study by Teodoro et al. [
17], for example, five different homogeneous regions are identified over a region of northeastern Brazil, albeit without analyzing how those groups interact with each other each month or their inter-monthly variation. The same gap is found in the study conducted by Macedo et al. [
29] in Paraíba state. In that study, although homogeneous regions were clustered based on k-means clustering, a breakdown of the inter-monthly variation across the state is still needed.
By reflecting on this and other knowledge gaps identified in studies on precipitation behavior that may be bridged, the cluster analysis proposed in this study is relevant because it enables not only the identification of homogeneous regions considering the entire study period (1998–2015) but also the evaluation of the similarity and dissimilarity between regions in each month, thereby facilitating the identification of the climate systems active in each region. Thus, by considering the water shortage problem in Paraíba in the last two decades, this study aims to analyze the precipitation variability using data estimated by the TRMM satellite to identify homogeneous precipitation trends and the climate systems active in Paraíba state by applying the statistical method of cluster analysis. The intention is to bridge knowledge gaps found in other studies and to understand how the regional monthly rainfall trends are affected by climate systems.
3. Results and Discussion
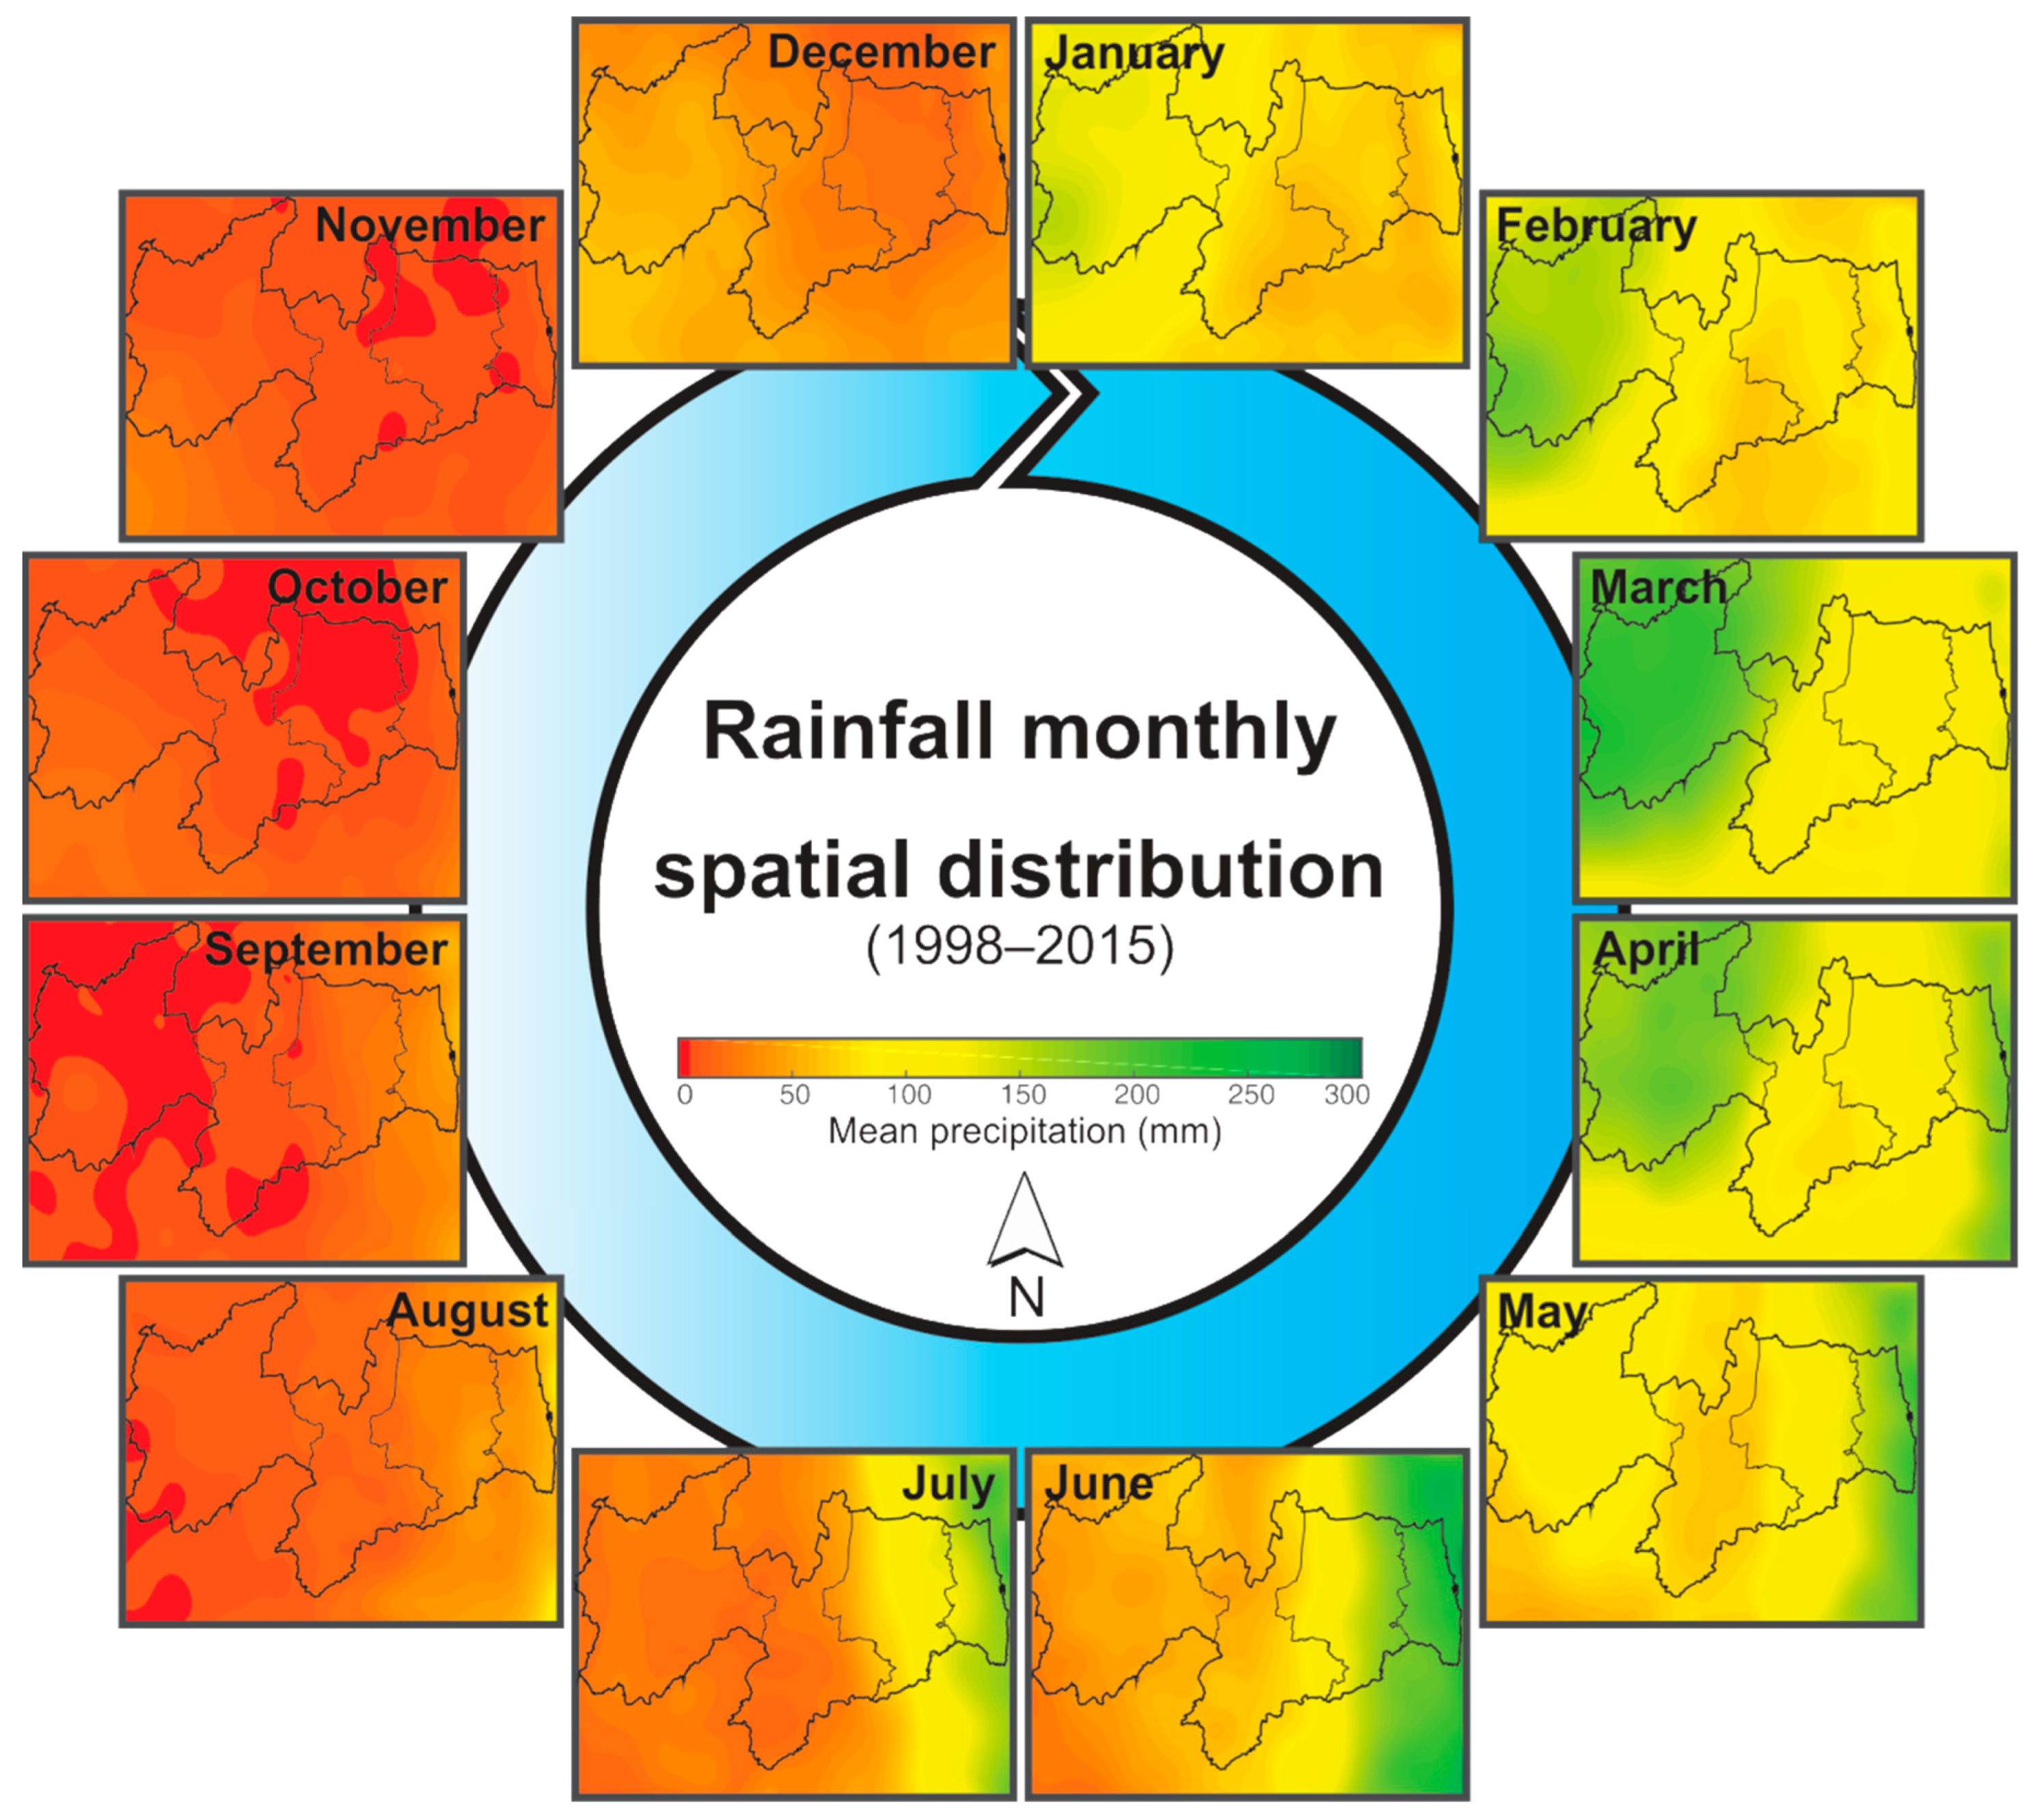
Figure 3 shows the spatial distribution of the mean monthly TRMM precipitation in the study area over the 18 study years (1998–2015). The results show the spatiotemporal variability of the monthly precipitation over Paraíba state, with precipitation values ranging from 0 to 300 mm, depending on the month and on the area of Paraíba. In general, the months from January to June are the rainiest, whereas the months from July to December are the least rainy in this state. The Mata Paraibana mesoregion shows the highest precipitation values, and the Borborema mesoregion has the lowest values, regardless of the month analyzed.
Although
Figure 3 clearly shows the spatiotemporal trends of precipitation in the study area, enabling the identification of the driest and rainiest months in Paraíba state, the data analysis must be refined, that is, the clustering of each of the 187 precipitation time series must be carried out. Thus, to overcome this difficulty in clustering each series analyzed into different homogeneous groups, only based on information available in the figure, cluster analysis was adopted in this study. Without applying an adequate statistical tool, such as cluster analysis, the classification of the precipitation trends into different groups may be highly subjective and inaccurate, leading to uncertain findings.
Given that limitation, the cluster analysis developed in this study addressed both the spatial and temporal variations in monthly precipitation in Paraíba state. In the spatial analysis, the 187 TRMM data series distributed in the study area were clustered in different ways to identify the regions that behaved similarly to each other, thereby explaining possible physical and climatological causes of the precipitation trends in Paraíba state. Conversely, in the temporal analysis, the monthly precipitation trend was assessed to study whether a specific month had a more similar behavior to the previous or to the following month, for example.
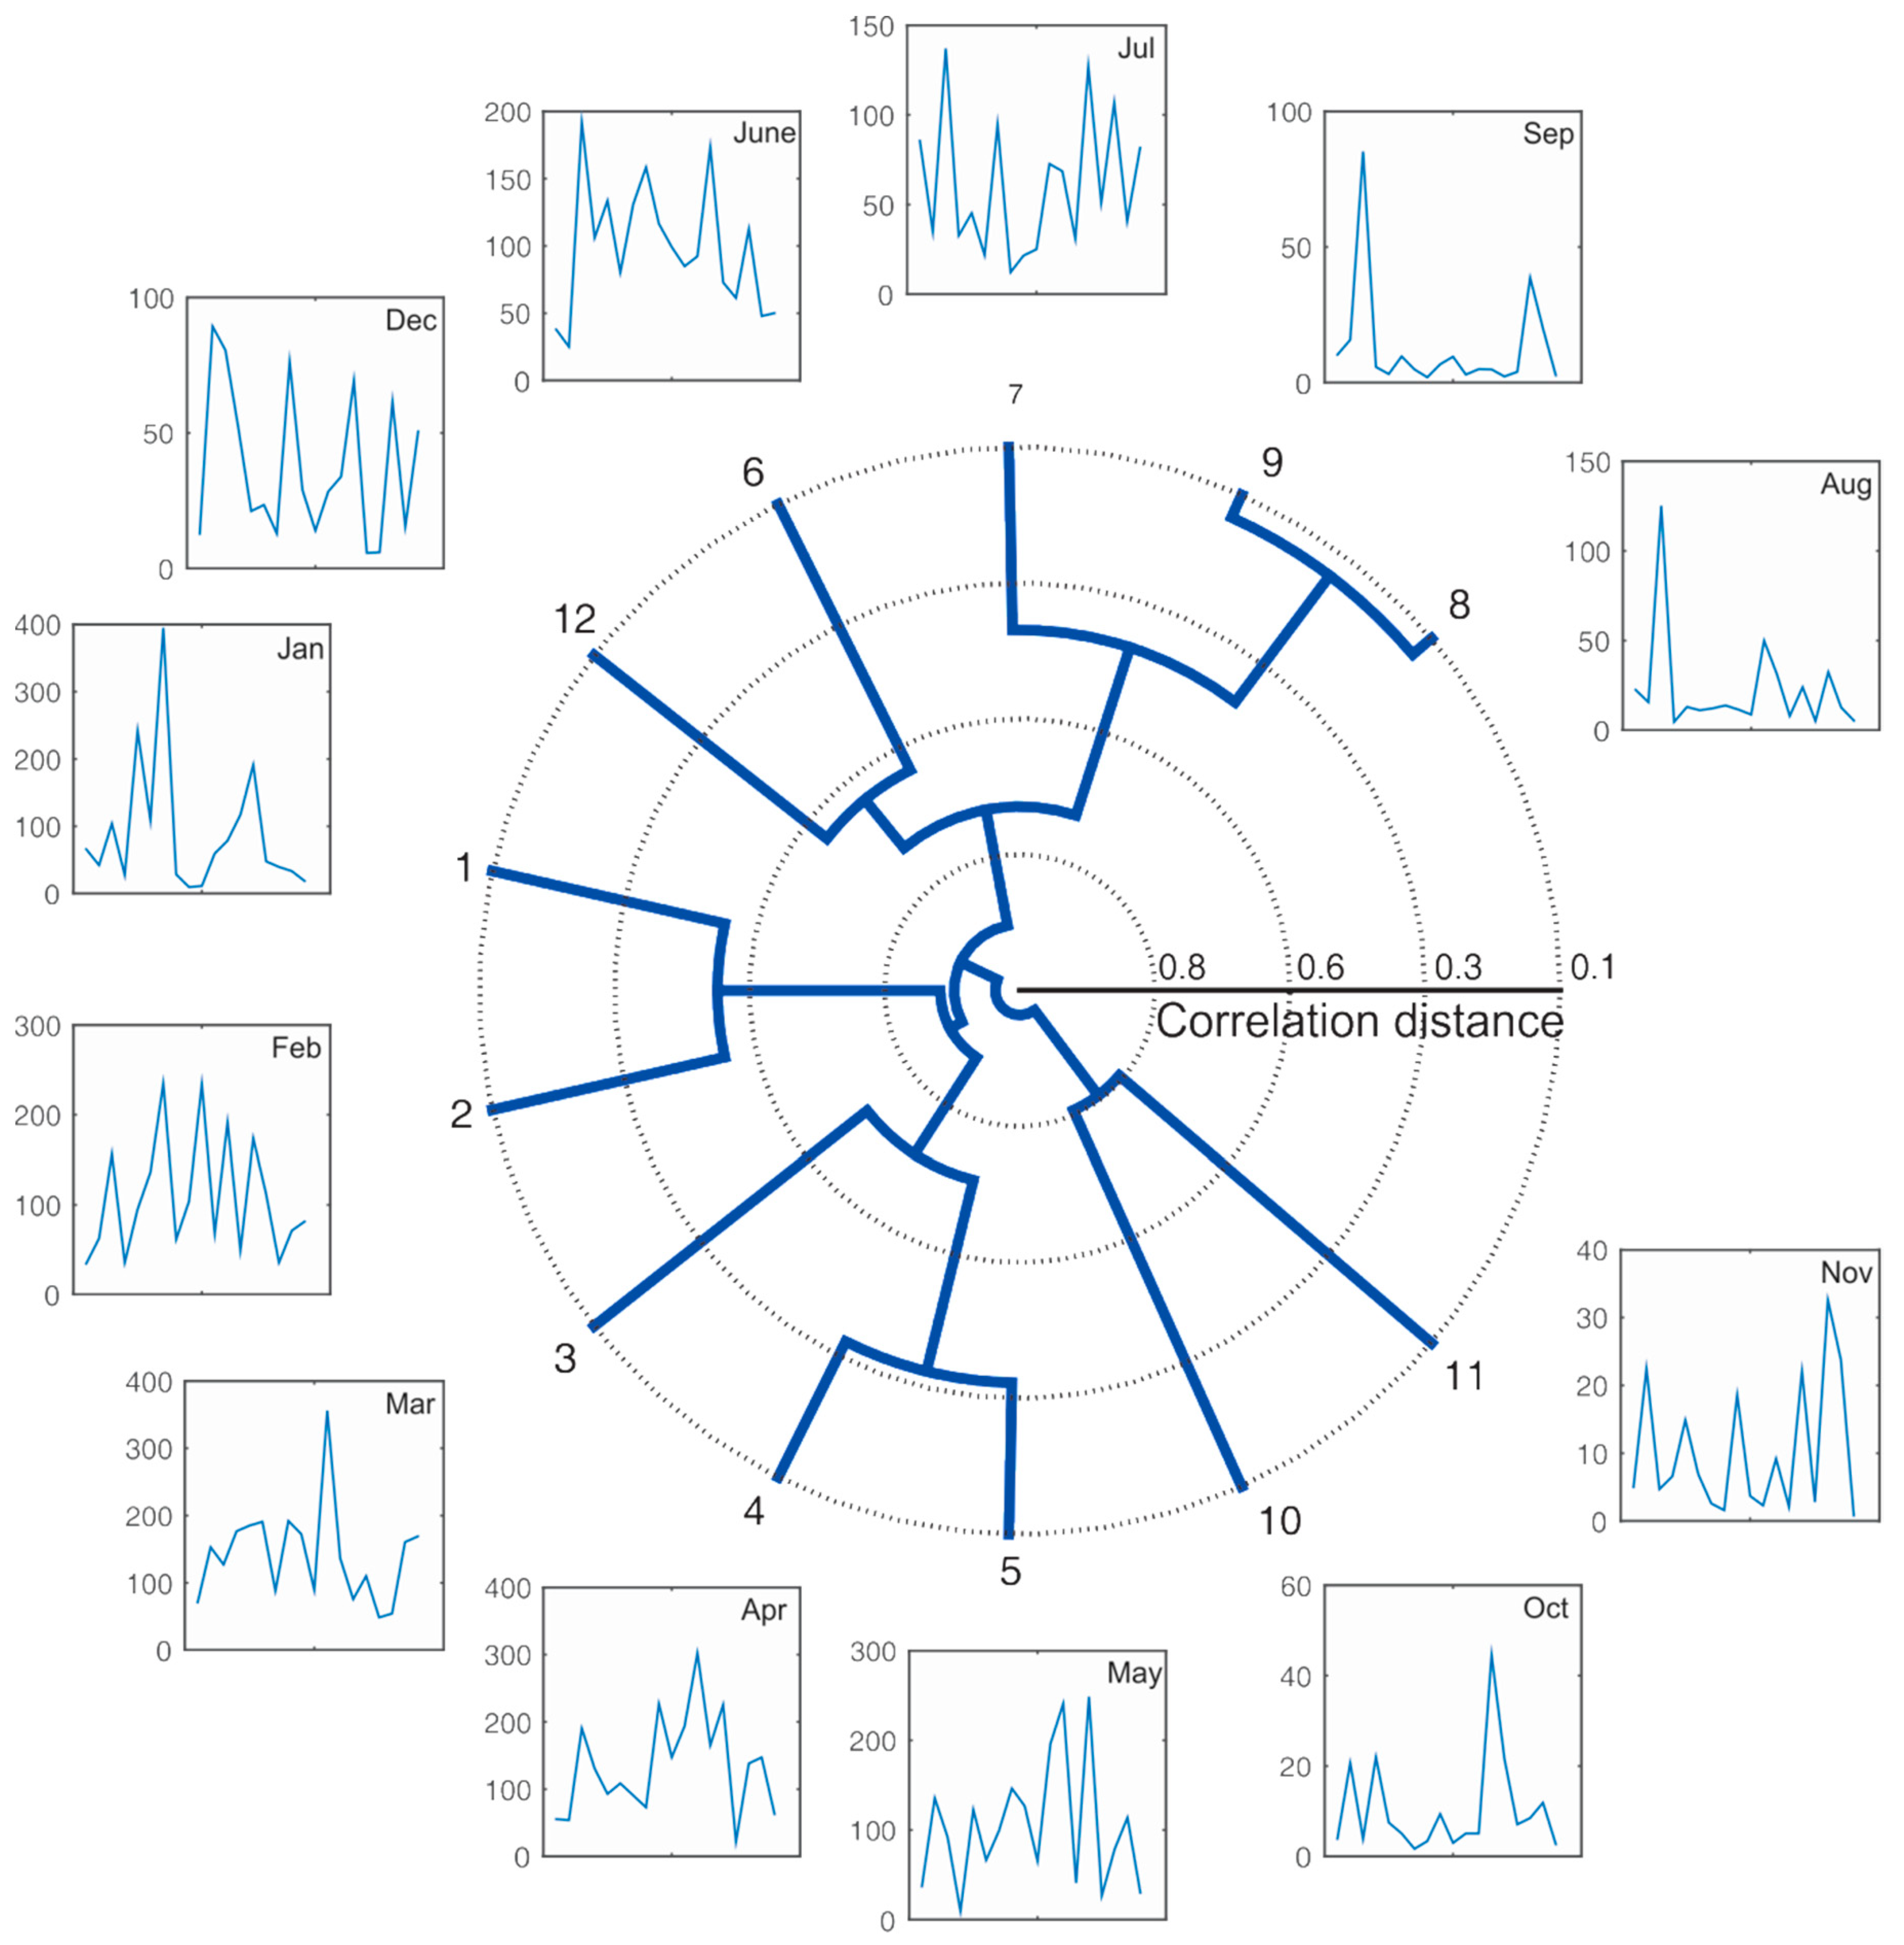
For the temporal cluster analysis, 12 series were organized (one for each month). Each series contained 18 values (one for each year of the series) comprising the mean monthly precipitation values over the 18 years of study throughout the study area, i.e., considering all 187 TRMM series.
Figure 4 shows the dendrogram resulting from the cluster analysis of the mean monthly precipitation from 1998 to 2015. Thus,
Figure 4 shows which months have similar hyetograph patterns. The monthly precipitation trend over the last 18 years is rather heterogeneous when analyzing the entire study area. However, when analyzing the results in more detail, the spatiotemporal precipitation trend on an annual scale indicates a decrease in precipitation in the last four years of the study, i.e., from 2012 to 2015, as previously reported by Santos et al. [
4], which evaluated the trends of eight SPI indexes over Paraíba state (1998–2015). Although the precipitation trends were not evaluated, the analyses based on the standardized precipitation index (SPI) time series, which is based only on precipitation data, complement the analysis of precipitation data over the 18 years analyzed.
The results in
Figure 4 show that the correlation distances between monthly series are considerably high because some series are completely different from each other, such as October and November precipitation time series, which differ considerably from the precipitation trend in other months. In general, considering a correlation distance of 0.50 between series, similar to Lyra et al. [
14] and to Teodoro et al. [
17], the results showed the existence of nine different clusters, highlighting a rather unusual trend between the study months in the last 18 years.
In more detail, the group formed by December and June can be considered to be the cluster that represents the two transition months; December is the transition to the rainy season, and June is the transition to the dry season. Although January, February, and March are rainy months for the region, they showed a similar precipitation trend when considering a correlation distance of 0.50, and January and February were the most similar months. April and May were highly similar to each other, as were July, August, and September, thus defining an intermediate precipitation season in Paraíba state.
Furthermore, in this context, it is worth noting that the clusters generated were based on the correlation dissimilarity metric, and had the Euclidean distance been used as the clustering metric, the findings would have certainly been different, possibly clustering the series from January, February, and March into a single cluster because the total precipitation of each of those months was higher than that of September, October, and November.
Another key issue is that the cluster analysis presented in
Figure 4 shows the mean precipitation trend of the entire study area, including the precipitation trend of all mesoregions and their specificities in a single series of mean monthly precipitation. Making a parallel with Omranian and Sharif [
27],
Figure 4 was developed based on the lowest possible spatial resolution; i.e., 187 TRMM grids were aggregated. Notwithstanding, the results obtained are practical. In this context, if the finest spatial resolution would be used (0.25° × 0.25°), 187 figures similar to
Figure 4 would be necessary to fully characterize the precipitation variability in the study area, which is impractical. In the case of Paraíba, the findings using one mean monthly precipitation time series can be considered satisfactory because they match the rainfall regime of the entire state, although the results from similar analyses in larger areas and with higher spatiotemporal variability in precipitation may be biased and therefore should be evaluated in more detail.
Figure 4 shows, for example, that the September hyetograph is more similar to the August hyetograph than the October hyetograph. However, this kind of similarity is not easily observed in
Figure 3. Thus, this cluster analysis (
Figure 4) is useful to identify this type of regional climate pattern. A simple example of how such information could help in drought (or rainy season) management is when the rainfall depths are low/high in August, similar rainfall depths may be expected in September.
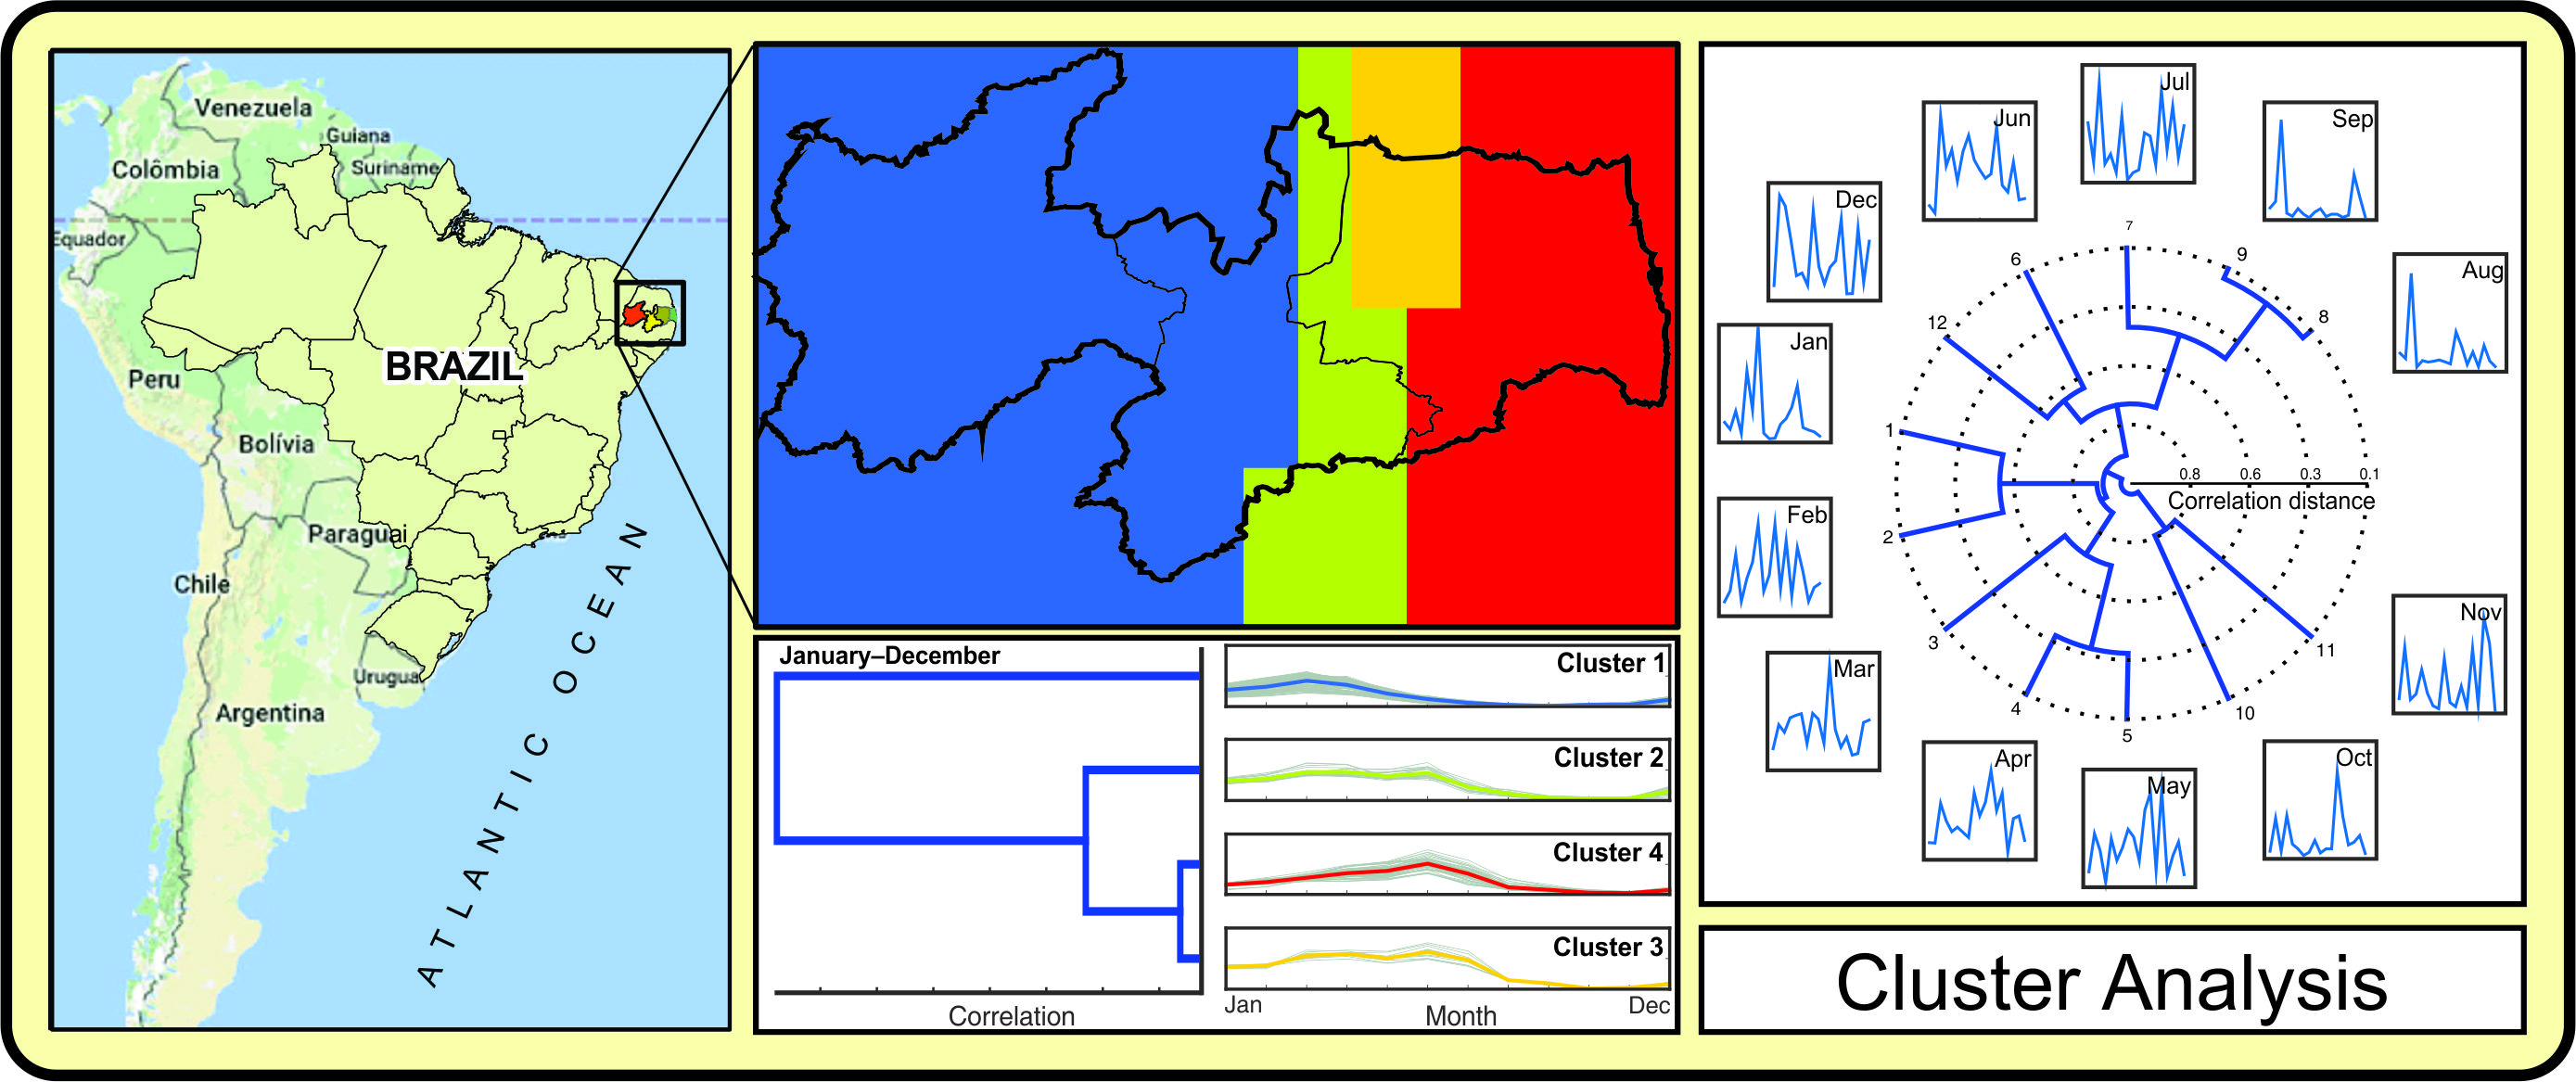
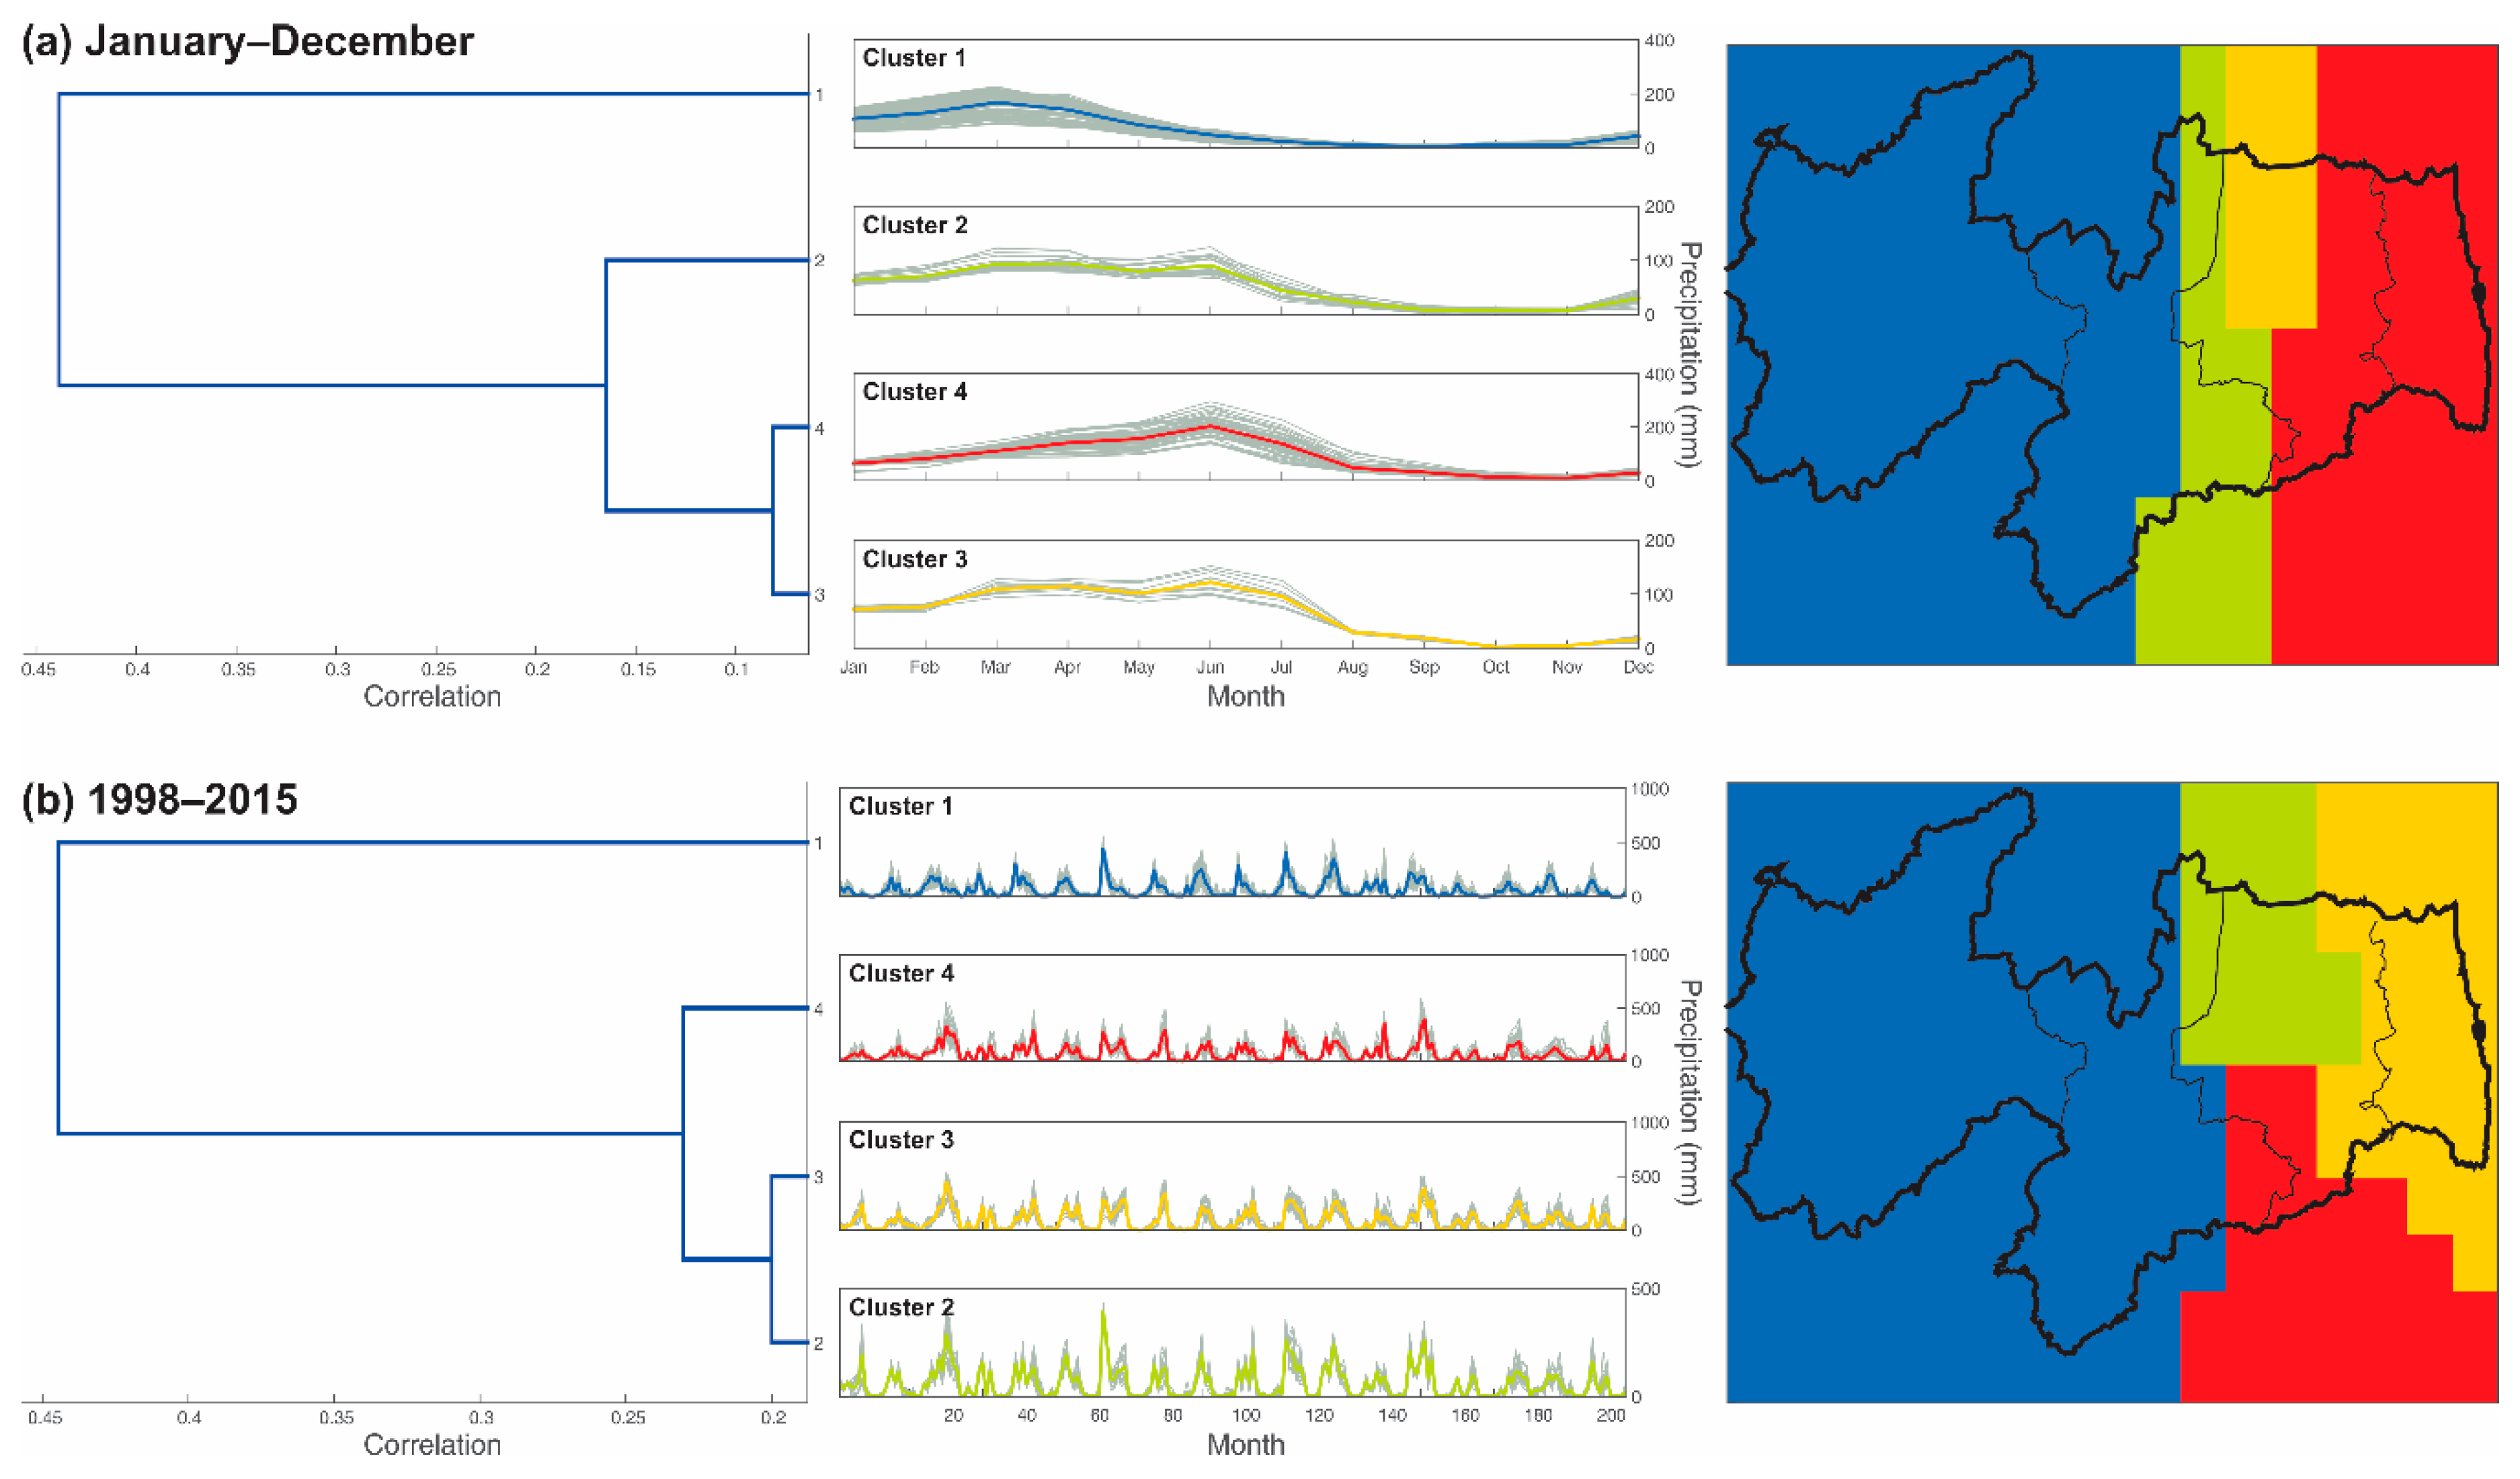
To perform spatial cluster analyses between the similarities of different precipitation time series, dendrograms and cluster spatializations in four clusters (because Paraíba has four mesoregions) were obtained based on (a) the mean monthly precipitation time series (hyetographs in
Figure 5a) and (b) total monthly precipitation time series between 1998 and 2015 (hyetographs in
Figure 5b). Thus, two different spatial clustering methods were used: one based on the clustering of the 187 total precipitation time series, each with 216 values (12 months × 18 years), and another based on the clustering of 187 mean monthly precipitation time series, each with 12 values (one for each month). Both types of analysis were used in this study to assess whether the clusters of precipitation time series significantly changed when considering both time series based on total monthly data and on mean monthly data throughout the study period.
For example, P131 (latitude = −7.75° and longitude = −35.75°) and P132 (latitude = −7.75° and longitude = −36.00°) belong to clusters 4 and 2, respectively, when the mean monthly precipitation time series are considered (
Figure 5a). However, when the total monthly time series are considered, these two grid points belong to the same cluster (cluster 4). This means that although the total monthly rainfall pattern has been statistically similar since 1998 (cluster 4 in
Figure 5b), the monthly averages have presented different patterns (cluster 2 and 4 in
Figure 5a); e.g., while the monthly rainfall depths are almost constant from January to June in P132 (cluster 2 in
Figure 5a), those rainfall depths slightly increase in P131 (cluster 4 in
Figure 5a).
The results show, in general, a rather similar trend between monthly precipitation time series because both the mean (
Figure 5a) and total (
Figure 5b) monthly precipitation data had a maximum correlation distance of 0.50 between time series. Conversely, despite that similarity, the clusters based on mean monthly rainfall (
Figure 5a) tend to be more similar to each other than the time series based on total monthly values (
Figure 5b). For a correlation distance of 0.20, for example, only two large groups are formed when using mean monthly precipitation time series (
Figure 5a), including one consisting of cluster 1, which basically encompasses the Sertão and Borborema mesoregions, and another group containing the other clusters, which encompass the Mata and Agreste Paraibano mesoregions. However, when using total monthly precipitation time series (
Figure 5b), for the same correlation distance of 0.20, four different clusters are formed: (a) most of Sertão and Borborema (cluster 1), (b) the northern section of Agreste (cluster 2), (c) the southern section (cluster 3), and (d) the entire region of Mata Paraibana (cluster 4).
Thus, although the Sertão and Borborema mesoregions tend to behave similarly throughout the study period, regardless of the precipitation values used (mean monthly or total monthly time series), the similarity of the mesoregions Agreste and Mata Paraibana varied according to the type of time series analyzed, i.e., continuous time series of total (series with 216 records) or mean (series with 12 records) monthly values. Recent studies [
37] show that performance of satellite products in capturing extreme/heavy rainfall events is not the same as regular events. However, this region is free from extreme/heavy rainfall events such as hurricanes.
The higher total rainfall values of the Mata Paraibana and Agreste mesoregions in comparison with those of the Sertão and Borborema mesoregions may possibly explain this result. Thus, those regions must have experienced some extreme precipitation events during the study period, considerably differing from the mean monthly values assessed. Hence, because they have higher monthly variations in the TRMM time series, the Mata and Agreste mesoregions differ more when using the total monthly time series (
Figure 5b) than when using the mean monthly time series (
Figure 5a) because all extreme events that occurred throughout the study period are captured in the total monthly time series, whereas all those unusual events are offset by a mean value for the study period in the time series of mean monthly values, thereby mitigating differences between clusters.
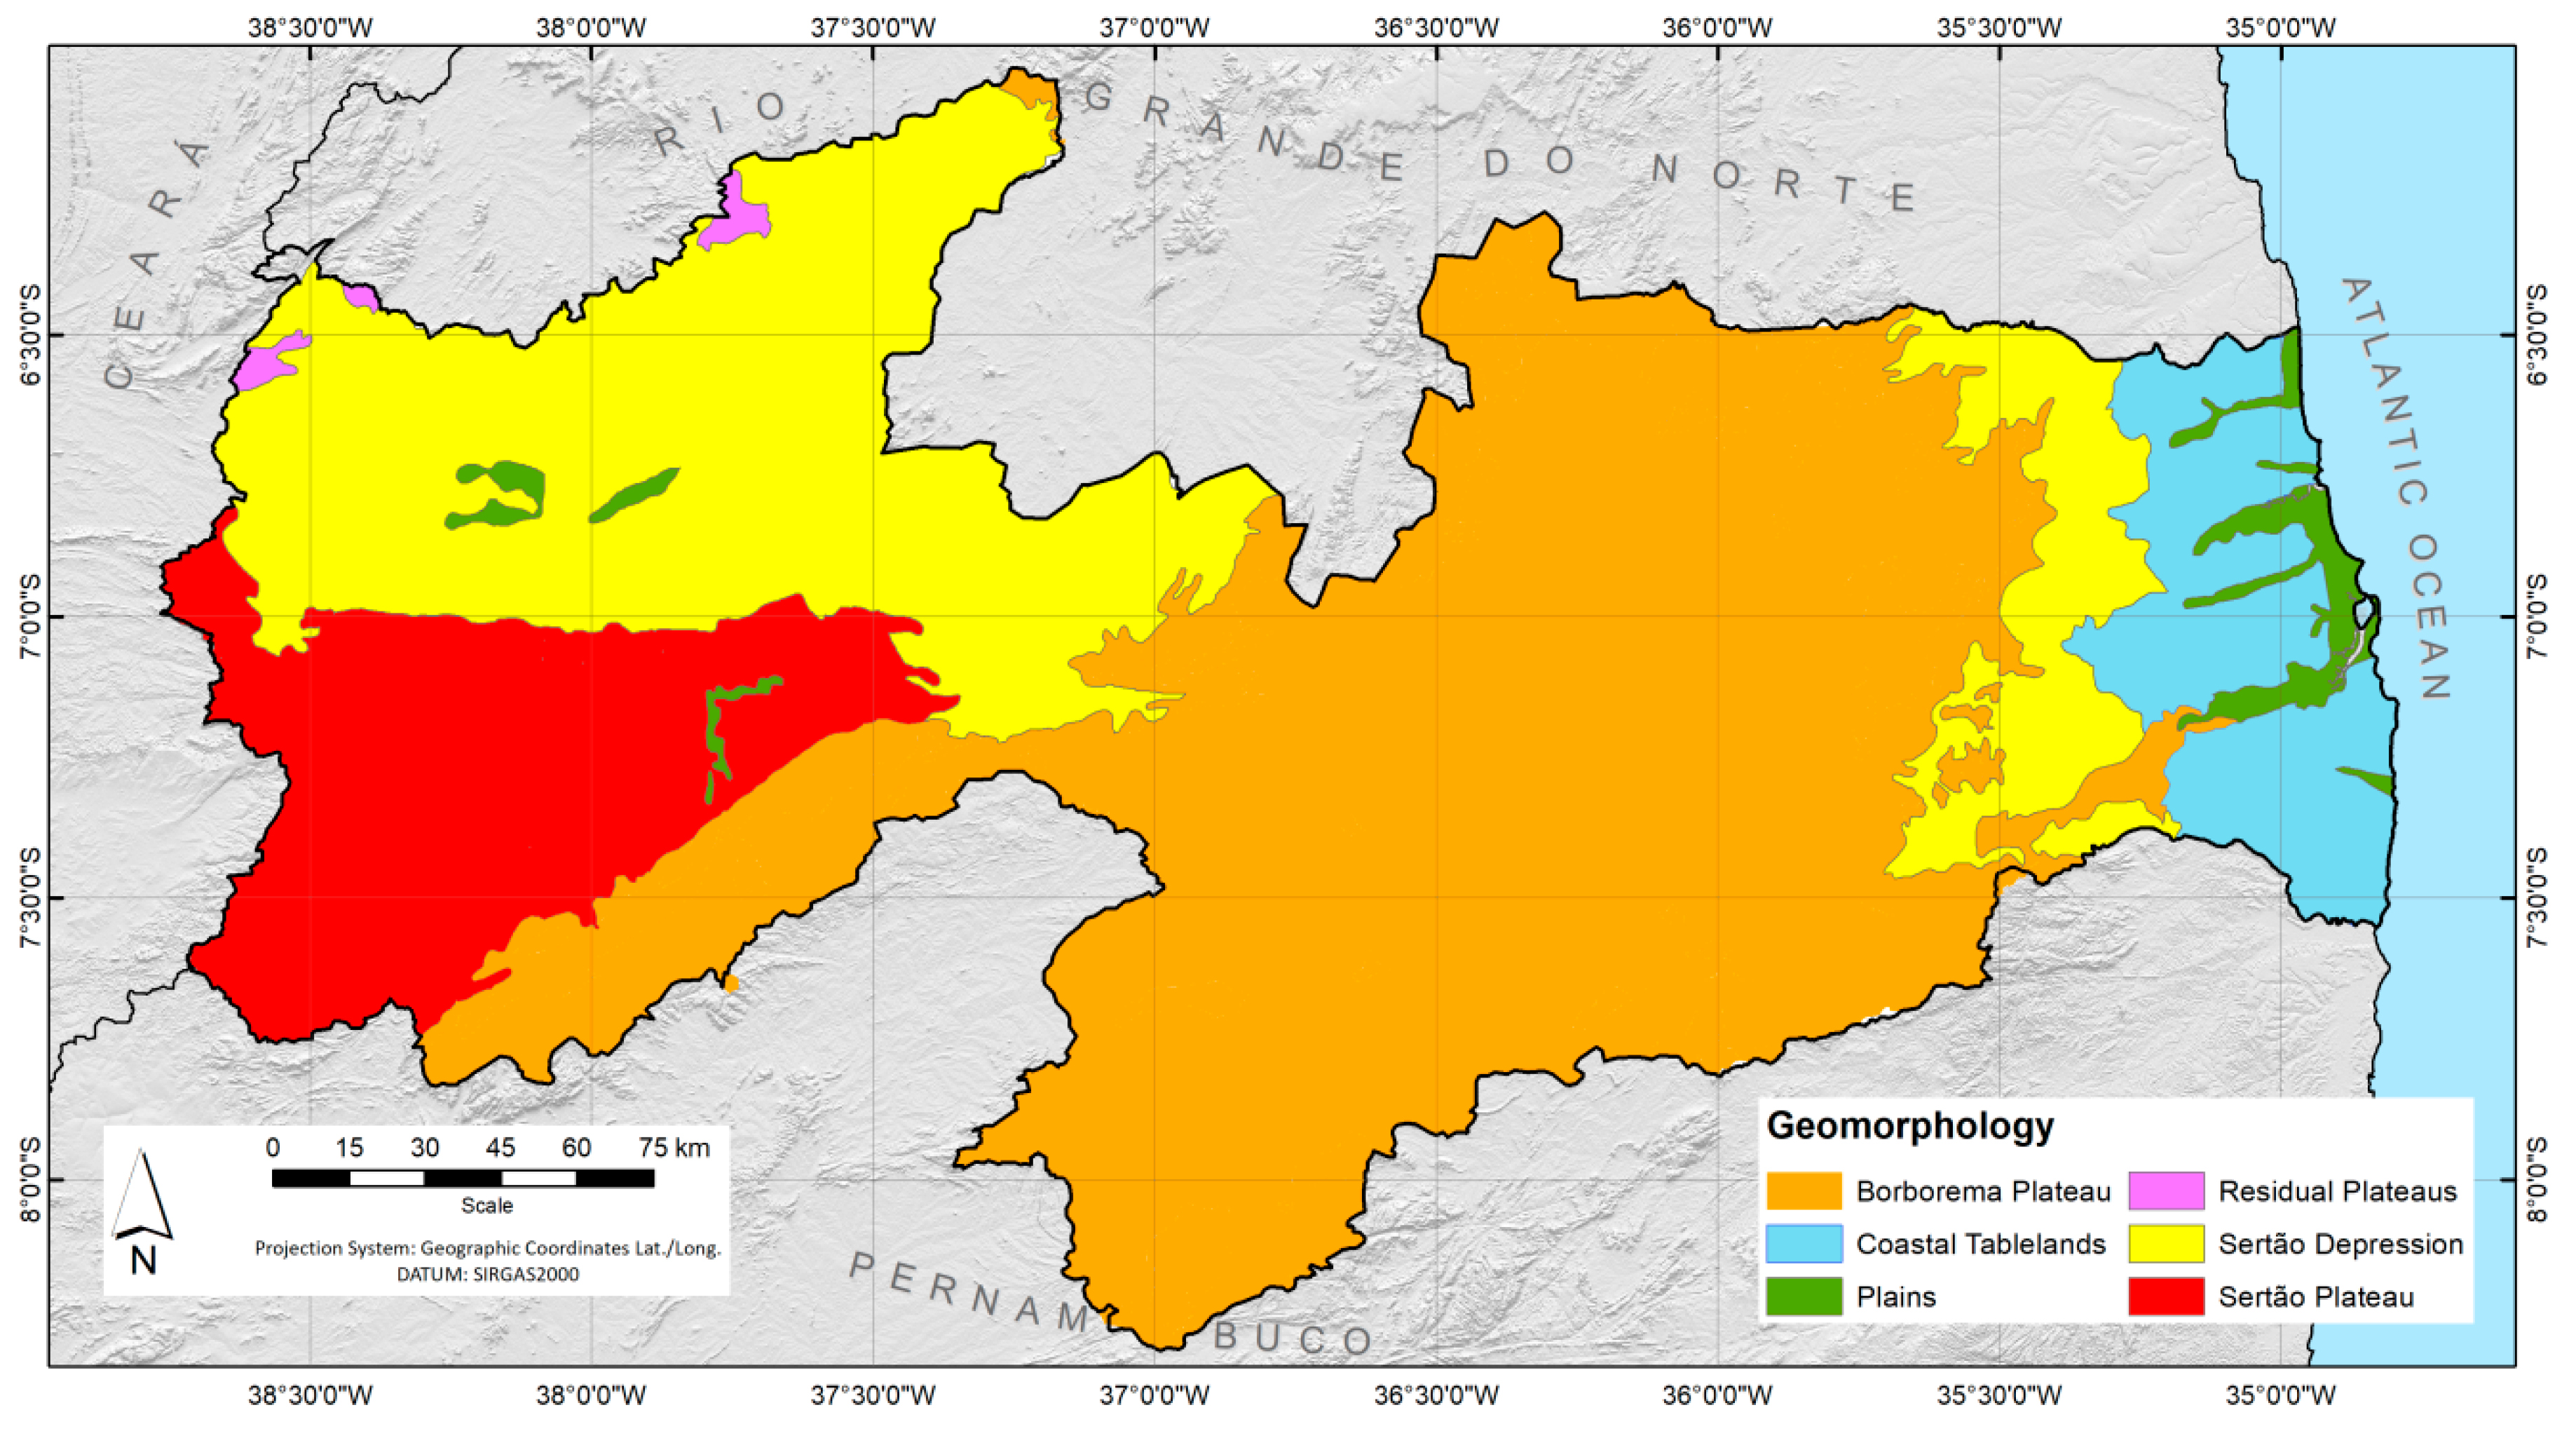
Furthermore, the trend observed on the coast may be related to the proximity between the mainland and the ocean, which entails high humidity in this region closest to the shore, considerably affecting the precipitation regime found there. In addition, the Borborema Plateau may be considered to be a topographic factor, that is, a natural barrier responsible for the behavior of the circulation of air masses in the region, hindering the arrival of moisture from the ocean to the semiarid region of Paraíba, directly affecting the precipitation in Sertão, Borborema, Mata Paraibana, and Agreste. These results corroborate the findings of Lyra et al. [
14], who identified, when delimiting homogeneous zones of Alagoas state, the formation of clusters far from the coast and affected by the topographic factor.
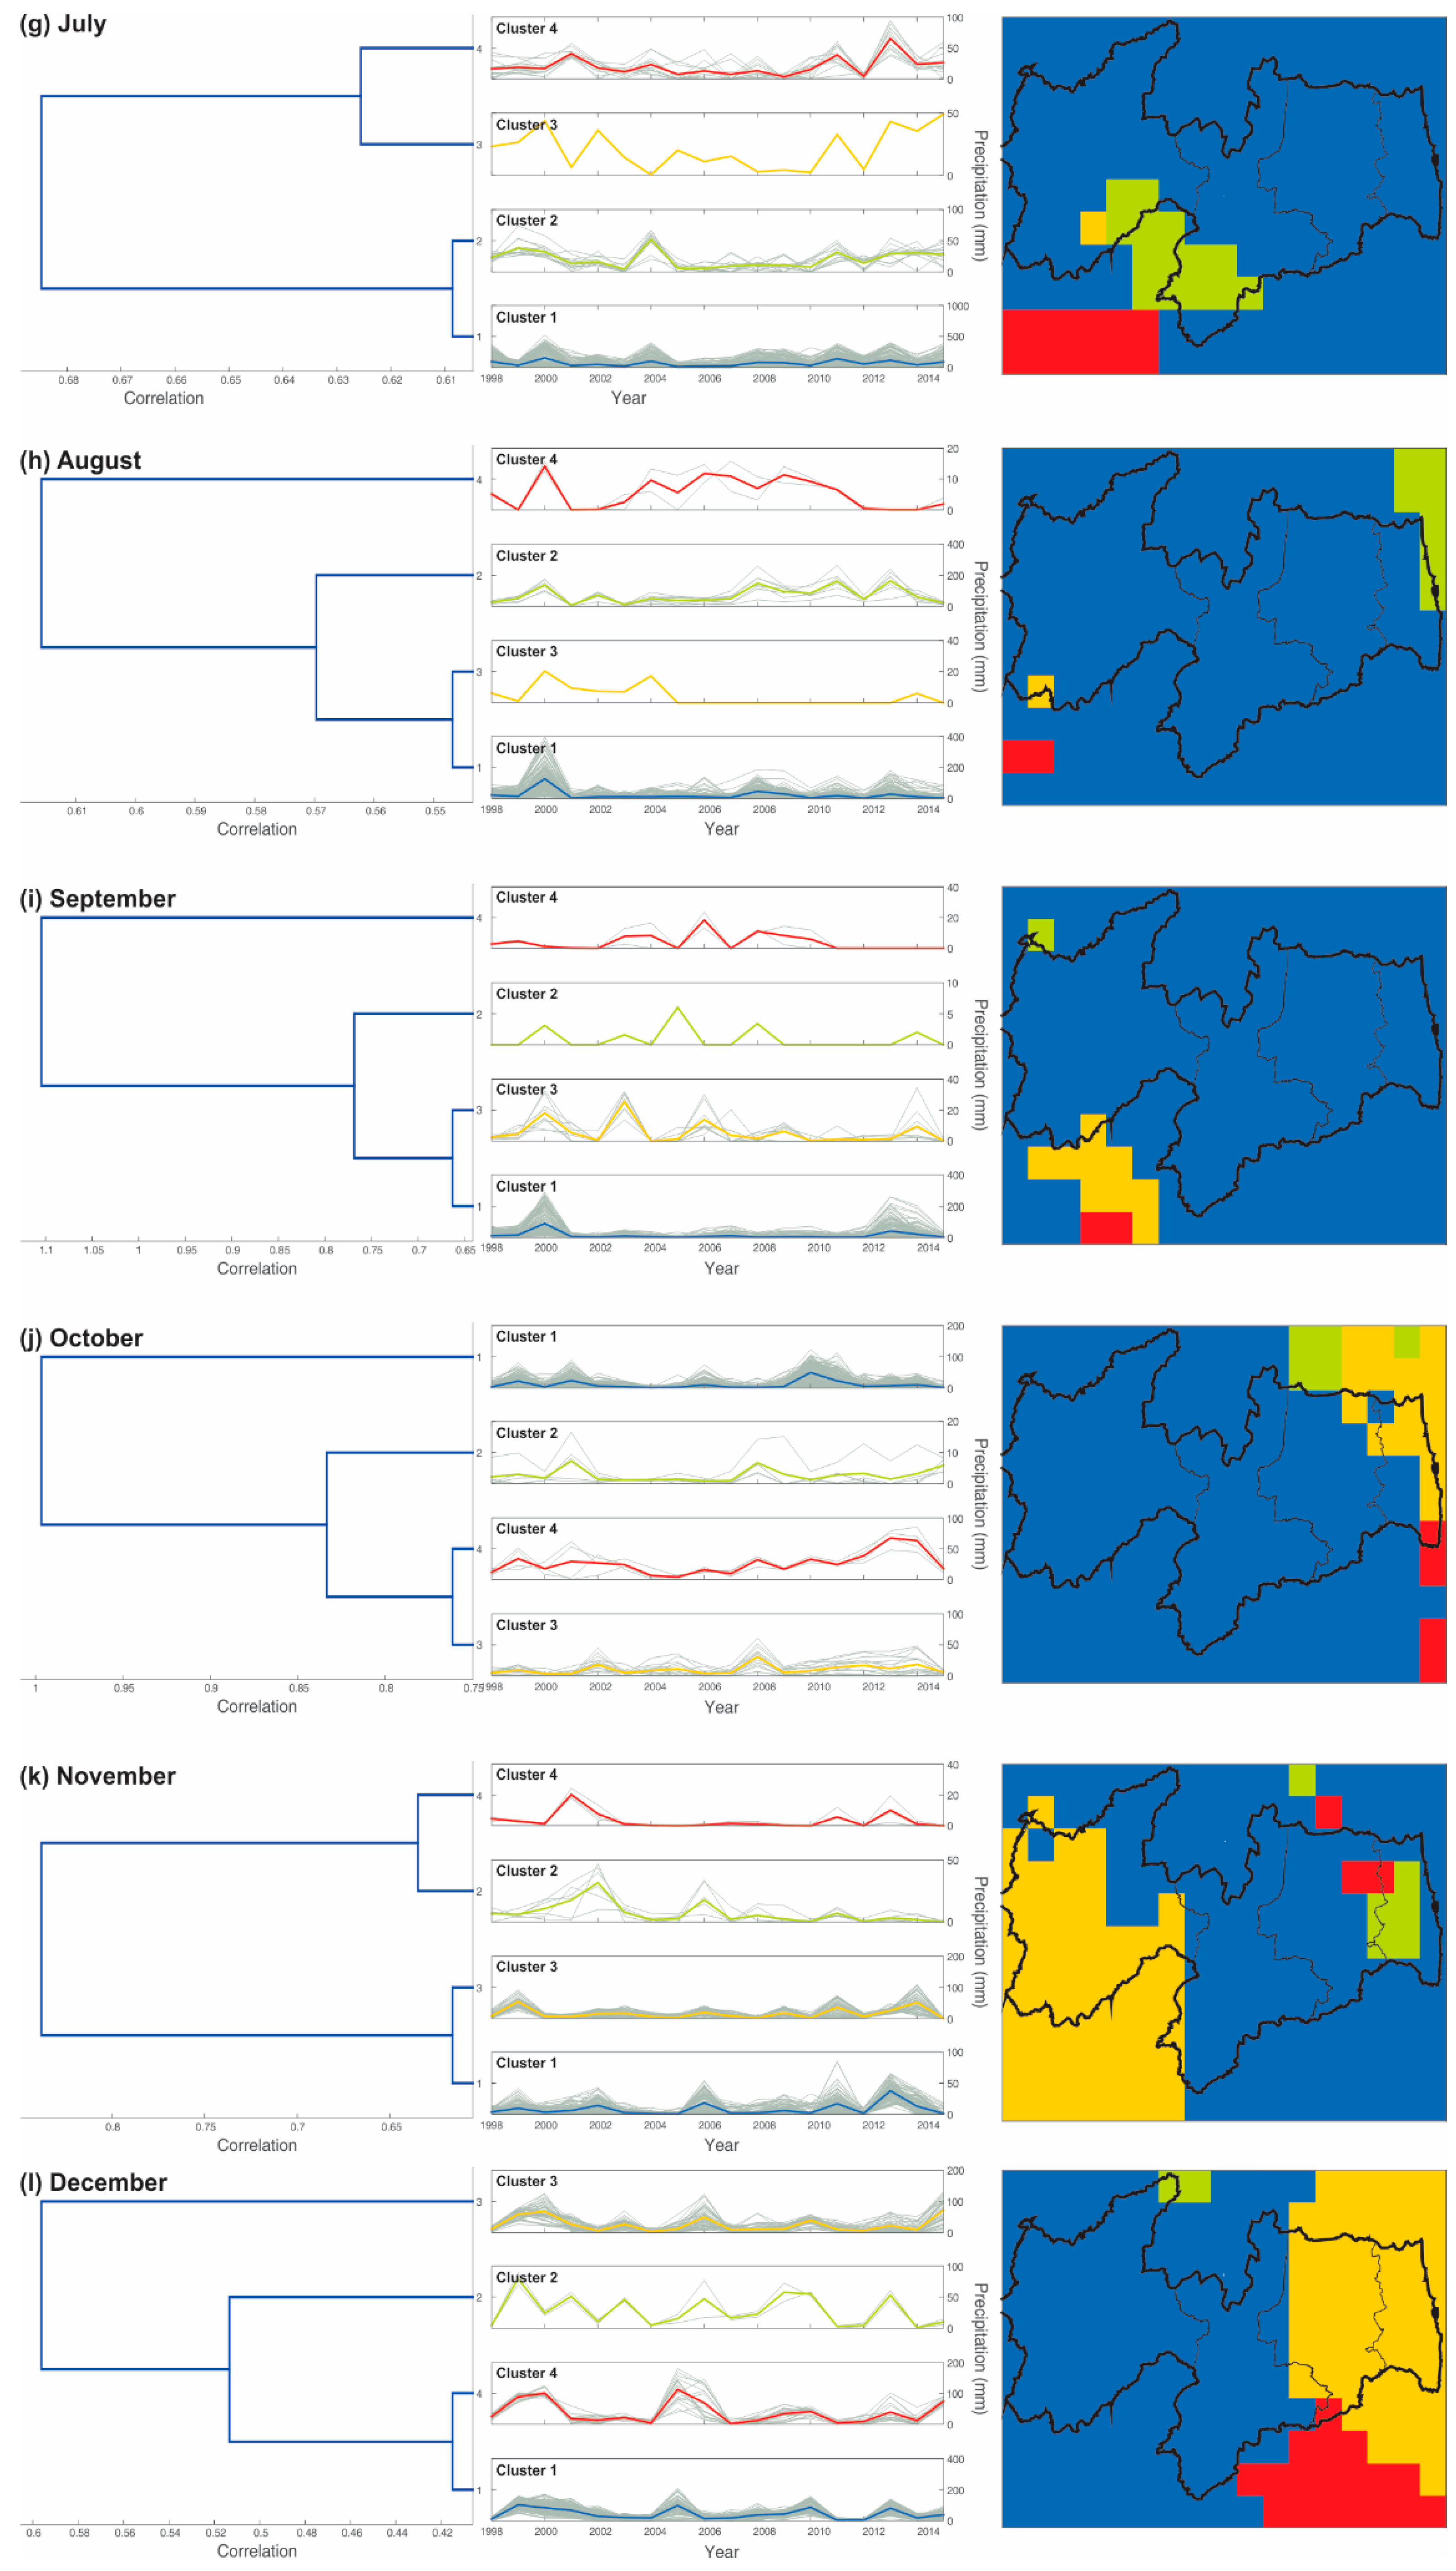
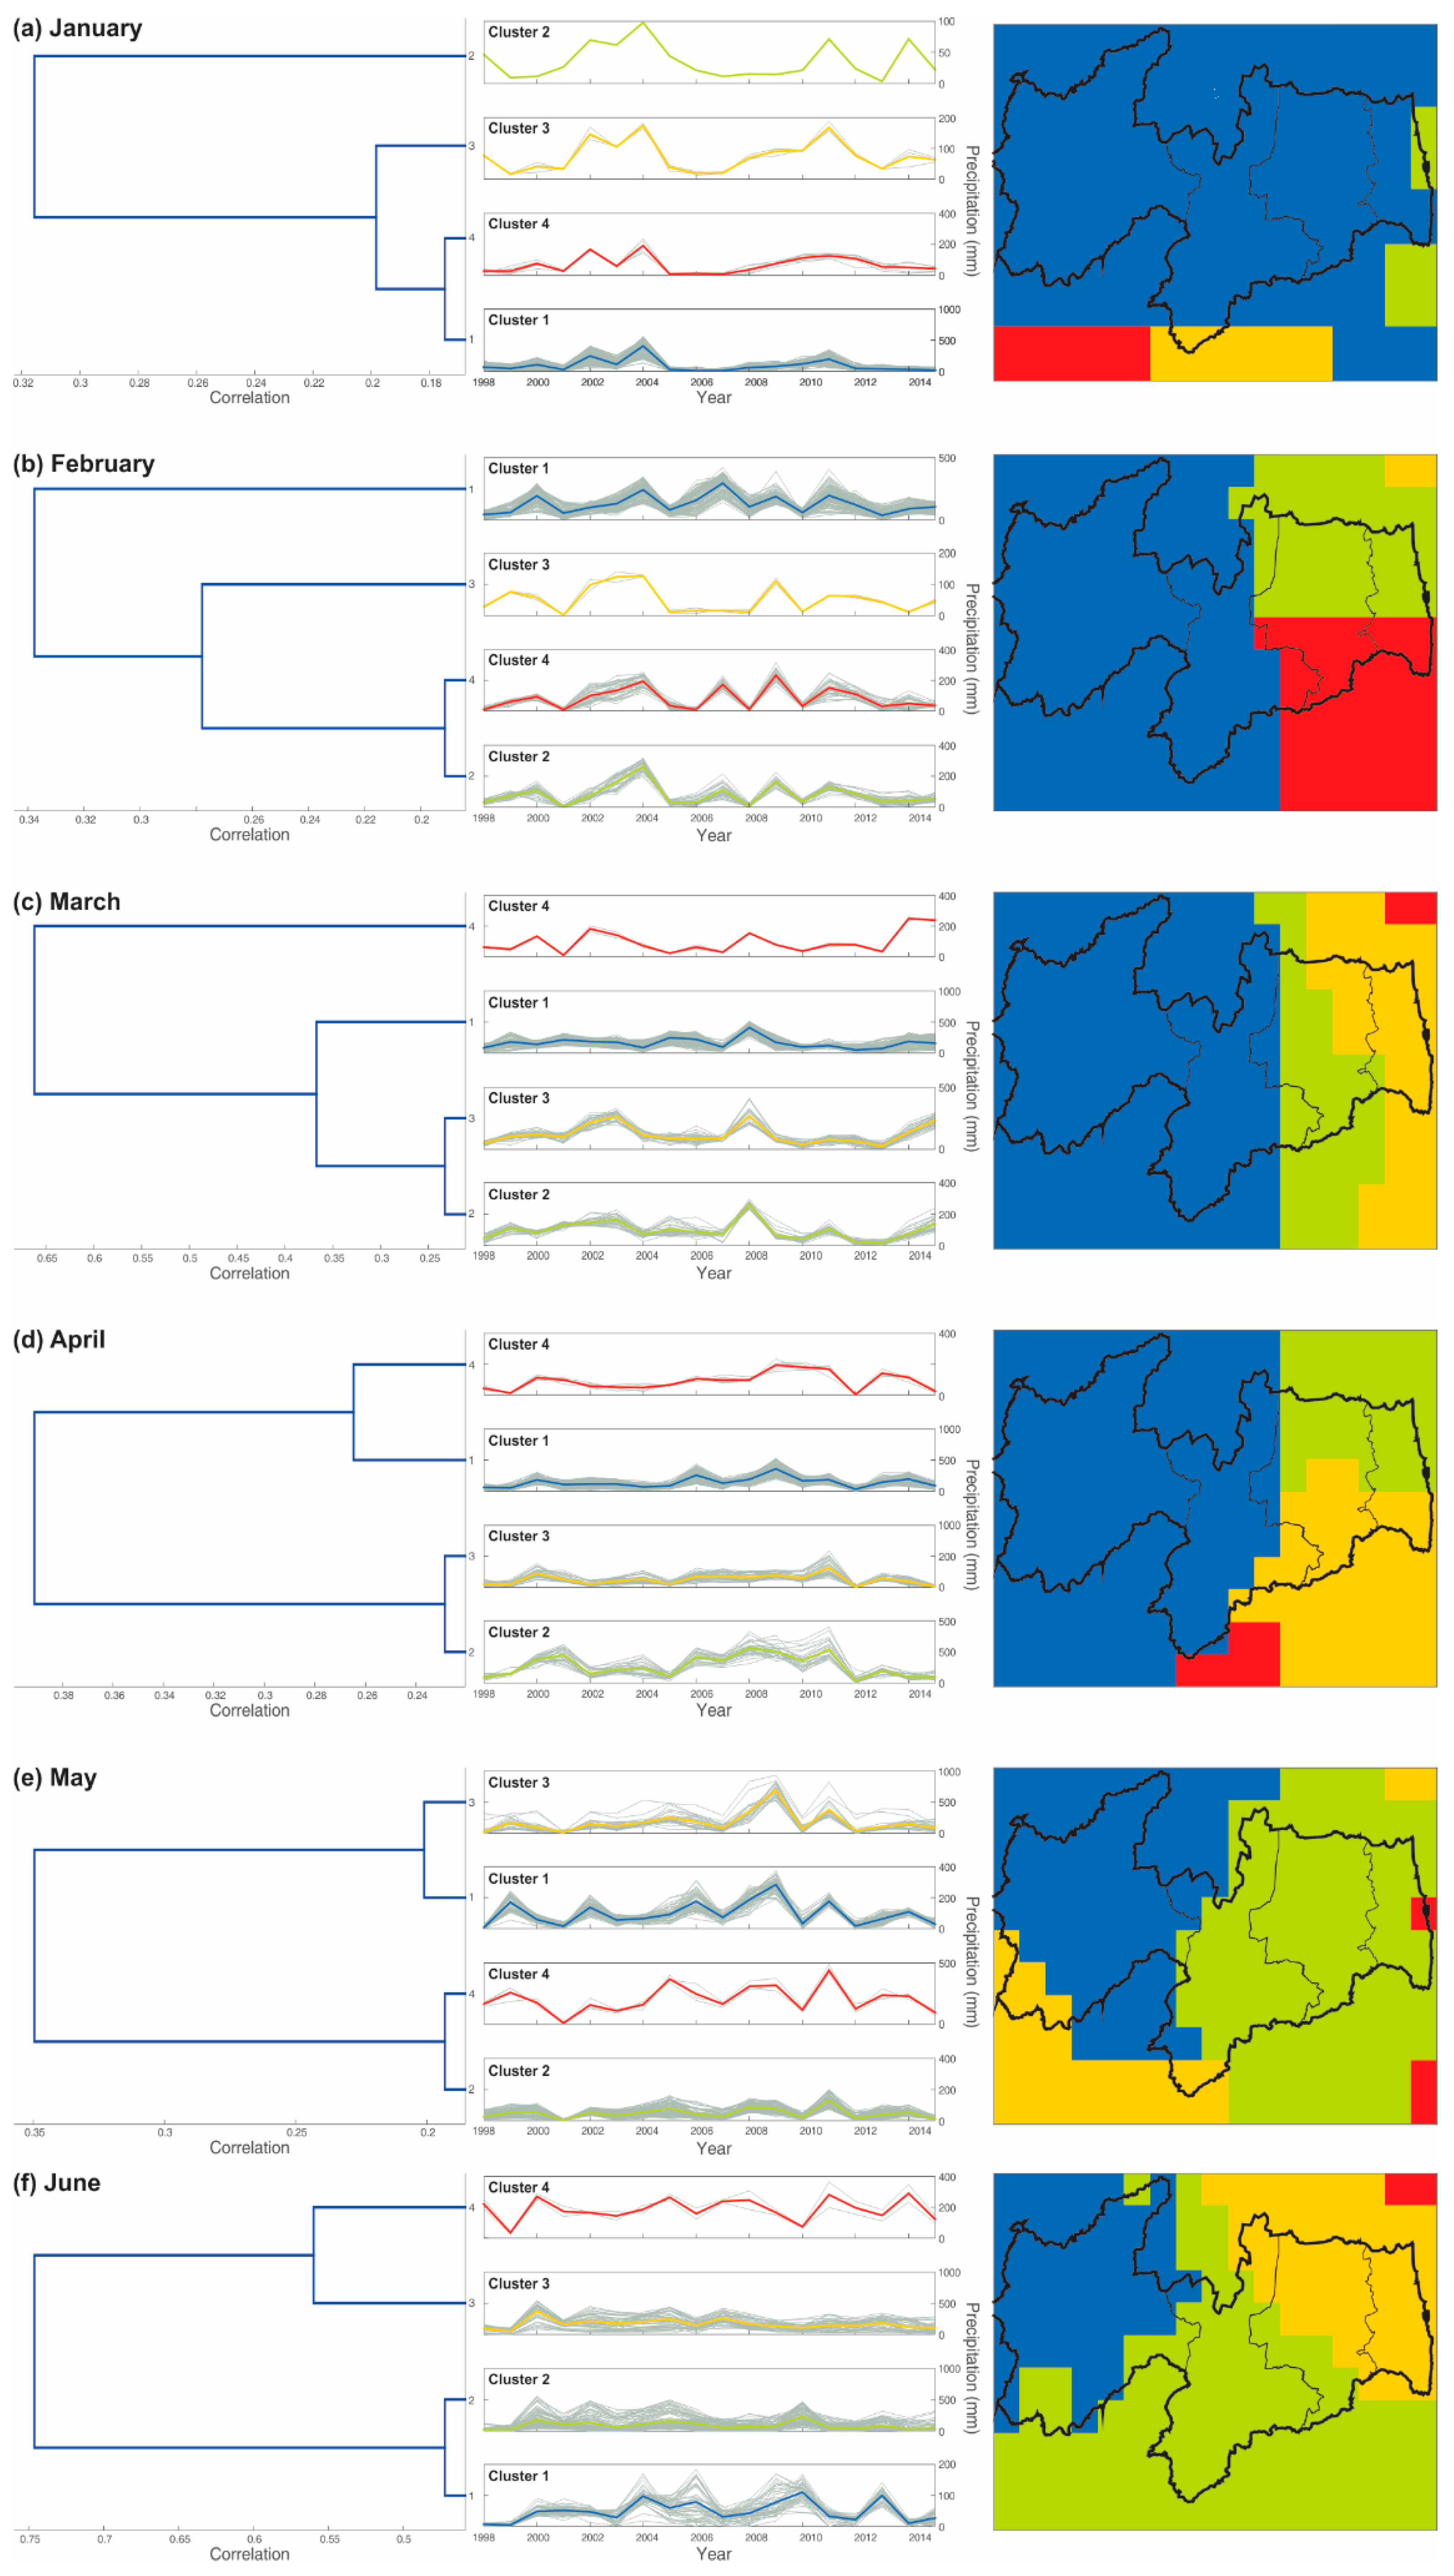
Figure 6 shows the results from the cluster analysis of each month, based on the total monthly time series of each year and for each grid, in contrast to previous studies, which exclusively analyzed results similar to those shown in
Figure 5. Thus, the regions with the most similar trends in each month can be identified, thereby identifying the climate systems active in the region. The specific analysis of the results for each month shows that the correlation distances between precipitation time series obtained in January in Paraíba state are small and that most of the study area is included in cluster 1, which basically covers all the mesoregions of the state. Considering that the dissimilarity metric used in this study was the correlation distance between the trend of the time series, this clustering highlights that the precipitation in January was proportional throughout the region over the 18 years analyzed, i.e., when it rained in some region of Mata Paraibana or Borborema, for example, it also rained in the Sertão and Agreste mesoregions, albeit in different volumes. Therefore, the correlation metric was more adequate because the objective is to assess whether the time series behave similarly to each other in general and not in absolute values, which would be the case if Euclidean distance had been used as a dissimilarity metric. The results also indicate increased correlation distances between the precipitation time series analyzed and the improved spatial division of Paraíba state. In general, three large clusters exist in Paraíba state: a large cluster over the regions of Sertão and Agreste (cluster 1), another covering the northern coastal region (cluster 2), and a third cluster covering the southern section of the Mata Paraibana and Borborema regions (cluster 4). The latter two are more similar to each other, as indicated by the values obtained. In March, the correlation distances between the time series increased when compared with the values obtained for January and February, albeit at a correlation distance between time series of 0.30 for the Sertão and Borborema mesoregions (cluster 1), the precipitation of which differs from that of the Mata Paraibana (cluster 3) and Agreste Paraibano (cluster 2) mesoregions.
In addition, in contrast to the results for January and February, at a correlation distance of 0.20, the precipitation in the Mata and Agreste regions is classified into different groups, indicating that its trend is no longer as similar as that of previous months. The spatiotemporal precipitation trend found in April is quite similar to that found in February, and Paraíba state is basically divided into three large clusters. Cluster 1 covers the entire Sertão and Borborema regions, whereas clusters 2 and 3 cover the north and south sections of the Mata Paraibana and Agreste mesoregions, respectively.
The precipitation trend in Paraíba from January to mid-April is noticeably similar to that observed by Lyra et al. [
14] when delimiting homogeneous clusters in the eastern section of Alagoas state. Conversely, in the western section, the clusters showed discordant trends. According to Moscati and Gan [
7] and to Molion and Bernardo [
6], rainfall concentration in this period of the year in northeastern Brazil is related to maximum displacements south of the intertropical convergence zone (ITCZ). Furthermore, upper tropospheric cyclonic vortices (UTCVs) may affect precipitation, and these climate systems are more frequently active in January and February in northeastern Brazil [
38].
In May, the monthly precipitation trend in Paraíba state significantly differed from the results from January to April. Although the correlation distances between precipitation time series maintained the same order of magnitude, when adopting a correlation distance of 0.20, for example, two large clusters are formed in the study area, namely cluster 1, which basically covers the entire regions of Sertão da Paraibano, and cluster 2, which basically covers the Borborema, Agreste, and Mata Paraibana regions. This is one of the few situations in which the Borborema and Sertão da Paraibano regions are not included in the same cluster, which indicates the rather unusual behavior of May compared with the other months of the year because that is the last month of the rainy season (autumn).
This peculiarity of the autumn season (March, April, and May) may be associated with the presence of instability lines (ILs), which propagate inland accompanying the seasonal movement of the ITCZ, considering that the frequency of ILs is higher in May in northeastern Brazil. The results show a relationship between rainfall and regions with clusters located in western Paraíba. Such a phenomenon was also observed in homogeneous groups classified by Lyra et al. [
14] in the eastern section of Alagoas state, the precipitation trend of which is more similar to that observed in previous months, especially in the semiarid section.
June marks the beginning of a period during which the correlation distances considerably increase, and that period lasts until mid-November, that is, the correlation distances between time series are significantly longer than those found in the analysis of the first semester. Accordingly, at a correlation distance of 0.50, two large groups are formed in the study area, one consisting of cluster 3, covering the Mata Paraibana region and the northern section of Agreste, and another large group formed by clusters 1 and 2, which basically cover the rest of the state. Notwithstanding, the precipitation trend in June is also rather unusual, with considerable differences between Sertão da Paraibano (cluster 1), Borborema and the southern section of Agreste (cluster 2) on one hand, and Mata Paraibana and northern Agreste (cluster 3) on the other hand.
Importantly, from June to August, the rainfall on the coast of Paraíba matches the undulating variations in winds and pressure from the South Atlantic, which generate a displacement from east to west from the coast of Africa and reach the Zona da Mata of northeastern Brazil, resulting in the easterly wave disturbances (EWDs) [
6,
38]. At the beginning of the second semester, once again, the correlation distances between precipitation time series are very long, with a differentiation of the trend of different clusters already at a correlation distance of 0.60. However, a more detailed analysis shows that most of the time series spaced over the study area form cluster 1, except the southern sections of Sertão (cluster 3) and Borborema (cluster 2).
The precipitation trend in August, regarding the clustering of homogeneous regions, is similar to that in July because, although the precipitation time series show long correlation distances from each other, most of Paraíba state shows a precipitation trend similar to that of cluster 1. Conversely, in contrast to the configuration of July, at a correlation distance of 0.55, the northeastern coastal region of Paraíba (cluster 2) tends to behave differently from the rest of the state.
In September, the entire Paraíba state is clustered in a single group according to the behavior of precipitation time series. Cluster 1 is the group that characterizes the homogeneous precipitation of the entire Paraíba state, indicating similarity in precipitation trends. In this case, the correlation distances obtained in this month are long. Therefore, at shorter correlation distances, more clusters will likely form and spread throughout Paraíba state. However, because the divisions were based on four clusters in the present study, corresponding to the number of mesoregions of the state, a single cluster basically characterizes the precipitation in September.
Similar to September, October shows some of the longest correlation distances between precipitation time series found in Paraíba state. In both months, the precipitation trends in specific areas tend to be completely different, as is the case for cluster 1 and the group formed by clusters 2, 3, and 4 in October, for example. In addition, similarly to August, cluster 1 tends to basically cover all mesoregions of Paraíba, and the precipitation trend also unusually differs in the northeastern coastal section of Paraíba (cluster 3).
In November, the precipitation trend is quite unusual, with the formation of clusters that spread across all mesoregions of Paraíba. In general, cluster 1 covers most of Borborema and Agreste of Paraíba, clusters 2 and 4 cover most of the Mata Paraibana region, and, lastly, cluster 3 mostly covers the Sertão Paraibano. November, therefore, shows a more diverse precipitation trend than other months because the precipitation in Sertão behaves differently from that in Borborema, similar to May and June, and Borborema in turn is more directly related to the Agreste region.
The analysis of the spring months (September, October, and November) shows a decrease in rainfall, especially in October, which may be related to the movement of the ITCZ, as explained by Moscati and Gan [
7] and by Molion and Bernardo [
6]. Those authors observed that when moving north, the formation of rain clouds tends to decrease, causing drought in the semiarid region. Another key issue is the modulation of the behavior of atmospheric systems and of the ITCZ by sea surface temperature (SST) anomalies through the El Niño Southern Oscillation (ENSO) phenomenon [
6,
39,
40].
Considering the effect of the ENSO phenomenon on the precipitation in Paraíba, Menezes et al. [
40] state that the conditions of SST anomalies are more strongly affected by the Tropical Atlantic in the eastern regions of the state, whereas SST anomalies are more related to the Equatorial Pacific in central and western Paraíba. Lastly, in December, the precipitation trend tends to strongly differ between the Sertão and Borborema regions (cluster 1) on one hand and the Agreste and Mata Paraibana mesoregions (cluster 3) on the other hand. Overall, the results also show that these differences in precipitation trend are very high because, for example, at the correlation distance of 0.60, the region defined by cluster 3 tends to show a behavior different from all other regions of the study area.

 ,
, 
