1. Introduction
Genoa is a historic city and seaport of northern Italy with almost 600,000 inhabitants, capital of the Liguria region (
Figure 1). The urban area has a peculiar topography characterized by a thin coastal strip narrowly enclosed by the mountains. The coast is found only at short distance from Apennine peaks of over 1000 m. Since the Middle Ages, the city and its harbor have progressively grown, reaching their greatest extent in the 1950s. Today it has an area of 8.5 km
2 and it includes seven small catchments with surfaces ranging from 0.5 to 2.4 km
2 [
1].
Genoa has a Mediterranean climate, with dry and hot summers, and relatively mild winters. Rainfall is mainly concentrated in spring and autumn [
2]. The mean annual temperature is 15.8 °C, and the mean annual rainfall is 1268 mm with 101 rainy days (>1 mm) [
3].
Unfortunately, the frequency of flash floods and their severe effects on the metropolitan area, have made Genoa an emblematic case study for flooding and their related damages often caused by uncontrolled urbanization effects [
4]. Recurring flood events have been attested as long ago as the Byzantine era [
5]. Human interventions have almost completely reshaped and modified the original morphology. Watercourses are often covered or limited within bank walls and have lost their natural configuration. Particularly, the hydraulic setting of the Bisagno river and his tributary Fereggiano (
Figure 1), appears completely inadequate for flood events, especially in the light of the modified rainfall regime due to recent climate change. In fact, there is a secular trend of increasing rainfall intensity and average temperature in the Genoa region linked to both centennial climate oscillation and to massive land use and modifications of the main and other minor hydrographical networks [
2,
4,
6]. According to historical data, the Bisagno flooded every 16 years in the last two centuries and floods in the Genoa metropolitan area every 7–8 years [
7]. This river originates at 675 m a.s.l., and has a catchment extending over an area of 95 km
2. It crosses the Genoa city center after 25 km, entering a covered section for the last 1.4 km before flowing into the Ligurian sea. The width of the riverbed in the final stretch was much larger in the past [
7]. His left-bank tributary, the Fereggiano river, has a 3 km
2 catchment and his last urban stretch flows covered until entering into the Bisagno riverbed.
In November 2011, a devastating flood hard-hit especially the areas arranged along the Fereggiano river. Unfortunately, this event led to the loss of some human lives. To quickly put these areas in hydraulic safety, the municipality and the Genoa competent authorities found the solution in the construction of a drainage tunnel, extending a 909 m long track already partially built in the ‘90s but never completed (
Figure 1).
The drainage tunnel, 3717 m long, allows flood waters of three different rivers (Fereggiano, Rovare and Noce) to flow directly into the sea, decreasing the inflow to the Bisagno river. The new construction section (2808 m) was built in 2017 using the traditional excavation method (blasting). The tunnel has a polycentric section with an internal diameter of 5.20 m and follows a north-south route under the city [
8].
As is well known, drilling tunnels may induce surface settlements of a few centimeters because of groundwater drainage and associated pore reduction. They may seem of little importance if compared to those associated with oil, gas or groundwater extraction but they are large enough to represent a potential treat, especially below densely built-up urban areas [
9,
10,
11,
12,
13]. Examples are reported in the literature in the cases of the construction of an investigation audit 1.5 km away from the Zeuzier arch dam [
14] and the Gotthard highway tunnel [
15,
16]. Subsidence was detected and measured with space-borne InSAR in the case of a headrace tunnel for a hydroelectric scheme in the Western Swiss Alps [
17] and the Gotthard Base Tunnel [
18] with ERS, ENVISAT and JERS satellite data. In urban areas settings are to remember the London Crossrail Case Study [
19] and the Shanghai Subway [
20], both using X-band COSMO-SkyMed data. In the Ligurian area, application of MT-InSAR techniques using COSMO-SkyMed data are reported for the instability monitoring of infrastructures around Genoa, in particular, harbor docks and railways [
21]. For the entire Liguria Region, the Permanent Scatterers data acquired by the Liguria Regional authorities are available online for consultation [
22]. These interferometric data were obtained with SAR images of the ERS1 and ERS2 and ENVISAT missions, both on ascending and descending orbits, acquired in the period May 1992-January 2001 (ERS) and December 2002-July 2010 (ENVISAT).
In this paper we exploited the space-borne SAR data of the European Space Agency (ESA) Sentinel-1 mission to detect and investigate the displacements occurred concurrently with the construction of the Fereggiano tunnel, describing the pattern in space and in time. Nowadays, using Sentinel open data is important to demonstrate their potential usefulness, especially for areas previously studied with other satellites. With the MT-InSAR processing a really high population of reliable targets have been analyzed, capturing the different construction phases of the tunnel.
This study is organized as follows:
Section 2 describes the area of interest together with the geological settings.
Section 3 describes briefly the dataset and the MT-InSAR methodology adopted in this study.
Section 4 presents and discusses the results. Conclusions are provided in
Section 5.
2. Area of Interest and Geological Setting
The area of interest (approximately 10 km
2) is located on the eastern side of the city, in the lower part of the Bisagno river catchment, more precisely in the San Martino district (
Figure 1). Autonomous municipality until 1873, it became part of the great urban area of Genoa in 1926. It experienced intense urbanization, transforming itself into a densely inhabited residential area, well known for its large hospital complex, which is the main Genoa one. The newly built Fereggiano tunnel section runs mostly under this area coming from the Fereggiano valley, passing the underground railway line and going to reconnect to the pre-existing tunnel section linked to the sea (
Figure 1).
The geology of the territory of Genoa has very peculiar characteristics because of the transition area between the Alpine and the Apennine mountain chains. It includes the Ligurian Alps units first involved in the Alpine evolution, subsequently affected by a tectonic phase attributable to the Apennines evolution [
23].
The terrains of the area of interest consist predominantly of flysch formations of the Cretaceous outcrop, composed by the marly limestones of Mt. Antola fm. (upper Cretaceous) and related base complex of Montoggio Shales (upper Cretaceous). The San Martino area is mainly characterized by the Ortovero Pliocenic clays [
23]. These post-orogenic deposits, characterize also the medieval historical center and the old harbor area [
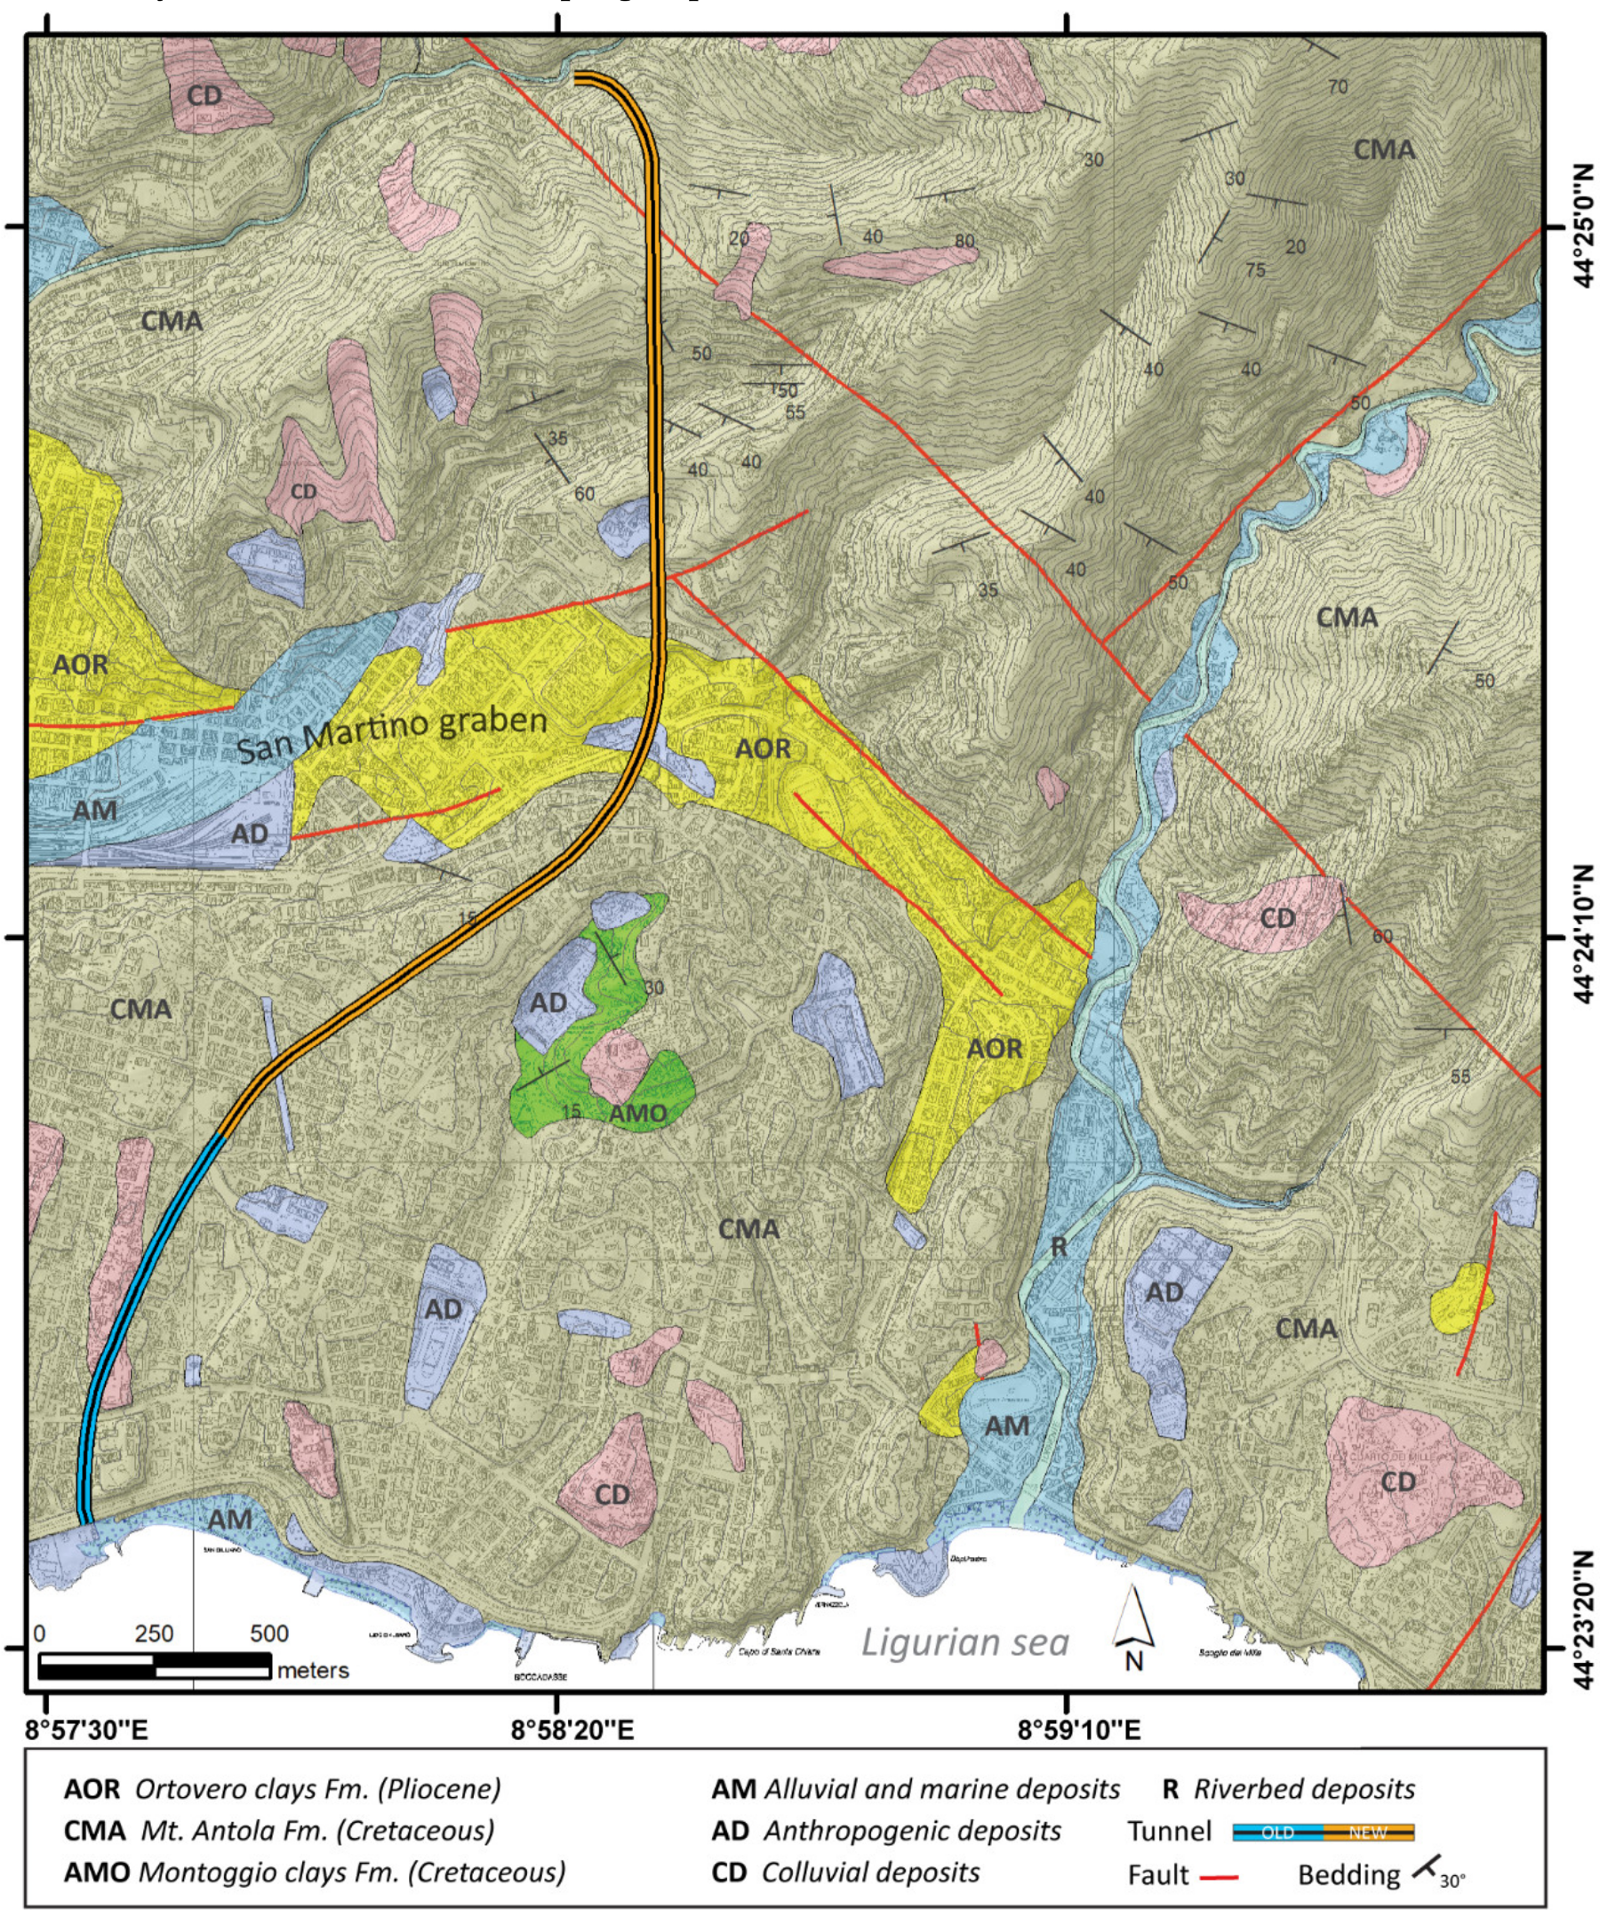
24]. The stratigraphic structure is very heterogeneous and the tectonic setting is dominated by the San Martino graben, oriented E-W and delimited by high-angle normal faults. This graben has developed within the rocky substratum of the Mt. Antola flysch, filled subsequently by the marine deposits of the Ortovero clays. The geological map and a schematic geological crosssections along the tunnel axis are shown in
Figure 2 and
Figure 7.
The tunnel is excavated for his entire length in the Mt. Antola fm. terrains with the exception of a few meters at the entrance to the sea. The formation consists of a turbidites sequence layers accumulated in a distal facies along an inclined and unstable sea floor. In the area, the thickness of this formation does not exceed 250 m. The calcareous and marly-calcareous levels occur in layers with a thickness of 1.0–1.50 m. They are generally compact and moderately fractured in areas of major tectonic disturbance. The clay interlayers have a decimetric thickness and a high degree of alteration. The transition to the underlying Montoggio clays fm. is gradual. The lowest and highest points of the tunnel are at 0 m at the entrance, and 13 m for the last sector (Fereggiano river catchment). The topography near the tunnel axis reaches the highest altitude of 181 m resulting for a max project depth of 170 m. The tunnel runs a few meters below the base of the Ortovero Pliocenic clays about halfway along its route, at an average depth of 60 m. The Ortovero clays fm. is a marine deposit made up of prevailing marls, over-consolidated marly clays, siltstones and fine sandstones. The prevailing color (not altered) is grey or light blue. Rarely there is the presence of gravel levels and sand lens. At the base of the formation and at the contact with the Antola fm. there is the presence of gravel and conglomerate levels whose thickness varies from a few centimeters to a few meters. Outcroppings of this formation are rare because it is confined to densely urbanized areas, and/or covered with debris, alluvial or carryover material. Laterally, the passage between the Ortovero clays and the Antola Fm. is marked by fault breccia and slumping deposits. The tunnel intersects two normal faults.
Figure 2.
Geological setting of the study area.
Figure 2.
Geological setting of the study area.
The area investigated is in a context of total anthropization characterized by both erosional and accumulation man-made landforms. The main geomorphic features concern artificial modifications of drainage networks and reshaped slopes. Some alluvial and marine deposits can be found in the main riverbeds and along the coastline (
Figure 2). In the area, flash floods are recurrent and sometimes disastrous [
4,
5] and currently there is no evidence of ongoing or potential landslides [
23].
3. Dataset and Methodology
A space-borne synthetic aperture radar multi temporal interferometry (MT-InSAR) analysis has been performed. This is a well-established technique for ground displacement monitoring characterized by millimeter accuracy. Interferometric Synthetic aperture radar (InSAR) is based on the phase comparison of different SAR images acquired at different times with slightly different angles. The phase difference contains the phase term proportional to the target motion occurred during the interval between the acquisitions along the sensor-target line of sight (LOS) direction. Multi-image techniques permit to identify radar targets exhibiting coherent phase behavior (persistent scatterers, PS) and remove atmospheric artefacts, getting higher accuracy and reliable time-series. A detailed description of the method can be found in [
25,
26,
27,
28,
29] and a comprehensive review in [
30]. We executed the wide-area analysis over the entire Genoa city and surrounding area, utilizing the available dataset composed of 320 Sentinel-1 C-band (5.6 cm wavelength) single look complex scenes per both of its ascending (159 images, orbit 15) and descending (161 images, orbit 168) geometries (frames in
Figure 1). The European Space agency (ESA) Sentinel-1 operates in TOPS (Terrain Observation by Progressive Scans) mode which captures images consisting of series of bursts with mutual overlaps. The spatial resolution provided is 5 m x 20 m. The two satellites (Sentinel-1 A&B) are in polar orbit, therefore they pass over the area of interest south to north in ascending pass and north to south in descending pass. The covered time period starts from April 2015 to October 2018, with approximately one acquisition every six or max twelve days. The orbit state vectors of each scene were refined using Sentinel-1 precise orbit ephemerides (POE) to reduce errors due to the satellite orbit inaccuracies. POE are published online by ESA [
31].
In this work we used the procedures implemented in SARPROZ software [
32] adopting a classic persistent scatterers interferometry (PSI). This method applies a single master configuration analysis based on algorithms proposed in literature [
26,
27,
29]. The multi-temporal processing (estimation of parameters) comes from the maximization of the periodogram and does not require either spatial unwrapping or filtering to the wrapped interferograms.
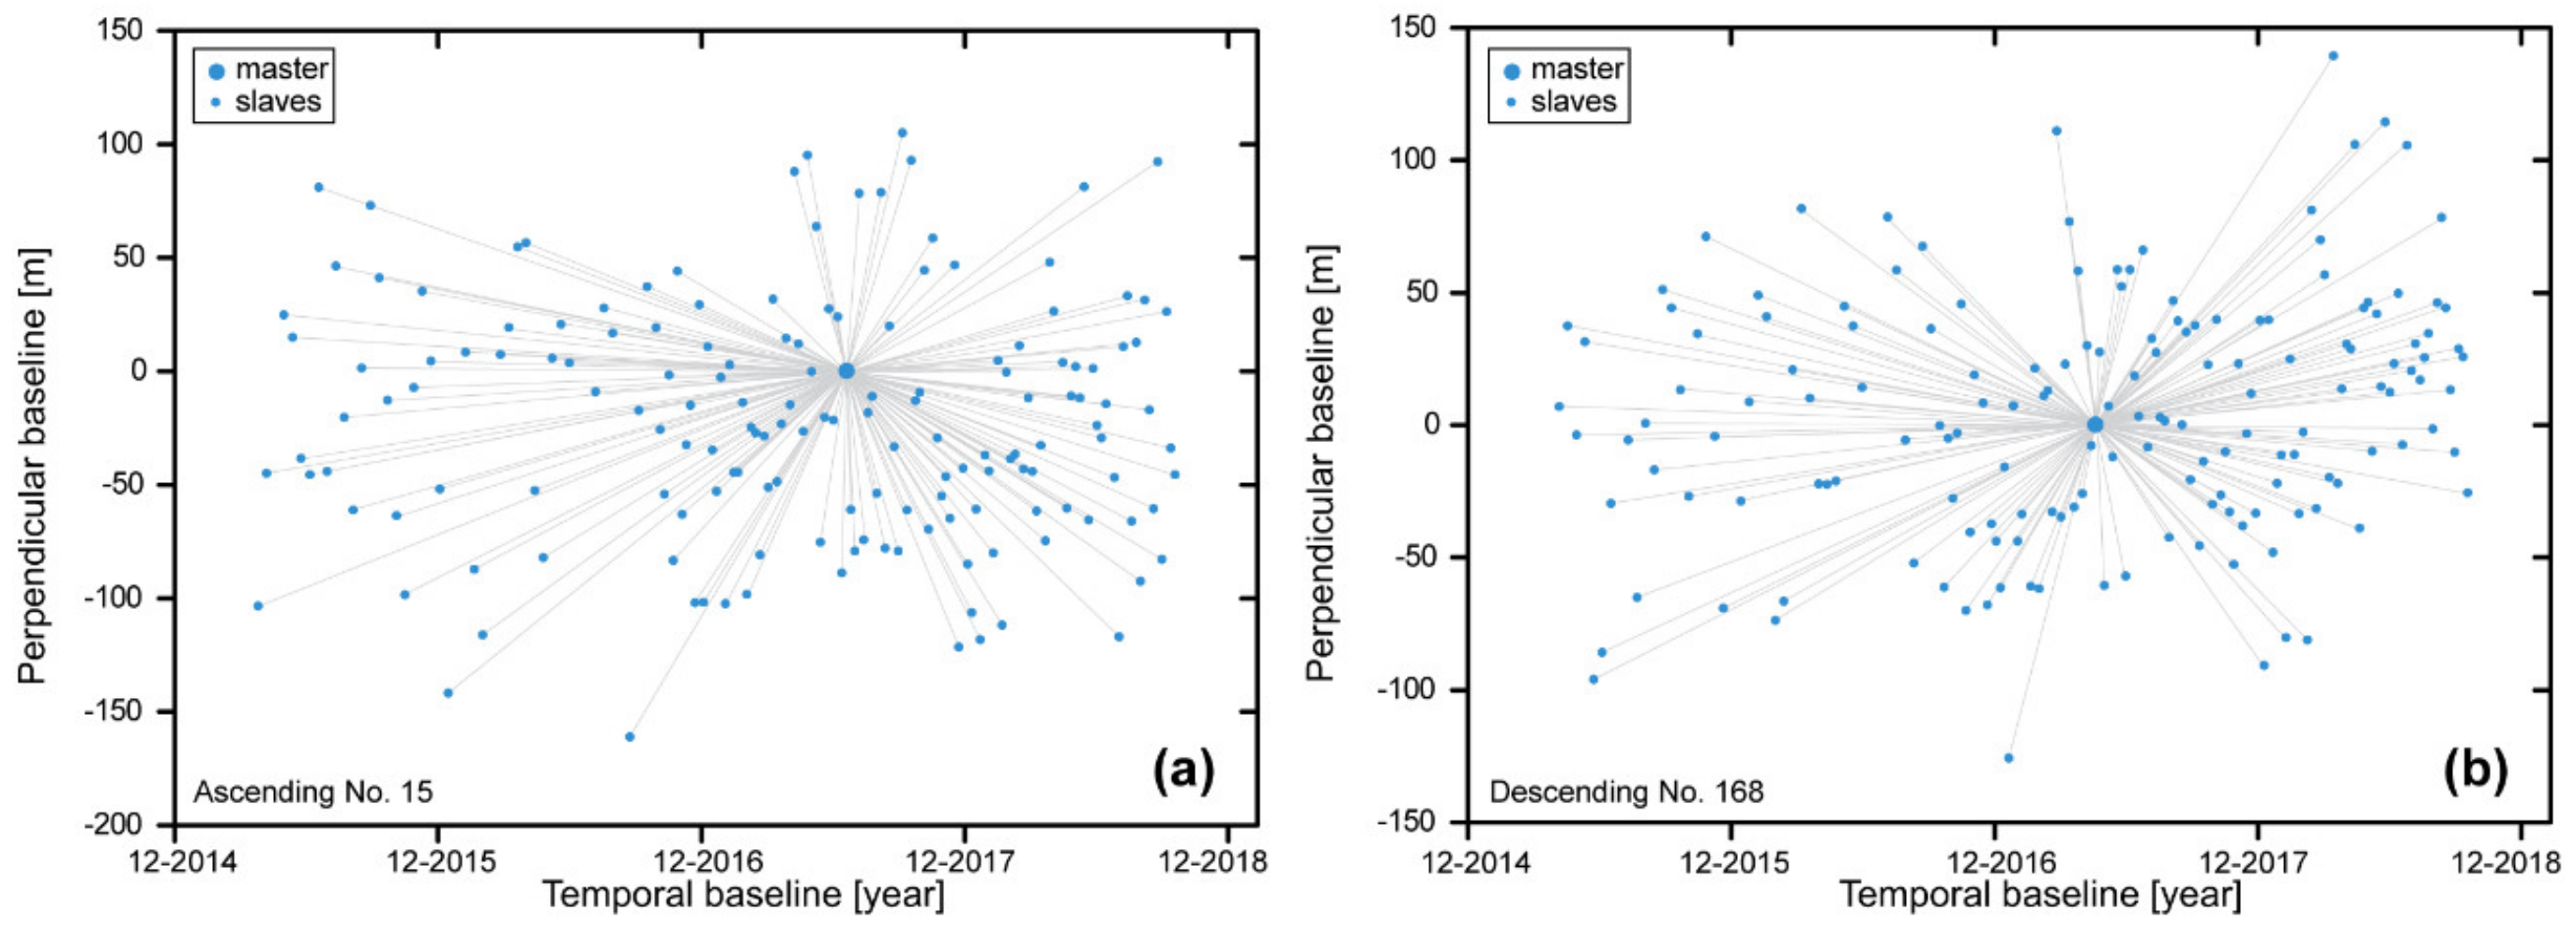
In the analysis, differential SAR interferometry is applied only on selected pixels, generally man-made objects, characterized by point-target scattering behaviour and are persistent over a long observation time. They can be used for monitoring both the displacement of individual structures and the evolution of a large displacement field. The density of ground targets can reach very high densities in urban areas. In this study PS candidates (PSC) were selected based on a combination of quality parameters related to the radar signal stability of the targets. Therefore, parameters such as reflectivity, amplitude stability index (ASI) and the spatial coherence have been considered. The first applied processing steps were the master images selection followed by the images co-registration adopting a classical star images graph. One master image is selected and all the other images are connected with the one common master image (
Figure 3). The reference master images were chosen among those acquired approximately in the mid of the temporal and perpendicular baseline domain to minimize space and temporal decorrelations [
33]. The corresponding interferograms were computed. The removal of the topographic phase was carried out using the Shuttle Radar Topographic Mission (SRTM) digital elevation model (DEM) with a pixel resolution of 3 arc second (90 m × 90 m), made available by NASA (National Aeronautics and Space Administration) in partnership with the USGS (United States Geological Survey) [
34].
Figure 3.
Sentinel-1 images graphs (single master PS analysis) for the Ascending frame no. 15 (a) and the Descending frame no. 168 (b). Each point represents an image and each line represents an interferogram. x-axis: temporal baseline of the acquisitions. y-axis: normal baseline of the acquisitions.
A strong preliminary network consisting of a sub-selection of PSC (ASI> 0.8) was created to estimate the height and velocity parameters to detect and remove the atmospheric phase screen (APS). After the APS removal phase, a subsequent estimation of the parameters was performed on the entire data set of the initial selection of the PSC. At the end of the analysis all the persistent scatterers with temporal coherence above 0.7 were selected. For each target the LOS velocity, displacement time series and heights have been estimated adopting a linear trend model. To obtain reliable results the reference point with zero displacement were located in a well constrained stable area outside the tunnel trajectory and away from known landslides.
4. Results and Discussion
In
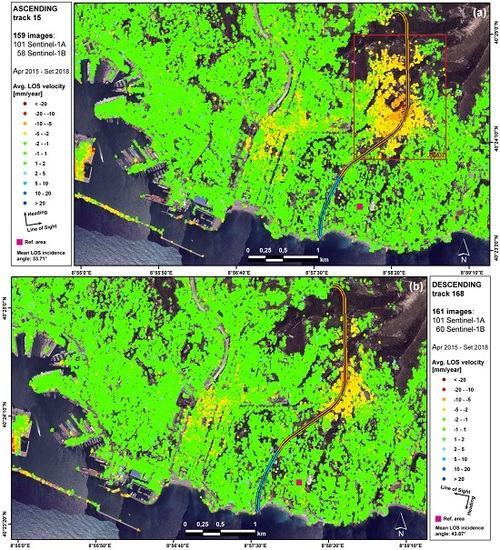
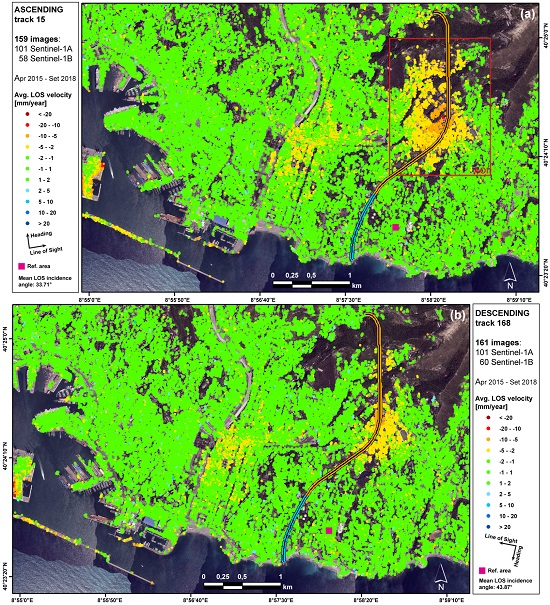
Figure 4, a general overview of the average line-of-sight annual velocities estimated from Sentinel data is presented. The figures show the results with both datasets of ascending and descending orbits over the whole area of Genoa city. In the two maps the color scale is [−20/20] mm/year. Due to the many buildings the maps show a nearly continuous distributions of PSs, except in the NW corner sector, where there is sparse urbanization and vegetation. Reference points are the same for both datasets to avoid biases in the analysis and situated in a flat stable area.
Figure 4.
Average 2015–2018 velocity maps of displacement in the Genoa area. In (a) and (b) LOS velocities in mm/years are reported. Green points indicate stable areas. Ground subsidence is clearly visible in the area of interest (red box).
Figure 4.
Average 2015–2018 velocity maps of displacement in the Genoa area. In (a) and (b) LOS velocities in mm/years are reported. Green points indicate stable areas. Ground subsidence is clearly visible in the area of interest (red box).
We can notice three different areas of subsidence, appearing with yellow, orange and red colors, respectively in the harbor zone, at Foce district and S. Martino district. From east to west, we can clearly appreciate first the potentially expected sinking phenomena of the harbor structures, like docks and piers. At the same time, in the center of each maps, the PSI analysis highlights different macro-areas of subsidence (−2 to −5 mm/year) linked most-likely to the paleo-riverbeds of the Bisagno river and his tributary Noce river, filled by alluvial deposits. This is particularly visible along the left bank of the river Bisagno, as a narrow linear yellow strip, which from the stadium runs southward and interconnects itself with another one, near the railway, oriented E-W (
Figure 1). This strip then widens for a few hundred meters under the “Foce” (in English: river-mouth) Genoa district. The kinematic behavior of these two sectors appears to be consistent with that described by previous analyses of interferometric data [
21,
22] carried out exploiting images of ERS1/ERS2 (acquired in the period 1992–2001), ENVISAT (acquired in the period 2002–2010) and COSMO-SkyMed (acquired in the period 2007–2008).
By looking at the western sector of the maps we can notice an additional widespread subsidence area. Here the displacement rate goes from −2 to −25 mm/y. To retrieve the origin of this ground settlements, we recovered from the Genoa city authorities [
8] the location of the newly built Fereggiano overflow tunnel, which is a strategic and of high importance infrastructure for the city’s hydraulic safety. This area presents itself as a 10 km
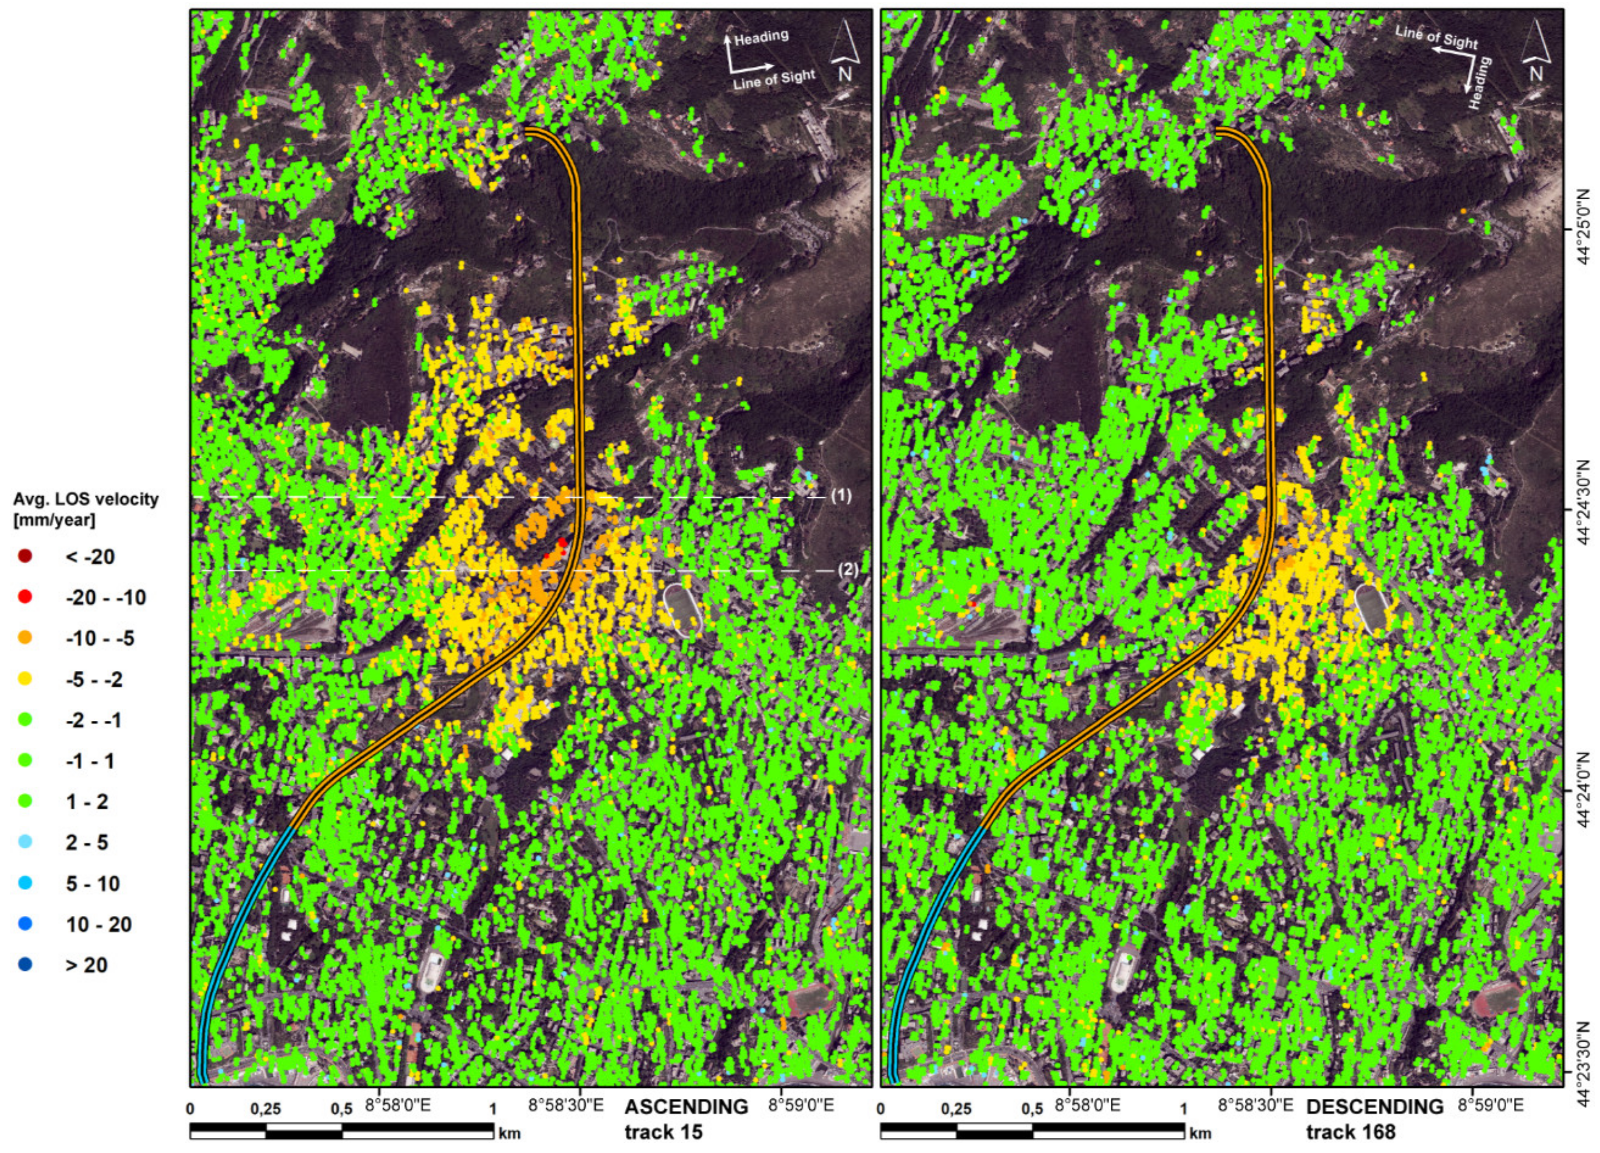
2 subsiding zone elongated N-S and correspondent mainly with the San Martino district. In
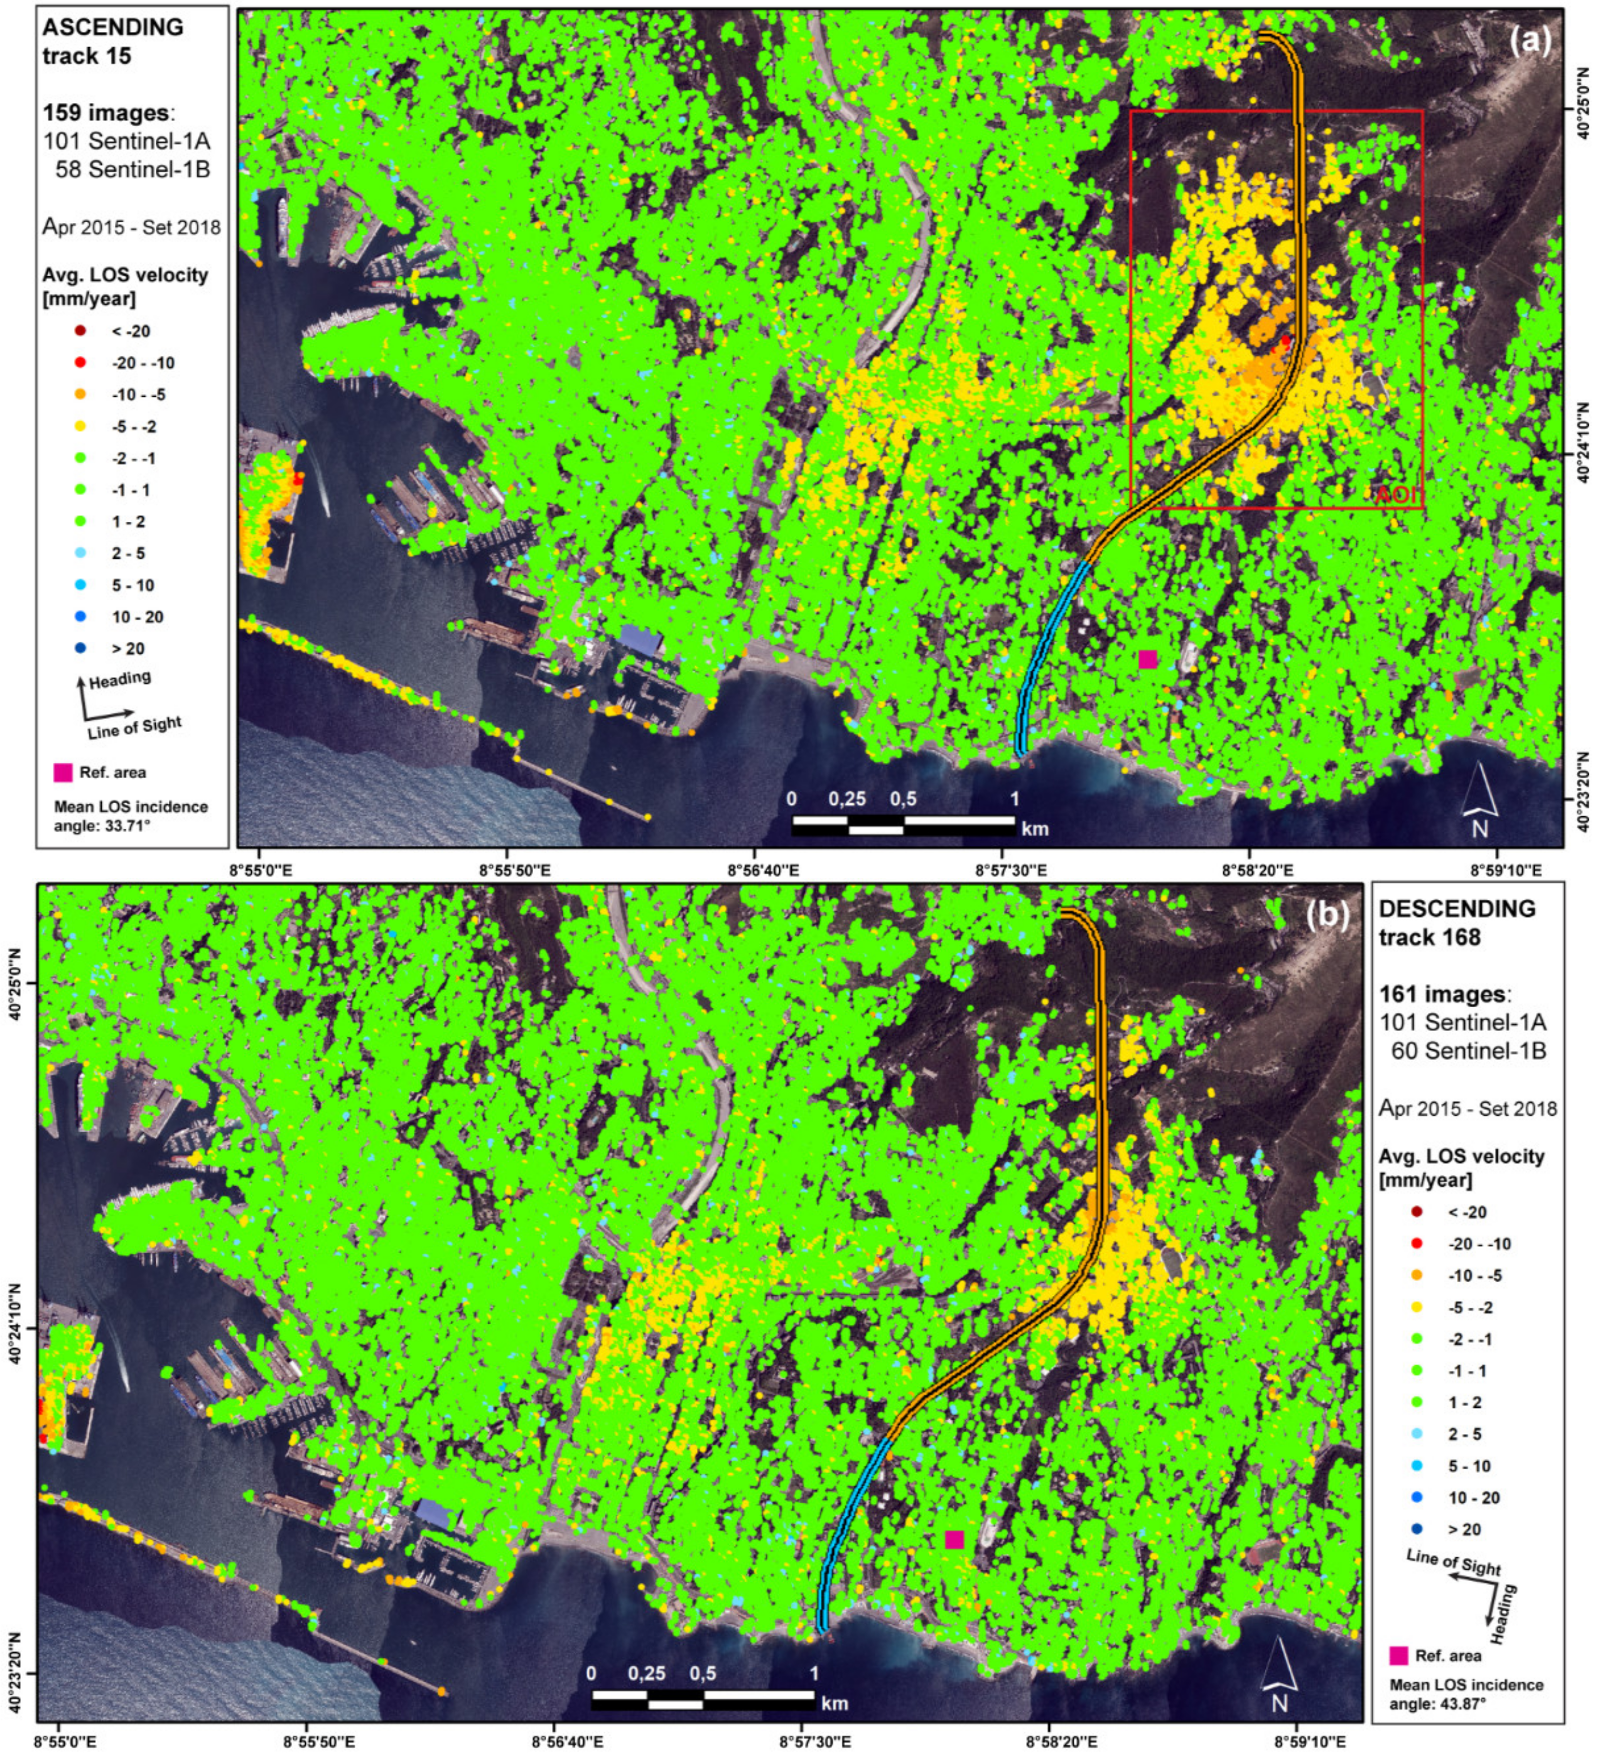
Figure 5 this area is shown as a close-up. The light blue line represents the pre-existing tunnel section, while the orange line indicates the new-built 2808 m. As we can notice, the ascending line-of-sight subsidence appears greater in magnitude and areal than for the descending orbit. This is attributed to the different satellite viewing geometries that were exploited in the analysis. Both results indicate a subsiding surface.
Figure 5.
Close-up of the average displacement rates (LOS direction, mm/y) above the Fereggiano tunnel from Sentinel-1 SAR data 2015-2018. Negative values (from yellow to red) indicates a lowering of the surface. Crosssections (1) and (2) are represented in the
Figure 6.
Figure 5.
Close-up of the average displacement rates (LOS direction, mm/y) above the Fereggiano tunnel from Sentinel-1 SAR data 2015-2018. Negative values (from yellow to red) indicates a lowering of the surface. Crosssections (1) and (2) are represented in the
Figure 6.
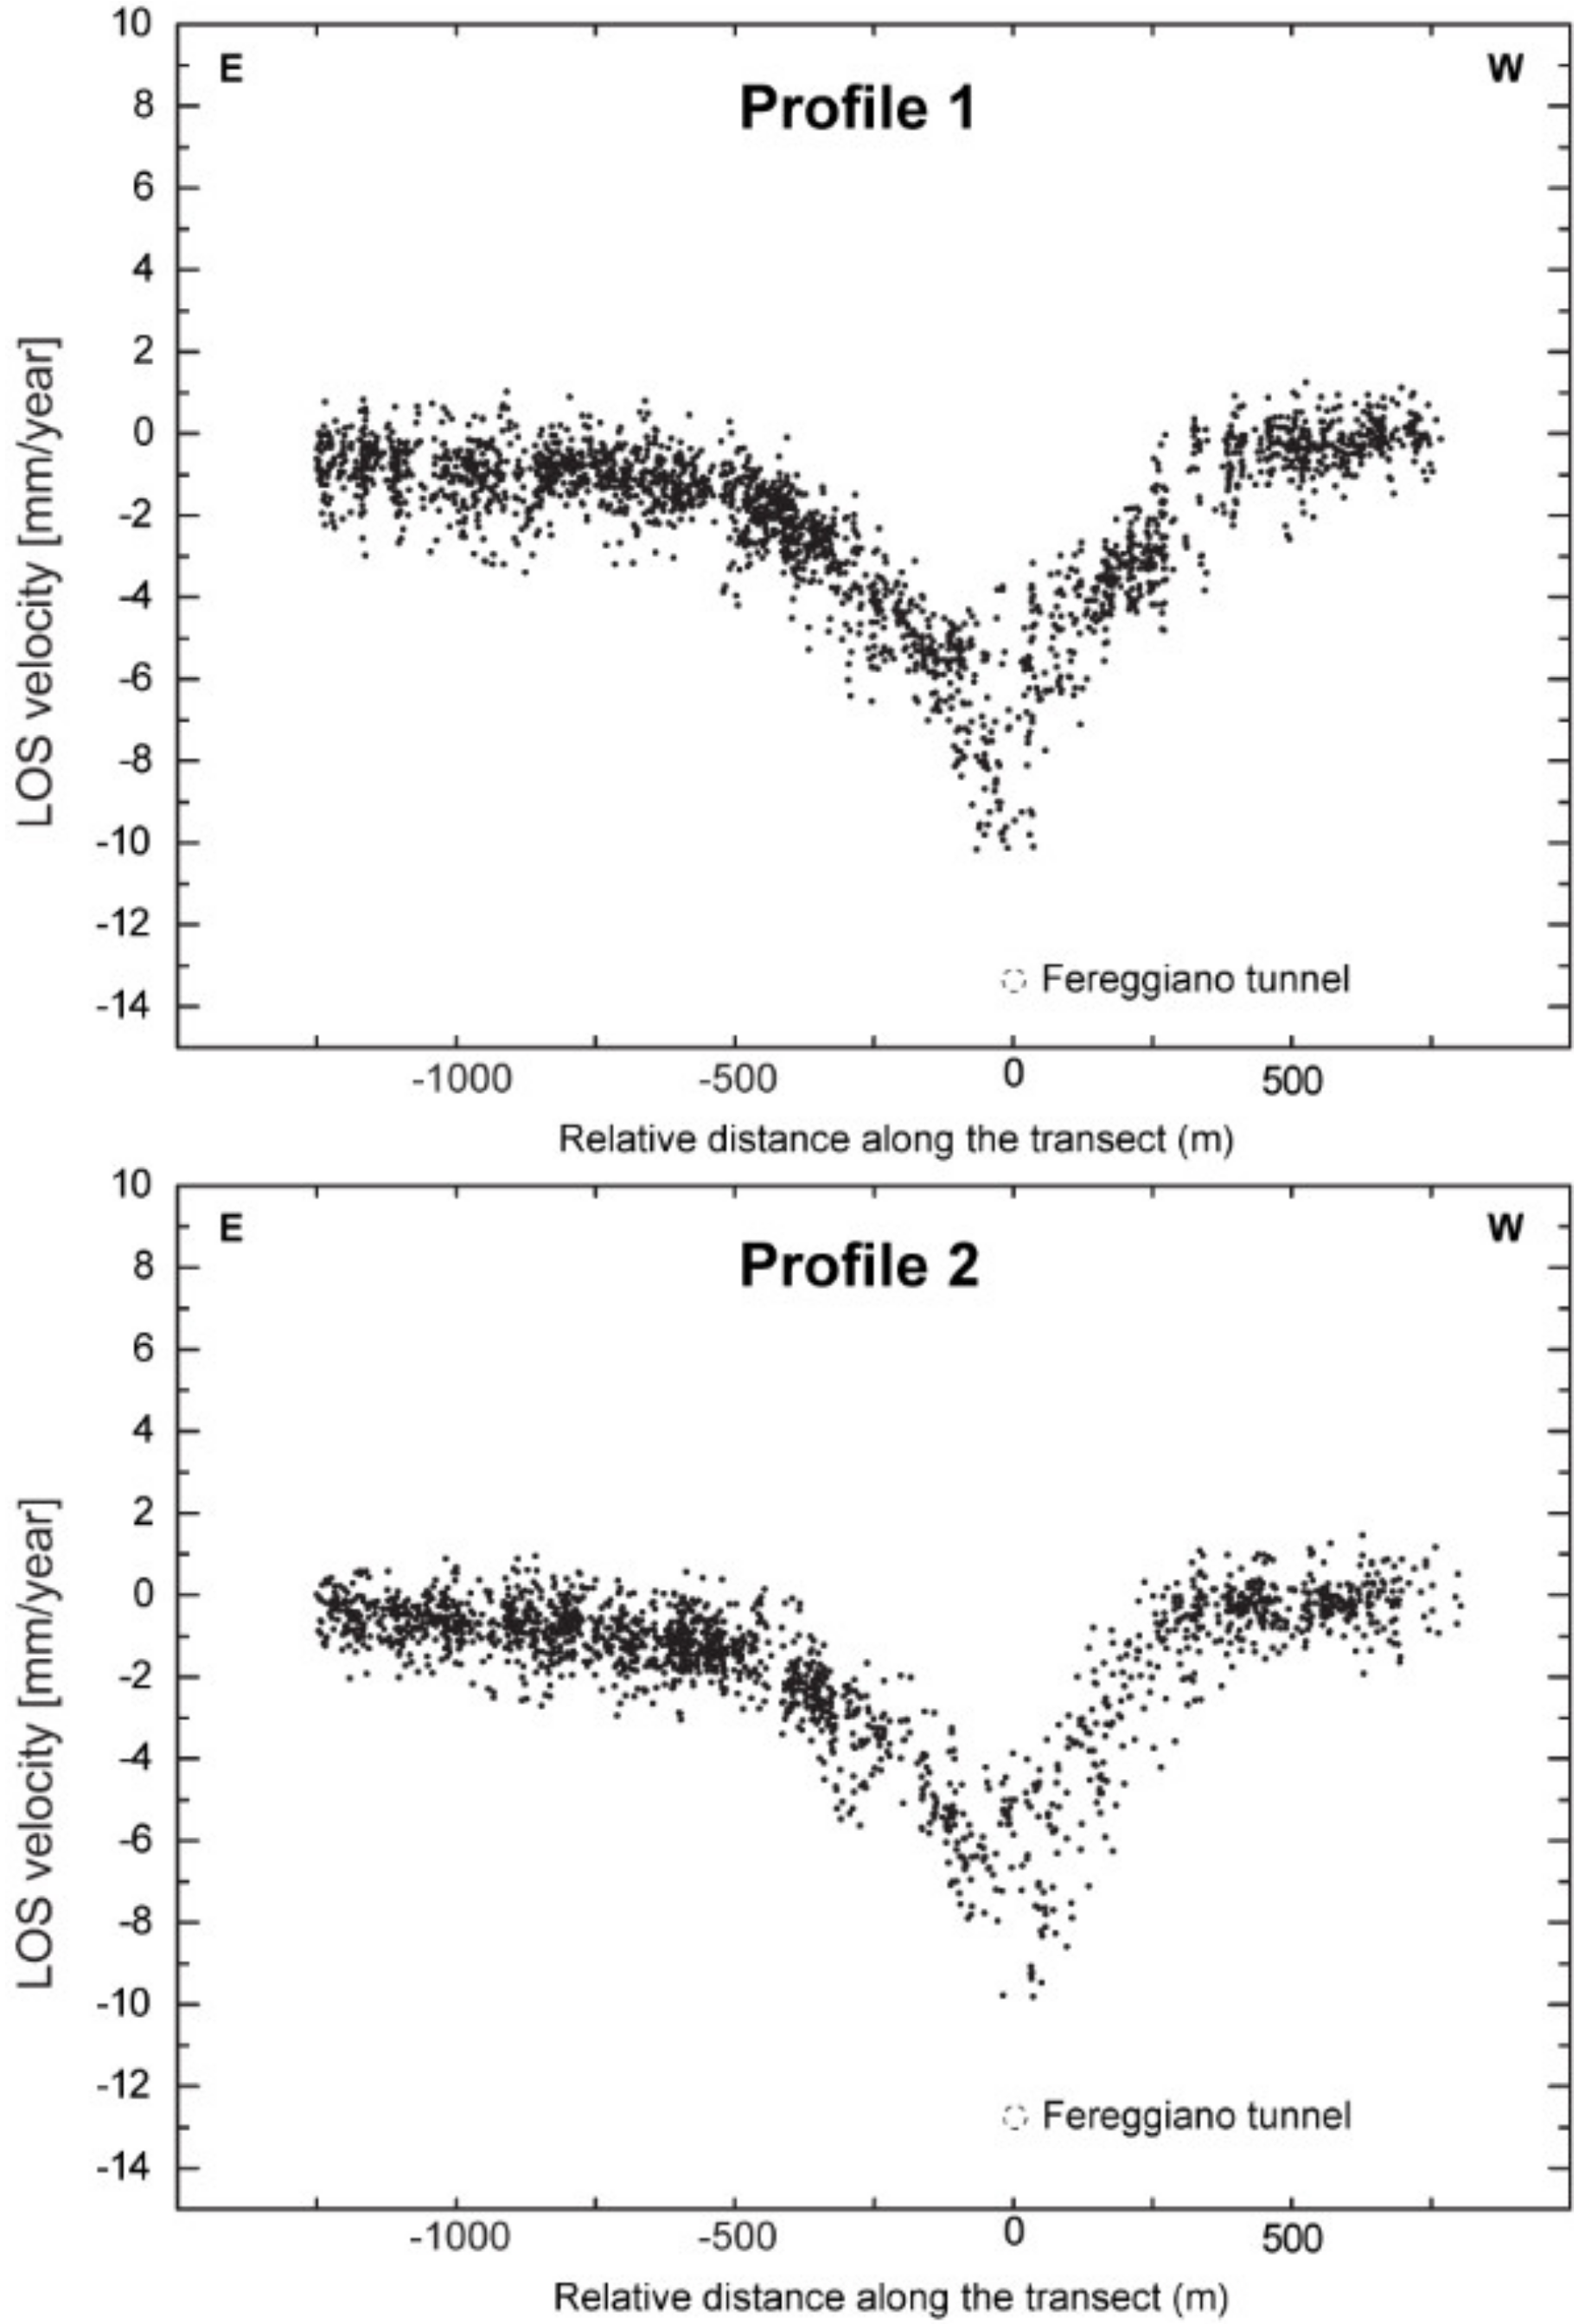
The density of PSs permitted to estimate the subsidence profile in two representative segments, perpendicular to the tunnel. The average deformation trend cross-sections are reported in
Figure 6. The vertical axis displays the settlement velocity in mm/y. The horizontal axis is expressed in meters and indicates the relative distance from the tunnel along the transects. It is shown that the locus of the maximum LOS velocity was found to be on the tunnel’s axis. In these areas, the tunnel runs about 50 m below the surface. In this case the buffer zone around the tunnel is quite large, as the deformation begins to increase 500 m away from the track. Compared to other studies this value is quite high and is due to site geological factors and the soil-structures interaction. In these cross-sections we can notice how the western side is affected by the slight subsidence (−1 to −3 mm/y) given by the soft deposits of the Noce river (
Figure 1). The accurate analysis of settlement traverse profiles could allow tracing the tunnel track with high accuracy even in case of unavailability or public inaccessibility of the project. In our study, the profile shape is quite in accordance with the prediction theoretical displacements models of the settlements transverse profile induced by tunneling [
35,
36,
37]. As known, the usual procedures for the assessment of structural damage induced by ground-settlement start with the evaluation of the tensile strains caused by the greenfield settlement profile [
38]. The soil greenfield displacements are defined as underground-excavation ground displacements in absence of buildings. They are usually calculated neglecting the influence of the structure weight, considering instead soil characteristics, tunnel depth and diameter, and the volume of ground lost [
39,
40]. The building weight and stiffness typically has the effect of widening the soil settlement profile, reducing the curvature [
19]. In this case, the max LOS cumulative displacement reaches 30 mm, in correspondence of the large complex of buildings in San Martino district (
Figure 1).
Figure 6.
Subsidence trend profiles of the settlements area. The vertical axis displays the settlement velocity in mm/y. The horizontal axis is expressed in meters and indicate the relative distance from the tunnel along the transects.
Figure 6.
Subsidence trend profiles of the settlements area. The vertical axis displays the settlement velocity in mm/y. The horizontal axis is expressed in meters and indicate the relative distance from the tunnel along the transects.
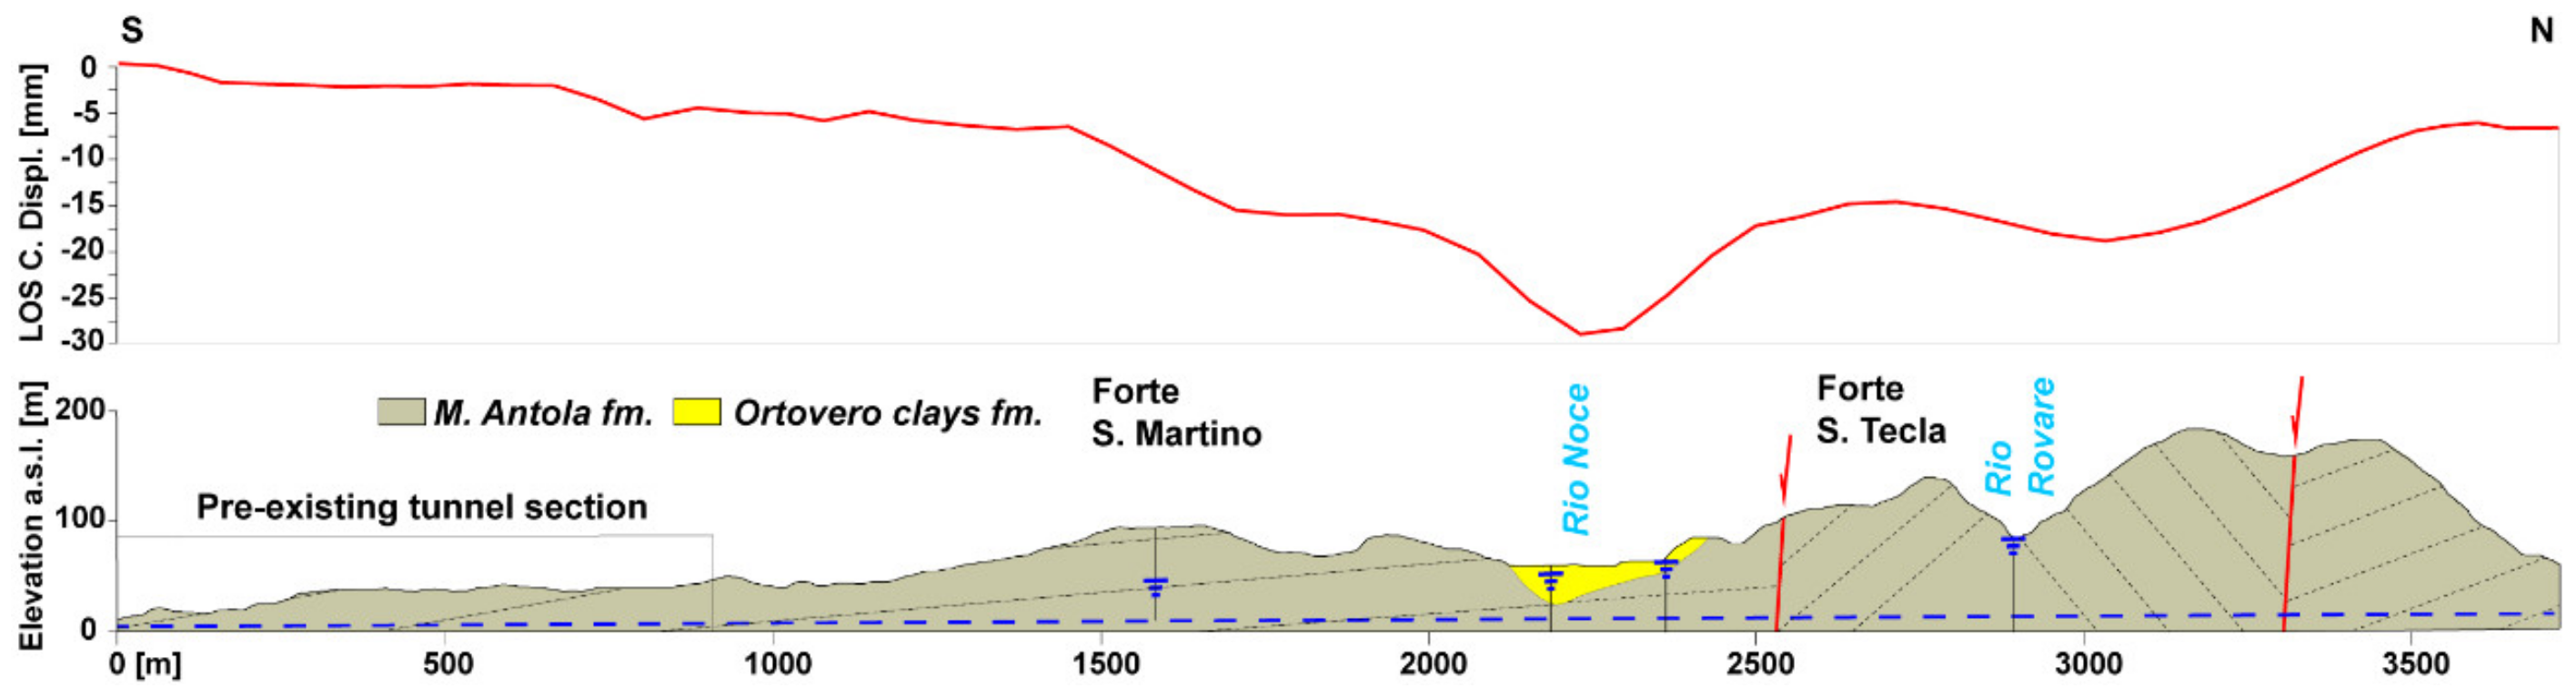
In
Figure 7 is reported a geological cross-section drawn along the longitudinal profile of the tunnel (blue-dotted line). For comparison purposes, in the upper part of the figure we inserted the corresponding value of LOS cumulative displacement along the section, achieved through an interpolation of the PSs values. It can be seen that, the subsidence values along the pre-existing tunnel section are negligible. Values greater than -5 mm start at about the area where the new-built section lies. The ground-displacements values increase proceeding northbound, reaching the maximum values in the San Martino graben (
Figure 2), the values then decrease northward, except in correspondence with the valley of the Rovare river.
Figure 7.
Geological section along the Fereggiano overflow tunnel (drawn as a blue dotted line). The red line represents the longitudinal profile along the tunnel axis of the LOS cumulative displacement (ascending orbit). The water table level (blue triangle) and the location of boreholes (black vertical line) are also show. Elevation exaggeration: 1.5.
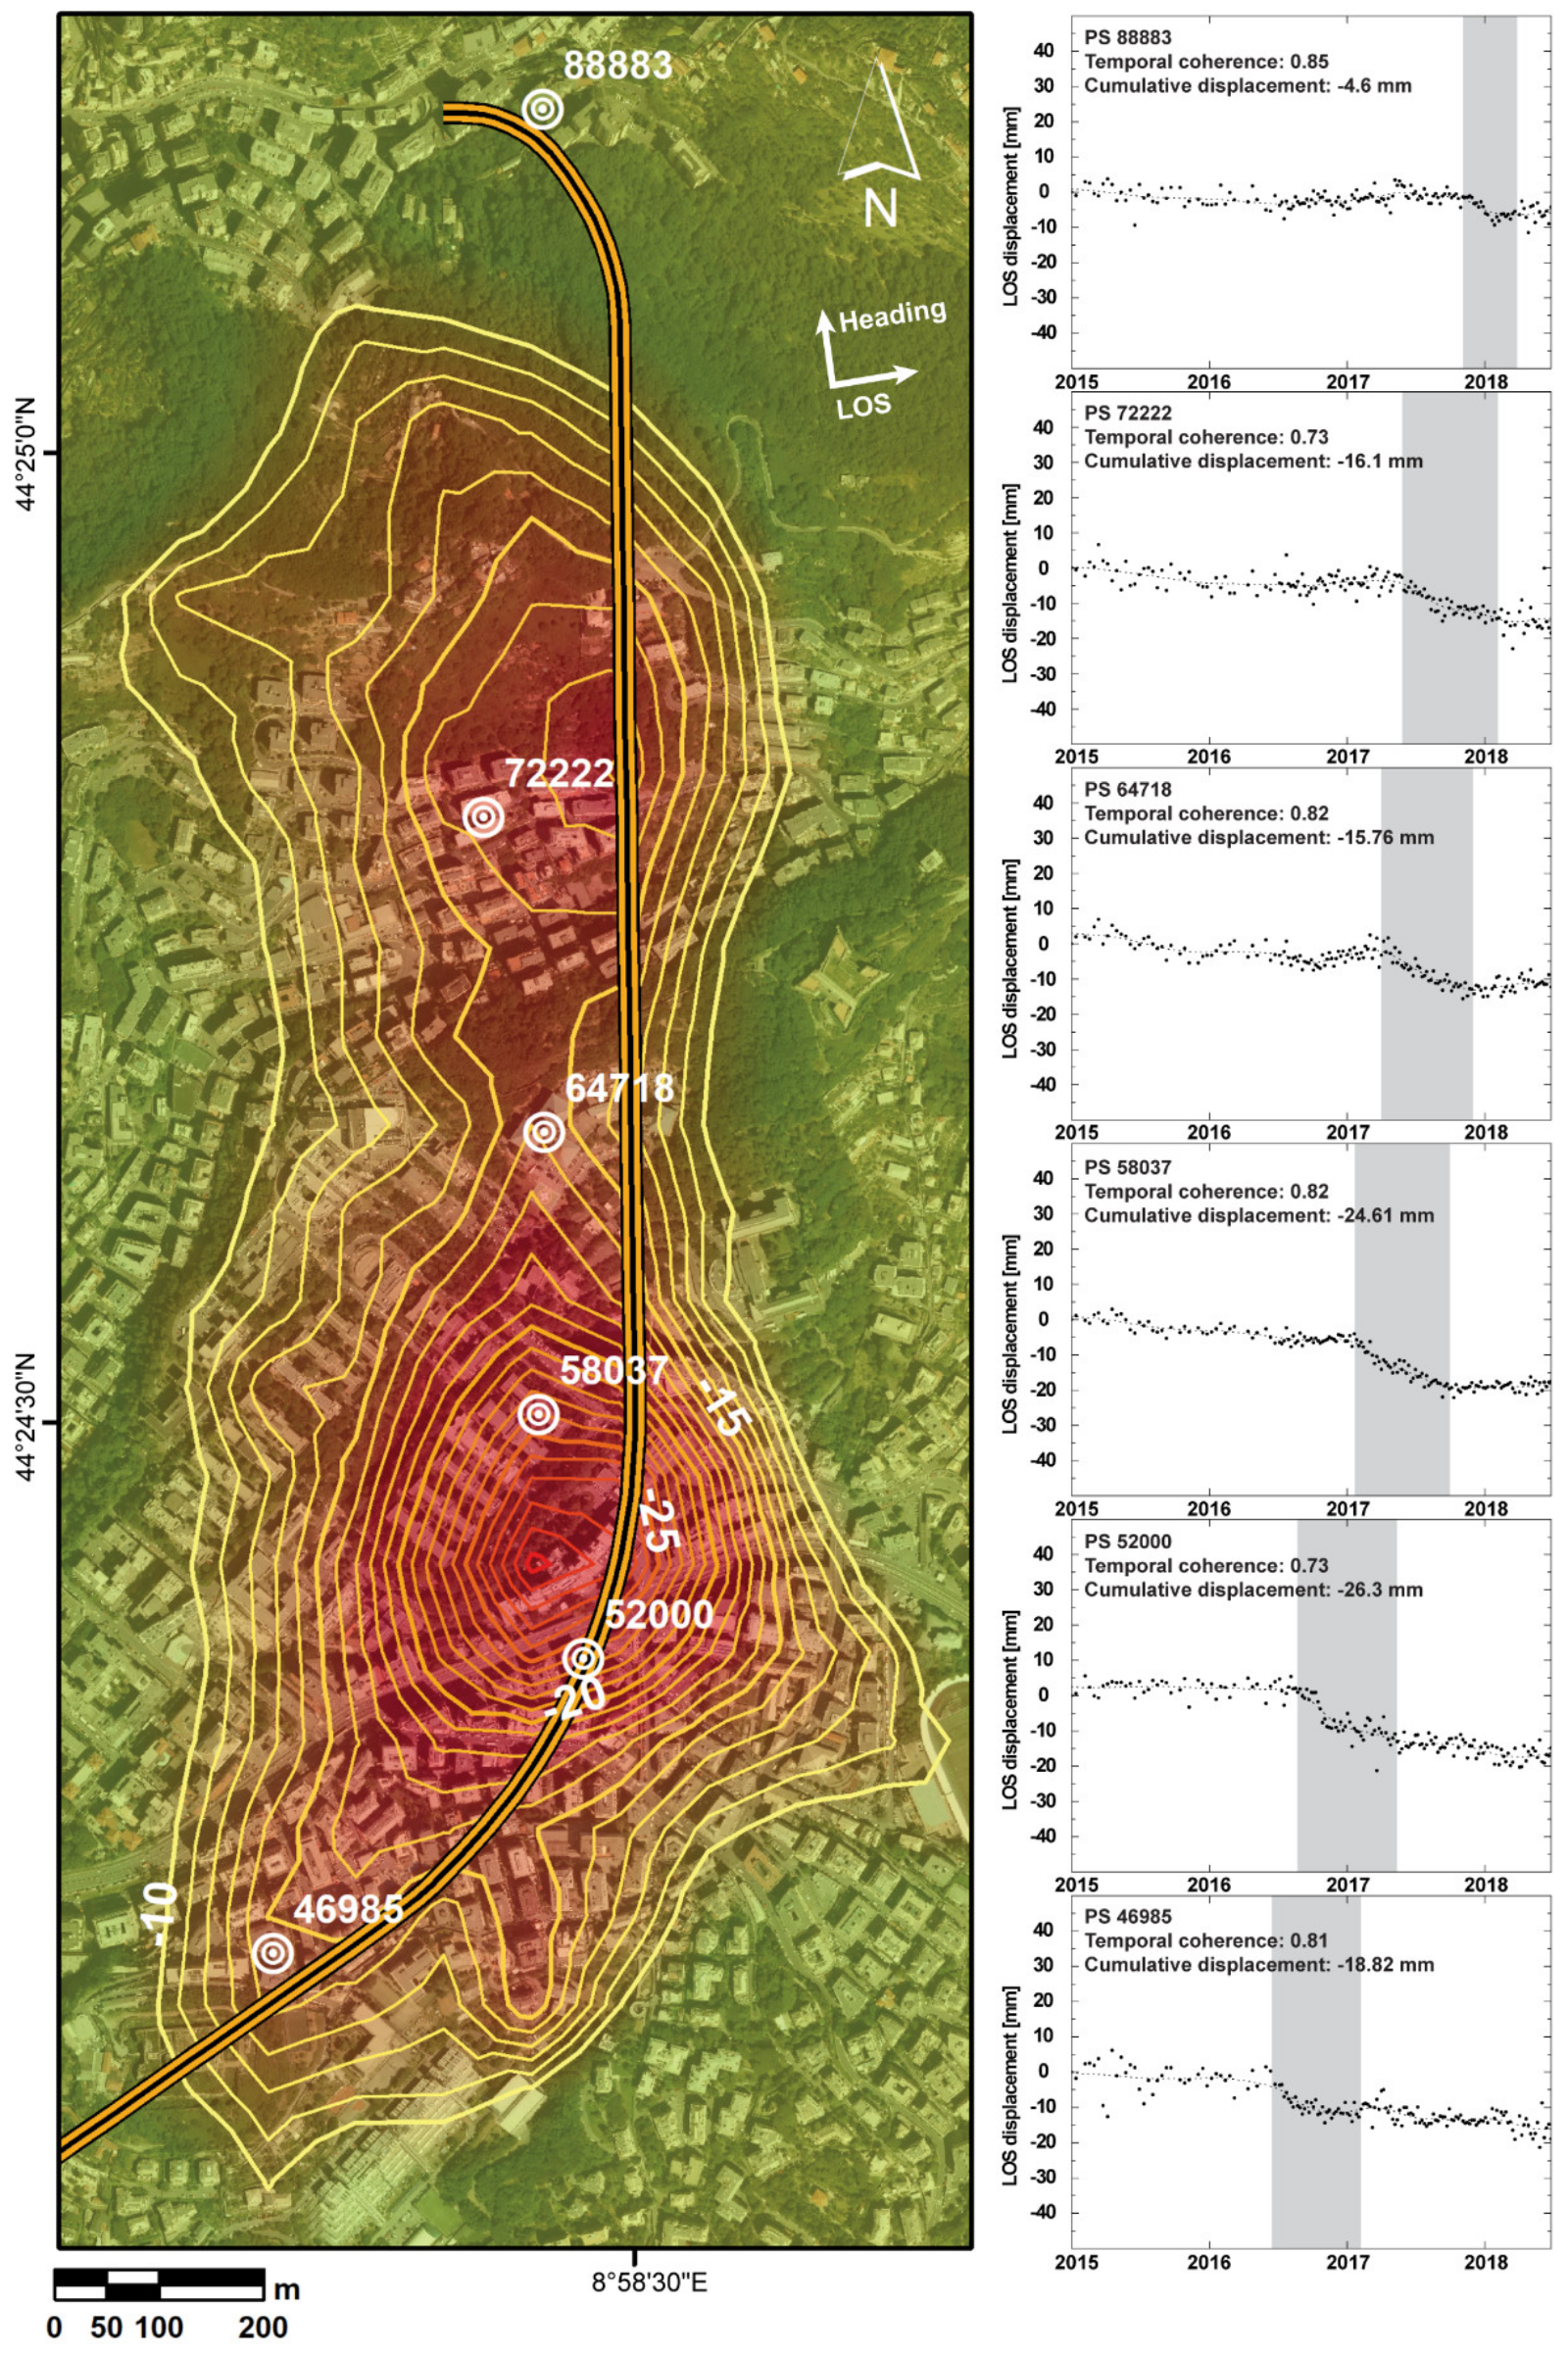
The two areas of subsidence maxima are easily noticeable in
Figure 8, where a contouring map of the ascending cumulative displacement is shown. At the right side of the figure time-series of specific reliable point targets with high coherence, are presented. In each graph, the
x-axis contains the acquisition time (years), while the
y-axis indicates the LOS displacement in mm. The time-span of the main displacement occurred, is denoted with grey in the graphs of
Figure 8. Targets were chosen all along the tunnel trajectory. Results indicate a straight relation of the time series with the tunnel’s face advancement. The southern target (no. 46985) started to be affected by ground-settlement in the middle of 2016, and the northern one (no. 88883) at the end of 2017. Each displacement phase lasts on average five-six months before the stabilization. The northbound progressive displacement is well constrained by the PSs time series as shown in graphs of the
Figure 8.
The overall stability of the area before the tunneling works is particularly noticeable and also confirmed from the kinematic behavior described by previous analyses of interferometric data [
21,
22]. The new-built tunnel runs mainly through the marly limestones of Mt. Antola and the Ortovero clays formations both characterized by low rates of natural subsidence. Accordingly, the results highlight that the main reason of subsidence in the area is due to the tunnel construction and that the greater displacement values are definitely reached where there is the presence of multiple predisposing factors. In fact, as we expected, the area characterized by the coexistence of a metric coverage of alluvional deposits, a shallow water table and, not last, the large complex of buildings, is the one that suffered the most from the tunnel’s influence.
Figure 8.
Contour map of cumulative displacement (LOS ascending direction, mm). The targets indicate the location of the PSs selected to show in the related time series (on the right). The T.S. graphs show the progressive deformation along the tunnel axis.
Figure 8.
Contour map of cumulative displacement (LOS ascending direction, mm). The targets indicate the location of the PSs selected to show in the related time series (on the right). The T.S. graphs show the progressive deformation along the tunnel axis.
5. Conclusions
The study highlights the reliability and the usefulness of the C-band Sentinel-1 mission data and the PS technique applied in an urban area like Genoa. In this paper 320 SAR images acquired by ESA have been processed with SARPROZ software covering a time span from 2015 to the end of 2018. We adopted a classic PSI single master configuration analysis approach. Subsidence areas of Genoa are revealed in good detail, making it possible to detect the subsiding piers of the harbor or the built-up paleo-riverbed areas. The PSI analysis made especially possible to track the ground settlements arising from the newly excavated Fereggiano overflow tunnel. This is a strategic infrastructure for the city of Genoa, 3717 m long, which allows flood waters of three different rivers (Fereggiano, Rovare and Noce) to flow directly into the sea. The new construction section (2808 m long) was built using the traditional blasting excavation method. The tunnel runs beneath a dense urbanized area through the marly limestones of Mt. Antola fm. (upper Cretaceous) and passing beneath the Ortovero clays formation (Pliocene). Small but significant cumulative displacements up to 30 mm in the LOS direction were detected in the area. No significant displacements were recorded before until end of 2016.
The outcomes confirm the high density of target detectable using Sentinel images with respect to other interfometric data analyses and demonstrate the potential usefulness of this sensor in addition to other satellites previously exploited. The numerous targets permit to enhance the understanding of the ground-settlements patterns in space and their spatio-temporal progression. Transverse subsidence profiles were made perpendicularly over the tunnel trajectory, showing a clear relation with the excavation works in a buffer zone of max 500 m circa for each side. As well known, underground drilling can often modify the hydrological regime around an excavated area and might induce generalized surface subsidence phenomena due to pore pressure reduction.
The results reveal the reliability of Sentinel data in monitoring of ongoing infrastructures. This is particularly relevant, from a cost-benefit point of view, to perform periodic controls during the construction phase of important works, mainly in vulnerable areas. The Sentinel-1 SAR data, with a revisiting time of six days, opened the possibility to monitor the displacements induced by progressing excavation front. The time-series analysis of the reliable targets with high coherence shows quite clearly the tunnel face advancement, which triggered the subsidence phenomena proceeding south to north starting from the middle of 2016 until the end of 2017 with different magnitude due to the tunnel depth, the geological characteristic of the crossed terrains and the soil-structure interaction. During the excavation works the deformation phases took place progressively along the track, lasting about six months before stabilization (terrain consolidation). Due to the low subsidence ratio the small-scale ground settlements did not cause severe damages to the buildings.
This study demonstrates once again the usefulness and the great importance of Sentinel missions which supply worldwide covering free and open-access data. Achieving the same spatio-temporal resolution and accuracy with conventional surveying methods can involve much higher costs, especially in areas that need extended coverage. Furthermore, the results validate the possibility of applying this analysis for the monitoring of infrastructures in remote areas.
The obtained results could also be significant for the development and calibration of numerical models to be employed to simulate the expected ground settlements in urban environments during each phase of the tunneling works, from the design to the monitoring after the construction. Outcomes of this analysis might be useful especially in this area, which shortly will be crossed by a new railway subway infrastructure and the Bisagno river overflow tunnel.

 ,
, 