Multiscale Analysis of DInSAR Measurements for Multi-Source Investigation at Uturuncu Volcano (Bolivia)


1
Istituto per il Rilevamento Elettromagnetico dell’Ambiente (IREA), CNR, 80124 Napoli, Italy
2
Dipartimento di Scienze della Terra, dell’Ambiente e delle Risorse (DiSTAR), Università degli Studi di Napoli “Federico II”, 80126 Napoli, Italy
*
Author to whom correspondence should be addressed.
Remote Sens. 2019, 11(6), 703; https://0-doi-org.brum.beds.ac.uk/10.3390/rs11060703
Submission received: 19 February 2019
/
Revised: 15 March 2019
/
Accepted: 19 March 2019
/
Published: 23 March 2019
(This article belongs to the Special Issue New Frontiers of Multiscale Monitoring, Analysis and Modeling of Environmental Systems via Integration of Remote and Proximal Sensing Measurements)
Abstract
:Uturuncu volcano (southwestern Bolivia) is localized within one of the largest updoming volcanic zones, the Altiplano Puna Volcanic Complex (APVC). In several geodetic studies the observed uplift phenomenon is analyzed and modeled by considering a deep source, related to the Altiplano Puna Magma Body (APMB). In this framework, we perform a multiscale analysis on the 2003–2010 ENVISAT satellite data to investigate the existence of a multi-source scenario for this region. The proposed analysis is based on Cross-correlation and Multiridge method, pointing out the spatial and temporal multiscale properties of the deformation field. In particular, we analyze the vertical component of ground deformation during two time interval: within the 2005–2008 time interval an inflating source at 18.7 km depth beneath the central zone of the APVC is retrieved; this result is in good agreement with those proposed by several authors for the APMB. Between August 2006 and February 2007, we identify a further inflating source at 4.5 km depth, beneath Uturuncu volcano; the existence of this latter, located just below the 2009–2010 seismic swarm, is supported by petrological, geochemical, and geophysical evidence, indicating as a possible interpretative scenario the action of shallow, temporarily trapped fluids.
1. Introduction
The Andean Central Volcanic Zone represents one of the largest updoming volcanic regions on Earth [1,2], in which almost at its center the Uturuncu volcano (southwestern Bolivia) lies (Figure 1). The magmatism of this area is the result of eastwards subduction of the Nazca oceanic plate beneath the South American continent [3,4]. In this setting, tectonic and magmatic processes have shaped the broad elevated (≈4 km) Altiplano Puna Volcanic Complex (APVC), which has been related at depth to a large continental crustal magma body known as Altiplano Puna Magma Body (APMB) [5,6,7,8,9,10].
Uturuncu volcano is a long-dormant effusive stratovolcano [11]; the volcanic edifice is a dominant morphological peak that rises for ≈6 km and covers a ≈400 km2 area. Its activity has been related to minor degassing and low-temperature fumaroles, while its products are dominated by Pleistocene dacitic lava domes and flows [9,12]; even the youngest summit lavas are excessively abraded by glaciers [13]. Geochronological analysis outcomes reveal the activity range around Uturuncu is about 10–15 Ma, with its deposits covered by 0.9–0.5 Ma lava flows; the youngest dating, and so the evidence of the last eruptive activity, is related to the 0.27 Ma summit lava dome [9].
This region was deeply studied within the PLUTONS project [14], focused on large-scale surface uplift areas through an interdisciplinary analysis [1]. Several geophysical and geochemical studies (Table 1) show evidences of a deep magma body, connected to the APMB, and of a possible shallower source: teleseismic and local receiver function analysis results highlight low-velocity zones at about 19 km [8] and 20 km [15] depth b.g.l., respectively. Seismic tomography turns out to be characterized by a deep Vp/Vs anomaly from 1–2 to 75–76 km depth [16], while about 4 to 25 km depth low-velocity zone is retrieved by seismicity and receiver function analysis [17,18,19]; vertically elongated low-density 3D structures rooted at the top of the APMB (15 km of depth) are highlighted from the gravity measurements modeling [20]. At the same time, petrological studies, besides a dacitic magma intrusion at depth major than 17 km, support the hypothesis of a shallow magma storage with a depth major than 1.5 km [9]; seismicity and ambient noise tomography show a shallow low-velocity zone [21]; several earthquakes occur at 4–6 km depth for the 2010–2012 time interval [22]; the existence of a shallow magma storage is supported by geochemical analysis [11]. Furthermore, evidence of low-resistivity zones is also emphasized by magnetotelluric data modeling. In particular, Comeau et al., [23] show a 2D regional model estimating a depth of the APMB of about 18–19 km, whereas Comeau et al., [24], by performing a 3D model, highlight the existence of two low-resistivity anomalies located at 3–5 km and 13–14 km depth, respectively. All of these studies are summarized in Pritchard et al., [1] in which the authors integrate all available information by considering the different resolutions of the discussed result.
Since 1992 the APVC area knowledge has significantly increased thanks to the exploitation of satellite Synthetic Aperture Radar (SAR) sensors [25,26,27,28,29,30,31,32,33]. The interpretation of these measurements is focused on the characterization of the APMB deep source (about 15–30 km b.s.l., Table 1): Pritchard et al., [26] study ERS satellite data between 1992–2000 to simultaneously model the deformation source as a sphere (17.3 km depth), a horizontal and vertical ellipsoid (18.8 and 18.2 km depth, respectively), a point and finite crack (25 and 12 km depth, respectively); Fialko et al., [27] proposed an ascending diapiric source, with depth > 15 km, by considering the 1992–2010 time interval; Henderson et al., [28] identified a 19–20 km depth point-spherical source by analyzing the 1992–2011 time interval; Hickey et al., [29] studied the 1996–2010 time interval by modeling the deformation source as a sphere (30.4 km depth b.g.l.), a prolate and oblate spheroid (20.6 and 32.8 km depth b.g.l., respectively); Walter et al., [30] modeled the ENVISAT satellite measurements related to the 2003–2009 time interval by considering an inflating flat-topped source at 17–18 ± 9 km depth; for the 1992–2011 time interval, Gottsmann et al., [31] suggested the use of the magmatic column source model for the APMB, with the top and bottom at 13 and 25 km depth, respectively, while Henderson et al., [32] proposed a dipole source model whose top is located at 15.4–30.4 km depth. Otherwise, Gottsmann et al., [31] and Lau et al., [33] have shown evidence of shallow sources, although their results are not directly related to a magmatic body.
Starting from the information collected by the geodetic studies, the classical procedures of the modeling seem to be suitable to investigate only the existence of the deep source related to APMB. In order to investigate the existence of a further shallower source beneath the Uturuncu volcano, we propose an alternative approach, based on the analysis of the 2003–2010 ENVISAT Differential SAR Interferometry (DInSAR) measurements. We apply two multiscale methods to investigate possible active multi-source localized at different depths. In particular, focusing on the vertical component relevant to the 2005–2008 time interval, we use the Cross-correlation analysis [34,35] and the Multiridge method [36,37] to emphasize the spatial and temporal multiscale properties of the field during the considered period.
The present study is planned as follows: we first retrieve the vertical ground deformation component by combining the DInSAR measurements acquired along ascending and descending orbits; then, we perform a spatial-temporal Cross-correlation analysis during the 2005–2008 time interval by considering two pixels, centered at the APVC and Uturuncu volcano, respectively. After, we apply the Multiridge method on the vertical component of the ground deformation patterns evaluating the depth and the horizontal location of the active sources during the considered time intervals. Finally, in order to evaluate the reliability of the performed approach, we carried out a comparative analysis between the achieved results with those proposed by other studies on this region.
2. DInSAR Measurements
In this work, we analyze the ground deformation pattern of the central zone of APVC and Uturuncu volcano, retrieved by DInSAR measurements during the 2003–2010 time interval. In particular, we estimate the vertical deformation occurring in the 2005–2008 period to perform a multiscale analysis.
We consider a catalogue of SAR images acquired by ENVISAT satellite (European Spatial Agency-ESA) sensor during the 2003–2010 time interval. In particular, we process 26 and 31 images acquired along ascending (track 89—look angle ϑ equal to 36.35°) and descending (track 282—look angle ϑ equal to 20.45°) orbits, respectively. The ENVISAT dataset was processed by using the online Parallel—Small BAseline Subset (P-SBAS) web tool available within ESA’s Grid Processing On Demand (G-POD) environment, which is within the framework of ESA’s Geohazards Exploitation Platform (GEP) [38,39]. In detail, we perform 76 and 89 interferograms for the ascending and descending orbits, respectively. The P-SBAS results from ENVISAT data were spatially averaged (i.e., multilooked) to obtain a pixel size of approximately 80 m by 80 m on the ground. The use of the SBAS approach [40,41] allows retrieving the spatial-temporal evolution of the Earth’s surface deformation, since its results provide the mean deformation velocity maps and the corresponding time-series for each coherent pixel.
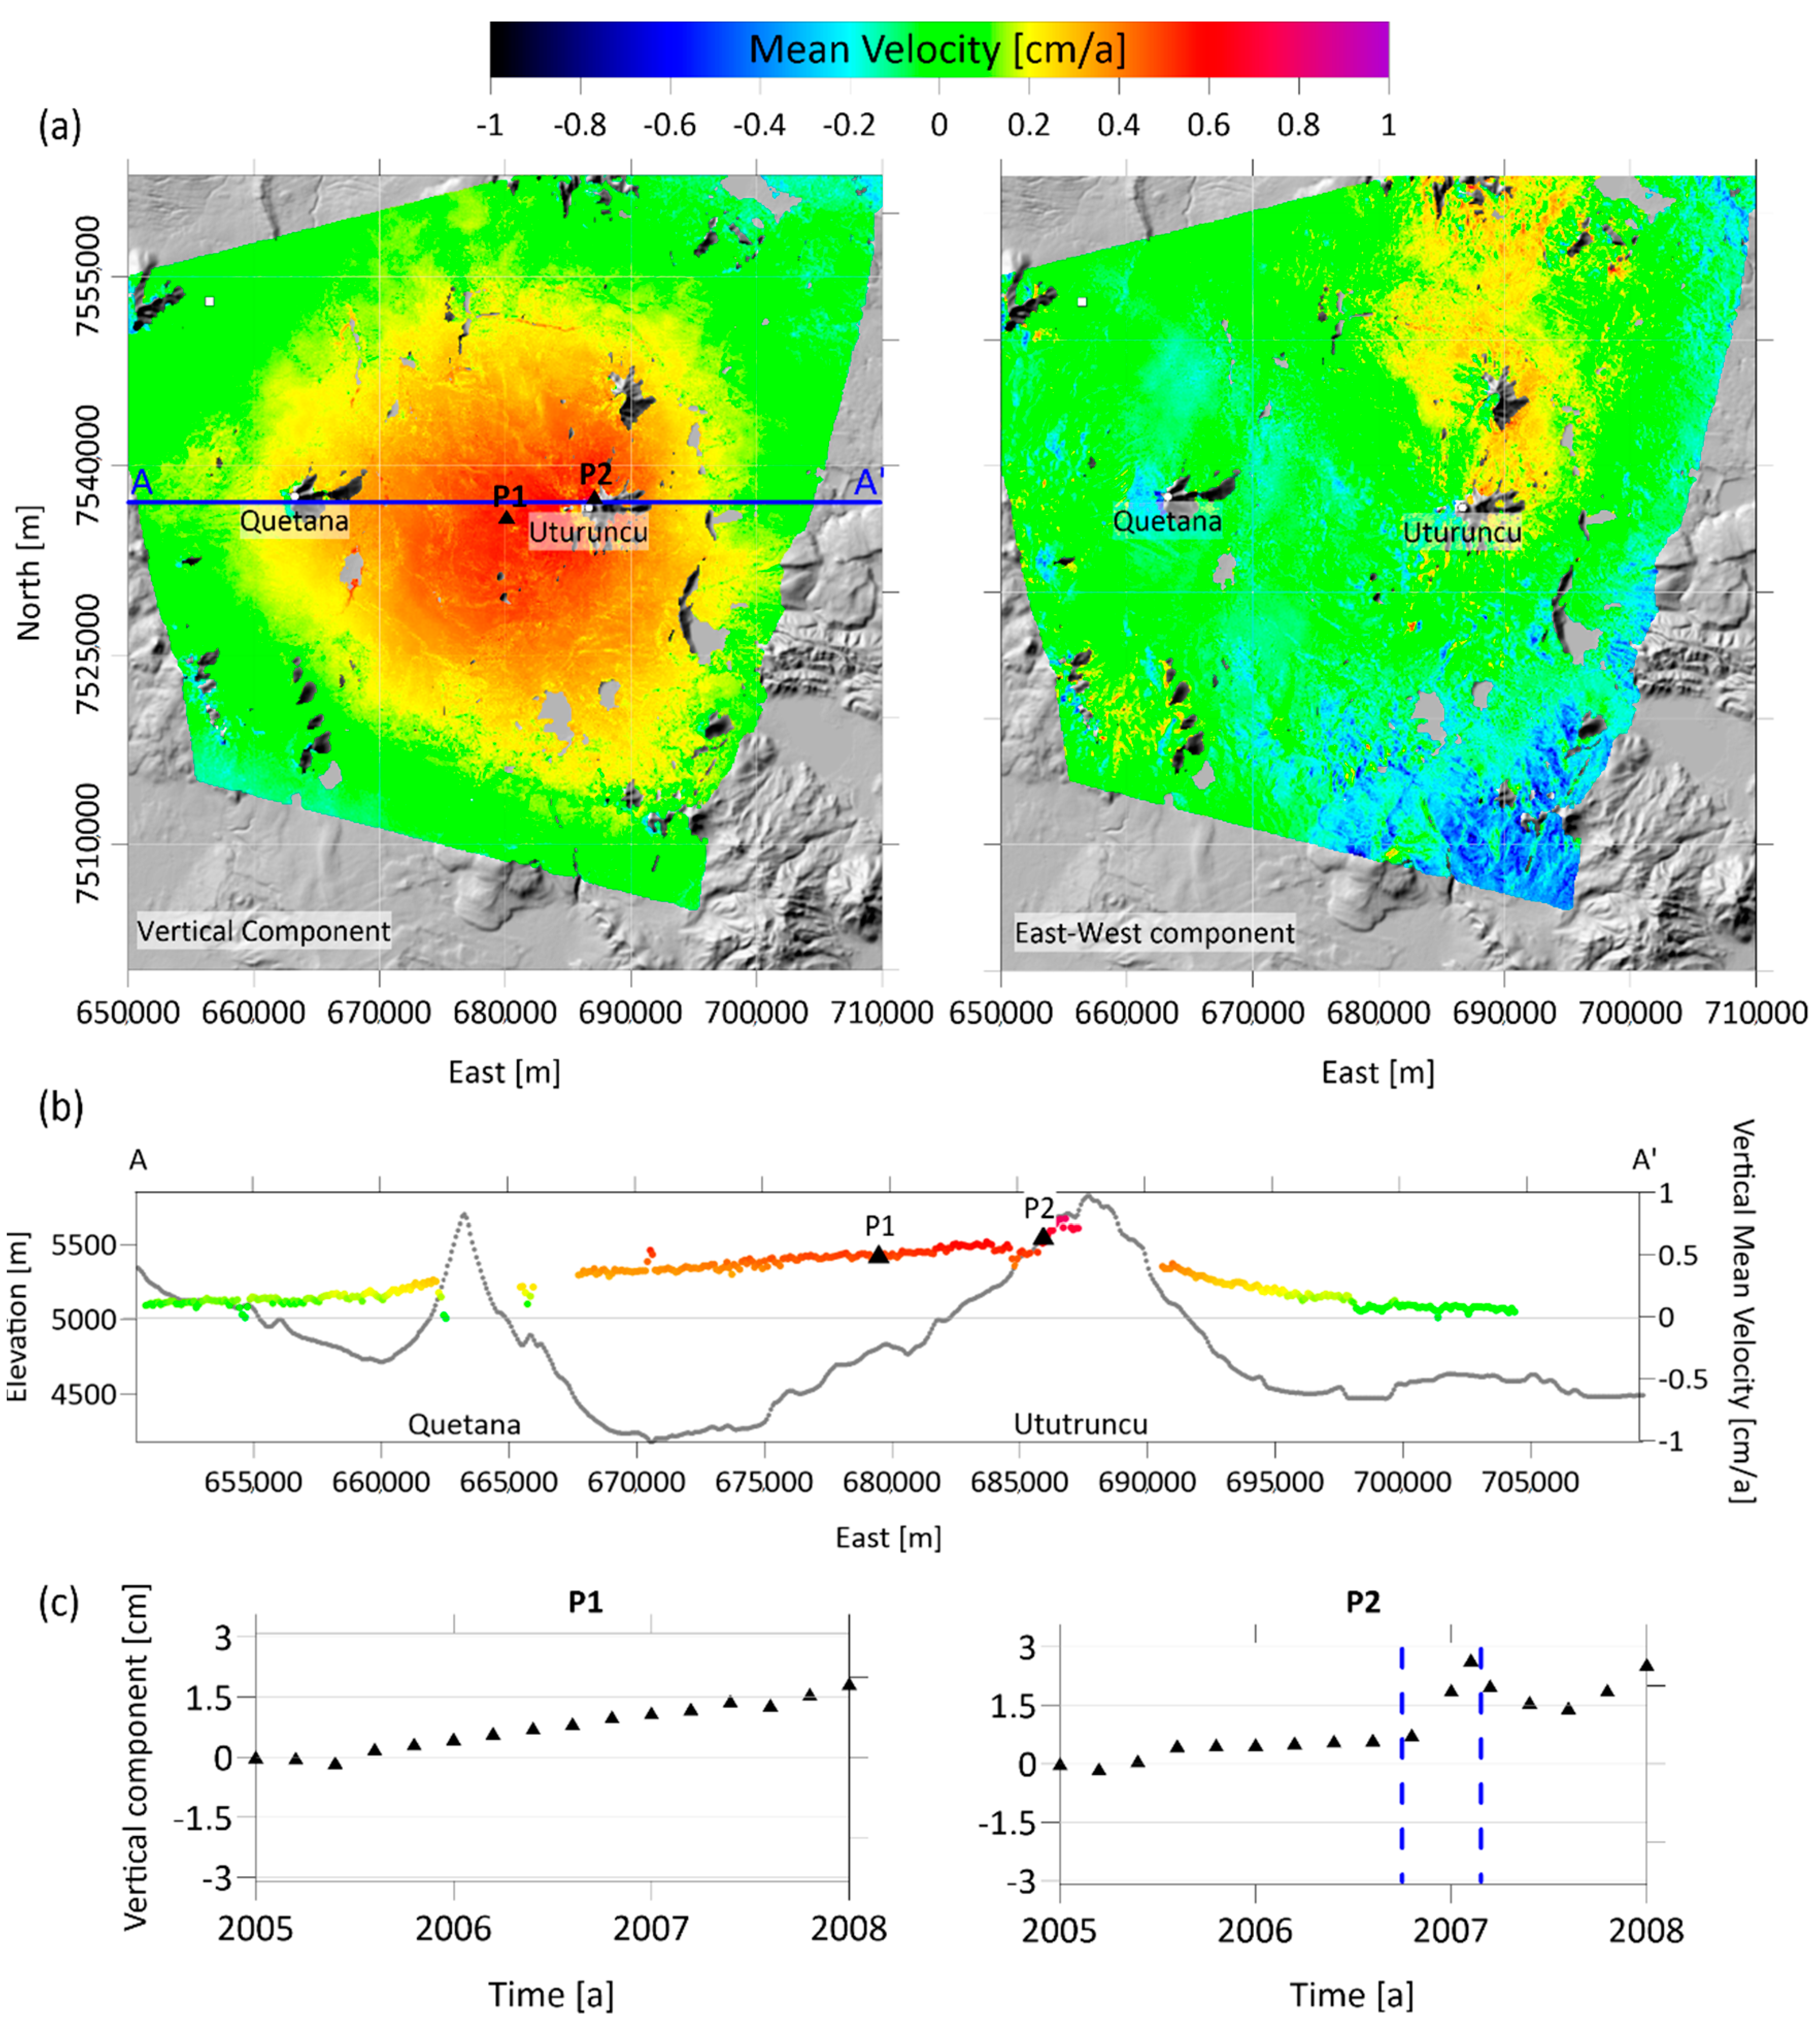
The Line Of Sight (LOS) mean velocity maps, both along ascending and descending orbits (Figure 1a), show the deformation phenomenon of a wide area (about 900 km2) in the APVC zone, with maximum velocity values ≈0.6–0.8 cm/a. The 2003–2010 LOS time-series of two selected pixels (black solid triangles in the Figure 1a) are reported in Figure 1b; the P1 pixel, almost localized at the center of the APVC area (Easting 680,650 [m], Northing 7,535,580 [m]—UTM WGS84 coordinate system), shows a quasi-linear deformation trend; the P2 pixel, localized at Uturuncu volcano (Easting 687,460 [m], Northing 7537,700 [m]—UTM WGS84 coordinate system), shows a long-term deformation trend with an unrest episode between August 2006 and February 2007. The time-series of the selected coherent pixels are representative of their surrounding zone deformation behavior.
Subsequently, in order to estimate the vertical and East-West components of the ground deformation field, we combine the LOS DInSAR measurements along ascending and descending orbits [42]; only the coherent pixels in both ascending and descending mean velocity maps have been combined and, since both images are acquired at different times, the time-series are resampled via linear interpolation to common constant sampling interval before applying the combination procedure. This operation is possible since nonlinear deformation events, such as eruption or earthquake, occur within the temporal sampling. We specify that by comparing the temporal sampling between the measurements acquired along ascending and descending orbits, we restrict our analysis to the 2005–2008 time interval (light red rectangle in Figure 1b) since a similar sampling both for ascending and descending LOS displacements is observed.
The retrieved vertical mean velocity map relevant to 2005–2008 time interval (left in the Figure 2a) shows a wide uplift zone at APVC, with maximum velocity values ≈0.6–0.8 cm/a, while the East-West component (right in the Figure 2a) does not display a relevant pattern. The AA’ profile (blue continuous line in Figure 2a) of vertical velocity, is reported in Figure 2b and highlights a high deformation rate of the Uturuncu volcanic edifice. This result is also confirmed by the analysis of the vertical deformation time-series at P1 and P2 pixels (Figure 2c), revealing the existence of two different deformation trends: the first one is characterized by a quasi-linear uplift trend for the entire 2005–2008 time interval, while the second one reveals an abrupt change of the long-term uplift deformation, showing a higher rate during the August 2006–February 2007 time interval (marked by the blue dashed lines in the Figure 2c).
3. Multiscale Methods
In this work, we apply the Cross–correlation analysis and Multiridge method for the multiscale study of the retrieved 2005–2008 cumulative vertical ground deformation. In detail, we use these methods to discriminate: (i) the different ground deformation pattern contributions and (ii) the depth and horizontal location of sources, avoiding the interference effects between their signals [36,43].
3.1. Cross-correlation Analysis
We perform a spatial-temporal Cross-correlation analysis for the vertical deformation time-series in the 2005–2008 time interval. This method represents a typical example of scale invariant methodology because it allows for analyzing the ground deformation pattern at different scales of space and time. Specifically, this technique has been already exploited for the analysis of deformations occurring in volcanic context, discriminating the magmatic and regional contributions on the ground deformation pattern, which generally coexist in a volcanic environment [35,44,45]. This analysis allows individuating a cluster of pixels having the same behavior over time of an a-priori selected pixel. To this purpose, the definition of the correlation coefficient threshold is required [34].
3.2. Multiridge Method
The Multiridge [36] method is a multiscale technique of the potential field, based on the detection of the extrema of the considered field, and of its derivatives, also called edges. In particular, the ridges, defined as the lines passing through the edges related to different spatial scales, intersect at the source center, and so the method allows for investigating about the depth and the horizontal position of sources from the ridges analysis of the field [46]. The method is stable, performs a high-resolution analysis and allows the separation of interfering contributions, which are common in a multi-source case [43]. Moreover, it does not require any a priori information about the source type. The Multiridge method consists of: (i) creation of a multiscale dataset by performing upward continuation [47,48]; (ii) edges search at different spatial scales [36]. Then, a linear regression through each set of detected edges allows the definition of the source position at the intersection of more ridges in the source-region. We specify that each ridge is determined by a best-fit linear regression within a 95% confidence interval; in particular, we calculate the determination coefficient R2, which represents a statistical measure of how the selected data (edges) are close to the fitted regression line (ridges). Moreover, we evaluate the solution uncertainties (intersection at the ridges) by considering the error on the best-fit linear regression coefficients (intercept and slope constants) [37].
Regarding the deformation case, Castaldo et al. [37] have exploited the physical properties of deformation fields, showing how to apply the Multiridge method to detect Mogi’s kind of source [49] by DInSAR measurements. Indeed, the proposed methodology has already been used to investigate the inflation source responsible for the 2003–2004 Okmok volcano (Alaska-USA) LOS ground deformation pattern, verifying its validity: its results do not depend on the physical property parameters, such as elastic modula or source pressure changes. Moreover, the achieved results are stable with respect to the high-frequency noise in the dataset [37].
4. Results
In this section, we show the results achieved by the use of the multiscale methods to the APVC and Uturuncu of the ground deformation field. We perform the Cross-correlation analysis on the cumulative vertical ground deformation that occurred during the 2005–2008 period (Figure 3), and then, we analyze the vertical gradient of the vertical deformation component occurring at the central zone of APVC during the 2005–2008 time interval (Figure 4a) and the vertical deformation component at Uturuncu volcano from August 2006 to February 2007 (Figure 5a). To apply the Multiridge method, we perform for each dataset the constant reduction level procedure [37], whose level, in this case, is equal to 6 km a.s.l.. Appendix A describes this procedure and the vertical gradient transformation (Figure A1 and Figure A2).
4.1. Cross Aorrelation Analysis of 2005–2008 Time Interval
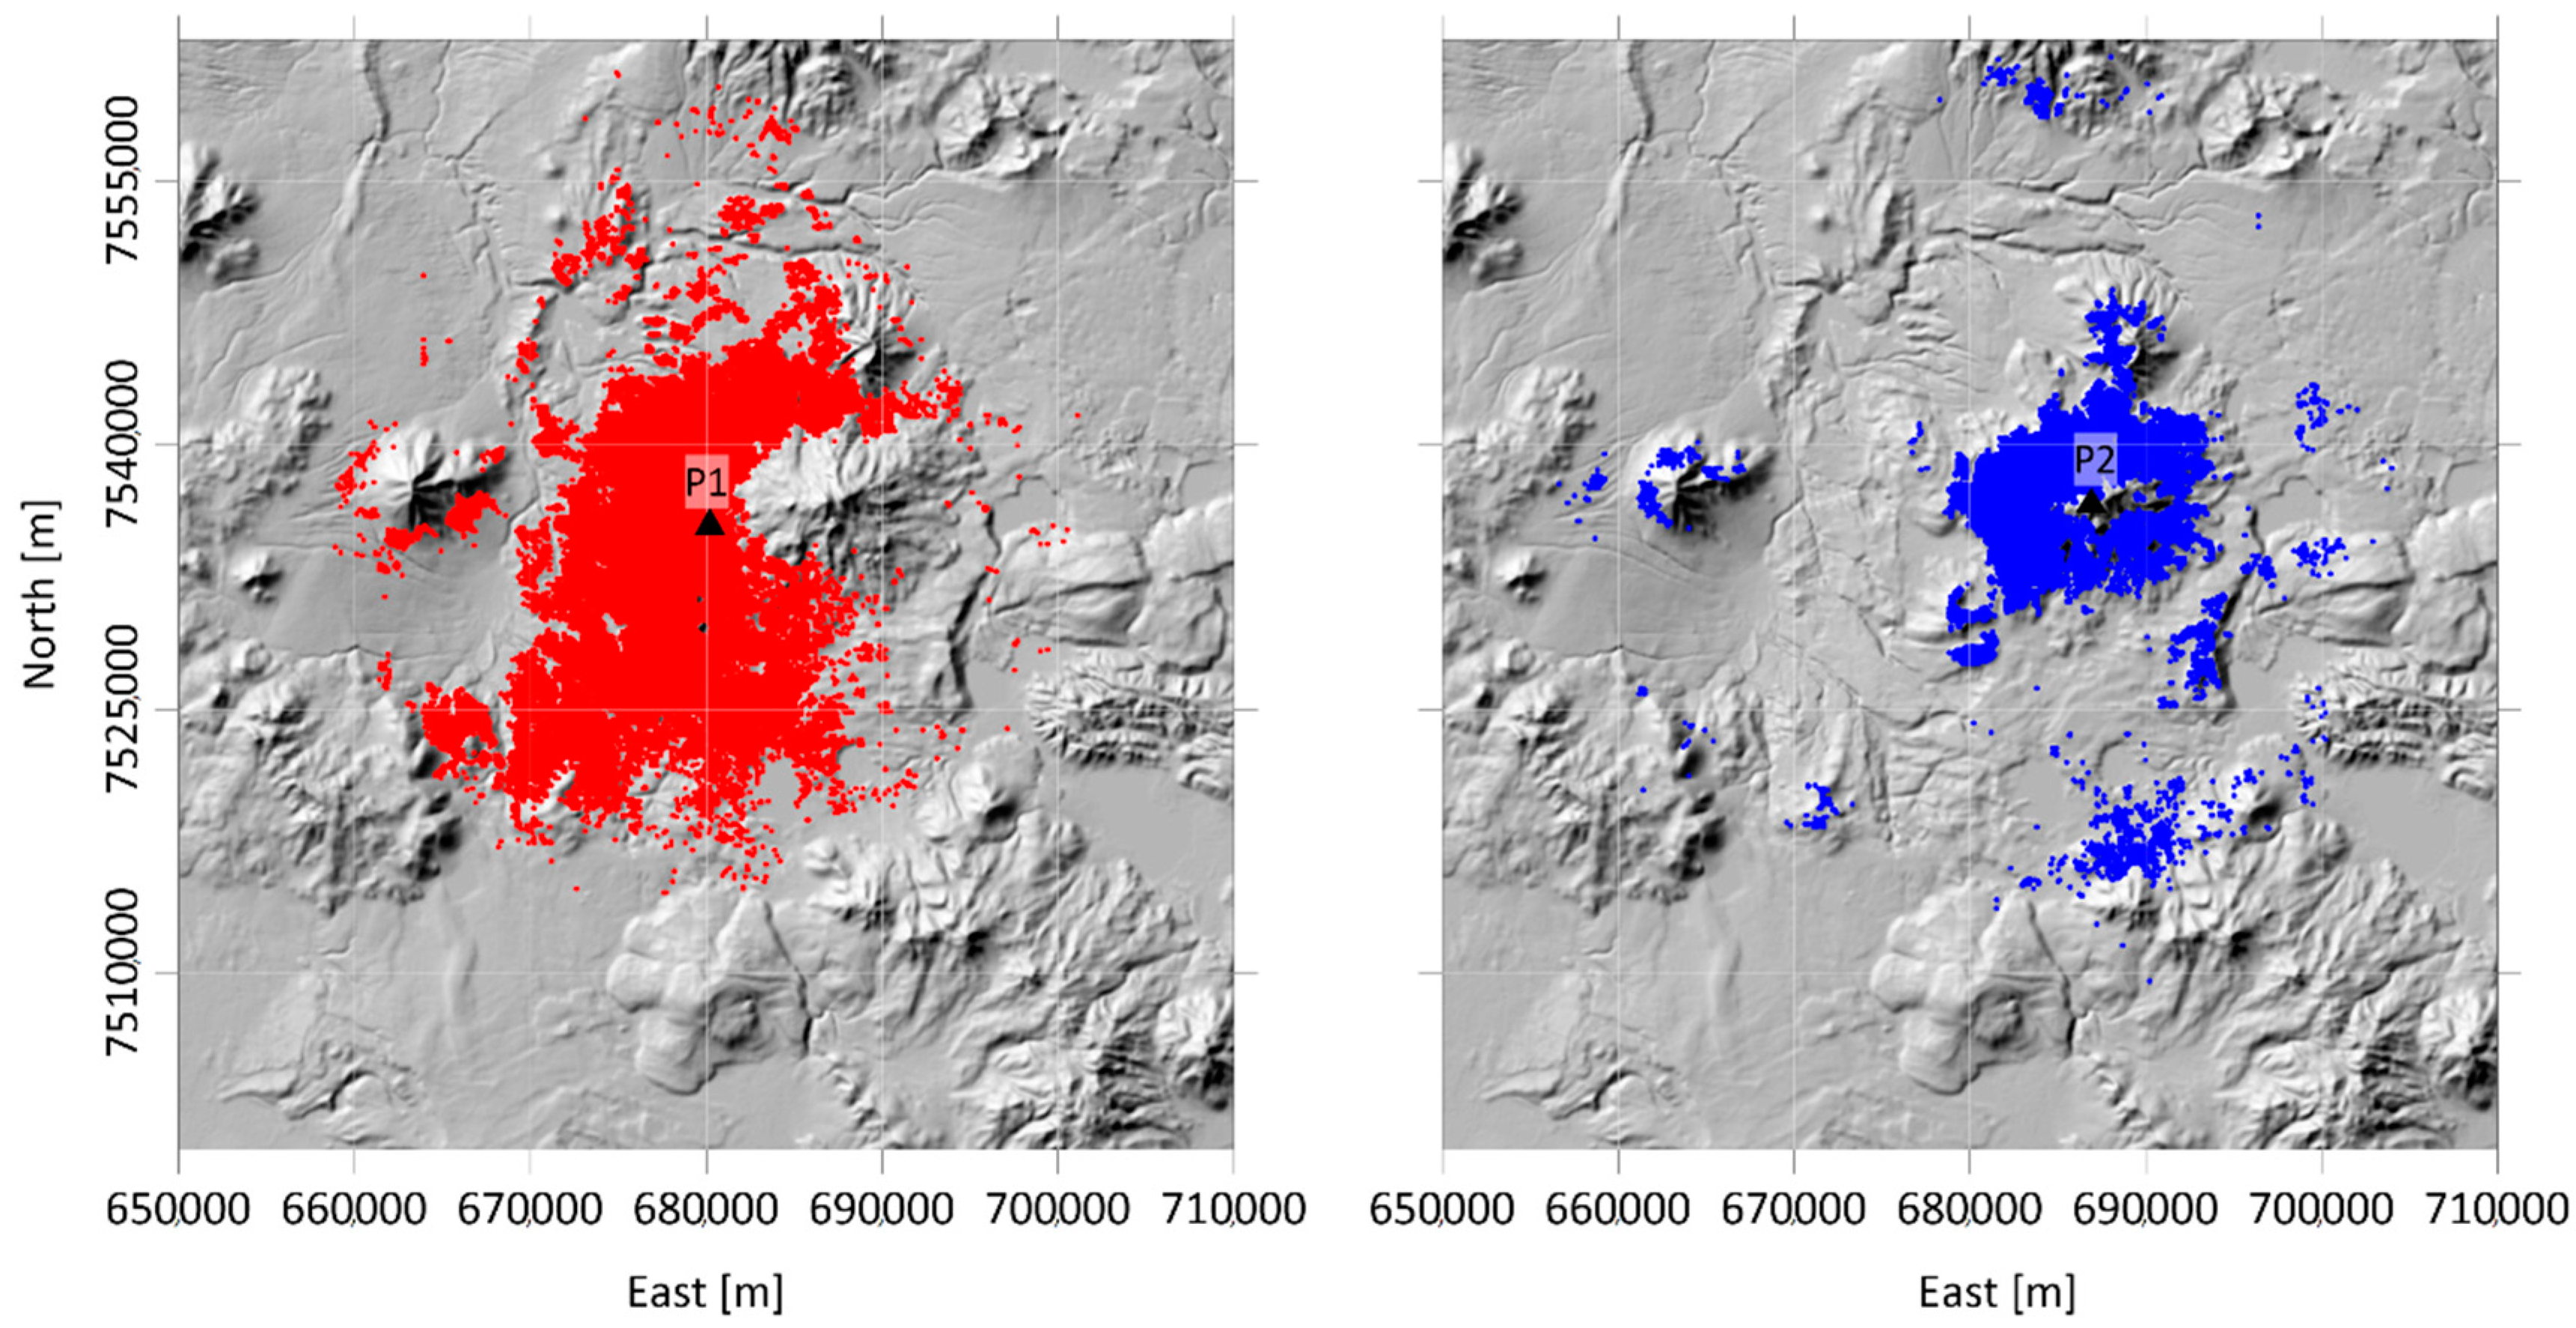
We carry out this analysis by evaluating the correlation coefficients with respect to P1 and P2 deformation time-series, setting as lower threshold a value of 0.97. These results, reported in Figure 3, show that a large number of pixels, covering the central part of APVC, are characterized by the same deformation trend observed at P1 (red solid circles at the left of Figure 3), while the Uturuncu volcano area is entirely interested by the same deformation trend recorded at P2 (blue solid circles at the right of Figure 3). The performed Cross-correlation analysis highlights the existence of two distinctive areas with different temporal deformation behavior that gives us further evidence supporting the multi-source scenario.
4.2. Multiridge Analysis of 2005–2008 Time Interval
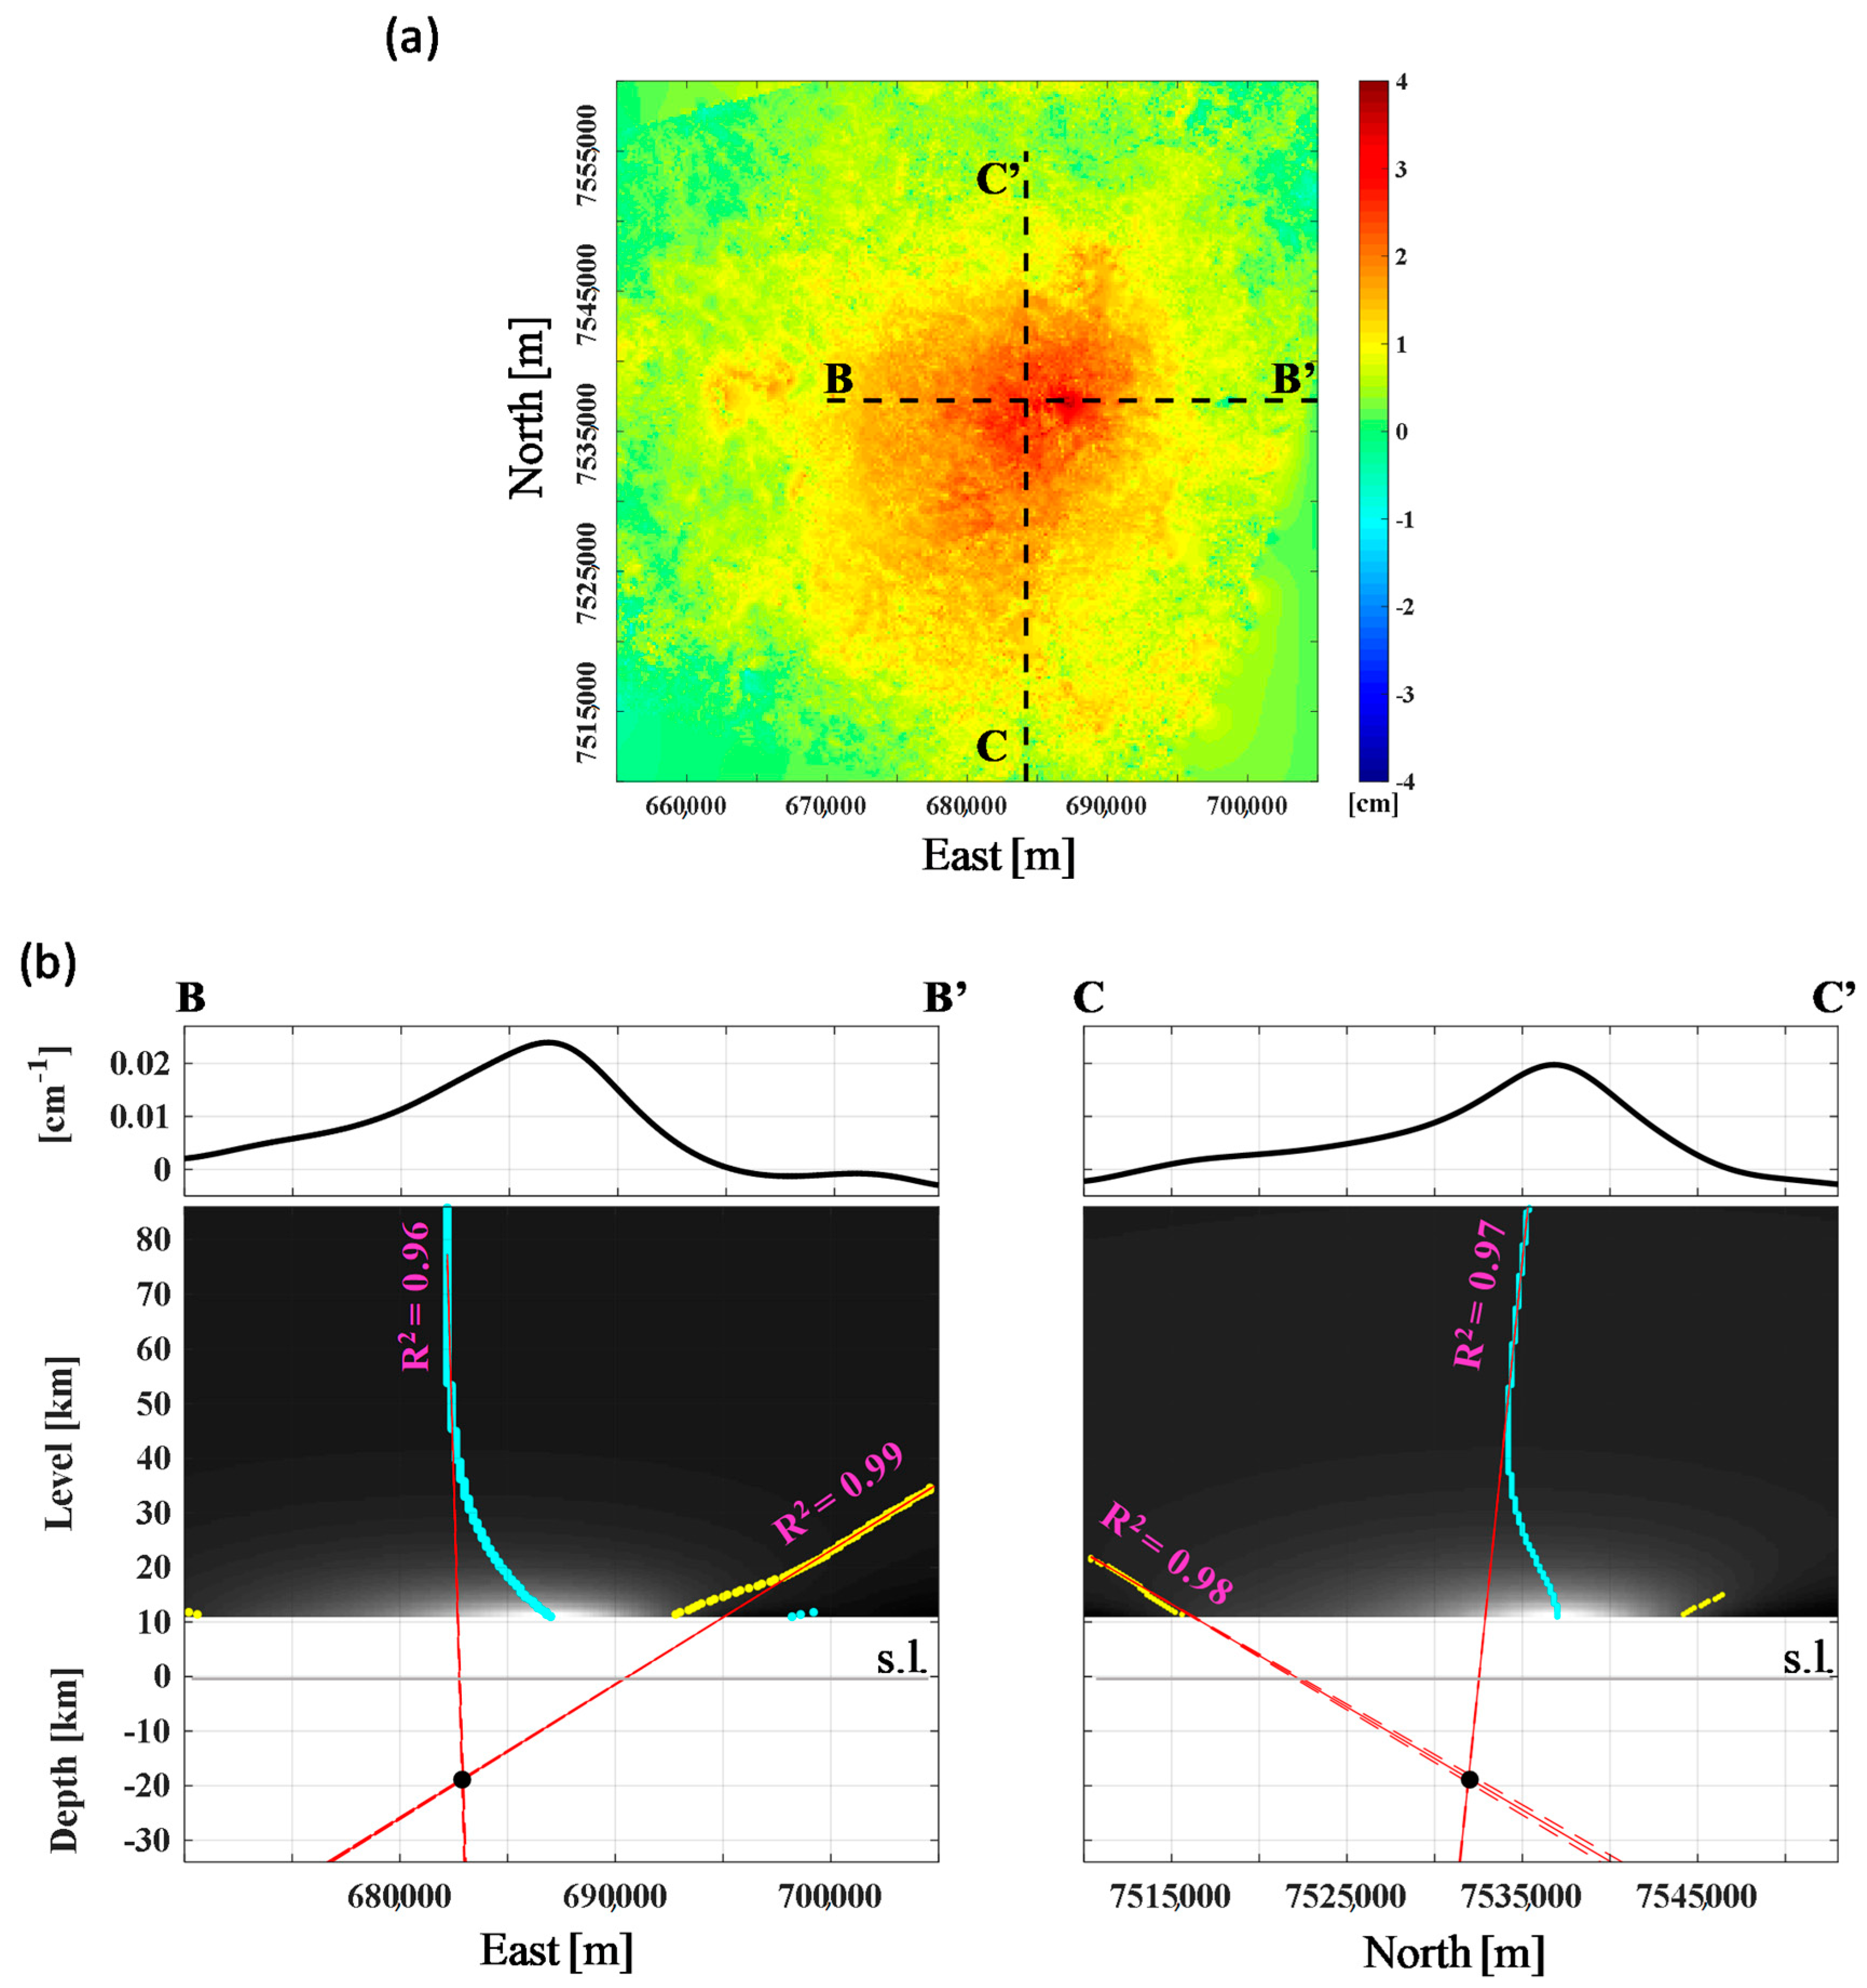
The 2005–2008 cumulative vertical deformation, reported in Figure 4a, appears as a very long wavelength signal, covering a wide ground area. We apply the Multiridge method to the vertical gradient of the cumulative deformation by considering mostly the edges related to high-scales. In this context, we exploit the vertical gradient operator (Appendix A) because it increases the signal resolution due to different interfering components, and so it can represent an important tool to solve multi-source cases. Furthermore, we take into account the edge region at the high scales since they are related to the contribution of the deep source (i.e., long wavelength), while we do not treat the edges regarding the low-scales, even avoiding the ridges portion affected by other signal interference effects, probably due to a contribution of high frequency noise and/or a shallower source.
We show the inferred results by considering the E-W and N-S profiles (black dashed lines in Figure 4a), passing through the maximum of the deformation field. In particular, from both cases, the depth and the horizontal position of the active source are detected at two-ridges intersection (Figure 4b): from the BB’ profile analysis (along the E-W direction), we deduce a depth value equal to −18.7 ± 0.3 km at the point with East UTM coordinate equal to 682,800 ± 200 m (left in the Figure 4b), while, by analyzing the CC’ profile (along the N-S direction), we infer a −18.7 ± 0.8 km depth at the point with North UTM coordinate equal to 7532,300 ± 200 m (right in the Figure 4b).
4.3. Multiridge Analysis of August 2006–February 2007 Time Interval
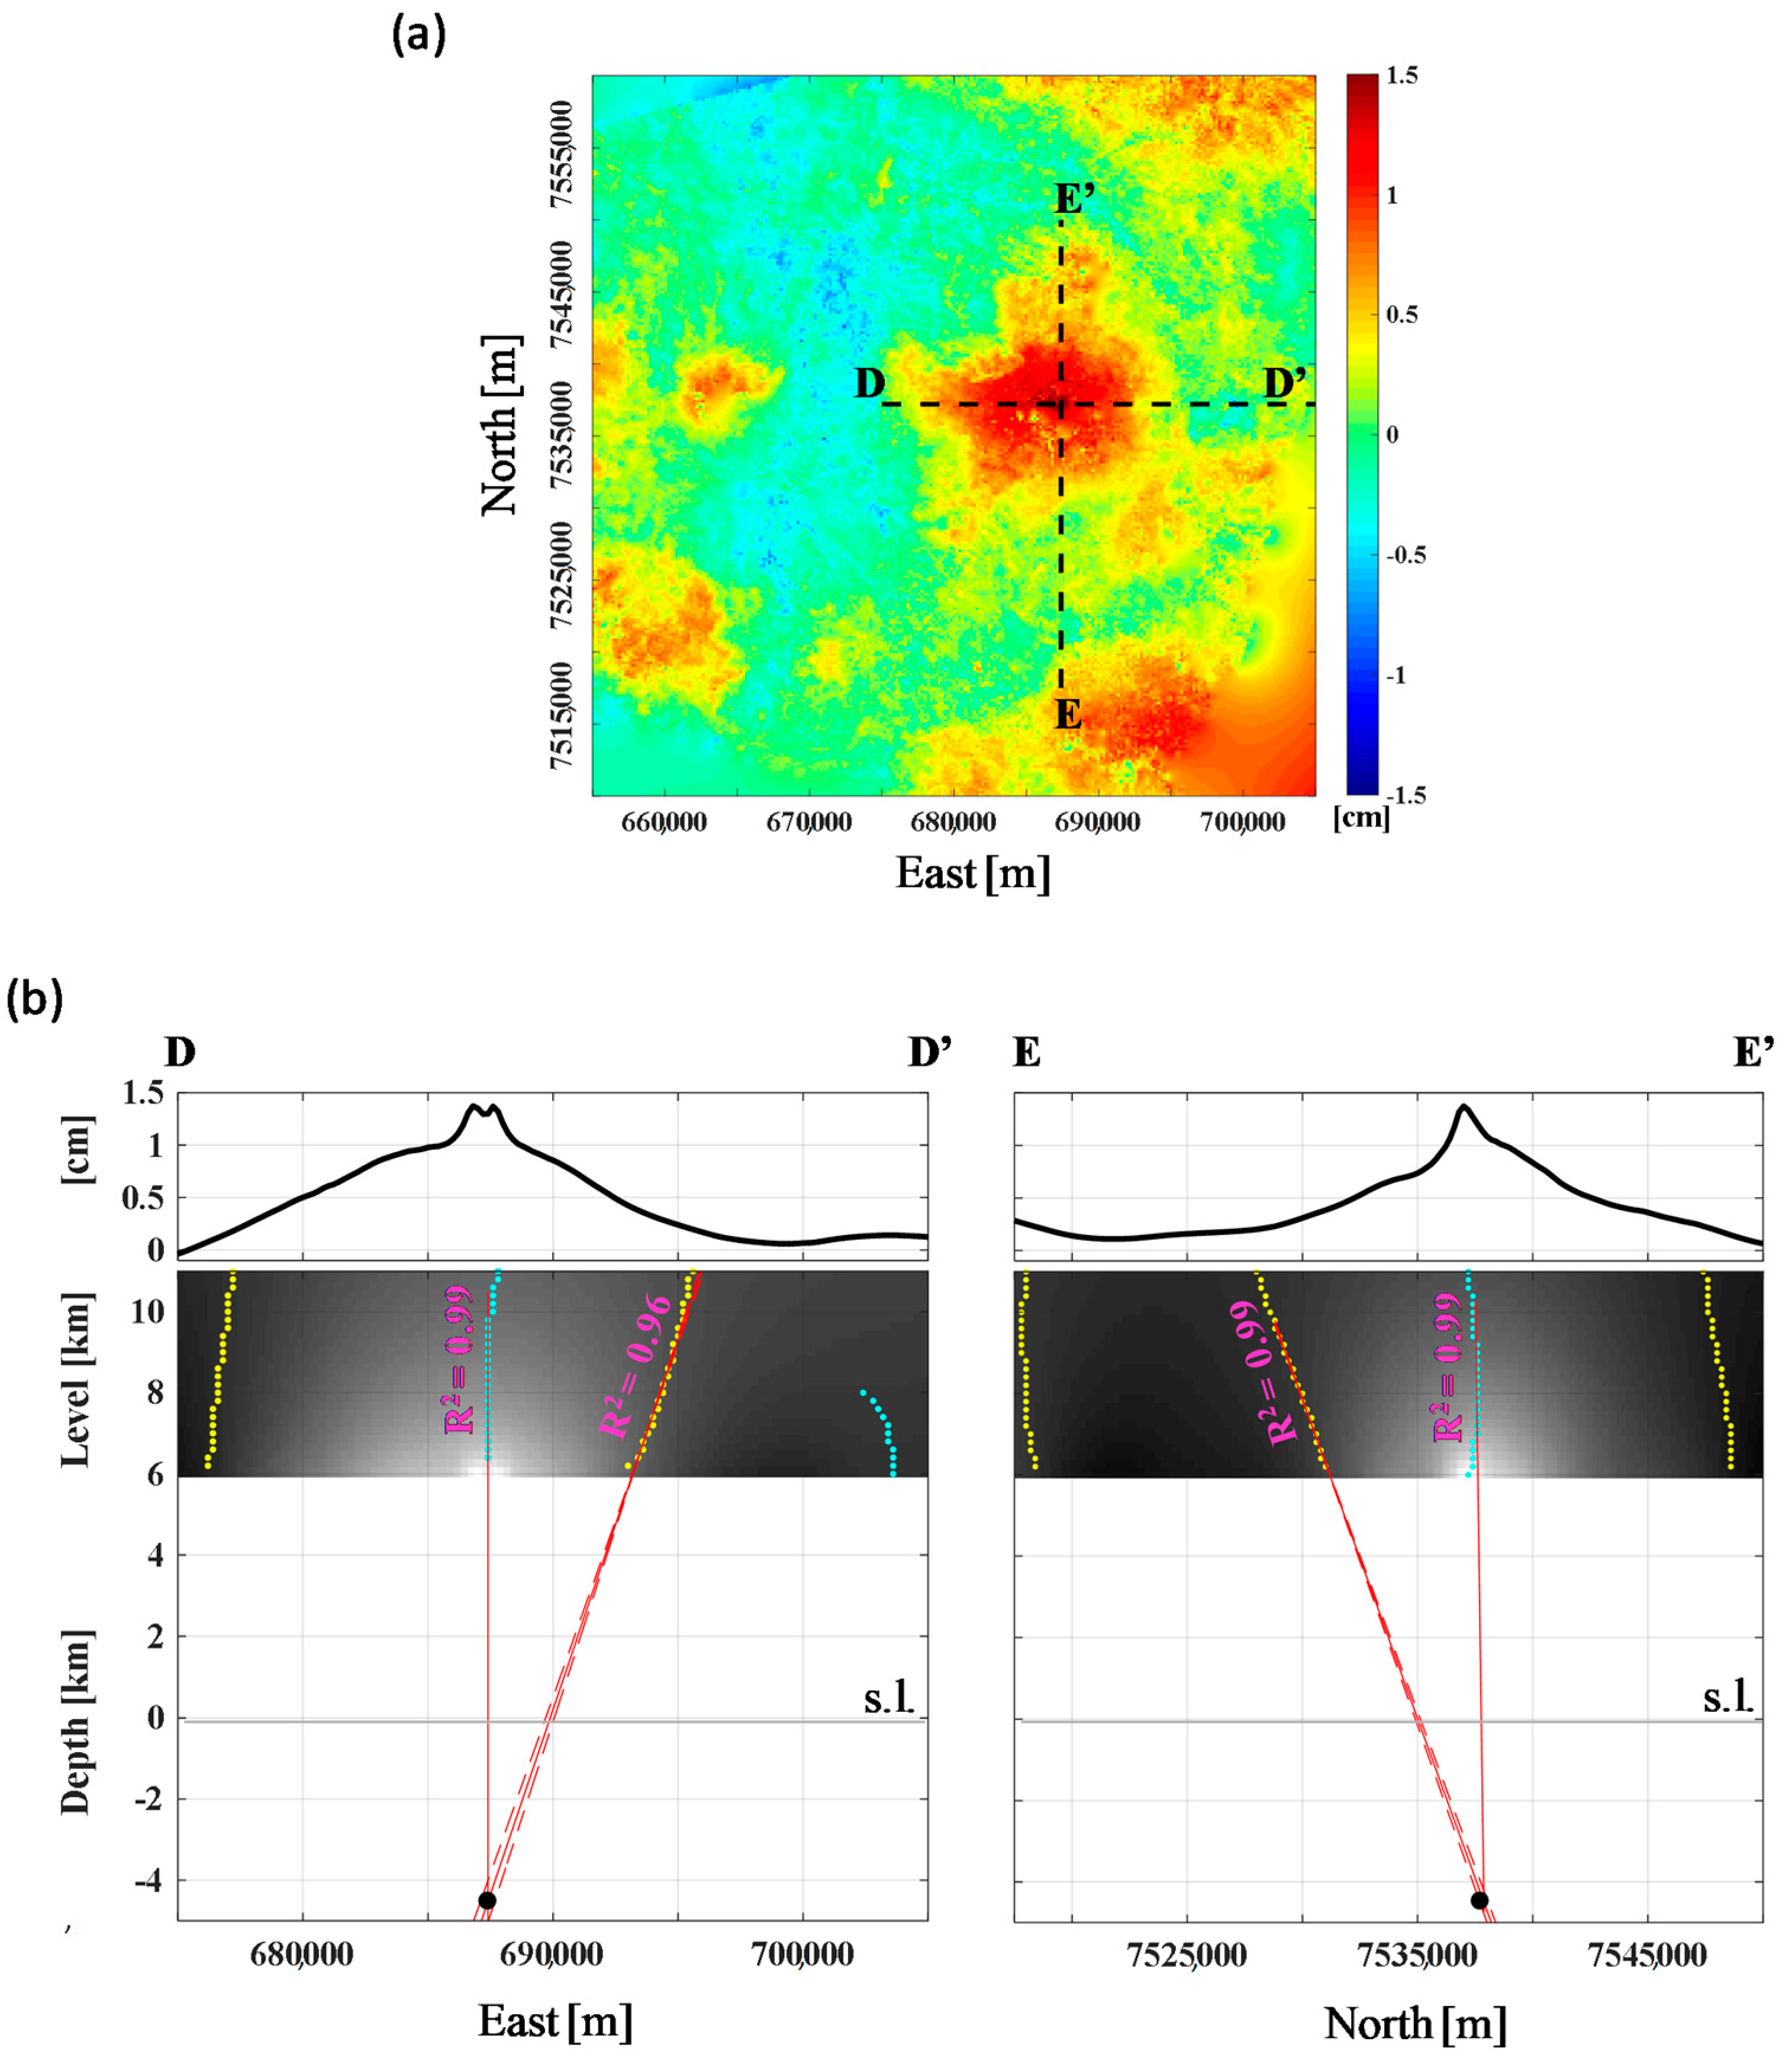
The August 2006 and February 2007 cumulative vertical deformation (Figure 5a) appears as a shorter wavelength signal, well centered at Uturuncu volcano, and it should not be affected by long wavelength-signal interference effects. Unlike the previous case, we apply the Multiridge method directly to the cumulative vertical deformation, avoiding an increase of the high-frequency contributions and considering the low scale edge region.
In Figure 5b, we show the retrieved results by considering E-W and N-S profiles (black dashed lines), passing through the volcano edifice center. In particular, for both cases, the depth and the horizontal position of the active source are detected at two-ridges intersection (Figure 5b): from the DD’ profile analysis (along the E-W direction), we infer a depth value equal to −4.5 ± 0.5 km at the point with East UTM coordinate equal to 687,400 ± 500 m (left in the Figure 5b), while, by analyzing the EE’ profile (along the N-S direction), we deduce a −4.5 ± 0.3 km depth at the point with North UTM coordinate equal to 7537,800 ± 200 m (right in the Figure 5b).
5. Discussion
The results retrieved by the application of multiscale analysis of DInSAR measurements support the hypothesis of a multi-source scenario for APVC and the Uturuncu volcano region. First evidence has been provided by the mean vertical velocity field (Figure 2a,b), which highlighted a higher deformation rate at Uturuncu in respect to the pattern measured at the APVC; indeed, different deformation trends are shown by P1 and P2 time-series (Figure 2c), located at the center of APVC and the Uturuncu volcano, respectively. Specifically, the APVC area is characterized by a quasi-linear vertical deformation trend, while the P2 time-series points out a higher vertical velocity pattern between August 2006 and February 2007.
The Cross-correlation maps (Figure 3) remark the existence of two areas with different vertical deformation behavior both in space and time, providing further evidence of a multi-source scenario.
Subsequently, we have used the Multiridge method to investigate the sources responsible for the observed DInSAR measurements, detecting their depths and horizontal positions, although it does not provide information about the source type and volume. This multiscale method is also very suitable for the considered volcanic site, in which different deformation phenomena are observed in the analyzed time period. It allows for the exploitation of spatial and temporal multiscale properties of the observed deformation field, so as to discriminate the contributions related to sources located at different depths. In this case, the use of the vertical gradient for the analysis of the 2005–2008 time interval allowed a significant reduction of the interference effects. Accordingly, the results are stable with respect to high-frequency noise.
The findings about the sources location provided a better characterization of the volcanic scenario; in particular, we retrieved a depth of 18.7 ± 0.8 km (Figure 4), and we identified a shallow source, beneath the Uturuncu volcano, at a depth of 4.5 ± 0.5 km (Figure 5). To interpret our geodetic results, we took into account other information about the volcanic system configuration.
Regarding the deep source, we interpreted the retrieved result as referring to the APMB deformation source. To support our interpretation, we compared our results with those achieved by other works. In particular, the retrieved depth values and horizontal position about the APMB source are in agreement with the findings of several geodetic models, based on DInSAR measurements (Table 2 and Figure 6) [26,27,28,29,30,31,32], as well as with petrological observations [9] and geophysical studies [1,8,15,16,17,19,20,23,24].
Most of the studies based on the classical procedure of geodetic modeling examine only the existence of a deep source (Table 2 and Figure 6), although Gottsmann et al., [31] and Lau et al., [33] suppose the existence of a shallow hydrothermal temporarily active system beneath Uturuncu volcano. Accordingly, our approach reveals a transient inflating shallower source, characterizing the August 2006–February 2007 unrest event. The retrieved source location (depth 4.5 ± 0.5 km) matches with the interpretation of a hybrid system beneath Uturuncu volcano, formed by an igneous mush and fractured plutonic complex through which exsolved fluids migrate toward the surface. These fluids, being temporarily trapped, could cause an overpressured reservoir and uplift phenomenon [1,31]. In addition, the proposed interpretation is in accordance with the existence of a low resistivity zone at this depth, explained by saline fluids of magmatic and/or meteoric origin [23,24], and with the shallow anomaly achieved by geophysical and petrological data analysis [1]. Moreover, the shallow overpressured source is located just beneath the cluster of the seismicity between 4 and 6 km of depth b.g.l. that occurred during the 2009–2010 time interval [1,21].
Finally, we remark that the proposed multiscale analysis can be extended to other volcanic contexts to study the geometrical features of the geodetic sources, or to investigate multi-source scenarios for which deformation patterns are contemporary/intermittently revealed.
6. Conclusions
We summarized our findings as follows:
- The DInSAR measurements retrieved through ENVISAT satellite data during the 2003–2010 time interval show two different deformation trends for APVC and Uturuncu volcano region, as highlighted by the analyzed pixels (i.e., P1 and P2 time-series). In addition, the vertical and East-West components are retrieved by combining the data acquired along ascending and descending orbits.
- The results of the Cross-correlation analysis, performed on the vertical component of the ground deformation between 2005 and 2008, reveal that a large number of pixels, covering the central part of APVC, are characterized by the same deformation trend observed at P1, while the Uturuncu volcano area is entirely affected by the same deformation trend recorded at P2.
- The Multiridge method allowed us an investigation on the multi-source scenario responsible for the observed deformation patterns at APVC zone and Uturuncu volcano, providing their depths and horizontal positions. This methodology is different from the methods currently used to model the ground deformation sources. It does not require any assumptions about the source type, and it is not influenced by the distribution of medium elastic parameters or the presence of high-frequency noise in the dataset. However, it does not provide information about the source type and its volume.
- The estimated inflating deep source at 18.7 ± 0.8 km depth, active during the focused time interval beneath APVC, is in agreement with those proposed by several authors regarding the APMB. A further inflating shallow source at 4.5 ± 0.5 km depth is identified between August 2006 and February 2007 beneath Uturuncu volcano, whose existence is supported by petrological, geochemical, and geophysical information about the reservoir.
- The existence of this transient shallow source, located just beneath Uturuncu volcano, allows comparing, for the first time, the geophysical information at that depth with those retrieved from the geodetic study, suggesting the active role of the hydrothermal system for 2006–2007 observed uplift phenomenon.
- The combined analysis of our results with the geophysical and petrological evidence confirms, as an interpretative scenario, a deep volcanic reservoir and shallow hydrothermal system beneath APVC zone and Uturuncu volcano, respectively.
Author Contributions
A.B. and R.C. conducted and conceived the experiments. All the authors have analysed the results and wrote the manuscript.
Funding
This research received no external funding.
Acknowledgments
This work has been partially supported by DTA.AD004.065.001 Geophysics Project CNR_PDGP 2016–2018, by the Italian agreement IREA-MISE DGS UNMIG. The DEM of the investigated zone is acquired through the SRTM archive. The ENVISAT data have been provided by ESA.
Conflicts of Interest
The authors declare no conflict of interest.
Appendix A
In this section, we report two synthetic tests showing the effectiveness of the operations used for the processing of the deformation field. The use of the proposed techniques has been already discussed by Castaldo et al. [37] for the analysis of Mogi’s source model. In this study, we consider an over-pressurized oblate spheroidal model (ΔP = 0.2 MPa), located at 15 km of depth, and with semimajor and semiminor axes extended for 5 and 1 km, respectively. The elastic half-space is characterized by a shear modulus and Poisson’s coefficient equal to 1 GPa and 0.25 (-), respectively. We remark that the following tests have been performed on the vertical component of the synthetic deformation field.
The first test refers to the constant reduction level procedure. Since the Multiridge method is based on a level-to-level algorithm, and the ground deformation field is measured on the topographic surface (which is generally detailed), the dataset must be processed to numerically generate a ground deformation field that could have been measured in the case of constant distance between the source and the measurement surface [37]. Thus, to relocate the analyzed field onto the constant reduction level, we use the CWT-domain algorithm [50]. In particular, to validate this procedure, we firstly calculated the modeled vertical deformation measured on the detailed measurement surface of the Uturuncu volcano topography (Figure A1a); we processed the latter by applying the constant reduction level procedure, which level is chosen to be at 6 km a.s.l. (Figure A1b). Then, we computed the modeled vertical deformation measured directly on a flat measurement surface at 6 km a.s.l. (Figure A1c) and, finally, we compared both the processed (blue continuous line in the Figure A1d) and the computed (red continuous line in the Figure A1d) vertical components referring to the same distance between the source and the measurement surface. This test shows how the employed procedure provided results in agreement with the expected ones.
![Remotesensing 11 00703 g0a1]()
Figure A1.
Constant reduction level procedure test. (a) Modeled vertical deformation measured on the ground surface of Uturuncu volcano; (b) Results of the constant reduction level procedure (cm) applied on (a); the constant reduction level is chosen to be at 6 km a.s.l.; (c) Modeled vertical deformation (cm) measured on a flat level at 6 km a.s.l.; the black dashed lines represent the traces passing from the maxima; (d) Black, blue and red profiles extrapolated from (a–c), respectively, along the above mentioned traces.

The second test refers to the vertical gradient operator that is commonly used for potential field interpretation [51,52,53,54,55,56].
Consider a coordinate system where the x- and y-directions are represented by the North-South and East-West directions, respectively, and the z-axis is definite and positive downward; the vertical gradient is mainly based on the difference between fields measured at the same x- and y-positions, but at different z-level. Since our ground deformation measurements refer to the Earth’s surface, following the same argumentations proposed by Castaldo et al. [37], we consider the vertical gradient to be the difference between the fields produced by the same source located at infinitesimally different depths, divided by the depth difference. Specifically, we compute the vertical gradient by using the vertical deformation component produced by the same source at ∓ 0.05 km with respect to the referred depth (i.e., 15 km) (Figure A2a).
For harmonic functions we may define the vertical gradient in the frequency-domain [36]. In detail, the nth-order vertical gradient is given by [48,57]:
where A(k) represents the signal amplitude, k are wavenumbers, n is the order of differentiation. The nth-order vertical gradient of the deformation field is finally retrieved by substituting A(k) with A’(k) and anti-transforming the so obtained Fourier transform of the deformation field back to the space-domain.
Here we apply the same transformation to the deformation field produced by the oblate spheroid model above-described (Figure A2b). In Figure A2c, we show the results along a profile passing from the vertical gradient maxima (black dashed lines in Figure A2a,b): the used procedure in the frequency-domain (Figure A2b and blue continuous line in the Figure A2c) provides well-approximated results within the 5 % root mean square error, in respect to the vertical gradient computed in the space-domain (Figure A2a and red continuous line in the Figure A2c).
Figure A2.
Vertical gradient operation test. (a) Results of the vertical gradient of the modeled vertical deformation (cm) calculated in the space-domain, and (b) those retrieved by performing the same transformation in the frequency-domain; the black dashed lines represent the traces passing from the maxima; (c) Red and blue continuous lines represent the vertical gradient values computed in the space- and frequency-domain, respectively.

References
- Pritchard, M.E.; de Silva, S.L.; Michelfelder, G.; Zandt, G.; McNutt, S.R.; Gottsmann, J.; West, M.E.; Blundy, J.; Christensen, D.H.; Finnegan, N.J.; et al. Synthesis: PLUTONS: Investigating the relationship between pluton growth and volcanism in the Central Andes. Geosphere 2018, 14, 954–982. [Google Scholar] [CrossRef] [Green Version]
- Gottsmann, J.; del Potro, R.; Muller, C. 50 years of steady ground deformation in the Altiplano-Puna region of southern Bolivia. Geosphere 2018, 14, 65–73. [Google Scholar] [CrossRef]
- De Silva, S.L.; Gosnold, W.D. Episodic construction of batholiths: Insights from the spatiotemporal development of an ignimbrite flare-up. J. Volcanol. Geotherm. Res. 2007, 167, 320–335. [Google Scholar] [CrossRef]
- Brandmeier, M.; Worner, G. Compositional variations of ignimbrite magmas in the Central Andes over the past 26 Ma—A multivariate statistical perspective. Lithos 2016, 262, 713–728. [Google Scholar] [CrossRef]
- Allmendinger, R.W.; Jordan, T.E.; Kay, S.M.; Isacks, B.L. The evolution of the Altiplano-Puna plateau of the central Andes. Annu. Rev. Earth Planet. Sci. 1997, 25, 139–174. [Google Scholar] [CrossRef]
- Schmitz, M.; Heinsohn, W.D.; Schilling, F.R. Seismic, gravity and petrological evidence for partial melt beneath the thickened Central Andean crust. Tectonophysics 1997, 270, 313–326. [Google Scholar] [CrossRef]
- Schilling, F.R.; Partzsch, G.M.; Brasse, H.; Schwarz, G. Partial melting below the magmatic arc in the central Andes deduced from geoelectromagnetic field experiments and laboratory data. Phys. Earth Planet. Inter. 1997, 103, 17–31. [Google Scholar] [CrossRef]
- Chmielowski, J.; Zandt, G.; Haberland, C. The Central Andean Altiplano-Puna Magma Body. Geophys. Res. Lett. 1999, 26, 783–786. [Google Scholar] [CrossRef]
- Sparks, R.S.J.; Folkes, C.B.; Humphreys, M.C.S.; Barfod, D.N.; Clavero, J.; Sunagua, M.C.; McNutt, S.R.; Pritchard, M.E. Uturuncu volcano, Bolivia: Volcanic unrest due to mid-crustal magma intrusion. Am. J. Sci. 2008, 308, 727–769. [Google Scholar] [CrossRef]
- Perkins, J.P.; Ward, K.M.; de Silva, S.L.; Zandt, G.; Beck, S.L.; Finnegan, N.J. Surface uplift in the Central Andes driven by growth of the Altiplano Puna Magma Body. Nat. Commun. 2016, 7, 13185. [Google Scholar] [CrossRef] [PubMed] [Green Version]
- Muir, D.D.; Blundy, J.D.; Rust, A.C.; Hickey, J. Experimental Constraints on Dacite Pre-eruptive Magma Storage Conditions beneath Uturuncu Volcano. J. Petrol. 2014, 55, 749–767. [Google Scholar] [CrossRef] [Green Version]
- Michelfelder, G.S.; Feeley, T.C.; Wilder, A.D. The Volcanic Evolution of Cerro Uturuncu: A High-K, Composite Volcano in the Back- Arc of the Central Andes of SW Bolivia. IJG 2014, 5, 1263–1281. [Google Scholar] [CrossRef]
- de Silva, S.L. Altiplano-Puna volcanic complex of the central Andes. Geology 1989, 17, 1102–1106. [Google Scholar] [CrossRef]
- PLUTONS Project. Probing Lazufre and Uturuncu TOgether: Nsf (USA), Nerc (UK), Nserc (Canada), Sergeotecmin (Bolivia), Sernageomin (Chile), Observatorio San calixto (Bolivia), Universidad Nacional de Salta (Argentina), Universidad Major San andres (Bolivia), Universidad de Poto Si (Bolivia), Sernap (Bolivia), Chilean Seismological Service, Universidad de San Juan (Argentina); The PLUTONS Project is Funded by the National Science Foundation Continental Dynamics Program and the Natural Environment Research Council, The PLUTONS Group; Oregon State University, Department of Geosciences: Corvallis, OR, USA, 2009. [Google Scholar]
- Zandt, G.; Leidig, M.; Chmielowski, J.; Baumont, D.; Yuan, X. Seismic Detection and Characterization of the Altiplano-Puna Magma Body, Central Andes. Pure Appl. Geophys. 2003, 160, 789–807. [Google Scholar] [CrossRef]
- Kukarina, E.; West, M.; Keyson, L.H.; Koulakov, I.; Tsibizov, L.; Smirnov, S. Focused magmatism beneath Uturuncu volcano, Bolivia: Insights from seismic tomography and deformation modeling. Geosphere 2017, 13, 1855–1866. [Google Scholar] [CrossRef]
- Ward, K.M.; Zandt, G.; Beck, S.L.; Christensen, D.H.; McFarlin, H. Seismic imaging of the magmatic underpinnings beneath the Altiplano-Puna volcanic complex from the joint inversion of surface wave dispersion and receiver functions. Earth Planet. Sci. Lett. 2014, 404, 43–53. [Google Scholar] [CrossRef]
- Ward, K.M.; Delph, J.R.; Zandt, G.; Beck, S.L.; Ducea, M.N. Magmatic evolution of a Cordilleran flare-up and its role in the creation of silicic crust. Sci. Rep. 2017, 7, 9047. [Google Scholar] [CrossRef] [Green Version]
- McFarlin, H.; Christensen, D.; McNutt, S.R.; Ward, K.M.; Ryan, J.; Zandt, G.; Thompson, G. Receiver function analyses of Uturuncu volcano, Bolivia and vicinity. Geosphere 2017, 14, 50–64. [Google Scholar] [CrossRef] [Green Version]
- Del Potro, R.; Diez, M.; Blundy, J.; Camacho, A.G.; Gottsmann, J. Diapiric ascent of silicic magma beneath the Bolivian Altiplano. Geophys. Res. Lett. 2013, 40, 2044–2048. [Google Scholar] [CrossRef] [Green Version]
- Jay, J.A.; Pritchard, M.E.; West, M.E.; Christensen, D.; Haney, M.; Minaya, E.; Sunagua, M.; McNutt, S.R.; Zabala, M. Shallow seismicity, triggered seismicity, and ambient noise tomography at the long-dormant Uturuncu Volcano, Bolivia. Bull. Volcanol. 2012, 74, 817–837. [Google Scholar] [CrossRef]
- Alvizuri, C.; Tape, C. Full moment tensors for small events at Uturuncu volcano, Bolivia. Geophys. J. Int. 2016, 206, 1761–1783. [Google Scholar] [CrossRef]
- Comeau, M.J.; Unsworth, M.J.; Ticona, F.; Sunagua, M. Magnetotelluric images of magma distribution beneath Volcan Uturuncu, Bolivia: Implications for magma dynamics. Geology 2015, 43, 243–246. [Google Scholar] [CrossRef]
- Comeau, M.J.; Unsworth, M.J.; Cordell, D. New constraints on the magma distribution and composition beneath Volcan Uturuncu and the southern Bolivian Altiplano from magnetotelluric data. Geosphere 2016, 12, 1391–1421. [Google Scholar] [CrossRef]
- Pritchard, M.E.; Simons, M. A satellite geodetic survey of large-scale deformation of volcanic centres in the central Andes. Nature 2002, 418, 167–171. [Google Scholar] [CrossRef] [PubMed]
- Pritchard, M.E.; Simons, M. An InSAR-based survey of volcanic deformation in the central Andes. Geochem. Geophys. Geosyst. 2004, 5, 1–42. [Google Scholar] [CrossRef]
- Fialko, Y.; Pearse, J. Sombrero Uplift Above the Altiplano-Puna Magma Body: Evidence of a Ballooning Mid-Crustal Diapir. Science 2012, 338, 250–252. [Google Scholar] [CrossRef] [PubMed]
- Henderson, S.T.; Pritchard, M.E. Decadal volcanic deformation in the Central Andes Volcanic Zone revealed by InSAR time series. Geochem. Geophys. Geosyst. 2013, 14, 1358–1374. [Google Scholar] [CrossRef] [Green Version]
- Hickey, J.; Gottsmann, J.; del Potro, R. The large-scale surface uplift in the Altiplano-Puna region of Bolivia: A parametric study of source characteristics and crustal rheology using finite element analysis. Geochem. Geophys. Geosyst. 2013, 14, 540–555. [Google Scholar] [CrossRef] [Green Version]
- Walter, T.R.; Motagh, M. Deflation and inflation of a large magma body beneath Uturuncu volcano, Bolivia? Insights from InSAR data, surface lineaments and stress modelling. Geophys. J. Int. 2014, 198, 462–473. [Google Scholar] [CrossRef] [Green Version]
- Gottsmann, J.; Blundy, J.; Henderson, S.; Pritchard, M.E.; Sparks, R.S.J. Thermomechanical modeling of the Altiplano-Puna deformation anomaly: Multiparameter insights into magma mush reorganization. Geosphere 2017, 13, 1042–1065. [Google Scholar] [CrossRef]
- Henderson, S.T.; Pritchard, M.E. Time-dependent deformation of Uturuncu volcano, Bolivia, constrained by GPS and InSAR measurements and implications for source models. Geosphere 2017, 13, 1834–1854. [Google Scholar] [CrossRef] [Green Version]
- Lau, N.; Tymofyeyeva, E.; Fialko, Y. Variations in the long-term uplift rate due to the Altiplano-Puna magma body observed with Sentinel-1 interferometry. Earth Planet. Sci. Lett. 2018, 491, 43–47. [Google Scholar] [CrossRef]
- Stanton, J.M. Galton, Pearson and the Peas: A brief history of linear regression for statistics instructors. J. Stat. Educ. 2001, 9. [Google Scholar] [CrossRef]
- Tizzani, P.; Berardino, P.; Casu, F.; Euillades, P.; Manzo, M.; Ricciardi, G.P.; Zeni, G.; Lanari, R. Surface deformation of Long Valley caldera and Mono Basin, California, investigated with the SBAS-InSAR approach. Remote Sens. Environ. 2007, 108, 277–289. [Google Scholar] [CrossRef]
- Fedi, M.; Florio, G.; Quarta, T.A.M. Multiridge analysis of potential fields: Geometric method and reduced Euler deconvolution. Geophysics 2009, 74, L53–L56. [Google Scholar] [CrossRef]
- Castaldo, R.; Barone, A.; Fedi, M.; Tizzani, P. Multiridge Method for Studying Ground-Deformation Sources: Application to Volcanic Environments. Sci. Rep. 2018, 8, 13420. [Google Scholar] [CrossRef] [PubMed]
- De Luca, C.; Cuccu, R.; Elefante, S.; Zinno, I.; Manunta, M.; Casola, V.; Rivolta, G.; Lanari, R.; Casu, F. An On-Demand Web Tool for the Unsupervised Retrieval of Earth’s Surface Deformation from SAR Data: The P-SBAS Service within the ESA G-POD Environment. Remote Sens. 2015, 7, 15630–15650. [Google Scholar] [CrossRef] [Green Version]
- De Luca, C.; Zinno, I.; Manunta, M.; Lanari, R.; Casu, F. Large areas surface deformation analysis through a cloud computing P-SBAS approach for massive processing of DInSAR time series. Remote Sens. Environ. 2017, 202, 3–17. [Google Scholar] [CrossRef]
- Berardino, P.; Fornaro, G.; Lanari, R.; Sansosti, E. A new algorithm for surface deformation monitoring based on small baseline differential SAR interferograms. IEEE Trans. Geosci. Remote Sens. 2002, 40, 2375–2383. [Google Scholar] [CrossRef]
- Casu, F.; Elefante, S.; Imperatore, P.; Zinno, I.; Manunta, M.; De Luca, C.; Lanari, R. SBAS-DInSAR Parallel Processing for Deformation Time-Series Computation. IEEE J. Sel. Top. Appl. Earth Observ. Remote Sens. 2014, 7, 3285–3296. [Google Scholar] [CrossRef]
- Manzo, M.; Ricciardi, G.P.; Casu, F.; Ventura, G.; Zeni, G.; Borgstrom, S.; Berardino, P.; Del Gaudio, C.; Lanari, R. Surface deformation analysis in the Ischia Island (Italy) based on spaceborne radar interferometry. J. Volcanol. Geotherm. Res. 2006, 151, 399–416. [Google Scholar] [CrossRef]
- Florio, G.; Fedi, M. Multiridge Euler deconvolution. Geophys. Prospect. 2014, 62, 333–351. [Google Scholar] [CrossRef]
- Tizzani, P.; Battaglia, M.; Castaldo, R.; Pepe, A.; Zeni, G.; Lanari, R. Magma and fluid migration at Yellowstone Caldera in the last three decades inferred from InSAR, leveling and gravity measurements. J. Geophys. Res. Solid Earth 2015, 120, 2627–2647. [Google Scholar] [CrossRef]
- Pepe, S.; Castaldo, R.; De Novellis, V.; D’Auria, L.; De Luca, C.; Casu, F.; Sansosti, E.; Tizzani, P. New insights on the 2012–2013 uplift episode at Fernandina Volcano (Galapagos). Geophys. J. Int. 2017, 211, 673–685. [Google Scholar] [CrossRef]
- Milano, M.; Fedi, M.; Fairhead, J.D. The deep crust beneath the Trans-European Suture Zone from a multiscale magnetic model. JGR Solid Earth 2016, 121, 6276–6292. [Google Scholar] [CrossRef]
- Baranov, W. Potential Fields and Their Transformations in Applied Geophysics; Geopublication Associates: Berlin-Stuttgart, Germany, 1975. [Google Scholar]
- Blakely, R.J. Potential Theory in Gravity and Magnetic Applications; Cambridge University Press: Cambridge, UK, 1996. [Google Scholar]
- Mogi, K. Relation between eruptions of various volcanoes and the deformations of ground surface around them. Bull. Earthq. Res. 1958, 36, 99–134. [Google Scholar]
- Ridsdill-Smith, T.A. Wavelet Design of Time-Varying Filters. In Proceedings of the Fifth International Symposium on Signal Processing and its Applications, Brisbane, QLD, Australia, 22–25 August 1999. [Google Scholar]
- Rao, D.A.; Ram Babu, H.V.; Sanker Narayan, P.V. Interpretation of magnetic anomalies due to dikes: The complex gradient method. Geophysics 1981, 46, 1572–1578. [Google Scholar] [CrossRef]
- Gupta, V.K.; Ramani, N. Optimum second vertical derivatives in geologic mapping and mineral exploration. Geophysics 1982, 47, 1706–1715. [Google Scholar] [CrossRef]
- Butler, D.K. Microgravimetric and gravity gradient techniques for detection of subsurface cavities. Geophysics 1984, 49, 1084–1096. [Google Scholar] [CrossRef]
- Reid, A.B.; Allsop, J.M.; Granser, H.; Millett, A.J.; Somerton, I.W. Magnetic interpretation in three dimensions using Euler deconvolution. Geophysics 1990, 55, 80–91. [Google Scholar] [CrossRef]
- Fedi, M.; Florio, G. Detection of potential fields source boundaries by enhanced horizontal derivative method. Geophys. Prospect. 2001, 49, 40–58. [Google Scholar] [CrossRef]
- Fedi, M.; Florio, G. Determination of the maximum-depth to potential field sources by a maximum structural index method. J. Appl. Geophys. 2013, 88, 154–160. [Google Scholar] [CrossRef]
- Cooper, G.R.J.; Cowan, D.R. Filtering using variable order vertical derivatives. Comput. Geosci. 2004, 30, 455–459. [Google Scholar] [CrossRef]
Figure 1.
DInSAR measurements of APVC and Uturuncu volcano. (a) LOS mean velocity maps (cm/a) retrieved by ENVISAT satellite data acquired along ascending (right-track 89) and descending (left-track 282) orbits, superimposed on Shuttle Radar Topography Mission (SRTM) Digital Elevation Model (DEM); the reference map (Google Maps source) in upper center shows the study area location (red box); the white solid square shows the reference point, the white solid circles indicate the Uturuncu and Quetana volcanoes location, while the solid black triangles show the location of the selected P1 and P2 pixels; (b) LOS displacement time-series (cm) related to the 2003–2010 interval at the P1 (up) and P2 (down) pixels; the blue and red triangles represent the time-series related to the tracks 89 and 282, respectively, while the light red rectangle indicates the considered 2005–2008 time interval for the following analysis.

Figure 2.
Vertical and East-West deformations at APVC and Uturuncu volcano. (a) Mean velocity maps (cm/a) of vertical (left) and East-West (right) components, superimposed on the SRTM DEM; the white solid square shows the reference point, the white solid circles indicate the Uturuncu and Quetana volcanoes location, the solid black triangles show the location of the P1 and P2 pixels, while the blue continuous line represents the AA’ trace; (b) AA’ profile of the vertical mean velocity (colored solid circles) and of the topography (grey solid circles); the black solid triangles represent P1 and P2 pixels on the AA’ profile; (c) Vertical displacement time-series at the pixels P1 (left) and P2 (right) related to the analyzed 2005–2008 interval; the blue dashed lines indicate the time interval in which a higher uplift rate is observed.

Figure 3.
Spatial-temporal Cross-correlation analysis. Cross-correlation map: the red and blue points indicate coherent cluster pixels with respect to the deformation time-series at P1 and P2 pixel (black solid triangle, also reported in Figure 2c), respectively, during the 2005–2008 time interval; these points are characterized by a correlation coefficient greater than 0.97.

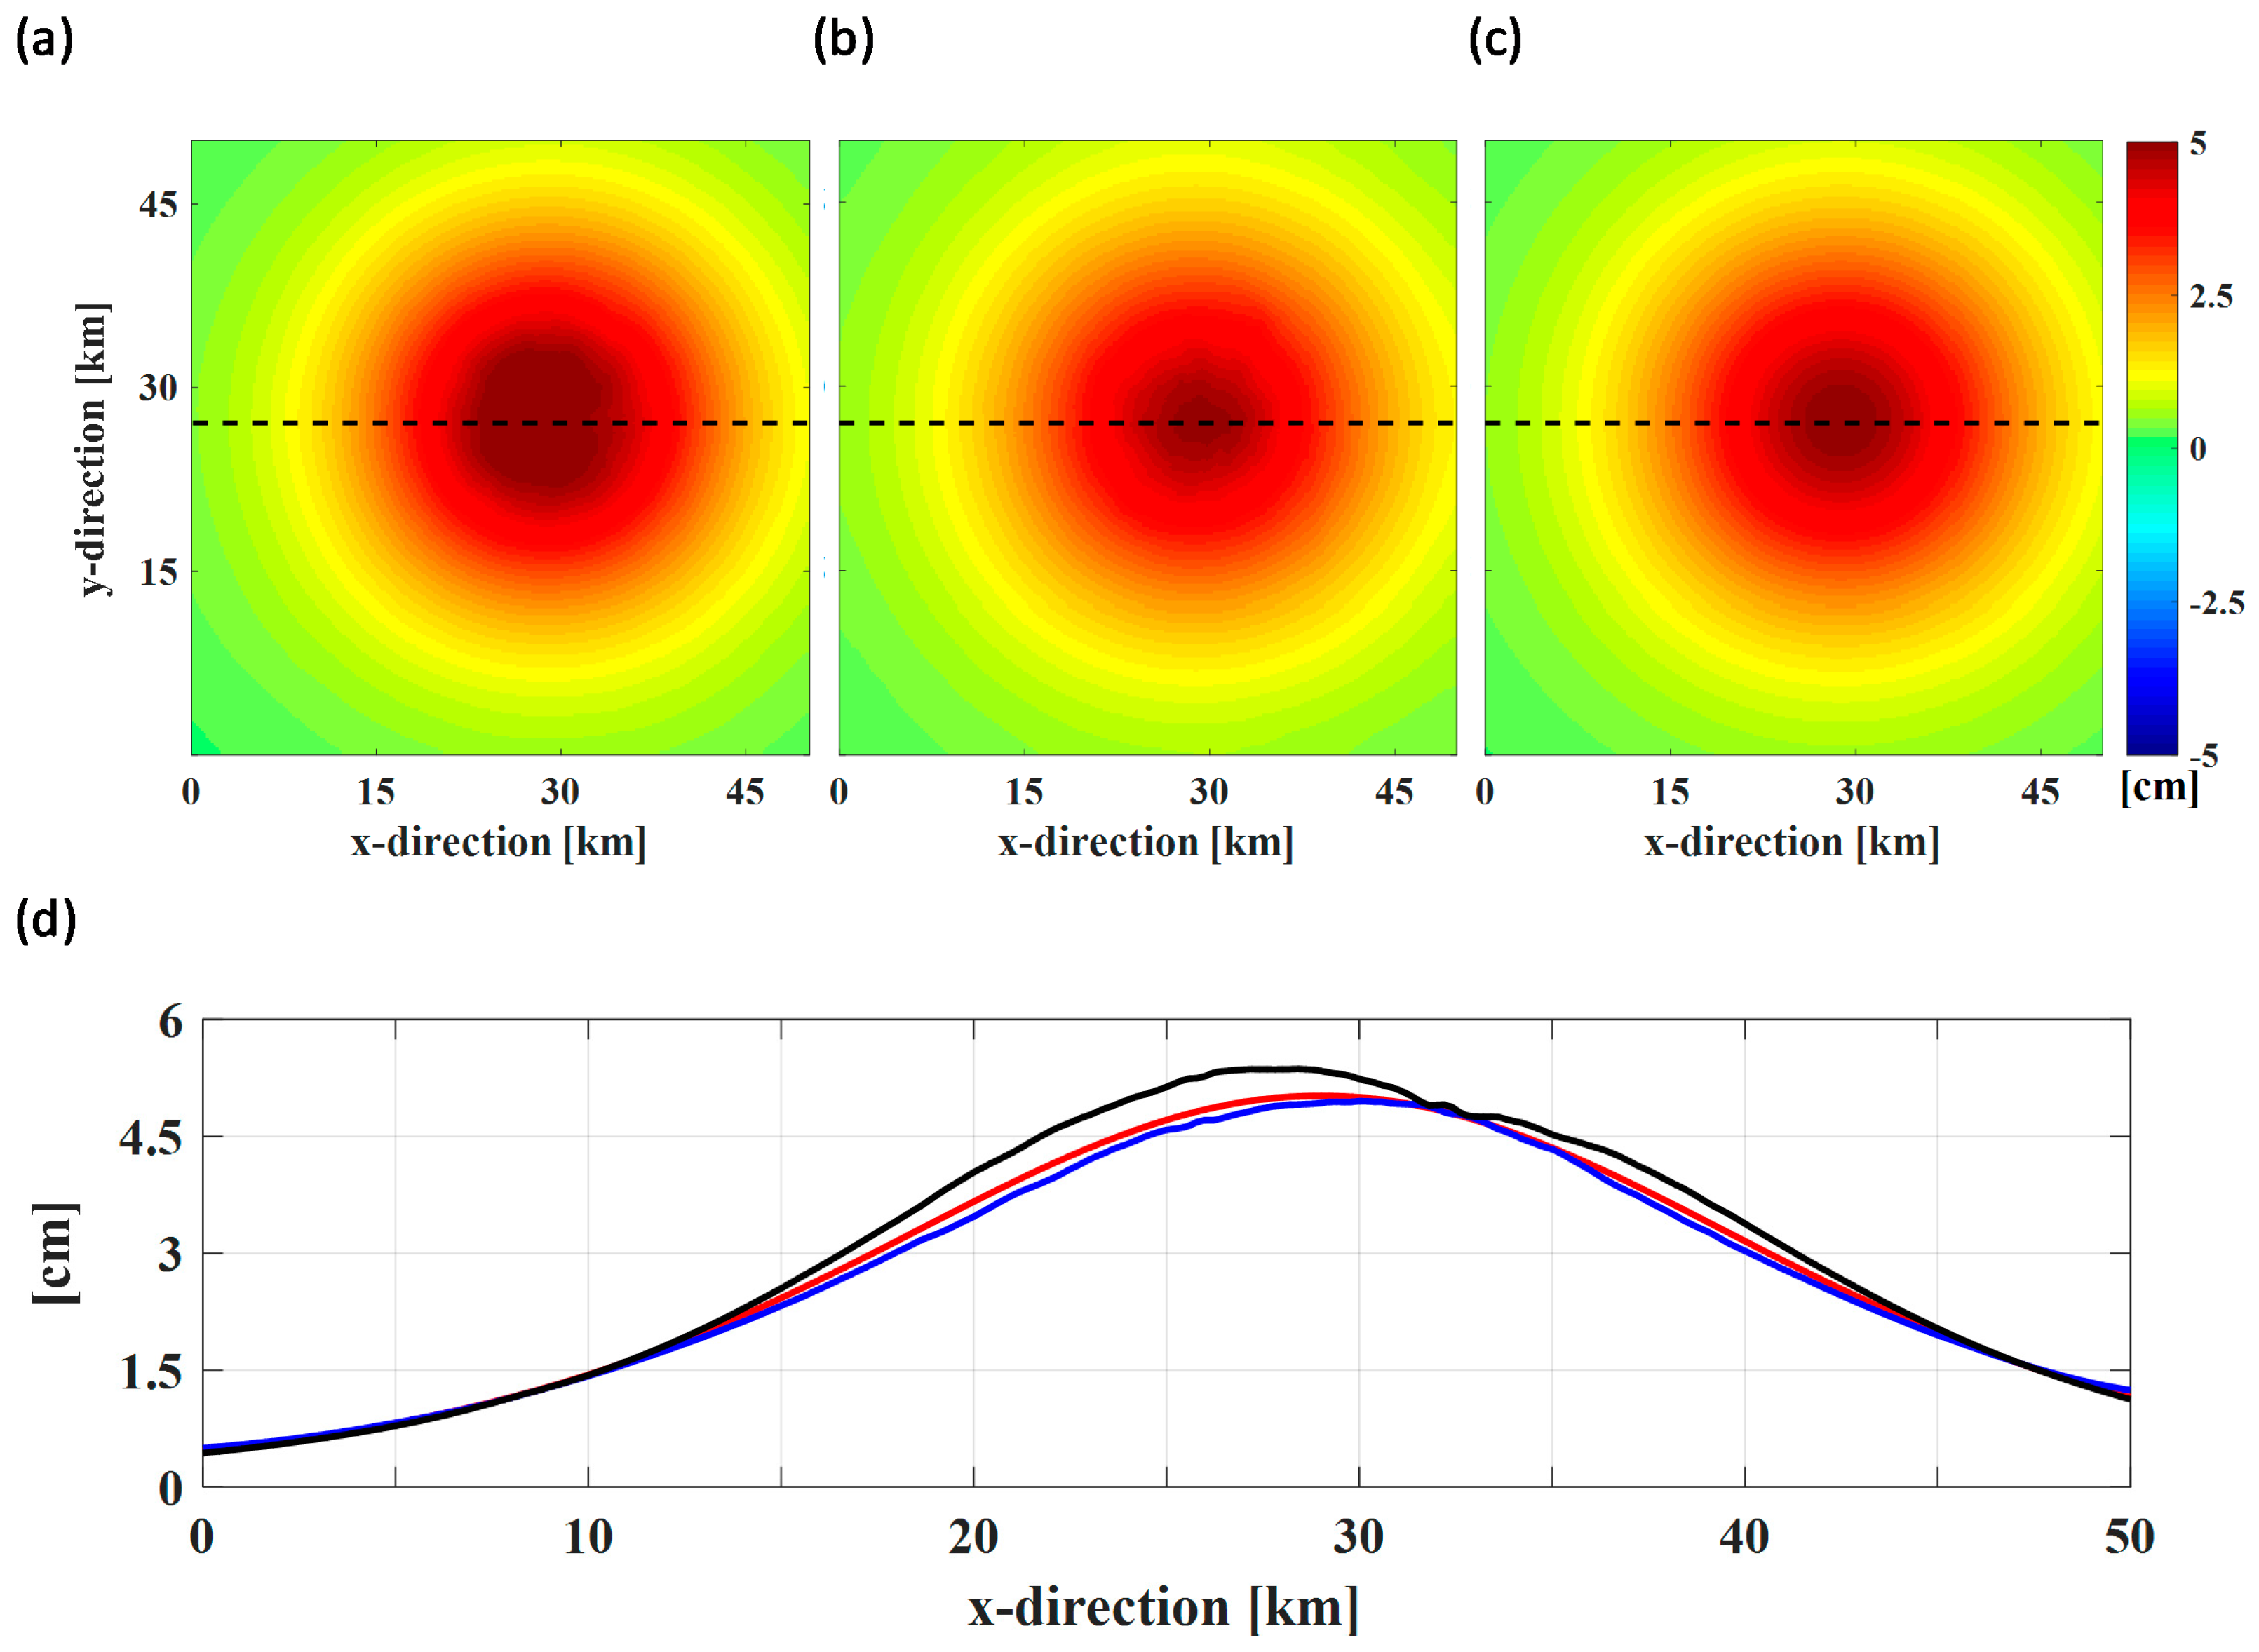
Figure 4.
Multiridge analysis of 2005–2008 time interval. (a) Gridded vertical deformation (cm); the black dashed lines represent the BB’ and CC’ traces; (b) Detection of deformation sources by using Multiridge method applied to the BB’ (left) and CC’ (right) profiles of the vertical gradient of the vertical deformation map (in (a)); the red solid and dashed lines represent the best-fit regression lines and the linear regression boundary solutions within a 95% confidence interval, respectively; the black solid circles indicate the ridges intersections; for each regression line, we indicate the R2 coefficient.

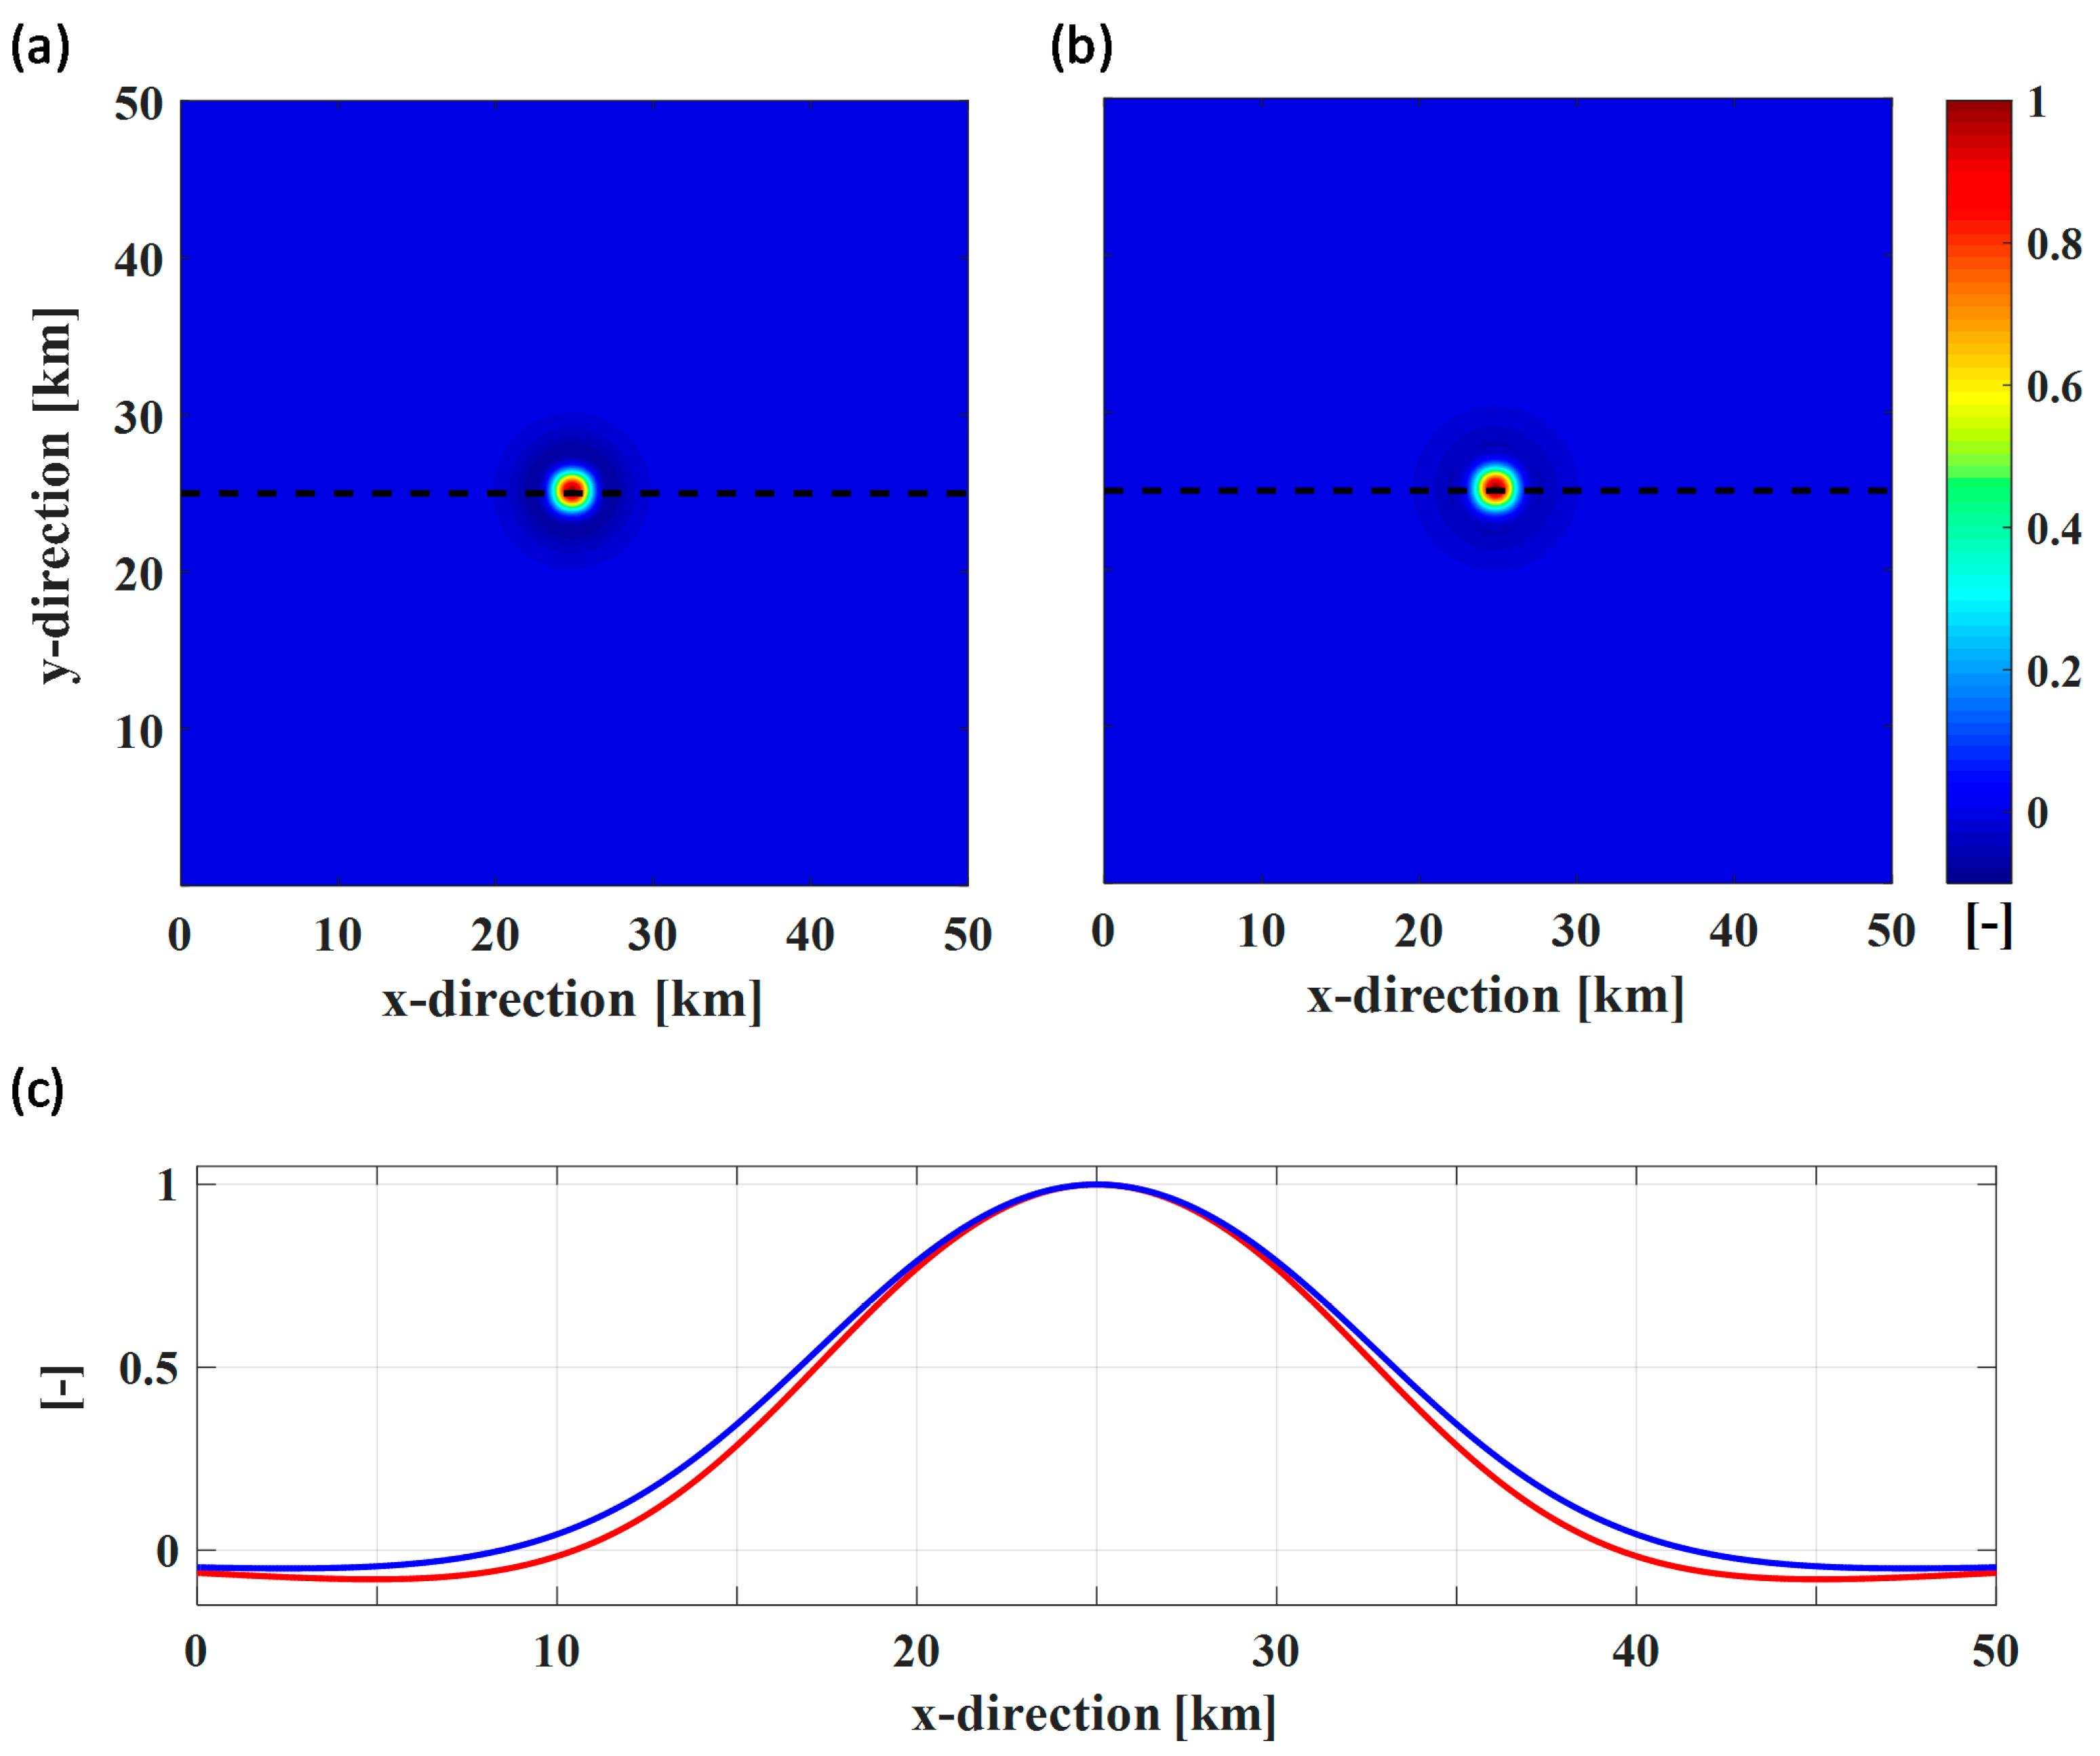
Figure 5.
Multiridge analysis of August 2006–February 2007 time interval. (a) Gridded vertical deformation (cm); the black dashed lines represent the DD’ and EE’ traces; (b) Detection of deformation sources by using Multiridge method applied to the DD’ (left) and EE’ (right) profiles of the vertical deformation map (in (a)); the red solid and dashed lines represent the best-fit regression lines and the linear regression boundary solutions within a 95% confidence interval, respectively; the black solid circles indicate the ridges intersections; for each regression line, we indicate the R2 coefficient.

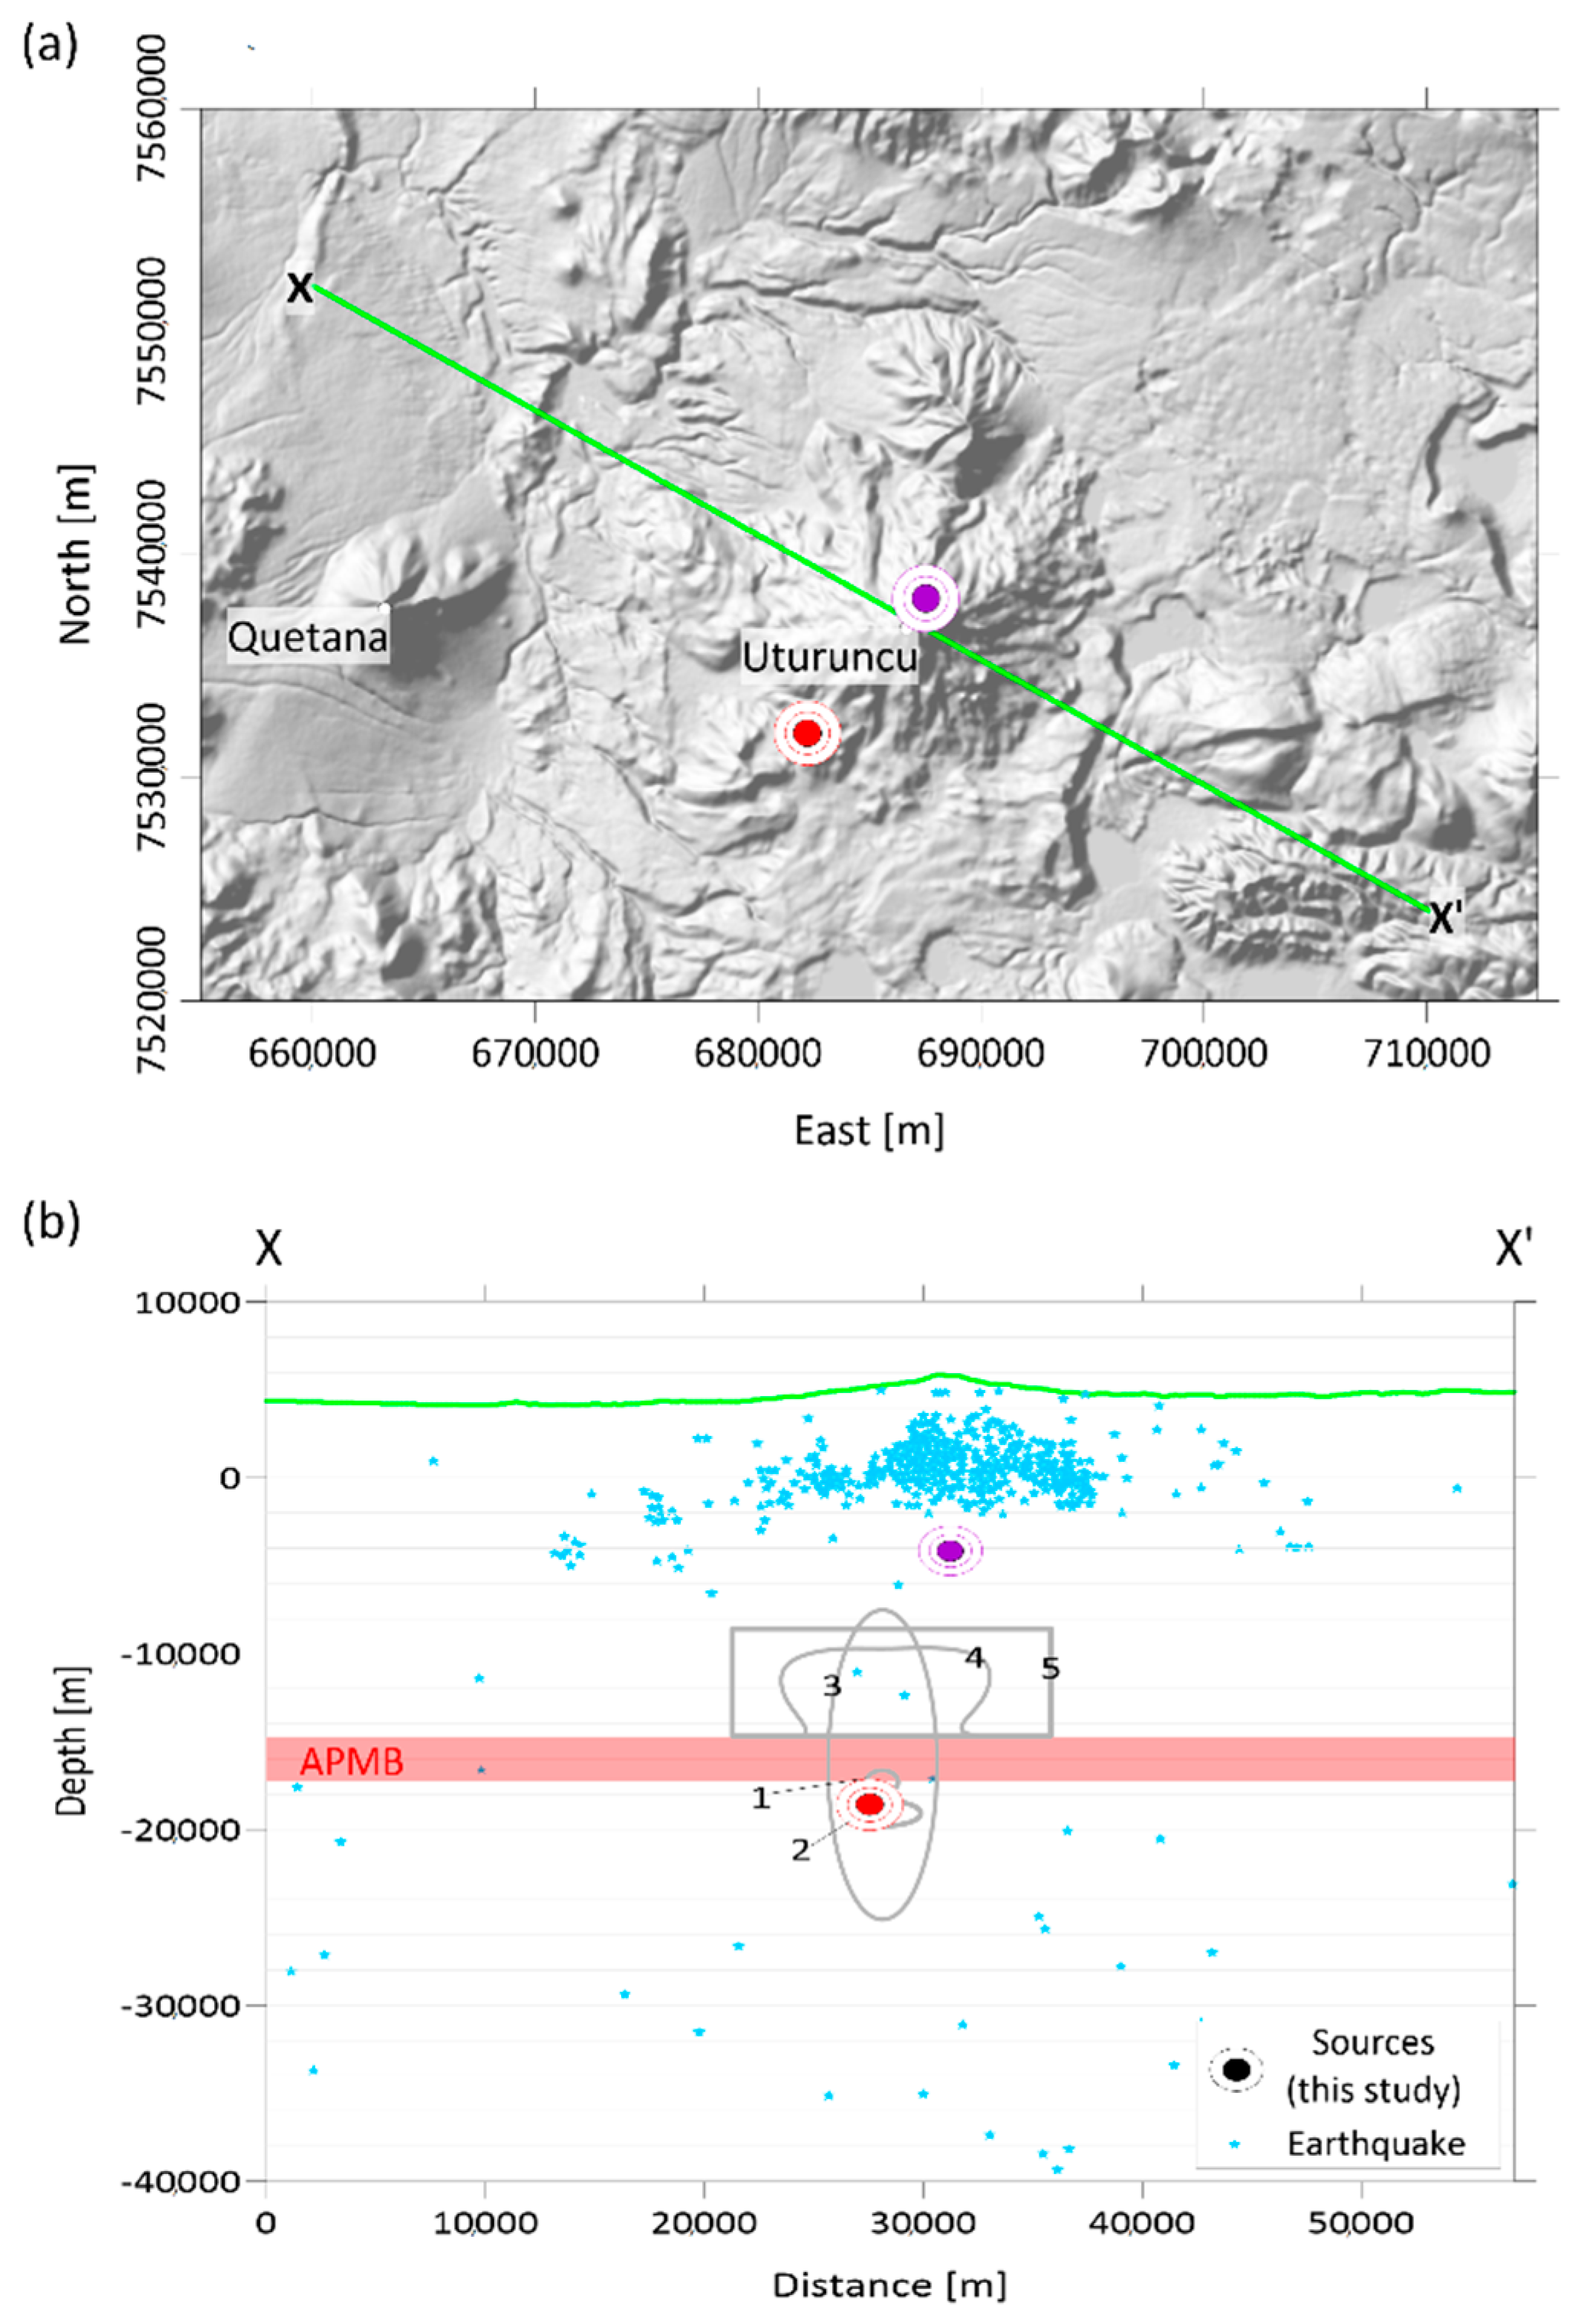
Figure 6.
Location and depth of deformation sources. (a) SRTM DEM of the study area with the green continuous line representing the XX’ trace and the red and the violet solid circles indicating the position of the deep and the shallow deformation sources, respectively; (b) XX’ section redrawn from [21,23,24], in which the location and depth of retrieved deformation sources are reported; the solid blue stars represent earthquake locations; the red solid rectangle indicates the depths to the APMB [15], while the green continuous line represents the topography; the grey continuous lines, numbered from 1 to 5, indicate the solutions proposed by 1-Pritchard and Simons [26], 2-Pritchard and Simons [26], 3-Hickey et al. [29], 4-Fialko and Pearse [27], 5-Walter and Motagh [30], respectively.


Table 1.
Summary of previous works. Main results provided by previous studies for Uturuncu volcano and APMB. Where not specified, depths are referred to sea level.
Table 1.
Summary of previous works. Main results provided by previous studies for Uturuncu volcano and APMB. Where not specified, depths are referred to sea level.
| Authors | Studies | Description of the Retrieved Results |
|---|---|---|
| Chmielowski et al., [8] | Receiver function analysis (1996–1997) | Low-velocity zone at ≈19 km depth b.g.l.. |
| Zandt et al., [15] | Teleseismic and local receiver function analysis (1996–1997) | Low-velocity zone at ≈20 km depth b.g.l.. |
| Pritchard et al., [26] | Deformation modeling (1992–2000) | Source of deformation modeled as sphere, horizontal and vertical ellipsoid, point and finite crack, at depth of 17.3 km, 18.8 and 18.2 km, 25 and 12 km, respectively. |
| Sparks et al., [9] | Petrological analysis | Shallow magma storage at a depth >1.5 km; dacite magma intrusion at a depth > 17 km. |
| Fialko et al., [27] | Deformation modeling (1992–2010) | Source of deformation modeled as an ascending diapir at a depth >15 km. |
| Jay et al., [21] | Seismicity and ambient noise tomography (2009–2010) | Low-velocity zone at ≈0 km associated to hydrothermal processes. |
| del Potro et al., [20] | Gravity modeling (2010–2011) | Vertically elongated low-density 3D structures rooted at the top of the APMB at 15 km depth. |
| Henderson et al., [28] | Deformation modeling (1992–2011) | Source of deformation modeled as a point-sphere at depth of 19–20 km. |
| Hickey et al., [29] | Deformation modeling (1996–2010) | Source of deformation modeled as prolate ellipsoid, oblate ellipsoid and sphere, at a depth of 20.6 km, 32.8 km, 30.4 km b.g.l., respectively. |
| Muir et al., [11] | Geochemical analysis | Pre-eruptive magma storage at maximum 1.9–5.7 km depth b.g.l.. |
| Walter et al., [30] | Deformation modeling (2003–2009) | Source of deformation modeled as an inflating flat-topped body at 17–18 ± 9 km depth. |
| Lineament stress modeling | Stress source modeled as a deflating flat-topped body at 13–14 ± 2 km depth. | |
| Ward et al., [17] | Surface wave dispersion and receiver function analysis | Low velocity zone with oblate-spheroidal shape at a depth of 4–25 km. |
| Comeau et al., [23] | Magnetotelluric 2D modeling (2011–2013) | Low-resistivity zone at 18–19 km depth. |
| Alvizuri et al., [22] | Earthquake clustering analysis (2010–2012) | Several events located at 4–6 km depth. |
| Comeau et al., [24] | Magnetotelluric 3D modeling (2011–2013) | Low-resistivity zone at 3–5 and 14 +1/−3 km depth. |
| Gottsmann et al., [31] | Numerical deformation modeling (1992–2015) | Modeled source composed by: hybrid column from 0 to 14 km depth; magmatic column from 6 to 14 km depth; APMB from 13 to 25 km depth. |
| Henderson et al., [32] | Deformation modeling (1992–2015) | Source of deformation modeled as a dipole which shallow pole is located at variable depth from 15.4 to 30.4 km. |
| Kukarina et al., [16] | Seismic tomography (2010–2012) | Deep large tooth-shaped Vp/Vs anomaly from 1–2 to 75–76 km depth. |
| McFarlin et al., [19] | Seismicity, receiver function analysis (2010–2012) | Low-velocity zone localized from 6 to 22 km depth with variable thickness. |
| Lau et al., [33] | Deformation modeling (2014–2017) | Source of deformation at 2.12 km depth associated with hydrothermal processes. |
Table 2.
Summary of deformation sources. Volcanic source modeling for APMB and Uturuncu volcano retrieved from satellite geodetic measurements. Where not specified, depths are referred to sea level.
Table 2.
Summary of deformation sources. Volcanic source modeling for APMB and Uturuncu volcano retrieved from satellite geodetic measurements. Where not specified, depths are referred to sea level.
| Study | Period | Depth [km] | Source Type |
|---|---|---|---|
| Pritchard et al., [26] | 1992–2000 | 17.3 18.8 18.2 25 12 | Sphere Horizontal Ellipsoid Vertical Ellipsoid Point Crack Finite Crack |
| Fialko et al., [27] | 1992–2010 | >15 | Prolate spheroid and tabular body |
| Henderson et al., [28] | 1992–2011 | 19–20 | Point-spherical |
| Hickey et al., [29] | 1996–2010 | 20.6 (18–25) b.g.l. 32.8 (30–35) b.g.l. 30.4 (28–33) b.g.l. | Prolate spheroid Oblate spheroid Sphere |
| Walter et al., [30] | 2003–2009 | 17–18 ± 9 | Inflating flat-topped body |
| Gottsmann et al., [31] | 1992–2011 | 6–14 (top and bottom) 13–25 (top and bottom) | Magmatic column APMB |
| Henderson et al., [32] | 1992–2011 | 15.4–30.4 | Point source (top of a dipole source) |
| This study | 2005–2008 2006–2007 | 18.7 ± 0.8 4.5 ± 0.5 | Deep inflation body Shallow inflation body |
© 2019 by the authors. Licensee MDPI, Basel, Switzerland. This article is an open access article distributed under the terms and conditions of the Creative Commons Attribution (CC BY) license (http://creativecommons.org/licenses/by/4.0/).
Share and Cite
MDPI and ACS Style
Barone, A.; Fedi, M.; Tizzani, P.; Castaldo, R. Multiscale Analysis of DInSAR Measurements for Multi-Source Investigation at Uturuncu Volcano (Bolivia). Remote Sens. 2019, 11, 703. https://0-doi-org.brum.beds.ac.uk/10.3390/rs11060703
AMA Style
Barone A, Fedi M, Tizzani P, Castaldo R. Multiscale Analysis of DInSAR Measurements for Multi-Source Investigation at Uturuncu Volcano (Bolivia). Remote Sensing. 2019; 11(6):703. https://0-doi-org.brum.beds.ac.uk/10.3390/rs11060703
Chicago/Turabian StyleBarone, Andrea, Maurizio Fedi, Pietro Tizzani, and Raffaele Castaldo. 2019. "Multiscale Analysis of DInSAR Measurements for Multi-Source Investigation at Uturuncu Volcano (Bolivia)" Remote Sensing 11, no. 6: 703. https://0-doi-org.brum.beds.ac.uk/10.3390/rs11060703
Note that from the first issue of 2016, this journal uses article numbers instead of page numbers. See further details here.