Article

The Terra Vega Active Light Source: A First Step in a New Approach to Perform Nighttime Absolute Radiometric Calibrations and Early Results Calibrating the VIIRS DNB

1
Innovative Imaging and Research (I2R), Building 1103, Suite 140C, NASA Stennis Space Center, MS 39529, USA
2
South Dakota State University, Daktronics Engineering Hall, 1250 8th Street, Brookings, SD 57007, USA
3
NOAA/NESDIS (National Environmental Satellite, Data and Information Service)/STAR (Center for Satellite Applications and Research), NCWCP (NOAA Center for Weather and Climate Prediction) E/RA2, 5830 University Research Ct., Suite 2838, College Park, MD 20740, USA
4
Global Science & Technology, Inc., NCWCP, 5830 University Research Ct., Suite 2723, College Park, MD 20740, USA
*
Author to whom correspondence should be addressed.
Submission received: 1 March 2019 / Accepted: 19 March 2019 / Published: 24 March 2019
(This article belongs to the Section Atmospheric Remote Sensing)

Abstract

:
A fully automated, National Institute of Standards and Technology (NIST)-traceable artificial light source called Terra Vega has been developed to radiometrically calibrate the Visible Infrared Imaging Radiometer (VIIRS) Day Night Band (DNB) working in high gain stage (HGS) mode. The Terra Vega active point source is a calibrated integrating sphere that is only a fraction in size of a VIIRS DNB pixel. As such, it can be considered analogous to a ground-based photometric reference star. Vicarious calibrations that employ active point sources are different than those that make use of traditional extended sources and can be applyed to quantify the brightness of artificial light sources. The active source is successfully fielded, and early results indicate that it can be used to augment and validate the radiometric calibration of the VIIRS DNB HGS sensor on both the Suomi National Polar-orbiting Partnership (NPP) and NOAA-20 satellites. The VIIRS DNB HGS sensor can benefit from this technology as on-board calibration is challenging and hinges on transferring low gain stage (LGS) calibration using a solar diffuser to the medium gain stage (MGS) and HGS via regions of overlap. Current vicarious calibration methods that use a lunar-illuminated extended source estimate the HGS radiometric accuracy to within 8-15%. By comparison, early results and analysis showed that Terra Vega is stable to about 1%. Under clear dark night conditions, predicted top-of-atmosphere radiance from Terra Vega ranged between 1–11% of VIIRS measured values. Terra Vega’s excellent stability opens up new opportunities to validate and develop nighttime imaging applications based on point sources.

1. Introduction

The Visible Infrared Imaging Radiometer (VIIRS) Day Night Band (DNB) is enabling a new generation of nighttime imaging applications because of its high spatial resolution and its extreme sensitivity in the high gain stage (HGS) mode. NASA’s Black Marble team of scientists is analyzing nighttime artificial light data from the VIIRS DNB and developing algorithms to improve the accuracy of these measurements [1]. In addition, the HGS has shown utility in night-light search and rescue by detecting faint lights from fishing vessels (using visual inspection methods only [2]); nighttime aerosol retrieval [3]; and analysis of lighting and energy use [4,5], an example of which is shown in Figure 1.
Many of these emerging applications depend on the absolute radiometric accuracy and stability of the data products. Unfortunately, there are limited ways to radiometrically calibrate the VIIRS DNB HGS [6] and the methods used are based on extended sources. The on-board solar diffuser is used to radiometrically calibrate the DNB low gain stage (LGS). Calibration is transferred from the LGS to the medium gain stage (MGS) and then from the MGS to the HGS using regions of observed radiance overlap near the terminator [7]. The illumination produced by the solar diffuser, which is the basis of the HGS calibration, is eight orders of magnitude brighter than many of the faintly lit targets imaged using the HGS.
Figure 2 further illustrates the extremely large dynamic range of the VIIRS instrument, which spans more than eight orders of magnitude. The differences in radiance as imaged by the low (LGS), medium (MGS), and high (HGS) gain settings on VIIRS lead to difficulties in transferring calibration from one gain setting to another.
Limited vicarious calibration studies have been performed to quantify DNB HGS radiometric accuracy. Traditional methods rely on lunar reflection off a large quasi-uniform area such as a desert playa or dry lake bed. These extended sources introduce errors associated with non-uniformity and imperfect knowledge of surface reflectance properties, including the bidirectional reflectance distribution function (BRDF) as well as atmospheric and illumination conditions. Liao et al. [7] used lunar illumination at Railroad Valley Playa to estimate top-of-atmosphere (TOA) radiance. The absolute calibration accuracy was found to be no better than 15%, reducing the sensor’s ability to provide quantifiable information and detect changes less than this value. These extended source radiometric techniques were recently improved by using deep convective clouds under lunar illumination to validate radiance [8]. Ma et al. [8] predicted an 8-9% accuracy with the deep convective cloud technique. Vicarious calibration approaches could be further improved with better knowledge of the atmosphere and surface reflectance, but additional work is needed.
Extended targets, imaged by many pixels and used in both on-board and vicarious radiometric calibration approaches, are different than the faint point source targets imaged by VIIRS, and there is limited experience with artificial point sources or quantitative small object radiometry. Since a sensor’s response to a point source target also depends on the sensor’s point spread function and ground sample distance, VIIRS DNB HGS radiometric calibrations that make use of point sources should include both the radiometric and spatial response of the DNB, which is not needed when using extended targets.
This paper describes a new way to approach nighttime calibration using a field-portable, NIST-traceable point source based on a large 1-m diameter integrating sphere called Terra Vega. Since VIIRS end users are interested in monitoring artificial light point sources, and point sources behave differently than extended sources, it is desirable to also calibrate VIIRS DNB HGS using a point source. The notion of using a NIST-traceable point source to calibrate the radiometric performance of the VIIRS DNB HGS was first conceived by Cao et al. [9]. Tuttle et al. [10] built an active point source proof of concept calibration source based on high pressure sodium lamps that was applied to the Defense Meteorological Satellite Programs’ Operational Linescan System (DMSP OLS).
Since the newly developed active source is a point or irradiance source, it is analogous to a star. NASA Goddard Space Flight Center (GSFC) demonstrated that stellar photometry (stars as point sources) could be used to trend the NPP VIIRS DNB HGS and medium gain stage (MGS) within 6% of what had been observed with the on-board solar diffuser [11]. This work also showed that subpixel sampling and aggregations and optical point spread function effects are not significant and that the stellar photometry could be applied to all of the aggregation zones of the HGS. While NASA has continued to use stars for trending, using stars for absolute radiometry has only been considered and not implemented at this time.
Absolute stellar photometry has its heritage with measuring the flux of the star Vega [12], also called Alpha Lyrae, the fifth brightest star in the night sky. Unlike a star, the calibration source is here on Earth and so using Terra, the Latin name of Earth, we named the source Terra Vega, the ground reference star.
Terra Vega has been fielded several times at two locations, in the Stennis Space Center buffer zone in Mississippi and on a small farm near the South Dakota State University (SDSU) campus. Both locations are dark sites where Terra Vega dominates the VIIRS measured signal. Early at-sensor radiance predictions from the South Dakota location are within 1–11% of measured VIIRS radiance, strongly suggesting the technology can be used to complement current calibration techniques. Terra Vega can be used to monitor the stability of the VIIRS DNB calibration at specified near-minimum radiances (Lmin = 3 × 10⁻⁹ W cm−2 sr−1), and can potentially be used to monitor environmental changes as well.
Section 2 below describes the Terra Vega design and hardware approach, and Section 3 describes early VIIRS DNB HGS calibration results. Conclusions, provided in Section 4, state Terra Vega can be combined with coincident atmospheric monitoring to radiometrically calibrate the VIIRS DNB operating in HGS mode.

2. Terra Vega Design and Hardware Approach

2.1. Terra Vega Performance Goals and Criteria

Terra Vega was designed to meet NOAA-provided performance goals [13] summarized in Table 1. The active source is envisioned to operate for less than ten minutes during a satellite overpass, around 3:30 AM local time (Northern Hemisphere), under low illumination conditions, with little or no moon present. It is also anticipated that the Terra Vega light source will be used as a radiometric reference to compare with other (nearby but not too close to interfere) light sources found within the DNB imagery. The required VIIRS viewing angle originally provided by NOAA was increased from ± 10° to ± 30° to increase the number of opportunities to acquire Terra Vega without significantly impacting atmospheric attenuation or the signal to noise ratio (SNR).
The team elected to use 1x10⁻⁸ W cm−2 sr−1 as the active source goal radiance under clear sky conditions. This radiance level is approx. 3x the NOAA given effective minimum radiance (also known as Lmin) shown in Table 1. Doing so requires providing additional power to the active source but in return provides a margin for off-nadir viewing. While arbitrary, it also increases the SNR of the measurements (benefit) and is still far below saturation in the HGS mode. The SNR for this radiance level at 30° off-nadir will be approx. 51 for a photon noise-limited assumption [7].

2.2. Terra Vega Required Source Intensity

As VIIRS effective radiance and other radiative transport equations are given in units of W cm−2 sr−1, the team first determined the radiant intensity [14], or optical power per unit solid angle (measured in Wsr−1) that would have to be generated by an active source from a pixel the size of VIIRS. To determine the required source intensity, the team employed a first-order physics source intensity model. The model uses as input the Terra Vega performance goals (Table 1) and VIIRS DNB HGS characteristics described in Table 2 [7]. The source intensity model assumes the VIIRS DNB HGS point spread function (PSF) is approximately the convolution of an ideal detector (rectangle function) with a small Gaussian blur [11] and uses the relative spectral response (RSR) curves given in Figure 3. This source intensity model was used with MODTRAN radiative transport calculations [15] to estimate atmospheric transmission, multiple scattering effects and background radiation at different sites using acquisition site geometries and given atmospheric conditions.
The HGS uses two independent 250 (scan) × 672 (track) CCD detector arrays to improve robustness against proton detector strikes. A rotating telescope assembly is used to create a whiskbroom scan and a separate scanning telescope enables straight forward baffling [16]. The CCD time delay integration (TDI) process is synchronized with each scan, which is key to DNB low light imaging [16]. The individual detectors within the DNB sensor are referred to as subpixels. Subpixel aggregation is performed over 32 zones that are symmetric about nadir to produce near constant 750 m horizontal ground sampling across the scan angle. At nadir the subpixels are 18 (scan) × 11 (track) m in size. According to values provided by Fulbright and Xiaoxiong [11] the optical PSF diameter is approximately 21 arcseconds (1.0e-4 radians) or 83 meters at nadir for the VIIRS orbit. This size PSF corresponds to approximately 30 subpixels at nadir reducing any potential subpixel non-uniformity effects.
At the nominal VIIRS DNB HGS pixel resolution, most active sources fill only a fraction of a pixel and should be considered as point sources. Point sources are radiometrically described by their radiant intensity I , typically expressed in units of W sr−1 [14]. VIIRS sensitivity, however, is defined in terms of TOA radiance L T O A in units of W cm−2 sr−1, a radiometric parameter for extended sources. The model therefore contains a simple method to convert point source radiant intensity to extended source radiance based on the following.
An extended radiance-based source can be considered as a series of point sources with radiant intensity I per unit area. If one defines the unit area as a pixel, the equivalent extended source radiance L can be estimated by the following expression:
L = I A p i x e l   ,
The unit area, defined as A p i x e l , is nominally 742 m × 742 m or 5.51x109 cm2 at nadir. Using this, a 55.10 W sr−1 per pixel TOA radiant intensity will be needed to achieve 1x10⁻⁸ W cm−2 sr−1 (approx. 3 × Lmin). Due to VIIRS CCD pixel aggregation and resampling, the area of a VIIRS pixel is known to approx. 1% (based on estimating pixel size from actual geolocation data).
This simple representation, however, does not include atmospheric effects. To include the atmosphere, the team started with a generalized but simple radiative transfer expression to estimate L TOA [17,18].
L T O A   = L A S ( θ )   +   L B   ,
where:
L A S = effective radiance from the Terra Vega point source [W cm−2 sr−1] after accounting for the finite pixel size
L B = radiance from the background [W cm−2 sr−1]
θ = zenith angle [radians]
The background radiance consists of several components including upwelling radiation from light pollution, airglow, and downwelling radiation striking the surface and reflected towards space. It could include lunar illumination but the source for now is typically operated under dark conditions (moonless or new moon).
If one describes L A S ( θ ) as:
L AS ( θ )   = M S L S ( θ ) T   ,
where:
M S = multiple scattering factor [-]
L S ( θ ) = Terra Vega surface (at source) radiance [W cm−2 sr−1]
T = total transmittance from the surface to the satellite [-]
For an active Lambertian illumination source, one can state:
M S =   1 1 s < ρ > ,
where:
s = spherical albedo [-]
< ρ > = average surface reflectance [-]
So that:
L T O A   =   L S ( θ ) T 1 s < ρ > +   L B   ,
A simplified radiative transfer diagram using these terms is shown below in Figure 4.
Radiance is calculated at each wavelength and is weighted by the RSR (not explicitly shown for notation compactness).
For the purposes of determining the required Terra Vega output source intensity, a series of ground to space atmospheric transmission values ( T ) were determined under a wide range of visibilities and view angle geometries using the MODTRAN radiative transport code. By way of example, these transmission estimates were made from the South Dakota calibration site ground altitude and used a mid-latitude summer atmosphere with rural aerosols. Visibility was varied from 5–200 km and sensor view zenith angle (VZA) was set to 0 and 30°. Terra Vega transmission values were estimated as a function of wavelength across the VIIRS DNB spectral region. The spectral transmission values were then integrated over the DNB bandpass using the RSR shown in Figure 3 to yield a series of single average transmission values, shown in Figure 5. Looking at visibilities at and above 50 km, which correspond to high visibility, high elevation view angles (ideal calibration opportunities), these single way average transmission values can be further averaged to approx. 0.85.
Since the average spherical albedo across the 500–650 nm spectral range (HPS peak emission) is less than 0.15 for clear conditions and vegetation has a low reflectance (< 0.15 in this region), we expect M S 1.01 1.02 .   Using the goal L T O A value of 1x10⁻⁸ W cm−2 sr−1, which is approx. 3 times greater than L m i n , one-way transmission to space at 0.85 and M S = 1.0 , the required Terra Vega source radiance L S is 1.17x10⁻⁸ W cm−2 sr−1. Using a VIIRS pixel area of 742 m × 742 m, the required Terra Vega lamp source intensity is about 65 W sr−1.

Terra Vega TOA Radiometric Expected Uncertainty in an Operational Setting

A preliminary assessment was performed to begin quantifying the uncertainty in Terra Vega generated TOA radiance within an operational setting. The assessment performed assumes the calibration point source would be collocated with atmospheric lidars and other instruments that measure nighttime aerosols and detect clouds and ideally near an AERONET atmospheric monitoring site [19]. In addition, the assessment assumes the point source was placed in a location having a dark enough background radiance to ensure the dominant signal was the source. Ideally, Terra Vega was also assumed to operate from a dry location with low atmospheric moisture to remove the temporal/spatial variability associated with night fog and mist.
It may be preferable to locate the source at a low enough latitude (< approx. 35°) so as to avoid significant VIIRS DNB stray light [20] even though stray light affects are reduced by the algorithm employed by the team that estimates the Terra Vega signal. Lower latitude placement may not be necessary, however, since the Terra Vega surface radiance algorithm subtracts dark pixels adjacent to and surrounding the illuminated Terra Vega pixels, removing the background which includes any residual stray light not corrected by the VIIRS stray light correction algorithm. Stray light under moonless conditions is approximately an order of magnitude smaller than Lmin [7,20].
Starting with Equation (2) above, assuming the background and Terra Vega effective radiances are uncorrelated and random [21], one can write the variance in top-of-atmosphere radiance as follows:
σ L T O A 2 =   σ L A S 2 + σ L B 2   ,
The uncertainty in L T O A can be written as:
( σ L T O A L T O A ) 2 =   ( σ L A S L T O A ) 2 + ( σ L B L T O A ) 2   ,
If one operates the Terra Vega on a clear night ( L U L T O A ) against a very low reflectance background ( < ρ > 0 ) whereby L T O A > 10 σ B , one can state:
( σ L A S L T O A ) 2   ( σ L A S L A S ) 2   ,
Equation (7) then becomes:
( σ L T O A L T O A ) 2 =   ( σ L A S L A S ) 2 + ( σ L B L T O A ) 2   ,
From Equation (3), assuming random and independent variables, one can state:
( σ L A S L A S ) 2 =   ( σ M S M S ) 2 + ( σ L S L S ) 2 + ( σ T T ) 2   ,
Therefore:
( σ L T O A L T O A ) 2 =   ( σ M S M S ) 2 + ( σ L S L S ) 2 + ( σ T T ) 2 +   ( σ L B L T O A ) 2 + ( 1 S N R ) 2   ,
Table 3 discusses the different uncertainty components as they relate to Equation (11) above. The table also includes preliminary estimates for each component along with the bases for each uncertainty term. This table should be considered a reasonable starting point to a more detailed assessment that would be required if Terra Vega is operationally fielded. The first term considered in the table is the Terra Vega ground source radiance uncertainty (σLs/Ls), which depends on several independent components, namely:
  • Sphere radiance (radiance standard)
  • Sphere exit port area
  • Sphere and trailer window transmission (two windows)
  • Pointing
  • VIIRS GSD
Since the ground source radiance components are independent of each other, they can be combined as a root square sum (RSS) for a total source ground radiance uncertainty of 3–5% (single measurement). In principle, the ground source radiance uncertainty could be reduced with improved spectroradiometry through round-robins and intercomparisons.
Of note, Table 3 also shows the uncertainty associated with the SNR of a VIIRS measurement. Since the SNR of the Terra Vega point source is approx. 100 within a VIIRS measurement at nadir, it will likely produce an error of approx. 1%. At off-nadir viewing, this error will increase to approx. 2%. Uncertainties due to potential pixel overlap have not as yet been considered. It is difficult to tell exactly how large the contribution from the potential pixel overlap could be without good knowledge of the PSF/MTF and additional investigations are required.
If one does not have a good estimate of the atmospheric transmission, the largest error by far is the uncertainty in ground-to-space transmission. Even for a clear night with a visibility near 100 km, a small error in the optical depth or visibility could lead to a ±3% error in transmission. (See Section 3.2.3 for more detail.) For non-ideal clear nights (lower visibility), this error is much larger.
Using the following preliminary estimated uncertainties in Table 3, in an operational environment, one can expect Terra Vega will provide an overall uncertainty of 5-6% in TOA radiance, which is comparable to the 5% goal set by NOAA [13]. This single measurement expected uncertainty value does not include possible uncertainties in the RSR. In addition, if multiple observations are averaged and the errors are independent and uncorrelated, the error will decrease by approximately the square root of the number of observations.

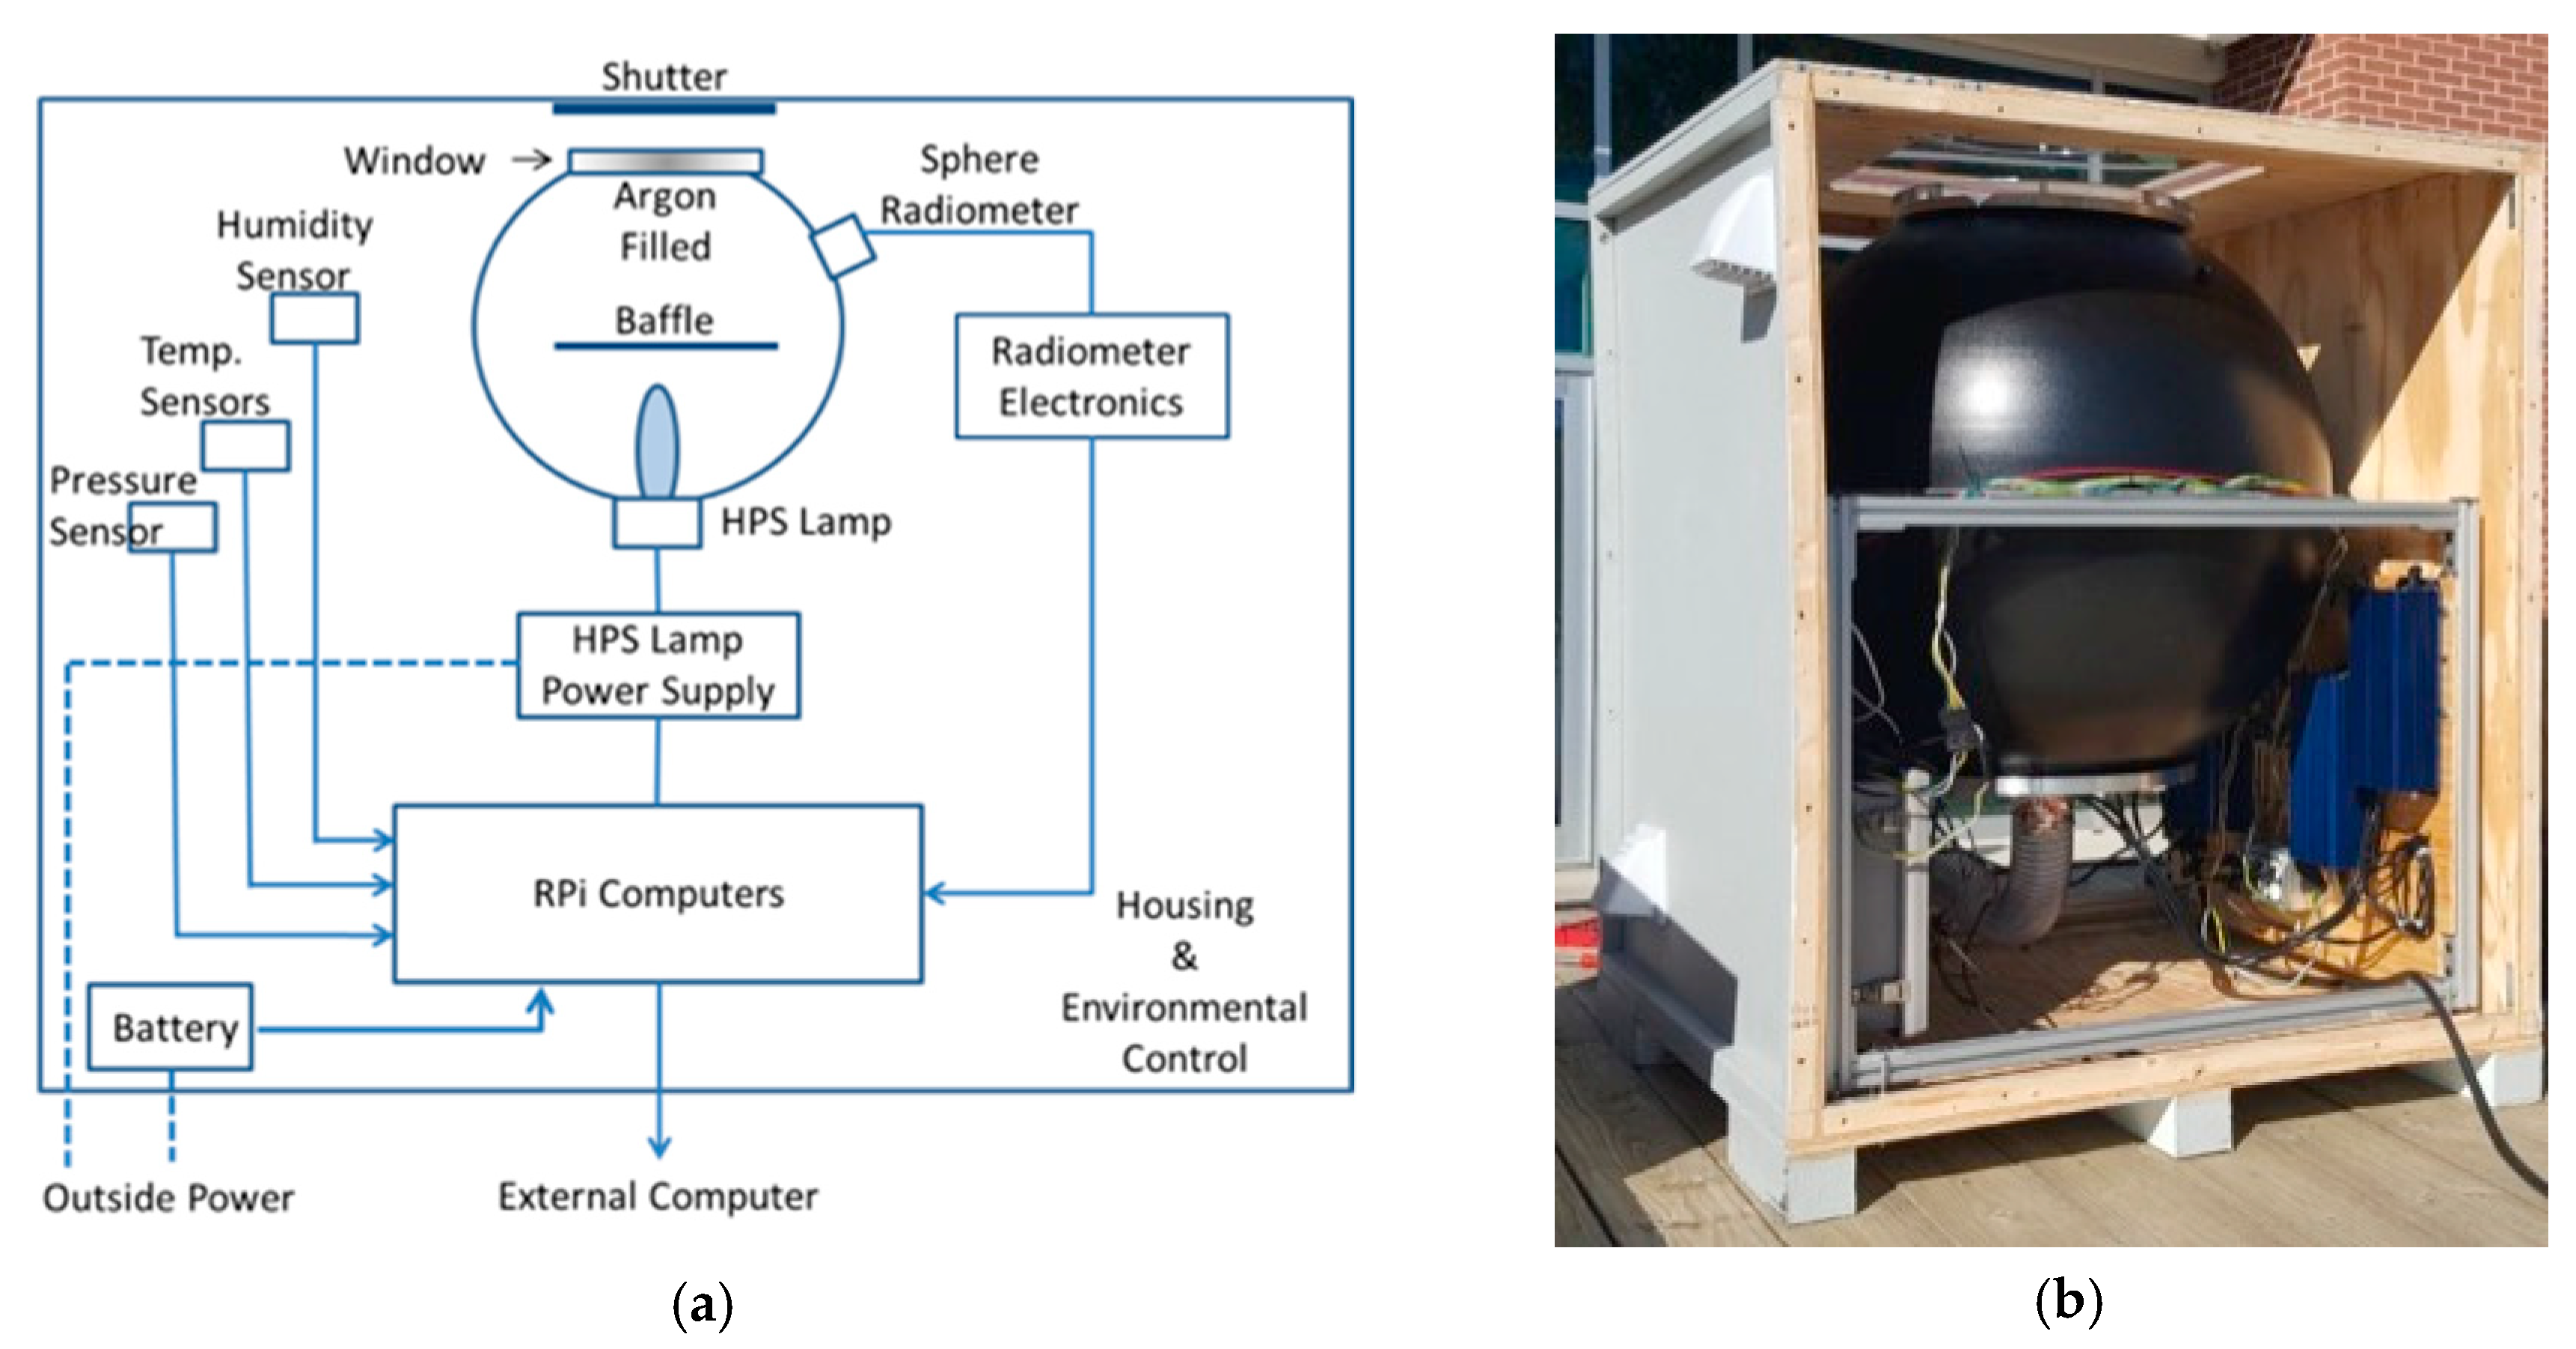
2.3. Terra Vega Hardware Implementation

Terra Vega is based on a large 1-meter diameter integrating sphere, shown in Figure 6. An integrating sphere can provide the greatest accuracy, simplest calibration and if properly isolated from the environment, a high chance of meeting the annual 1% stability (Table 1) and 5% TOA accuracy goals. An integrating sphere also produces well understood wide-angle Lambertian illumination, which enables larger viewing geometries (greater than ±30°), increasing the number of viewing opportunities over a given site. Source/spectrometer control and temperature/humidity monitoring are managed by two Raspberry Pi single board computers which communicate with a master control computer located outside the Terra Vega. The sphere is contained within an environmentally controlled housing emitting illumination through a shuttered aperture open only during clear weather, new/no moon VIIRS overpass. The unit can be powered using conventional wall power, battery bank or generator. During this investigation, to improve portability and field ruggedization, the Terra Vega was installed in a cargo trailer (Figure 7). Terra Vega illumination, ancillary measurements and automated control and functionality are provided below.

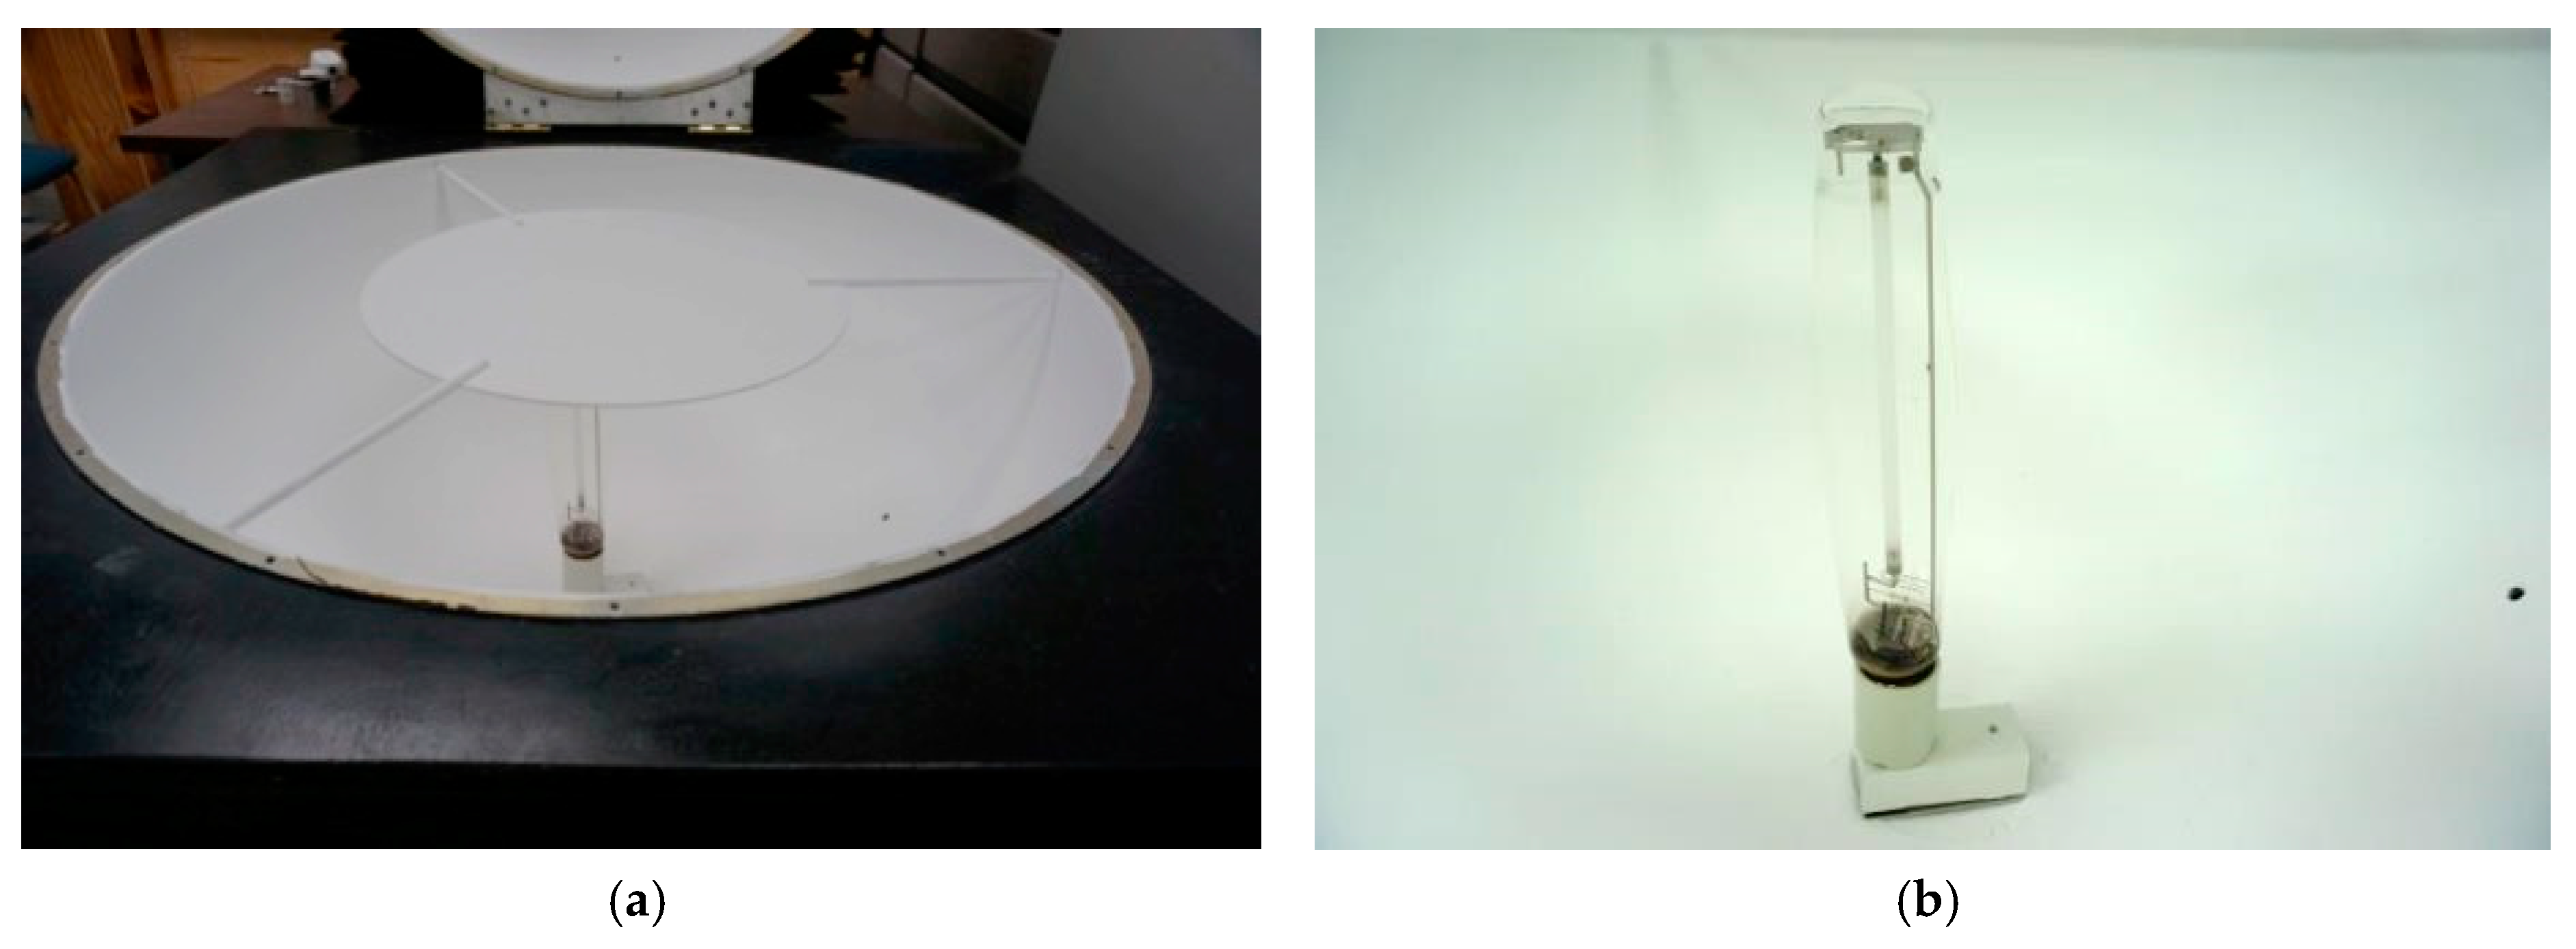
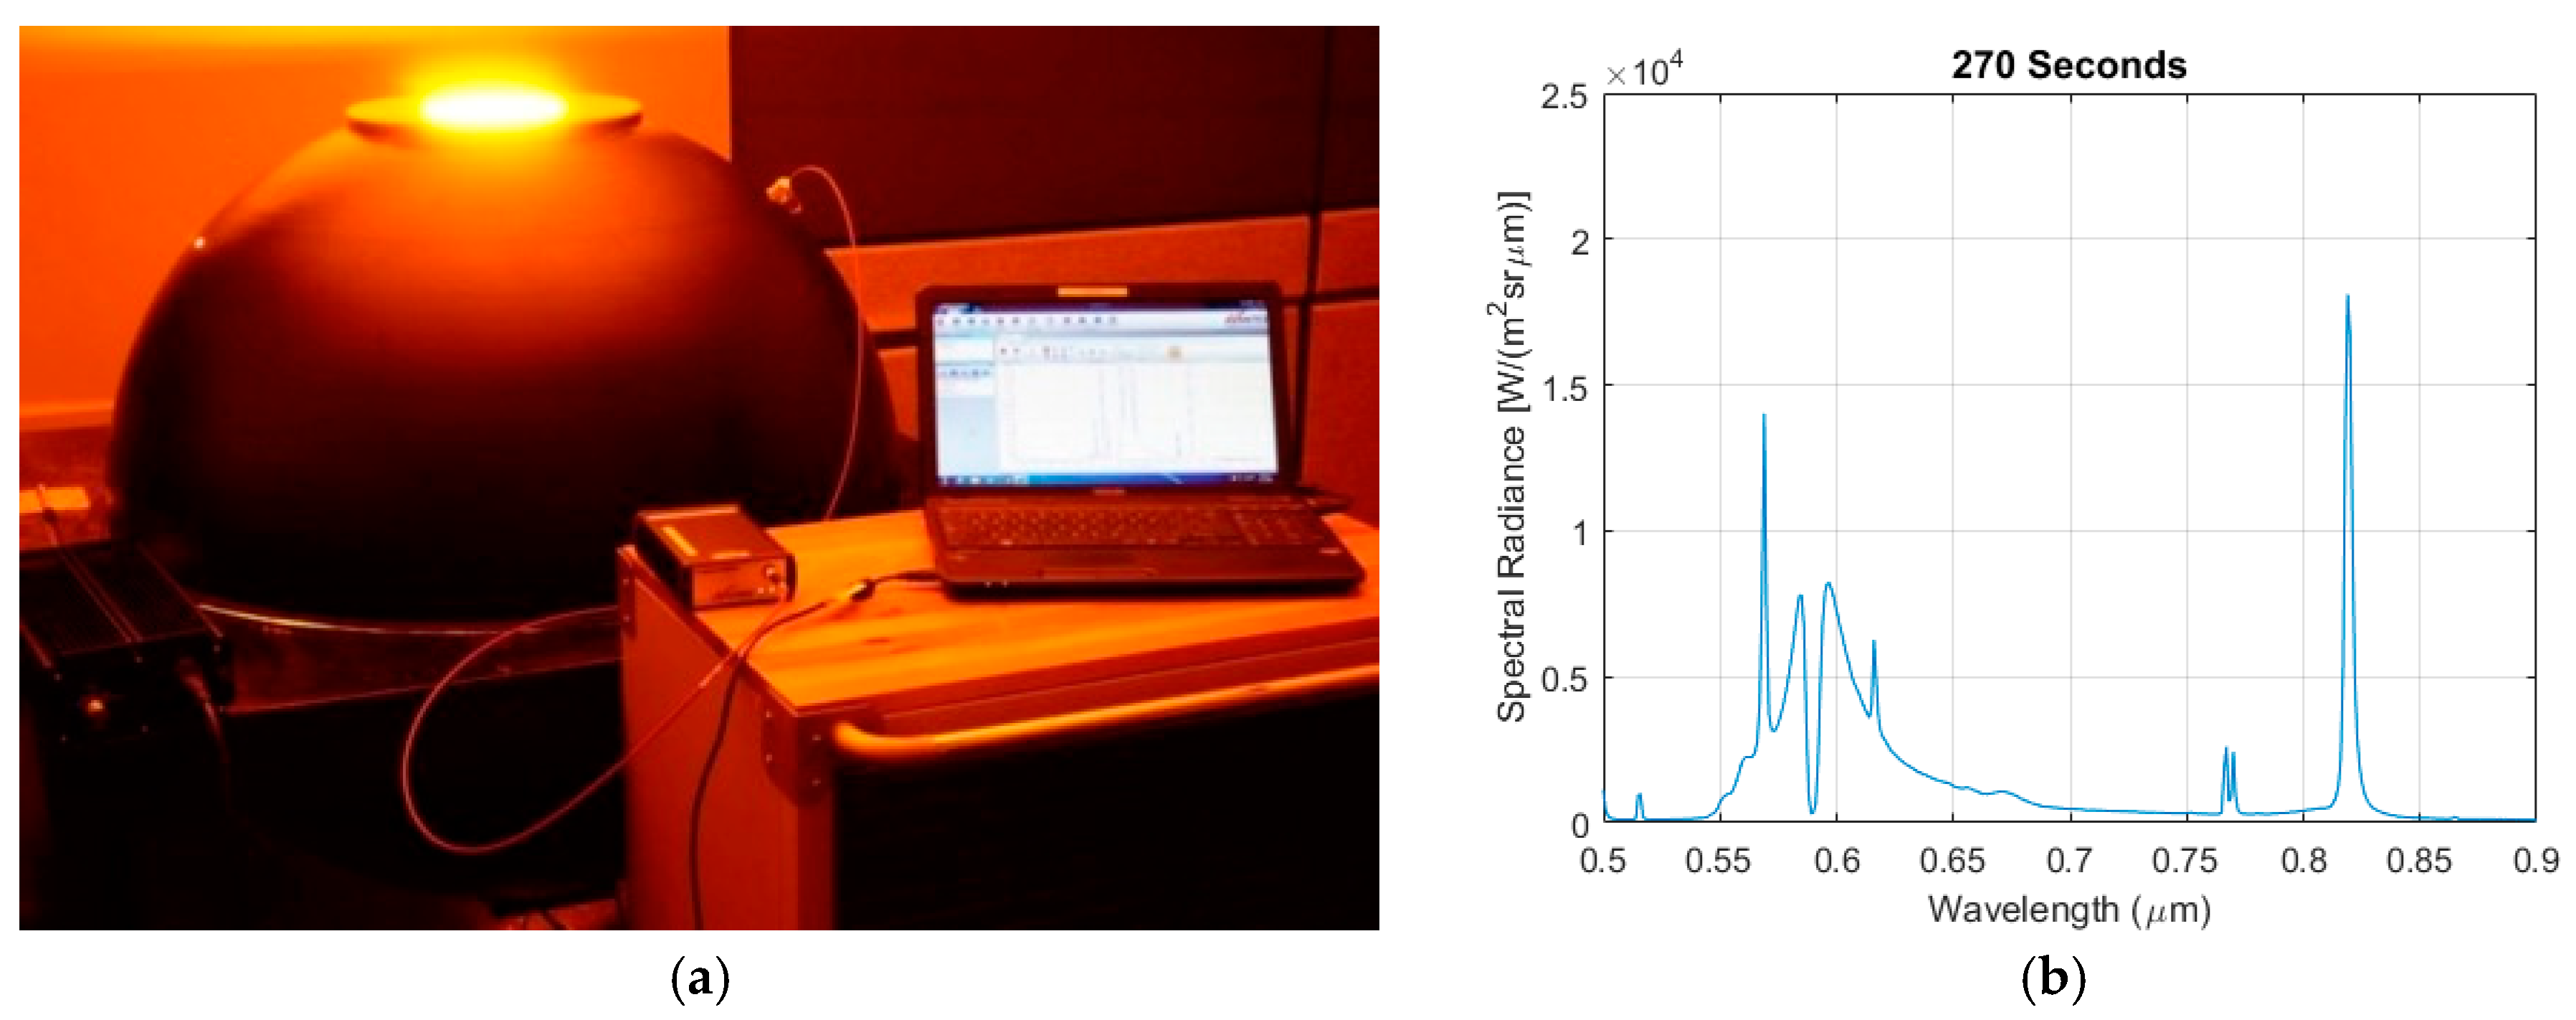
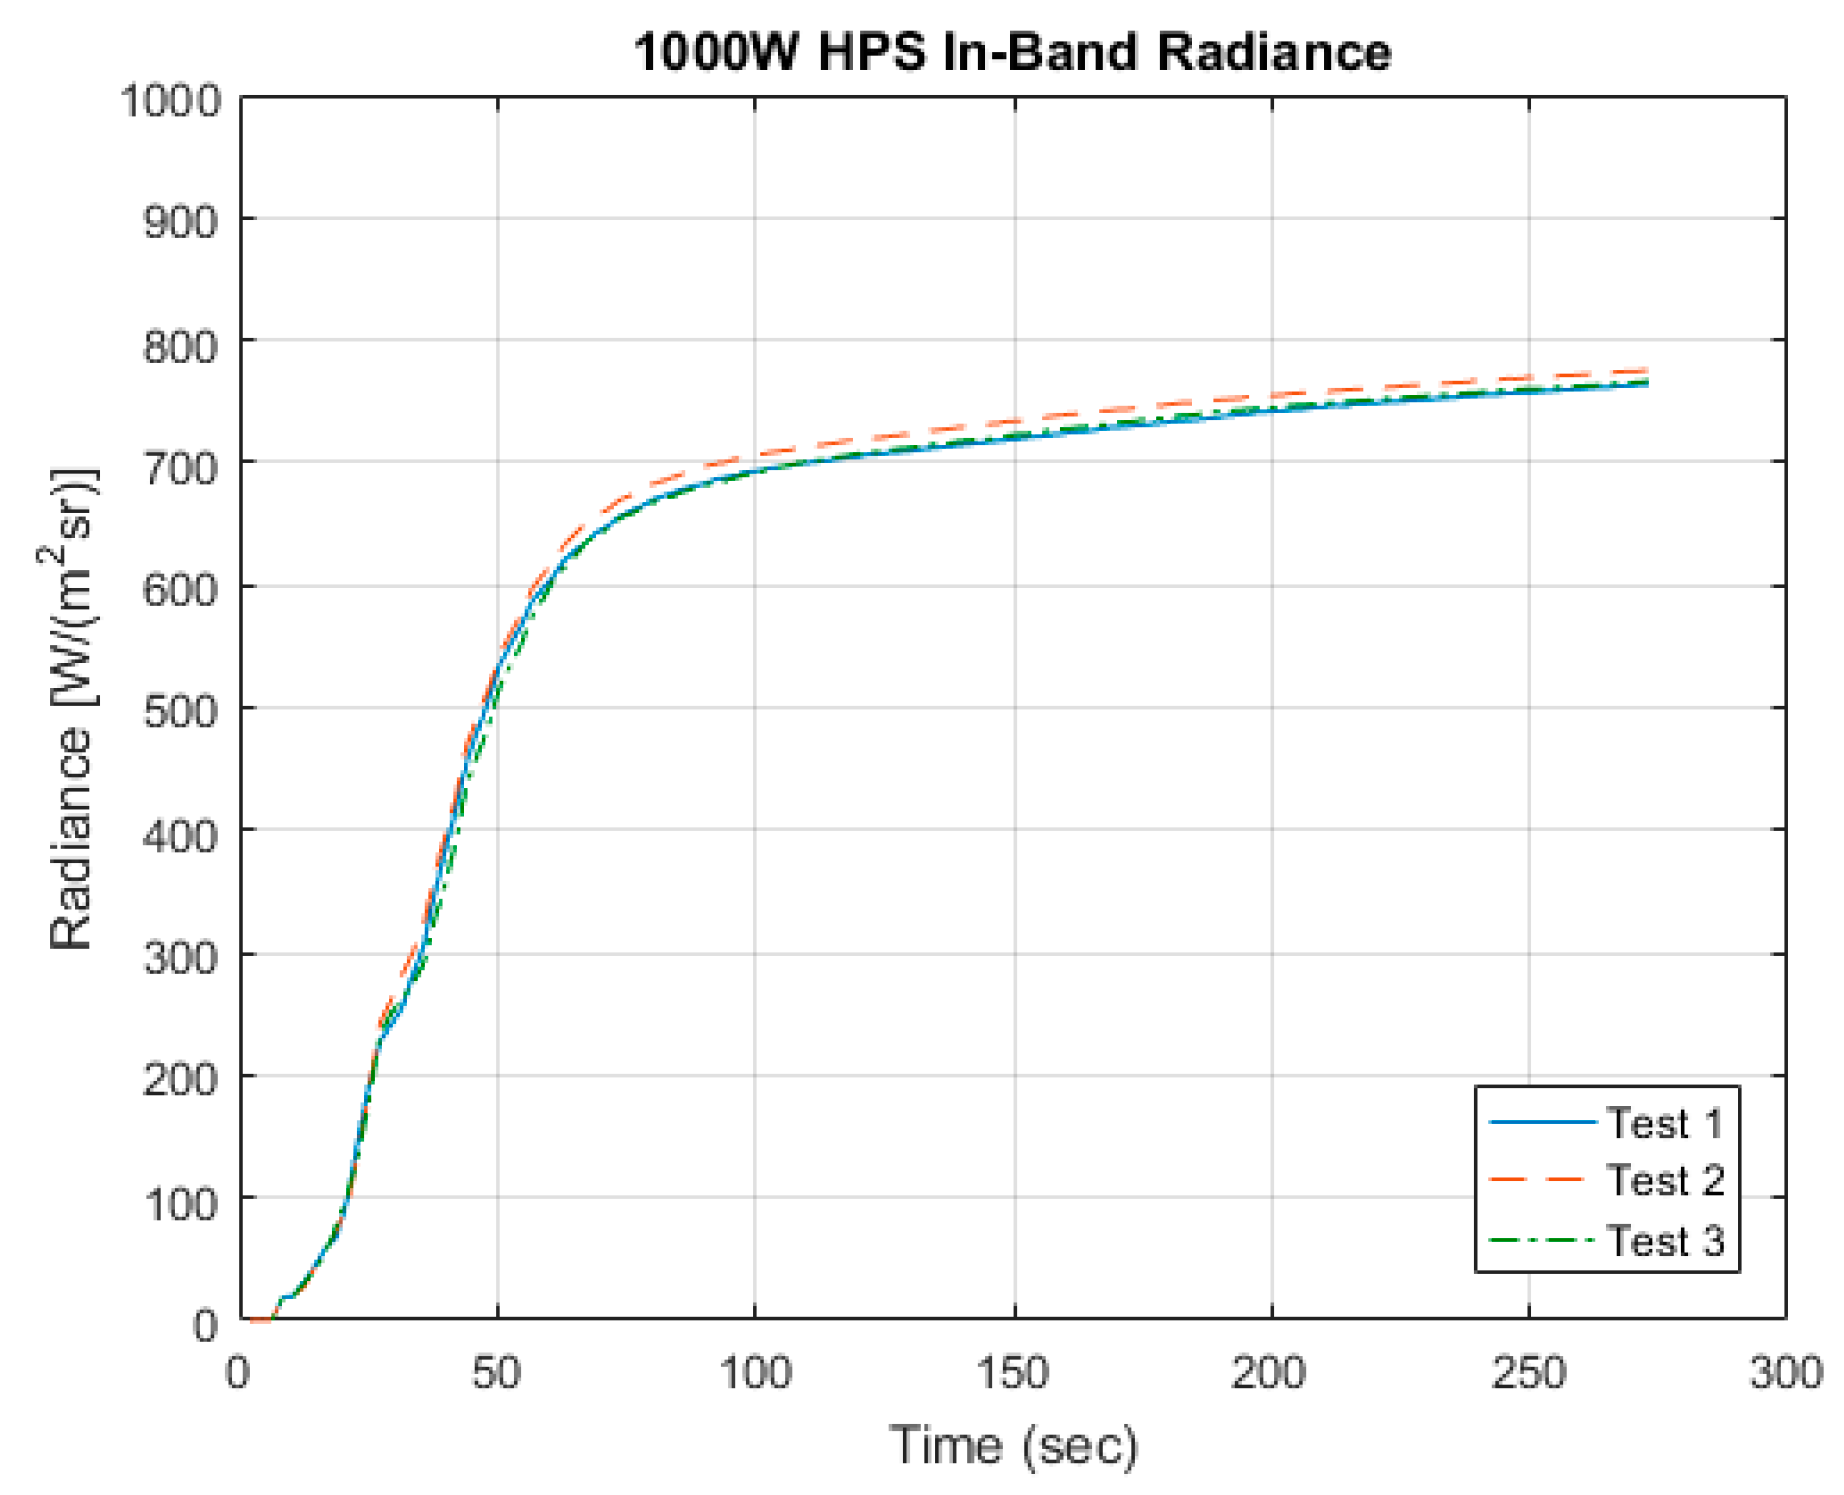
2.3.1. Terra Vega Illumination

The Terra Vega sphere houses four independently controlled 1 KW high-pressure sodium (HPS) lamps (Figure 8), the most common street lamp source, producing a radiance level of approx. 8x L m i n . In principle, the independent control of each lamp will allow discrete radiance levels to be selected. The design can also support other lamp types such as high intensity discharge and LED lamps. Terra Vega radiance is measured with a calibrated Avantes AvaSpec ULS 2048 USB spectrometer. Early Terra Vega HPS lamp testing, after seasoning, was conducted to confirm the number of lamps required. A sample spectrum from these tests is shown in Figure 9.
Lamp warm-up investigations were conducted as part of this investigation using a single 1 KW HPS lamp. Calibrated spectrometer measurements acquired during warm-up were integrated over the VIIRS DNB RSR to estimate the VIIRS at source in-band radiance. Figure 10 indicates that at this bulb-life point, the data are highly repeatable. Based on these results, during a VIIRS calibration sequence, the lamps are programmed to turn on approx. 5 minutes before an overpass to allow the lamps to warm-up and stabilize. The small increase in radiance that is observed after approx. 100 seconds can be accounted for with the calibrated spectrometer.

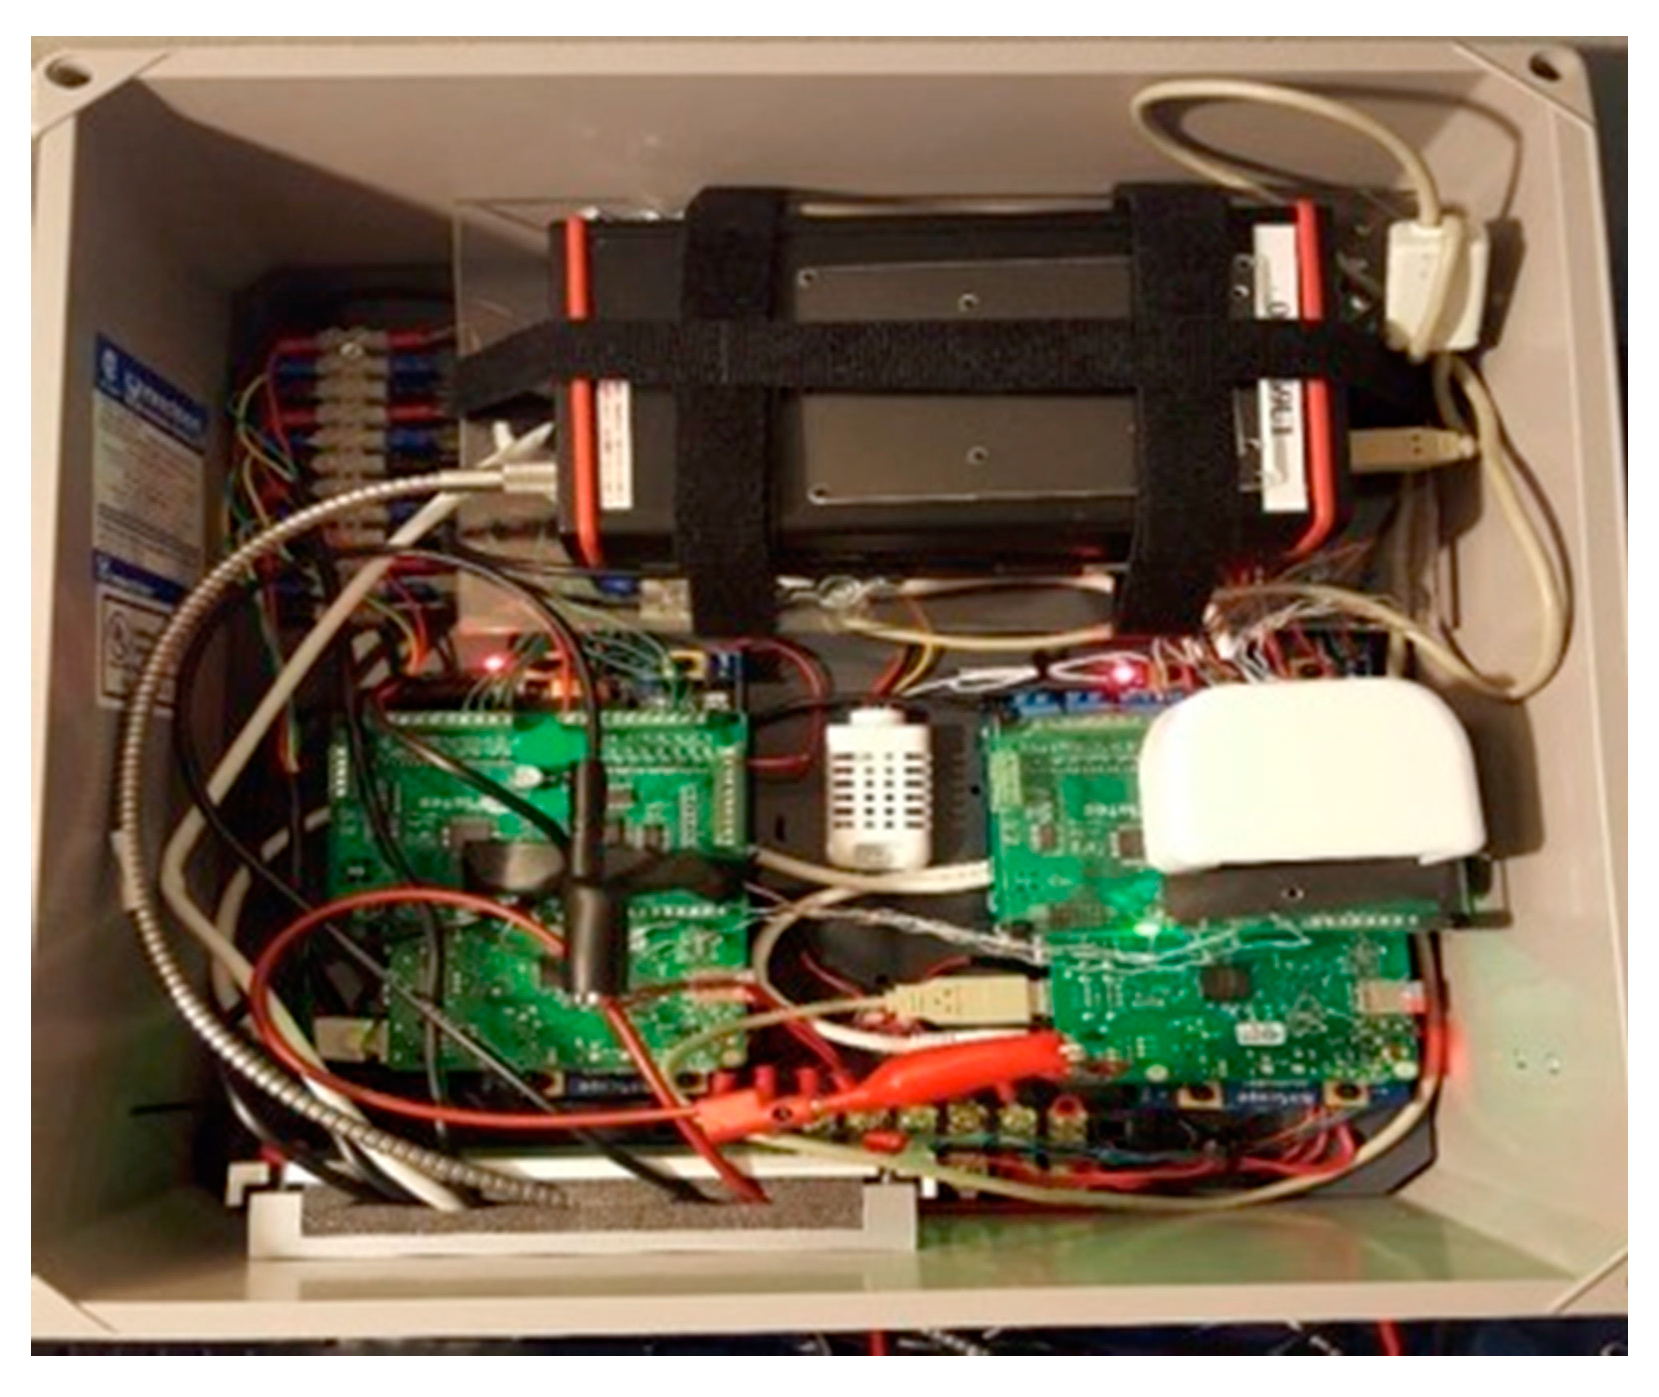
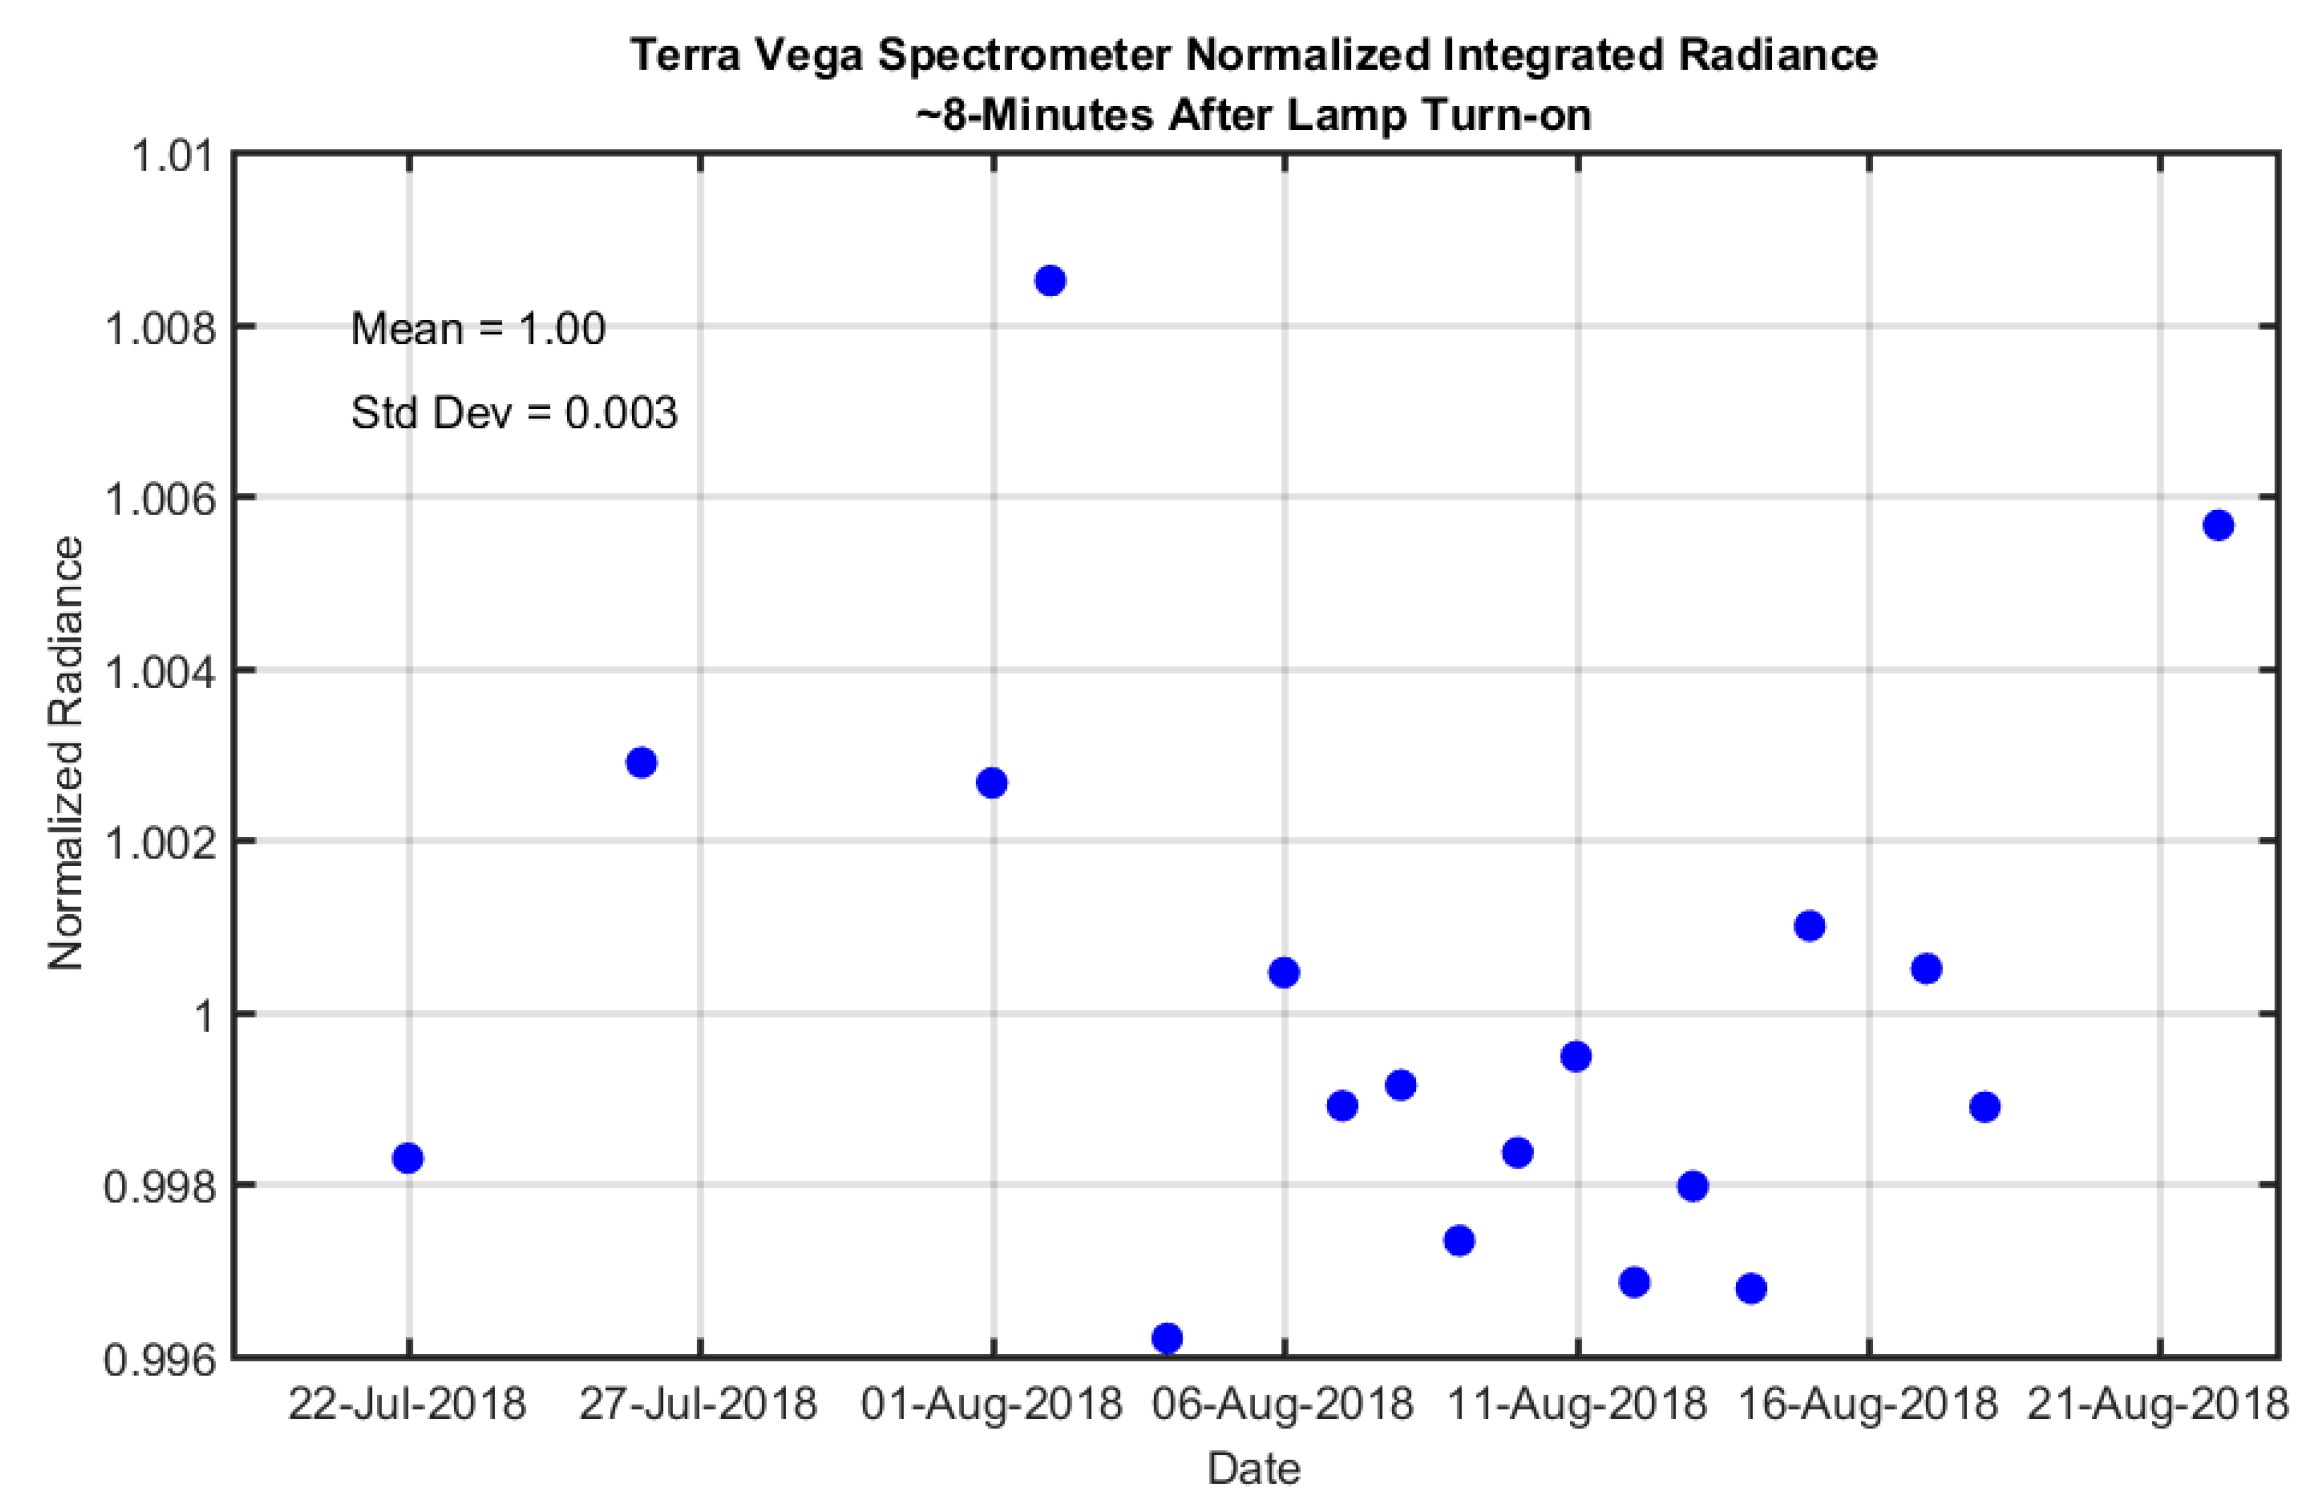
2.3.2. Terra Vega Automation and Control

A Master Controller (MC) unit, consisting of two Raspberry Pi Model 3B (RPi3) single board computers running Raspbian Linux “Jessie” (v 4.9.37-v7+) are housed within the enclosure to control the Terra Vega point source (Figure 11). The RPi3 was chosen because of its small size, built-in wireless/Ethernet and USB support, processing power and internal memory capacity (1.2 GHz 64-bit quad core CPU with 1 GB onboard RAM), and very low cost.
The RPi3s communicate with a 32 GB micro SD card containing the operating system files. The large capacity enables logging and measurement data files acquired over several months to be stored. With the built-in wireless and Ethernet functionality, the RPi3s are configured such that a user can establish an on-site SSH connection to them to manually operate the Terra Vega or perform maintenance tasks if desired.
Power to the RPi3s is provided through a 12 V deep-cycle marine battery that is continuously recharged through the main AC line installed at the deployment site.
Terra Vega operating tasks are divided between three RPi3s. The Logging RPi3 continuously acquires data from sensors placed in the MC unit and Terra Vega housing that monitor the Terra Vega overall operating status. The Sequence RPi3 drives the data collect sequence that is executed on dates with scheduled VIIRS overpasses and the Communication RPi3 performs external communication tasks and, in addition, acts as a time synch server for the other two RPi3s. Direct communication between the RPi3s is limited to exchange of status information during a data collect sequence. Nearly all of the MC software is implemented in Python.

Logging RPi3

The logging RPi3 drives sensor monitoring and recording information regarding the Terra Vega operating condition. This monitoring offers two benefits: i) it provides corresponding environmental information (e.g. ambient temperature, humidity, and barometric pressure) potentially useful in performing an accurate characterization of the Terra Vega lamp response (which in turn can impact the resulting calibration); and ii) it provides detailed information indicating developing or suddenly occurring issues that could adversely impact Terra Vega operation over time (e.g. elevated operating temperatures, moisture, MC power levels, etc.).
Four digital sensor probes are used to monitor temperatures near critical parts within the Terra Vega assembly. Ambient temperature, humidity, and barometric pressure in the MC unit are measured with an Adafruit digital sensor chip. Battery voltage is monitored with a voltage level sensor. The operating temperature of the Logging RPi3 itself is also monitored.

Sequence RPi3

The Sequence RPi3 controls mechanical relay circuits to power up and power down the lamps and cooling fan and to operate a retractable window cover in the Terra Vega assembly located directly over the integrating sphere. The retractable window cover is opened a few minutes before the VIIRS overpass and is closed shortly thereafter to reduce the window’s exposure to the elements and reduce maintenance and cleaning of the external window. The lamps are individually controlled so that any number of them can be turned on during a collect.
The Sequence RPi3 also controls a calibrated Avantes AvaSpec ULS 2048 USB spectrometer to measure the output produced from all working lamps in a short interval around the scheduled overpass time. Background or “dark” level measurements are acquired before the lamps are turned on and after a specified cooldown period following lamp turn off.
Primary external communication is established through a cellular modem. The modem contains built-in GPS capability to permit time synchronization when the Terra Vega is not connected to the Internet and cannot access an NTP time server; this functionality is critical given the RPi3’s lack of native real time clock support.

3. VIIRS DNB HGS Calibration and Feasibility Sites, Methods and Results

The following section describes the field sites, methodology and results achieved using the NIST-traceable Terra Vega point source. Separate calibrations were performed for the VIIRS DNB instruments that are installed on two different satellites, the NOAA-20 (formerly Joint Polar Satellite System (JPSS-1)) and the Suomi National Polar-orbiting Partnership (NPP).

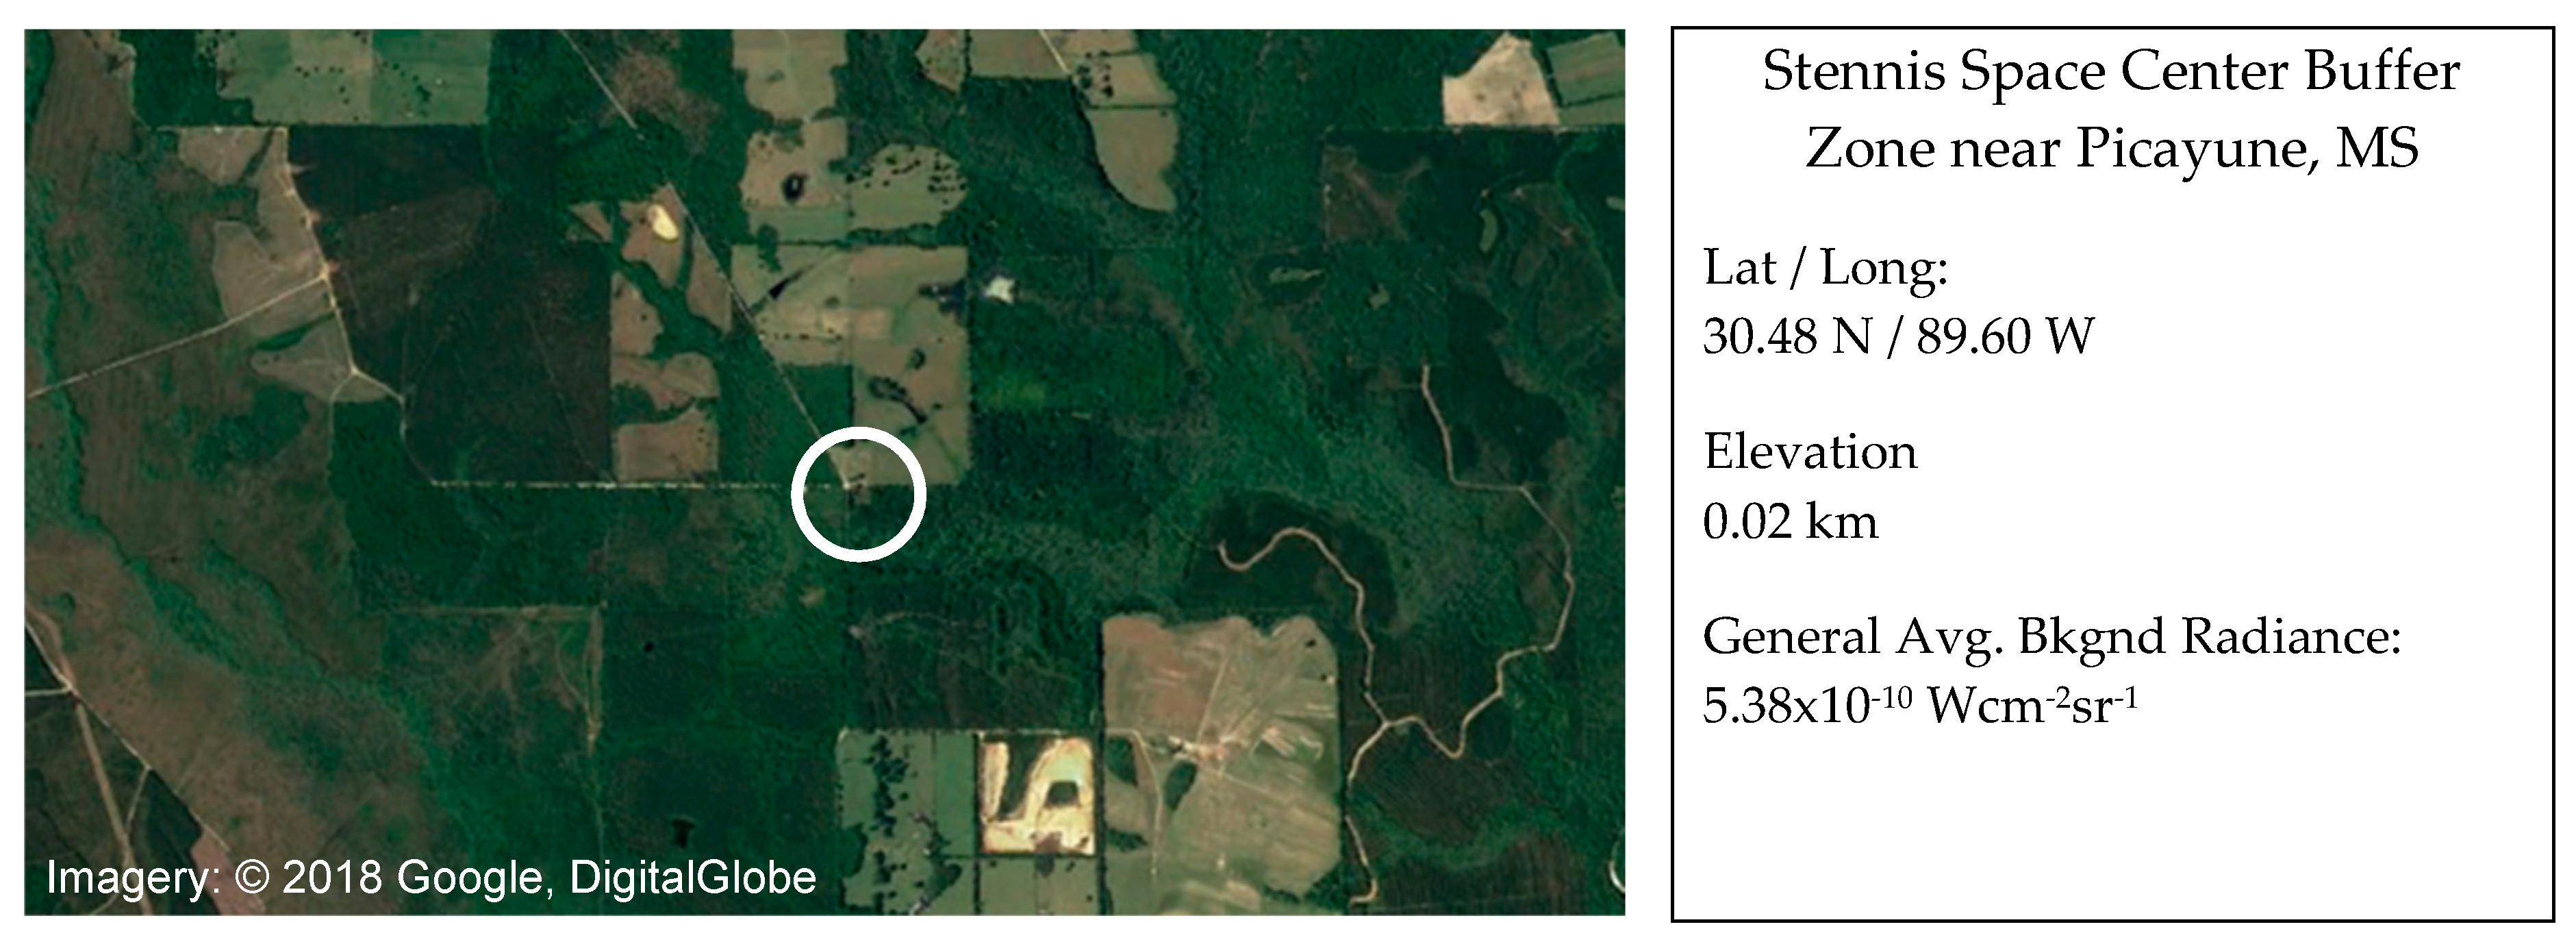
3.1. Calibration Sites

Two sites were chosen as early Terra Vega deployment sites. The first site, used to establish feasibility, is within the NASA Stennis Space Center (SSC) buffer zone near Picayune, MS. The second site, where early calibrations were performed, is at a small farm near Arlington, SD, near the SDSU campus. Although there is a time period each year when DNB data from South Dakota are affected by stray light, DNB stray light correction is applied during the VIIRS sensor data record (SDR) processing and any residual is removed by the Terra Vega radiance retrieval algorithm during the background subtraction step.
These two sites are described further in Figure 12 and Figure 13. Both locations are extremely dark. Based on VIIRS DNB HGS data, on a clear night, they have background radiances that are below Lmin (<1 × 10⁻⁹ W cm−2 sr−1). The Arlington, SD site can also provide electric power to the Terra Vega, which simplifies operation.
Terra Vega has been fielded, coincident with a VIIRS overpass 7 times, on clear nights with little to no lunar illumination, in support of VIIRS DNB HGS setting calibrations as summarized in Table 4 below. The first deployment, near Picayune, MS confirmed model results and validated that the VIIRS DNB operating in HGS was able to visually detect the light (Figure 14). The remaining deployments, all at the Arlington, SD site, were used to assess the ability to use the Terra Vega point source as a means to calibrate the VIIRS DNB HGS.
Because Terra Vega automation was not yet complete, a ground team was present during the initial (2017) feasibility and calibration exercises. All nights were clear with the exception of 9/29/17. On that night, just before the VIIRS satellite imaged the Terra Vega target, a ground fog similar to thin cirrus appeared. The 2018 calibration exercises were fully automated.

3.2. Calibration Method

A VIIRS DNB calibration was performed by comparing VIIRS measured target radiance to TOA radiance estimated from ground truth data.
The Terra Vega Avantes spectrometer was calibrated using a 1 KW quartz tungsten halogen (QTH) lamp illuminating a 12” × 12” Spectralon plaque that was monitored with a Labsphere calibrated CDS610 spectrometer. The CDS610 was calibrated at Labsphere with an integrating sphere whose uncertainty is less than 1–2% in the visible range. The transfer calibration uncertainty should be better than 1–3% [22]. The Terra Vega sphere radiance was also measured with a calibrated ASD FR spectroradiometer. The band integrated radiance values obtained using the two approaches agreed to within 2% of each other. The Avantes spectrometer wavelength calibration was verified with Hg and Ar pen lamp atomic emission line spectra.

3.2.1. VIIRS Measured Radiance

The Terra Vega target was located within each VIIRS image using fielded latitude/longitude coordinates. Early assessments, accounting for the VIIRS PSF and the Lambertian properties of the Terra Vega integrating sphere-based point source, determined that over 97% of the illumination exiting from Terra Vega would be captured in a single pixel, if it was located in the center of a VIIRS pixel. Based on the random location of Terra Vega with respect to a VIIRS pixel, a 3 × 3 pixel area around and including the point source target was selected as sufficient to capture the total radiance of the light source. An average background radiance was estimated as the mean value of the 16 pixels that surrounded the 3 × 3 target area. The total target radiance was then determined by summing the target pixels and subtracting the average background radiance as follows:
T o t a l   R a d i a n c e = i = 1 3 j = 1 3 ( T g t   P i x e l i j     A v g   B k g n d   R a d i a n c e )
The resulting VIIRS target and background radiance values for the six calibration deployments are shown in Table 5 below. It should be noted that the summed target radiance is approx. 40-150 × greater than the average background radiance showing the background is small compared to the target (i.e., dark conditions).

3.2.2. Terra Vega Measured Ground Source Radiance

For each calibration, the lamps within Terra Vega were sequentially turned on approx. 8 minutes before the overpass, giving them sufficient time to warm-up. During operation, the calibrated Avantes AvaSpec ULS 2048 USB spectrometer within Terra Vega monitored the sphere spectral radiance approximately every five seconds. Each recorded spectrum was an average of 950 spectra, each having a short 1.05 ms exposure. The Terra Vega output sphere radiance is high so short exposures are required. Short exposures also minimize the variation in dark frame values with temperature. Thirteen recorded spectra that span +/− 30 seconds of overpass time were obtained and converted to absolute VIIRS in-band surface radiance. The in-band radiance values were then averaged to determine the Terra Vega generated in-band surface radiance at time of overpass. An example of Terra Vega-normalized (to demonstrate stability) in-band radiance measured approx. 8 minutes after warmup over a one-month period is shown in Figure 15. The in-band radiance values were observed to be stable to approximately 1%.

3.2.3. Atmospheric Modeling

Without direct measurements of the transmission from the ground to the satellite at the time of overpass it is difficult to correct for the atmosphere. The overall error, however, is reduced compared to solar or lunar illuminated surfaces since the atmospheric propagation is a single path (ground-to-space) as compared to two path (space-to-ground and then ground-to-space). In an operational setting, Terra Vega would be collocated with atmospheric monitoring instrumentation; however, this capability was not available during early field campaigns.
Johnson et al. used the VIIRS DNB to estimate aerosol optical thickness (AOT) using artificial lights. They compared their VIIRS DNB results with the average of adjacent AERONET 675 nm AOT day results [3]. The 675 nm AOT band was selected since it was the closest to the center of the VIIRS RSR bandpass. They assigned an uncertainty to the AERONET measurement to be the difference between the two days’ AOTs and showed good correlation (approx. 0.7) between the VIIRS and AERONET results.
To understand the potential variability in this approach, the team analyzed one year’s worth of data from four potential calibration sites (Railroad Valley 2014, Frenchman Flat 2007, Sevilleta 2017 and White Sands 2017). Reviewing days having consecutive AERONET data, the team found the average RMSE of a two-day AOT difference case was 0.028 or approx. 3%. Assuming a stable air mass and no nighttime transient events, this directly translates into approx. 3% variability in atmospheric transmission (including molecular scattering and absorption components) throughout the night, consistent with the preliminary uncertainty assessment performed assuming collocated atmospheric measurements (Table 3). The sites chosen for this assessment are typically dry and have low humidity, which also likely reduces variability at night.
Noting the South Dakota calibration site does not have the same low humidity as the four sites described above, the team adopted the method of averaging nearby AERONET measurements taken one day before and one day following the VIIRS overpass to estimate atmospheric conditions at night during the time of overpass. To ensure reasonable atmospheric stability over this two-day period, all AERONET data were screened for anomalies and differences between consecutive day time measurements. A map showing the location of the AERONET site with respect to the South Dakota calibration site is shown in Figure 16.
Alternatively, visible observations of the night sky by a human observer or upward-pointed camera (visible spectrum star camera or infrared camera) at the time of overpass could be used to distinguish clear conditions from hazy ones. A star camera, for instance, could be used to search for obscured stars, indicating the presence of clouds. An automated (or even manual) review of coincident star camera images could also be performed to search for blurred or fuzzy light sources that would indicate a large aerosol PSF and uncertain atmospheric transmission in order to remove poor collects.

MODTRAN Model Atmosphere

The optical depth measurements for the South Dakota farm site were taken with a CIMEL sun photometer at a nearby AERONET site at SDSU. AERONET version 3 data were used for the October 2017 and all 2018 acquisitions and are preferred, when available, because there are fewer extremes and likely better outlier rejection. Version 2 optical depth data were used for both September 2017 acquisitions. L1.5 total optical depth measurements at eight wavelengths were converted to transmission using the air mass corresponding to the VIIRS elevation angle. The resulting transmission values at each wavelength from the day prior and day after the satellite overpass were averaged to yield a measured transmission. This can only be considered reasonable if the atmosphere is stable, i.e., the transmission values on either side of the overpass are close, and there are no transient events. This puts into question the validity of the 9/29/17 data collect, when it was noted that a thin cirrus-like ground fog rolled into the site just prior to satellite overpass.
A series of MODTRAN modeled atmospheres were then developed with differing visibilities, ozone and water vapor values using, for the South Dakota site, a mid-latitude winter (MLW) model atmosphere for the autumn 2017 acquisitions and mid-latitude summer (MLS) model for the summer 2018 acquisitions. A least squares approach was taken to determine the parameters that generated a spectral transmission that best matched the measured AERONET transmission (Table 6).

3.2.4. TOA Terra Vega Radiance

TOA Terra Vega radiance was estimated by first multiplying the Terra Vega measured spectral radiance by the estimated spectral transmission obtained using the MODTRAN model atmosphere. The resulting spectral radiance was then scaled to account for the Terra Vega sphere and external housing cover glass transmission (each at 0.92), and multiplied by the cosine of the view zenith angle to the sensor to account for sphere exit port Lambertian illumination. The scaled spectral radiance was then integrated over the appropriate VIIRS DNB RSR (Figure 3) to generate a single TOA total radiance. To convert this value to units of VIIRS effective radiance (described in Equation 1), it was then multiplied by the sphere exit port area (0.145 m2, based on a diameter of 43 cm) to express it in units of radiant intensity and then divided by the size of a VIIRS pixel (742 m × 742 m) to convert it back into units of radiance.

3.2.5. Comparison of TOA Terra Vega Radiance to VIIRS Measured Radiance

The estimated TOA Terra Vega radiance values (Section 3.2.4) were compared to the VIIRS total target radiance values (Section 3.2.1) and are shown below in Table 7 (for NPP) and Table 8 (for NOAA-20).
Table 7 and Table 8 show that the measurements acquired on the first and third 2017 calibration deployment dates and all 2018 dates yield TOA estimates that agree to within 1-11% of the measured VIIRS radiance and give confidence in this type of calibration method. During the 9/29/17 calibration deployment, a thin cirrus ground fog rolled in just before the VIIRS overpass and invalidated the atmospheric measurement premise that daytime atmospheric transmission measurements on either side of a nighttime satellite overpass are representative of the nighttime atmospheric conditions. The relatively low radiance measured on 8/11/18 is due to the relatively large off-nadir VIIRS view angle associated with that date (66.55°) and the lower averaged AERONET measured visibility (11 km).

4. Conclusions

This paper shows that the NIST-traceable Terra Vega point source can be used to successfully calibrate the VIIRS DNB operating in HGS with potentially higher accuracy than current extended source methods and more applicable to point sources. It also shows that an effective radiance can be determined using techniques similar to stellar photometry [23]. While to date, Terra Vega has been successfully used to generate TOA radiance only five times, the difference between VIIRS measured total target radiance and estimated Terra Vega TOA radiance differs by only 1–11%.
The first few calibration deployments were conducted prior to automation and required a small team in the field to operate Terra Vega (now fully automated). While not convienent, since these calibration overpasses occurred near 3:30AM local time, the team present at the collect noted a patch of local fog that rolled across the Terra Vega point source during one satellite overpass. Since the initial atmospheric monitoring approach taken by the team relied on a clear stable air mass between AERONET measurements acquired one day before and one day following the VIIRS overpass, this data point was appropriately excluded from the limited statistics that were generated.
Ground truthing depends not only on placing an active target with high SNR in the field of view of the sensor but also requires an accurate atmospheric measurement at the time of satellite overpass. The Terra Vega active light source only provides surface radiance and should be considered the first step in a new approach to performing absolute radiometric calibrations at night. While it is possible to achieve highly encouraging results when carefully fielding Terra Vega so as to limit calibrations to times with clear and stable air masses, the source should be fielded alongside instrumentation capable of providing coincident nighttime atmospheric measurements.
To address this need and advance the capabilities of Terra Vega, the light source will be modified to incorporate an upward-looking visible camera to record sky conditions at the time of overpass and determine if a calibration should be performed. A more robust method to quantitatively measure nighttime atmospheric conditions at the time of overpass has been conceived and a provisional patent has been applied for. Once the upward-looking visible camera is incorporated, based on the preliminary error assessment that was conducted, the team expects Terra Vega will produce illumination with a TOA radiometric accuracy in the 5–6% range for clear night skies. Knowledge of the atmosphere, at the time of overpass will further improve accuracy. Further work is needed to validate this preliminary uncertainty assessment.

5. Patents

A provisional patent has been submitted that will extend the Terra Vega capability to provide nighttime atmospheric monitoring in addition to providing NIST-traceable high SNR point source illumination.

Author Contributions

R.E.R. performed the analysis and developed the general methodology associated with putting Terra Vega into practice. C.C. conceived the notion of a NIST-traceable active source, defined its initial specifications and provided key information on the VIIRS DNB. R.E.R. and M.P. developed the detailed design and constructed the Terra Vega integrating sphere. L.L. designed and constructed the computer interface. T.R. wrote the control software. D.A., L.L., T.R., R.E.R. and M.P. field tested Terra Vega. K.B. and R.E.R. performed the radiative transfer calculations and developed the uncertainty budget to support the VIIRS DNB calibrations. S.B. provided VIIRS knowledge and assisted with the uncertainty budget and radiative transfer analysis. D.H. provided guidance and oversight at SDSU. R.E.R., M.P. and T.R. wrote, reviewed and edited the paper.

Funding

This research was funded by NOAA’s Small Business Innovative Research Phase I and Phase II grant numbers WC-133R-15-CN-0065 and WC-133R-16-CN-0099. The manuscript contents are solely the opinions of the author(s) and do not constitute a statement of policy, decision, or position on behalf of NOAA or the U. S. Government.

Conflicts of Interest

The authors declare no conflict of interest.

References

  1. Román, M.O.; Wang, Z.; Sun, Q.; Kalb, V.; Miller, S.D.; Molthan, A.; Schultz, L.; Bell, J.; Stokes, E.C.; Pandey, B.; et al. NASA’s Black Marble nighttime lights product suite. Remote Sens. Environ. 2018, 210, 113–143. [Google Scholar] [CrossRef]
  2. Elvidge, C.D.; Baugh, K.E.; Zhizhi, M.; Hsu, F.-C. Why VIIRS data are superior to DMSP for mapping nighttime lights. Proc. Asia Pac. Adv. Netw. 2013, 35, 62–69. [Google Scholar] [CrossRef]
  3. Johnson, R.S.; Zhang, J.; Hyer, E.J.; Miller, S.D.; Reid, J.S. Preliminary investigations toward night time aerosol optical depth retrievals from the VIIRS Day/Night Band. Atmos. Meas. Tech. 2013, 6, 1245–1255. [Google Scholar] [CrossRef]
  4. Cao, C.; Shao, X.; Uprety, S. Detecting Light Outages after Severe Storms Using the S-NPP/VIIRS Day/Night Band Radiances, Geoscience and Remote Sensing Letters. IEEE Geosci. Remote Sens. Lett. 2013, 10, 1582–1586. [Google Scholar] [CrossRef]
  5. NASA Earth Observatory. Available online: https://earthobservatory.nasa.gov/images/78445 (accessed on 15 July 2018).
  6. Cao, C.; Bai, Y. Quantitative analysis of VIIRS DNB nightlight point source for light power estimation and stability monitoring. Remote Sens. 2014, 6, 11915–11935. [Google Scholar] [CrossRef]
  7. Liao, L.; Weiss, S.; Mills, S.; Hauss, B. Suomi NPP VIIRS day-night band on-orbit performance. J. Geophys. Res. 2013, 118, 12705–12718. [Google Scholar] [CrossRef]
  8. Ma, S.; Yan, W.; Huang, Y.-X.; Ai, W.-H.; Zhao, X. Vicarious calibration of S-NPP/VIIRS day-night band using deep convective clouds. Remote Sens. Environ 2015, 158, 42–55. [Google Scholar] [CrossRef]
  9. Cao, C.; Zong, Y.; Bai, Y.; Shao, X. Preliminary study for improving the VIIRS DNB low light calibration accuracy with ground based active light source. In Earth Observing Systems XX; 96070D1-96070D8; Butler, J.J., Xiong, X., Eds.; International Society for Optics and Photonics: San Diego, CA, USA, 2015. [Google Scholar] [CrossRef]
  10. Tuttle, B.T.; Anderson, S.; Elvidge, C.; Ghosh, T.; Baugh, K.; Sutton, P. Aladdin’s Magic Lamp: Active Target Calibration of the DMSP OLS. Remote Sens. 2014, 6, 12708–12722. [Google Scholar] [CrossRef] [Green Version]
  11. Fulbright, J.P.; Xiaoxiong, X. Suomi-NPP VIIRS day/night band calibration with stars. In Earth Observing Systems XX; Butler, J.J., Xiong, X., Eds.; International Society for Optics and Photonics: San Diego, CA, USA, 2015; p. 96071S. [Google Scholar] [CrossRef]
  12. Smith, A.W.; Woodward, J.T.; Jenkins, C.A.; Brown, S.W.; Lykke, K.R. Absolute flux calibration of stars: Calibration of the reference telescope. Metrologia 2009, 46, S219. [Google Scholar] [CrossRef]
  13. NOAA Small Business Innovation Research FY2015 Amendment 0001 dated October 16, 2014, Program Solicitation: NOAA2015-1, Subtopic 8.4.3D. Available online: https://www.sbir.gov/node/691982 (accessed on 17 February 2019).
  14. Wolfe, W.L. Introduction to Radiometry, Tutorial Texts in Optical Engineering Vol. TT29; SPIE Press: Bellingham, WA, USA, 1998; pp. 3–25. ISBN 9780819427588. [Google Scholar]
  15. Berk, A.; Anderson, G.P.; Acharya, P.K.; Bernstein, L.S.; Muratov, L.; Lee, J.; Fox, M.; Adler-Golder, S.M.; Chetwynd, J.H.; Hoke, M.L.; et al. MODTRAN 5: A reformulated atmospheric band model with auxiliary species and practical multiple scattering options: Update. In Algorithms and Technologies for Multispectral, Hyperspectral, and Ultraspectral Imagery X.; Shen, S.S., Lewis, P.L., Eds.; International Society for Optics and Photonics: Orlando, FL, USA, 2005; Volume 5806, pp. 662–668. ISBN 9780819457912. [Google Scholar]
  16. Schueler, C.F.; Clement, J.E.; Ardanuy, P.E.; Welsch, C.; DeLuccia, F.; Swenson, H. NPOESS VIIRS sensor design overview. In Earth Observing Systems VI; International Society for Optics and Photonics: San Diego, CA, USA, 2002; Volume 4483, pp. 11–24. [Google Scholar] [CrossRef]
  17. Schott, J.R. Remote Sensing: The Image Chain Approach; Oxford University Press on Demand: New York, NY, USA, 2007. [Google Scholar]
  18. Tanré, D.; Herman, M.; Deschamps, P.Y.; De Leffe, A. Atmospheric modeling for space measurements of ground reflectances, including bidirectional properties. Appl. Opt. 1979, 18, 3587–3594. [Google Scholar] [CrossRef] [PubMed]
  19. Holben, B.N.; Eck, T.F.; Slutsker, I.; Tanre, D.; Buis, J.P.; Setzer, A.; Vermote, E.; Reagan, J.A.; Kaufman, Y.J.; Nakajima, T.; et al. AERONET—A federated instrument network and data archive for aerosol characterization. Remote Sens. Environ. 1998, 66, 1–16. [Google Scholar] [CrossRef]
  20. Mills, S.; Jacobson, E.; Jaron, J.; McCarthy, J.; Ohnuki, T.; Plonski, M.; Searcy, D.; Weiss, S. Calibration of the VIIRS Day/Night Band (DNB). In Proceedings of the American Meteorological Society 6th Annual Symposium on Future National Operational Environmental Satellite Systems-NPOESS and GOES-R, 2010, Atlanta, GA, USA, 16–21 January 2010; Volume 9, pp. 1–9. [Google Scholar]
  21. Taylor, J. Introduction to Error Analysis, the Study of Uncertainties in Physical Measurements, 2nd ed.; University Science Books: Sausalito, CA, USA, 1982; pp. 60–61. ISBN 0-935702-42-3. [Google Scholar]
  22. Chrien, T.G.; Green, R.O.; Eastwood, M.L. Accuracy of the spectral and radiometric laboratory calibration of the Airborne Visible/Infrared Imaging Spectrometer. In Imaging Spectroscopy of the Terrestrial Environment; International Society for Optics and Photonics: Orlando, FL, USA, 1990; Volume 1298, pp. 37–50. [Google Scholar] [CrossRef]
  23. Mighell, K.J. Algorithms for CCD stellar photometry. In Astronomical Data Analysis Software and Systems VIII; Astronomical Society of the Pacific: San Fransisco, CA, USA, 1999; Volume 172, pp. 317–328. ISBN 1-886733-94-5. [Google Scholar]
Figure 1. VIIRS nighttime imagery used to monitor power outages. (a) Normal conditions are shown in imagery acquired on June 28, 2012, while imagery acquired on June 30, 2012 (b) shows the extent of a fast-moving thunderstorm that swept through the Baltimore-Washington DC area on June 29th. [5].
Remotesensing 11 00710 g001
Figure 2. VIIRS DNB dynamic range.
Remotesensing 11 00710 g002
Figure 3. VIIRS DNB relative spectral response.
Remotesensing 11 00710 g003
Figure 4. Radiative transfer schematic for TOA radiance for Terra Vega without lunar illumination.
Remotesensing 11 00710 g004
Figure 5. Average in-band Terra Vega illumination transmission from ground to space using the South Dakota calibration site ground altitude, mid-latitude summer atmosphere, rural aerosols, Terra Vega HPS lamp spectra and the VIIRS HGS DNB spectral bandpass for the purpose of sizing the TerraVega lamp source intensity to be seen at high SNR by VIIRS DNB operating in HGS.
Remotesensing 11 00710 g005
Figure 6. Terra Vega (a) design schematic and (b) in open housing prior to fielding in South Dakota.
Remotesensing 11 00710 g006
Figure 7. Terra Vega installed within a trailer (a) beneath a protected window with retractable cover and (b) in operation at the South Dakota site.
Remotesensing 11 00710 g007
Figure 8. A 1 KW HPS lamp shown (a) installed underneath a baffle within the sphere and (b) close up with the baffle removed.
Remotesensing 11 00710 g008
Figure 9. Early Terra Vega laboratory testing showing (a) experimental setup and (b) 600 W HPS lamp spectral radiance measured within the Terra Vega sphere 270 seconds after being turned on. To prevent saturation, measurements were acquired with a 0.6-mm thick polypropylene diffuser in front of the spectrometer fiber.
Remotesensing 11 00710 g009
Figure 10. 1 KW HPS lamp in-band radiance measured within the Terra Vega sphere for 270 seconds after being turned on. To prevent saturation, measurements were acquired with a polypropylene diffuser, 0.6-mm thick, in front of the spectrometer fiber.
Remotesensing 11 00710 g010
Figure 11. Master Computer (MC) unit; showing internal components.
Remotesensing 11 00710 g011
Figure 12. Calibration site at a farm near Arlington, South Dakota.
Remotesensing 11 00710 g012
Figure 13. Stennis Space Center buffer zone feasibility site near Picayune, Mississippi.
Remotesensing 11 00710 g013
Figure 14. VIIRS DNB imagery (a) on March 18, 2017 without the Terra Vega and (b) on March 23, 2017 with the Terra Vega. The test site target pixel is identified in both images with a red arrow. The dark annulus region within the image is the SSC buffer zone. Background radiance differs between the two dates due to atmospheric conditions. Zoom-ins of the target area are shown in (c) and (d).
Remotesensing 11 00710 g014
Figure 15. Terra Vega generated in-band radiance over a one-month period measured using a calibrated AvaSpec ULS 2048 USB spectrometer.
Remotesensing 11 00710 g015
Figure 16. South Dakota calibration site in relation to the SDSU AERONET site. The distance between the two sites is 29 km.
Remotesensing 11 00710 g016
Table 1. Terra Vega Performance Goals.
Performance ParameterNOAA Provided Performance GoalUpdated Performance Goal
Effective radiance output> Lmin (3 × 10⁻⁹ W cm−2 sr−1)> Lmin (1 × 10⁻⁸ W cm−2 sr−1)
(achieved 2.5 × 10⁻⁸ W cm−2 sr−1)
Corrected systematic drift< 1%< 1%
TOA absolute radiometric accuracy
(SI traceable)
Accurate to within 5% (with good atmospheric knowledge) Accurate to within 5% (with good atmospheric knowledge)
Viewing angle± 10°± 30°
Table 2. VIIRS HGS DNB Characteristics on-board Suomi NPP.
HGS DNB CharacteristicsPrelaunch PerformanceOn-Orbit Performance
Orbit (Polar)N/A827 km alt, 98°
Swath (±56°)N/A3000 km
Nighttime Equator Crossing N/A1:30 AM
Spectral Bandpass Center707 nmModel estimate center 694 nm
Spectral Bandpass Bandwidth379 nmModel estimate 375 nm
Horizontal Sample Interval742 m scan 742 m track704–790 m scan, 734–777 m track
Horizontal Spatial Resolution (HSR)<820 m scan, <670 m track
MTF(1/(2*HSR)) = 0.5
<750 m <52° scan, <750 m <52° track
MTF(1/(2*HSR)) = 0.52
HGS Lmin3 × 10−9 W cm−2 sr−13 × 10−9 W cm−2 sr−1
HGS calibration accuracy11%15% (1σ)
SNR @ HGS LminSNR >10 @ end of scan or approx. 40 at nadir SNR>9 across scan after degradation
Stray lightN/A>100% Lmin, approx. 15% Lmin after corr.
Table 3. Expected LTOA Uncertainties when Fielding Terra Vega (Clear Conditions).
TermContribution TermEstimated Uncertainty (%)Comment/Justification
σ L s L s Radiance standard2Conservative estimate for commercially available calibration spheres in the visible range
Transfer uncertainty1–3Conservative estimate. Round robin needed to verify
Spectrometer stability1–2Measurements of similar spectrometers by authors
Sphere exit port area<0.5Analysis of manufacturing tolerances. Sphere exit port is machined to approx. 250 micron tolerance
Sphere and trailer window transmission1–2Analysis of Fresnel equations for unpolarized radiation, average 30° cone and assumption that windows are periodically cleaned
Pointing0.5–1Analysis of leveling error (1–2°) and assumption that periodic leveling will be needed
VIIRS GSD1Subpixel aggregation is used to minimize GSD variations. Known GSD used for measurement
RSS3–5Total ground source radiance
σ M s M s 1For clear conditions and relatively low reflectance background the uncertainty in the multiple scatter should be < 1%. May be larger at bright sites
σ T T 3Assumes Terra Vega is fielded under clear conditions and near atmospheric monitoring. Based on models and predictions. Will be much larger without clear conditions and monitoring.
σ L B L T O A <1Active source much larger than background radiance. Measured background is measured and subtracted and includes VIIRS residual stray light
SNR 1–2For the Terra Vega radiance level, the VIIRS DNB HGS has a SNR approx. 100 at nadir.
σ L T O A L T O A 5–6RMS
Table 4. Terra Vega Deployment Overview.
SatelliteElevation Angle (max)DateOverpass TimeLocationVisibility at OverpassAvailable PowerPurpose
Suomi NPP88.60°3/23/177:44:38 UTCPicayune, MSClearGeneratorFeasibility
Suomi NPP75.26°9/28/178:38:28 UTCArlington, SDClearWall powerCalibration
Suomi NPP76.76°9/29/178:19:41 UTCArlington, SDThin cirrus presentWall powerCalibration
Suomi NPP86.68°10/20/178:25:59 UTCArlington, SDClearWall powerCalibration
NOAA-2066.55°8/11/188:43:37 UTCArlington, SDClearWall powerCalibration
NOAA-2084.19°8/17/188:31:08 UTCArlington, SDClearWall powerCalibration
NOAA-2074.99°8/22/188:37:25 UTCArlington, SDClearWall powerCalibration
Table 5. VIIRS Summed Target and Average Background Radiance Values.
SatelliteDateVIIRS Summed Target Radiance [Wcm−2sr−1]VIIRS Average Background Radiance [Wcm−2sr−1]VIIRS Total Target Radiance [Wcm−2sr−1]
Suomi NPP9/28/172.52 × 10−83.32 × 10−102.49 × 10⁻⁸
Suomi NPP9/29/171.78 × 10−83.76 × 10−101.74 × 10⁻⁸
Suomi NPP10/20/172.26 × 10−85.42 × 10−102.20 × 10⁻⁸
NOAA-208/11/181.42 × 10−89.38 × 10−111.41 × 10⁻⁸
NOAA-208/17/182.10 × 10−81.81 × 10−102.08 × 10⁻⁸
NOAA-208/22/182.43 × 10−83.04 × 10−102.40 × 10⁻⁸
Table 6. MODTRAN parameters used to determine atmospheric transmission.
SatelliteDateAtmosphereVisibilityWater VaporOzone
Suomi NPP9/28/17MLW150 km0.694 g cm−28.04 g m−2
Suomi NPP9/29/17MLW150 km1.163 g cm−28.04 g m−2
Suomi NPP10/20/17MLW75 km1.163 g cm−28.04 g m−2
NOAA-208/11/18MLS11 km2.922 g cm−27.10 g m−2
NOAA-208/17/18MLS27 km4.504 g cm−214.14 g m−2
NOAA-208/22/18MLS33 km2.922 g cm−27.102 g m−2
Table 7. TOA Terra Vega Radiance Compared to VIIRS Measured Radiance on Suomi NPP.
SatelliteDateVIIRS Total Target Radiance [Wcm−2sr−1]TOA Terra Vega Radiance [Wcm−2sr−1]% Difference
100 V I I R S T e r r a     V e g a V I I R S
[Wcm−2sr−1]
Suomi NPP9/28/172.49 × 10−82.42 × 10−82.8%
Suomi NPP9/29/171.74 × 10−82.45 × 10−8−40.8%
Suomi NPP10/20/172.20 × 10−82.44 × 10−8−10.9%
Mean (excluding 9/29/17)−4.1%
Table 8. TOA Terra Vega Radiance Compared to VIIRS Measured Radiance on NOAA-20.
SatelliteDateVIIRS Total Target Radiance [Wcm−2sr−1]TOA Terra Vega Radiance [Wcm−2sr−1]% Difference
100 V I I R S T e r r a     V e g a V I I R S
[Wcm−2sr−1]
NOAA-208/11/181.41 × 10−81.50 × 10−8−6.4%
NOAA-208/17/182.08 × 10−82.06 × 10−81.0%
NOAA-208/22/182.40 × 10−82.24 × 10−86.7%
Mean0.4%

