Application of UAV-Based Methodology for Census of an Endangered Plant Species in a Fragile Habitat


1
College of Science, Utah Valley University, Orem, UT 84058, USA
2
USFS Rocky Mountain Research Station, Shrub Sciences Laboratory, Provo, UT 84606, USA
*
Author to whom correspondence should be addressed.
Remote Sens. 2019, 11(6), 719; https://0-doi-org.brum.beds.ac.uk/10.3390/rs11060719
Submission received: 11 February 2019
/
Revised: 16 March 2019
/
Accepted: 21 March 2019
/
Published: 26 March 2019
(This article belongs to the Special Issue Remote Sensing for Biodiversity, Ecology and Conservation)
Abstract
:Accurate census is essential for endangered plant management, yet lack of resources may make complete on-the-ground census difficult to achieve. Accessibility, especially for species in fragile habitats, is an added constraint. We examined the feasibility of using UAV (unmanned aerial vehicle, drone)-based imagery for census of an endangered plant species, Arctomecon humilis (dwarf bear-poppy), an herbaceous perennial gypsophile endemic of the Mojave Desert, USA. Using UAV technology, we captured imagery at both 50-m altitude (census) and 15-m altitude (validation) at two populations, White Dome (325 ha) and Red Bluffs (166 ha). The imagery was processed into orthomosaics that averaged 2.32 cm ground sampling distance (GSD) for 50-m imagery and 0.73 cm GSD for 15-m imagery. Putative poppy plants were marked in the 50-m imagery according to predefined criteria. We then used the 15-m imagery from each area to verify the identification accuracy of marked plants. Visual evaluation of the 50-m imagery resulted in errors of both commission and omission, mainly caused by failure to accurately identify or detect small poppies (<10 cm diameter). Higher-resolution 30-m altitude imagery (1.19 cm GSD) greatly reduced errors of commission. Habitat classification demonstrated that poppy density variation was closely tied to soil surface color. This study showed that drone imagery can potentially be used to census rare plant species with distinctive morphology in open habitats and understand their spatial distribution.
1. Introduction
For plant species of conservation concern, census is a fundamental step in designing sound management strategies [1]. Census is defined here as enumeration of actively growing individuals of a species within a defined area that contains a known population of the target species. The terms surrounding evaluation of plant population status have been used differently by different workers [2,3,4]. In this scheme, survey is the search for new populations, census is location and enumeration of plants within a population, and monitoring is census, usually of a small subset of the population, that is repeated over time to detect population trend. Demographic studies represent a more detailed version of monitoring that includes tracking the emergence, growth, reproduction, and death of known individual plants within a population.
Traditionally, all of the activities described above for characterizing the spatial distribution, population size, and trends through time for rare plant species have been carried out using fieldwork on the ground. Because these field efforts are often time and labor-intensive, the full spectrum of activities needed to inform management for conservation has been carried out for relatively few plant species. The resources available for plant conservation work are limited, the field season is short for many species, and the occupied terrain can be dangerous and difficult to access. Another drawback to on-the-ground evaluation is that some occupied habitats are easily damaged even by foot traffic, so that data collection can have a direct negative impact on the plant and its habitat.
The advent of UAV (unmanned aerial vehicle) or “drone” technology has created the promise of a revolution in data collection methods for biodiversity conservation that could address many of the constraints imposed by on-the-ground fieldwork [5,6]. Wildlife biologists are attempting to adopt this new technology to address a wide range of questions and problems in wildlife conservation [6,7]. Techniques for characterization of vegetation using high-resolution drone imagery have also received considerable study [8,9,10,11,12,13]. However, the use of UAV technology to address problems in plant conservation is not well developed. Sanchez-Bou and Lopez-Pujol [5], in a 2014 review, could find no references that dealt with the use of drones in plant conservation. In a more recent extensive review of drone applications for conservation in protected areas [6], rare plant conservation was not even formally considered, and only one cited paper addressed the use of drones to evaluate rare plant population status. Baena et al. [14] reviewed and discussed recent examples of the application of drone technology to plant conservation. They commented that “little attention has been given to the specific issues associated with plant conservation”. Only one of their examples involved census of a rare species, Caicos pine, within an area. The few species successfully quantified with drone imagery have usually been trees [15,16,17,18]. Drones have been successfully used to map herbaceous invasive species infestations, but the species mapped are usually clonal species that can be quantified using vegetation mapping techniques; efforts to map invasive species individuals intermingled in other vegetation have been less successful [19,20,21,22].
There are apparently few studies carried out with the goal of identifying or quantifying native herbaceous species from drone imagery [12,23,24,25,26,27]. These studies were implemented at a range of spatial and spectral resolutions with varying degrees of sophistication and mixed results. Success generally hinged on a major color difference between a target species and the background vegetation. The importance of sampling at a phenological stage that emphasizes maximum spectral differences is emphasized in these studies. The only paper we found that reported use of drone imagery for identification and quantification of an herbaceous species of conservation concern was for wild leek (Allium tricoccum) in a deciduous forest understory [28]. Wild leek forms large patches, and these workers were able to identify the species with 76% accuracy. None of the studies cited above for herbaceous species involved census, that is, counting individual plants. The techniques utilized resulted in cover or frequency data rather than density measurements. One of the few examples of successful counting of individual plants was for juvenile maize plants in a precision agriculture setting [29].
One explanation for the lack of studies on plant census applications using drone technology is that little exploratory work has been carried out in plant communities with low vegetative cover, where detection and identification of individual plants might be more feasible, as demonstrated in identification trials in sparse and structurally simple desert vegetation [23]. However, a sizeable fraction of plant species of conservation concern worldwide are edaphic endemics, that is, plant species restricted to unusual substrates. Examples include serpentine substrates [30] and limestone or dolomite outcrops [31]. These substrates generally support relatively simple plant communities with low vascular plant cover. Another important example is gypsophile endemism [32]. Gypsum (calcium sulfate) substrates occur over large areas in many semi-arid and arid parts of the world and support a unique and highly diverse assemblage of many hundreds of endemic plant species [33,34]. Many of these gypsophile endemics are species of conservation concern [35]. The ability to census rare plant species using drone technology in low-cover plant communities, including gypsum badlands communities, would be a valuable addition to rare plant management.
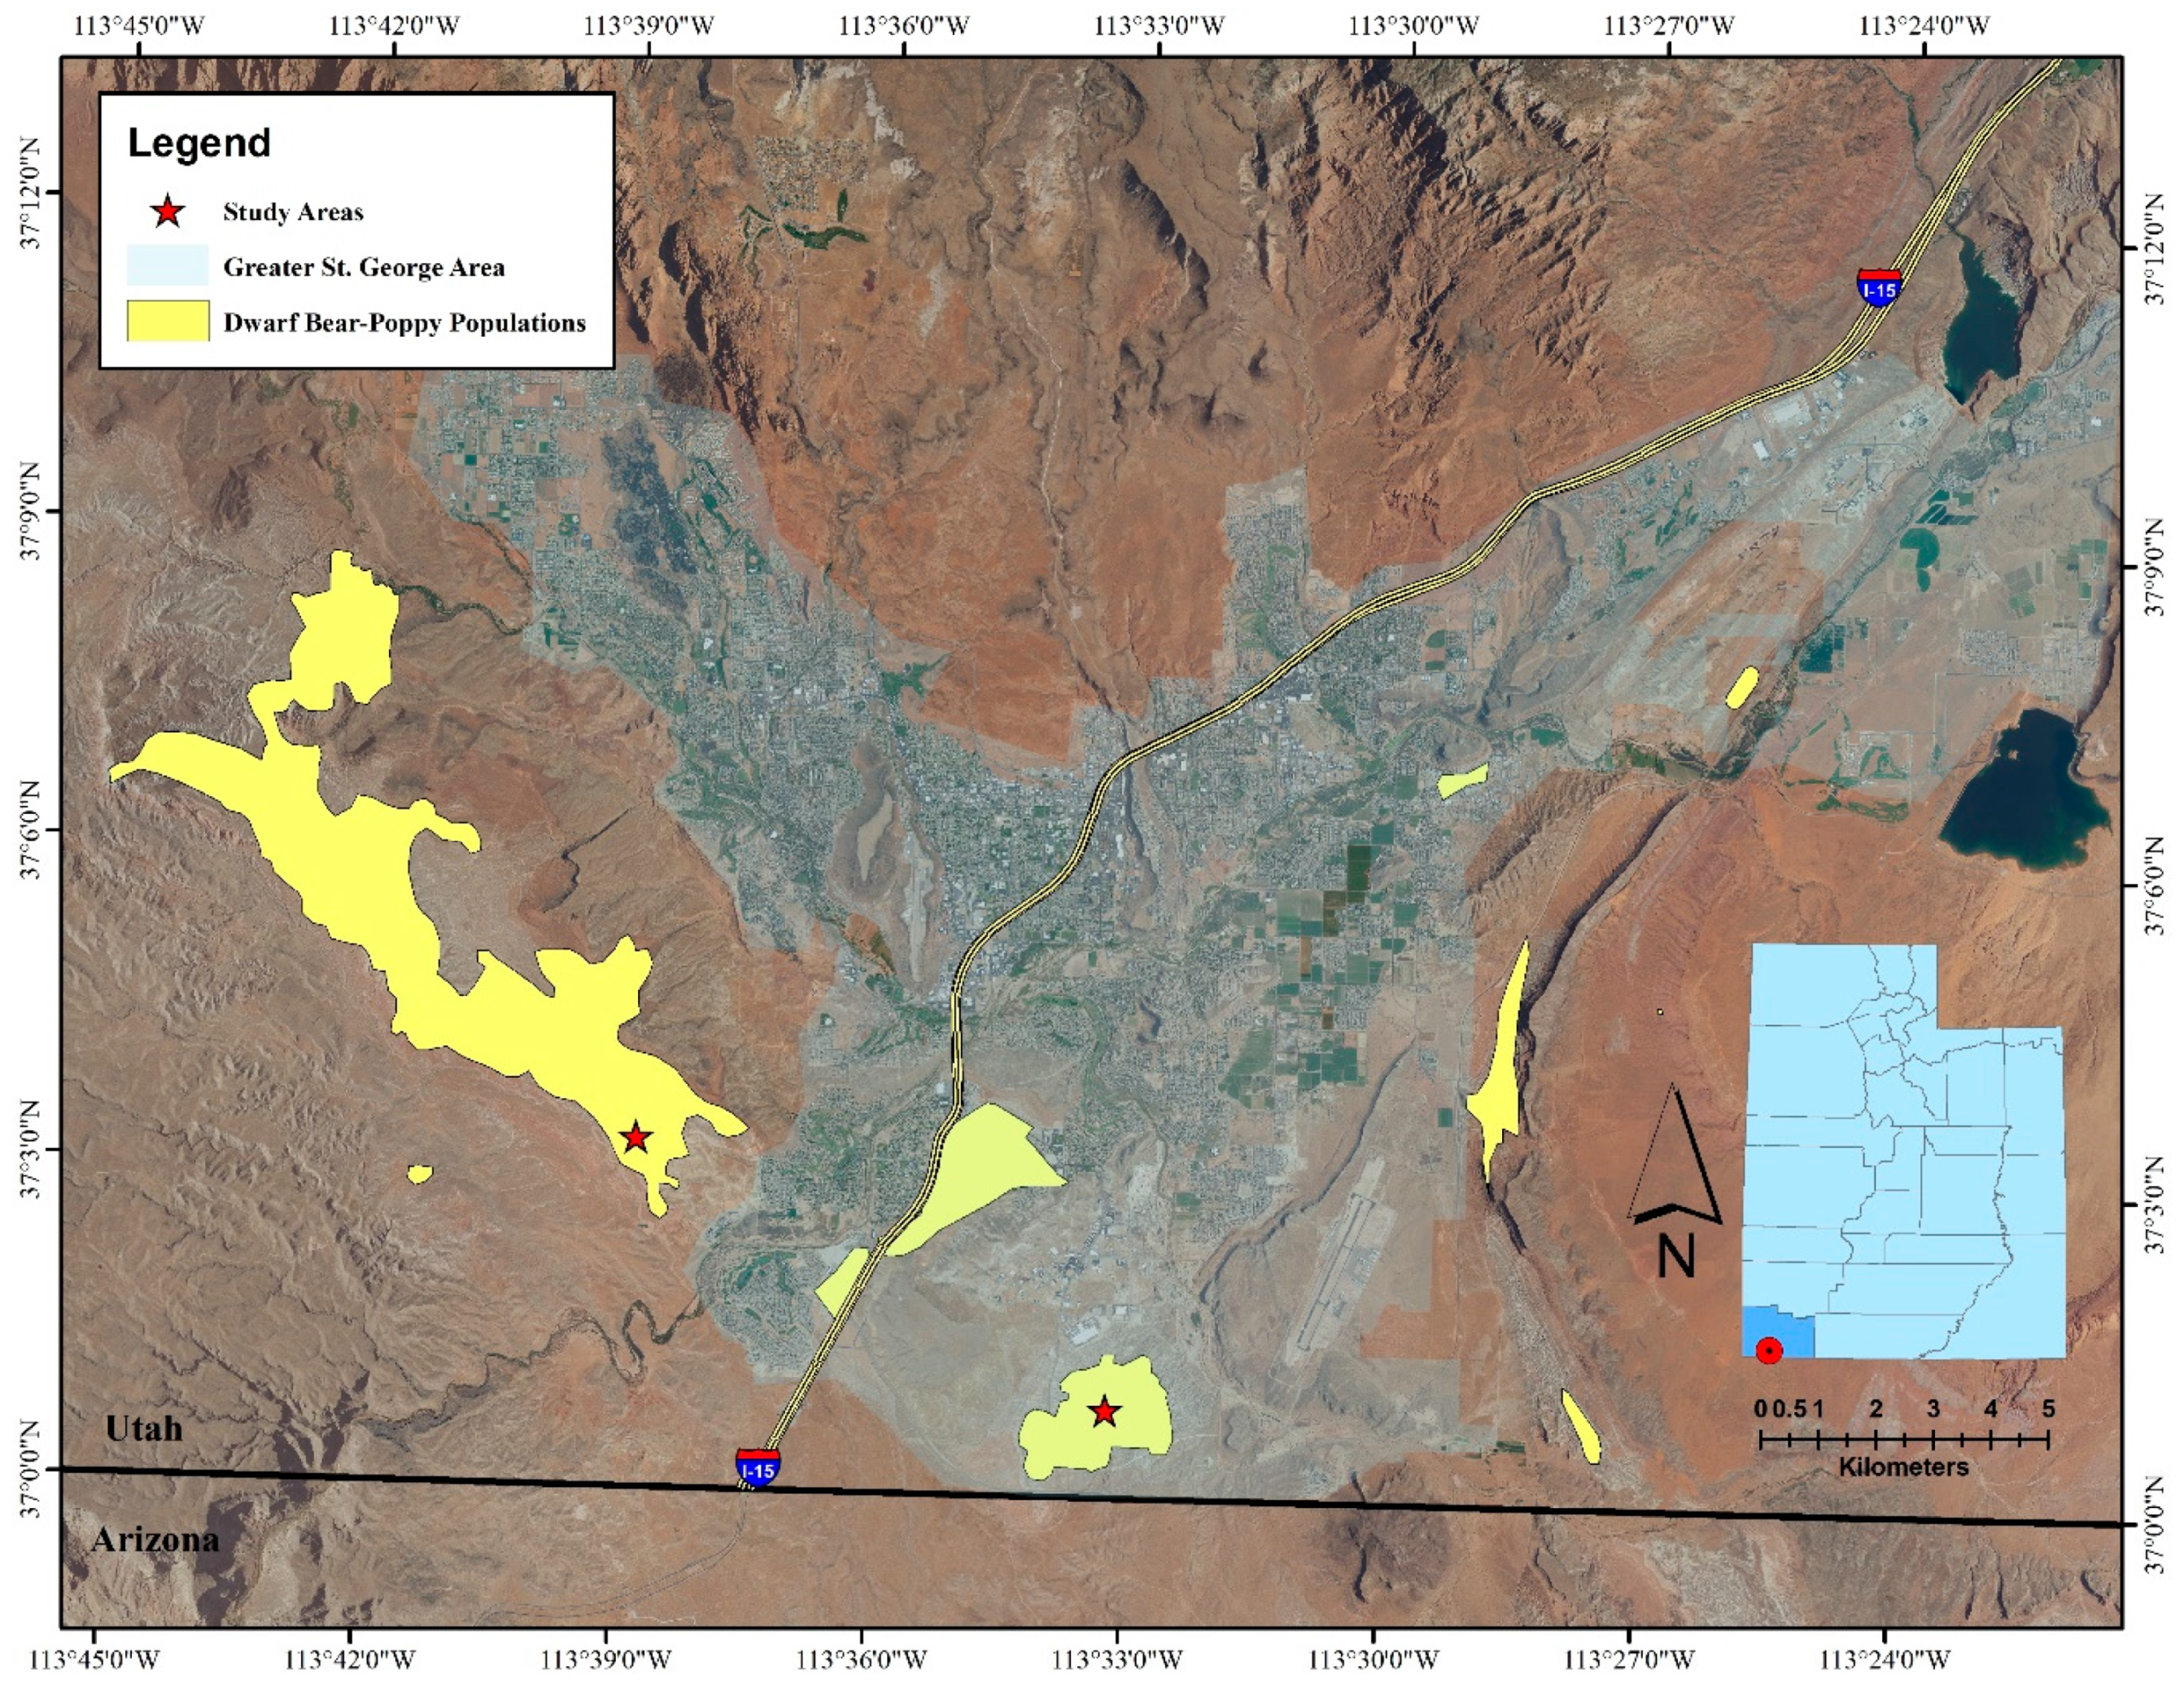
The study reported here examined the feasibility of carrying out a UAV-based census for a federally listed endangered plant restricted to gypsum substrates in a small area near a rapidly expanding urban center, St. George, Washington County, Utah, USA, at the northeastern edge of the Mojave Desert (Figure 1 and Figure 2). The study species, dwarf bear-poppy (Arctomecon humilis Coville), was listed as endangered in 1979 [36]. It is under threat from continuing urban development and associated anthropogenic damage. The gypsum hills it occupies are extremely susceptible to damage from any vehicular traffic and even foot traffic because of the compressible structure of the weathered gypsum surface material. In addition, these gypsum soils often support very well-developed biological soil crusts that make up the majority of living cover and that are also easily damaged and very slow to recover [37]. This makes on-the-ground census activities problematic from a management perspective, so that most of the ca. 3600 ha of known potentially occupied habitat has never been adequately censused [38].
Dwarf bear-poppy is an herbaceous perennial plant with a distinctive blue-green color and characteristic rounded morphology that cause it to stand out clearly against the bare gypsum substrate, making it a good candidate for detection on aerial imagery (Figure 2). It grows actively throughout the year, which increases the window of time for obtaining imagery [39]. A short-lived plant (mean life span of adult plants ca. 6 years), it can produce an abundance of seeds that form a persistent seed bank [40]. Recruitment from seed occurs episodically in response to years of unusually favorable spring rainfall in this warm desert environment (mean annual precipitation ca. 200 mm) [39,41]. Adult plant density fluctuates widely from year to year and can reach low levels following several years unfavorable for recruitment [41]. This means that population numbers must be interpreted in terms of this repeating cycle of recruitment followed by decline. We assumed that the best time to carry out population census would be in the year following a major recruitment episode, as this would provide a baseline population number for established plants that would likely indicate maximum spatial distribution, and also enable a systematic examination of patterns of decline and potential future recovery through recruitment. A sizeable dwarf bear-poppy recruitment event occurred in spring 2017, prompting the initiation of the present study.
Another prominent feature of the ecology of dwarf bear-poppy is that it is not randomly distributed across its potential habitat, but instead has been observed to have a highly clumped distribution [39,40]. By developing a census method that provides point locations for individual plants, it will be possible to examine how this clumped distribution is related to underlying environmental variables. This could ultimately lead to a fine-scale species distribution model (SDM) [42,43] for predicting species occurrence and abundance within the context of the gypsum environment. This information will be useful to managers for locating new occurrences, for managing disturbance with limited resources, and possibly for planning introductions into unoccupied suitable habitat [44].
The overarching goal of this research is to further the use of drone technology in biodiversity conservation, specifically to understand factors mediating abundance and distribution of plant species of conservation concern on a local scale. The study had three specific objectives:
1. To apply a UAV-based methodology to experimentally evaluate poppy identification accuracy with imagery obtained from flights at 50-m and 30-m altitude using validation data derived from higher-resolution 15-m imagery.
2. To carry out provisional poppy census using 50-m imagery at two populations using the validation data sets as a source of error correction for poppy counts.
3. To build a preliminary habitat classification model to relate dwarf bear-poppy density variation within the gypsum habitat at these two populations to variation in surface features that are quantifiable in remote sensing imagery.
Based on preliminary observations and trials, we hypothesized that potentially reproductive poppies would be detectable in the 15-m (0.73 cm GSD) validation imagery. Our null hypothesis, with respect to Objective 1, was that poppies detectable in validation imagery would also be detectable in census-level imagery (2.32 cm GSD). The alternative hypothesis was that poppy detection in higher-altitude imagery would result in large errors of both commission and omission. We reasoned that we could use error estimates from the validation data to improve the accuracy of census estimates. We further hypothesized that census estimates would be sufficiently accurate to permit detection of spatial patterns of poppy distribution as a function of variation in surface features within the gypsum habitat.
2. Materials and Methods
2.1. Study Areas
Census activities were carried out at two populations of dwarf bear-poppy, White Dome and Red Bluffs [38]. The White Dome Nature Preserve is a 325-hectare dwarf bear-poppy preserve owned and managed by The Nature Conservancy (TNC) (Figure 1), and census flights there were carried out in cooperation with TNC. The Red Bluffs population is located ca. 16 km northwest of White Dome on land designated as an Area of Critical Environmental Concern (ACEC) by the US Department of the Interior, Bureau of Land Management. This roughly 2200-hectare area was designated to mitigate dwarf bear-poppy habitat degradation. We were asked by the Utah Department of Natural Resources to census an area on the southwestern edge of the Red Bluffs ACEC as well as on adjacent Utah State Trust lands that border the ACEC on the south end. This 166-hectare parcel will be referred to as the Tonaquint area.
2.2. UAV Mission Planning and Flights
For all UAV flights we used the DJI Phantom 3 Advanced drone (SZ DJI Technology Co. Ltd. Shenzhen, China) with stock camera (f/2.8, 94° FOV, 12MP). The drone remote controller was interfaced with an iPad Mini 4 (Apple, Cupertino, CA). Individual flights were programmed within the tablet using the application Map Pilot for DJI (Drones Made Easy, San Diego, CA). The advantage of using this application was that flights were programmed to a set altitude above the ground, so that the imagery was relatively consistent regardless of elevation and terrain changes. The Map Pilot for DJI app uses satellite-derived elevation data to adjust drone in-flight altitude to maintain consistent imagery capture above the ground. The only elevation data source available in the study area is Shuttle Radar Topography Mission (SRTM), which has a resolution of 30 m. Due to the relatively low resolution of the SRTM data, subtle terrain changes were not accurately accounted for in-flight, resulting in imagery captured at inconsistent altitudes.
We carried out 45 census-level flights at 50-m altitude during April and May of 2018, as well as 13 validation-level flights at 15-m altitude, across White Dome and Tonaquint. We also conducted two additional flights at both 30-m and 15-m altitudes at two locations within the Tonaquint area in order to compare higher resolution imagery to census-level imagery. We covered a total of 491 hectares at 50 m altitude and captured roughly 12,000 red-green-blue (RGB) images.
2.3. Post-Flight Image Processing
UAV-captured images were sorted by flight and stored in an external hard drive. All images were corrected for color distortion with Photoshop CC 2018 (Adobe Systems Inc., San Jose, CA, USA), using the “neutralize” feature within the “auto-color” tool to standardize the imagery. After color correction, images from each individual flight were further processed using Pix4D software (Pix4D S.A. Lausanne, Switzerland) to generate high-resolution orthomosaics. The orthomosaic outputs were then imported into ArcMap 10.5. The average ground sampling distance (GSD) of the 50-meter flights was 2.32 cm/pixel across both study areas. The 30-m flights at Tonaquint Block had an average GSD of 1.19 cm/pixel, while the average GSD of the 15-m validation flights was 0.732 cm/pixel, depending on in-flight elevation accuracy. At White Dome, the imagery from one individual flight had to be discarded due to imagery distortion that could not be corrected. This flight was over the White Dome Peak area, which has very steep terrain and drastic elevation changes. That flight was not used in mapping, which effectively created a “hole” in the White Dome map. This small section of the area could not be included in the census and was also excluded from the habitat classification model.
2.4. Poppy Detection and Validation Protocol
Our initial plan was to use a supervised classification within ArcMap to isolate the poppies based on their unique spectral range. That plan was eventually abandoned for this phase of the project due to limitations of imagery resolution, as well as issues with other plants having similar spectral characteristics to the poppy. As an alternative, we developed a protocol for visually distinguishing poppies from other plants within the 50-m imagery and marked plants that met the defined criteria. The protocol was based on the following criteria: 1) color—having a distinct blue-green color typical of poppy; 2) shape—round and mound-like form; and 3) size—plants 6–40 cm in diameter (Figure 2C).
We evaluated the accuracy of the protocol by comparing plants marked on the 50-m census imagery with plants marked on the higher-resolution 15-m validation imagery, in a set of plots for each area. Informal ground verification, confirming poppies marked in 15-m UAV imagery, was carried out on a small plot in the Tonaquint area. Poppies as small as 3 cm in diameter were identifiable at this resolution (Supplemental File S1). In ArcMap 10.5, we built fishnet grids on the 50-m imagery captured over each validation plot and read each grid at a 1/25 scale. Each potential poppy plant was marked with a green, orange, or red point depending on how many criteria of the protocol were met (see Supplemental File S1 for a detailed description of the detection protocol). A green point would be marked if the plant met all three of the criteria and looked like an “obvious” poppy. An orange point met two of the three criteria and a red point met one of the three criteria. The protocol was applied only to plants that appeared reasonably similar in color, shape, and size to poppy. For poppies within the size range 6-40 cm, blue-green color was the most accurate indicator.
After all the potential poppies were marked over the validation plots in the 50-m imagery, we independently evaluated the 15-m imagery over the same area. We marked each poppy in the 15-m imagery and compared those points to the marked points from the 50-m imagery, to confirm whether the 50-m marked points were poppies and to determine how many poppies were not detected at 50 m. Plants marked as poppies at 50 m that were not confirmed in the 15-m imagery were considered errors of commission. Poppies clearly present in the 15-m imagery that were not detected in the 50-m imagery were considered errors of omission. Most of the misclassified and undetected plants were <10 cm in diameter.
To compensate for our errors of commission and omission in the census-level imagery, we developed a correction factor using data derived from poppies scored as marked, confirmed, and missed, as well as the actual number of plants found in 15-m imagery in each of the validation plots. We calculated the ratio of the number of plants confirmed within each plot over the number of plants marked within each plot to get the error of commission correction factor per plot. Within each of the same plots, we calculated the ratio of the actual number of plants at 15 m over the number of confirmed plants at 50 m to get the error of omission per plot. We then calculated the average and standard error of both omission and commission errors across all validation plots for each area and flight altitude. To obtain a correction factor that included both types of error, we multiplied the commission error by the omission error for each plot, which yielded the ratio of the actual number of plants over the number of confirmed plants. We then calculated the average and standard error for this combined measure of error. We used the mean value of the combined error measure as a correction factor that was then applied to the final census counts. The standard error of this mean value represented an estimate of the reliability of the 50-m census data. This method was applied independently in each study area.
We also used this method to evaluate 30-m imagery along with 15-m validation imagery taken in the Tonaquint area to quantify errors of commission and omission with higher-resolution imagery. Because the 30-m imagery contained a higher level of detail, a slight adjustment to the protocol was made during evaluation. The adjustment was simply not marking plants that were clearly not poppies, though they still met at least one of the criteria in the protocol applied for the 50-m imagery. For example, plant color was more easily distinguished in the 30-m imagery; therefore, plants not exhibiting the typical poppy blue-green color were not marked regardless of whether other criteria were met.
2.5. Procedure for Census
Based on orthomosaics generated from the 50-m UAV-acquired imagery, we conducted a digital census at White Dome and at Tonaquint in ArcMap 10.5 by applying the developed protocol to identify poppies. Fishnet grids of various sizes were generated to sub-set the census areas into more manageable blocks, plots, and sub-plots. The sub-plot-level grid was evaluated at a scale of 1/60 to 1/80, at which potential poppies could be detected while visually maintaining the sub-plot line. This method was used to aid in “keeping the line”, which ensured the study area was evaluated in its entirety. Each marked plant met at least one of the three criteria, with one exception.
During our time in the field on this project we observed that the poppies were consistently growing in or close-by gypsiferous soil, which was white, pink, or tan, often within a “white band” of fine, white gypsiferous shale (Figure 2A). Poppies were generally absent from areas with darker, more heavily developed lichen crusts. We observed this pattern throughout the range of the poppy. For this reason, plants found outside of this “poppy habitat” were marked only if they met all three criteria. Evaluation of the validation data set confirmed that there were very few errors of omission generated by following this procedure on dark, lichen-crusted areas.
2.6. Poppy Habitat Classification
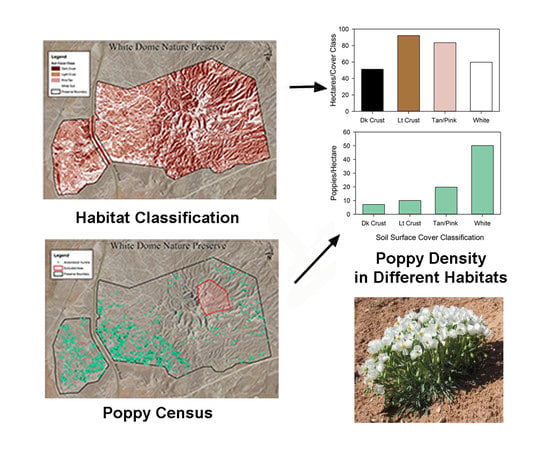
To evaluate the habitat differences based on our field observations of soil color mentioned previously, we characterized the habitat at White Dome and Tonaquint using ISO cluster (unsupervised) classification in ArcMap 10.5. We attempted this exercise with orthomosaics derived from 50-m UAV imagery and with National Agricultural Imagery Program (NAIP) imagery to generate four distinct groups or clusters classified by similar spectral characteristics. At White Dome, a shadow cover class was also classified, but this class covered a small area (6.5% of the total), supported very few poppies, and was excluded from the analysis. The 1-m/pixel resolution NAIP imagery gave a satisfactory surface cover classification, while the 2.32-cm/pixel resolution orthomosaics resulted in a much more fragmented raster of cover types, even when pixel size was resampled to produce 1-m/pixel resolution orthomosaics similar to the NAIP resolution. For this reason, we chose to use NAIP imagery for this preliminary habitat classification exercise. The area of each cover class and the number of poppy plants within each cover class were calculated, and a Χ2 contingency table analysis was carried out to determine if poppy density and cover class were significantly associated at each of the study areas. We also used contingency table analysis to determine if relative cover of each of the four surface cover classes was different at the two study areas, and to test whether relative poppy density as a function of cover class differed between study areas.
3. Results
3.1. Validation
At both White Dome and Tonaquint, slightly more than 70% of the poppies marked in the 50-m imagery over the validation plots were confirmed as poppies in the 15-m plots (Table 1). Close examination of the White Dome data revealed that most of the misidentified plants were small (<10 cm diameter). Almost all of the marked plants >10 cm (97.9%) were confirmed to be poppies. The error of commission at Tonaquint was greatly reduced with higher-quality 30-m imagery, with over 90% of all marked plants confirmed to be poppies.
Approximately half of the plants evident on the 15-m imagery at both White Dome and Tonaquint were not marked on the 50-m imagery (Table 1). These missed plants represented errors of omission. Again, this error was almost completely due to small plant size. We determined that the smallest plants confirmed as poppies in the 50-m imagery were >7 cm in diameter, while at 30-m, the smallest plants confirmed as poppies were >5 cm in diameter. The fact that the fraction of missed plants was only slightly lower at 30 m than at 50 m suggests that most of the missed plants were <5 cm, and thus not detectable in either 50-m or 30-m imagery. This was confirmed with close examination of the 15-m imagery. Even at 15 m, there was probably error of omission, because plants <3 cm in diameter were not detectable. We considered these tiny seedling or yearling plants to be excluded from the census, as they were below the threshold size for reproduction.
Commission, omission, and net error estimates from 50-m imagery were remarkably similar at White Dome and Tonaquint, and these estimates usually had relatively small standard errors, especially considering the small number of validation plots (Table 1). Commission and omission errors tended to compensate for each other. But even with this compensation, the large number of poppies too small to detect at 50 m (approximately half of the plants detected in the validation imagery) resulted in a net error correction factor of approximately 1.5. When the 30-m imagery was considered, the correction factor was similar to correction factors from 50-m imagery, even though commission error was much reduced. This was because error of omission was still very high.
3.2. Population Census
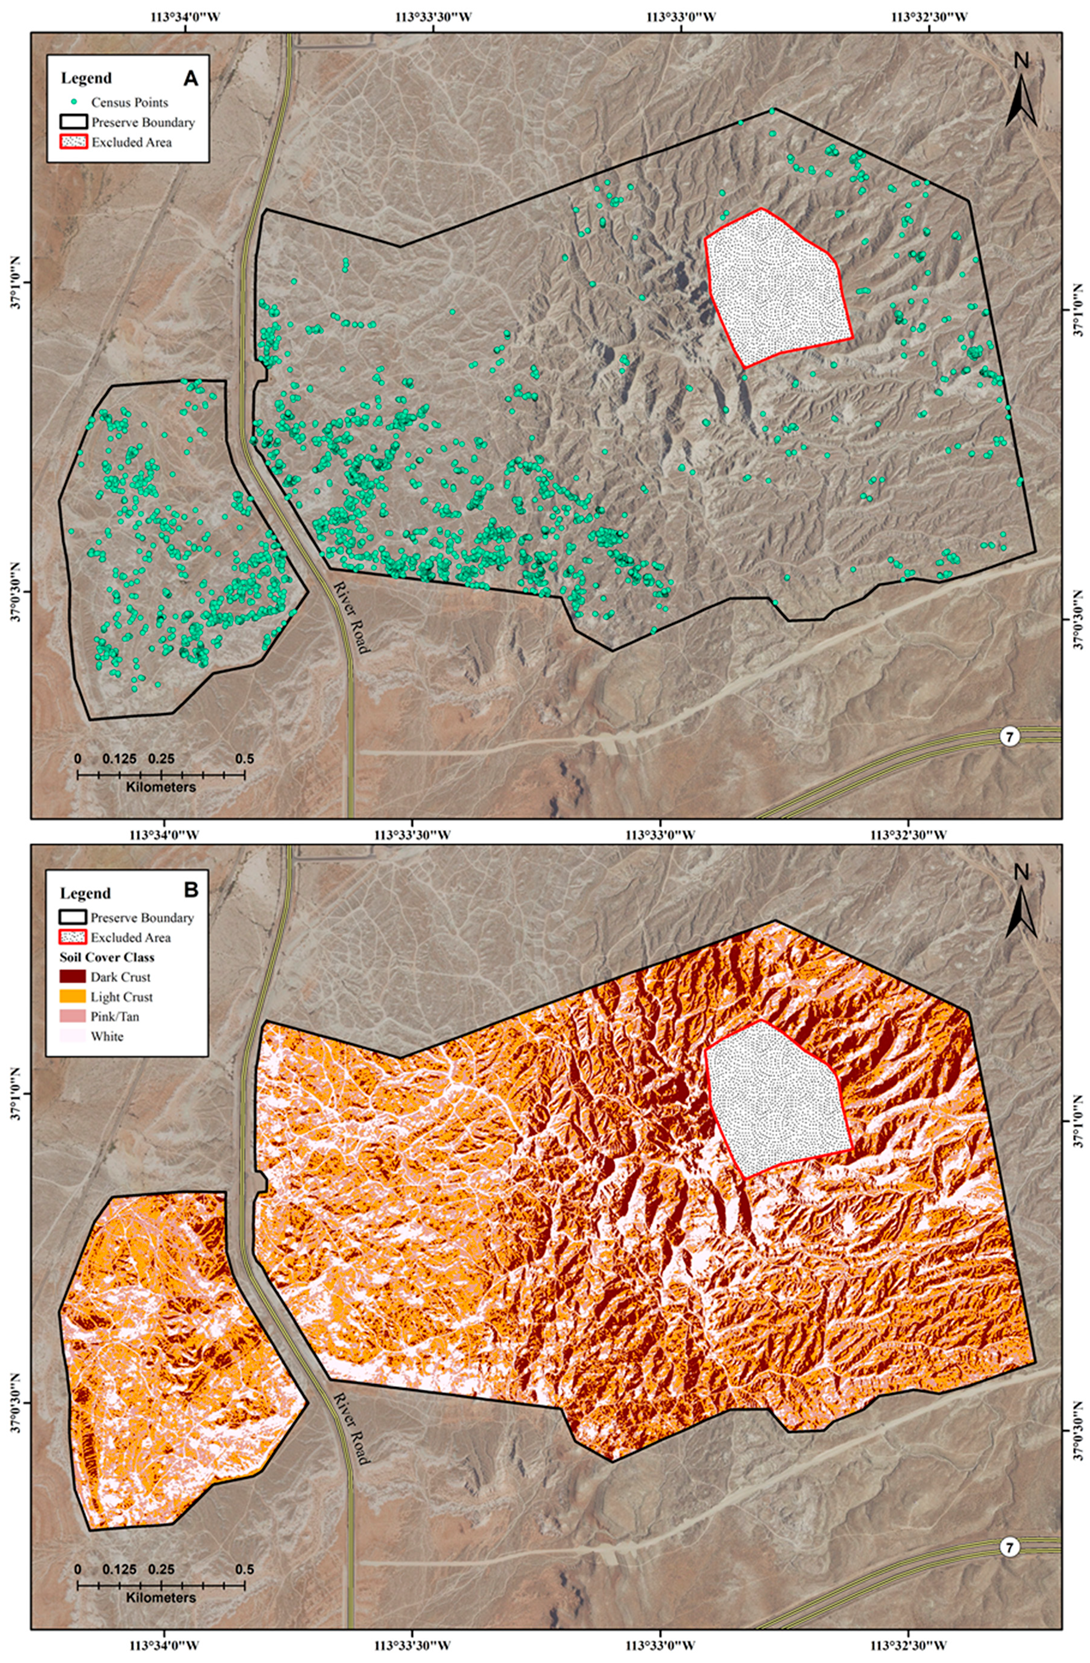
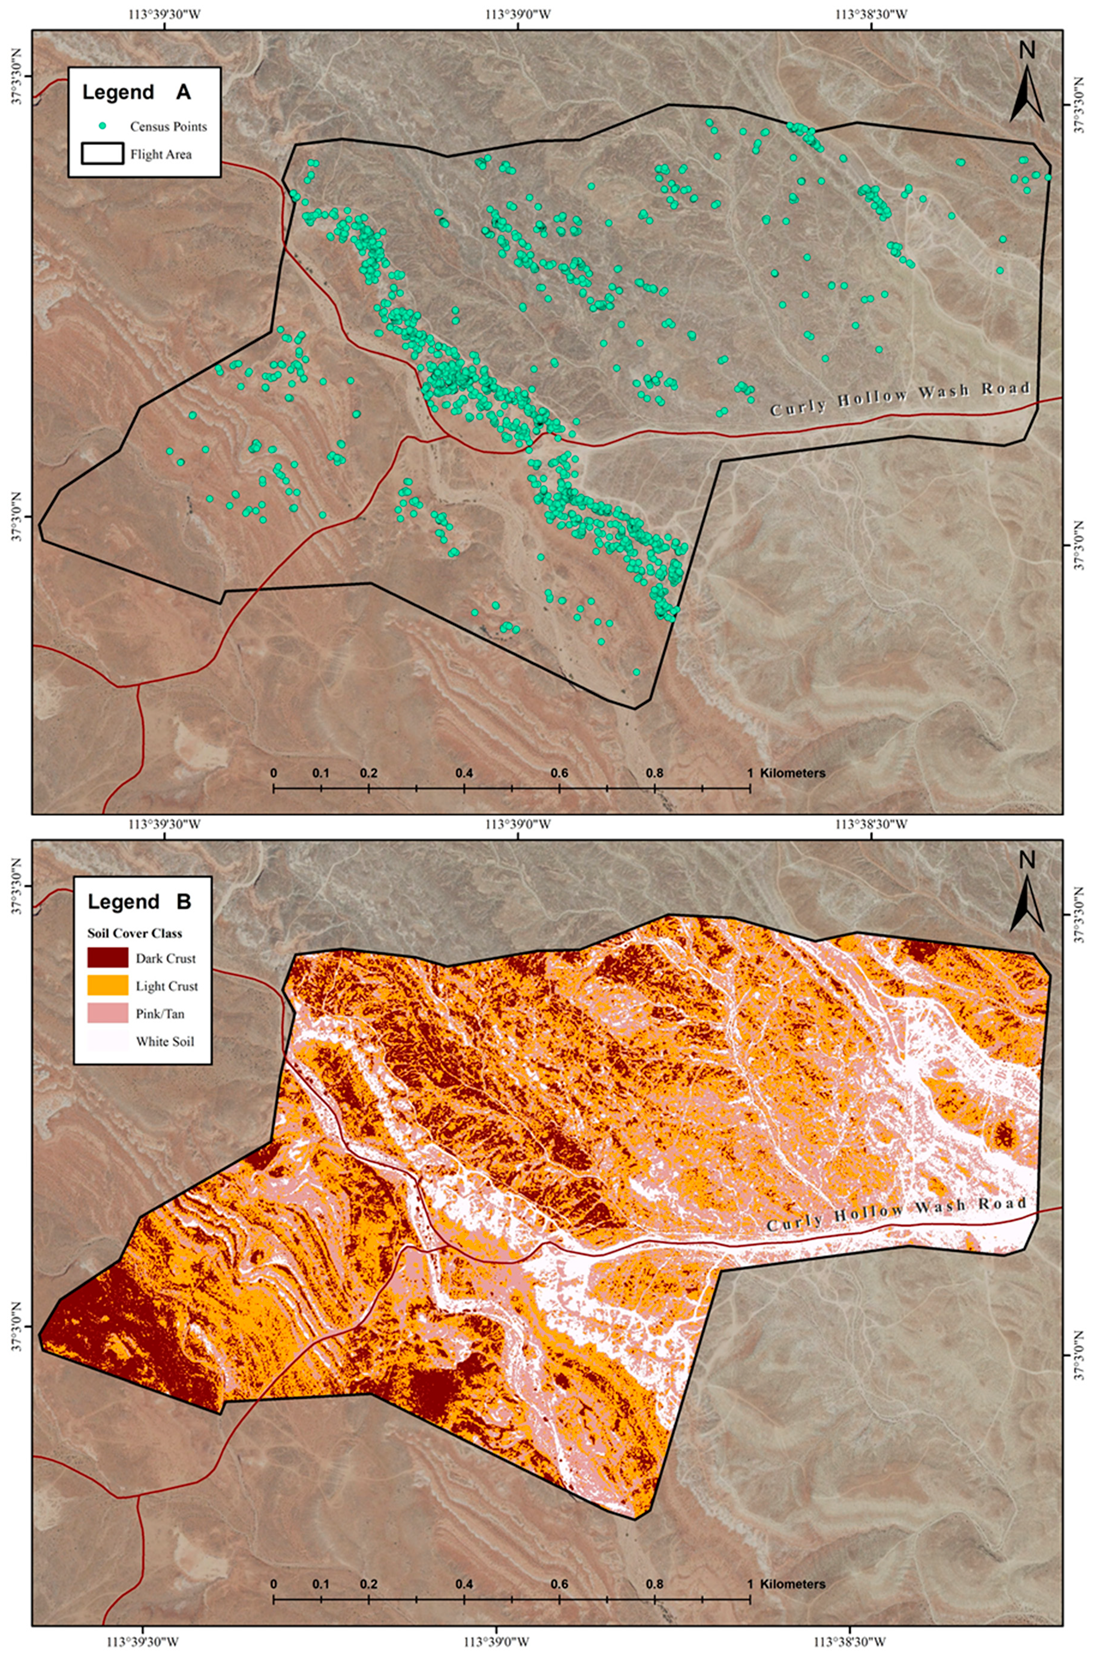
At White Dome, 6756 putative poppy plants were marked by visual scanning of 50-m imagery obtained over the 325-hectare preserve (Figure 3A; Supplemental Files S3 and S4). Applying the correction factor of 1.54 (Table 1), the estimated number of plants >3 cm in diameter was 10,404 ± 988 (SE = 0.095), for a mean density of 32.0 poppies per hectare. Poppies were most heavily concentrated on eroded gypsum bluffs on the southwest side of the preserve, in an area known to support high poppy densities in past years. At Tonaquint, 2095 putative poppy plants were marked in 50-m imagery (Figure 4A; Supplemental Files S6 and S7). After correction, the estimated population of plants >3 cm in diameter was 3205 ± 433 (SE = 0.135), for a mean density of 19.3 plants per hectare. The plants were again concentrated on highly eroded gypsum slopes at the western edge of the Shinob Kibe formation.
3.3. Habitat Classification
The ISO cluster classification of soil surface cover types from NAIP imagery at the two study areas resulted in very similar results, with no significant difference between study areas in the proportion classified into each of the four cover categories (Figure 3B, Figure 4B and Figure 5, Table 2, and Supplemental Files S5 and S8). This is likely a reflection of the very similar geology of the two areas, both of which are located at the lower edge of the highly gypsiferous Shinob Kibe member of the Moenkopi Formation.
In the analysis of poppy density vs. soil cover class, there was a highly significant association between poppy density and cover class at both sites, with by far the highest densities on the white soil cover class and the lowest densities on the dark crust cover class, confirming our earlier field observations (Figure 5, Table 2). Poppy densities were seven to nine times lower on the dark crust than on the white soil, with intermediate densities on the light crust and pink/tan soil cover types. Although poppy absolute density was ca. 1.7 times higher at White Dome than at Tonaquint, relative density as a function of soil cover class did not differ significantly between study areas, showing that the poppies exhibited similar surface soil preferences in both areas (Table 2). These results supported our hypothesis that census data would be sufficiently accurate to detect significant differences in poppy density as a function of soil surface cover class.
4. Discussion
Our effort to develop a rare plant census methodology using UAV imagery represents a promising first step in implementing a drone-based range-wide census of dwarf bear-poppy. It is likely that this methodology could be useful for census of other rare plant species with distinctive color and morphology that occur in open habitats with low vegetative cover. We obtained very similar validation results for 50-m imagery in the two census areas, indicating that the visual scanning method for scoring poppies was applied consistently, and that the validation method used likely yielded reliable estimates of error (Table 1).
The relatively high errors of commission (only ca. 70% of marked poppies confirmed) and omission (ca. 50% of poppies not marked) at 50 m were clearly due to inadequacy of the imagery itself and not to any intrinsic problem with the census procedure. As we were constrained to complete this census activity in spring 2018, in the year following the large 2017 recruitment episode, we did not have the option of re-flying the census areas at lower altitude to obtain higher-resolution imagery within the available time frame. However, our pilot validation with 30-m imagery at Tonaquint made it obvious that improved image resolution would greatly reduce errors of commission, with confirmation of over 90% of marked plants. Increasing imagery resolution further through use of an upgraded UAV or by flying at a lower altitude could largely eliminate errors of commission.
The high error of omission in the validation data for imagery at both 50 m and 30 m is more problematic, as there will likely continue to be some error of omission at any resolution if seedlings or very small yearling plants are present. This error, even at 30 m, was almost completely due to failure to detect poppies below a threshold size. Omission error is thus directly related to the proportion of plants in the population too small for detection, a number that can vary over a wide range depending on time since a recruitment episode. Soon after recruitment, the proportion of plants in very small size classes is large. In the years following a recruitment episode, the total number of plants as well as the proportion of very small plants is expected to decline. In order to track this population trend through time, it is necessary to start with a reasonably accurate enumeration that includes the majority of small plants in the year following recruitment. We used enumeration of small poppies in high-resolution validation plots to estimate numbers of plants undetected in 50-m imagery over the entire census area, but it would be much better to use an image-capture technology that could directly detect poppies above a small threshold size with high accuracy.
Accurate enumeration of very small plants may not be essential for predicting population trajectories, as these plants have a lower probability of survival to reproduction. This is particularly true the year after a recruitment episode, when small plants represent yearling plants that grew very little in the post-seedling year. However, in monitoring plots at White Dome in late spring 2018, 45% of sub-adult (yearling) plants (<10 cm) were observed in flower (K. Rominger, unpublished data), emphasizing the need for a relatively low minimum size threshold for census. Yearling plants with basal rosettes as small as 4.5 cm in diameter were observed in flower, possibly providing a reasonable minimum size threshold for accurate detection.
Another consideration in determining the protocol for a range-wide dwarf bear-poppy census is the need to develop an automated system for detecting poppies in the imagery, eliminating the significant time and labor investment involved in visual scanning, while also reducing or eliminating the judgment component that makes visual scanning somewhat subjective. We plan to combine use of a DJI Phantom 4 Professional drone (20-megapixel camera) with object-based image analysis software or perhaps a machine learning approach to develop and apply a practical methodology for range-wide census [14,45].
Our first approach to habitat classification using an unsupervised ISO classification algorithm in ArcGIS 10.5 was quite successful. We were able to identify a relevant environmental variable in the NAIP imagery, soil surface color, and map the areal coverage of four principal cover classes based on soil color in both census areas. We then showed that the observed nonrandom distribution of poppies in each area was strongly tied to soil surface cover class. Both relative cover of the four cover classes and relative poppy density as a function of cover class were statistically identical in the two census areas. This indicates that the poppies showed similar habitat preferences across both census areas (Table 2). Gypsophile endemic species have previously been shown to exhibit habitat preferences within the context of the gypsum environment [32,46,47]. However, to our knowledge this is the first time that such a pattern of habitat preference has been mapped over relatively large areas and quantitatively confirmed.
The main difference between the two census areas in our study was in absolute poppy density, with estimated densities ca.1.7 times higher at White Dome than at Tonaquint. The simplest hypothesis to explain this, namely that there was a larger proportion of suitable habitat at White Dome, must be rejected based on the similarity in relative surface cover class areal extent in the two areas. A possible alternative explanation is that this density variation represents the result of long-term differences in management within the two study areas. Recreational use at the White Dome Preserve has been restricted to foot traffic on established paths, since the area was fenced in 2007, and this restriction has been generally respected. For some years prior to this time, White Dome was a heavily used recreational area and was particularly popular with off-highway vehicle riders. In contrast, the Tonaquint area, now largely fenced and designated as protected, has received intensive recreational use for decades. The area is still open to hiking and mountain bike use on the designated Bearclaw Poppy Trail; however, the creation of additional unauthorized trails and some trespass by motorized off-highway vehicles has continued. Surface disturbance in this area is much more evident than at White Dome. A protocol for mapping surface disturbance in gypsum habitats from drone imagery along with poppy relative abundance would be a boon to managers, who could then more effectively prioritize protection activities with the limited resources available.
We consider our habitat classification analysis as only a preliminary first step in the development of an SDM for predicting dwarf bear-poppy occurrence within the gypsum habitat. First, it is based on marked plants from the large-scale census and is, thus, subject to the measured errors of both commission and omission. The similar strong patterns revealed in both census areas suggest that this error may have created sampling noise but did not obscure the main result. However, as we add more components to an SDM for dwarf bear-poppy in the future, we will base our presence points on census using higher-resolution imagery.
Ideally, most, or all, of the environmental parameters that will be used in the bear-poppy SDM will be based on much more detailed imagery. This should give it additional power to predict poppy occurrences on a local scale. Up to this point, the main predictor of poppy occurrence has been a coarse-scale environmental variable, namely geology. The poppy is largely restricted to the highly gypsiferous Shinob Kibe member of the Triassic Moenkopi Formation [38]. The other controlling variable is apparently elevation, or climate variables associated with elevation, because extensive areas of Shinob Kibe gypsum at higher elevation to the east, near Zion National Park, are not occupied. The plant has also not been detected in apparently suitable Shinob Kibe habitat in northern Arizona, immediately to the south of known poppy occurrences. A more detailed SDM could elucidate reasons for this distribution, aid in location of possible new occurrences, and provide environmental context for introduction efforts. Integration of environmental predictors across multiple scales of spatial resolution will likely be necessary to produce a successful SDM [48].
5. Conclusions
We found that the main factor limiting the success of our census application was insufficient resolution (2.32 cm/pixel) of the 50-m imagery, both to distinguish poppy plants from nontarget species and to detect smaller poppy plants. With 30-m (1.19 cm/pixel) imagery, error of commission was greatly reduced, but error of omission was still high due to the high proportion of plants too small to detect even at this resolution. Defining a minimum size threshold necessary for detection is basically a management decision. Once this size threshold is defined, the task is to determine the combination of flight altitude and camera resolution that will enable accurate detection of plants near the size threshold, yet be practical for carrying out a census over a large area. A monitoring program that uses very high-resolution imagery over a representative subset of each census area will likely be a better approach for quantification of plants across the complete size spectrum. Census is a major undertaking that will be carried out over relatively long-time intervals, whereas a well-designed drone-based monitoring program can potentially be carried out on a yearly basis.
We used a reasonably priced off-the-shelf drone and simple RGB imagery for this preliminary work, because we wanted to develop methods for census, monitoring, and habitat classification that could easily be implemented by managers in the future. To fully understand the population dynamics of a short-lived perennial with a long-lived seed bank in a highly stochastic desert environment will require a continuing effort. This understanding will be essential for management of this species for long-term persistence. The methods described here are still in development, but it appears that drone-based census of rare plants with distinctive morphology in open habitats will be sufficiently accurate for management purposes. Our methods could provide a model for drone-based management of rare, edaphically-restricted plant species worldwide.
Supplementary Materials
The following are available online at https://0-www-mdpi-com.brum.beds.ac.uk/2072-4292/11/6/719/s1. Supplemental File S1: Poppy detection protocol; Supplemental File S2: Validation data sets; Supplemental File S3: High-resolution map of White Dome Nature Preserve; Supplemental File S4: High-resolution White Dome census; Supplemental File S5: High-resolution White Dome habitat classification; Supplemental File S6: High-resolution map of Tonaquint census area; Supplemental File S7: High-resolution Tonaquint census; Supplemental File S8: High-resolution Tonaquint habitat classification.
Author Contributions
Conceptualization, K.R. and S.E.M.; methodology, K.R.; investigation, K.R.; validation, K.R. and S.E.M.; formal analysis, K.R. and S.E.M.; visualization, K.R. and S.E.M.; writing—original draft, K.R. and S.E.M.; writing—review and editing, K.R. and S.E.M.; funding acquisition, K.R. and S.E.M.
Funding
This work was funded in part by contributions from The Nature Conservancy (TNC), the Utah Department of Natural Resources (UDNR), the Washington County Habitat Conservation Plan (HCP), and the US Department of the Interior, Bureau of Land Management (BLM).
Acknowledgments
We would like to thank the following people who were instrumental in making it possible for us to complete this study: Elaine York of TNC, Mindy Wheeler of the State of Utah Department of Natural Resources, Cameron Rognan of the Washington County HCP, Marcia Wineteer, Dawna Ferris-Rowley, and John Kellam of the BLM, and Jena Lewinsohn of the US Fish and Wildlife Service.
Conflicts of Interest
The authors declare no conflicts of interest.
References
- Hutchings, M.J. Monitoring plant populations: Census as an aid to conservation. In Monitoring for Conservation and Ecology; Goldsmith, B., Ed.; Springer: Dordrecht, The Netherlands, 1991; pp. 61–76. [Google Scholar]
- Nelson, J.R. Rare plant surveys: Techniques for impact assessment. Nat. Area J. 1991, 5, 18–30. [Google Scholar]
- Palmer, M.E. A critical look at rare plant monitoring in the United States. Biol. Conserv. 1987, 39, 113–127. [Google Scholar] [CrossRef]
- Menges, E.S. Three levels of monitoring intensity for rare plant species. Nat. Area J. 1996, 16, 227–237. [Google Scholar]
- Sánchez-Bou, C.; López-Pujol, J. The coming revolution: The use of drones in plant conservation. Collect. Bot. 2014, 33, e007. [Google Scholar]
- Jiménez-López, J.; Mulero-Pázmány, M. Drones for conservation in protected areas: Present and future. Drones 2019, 3, 10. [Google Scholar] [CrossRef]
- Christie, K.S.; Gilbert, S.L.; Brown, C.L.; Hatfield, M.; Hanson, L. Unmanned aircraft systems in wildlife research: Current and future applications of a transformative technology. Front. Ecol. Environ. 2016, 14, 241–251. [Google Scholar] [CrossRef]
- Getzin, S.; Wiegand, K.; Schöning, I. Assessing biodiversity in forests using very high-resolution images and unmanned aerial vehicles. Methods Ecol. Evol. 2012, 3, 397–404. [Google Scholar] [CrossRef]
- Breckenridge, R.P.; Dakins, M.; Bunting, S.; Harbour, J.L.; Lee, R.D. Using unmanned helicopters to assess vegetation cover in sagebrush steppe ecosystems. Rangel. Ecol. Manag. 2012, 65, 362–370. [Google Scholar] [CrossRef]
- Zweig, C.L.; Burgess, M.A.; Percival, H.F.; Kitchens, W.M. Use of unmanned aircraft systems to delineate fine-scale wetland vegetation communities. Wetlands 2015, 35, 303–309. [Google Scholar] [CrossRef]
- Cruzan, M.B.; Weinstein, B.G.; Grasty, M.R.; Kohrn, B.F.; Hendrickson, E.C.; Arredondo, T.M.; Thompson, P.G. Small unmanned aerial vehicles (micro-UAVs, drones) in plant ecology. Appl. Plant Sci. 2016, 4, 1600041. [Google Scholar] [CrossRef]
- Cunliffe, A.M.; Brazier, R.E.; Anderson, K. Ultra-fine grain landscape-scale quantification of dryland vegetation structure with drone-acquired structure-from-motion photogrammetry. Remote Sens. Environ. 2016, 183, 129–143. [Google Scholar] [CrossRef] [Green Version]
- Lorah, P.; Ready, A.; Rinn, E. Using drones to generate new data for conservation insights. Int. J. Geospat. Environ. Res. 2018, 5, 2. [Google Scholar]
- Baena, S.; Boyd, D.S.; Moat, J. UAVs in pursuit of plant conservation—Real world experiences. Ecol. Inform. 2018, 47, 2–9. [Google Scholar] [CrossRef]
- Baena, S.; Moat, J.; Whaley, O.; Boyd, D.S. Identifying species from the air: UAVs and the very high-resolution challenge for plant conservation. PLoS ONE 2017, 12, e0188714. [Google Scholar] [CrossRef]
- Van Auken, O.W.; Taylor, D.L. Using a drone (UAV) to determine the Acer grandidentatum (bigtooth maple) density in a relic, isolated community. Phytologia 2017, 99, 208–220. [Google Scholar]
- Franklin, S.E.; Ahmed, O.S. Deciduous tree species classification using object-based analysis and machine learning with unmanned aerial vehicle multispectral data. Int. J. Remote Sens. 2018, 39, 5236–5245. [Google Scholar] [CrossRef]
- Mishra, N.; Mainali, K.; Shrestha, B.; Radenz, J.; Karki, D. Species-level vegetation mapping in a Himalayan treeline ecotone using unmanned aerial system (UAS) imagery. ISPRS Int. J. Geo-Inf. 2018, 7, 445. [Google Scholar] [CrossRef]
- Michez, A.; Piégay, H.; Jonathan, L.; Claessens, H.; Lejeune, P. Mapping of riparian invasive species with supervised classification of Unmanned Aerial -System (UAS) imagery. Int. J. Appl. Earth Obs. 2016, 44, 88–94. [Google Scholar] [CrossRef]
- Hill, D.J.; Tarasoff, C.; Whitworth, G.E.; Baron, J.; Bradshaw, J.L.; Church, J.S. Utility of unmanned aerial vehicles for mapping invasive plant species: A case study on yellow flag iris (Iris pseudacorus L.). Int. J. Remote Sens. 2017, 38, 2083–2105. [Google Scholar] [CrossRef]
- Müllerová, J.; Bartaloš, T.; Brůna, J.; Dvořák, P.; Vítková, M. Unmanned aircraft in nature conservation: An example from plant invasions. Int. J. Remote Sens. 2017, 38, 2177–2198. [Google Scholar] [CrossRef]
- Rivas-Torres, G.F.; Benítez, F.L.; Rueda, D.; Sevilla, C.; Mena, C.F. A methodology for mapping native and invasive vegetation coverage in archipelagos: An example from the Galápagos Islands. Prog. Phys. Geog. 2018, 42, 83–111. [Google Scholar] [CrossRef]
- Gallacher, D.; Khafaga, M.T.; Ahmed, M.T.M.; Shabana, M.H.A. Plant species identification via drone images in an arid shrubland. In The Future of Grazing and Wild Land Management in a High-Tech World: Proceedings of the 10th International Rangeland Congress, Saskatoon, SK, Canada, 16–22 July 2016; Iwaasa, A., Lardner, H.A., Willms, W., Schellenberg, M., Larson, K., Eds.; 10th International Rangeland Congress: Saskatoon, Canada, 2016; pp. 981–982. Available online: https://www.researchgate.net/profile/David_Gallacher3/publication/282134026_Plant_species_identification_via_drone_images_in_an_arid_shrubland/links/57b5700208aeaab2a103aac0/Plant-species-identification-via-drone-images-in-an-arid-shrubland.pdf (accessed on 26 March 2019).
- Lu, B.; He, Y. Species classification using Unmanned Aerial Vehicle (UAV)-acquired high spatial resolution imagery in a heterogeneous grassland. ISPRS J. Photogramm. Remote Sens. 2017, 128, 73–85. [Google Scholar] [CrossRef]
- Tay, J.Y.; Erfmeier, A.; Kalwij, J.M. Reaching new heights: Can drones replace current methods to study plant population dynamics? Plant Ecol. 2018, 219, 1139–1150. [Google Scholar] [CrossRef]
- Sun, Y.; Yi, S.; Hou, F. Unmanned aerial vehicle methods makes species composition monitoring easier in grasslands. Ecol. Indic. 2018, 95, 825–830. [Google Scholar] [CrossRef]
- Hernandez-Santin, L.; Rudge, M.L.; Bartolo, R.E.; Erskine, P.D. Identifying species and monitoring understorey from UAS-derived data: A literature review and future directions. Drones 2019, 3, 9. [Google Scholar] [CrossRef]
- Leduc, M.B.; Knudby, A.J. Mapping wild leek through the forest canopy using a UAV. Remote Sens. 2018, 10, 70. [Google Scholar] [CrossRef]
- Gnädinger, F.; Schmidhalter, U. Digital counts of maize plants by unmanned aerial vehicles (UAVs). Remote Sens. 2017, 9, 544. [Google Scholar] [CrossRef]
- Anacker, B.L. The nature of serpentine endemism. Am. J. Bot. 2014, 101, 219–224. [Google Scholar] [CrossRef] [PubMed] [Green Version]
- Willis, C.K.; Cowling, R.M.; Lombard, A.T. Patterns of endemism in the limestone flora of South African lowland fynbos. Biodivers. Conserv. 1996, 5, 55–73. [Google Scholar] [CrossRef]
- Escudero, A.; Palacio, S.; Maestre, F.T.; Luzuriaga, A.L. Plant life on gypsum: A review of its multiple facets. Biol. Rev. 2015, 90, 1–18. [Google Scholar] [CrossRef]
- Pérez-García, F.J.; Martínez-Hernández, F.; Mendoza-Fernández, A.J.; Merlo, M.E.; Sola, F.; Salmerón-Sánchez, E.; Garrido-Becerra, J.A.; Mota, J.F. Towards a global checklist of the of world gypsophytes: A qualitative approach. Plant Sociol. 2017, 54, 61–76. [Google Scholar]
- Pérez-García, F.J.; Akhani, H.; Parsons, R.F.; Silcock, J.L.; Kurt, L.; Özdeniz, E.; Spampinato, G.; Musarella, C.M.; Salmerón-Sánchez, E.; Sola, F.; et al. A first inventory of gypsum flora in the Palearctic and Australia. Mediterr. Bot. 2018, 39, 35–49. [Google Scholar]
- Martínez-Hernández, F.; Pérez-García, F.J.; Garrido-Becerra, J.A.; Mendoza-Fernández, A.J.; Medina-Cazorla, J.M.; Martínez-Nieto, M.I.; Calvente, M.E.M.; Poveda, J.F.M. The distribution of Iberian gypsophilous flora as a criterion for conservation policy. Biodivers. Conserv. 2011, 20, 1353–1364. [Google Scholar] [CrossRef]
- US Fish and Wildlife Service Determination that Arctomecon humilis is an endangered species. Fed. Register. 1979, 44, 64250–64252.
- Belnap, J.; Eldridge, D. Disturbance and recovery of biological soil crusts. In Biological Soil Crusts: Structure, Function, and Management; Belnap, J., Lange, O.L., Eds.; Springer: Berlin/Heidelberg, Germany, 2001; pp. 363–383. [Google Scholar]
- US Fish and Wildlife Service. Dwarf Bear Poppy (Arctomecon humilis Coville) 5-Year Review: Summary and Evaluation; USFWS Utah Field Office: Salt Lake City, UT, USA, 29 September 2016. [Google Scholar]
- Nelson, D.R.; Harper, K.T. Site characteristics and habitat requirements of the endangered dwarf bear-claw poppy (Arctomecon humilis Coville, Papaveraceae). Great Basin Nat. 1991, 51, 167–175. [Google Scholar]
- Harper, K.T.; Van Buren, R. Dynamics of a dwarf bear-poppy (Arctomecon humilis) population over a sixteen-year period. West N. Am. Nat. 2004, 64, 482–491. [Google Scholar]
- Meyer, S.E.; Van Buren, R.; Searle, A. Plant Demography Study and Population Viability Analysis for the Endangered Dwarf Bear Poppy (Arctomecon humilis); The Nature Conservancy Salt Lake Field Office: Salt Lake, UT, USA, 2015. [Google Scholar]
- Elith, J.; Leathwick, J.R. Species distribution models: Ecological explanation and prediction across space and time. Annu. Rev. Ecol. Evol. Syst. 2009, 40, 677–697. [Google Scholar] [CrossRef]
- He, K.S.; Bradley, B.A.; Cord, A.F.; Rocchini, D.; Tuanmu, M.N.; Schmidtlein, S.; Turner, W.; Wegmann, M.; Pettorelli, N. Will remote sensing shape the next generation of species distribution models? Remote Sens. Ecol. Conserv. 2015, 1, 4–18. [Google Scholar] [CrossRef]
- Guisan, A.; Broennimann, O.; Engler, R.; Vust, M.; Yoccoz, N.G.; Lehmann, A.; Zimmermann, N.E. Using niche-based models to improve the sampling of rare species. Conserv. Biol. 2006, 20, 501–511. [Google Scholar] [CrossRef] [PubMed]
- Ma, L.; Yin, G.; Zhou, Z.; Lu, H.; Li, M. Uncertainty of object-based image analysis for drone survey images. In Drones; Dekoulis, G., Ed.; Intech Open: London, UK, 2017. [Google Scholar] [CrossRef]
- Meyer, S.E. The ecology of gypsophile endemism in the eastern Mojave Desert. Ecology 1986, 67, 1303–1313. [Google Scholar] [CrossRef]
- Meyer, S.E.; García-Moya, E.; Lagunes-Espinoza, L. Topographic and soil surface effects on gypsophile plant community patterns in central Mexico. J. Veg. Sci. 1992, 3, 429–438. [Google Scholar] [CrossRef]
- Elith, J.; Phillips, S.J.; Hastie, T.; Dudík, M.; Chee, Y.E.; Yates, C.J. A statistical explanation of MaxEnt for ecologists. Divers. Distrib. 2011, 17, 43–57. [Google Scholar] [CrossRef]
Figure 1.
Range-wide distribution of Arctomecon humilis in southwestern Utah, USA [38], location of the two census areas, and boundaries of the Greater St. George Metropolitan Area.
Figure 1.
Range-wide distribution of Arctomecon humilis in southwestern Utah, USA [38], location of the two census areas, and boundaries of the Greater St. George Metropolitan Area.

Figure 2.
(A) Example of high-density dwarf bear-poppy habitat, with poppies clustered primarily within and around the peripheries of white shale bands; (B) a yearling dwarf bear-poppy (~8 cm) with developing inflorescence; (C) typical dwarf bear-poppies, as seen from 5-m altitude drone imagery, showing blue-green color and mound shape; (D) dwarf bear-poppy in full flower.

Figure 3.
(A) Census of White Dome Nature Preserve (green points represent marked plants within the 50-m imagery); (B) ISO-cluster classification of White Dome using 1-m NAIP (National Agricultural Imagery Program) imagery.
Figure 3.
(A) Census of White Dome Nature Preserve (green points represent marked plants within the 50-m imagery); (B) ISO-cluster classification of White Dome using 1-m NAIP (National Agricultural Imagery Program) imagery.

Figure 4.
(A) Census of Tonaquint area (green points represent marked plants within the 50-m imagery) with (B) ISO-cluster classification of Tonaquint using 1-m NAIP imagery.
Figure 4.
(A) Census of Tonaquint area (green points represent marked plants within the 50-m imagery) with (B) ISO-cluster classification of Tonaquint using 1-m NAIP imagery.

Figure 5.
Area covered by each of the four soil surface cover classes and total area at: (A) White Dome and (B) Tonaquint, and poppy densities in each of the four cover classes and overall at: (C) White Dome and (D) Tonaquint. Analysis was based on marked plants. See Table 2 for statistical analysis.


Table 1.
Validation data matrix for drone imagery obtained over plots at 50-m altitude at White Dome, at 50-m altitude at Tonaquint, and at 30-m altitude at Tonaquint. Putative poppy plants were marked on high-altitude imagery, then confirmed on validation imagery at 15 m. Additional plants found on 15-m imagery but not on the higher altitude imagery were scored as missed. Error terms are standard error of the mean of plot values. (See Supplemental File S2 for full validation data set.).
| Drone Imagery | Total Plant Counts | Fraction Confirm 1 | Fraction Missed 2 | Correction Terms | |||||
|---|---|---|---|---|---|---|---|---|---|
| Marked | Confirm | Missed | Actual | EOC 3 | EOO 4 | Net Error 5 | |||
| White Dome 50 m (n = 9 plots) | 429 | 318 | 339 | 657 | 0.711 | 0.516 | 0.711 ± 0.03 | 2.17 ± 0.109 | 1.54 ± 0.095 |
| Tonaquint 50 m (n = 4 plots) | 74 | 52 | 61 | 113 | 0.702 | 0.54 | 0.702 ± 0.055 | 2.26 ± 0.35 | 1.53 ± 0.135 |
| Tonaquint 30 m (n = 5 plots) | 248 | 225 | 166 | 391 | 0.907 | 0.425 | 0.902 ± 0.048 | 1.76 ± 0.122 | 1.56 ± 0.066 |
1 Fraction Confirm = Confirm/marked (calculated as mean of plot values); 2 Fraction Missed = Missed/actual (calculated as mean of plot values; 3 EOC = Error of commission correction term = Fraction confirm; 4 EOO = Error of omission correction term = Actual/confirm); 5 Net Error Correction Term = EOC * EOO = Actual/marked (calculated as mean of plot values).
Table 2.
Soil surface cover classification and poppy density contingency table (Χ2) analyses.
| Contingency Table Analysis | d. f. | Χ2 Value | p Value |
|---|---|---|---|
| Poppy number by cover class area—White Dome | 3 | 151.242 | 0.0000 |
| Poppy number by cover class area—Tonaquint | 3 | 88.423 | 0.0000 |
| Compare cover class areas—White Dome vs. Tonaquint | 3 | 1.378 | 0.7106 |
| Compare poppy densities by cover class—White Dome vs. Tonaquint | 3 | 0.830 | 0.8423 |
© 2019 by the authors. Licensee MDPI, Basel, Switzerland. This article is an open access article distributed under the terms and conditions of the Creative Commons Attribution (CC BY) license (http://creativecommons.org/licenses/by/4.0/).
Share and Cite
MDPI and ACS Style
Rominger, K.; Meyer, S.E. Application of UAV-Based Methodology for Census of an Endangered Plant Species in a Fragile Habitat. Remote Sens. 2019, 11, 719. https://0-doi-org.brum.beds.ac.uk/10.3390/rs11060719
AMA Style
Rominger K, Meyer SE. Application of UAV-Based Methodology for Census of an Endangered Plant Species in a Fragile Habitat. Remote Sensing. 2019; 11(6):719. https://0-doi-org.brum.beds.ac.uk/10.3390/rs11060719
Chicago/Turabian StyleRominger, Kody, and Susan E. Meyer. 2019. "Application of UAV-Based Methodology for Census of an Endangered Plant Species in a Fragile Habitat" Remote Sensing 11, no. 6: 719. https://0-doi-org.brum.beds.ac.uk/10.3390/rs11060719
Note that from the first issue of 2016, this journal uses article numbers instead of page numbers. See further details here.