Determination of Primary and Secondary Lahar Flow Paths of the Fuego Volcano (Guatemala) Using Morphometric Parameters


Geology Department, External Geodynamics Area, Faculty of Sciences, University of Salamanca, Plaza Merced s/n, 37008 Salamanca, Spain
*
Author to whom correspondence should be addressed.
Remote Sens. 2019, 11(6), 727; https://0-doi-org.brum.beds.ac.uk/10.3390/rs11060727
Submission received: 2 February 2019
/
Revised: 23 March 2019
/
Accepted: 25 March 2019
/
Published: 26 March 2019
(This article belongs to the Special Issue Remote Sensing of Volcanic Processes and Risk)
Abstract
:On 3 June 2018, a strong eruption of the Fuego volcano in Guatemala produced a dense cloud of 10-km-high volcanic ash and destructive pyroclastic flows that caused nearly 200 deaths and huge economic losses in the region. Subsequently, due to heavy rains, destructive secondary lahars were produced, which were not plotted on the hazard maps using the LAHAR Z software. In this work we propose to complement the mapping of this type of lahars using remote-sensing (Differential Interferometry, DINSAR) in Sentinel images 1A and 2A, to locate areas of deformation of the relief on the flanks of the volcano, areas that are possibly origin of these lahars. To determine the trajectory of the lahars, parameters and morphological indices were analyzed with the software System for Automated Geoscientific Analysis (SAGA). The parameters and morphological indices used were the accumulation of flow (FCC), the topographic wetness index (TWI), the length-magnitude factor of the slope (LS). Finally, a slope stability analysis was performed using the Shallow Landslide Susceptibility software (SHALSTAB) based on the Mohr–Coulomb theory and its parameters: internal soil saturation degree and effective precipitation, parameters required to destabilize a hillside. In this case, the application of this complementary methodology provided a more accurate response of the areas destroyed by primary and secondary lahars in the vicinity of the volcano.
1. Introduction
Primary lahars are flows which are formed as a direct result of a volcanic eruption. They tend to be bulky (107–109 m3) and record high speeds (>20 m/s). Their maximum flows are commonly between 103–105 m3/s. These features provide the ability to flow long distances, even hundreds of kilometers downstream. They occur primarily when during an eruptive event incandescent material causes the fast melting of large volumes of ice and snow of the glaciers that cover some volcanic edifices and flows by descent gullies. Secondary lahars mainly include lahars caused by the rains. The unbound, by previous eruptions, pyroclastic material can be easily removed by the rains. In general, these are at lower speed, volume and they travel shorter distances as compared to primary lahars, however, they are most frequent during periods of rain [1].
Guatemala is the only country in the Central American region that has trained local observers to generate reports on volcanic activity, who then transmit the information via radio and/or telephone three times a day. The information is transmitted to the National Institute of Seismology, Volcanology, Meteorology and Hydrology (INSIVUMEH) plant when the following characteristics are present: changes in the release of energy, increase in the number of explosions, increase in the expulsion of ash, increase in seismic activity, rumblings, shock waves, and the manifestation of block avalanches that descend through the ravines in the volcanic perimeter.
On 3 June 2018, a strong eruption of the Fuego volcano in Guatemala produced a dense volcanic ash cloud rising to 10 km high. Following the collapse of the volcanic column, pyroclastic flows and descending lahars caused significant damage and a high number of fatalities around the mountain [2]. After the eruption, INSIVUMEH, with support from the Volcano Disaster Assistance Program (VDAP) of the United States Geological Survey (USGS), the University of Edinburgh, and Michigan Technological University, elaborated 2 scenarios of lahars for medium and heavy rains based on the numerical models obtained from the program LAHAR Z (Figure 1). These scenarios can be seen on the MapAction page [3].
On 19 November and for the fifth time during 2018, the Fuego volcano erupted, with a 1200-m long lava flow that descended into the Ceniza canyon. This volcanic flow with fragments of rock producws by erosion on the slopes of the volcano moved downhill, incorporating enough water, so that they formed mud flows and volcanic debris or lahars that descended the slopes of the volcano, affecting sectors such as Las Lajas, El Jute, besides the Ceniza and Seca ravines, according to INSIVUMEH in its last special volcanological bulletins (Nos. 157-2018 and 158-2018) [4,5].
The theory of LAHAR Z’s operation will not be studied in this article, since it is not the objective of this study. Its operation is reviewed briefly. In this article, reference is made to the LAHAR Z program and its results as a basis for superimposing the results obtained by the Differential Interferometry Synthetic Aperture Radar Differential (DINSAR) analysis, the morphometric indices and the unstable areas near the volcano.
LAHAR Z was written to delimit areas of potential lahar inundation from one or more user-specified lahar volumes. LAHAR Z is a code that is executed within a geographic information system (GIS), which was created by the USGS [4] and is based on a semi-empirical model that delimits flood risk zones by lahar (that is, areas drawn to represent the probable floods during a lahar event) in a digital elevation model (DEM).
The program uses two semi-empirical equations calibrated by statistical analysis in the cross section of an area flooded by a lahar (A) and the flooded planimetric area (B) measured in 27 lahars deposits of 9 volcanoes in the United States of America, Mexico, Colombia, Canada and Philippines [6] (Figure 2).
The equations are:
where A is the maximum section area flooded, B is the total area flooded and V is the volume of the lahar, and 200, are constant values.
The LAHAR Z model works under assumptions such as:
- Floods from past lahars can provide the information basis to predict possible future floods.
- Distant hazard zones are confined to the valleys and are directed to the slopes of the volcano.
- The volume of the proximal lahar controls the extent of the distal flood forming downstream.
- Very voluminous lahars occur less frequently.
- No one can predict the size of the next lahar that will descend by a river.
- The volume selection for the lahar and the origin site thereof control the flow range.
As a complementary mechanism to the results obtained by DINSAR and Lahar-Z, the morphometric model has been used to determine the trajectories of the destructive lahars with greater precision by combining morphometric parameters obtained from the digital elevation model of 12 m of spatial resolution such as the flow accumulation (FCC), the topographic wetness index (TWI), the length-magnitude factor of slope (LS), the degree of internal saturation of the soil (h/z), where z is soil depth, h is water level above the failure plane and the effective precipitation (q/T) required to destabilize a slope, where h is the height of the water table and z is the thickness of the colluvium that slides above the failure plane. All these parameters are obtained from the shallow landslide slope stability model (SHALSTAB) to complement the mapping of this type of lahars using remote sensing (differential interferometry, DINSAR) in Sentinel images 1A and 2A, to locate areas of deformation of the relief on the flanks of the volcano, areas that are possibly origin of these lahars. To determine the trajectory of the lahars, parameters and morphological indices were analyzed with the software System for Automated Geoscientific Analysis (SAGA). The parameters and morphological indices used were the accumulation of flow (FCC), the TWI, the length-magnitude factor of the slope (LS). Finally, a slope stability analysis was performed using the Shallow Landslide Susceptibility software (SHALSTAB) based on the Mohr–Coulomb theory and its parameters: internal soil saturation degree (h/z) and effective precipitation (q/T), parameters required to destabilize a hillside. In this case, the application of this complementary methodology provided a more accurate response of the areas destroyed by primary and secondary lahars in the vicinity of the volcano [6] (Figure 3). These parameters are described in more detail in the Materials and Methods chapter.
Although the limits of the areas delimited by the numerical modeling of lahars must be taken with caution and are considered as references and not as absolutes, the comparison between the limits of hazards by flows of lahars obtained from modeling with LAHAR Z and the morphometric model is mainly differentiated by their theoretical conceptualization.
Based on the damage caused by the pyroclastic flows, it was found that the volcanic hazard maps and physical vulnerability contained errors for two main reasons: a lack of field observation data to adjust the limits of the hazard map simulated with LAHAR Z, and the poor tracing of possible secondary lahars and the analysis of their distal trajectories originating in proximal sources [5].
2. Materials and Methods
The Sentinel 1 and 2 images obtained from the Alaska Satellite Facility [7], were used to determine the deformations of the terrain using the DINSAR technique [8] and those from Sentinel 2 were used to determine the changes in the morphology of the relief, which in this case was the delimitation of primary and secondary lahars, and compare them with the results obtained from the morphological model. The digital elevation model of 12 m of spatial resolution was obtained from the Copernico Project [9]. The planimetric information such as the results of the LAHAR Z software application was provided by the National Coordinator for Disaster Reduction (CONRED).
To complement the results obtained with the DINSAR analysis and the morphological method, in this study, the spatial distribution of potential sources of primary and secondary lahars during eruptions and torrential rains was analyzed using the slope stability model of shallow landslides. SHALSTAB is a plugin of the SAGA GIS.
The general flow of processes used in this study can be seen in Figure 4.
The processes A, B and C are described below:
Process (A): DINSAR analysis. The Sentinel 1 and 2 images were obtained from the Alaska Satellite Facility [9]. Sentinel 1 images were used to determine the deformations of the terrain using the differential SAR interferometry (DINSAR) technique [10] and those from Sentinel 2 were used to determine the changes in the morphology of the relief, which in this case was the delimitation of primary and secondary lahars and compare them with the results obtained from the morphological model. Process B: the planimetric information such as the results of the LAHAR Z software application was provided by CONRED. Process C: digital elevation model of 12 m of spatial resolution was obtained from the Copernico Project. The field observations carried out by CONRED technicians and sent in the format of points in shp format, helped to calibrate and verify the results obtained from the presented methodology, as well as to understand which of the three morphological parameters used had greater weight according to the scenario in the one that developed the lahars.
For the study of the primary and secondary trajectories of lahars using the DINSAR technique, the morphometric method and the stability analysis, the following parameters were analyzed:
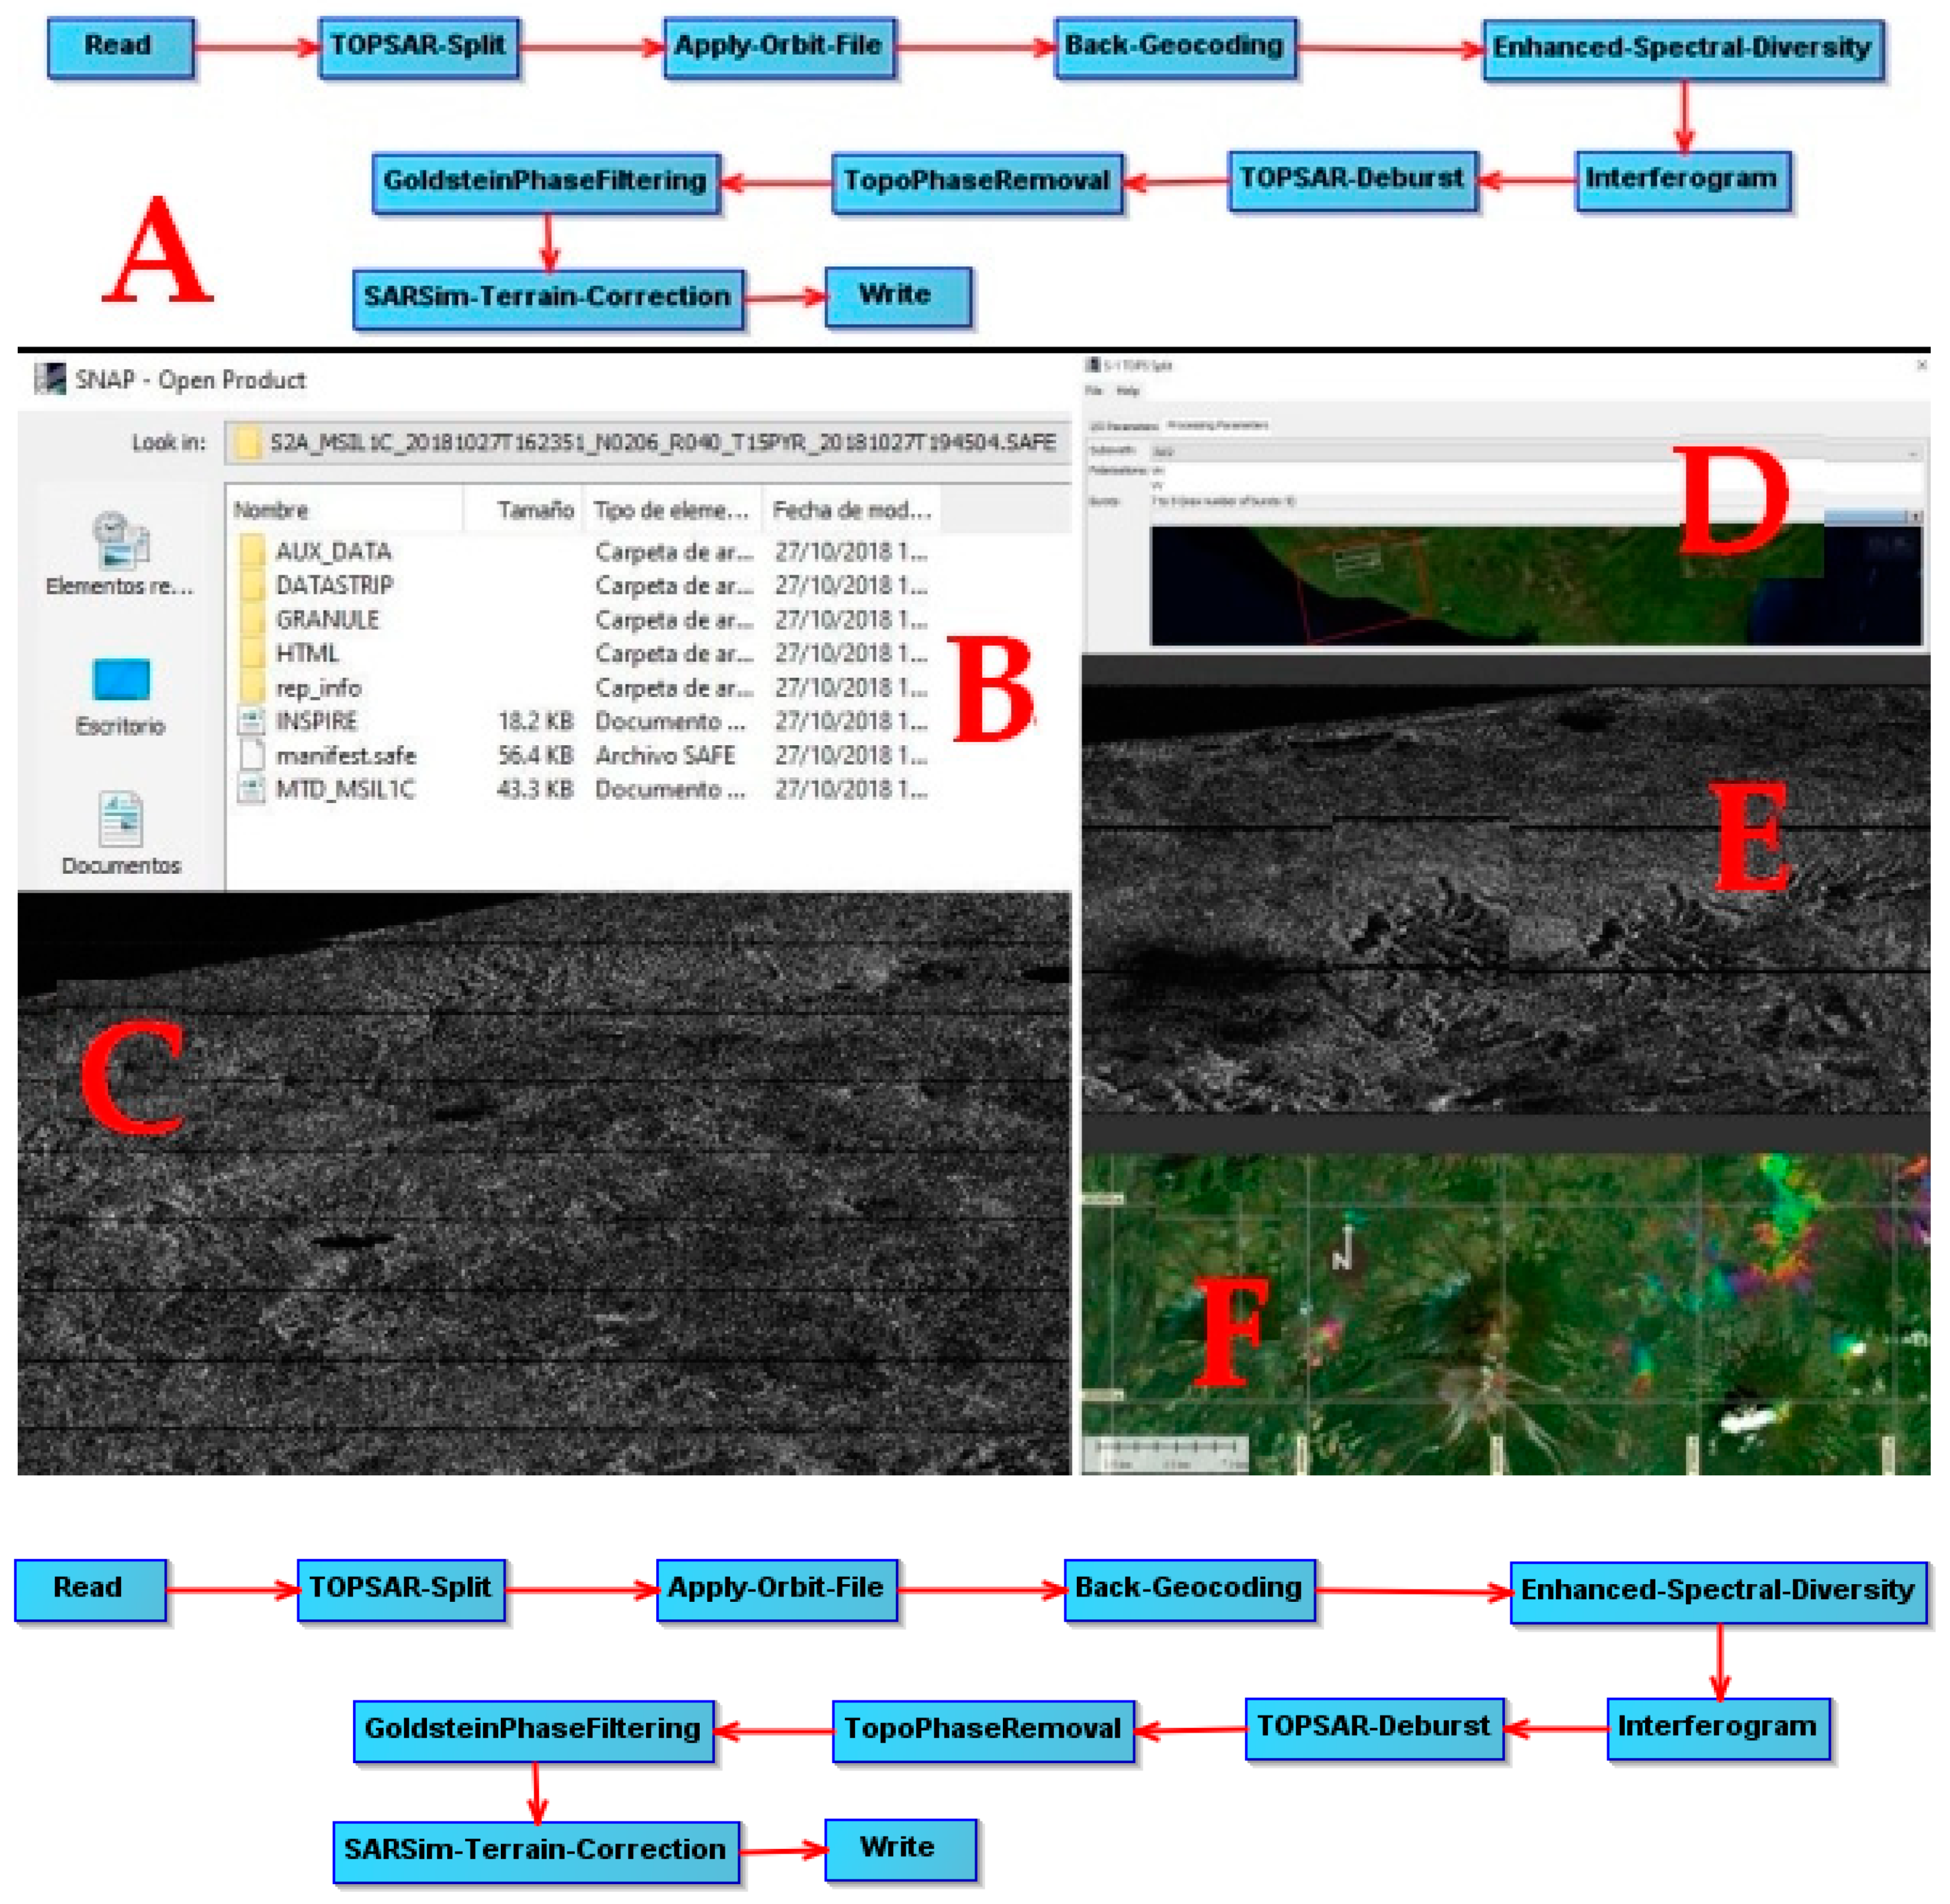
The relief deformation analysis by the Sentinel Application Platform (SNAP) [11] followed the workflow indicated in Figure 4 from the Sentinel 1B images taken on May 21 and June 14, 2018.
This analysis was carried out to determine the possible zones of deformation of the ground where the possible secondary lahars start.
Brief synthesis of the processes to obtain the Interferogram:
- Base images: Sentinel 1B
- S1B_IW_SLC__1SDV_20180521T001317_20180521T001345_011012_0142C5_A797
- S1B_IW_SLC__1SDV_20180614T001319_20180614T001347_011362_014DD5_D06F;
- Mission: SENTINEL-1B
- Pass: ASCENDING
- Polarization: VV
- Step 1
- Read-Topsar-Split-Orbit file: Open the products (Figure 5A).
- S1B_IW_SLC__1SDV_20180521T001317_20180521T001345_011012_0142C5_A797
- S1B_IW_SLC__1SDV_20180614T001319_20180614T001347_011362_014DD5_D06F;
View the products. (Figure 5B): In the Sentinel-1 IW SLC products, there are 3 subsets IW1, IW2, IW3. Each subset is for an adjacent strip of satellite data collection by TOPS mode. The Fuego volcano can be seen in IW3 (Figure 5C).
- Step 2
- View a band geocoding-enhanced spectral diversity. To view the data, Intensity_IW3_VV band.
Coregister the images into a stack: For interferometric processing, two or more images must be coregistered into a stack. One image is selected as the master and the other images are the slaves. The pixels in slave images will be moved to align with the master image to sub-pixel accuracy (Figure 5D).
- Step 3
- Form the Interferogram-Topsar Deburst-TopoPhase Removal-Filtering-Sarsim Terrain Corection-Write. (Figure 5E): Interferogram formation from the InSAR products menu.
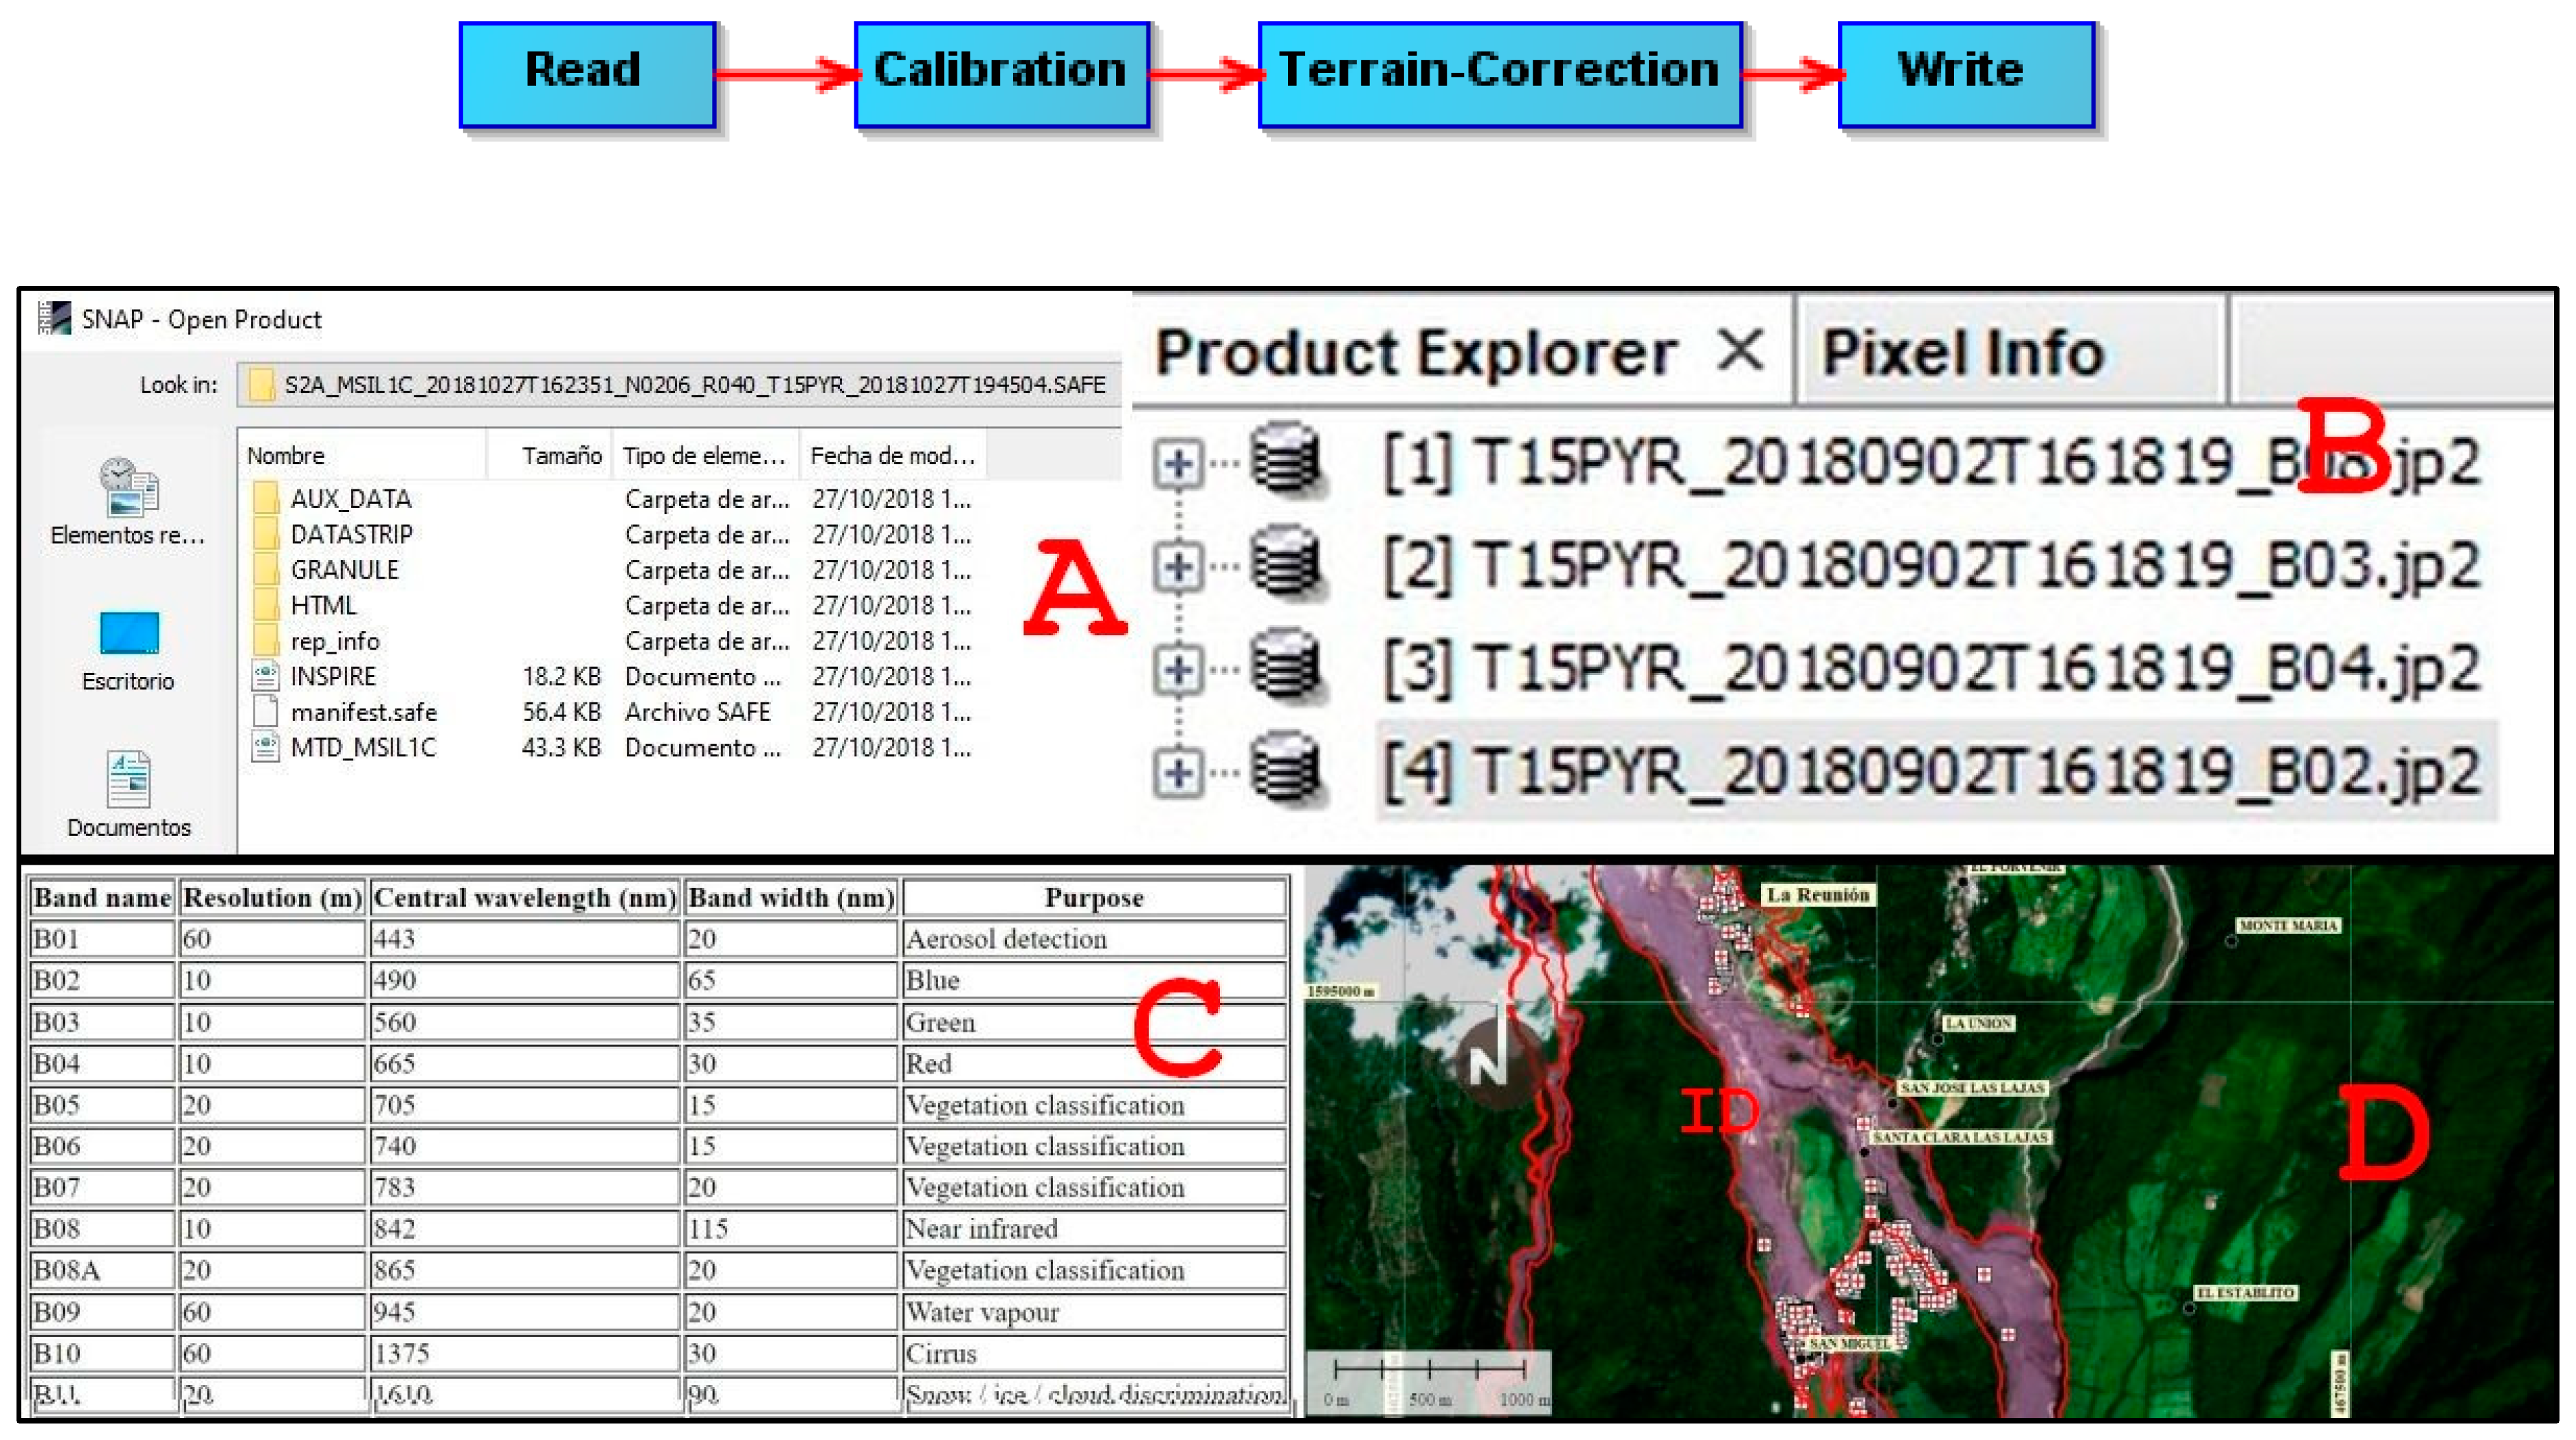
The current location of the primary and secondary tabs after the eruption of 3 June 2018, were obtained with a Sentinel 2 image of 10 m of spatial resolution where bands 4, 3 and 2 were combined to obtain the current position of the lahars (Figure 6). A brief synthesis of the processes to obtain the real position of lahars is presented below:
- Base Image: Sentinel-2B: 2018-10-22T16: 23: 19.024Z
- Pass: DESCENDING
- Bands: 4-3-2
Process diagram in ESA-SNAP
- Step 1
- Read-Open the products. Granule-img-bands (Figure 6A).
View the products. (Figure 6B): In the Sentine-2B-Granule-Img products, there are 13 spectral bands in the visible and near-infrared (VNIR) and short-wavelength infrared (SWIR) spectrum, as show in the below table (Figure 6C).
- Step 2
- Combine bands 4-3-2 RGB natural colors. Location of primary and secondary lahars (Figure 6D).
Process (D): mass movements analysis. To evaluate the susceptibility for landslides and define potential areas of sediment production through mass removal processes, the SHALSTAB program was used, which is a model to map potential shallow landslides. SHALSTAB combines the characteristics of the stationary subsurface flow (water flow that moves at shallow depths below the surface of the land with a constant velocity), considering the morphology-hydrology relationship [12]. SHALSTAB uses two types of numerical models: the slope stability model and the hydrologic model.
The slope stability model is based on an infinite slope form of the Mohr–Coulomb failure law in which the downslope component of the weight of the soil just at failure, τ, is equal to the strength of resistance caused by cohesion (soil cohesion and/or root strength), C, and by frictional resistance due to the effective normal stress on the failure plane Equation (3).
where is the normal stress, is the pore pressure opposing the normal load and is the angle of internal friction of the soil mass at the failure plane. This model assumes, therefore, that the resistances to movement along the sides and ends of the landslide are not significant. As SHALSTAB’s goal is the mapping of landslide hazards, then establishing zero cohesion maximizes the degree of instability possible at the study site. By eliminating cohesion, Equation (4) can be written as:
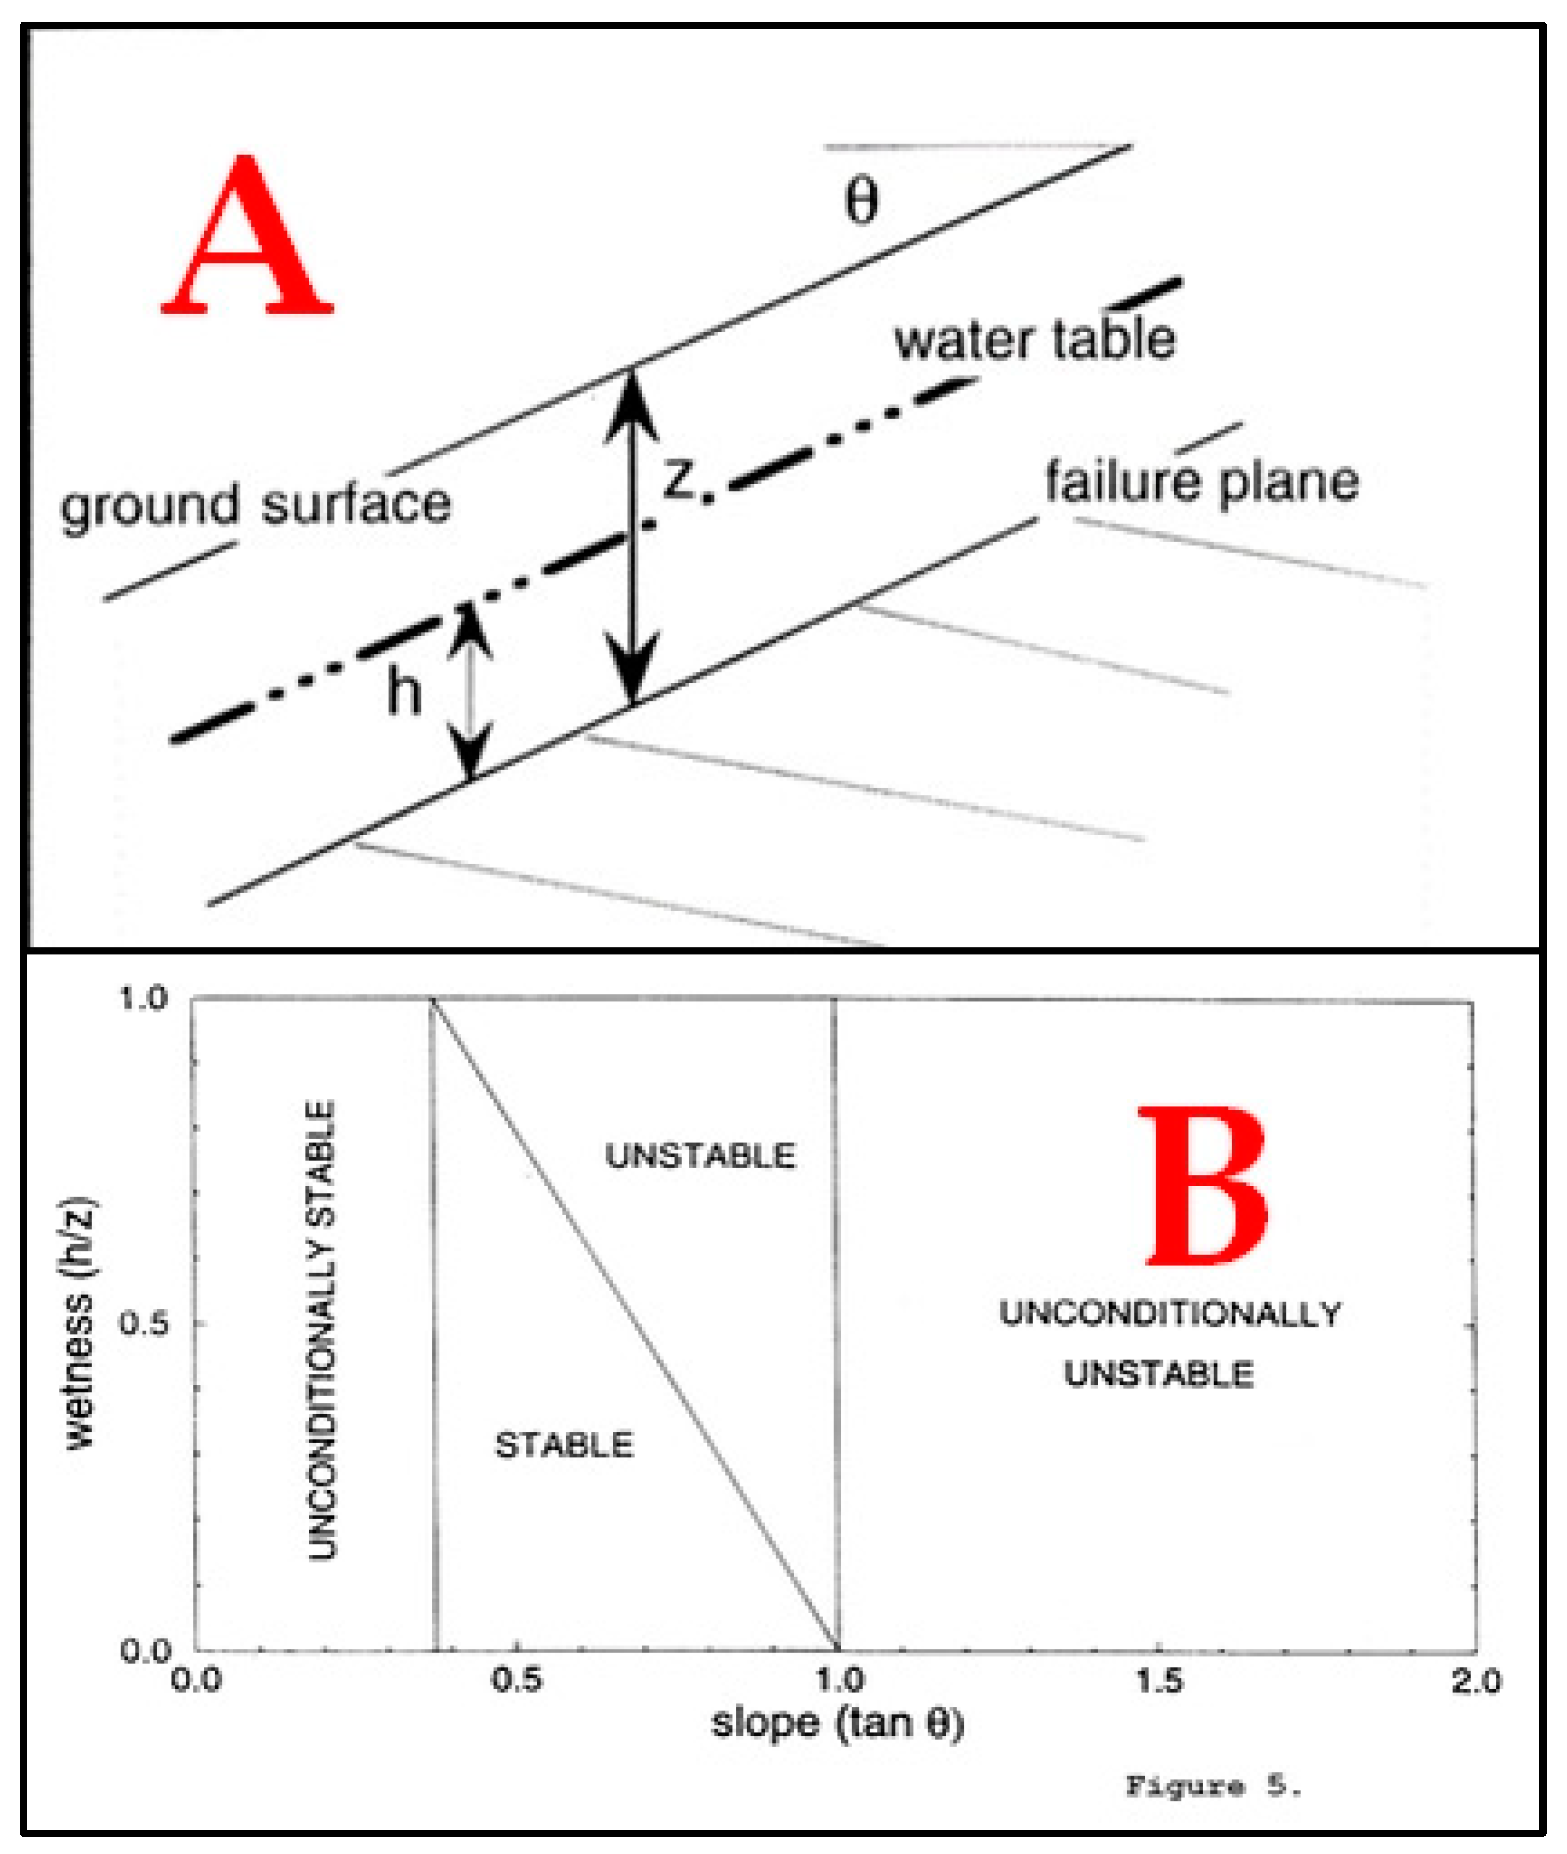
where z is soil depth, h is water level above the failure plane, cρs and is the soil and water bulk density, respectively; g is gravitational acceleration and is slope angle (Figure 7A). This Equation (5) can then be solved for h/z which is the proportion of the soil column that is saturated at instability:
h/z could vary from zero (when the slope is as steep as the friction angle) to when the slope is flat (tan θ = 0). An important assumption, however, will be used below which sets a limit on what h/z can be. It is assumed that the failure plane and the shallow subsurface flow is parallel to hillslope, in which case h/z can only be less than or equal to 1.0 and any site requiring h/z greater than 1 is unconditionally stable—no extreme rain can cause it to fail. Figure 7B illustrates the relationship between h/z and for an angle of internal friction φ of 45° and a bulk density ratio of 1.6. There may be 4 stability states: any slopes equal to or greater than the friction angle will cause the right-hand side of (3) go to zero, hence the site is unstable even if the site is dry (h/z = 0). This scenario is “unconditionally unstable”, commonly corresponds to sites of bedrock outcrop. Because h/z cannot exceed 1.0 in this model, if is less than or equal to tanφ(1-(ρs-ρw) then the slope is “unconditionally stable”. The two other stability states are “stable” and “unstable”, with the former corresponding to the condition in which h/z is greater than or equal to that needed to cause instability (given by the right hand side of Equation (5)) and the latter corresponding to the case in which h/z is less than that needed to cause instability.
Hydrologic model
To model the hydrologic controls on h/z. SHALSTAB use a steady state shallow subsurface flow based on the work by [14,15]. Assume that the steady state hydrologic response model mimics what the relative spatial pattern of wetness (h/z) would be during an intense natural storm which is not in steady state. This assumption would break down if precipitation events are sufficiently intense that thin soils on non-convergent sites can quickly reach destabilizing values of h/z before shallow subsurface flow can converge on unchanneled valleys.
Figure 8 illustrates the geometry and routing of water off the landscape used in the SHALSTAB hydrologic model. If we assume that there is no overland flow, no significant deep drainage, and no significant flow in the bedrock, then q, the effective precipitation (rainfall minus evapotranspiration) times the upslope drainage area, a, must be the amount of runoff that occurs through a grid cell of width b under steady state conditions. Using Darcy’s law, we can write that (6):
where is the head gradient, is saturated hydraulic conductivity. At saturation the shallow subsurface flow will equal the transmissivity, T, (the vertical integral of the saturated conductivity) times the head gradient, sinq and the width of the outflow boundary, b and this we can approximate as follows (7):
where represents the height of the water table on the sliding surface (m), the depth of the soil (m), effective precipitation [mm], soil transmissivity [m2·day-1], (Wetness Index) factor describes the effect of morphology on the subsurface flow (this is calculated in SAGA as the topogrraphic wetness index (TWI)).
In order to delimit areas of danger, new studies have applied a methodology with a geographical information system (GIS) base, identifying zones where flows start along the hydrographic network [12].
Morphologically, the triggering of a detritic or lahar flow depends on two factors: the slope of the channel and the critical flow. The speed of an elementary gravity wave is called the critical velocity. When the velocity of the surface water in a channel equals the critical velocity, the elementary gravity waves with upstream motion remain at the point where they were generated and the flow in the channel is called critical.
When the superficial velocity of the water in the channel is equal to the critical velocity, the elementary waves of gravity with movement upstream remain at the point where they were generated and the flow in the channel is called critical. Both factors can be obtained from the morphological characteristics of the basin. The first one is evaluated directly from the digital terrain model, while the liquid flow is evaluated indirectly through the drained area [12].
Studies conducted in the Swiss Alps found a relationship for the critical slope (S) that triggered detrital flows and the drained area of the basin (A) (Equation (8)).
The coefficients c and n have values of 0.32 and 0.20, respectively. The inverse relationship between S and A indicates that a greater slope of the channel will require a smaller liquid flow to trigger a debris flow (a smaller amount of liquid within the flow area).
Other authors have proposed classifying lahar flows into four categories: triggering, propagation, deceleration, and deposit [13].
Triggering occurs on slopes greater than the threshold proposed by other authors; 25° is known as a slope of minimum probable slope for the initiation of debris flow [13,14,15], but with a lower angle than the internal friction of the ground and a drained area smaller than 10 km2. The maximum slope corresponding to the internal friction angle of the deposit is such that, in areas with steeper slopes, the amount of detritus is generally modest or negligible, while for drained areas exceeding 10 km2, the type of transport becomes fluvial in place of detrital. The model calculates the degree of the internal saturation of the soil with the relationships of the height h/soil depth of the groundwater level z; (h/z) (Equation (9)) is the necessary factors to destabilize the slopes.
This formula allows two limit states to be defined. When h/z is negative, the slope is unstable for any degree of saturation and is called “unconditionally unstable”.
On the other hand, when h/z is greater than one, it is called “unconditionally stable” because even in cases of saturation, the slope is stable. To define the intermediate situations, it is necessary to add the hydrological model.
The hydrological model considers a subsurface flow in a permanent regime.
Applying the law of Darcy, on the characteristics of the movement of water through a porous medium, it is possible to arrive at the following expression that links the degree of saturation (h/z) with effective precipitation (q), which is the rainwater that enters the soil and is assimilated by the plants (Equation (10)).
With
- = effective precipitation [mm];
- T = soil transmissivity [m2·day−1];
- θ = slope [°];
- a = contribution area [m2]; and
- b = is the length of the contour through which the flow transits [m].
where T is the transmissivity of the soil; a is the drained area; and b is the dimension of the raster cell. The relation q/T represents the magnitude of the precipitation relative to the capacity of the soil to conduct the water. The WI (wetness index) factor describes the effect of ground morphology on the subsurface flow.
The analysis of the stability on the slopes of the volcano with SHALSTAB through the hydrological relationship q/T, the magnitude of precipitation, q, in relation to the capacity of the subsoil to transmit water along the T (transmissivity) slopes determined that the greater q was in relation to T, the more likely the soil would be saturated, and the greater the number of sites with unstable slopes. This relationship used the classification of pixels with stable positive values to quasi stable and chronically unstable values with negative values according to the stability classes (Table 1).
Process E: The morphometric method with SAGA. Once the areas of surface deformation of the relief were found with DINSAR (Sentinel 1 images), the current location of the lahars (Sentinel 2 images), the superficial flow accumulators of the runoff and instability zones (SHALSTAB) were determined, the morphological method was applied to complement the location of trajectories of lahar flows with the analysis of the following morphological index.
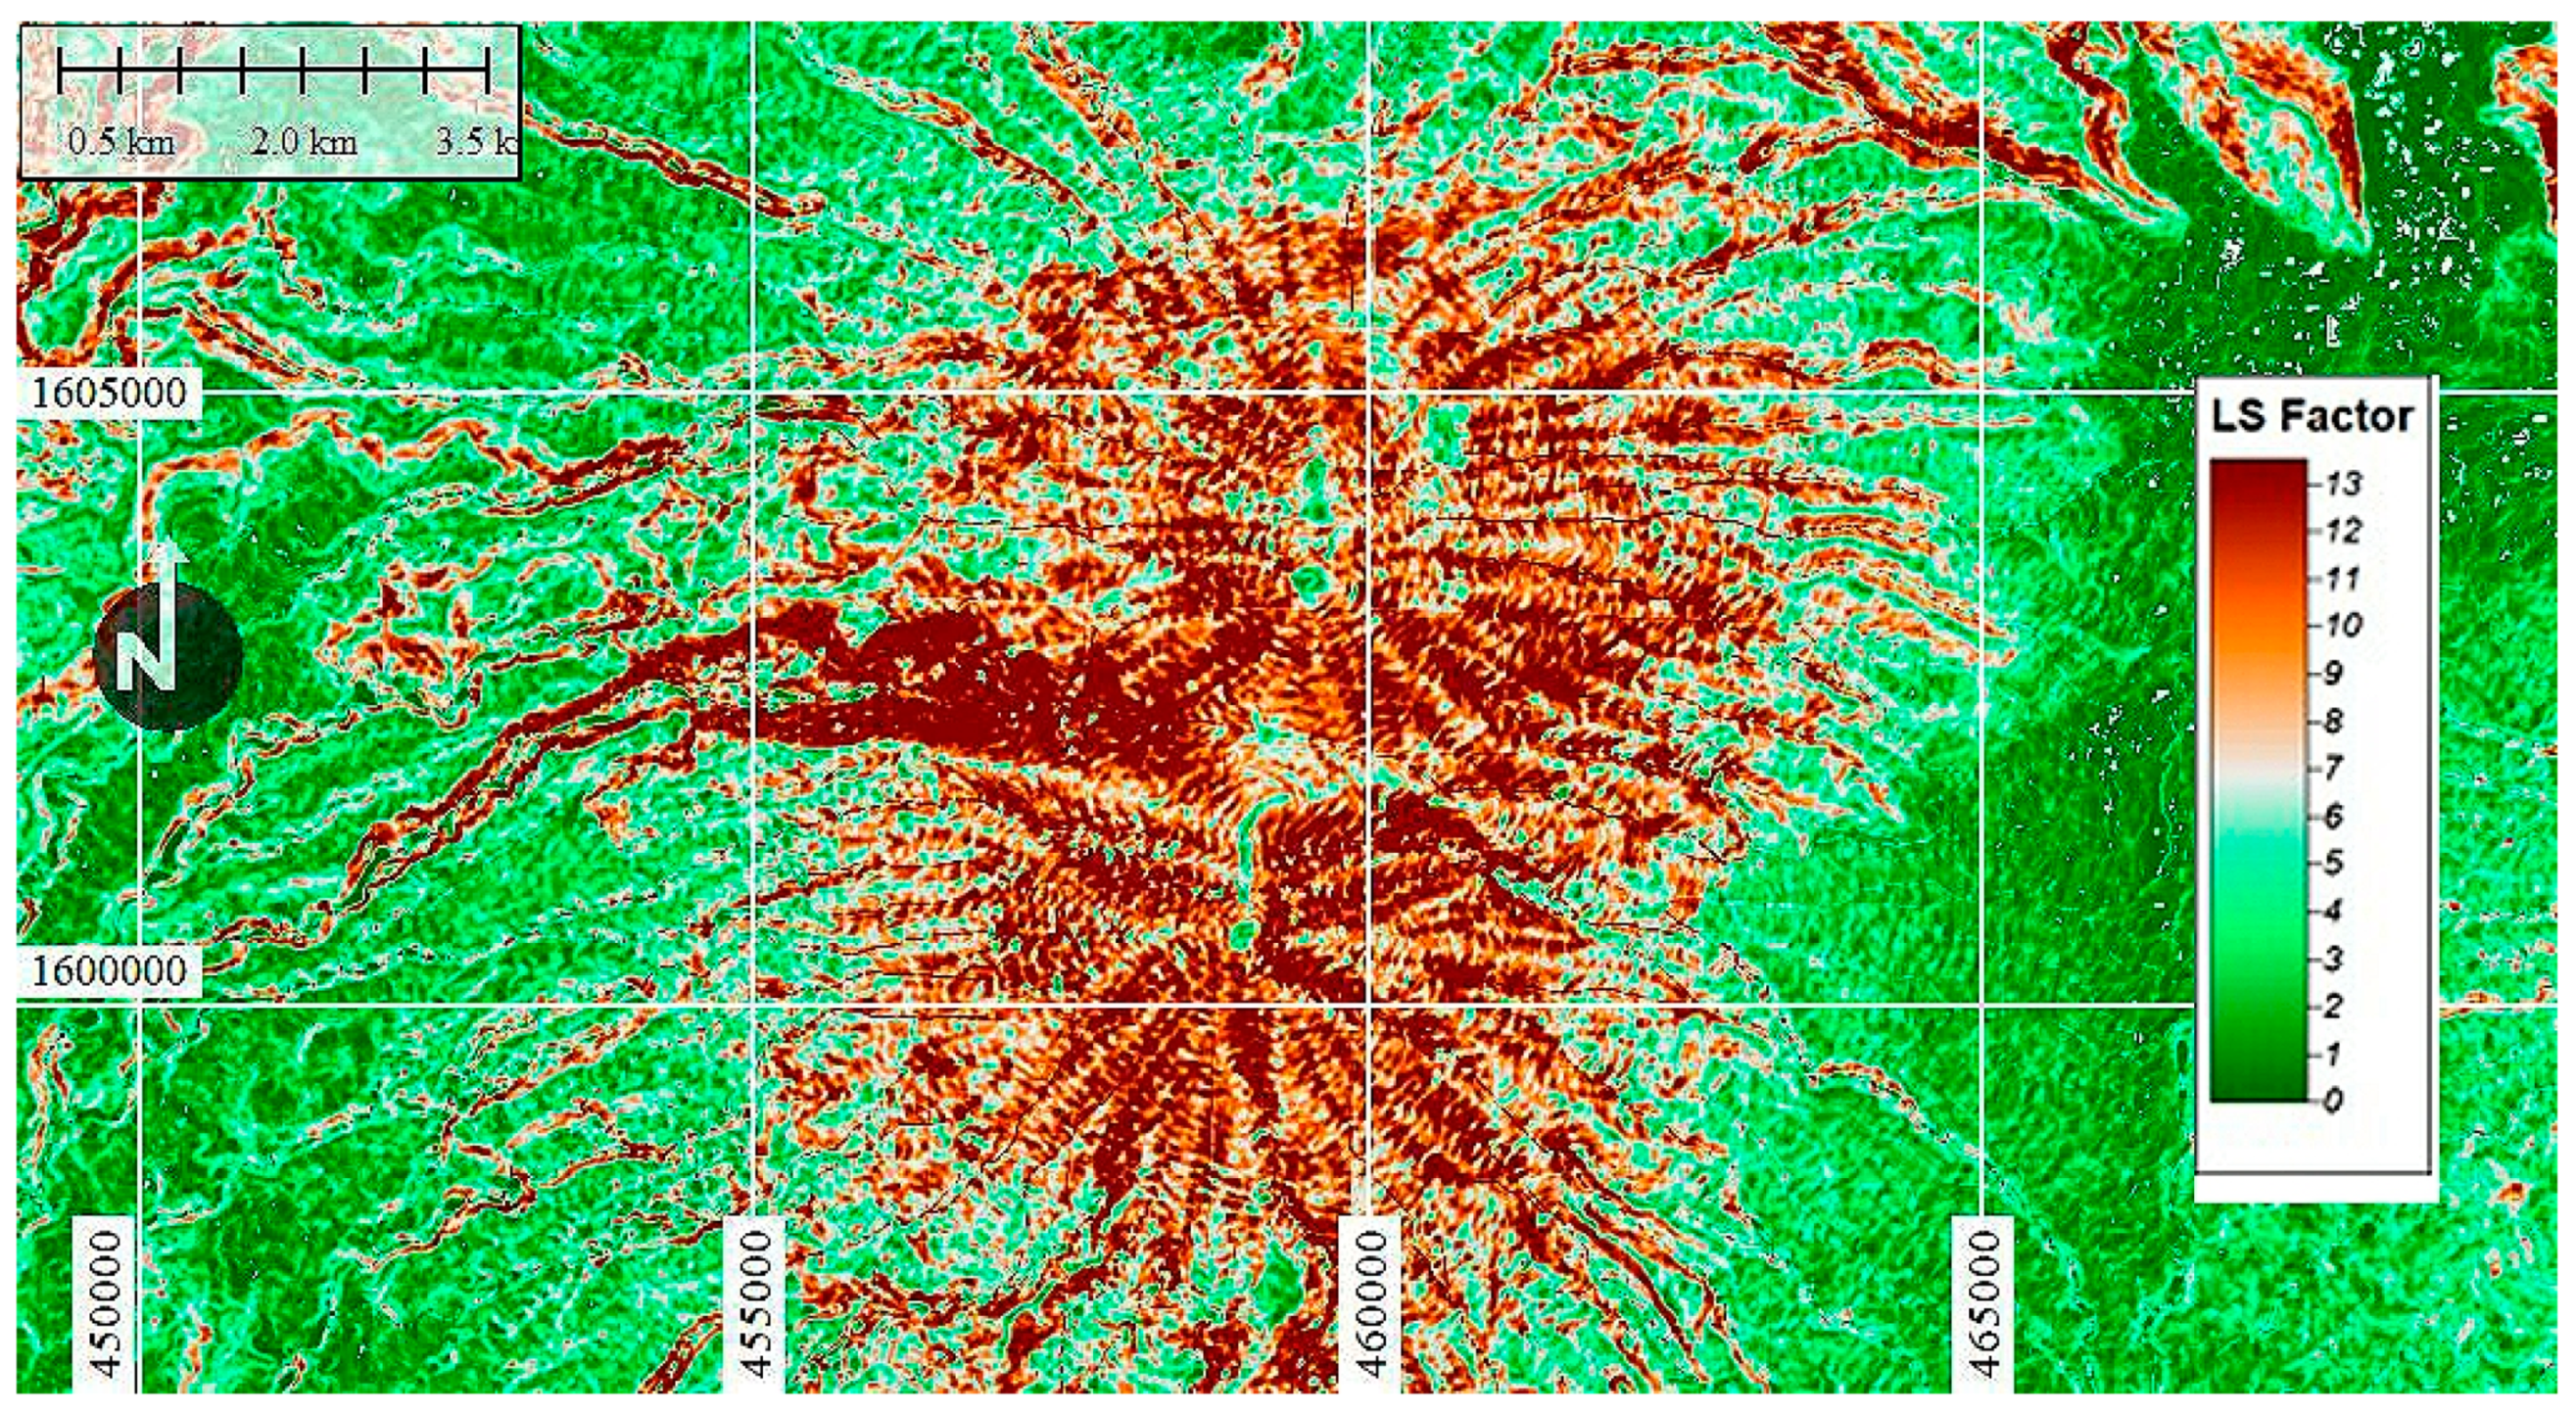
2.1. LS-Factor (Slope Length and Steepness Factor)
This is a combination of the slope and the length of the slope as when combined, it is a useful attribute to predict erosion potential (Equation (11)). The length factor of the slope, L, calculates the effect of the length of the slope on the erosion, and the slope factor of the slope, S, calculates the effect of the slope on the erosion [16,17]. The higher values of brown color represent a greater susceptibility to erosion (Figure 9).
where L is the length of the slope in meters, and S is the gradient of the slope in %.
LS = L^(1/2)/100*(1.36 + 0.97 + 0.1385*S^2)
2.2. Topographic Wetness Index (TWI)
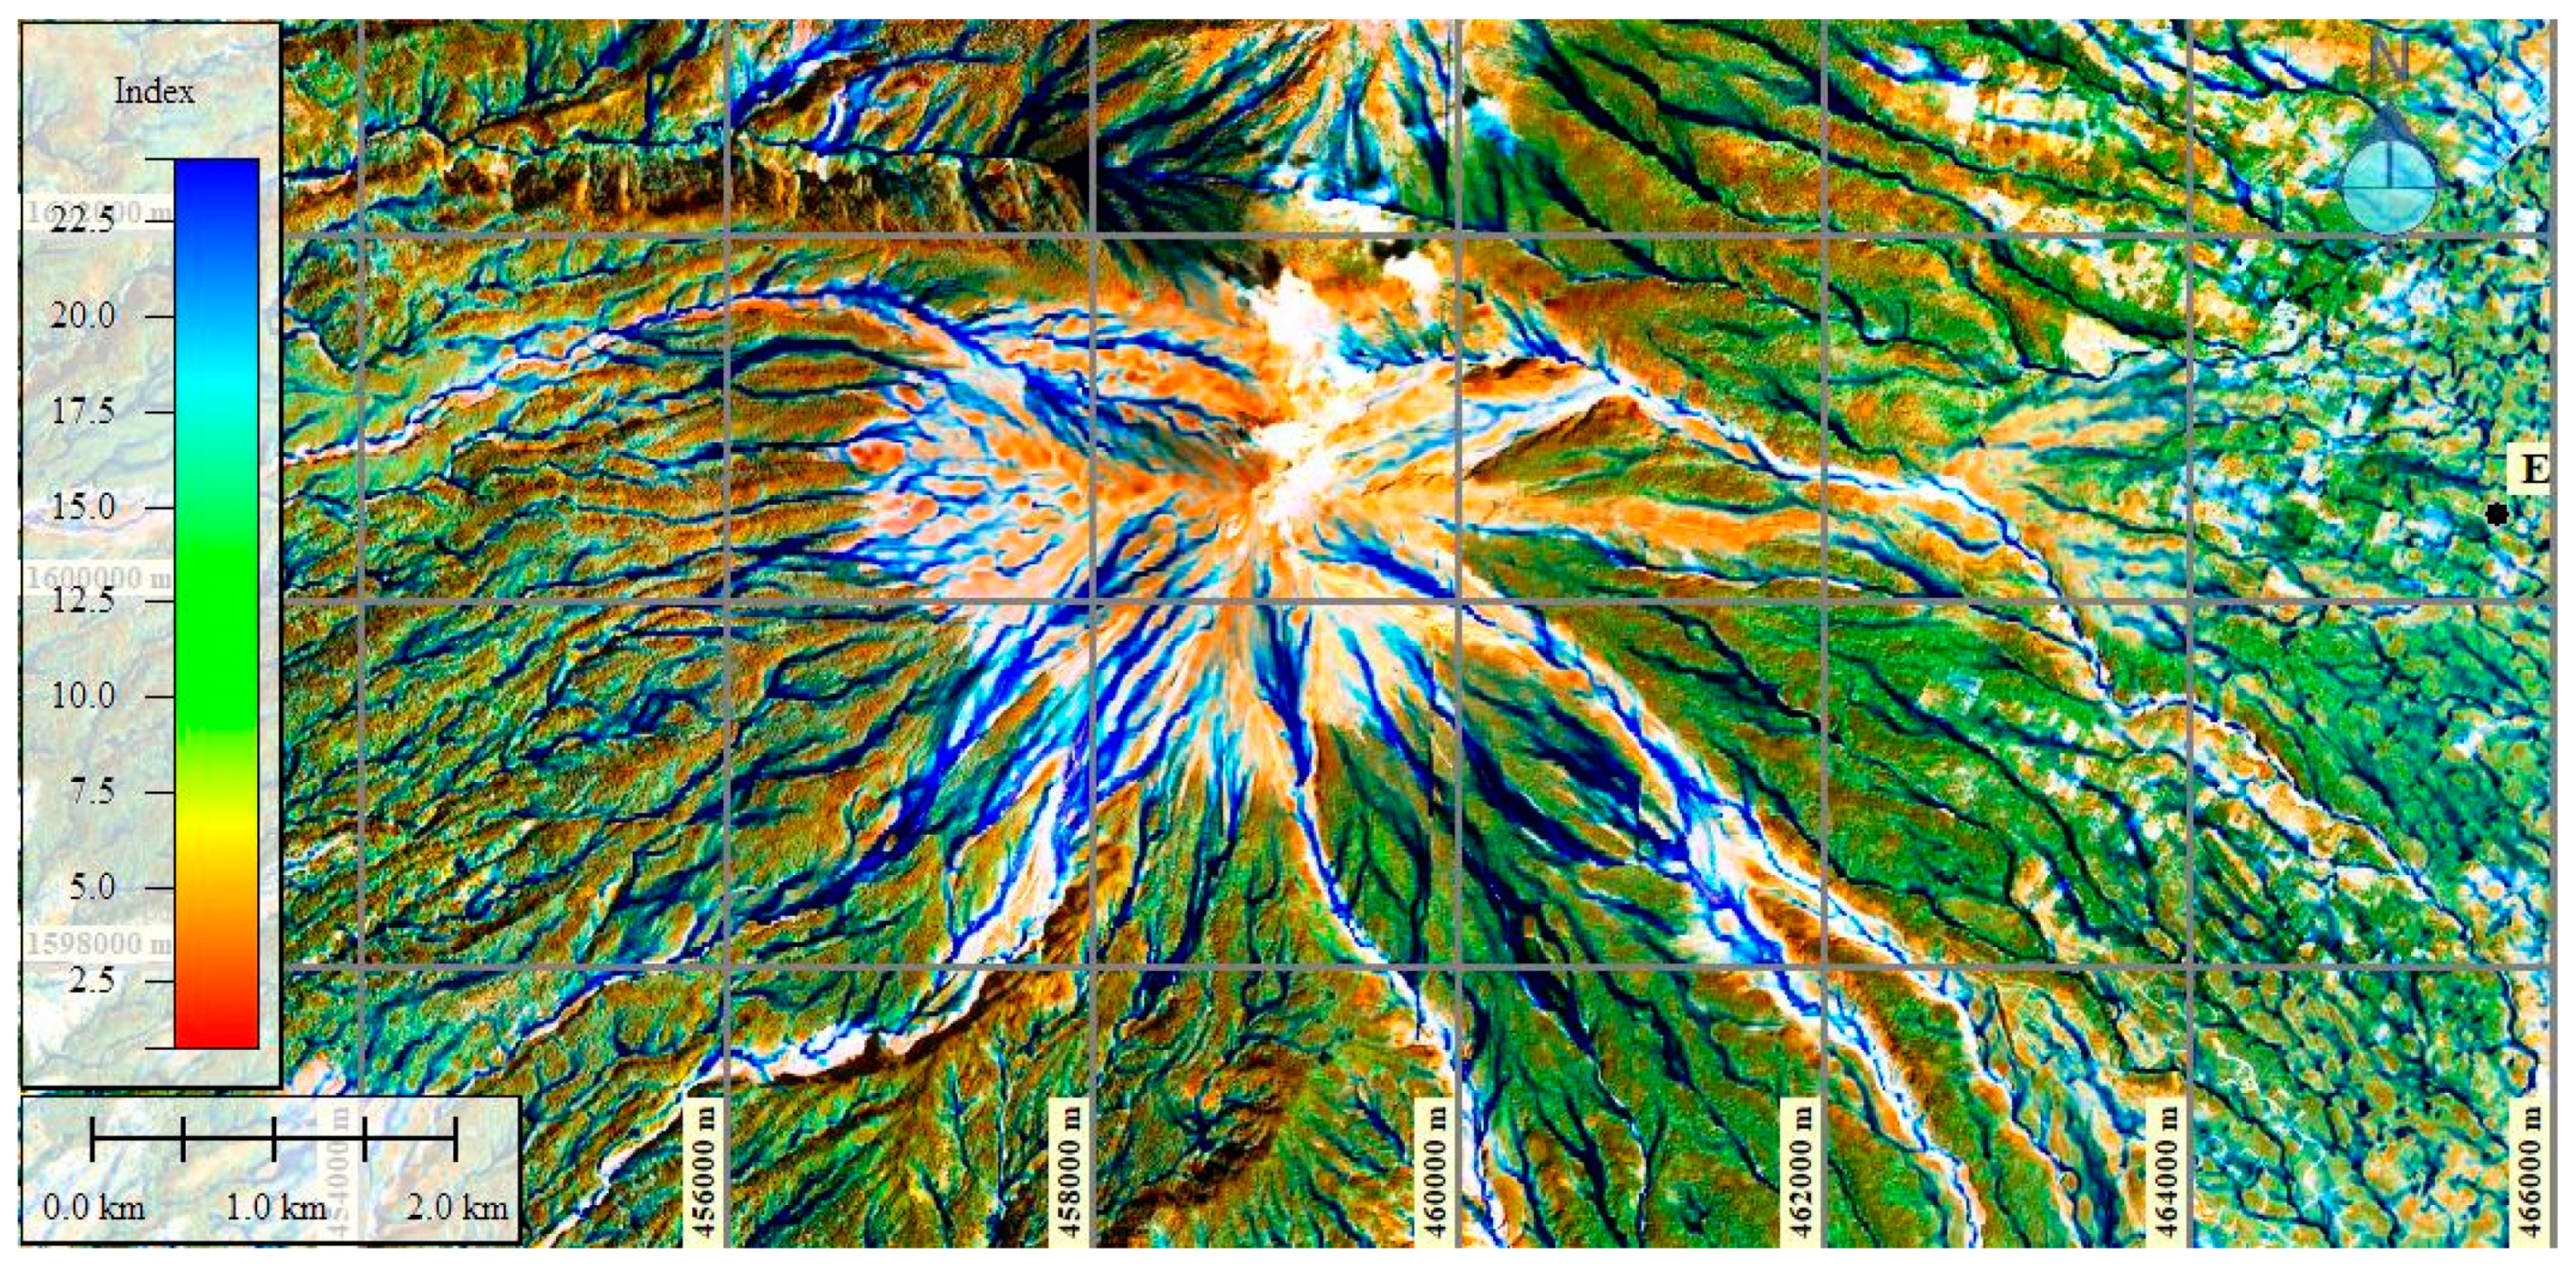
The topographic wetness index models the dynamics of surface and subsurface flows based on the topographic control of runoff, which offers a better perspective in relation to the prediction of sites where the saturation and high concentration of runoff can act as initial flow paths to processes greater than flood (Figure 10).
The TWI combines the contribution to runoff from a local area drained and the pending of it, and it is commonly used to quantify topographic control on hydrological processes and is defined as [6,7,8,9,10,18,19,20] (Equation (12):
where af is the local area drained for a calculation point, and tan β is the directional slope of the cell of interest (and of the eight neighbors in the case of using an algorithm D8. Ln is natural logarithm.
TWI = Ln (af/tan β)
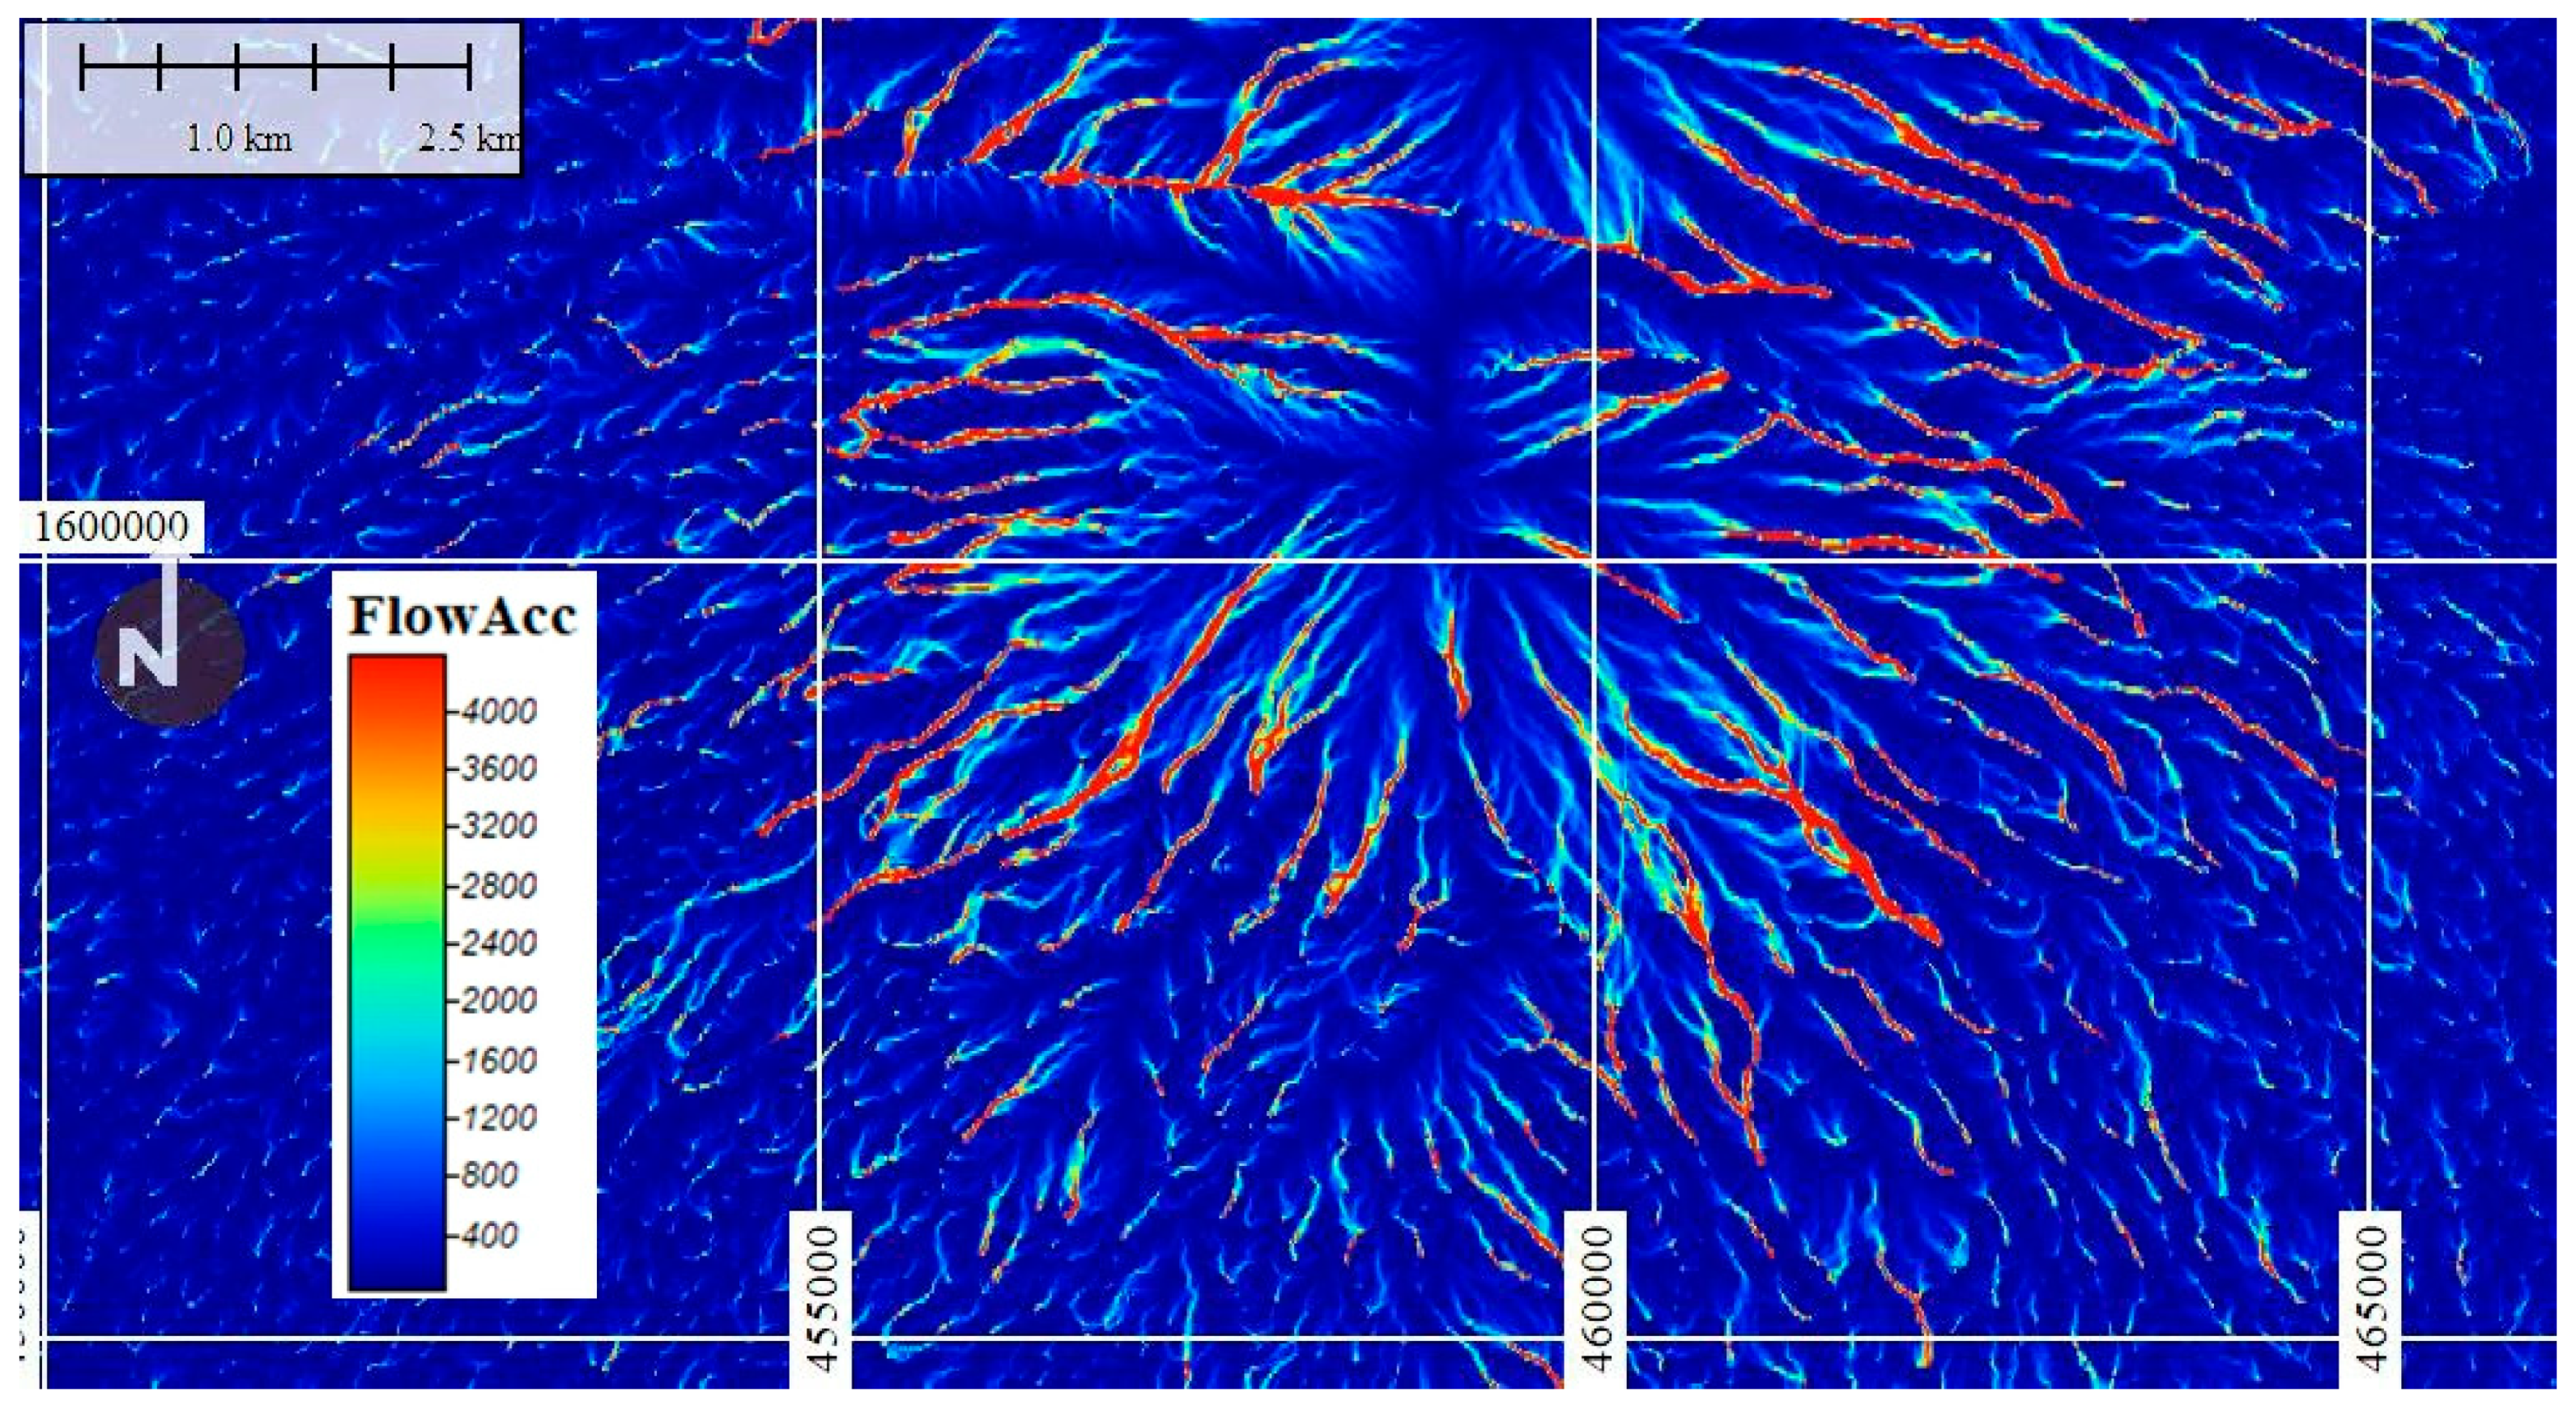
2.3. Flow Accumulation (FCC)
Flow accumulation is calculated as the upslope contributing (catchment) area using the D8 model or multiple flow direction approach [17,18,19]. The result is an accumulated flow raster for each cell, determined by the accumulation of the weight of all of the cells that flow into each cell of the descending slope. The accumulated flow is based on the total number of cells, or a fraction of them, flowing to each cell in the output raster.
The output cells with a high flow accumulation are areas of concentrated flow and can be used to identify watercourse channels (Figure 11).
3. Results
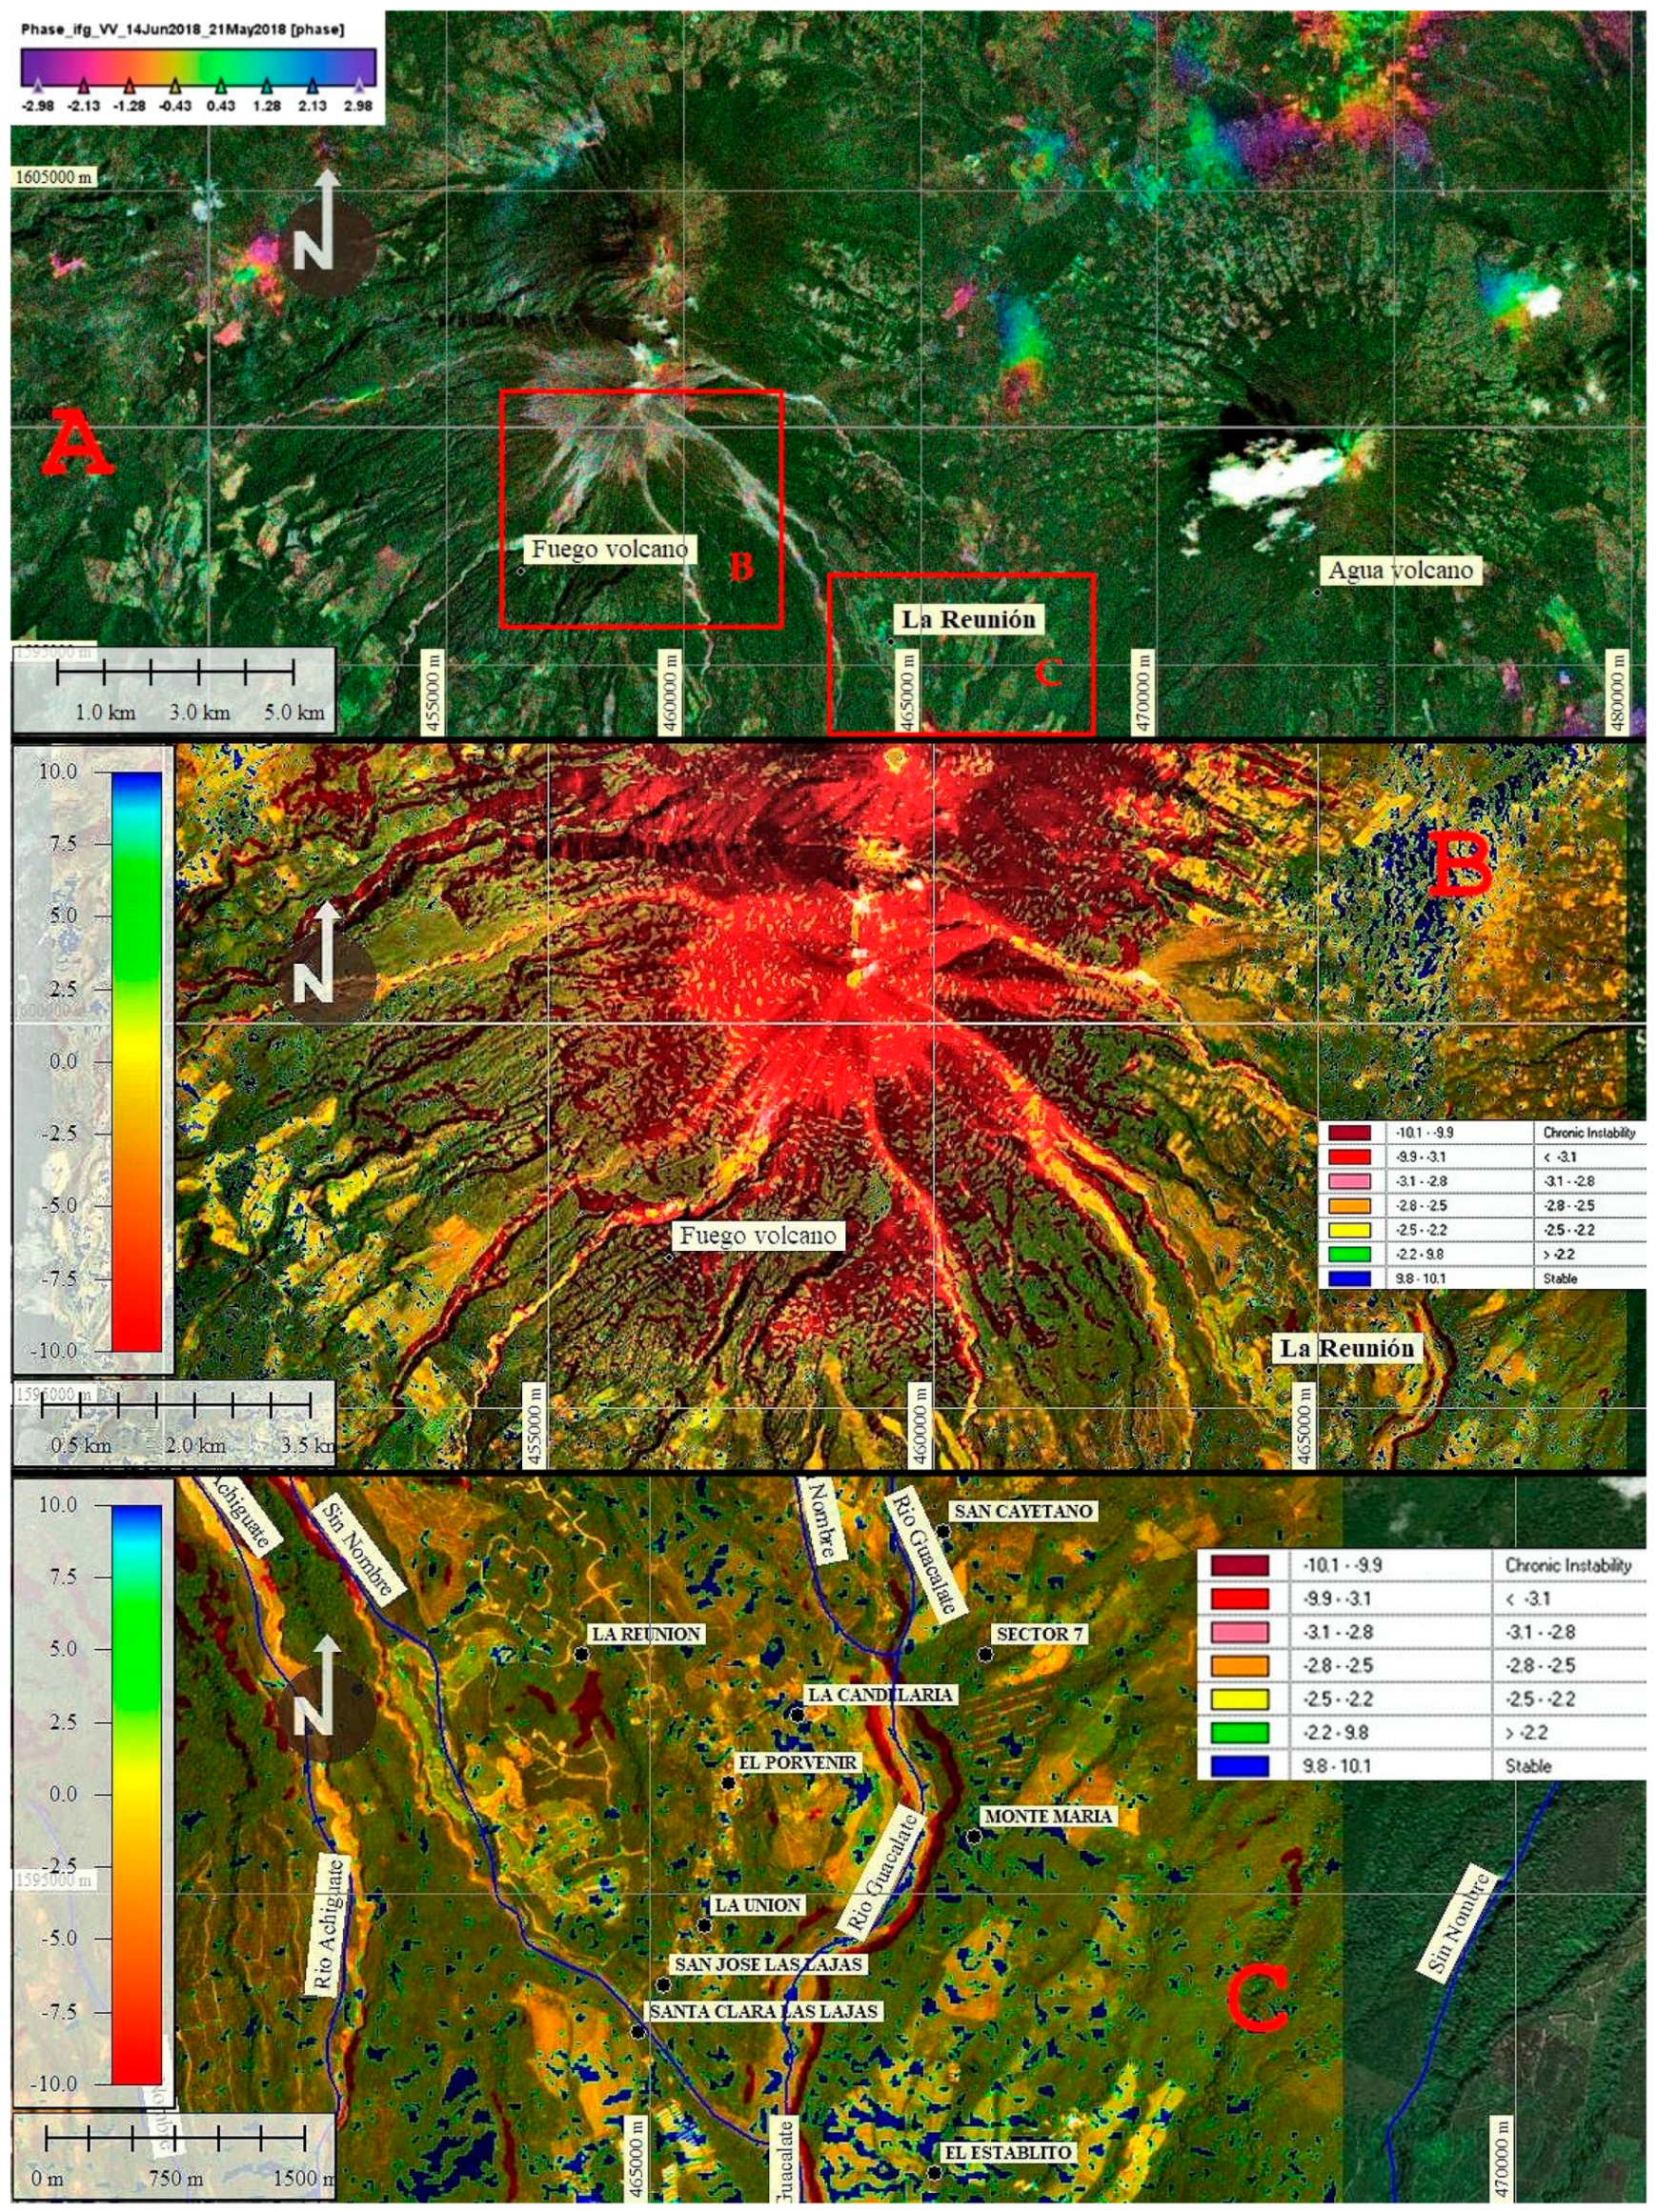
The differential synthetic aperture radar interferometry (DINSAR) analysis, based on the Sentinel 1 images, showed the lack of magmatic deformation before the eruption, but there were surface subsidences on the associated slopes due to the passage and deposits of lahars (Figure 12). This lack of magmatic deformation corroborates the studies undertaken by several researchers in the volcanoes of the area [20,21,22], which attribute the absence of deformation to differences in the storage of magma in relation to other continental arcs. The absence of magmatic deformation before the lahars can mean that the intrusion of magma is not the trigger of the lahars. Most likely, the rain is the cause.
The analysis of stability on the slopes of the volcano with SHALSTAB determined that the zones near the volcano were the most unstable with a qualification of quasi stable to chronic instability through the erosion of the channels where the lahars had flowed and where there had been greater destruction as is the case of El Rodeo, San Miguel, Monte María, and sectors near the Guacalate River (Figure 12B,C).
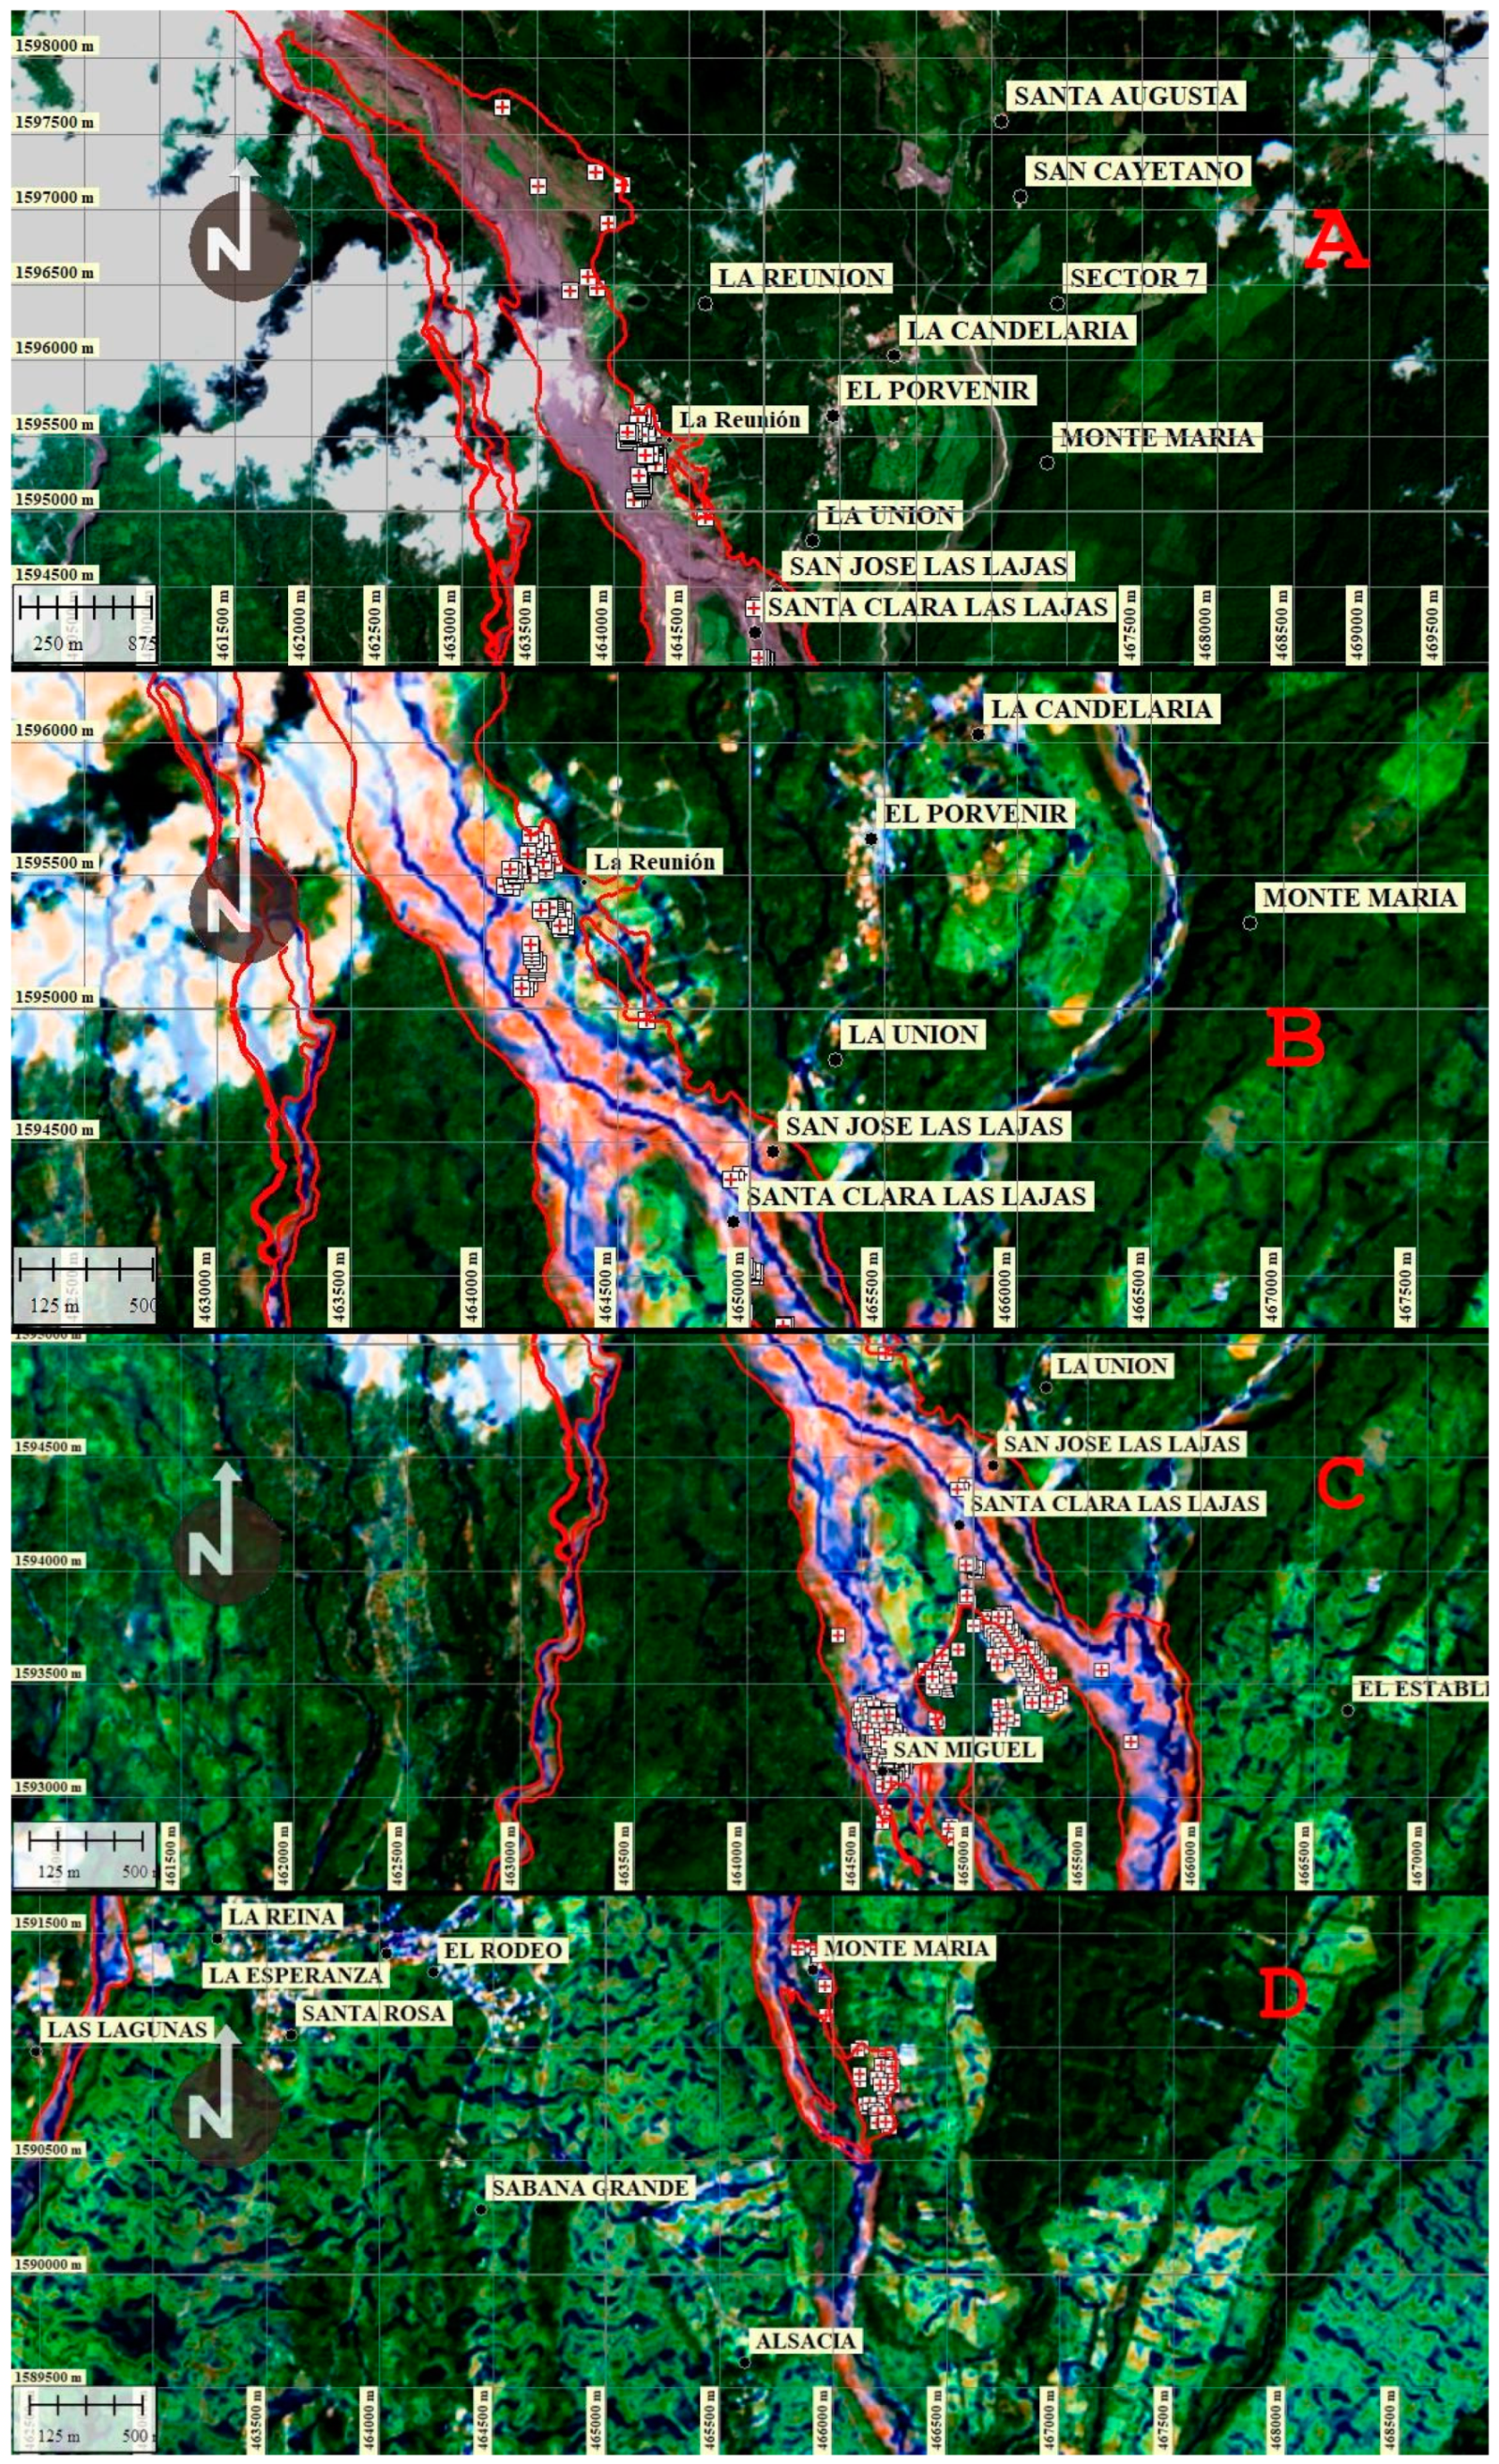
The current locations of the lahars produced by the eruption of 3 June 2018 and later were delimited with the Sentinel 2 images and their destructive power was verified with field data mainly from La Réunion, San José Las Lajas, Santa Clara Las Lajas, San Miguel, and El Rodeo, amongst other towns (Figure 12C). Figure 13A shows the sectors before the eruption. The implementation of lead-colored lahars on that date. In line of red color, the limits of the model of lahars obtained with LAHAR Z. In blue are the ravines and canals where the primary and secondary lahars flowed that flooded the sectors, and in green-yellow-ocher color the areas of ridges and crests. The field control points of the destroyed sites are represented by red crosses. In (B) Sectors close to La Réunion, in (C) sectors near San Miguel and in (D) close to Monte María.
From the analysis of the morphometric parameters LS, TWI, and FlowAcc, the areas with greater susceptibility to erosion were obtained as well as those with the highest concentration and accumulation of superficial flow of rainwater that were directly related to the primary and secondary lahars (Figure 14). These areas of blue color were observed to have been directed by the lahars that destroyed the populated areas. These three morphometric indices [23,24,25,26] are valid parameters to determine the flow paths of primary and secondary lahars. The areas with high values of these indices are areas of moisture concentration in the slopes, flow paths and concentration of sediments that can move from the high parts by intense rains and gravity generating secondary lahars, generally on the slopes.
The field control was carried out by technicians of CONRED.
4. Discussion
Unlike the LAHARZ model, the presented model uses morphometry as a value that changes the trajectory of the primary and secondary lahars, which allowed us to obtain the real flow paths of these phenomena and their effects. A beneficial coincidence of the application of both models is that they kept a central axis path of the main lahars, due to the fact that they were drains or main rivers. However, LAHARZ does not separate secondary lahars, due to this action; the morphological method can determine the flow paths of the mentioned phenomenon.
The lahar danger map, created for the Fuego volcano, based on the LAHARZ program, published in 2018 by CONRED, established high hazards zones (marked in red color) that can be affected by lahar flow paths. Torrential rains have generated secondary lahars that have affected the surrounding areas of the volcano, even those ones of low hazard. The medium hazard zones were affected by lahar flow paths from the La Reunión site to the Alsacia site, as can be evidenced in Figure 13.
In the current paper, with the proposed methodology, a study of the lahars flow paths has been carried out, being the main study areas the valleys of these Barranca Seca, Ceniza, Guacalate, Playa Trinidad, Las Cañas, El Jute and Las Lajas rivers. Lahars originated due to the erosion of the cause ways of detritus-ash-water deposited during the volcanic eruption and torrential rains. The axis of the primary lahar paths studied with the proposed methodology are like the ones obtained to delimit the high hazards zones in the mentioned hazard map.
On the other side, is has been proved that the modeled secondary lahar deposits with the proposed methodology destroyed civilian structures in La Reunión, San José de Las Lajas, Santa Clara de Las Lajas, San Miguel and other areas had location limits in accordance with the data obtained with LAHARZ and the location obtained with Sentinel 2A images, but with an added element that was not obtained with LAHARZ which is the outline of the secondary lahars flow paths, some as contributors to primary lahars and others as independent elements with no connection to the main ones.
The range of the secondary lahars and its respective modeled central axis is similar and bigger to the June and November lahars of 2018, observed in the Sentinel images. This is probably due to the resolution of the digital elevation model and the data given by the analyzed morphometric index.
Finally, a comparison of the affected areas has been carried out and its reach on transit zones, obtained with the proposed methodology and LAHARZ, observing that the entire area affected by lahars is within the high danger zone. The lahars corresponding to the Las Lajas y Guacalate rivers, take the biggest amount of area of the affected areas, with most of the civilian infrastructure destroyed as a result, turning the mentioned areas to maximum danger zones.
The surface terrain deformations, obtained from Sentinel 1B, located in the high mass erosion and removal areas can be part of secondary lahars which were generated from high ground. This is a contribution when the DINSAR analysis is used.
In addition to this work, further research studies can improve the location of the lahars flow paths using the deformed areas of the relief obtained with the DINSAR analysis, the stability criterion of slopes and analysis of morphometric parameters in digital models of high elevation spatial resolution obtained from Lidar images and integrating them into specialized programs in lahars and floods analysis such as LAHAR Z, Titan 2D, Ash3D, Flo-2D, IRIC, Iber, among others. The final objective of these investigations is to put in the hands of government authorities and the community, vulnerability maps to this type of threats to reduce them.
5. Conclusions
As a contribution of the application of this methodology, based on a flow modeler such as LAHAR Z or another program, to know the Flow Paths of the primary and secondary lahars that have caused the destruction in the vicinity of the volcano, this methodology deepened the study of these trajectories based on the analysis of the morphometric parameters, which allowed us to have a better knowledge of the possible paths before a new volcanic eruption. This methodology is currently being applied in the Fuego volcano by INSIVUMEH technicians with the objective of putting it in the hands of the government authorities, as well as the institutions linked to the subject, which allows these conditions to be ascertained in advance thereby implementing structural measures and non-structural measures to reduce this danger.
To complement the results obtained with the DINSAR analysis and the morphological method, in this study, the spatial distribution of the sources and potential routes of primary and secondary lahars during the eruptions and torrential rains that can erode and produce mass movements in areas of critical instability was obtained from the stability model of shallow landslide slopes with SHALSTAB.
The integration of the DINSAR methodologies to determine the surface deformations of the ground, where the SHALSTAB model determines the stability-erosion of the slopes of the volcano, and the morphometric method to analyze the primary and secondary lahar currents, is a procedure that can help to prevent the destructive effects that they cause during these events as demonstrated in the same destroyed localities that were not mapped in the maps of existing hazards by CONRED.
The field observations carried out by CONRED technicians and sent in the format of points in shp format, helped to calibrate and verify the results obtained from the presented methodology, as well as in understanding which of the three morphological parameters used had greater weight according to the scenario in the one that developed the lahars. This parameter corresponds to the TWI, the same one that determined that the lower areas of the streams are the ones that get wet and fill quickly overflowing and flooding nearby areas.
The morphological model could obtain the primary and secondary lahar paths in all sectors near the volcano in a very short time, unlike the numerical models such as the LAHAR Z, which are applied in a single axis of a current or drainage. In this case, the paths of the lahars obtained are sufficient to produce maps of the vulnerability reduction of civil structures and socio-economic systems including the preservation of human lives.
This combination of procedures can be applied in any volcanic landscape based on digital models of high-resolution elevation, obtaining very good agreement with the paths of the real flows.
Author Contributions
The research work presented in this paper is a collaborative development by both authors. Conceptualization, M.C. and A.M.; Methodology, M.C. and A.M.; Software, M.C.; Validation, M.C. and A.M.; Formal Analysis, M.C.; Investigation, M.C. and A.M.; Resources, M.C.; Data Curation, M.C.; Writing-Original Draft Preparation, M.C. and A.M.; Writing-Review and Editing, A.M.; Visualization, Supervision: A.M.; Project Administration, A.M.; Funding Acquisition, A.M.
Funding
This research received no external funding.
Acknowledgments
This research was funded by projects Junta Castilla y León SA044G18 and projects from the Ministry of Economy and Competitiveness CGL2015-67169-P and CGL2015-69919-R.
Conflicts of Interest
The authors declare no conflict of interest.
References
- Almeida, S.; Daniel, S.; Daniel, A. Definition, Primary and Secondary Lahars, Flow Types, Behavior, afectation And Hazard Monitoring. Geophysical Institute National Polytechnic School, 2017. Available online: https://www.igepn.edu.ec/publicaciones-para-la-comunidad/comunidad-eng/19268-triptych-lahars-mud-flows/file (accessed on 21 February 2019).
- National Coordinator for Disaster Reduction CONRED. Situation Report No. 1 (as of 04 June 2018). Internal Report. Available online: https://reliefweb.int/sites/reliefweb.int/files/resources/2018-06-04%20GT%20SITREP%20-%20Volcanic%20Activity%20%28ENG%29.pdf (accessed on 21 February 2019).
- Department of Vulcanology, INSIVUMEH. Preliminary Map of Hazard Scenarios by Pyroclastic Flows, after the Eruption of June 3, 2018. Available online: http://www.insivumeh.gob.gt/?page_id=70 (accessed on 21 February 2019).
- National Coordinator for Disaster Reduction CONRED. Informative Bulletin No. 3162018—The Drop of Lahares Is Monitored on The Fuego Volcano. 2018. Available online: https://conred.gob.gt/site/Boletin-Informativo-3162018 and https://conred.gob.gt/www/index.php?option=com_content&view=article&id=7076&catid=37&Itemid=1010 (accessed on 21 February 2019).
- León, X. Vulnerability Assessment Associated with the Hazard of the Fuego Volcano. Internal Study. Universidad de San Carlos de Guatemala, 2012. Available online: http://biblioteca.usac.edu.gt/tesis/02/02_3433.pdf (accessed on 24 February 2019).
- Schilling, S.P. TI-LAHARZ: GIS Programs for Automated Mapping of Lahar-Inundation Hazard Zones. USGS Publications Warehouse, 1998. Available online: http://pubs.er.usgs.gov/publication/ofr98638 (accessed on 25 February 2019). [CrossRef]
- Dietrich, W.E.; Bellugi, D.; Real de Asua, R. Validation of the Shallow Landslide Model, SHALSTAB, for forest management. Land Use and Watersheds: Human Influence on Hydrology and Geomorphology in Urban and Forest Areas. Water Sci. Appl. 2001, 2, 195–227. Available online: https://www.researchgate.net/publication/284902139_Validation_of_the_Shallow_Landslide_Model_SHALSTAB_for_forest_management (accessed on 25 February 2019). [CrossRef]
- Montoya, S. Tutorial to Download Sentinel 2 Images (10 m Resolution) and Process Them in QGIS. GIDAHATARI, 2017. Available online: http://gidahatari.com/ih-es/tutorial-para-descargar-imgenes-sentinel-2-resolucin-10-m-y-procesarlas-en-qgis (accessed on 25 February 2019).
- Zeni, G.; Pepe, A.; Zhao, Q.; Bonano, M.; Gao, W.; Li, X.; Ding, X. A differential SAR interferometry (DInSAR) investigation of the deformation affecting the coastal reclaimed areas of the Shangai megacity. In Proceedings of the International Geoscience and Remote Sensing Symposium (IGARSS), Quebec City, QC, Canada, 13–18 July 2014; pp. 482–485. [Google Scholar] [CrossRef]
- The Copernicus Open Access Hub. The Open Access Hub Provides Complete, Free and Open Access to Sentinel-1, Sentinel-2, Sentinel-3 and Sentinel-5P User Products. Available online: https://scihub.copernicus.eu/userguide/ (accessed on 21 February 2019).
- Foumelis, M.; Delgado Blasco, J.M.; Desnos, Y.-L.; Engdahl, M.; Fernández, D.; Veci, L.; Lu, J.; Wong, C. ESA SNAP—StaMPS Integrated processing for Sentinel-1 Persistent Scatterer Interferometry. 2018. Available online: https://www.researchgate.net/publication/327253039_ESA_SNAP_-_StaMPS_Integrated_processing_for_Sentinel-1_Persistent_Scatterer_Interferometry (accessed on 23 February 2019).
- Martins, T.; Vieira, B.; Fernandes, N.; Oka-Fiori, C.; Montgomery, D.R. Application of the SHALSTAB model for the identification of areas susceptible to landslides: Brazilian case studies. Revista de Geomorfologie 2017, 19, 136–144. [Google Scholar]
- Panagos, P.; Borrelli, P.; Meusburger, K. A New European Slope Length and Steepness Factor (LS-Factor) for Modeling Soil Erosion by Water. Geosciences 2015, 5, 117–126. [Google Scholar] [CrossRef] [Green Version]
- Zimmermann, M.; Mani, P.; Romang, H. Magnitude-frequency aspects of alpine debris flows. Eclogae Geol. Helv. 1997, 90, 415–420. Available online: https://www.e-periodica.ch/cntmng?pid=egh-001:1997:90::738 (accessed on 21 February 2019).
- Carmona-Álvarez, J.E.; Ruge-Cárdenas, J.C. Análisis de las correlaciones existentes del ángulo de fricción efectivo para suelos del piedemonte oriental de Bogotá usando ensayos in situ. Tecno Lógicas 2015, 18, 93–104. Available online: http://www.scielo.org.co/pdf/teclo/v18n35/v18n35a09.pdf (accessed on 23 February 2019). [CrossRef]
- Dietrich, W.E.; Montgomery, D.R. A Digital Terrain Model for Mapping Shallow Landslide Potential. University of California-University of Washington, 1998. Published as a Technical Report by NCASI. Available online: http://calm.geo.berkeley.edu/geomorph/shalstab/index.htm (accessed on 23 February 2019).
- O’Loughlin, E.M. Prediction of surface saturation zones in natural catchments by topographic analysis. Water Resour. Res. 1986, 22, 794–804. Available online: https://www.scirp.org/(S(i43dyn45teexjx455qlt3d2q))/reference/ReferencesPapers.aspx?ReferenceID=729751 (accessed on 21 February 2019). [CrossRef]
- Sebastiano, T.; Cavalli, M. Topography-based flow-directional roughness: potential and challenges. Earth Surf. Dyn. 2016, 4, 343–358. Available online: https://www.earth-surf-dynam.net/4/343/2016/esurf-4-343-2016.pdf (accessed on 26 February 2019).[Green Version]
- Beven, K.J.; Kirkby, M.J. A physically based variable contributing area model of basin hydrology. Hydrol. Sci. Bull. 1979, 24, 43–69. Available online: https://0-www-tandfonline-com.brum.beds.ac.uk/doi/abs/10.1080/02626667909491834 (accessed on 26 February 2019). [CrossRef]
- Cando, M.; Martínez-Graña, A. Numerical modeling of flow patterns applied to the analysis of the susceptibility to movements of the ground. Geosciences 2018, 8, 340. Available online: https://0-www-mdpi-com.brum.beds.ac.uk/2076-3263/8/9/340 (accessed on 26 February 2019). [CrossRef]
- Hojati, M.; Mokarram, M. Determination of a Topographic Wetness Index using high resolution Digital Elevation Models. Eur. J. Geogr. 2016, 7, 41–52. Available online: http://www.eurogeographyjournal.eu/articles/4.%20DETERMINATION%20OF%20A%20TOPOGRAPHIC%20WETNESS%20INDEX%20USING%20HIGH%20RESOLUTION%20DIGITAL%20ELEVATION%20MODELS.pdf (accessed on 25 February 2019).
- Ebmeier, S.; Biggs, J.; Mather, T.; Amelung, F. Applicability of InSAR to tropical volcanoes: Insights from Central America. Geol. Soc. Lond. Spec. Publ. 2013, 380, 15–37. Available online: https://www.researchgate.net/publication/259130455_Applicability_of_InSAR_to_tropical_volcanoes_Insights_from_Central_America (accessed on 21 February 2019). [CrossRef]
- Baumann, V.; Bonadonna, C.; Cuomo, S.; Moscariello, M.; Manzella, I. Slope stability models for rainfall-induced lahars during long-lasting eruptions. J. Volcanol. Geotherm. Res. 2018. Available online: https://www.researchgate.net/publication/326139979_Slope_stability_models_for_rainfall-induced_lahars_during_long-lasting_eruptions (accessed on 25 February 2019). [CrossRef]
- Vidal Montes, R.; Martínez-Graña, A.M.; Martínez Catalán, J.R.; Ayarza, P.; Sánchez San Román, F.J. Vulnerability to groundwater contamination, SW Salamanca, Spain. J. Maps 2016, 12, 147–155. [Google Scholar] [CrossRef]
- Martínez-Graña, A.M.; Goy, J.L.; Zazo, C. Geomorphological applications for susceptibility mapping of landslides in natural parks. Environ. Eng. Manag. J. 2016, 15, 1–12. [Google Scholar] [CrossRef]
- Santos-Francés, F.; Martínez-Graña, A.; Rojo, P.A.; Sánchez, A.G. Geochemical background and baseline values determination and spatial distribution of heavy metal pollution in soils of the Andes mountain range (Cajamarca-Huancavelica, Peru). Int. J. Environ. Res. Public Health 2017, 14, 859. [Google Scholar] [CrossRef] [PubMed]
Figure 1.
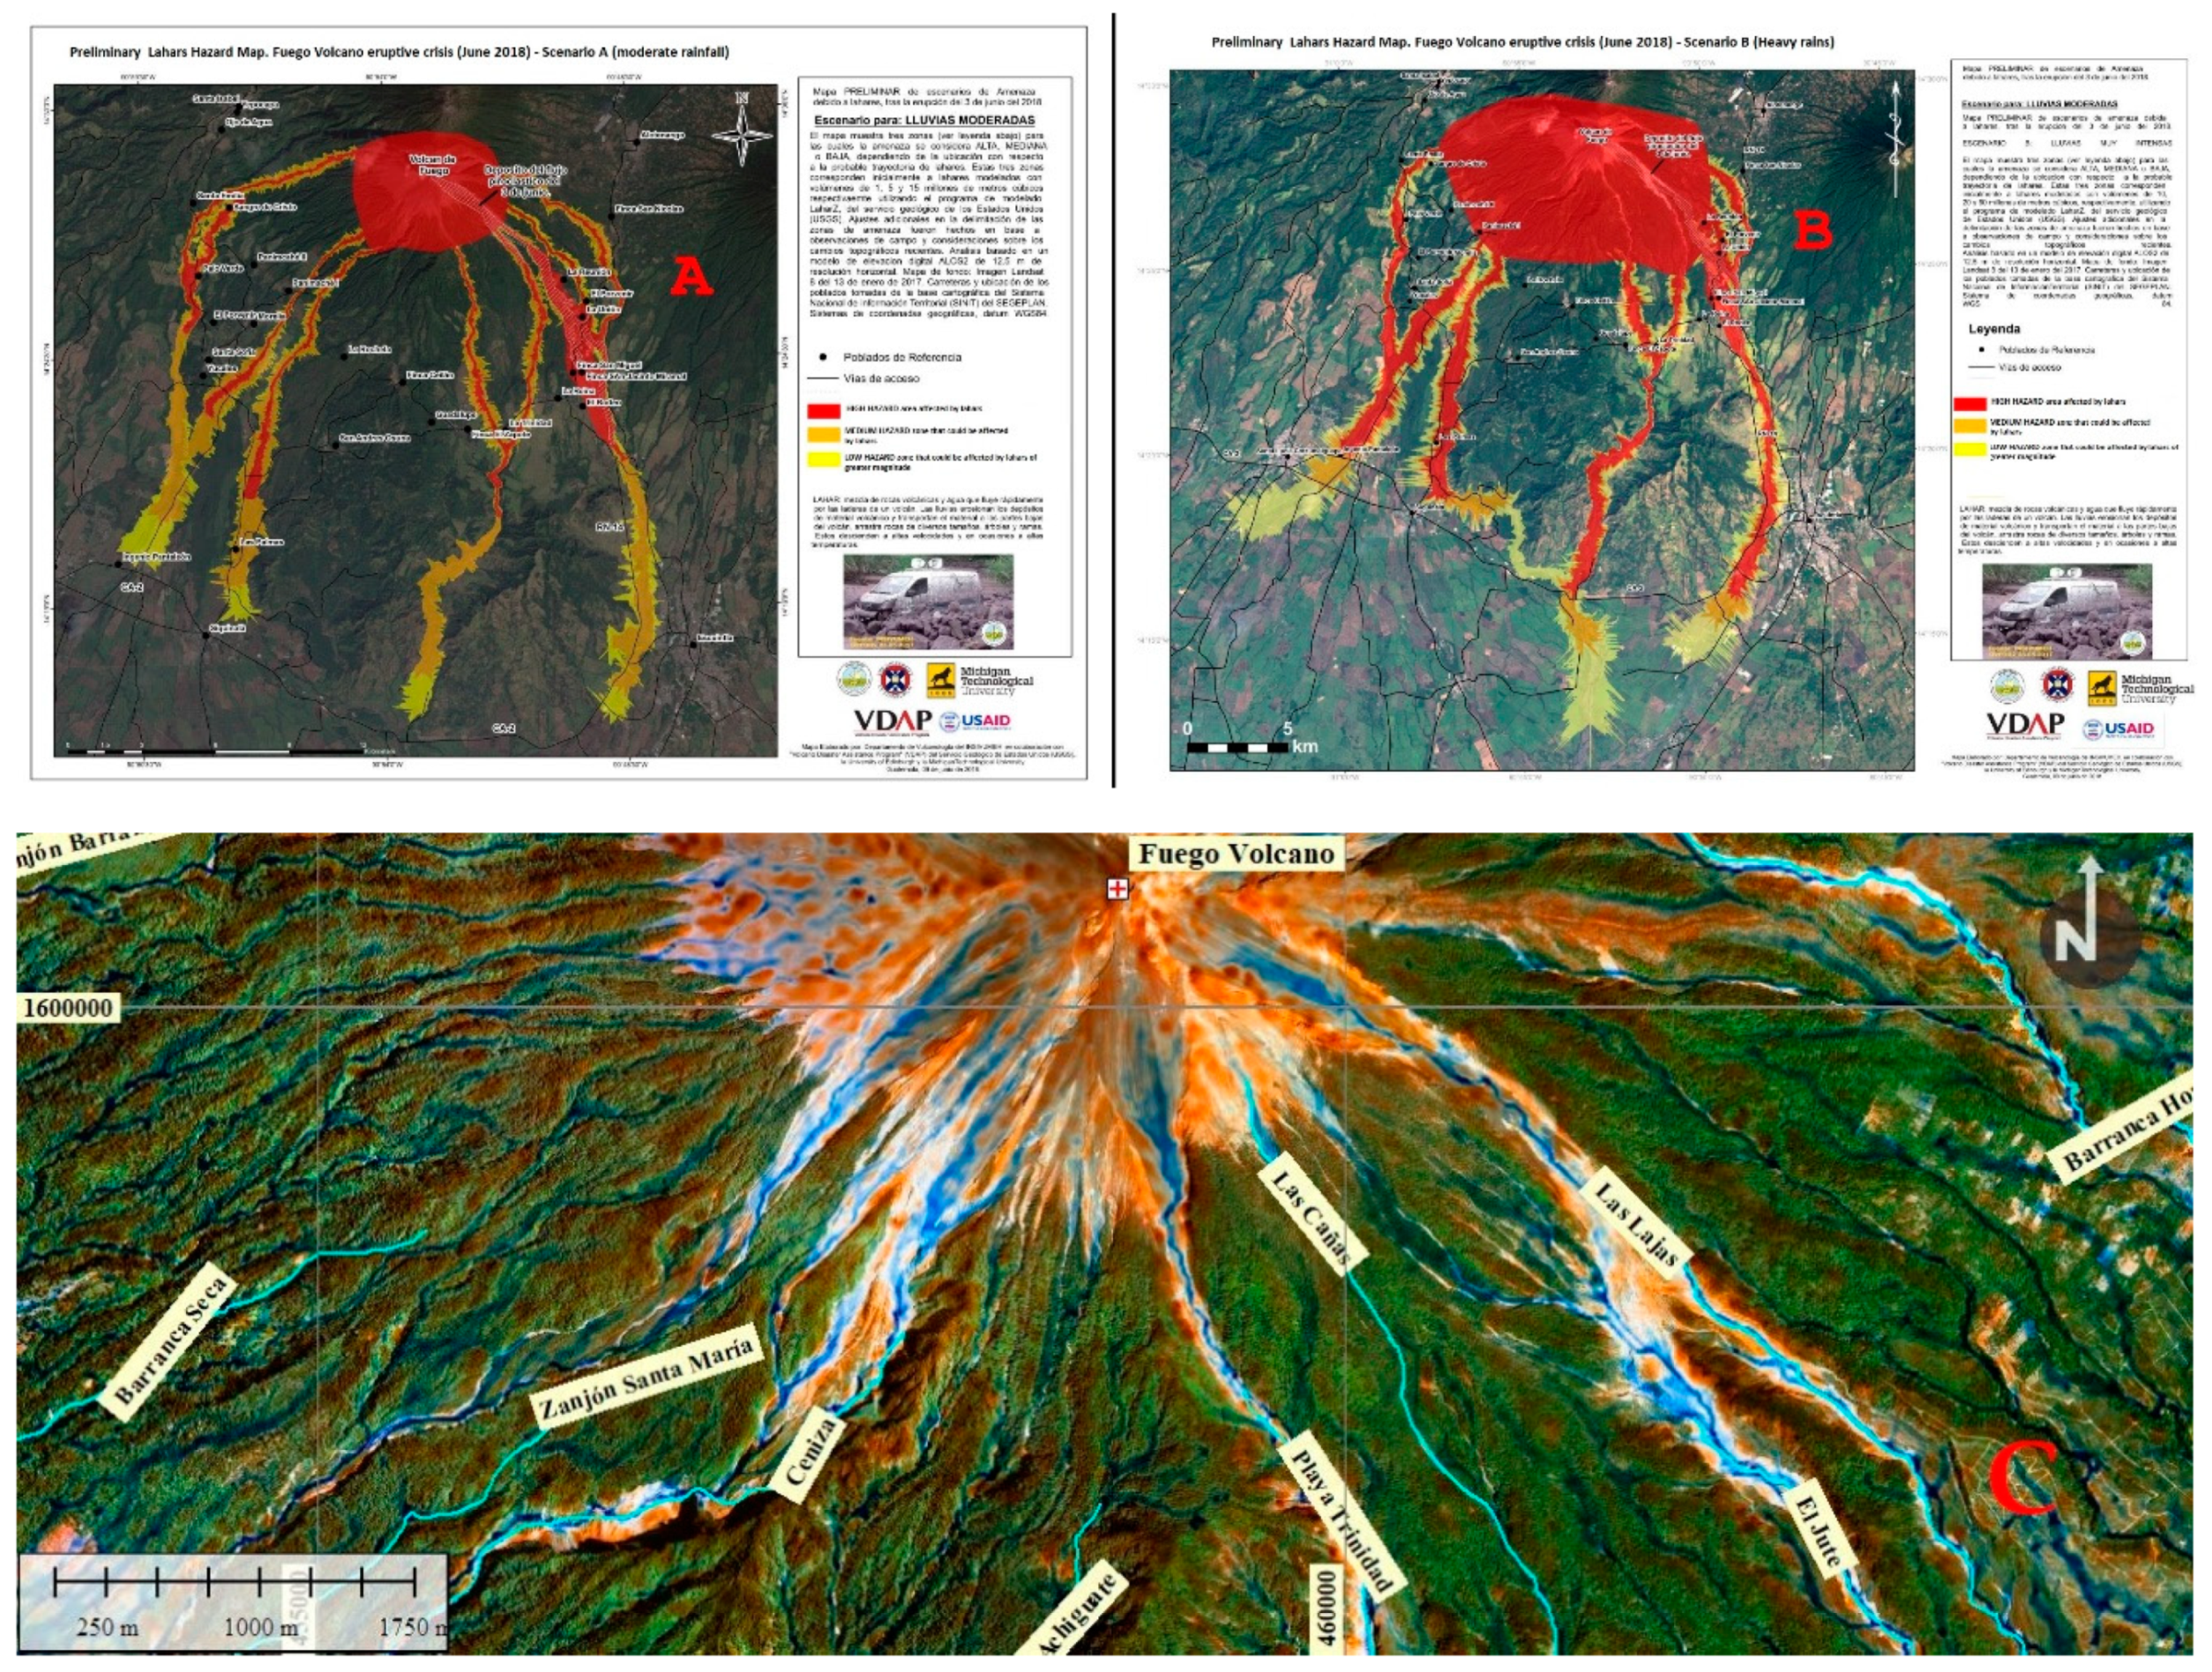
Web Map prepared by MapAction as a collaborator on the HazMap project and in support of National Institute of Seismology, Volcanology, Meteorology and Hydrology (INSIVUMEH). Data from preliminary maps of the hazard of pyroclastic flows and lahars for scenario A (moderate rainfall) and scenario B (very heavy rainfall). Prepared in June 2018 by INSIVUMEH, Volcano Disaster Assistance Program (VDAP), United States Geological Survey (USGS), the University of Edinburgh, and Michigan Technological University. In C, location of Las Lajas, El Jute, Ceniza and Seca ravines.
Figure 1.
Web Map prepared by MapAction as a collaborator on the HazMap project and in support of National Institute of Seismology, Volcanology, Meteorology and Hydrology (INSIVUMEH). Data from preliminary maps of the hazard of pyroclastic flows and lahars for scenario A (moderate rainfall) and scenario B (very heavy rainfall). Prepared in June 2018 by INSIVUMEH, Volcano Disaster Assistance Program (VDAP), United States Geological Survey (USGS), the University of Edinburgh, and Michigan Technological University. In C, location of Las Lajas, El Jute, Ceniza and Seca ravines.

Figure 2.
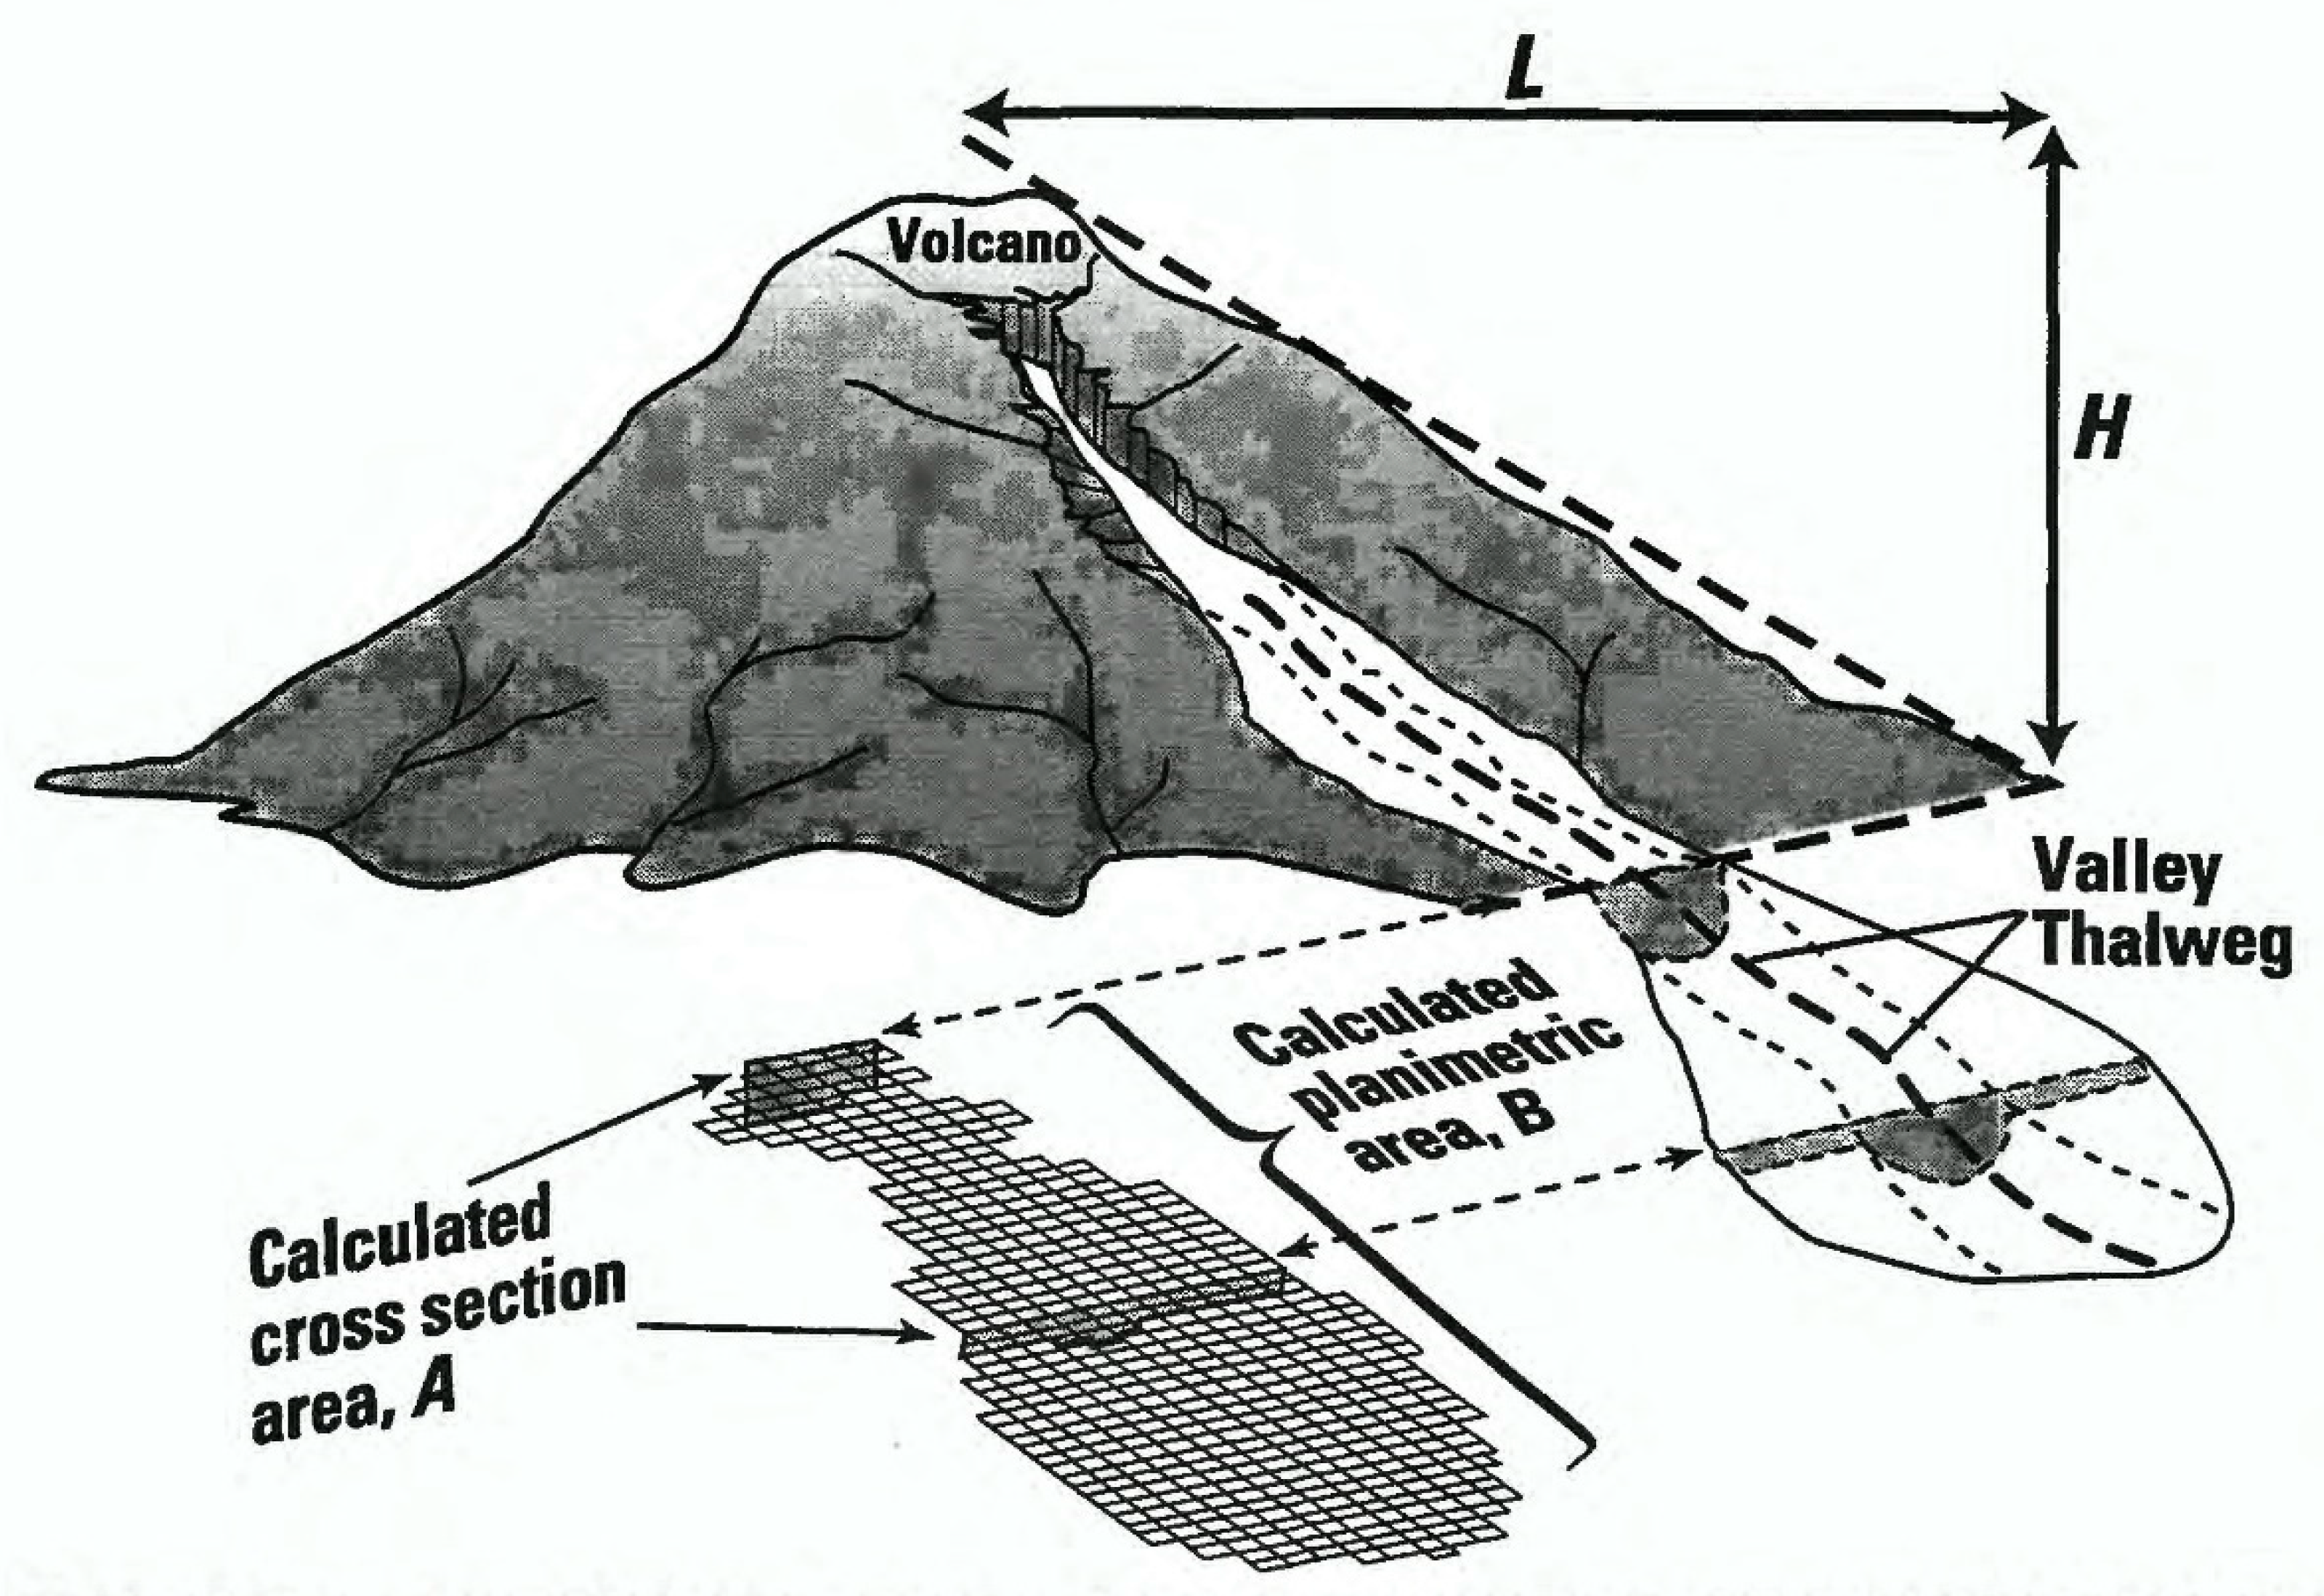
Diagram of association between dimensions of an idealized lahar and cross-sectional (A) and planimetric (B) areas calculated by LAHAR Z for a hypothetical volcano. The ratio of vertical drop (H) to horizontal runout distance (L) describes the extent of proximal volcano hazard. LAHAR Z begins calculations of lahar-inundation hazard zones where a user-specified stream and the proximal-hazard zone boundary intersect [6].
Figure 2.
Diagram of association between dimensions of an idealized lahar and cross-sectional (A) and planimetric (B) areas calculated by LAHAR Z for a hypothetical volcano. The ratio of vertical drop (H) to horizontal runout distance (L) describes the extent of proximal volcano hazard. LAHAR Z begins calculations of lahar-inundation hazard zones where a user-specified stream and the proximal-hazard zone boundary intersect [6].

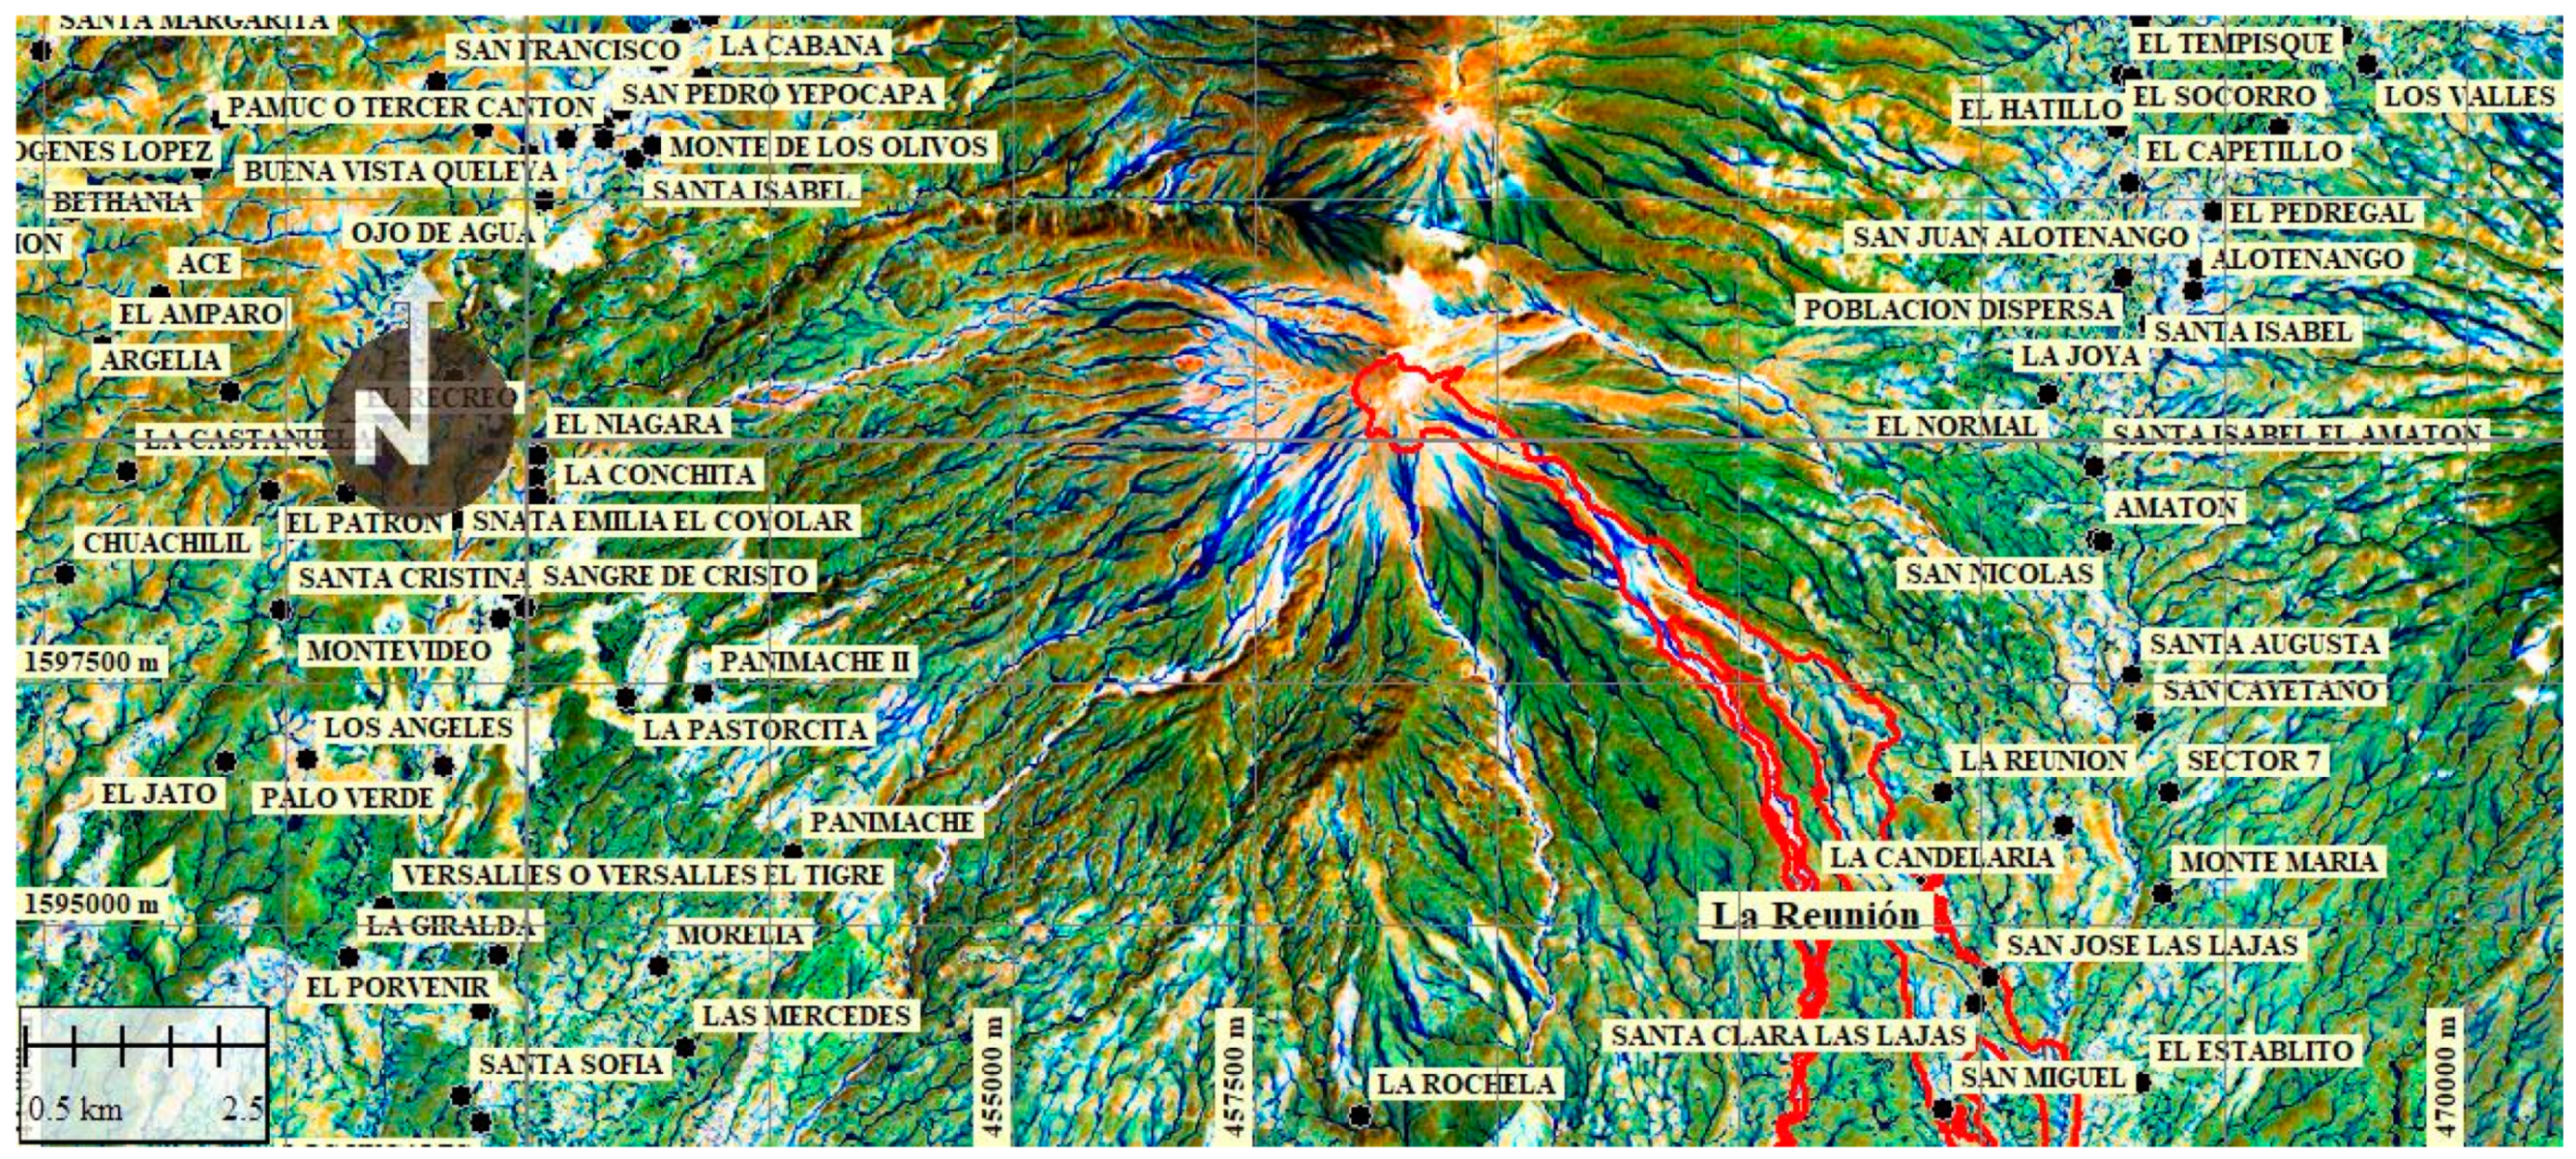
Figure 3.
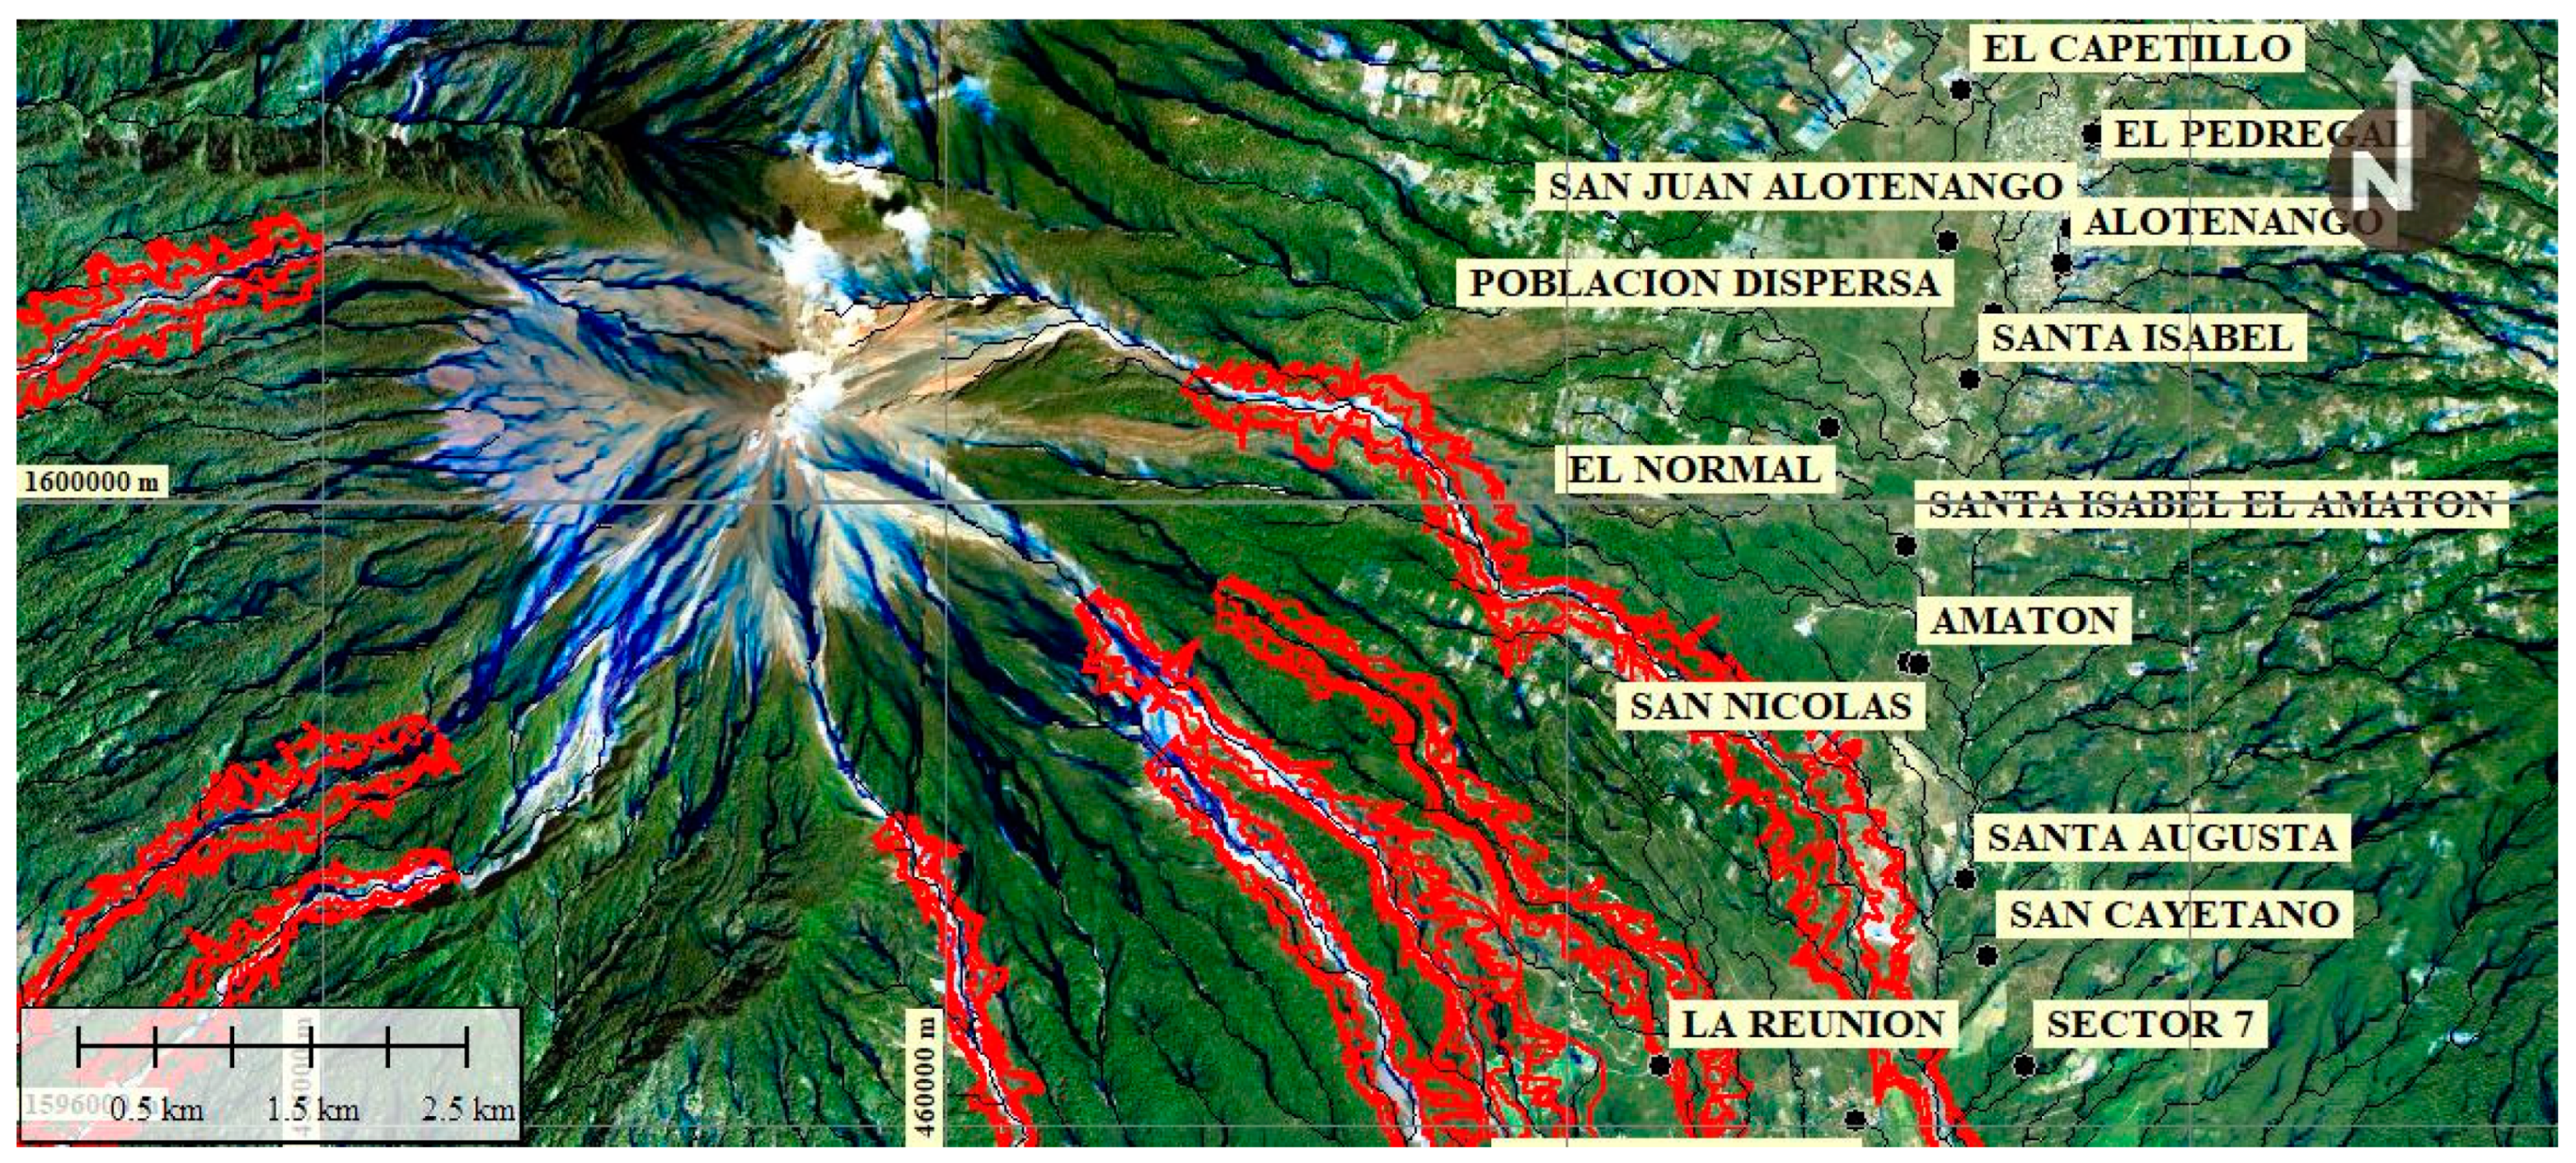
LAHAR Z Model (red lines) and the poor tracing of possible secondary lahars and analysis of their distal trajectories originating from proximal sources. The morphometric model combines parameters such as the flow accumulation (FCC), the topographical humidity index (TWI), and slope-length factor of the slope to more accurately determine the trajectories of the destructive lahars.
Figure 3.
LAHAR Z Model (red lines) and the poor tracing of possible secondary lahars and analysis of their distal trajectories originating from proximal sources. The morphometric model combines parameters such as the flow accumulation (FCC), the topographical humidity index (TWI), and slope-length factor of the slope to more accurately determine the trajectories of the destructive lahars.

Figure 4.
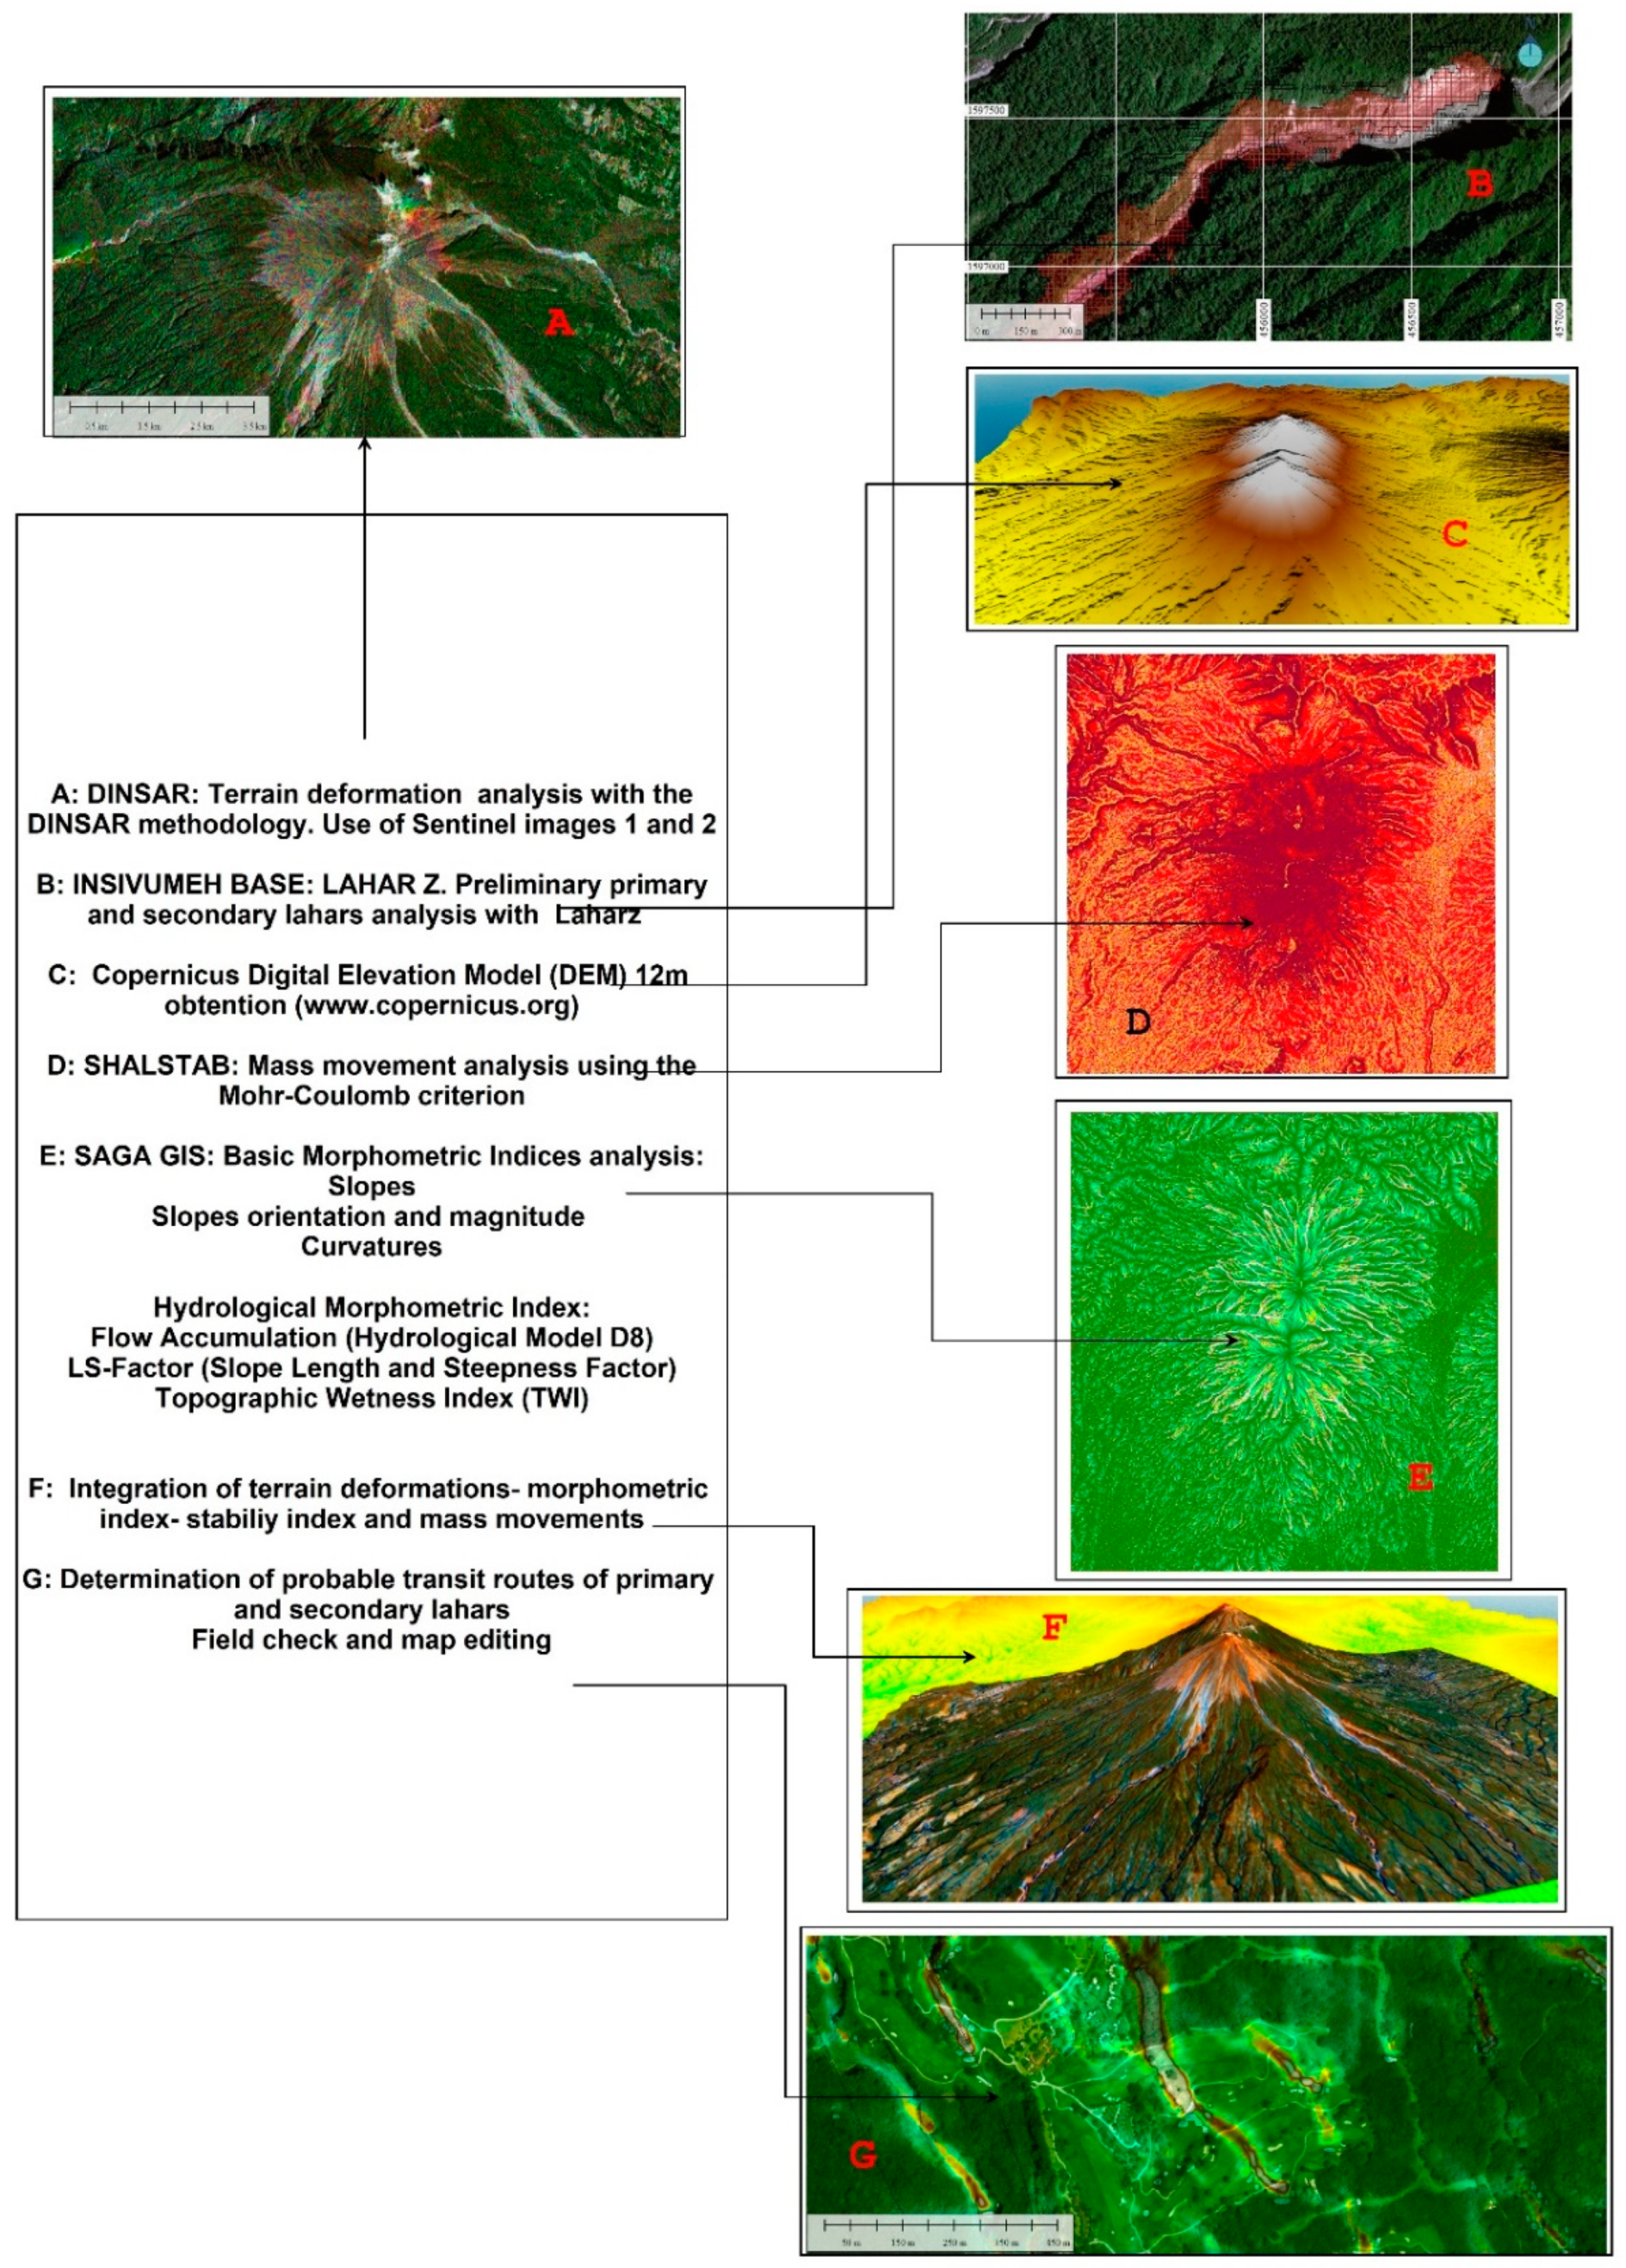
Flow methodological diagram for the determination of primary and secondary lahars flow paths from the following processes: (A) Analysis of terrain deformation with differential synthetic aperture radar interferometry DINSAR, (B) Use of base information of lahars routes obtained from LAHAR Z -National Institute of Seismology, Volcanology, Meteorology and Hydrology—INSIVUMEHIN. (C) Obtaining the digital elevation model of 12m of spatial resolution of Copernicus.org, (D) Analysis of Instability of the Relief with Shallow Landslide Susceptibility software (SHALSTAB), (E) Determination of Morphometric Indexes of the Relief with System for Automated Geoscientific Analyzes (SAGA), (F) Integration of information and determination of possible flow paths of primary and secondary lahars (G).
Figure 4.
Flow methodological diagram for the determination of primary and secondary lahars flow paths from the following processes: (A) Analysis of terrain deformation with differential synthetic aperture radar interferometry DINSAR, (B) Use of base information of lahars routes obtained from LAHAR Z -National Institute of Seismology, Volcanology, Meteorology and Hydrology—INSIVUMEHIN. (C) Obtaining the digital elevation model of 12m of spatial resolution of Copernicus.org, (D) Analysis of Instability of the Relief with Shallow Landslide Susceptibility software (SHALSTAB), (E) Determination of Morphometric Indexes of the Relief with System for Automated Geoscientific Analyzes (SAGA), (F) Integration of information and determination of possible flow paths of primary and secondary lahars (G).

Figure 5.
(A) The Sentinel Application Platform (SNAP) process used to obtain the deformations of the relief by DINSAR analysis. Steps (B–F). Sentinel Application Platform (SNAP) passages of each portion of the routine. See text for further explanation.
Figure 5.
(A) The Sentinel Application Platform (SNAP) process used to obtain the deformations of the relief by DINSAR analysis. Steps (B–F). Sentinel Application Platform (SNAP) passages of each portion of the routine. See text for further explanation.

Figure 6.
Process flow in SNAP. Spatial location of primary and secondary lahars from a Sentinel image 2. Combination of bands 4, 3 and 2. (A–C) SNAP passages of each portion of the routine in Sentinel 2A images. Location of primary and secondary lahars, (D) Synthesis of final product: limit of the model of lahar in red color obtained from LAHAR Z. In lead color the location to that date of the real lahar product of the eruption of June 3 and nearby places.

Figure 7.
(A) The one-dimensional approximation used in the SHALSTAB slope stability model in which the failure plane, water table, and ground surface are assumed parallel. The slope is , the height of the water table is h, and the thickness of the colluvium that slides above the failure plane is z. Typically, the failure plane is at the colluvium-weathered bedrock or saprolite boundary. (B) Definition of stability fields. For this example, the angle of internal friction is 45 degrees, and the bulk density ratio is 1.6 [13].

Figure 8.
Sketch of hydrological model: (A) plan view and (B) cross section of a draining area a across a contour of length b. (B) The grey volume is the shallow sub-surface flow TMb and the saturation overland flow udb (not calculated by the model). p: precipitation; e: evapotranspiration; r: deep drainage; q: effective rainfall (q = p − e − r); h: vertical depth of the saturated sub-surface flow; z: vertical depth of the failure plane; T: transmissivity; M: sinθ; θ: slope angle. Mettma Ridge study site [13].

Figure 9.
LS-factor (slope length and steepness factor) calculated in SAGA geographic information system (GIS). The low susceptibility to erosion is represented with green colors and the high with brown color.
Figure 9.
LS-factor (slope length and steepness factor) calculated in SAGA geographic information system (GIS). The low susceptibility to erosion is represented with green colors and the high with brown color.

Figure 10.
Topographic wetness index (TWI) calculated in SAGA GIS. Higher values of TWI (tendency to blue color) represent drainage depressions and lower values (tendency to red color) represent crests and ridges.
Figure 10.
Topographic wetness index (TWI) calculated in SAGA GIS. Higher values of TWI (tendency to blue color) represent drainage depressions and lower values (tendency to red color) represent crests and ridges.

Figure 11.
Cumulative flow calculated in SAGA GIS. The higher values (tendency to red color) represent greater accumulations of flow and areas of concentrated flow that can be used to identify watercourse channels.
Figure 11.
Cumulative flow calculated in SAGA GIS. The higher values (tendency to red color) represent greater accumulations of flow and areas of concentrated flow that can be used to identify watercourse channels.

Figure 12.
DINSAR analysis and SHALSTAB unstable and erosion areas. (A) Iridescent colors indicate the tendency of deformation in the region in cm. The positive values represent raised areas and the negative subsidence zones with minimal deformation in the volcano on the SE flank. (B) SHALSTAB results: the relief on the flanks of the volcano is very irregular with raised and sunken areas possibly due to the permanent morphological change resulting from the eruptions that have occurred. (C) Detail of the areas near the volcano that are the most unstable, with a rating of almost stable to chronic instability due to erosion of the channels that the lahars have flowed in, have overflowed and caused flooding with the destruction of the civil infrastructure mainly in El Rodeo, San Miguel, Monte María, and sectors near the Guacalate river. Negative red colors and trend towards –10 are unstable areas and stable positive zones with colors towards the blue and values with trend toward 10. The value is dimensionless.

Figure 13.
Sequence of images from the upper parts of the volcano of the areas destroyed by the lahars, erosion of channels and floods obtained from the combination of the response of the Sentinel 2A, morphometric index LS, TWI, FlowAcc(acronym of Flow Accumulation), and stabilized in the sectors the day of the eruption of Fuego volcano. (A) The implementation of lead colored lahars on that date. In line of red color, the limits of the model of lahars obtained with LAHAR Z. In blue the ravines and canals where the primary and secondary lahars flowed that flooded the sectors, and in green-yellow-ocher color the areas of ridges and crests. The field control points of the destroyed sites are represented by red crosses. In (B) Sectors close to La Reunion, in (C) sectors near San Miguel and in (D) close to Monte María.

Figure 14.
The flow paths, calculated by using the three morphometric indices TWI, LS, and FlowAcc in SAGA, determined the areas that were flooded by primary and secondary lahars.
Figure 14.
The flow paths, calculated by using the three morphometric indices TWI, LS, and FlowAcc in SAGA, determined the areas that were flooded by primary and secondary lahars.


Table 1.
Stability classes defined by SHALSTAB and modified from Montgomery and Dietrich [15].
Table 1.
Stability classes defined by SHALSTAB and modified from Montgomery and Dietrich [15].
| Classes SHALSTAB | Interpretation of Class |
|---|---|
| Chronic instability | Unconditionally unstable and unsaturated |
| Log q·T -1 < -3,1 | Unconditionally unstable and unsaturated |
| 3,1 < Log q·T -1 < -2,8 | Unstable and saturated |
| -2,8< Log q·T-1 < -2,5 | Unstable and unsaturated |
| -2,5< Log q·T-1 < -2,2 | Stable and unsaturated |
| Log q·T -1 > -2,2 | Unconditionally stable and unsaturated |
| Stable | Unconditionally stable and saturated |
© 2019 by the authors. Licensee MDPI, Basel, Switzerland. This article is an open access article distributed under the terms and conditions of the Creative Commons Attribution (CC BY) license (http://creativecommons.org/licenses/by/4.0/).
Share and Cite
MDPI and ACS Style
Cando-Jácome, M.; Martínez-Graña, A. Determination of Primary and Secondary Lahar Flow Paths of the Fuego Volcano (Guatemala) Using Morphometric Parameters. Remote Sens. 2019, 11, 727. https://0-doi-org.brum.beds.ac.uk/10.3390/rs11060727
AMA Style
Cando-Jácome M, Martínez-Graña A. Determination of Primary and Secondary Lahar Flow Paths of the Fuego Volcano (Guatemala) Using Morphometric Parameters. Remote Sensing. 2019; 11(6):727. https://0-doi-org.brum.beds.ac.uk/10.3390/rs11060727
Chicago/Turabian StyleCando-Jácome, Marcelo, and Antonio Martínez-Graña. 2019. "Determination of Primary and Secondary Lahar Flow Paths of the Fuego Volcano (Guatemala) Using Morphometric Parameters" Remote Sensing 11, no. 6: 727. https://0-doi-org.brum.beds.ac.uk/10.3390/rs11060727
Note that from the first issue of 2016, this journal uses article numbers instead of page numbers. See further details here.