Pre-launch Radiometric Characterization of JPSS-2 VIIRS Thermal Emissive Bands


1
Science Systems and Applications, Inc., Lanham, MD 20706, USA
2
The Aerospace Corporation, El Segundo, CA 90245, USA
3
NASA Goddard Space Flight Center, Greenbelt, MD 20771, USA
*
Author to whom correspondence should be addressed.
Remote Sens. 2019, 11(6), 732; https://0-doi-org.brum.beds.ac.uk/10.3390/rs11060732
Submission received: 5 February 2019
/
Revised: 11 March 2019
/
Accepted: 20 March 2019
/
Published: 26 March 2019
(This article belongs to the Collection Visible Infrared Imaging Radiometers and Applications)
Abstract
:The Joint Polar Satellite System 2 (JPSS-2) Visible Infrared Imaging Radiometer Suite (VIIRS) is the third in its series of sensors designed to produce high quality data products for environmental and climate data records once launched. To meet this goal, the VIIRS instrument must be calibrated and characterized prior to launch. A comprehensive test program was conducted at the Raytheon Space and Airborne Systems facility in 2016–2017, including extensive environmental testing. The pre-launch thermal band radiometric performance and stability is the focus of this work including: the evaluation of a number of sensor performance metrics, comparison to the design requirements, and the estimation of uncertainties. Comparisons of the thermal band performance to the earlier Suomi National Polar-orbiting Partnership (SNPP) and JPSS-1 VIIRS instruments as well as the design specifications have shown that JPSS-2 VIIRS exhibits similar performance to its predecessors. The differences of note (decreased blackbody uniformity, reduced dynamic range for bands M15 and M16, and improved performance with respect to striping) are small and not expected to have a significant impact on the science products.
1. Introduction
The Visible Infrared Imaging Radiometer Suite (VIIRS) is a key sensor on-board the National Oceanic and Atmospheric Administration’s (NOAA) Earth observing missions in low Earth orbit. The first two flight units have launched on-board the Suomi National Polar-orbiting Partnership (SNPP) satellite in late 2011 [1,2] and the Joint Polar Satellite System 1 (JPSS-1) mission in late 2017 [3]. The third in the series is scheduled to launch on the Joint Polar Satellite System 2 (JPSS-2) platform in 2022. VIIRS is a cross-track scanning radiometer capable of making continuous global observations twice daily and is based on the designs of the heritage sensors MODIS (Moderate Resolution Imaging Spectroradiometer) [4] and AVHRR (Advanced Very-High-Resolution Radiometer) [5]. This sensor supports a number of environmental data records covering land, ocean, and atmospheric science disciplines [6,7,8] by collecting data in 21 spectral bands and one pan-chromatic band covering a spectral range from 0.4 m to 12.0 m. Of these spectral bands, the seven listed in Table 1 are considered thermal emissive covering a spectral range of 3.7 m to 12.0 m. To ensure that high quality science data records are produced and maintained on-orbit, the VIIRS instrument is subjected to a comprehensive test program prior to launch which characterizes and calibrates the sensor. The thermal band pre-launch radiometric calibration and characterization of the JPSS-2 VIIRS instrument is the subject of this paper.
1.1. VIIRS Emissive Bands Overview
The VIIRS thermal emissive bands are listed in Table 1 with some of their spectral band characteristics ( and refer to the lower and upper limits of the specified dynamic range while is the expected typical scene temperature). All of the thermal bands are comprised of 16 (or 32 for bands I4 and I5) HgCdTe photo-voltaic detectors staggered parallel to the spacecraft direction of motion. Band M16 has two sets of 16 detectors (referred to as M16A and M16B) which are combined via time delay integration, but are generally reported separately pre-launch. In addition, band M13 has two gain states; the lower gain state is used to reach very high scene temperatures needed for accurate fire detection. The bands have ground resolutions at nadir of either 375 m (I4 and I5) or 750 m (M12–M16). A microlens focuses the light onto each detector after it passes through a spectral bandpass filter, defined by the center wavelength and bandpass listed in Table 1. The thermal bands are divided between two focal planes arrays (FPA): the mid-wave infrared (MWIR) bands I4, M12, and M13 are located on one FPA (along with five reflective bands covering ∼1.2 m to 2.3 m) and the long-wave infrared (LWIR) bands I5, M14, M15, and M16 are located on a dedicated FPA. Both focal planes are housed inside their own dewars and will be cryogenically controlled at 82 K on-orbit using a three stage passive cooler.
The MWIR and LWIR spectral regions are separated via a dichroic beamsplitter and directed into the two dewars. To reach this dichroic, the light entering the aft-optics passes through a fold mirror, a four mirror anistigmat, and an earlier dichroic beamsplitter that separates the visible and near-infrared from the infrared. The optical path preceding the aft-optics contains the fore-optics, which is comprised of a scanning telescope and a half-angle mirror (HAM). The rotating telescope (referred to as the RTA) is comprised of a three mirror anistigmat and a fold mirror; the RTA makes one full rotation in about 1.78 s, viewing a ±56 degree swath through the Earth view (EV) port as well as three calibration views, each about one degree wide: a view of deep space (SV) used to determine the dark offset at about −66 degrees off nadir; a view of an on-board blackbody (OBCBB) at about 100 degrees off nadir, used for on-orbit thermal band calibration; and a view of the solar diffuser at about 159 degrees off nadir, used for reflective band calibration on-orbit. The HAM, rotating at half the speed of the RTA, de-rotates the light beam and directs it into the fixed aft-optics.
The OBCBB is a V-groove blackbody that is used on-orbit as a calibration reference viewed every scan. It has an emissivity above 99.6% in the spectral regions accessed by VIIRS thermal bands and is nominally controlled at ∼292 K. It can also be cycled from instrument ambient to 315 K in a number of discrete temperature settings, or allowed to cool down in an uncontrolled manner. During ground testing under environmental conditions, instrument ambient ranges from ∼253–276 K, while on-orbit instrument ambient is expected to be about 267 K (based on SNPP and JPSS-1 experience [1,3]).
1.2. Testing Overview
The sensor vendor (Raytheon Space and Airborne Systems) conducted a comprehensive series of performance tests prior to launch in 2016 and 2017 [10,11]. Environmental testing was conducted during the fall of 2017 during which the bulk of testing was performed at three instrument temperature plateaus (referred to as cold, nominal, and hot) designed to cover the range of possible on-orbit conditions. The results of the radiometric testing that was conducted under thermal vacuum conditions for the JPSS-2 VIIRS is the focus of this work.
The test program used for JPSS-2 VIIRS was very similar to that employed for JPSS-1 VIIRS [12]. There were four blackbodies used in testing. An external, cavity type blackbody (known as the BCS) with a temperature range from 190 K to 345 K and an emissivity greater than 99.96% was used as the main calibration source, located inside the thermal vacuum chamber at about 41 degrees scan angle. A high temperature blackbody (referred to as the TMCBB) used to calibrate M13 low gain and cross calibrated to the BCS was located outside the chamber and viewed through collimating optics (TMC) and a ZnSe window in the thermal vacuum chamber at about −7 degrees scan angle. A cold reference target (known as the SVS) was used to simulate the deep space view and was controlled around 90 K; the SVS was located inside the chamber and was viewed at about −65.7 degrees scan angle. The fourth blackbody was the OBCBB as described in Section 1.1.
The radiometric testing for the thermal bands can be divided into two sections: performance and stability. The source temperatures were cycled through a series of discrete levels during performance testing, whereas the source temperatures were fixed while the instrument conditions were varied for stability testing. The individual tests performed are listed in Table 2 including the source temperatures or temperature ranges as well as some of the instrument conditions such as instrument temperature plateau, focal plane temperature, and bus voltage. The performance tests were used to determine the model coefficients relating the detector response to the radiance as well as to assess a number of performance metrics, such as response nonlinearity and detector-to-detector uniformity. The stability tests were performed to check the instrument response to variations in operating conditions including: time, instrument temperature, focal plane temperature, and bus voltage.
2. Methodology
The methodology used to characterize the thermal emissive bands has been described in detail for the JPSS-1 VIIRS instrument [12]. The equations used to determine the radiometric model coefficients and estimate the performance and stability metrics have not changed for JPSS-2 VIIRS and so will only be briefly repeated here.
2.1. Radiometric Performance
The path difference radiance between two sources (the first of which is either the BCS, TMCBB or OBCBB depending on the test and the latter of which is the SVS) is [12,13]
where the reflectance factor () represents the product of individual reflectances of the RTA and is the emissivity of the source. For VIIRS, the only optic that has a varying angle of incidence (AOI) is the HAM; is the AOI dependent, relative reflectance of the HAM [14] and here it was at the AOI of either the source or the SVS. The radiances of the sources (L) are determined via Planck’s law, convolved over the extended bandpass of the spectral transmittance of each band. The temperature of each source was determined from one or more thermistors located on or near each component.
For the BCS, the emissivity was high enough that the contribution from light reflected off the BCS was ignored; for the OBCBB, this contribution must be explicitly included, as given by
The relative contributions of light reflected off the OBCBB into the detector field of view by the RTA, the blackbody shield (SH), and the scan cavity (CAV) are denoted by , , and , respectively.
For the TMCBB, additional terms are added for the TMC optics and thermal vacuum chamber window, or
is the reflectance of the chamber window. The transmittance of the TMC optics () was used to facilitate the calibration transfer from the BCS to the TMCBB.
The path difference radiance was modeled as a quadratic polynomial in the offset corrected digital response [13,15], or
where are the calibration coefficients and is the digital counts. Both the BCS and OBCBB were transitioned through a series of temperature levels; the data acquired was used to determine the coefficients by fitting the path difference radiance versus the detector response within the dynamic range (as discussed in Section 3.1). A check on the linearity of Equation (4) was performed by computing the maximum fitting residual of a linear fit divided by the upper limit of the specified dynamic range, .
An additional term, called the F factor, was included on-orbit to adjust the calibration coefficients for scan-to-scan variations in the detector responsivity [1,2,3]. For the purposes of this work, this factor will also be included when considering the uncertainty estimate in Section 2.3, so as to better estimate the expected on-orbit uncertainty. The detector-to-detector uniformity (or striping) was quantified by estimating the deviation of the retrieved radiance from the detector average and dividing by the noise equivalent differential radiance (NEdL), which is defined below.
The noise equivalent differential temperature (NEdT), the fluctuation in the scene temperature equivalent to the system noise, was computed by the equation
The derivative is of Planck’s law with respect to the source temperature. The signal to noise ratio (SNR) was modeled as the path difference source radiance divided by the square root of a quadratic polynomial. The polynomial coefficients were determined by fitting the SNR to .
2.2. Radiometric Stability
Radiometric stability testing was performed to supplement the radiometric performance testing by examining how the instrument behaves with changing instrument conditions. The stability was trended using the linear gain [] assuming the offset and nonlinear calibration coefficients were negligible. This trending was performed in tests of stability versus time, changes in instrument temperature, variation in FPA temperature, and changes in the bus voltage.
2.3. Radiometric Uncertainty
The radiometric uncertainty was estimated in this work following the methodology outlined in [16,17] where all of the terms in Equation (5) were propagated to the total one-sigma uncertainty for a single EV pixel. A brief description is given here, while more detail is contained in the nearly identical analysis performed in [12] for JPSS-1 VIIRS. Because the covariance terms are in general difficult to estimate and beyond the scope of this work, a worst case estimate was derived using the Schwarz inequality [16] as an upper bound. Both the baseline (without covariance terms) and worst case (with covariance terms) uncertainties are presented. The individual uncertainty contributors were determined in the same manner as in previous work [12], and so will not be repeated here.
This procedure was followed at each instrument condition (temperature plateaus and electronics sides) as well as for both internal and external sources. Additionally, as a check on the model validity, the full uncertainty analysis was performed using linear, quadratic, and cubic polynomials in Equation (4); the results were compared to determine any relative improvement with increasing polynomial order. In the present work, only the uncertainty derived using the BCS data is shown. On-orbit, the pre-launch radiometric coefficients will be used as a baseline, to which a scan-by-scan correction is applied; the coefficients derived from the OBCBB during its warm-up/cool-down cycle will be used as a check on the calibration and replace the BCS coefficients only if a large change in behavior occurs.
3. Results
3.1. Data Quality and Reduction
As the testing methodology has not changed much from JPSS-1 to JPSS-2 VIIRS, the processing methodology is also very similar to that described in [12]. As a result, this section briefly describes the data selection and reduction performed to determine the radiometric fitting coefficients as well as the performance and stability metrics. In this work, all available data that was deemed good quality (not contaminated by noise at low signal levels or saturation at high signal levels) was used in the determination of the performance metrics; this may differ from the design requirements of the sensor by including additional data or in some cases excluding data. The dynamic ranges are shown in Figure 1: the black lines represent the specified dynamic range; the red lines indicate the scene temperatures for which the SNR is equal to 5 and the saturation temperatures. The blue lines indicate the extent of the measurements used in the fitting. Note that the BCS temperature range (190 K to 345 K) was in many cases a limiting factor; while no band saturated lower than 345 K, the SNR for bands I4 and M14 fell below 5 above the lower limit of their specified dynamic range (I4 due to high noise and M14 due to a negative offset corrected response resulting from the large difference in RVS from EV to SV). Figure 1 does not show M13 low gain, but all measured data was used in the determination of its performance metrics.
Data collections were recorded at various source temperature levels, during which the sensor response and telemetry as well as external source telemetry was recorded. The pixels for which the sensor viewed a given source were averaged and the offset (determined by viewing the SVS every scan) was subtracted, and then the data is averaged over all valid scans in a data collection. The resulting , , and were inserted into Equation (4). The telemetry data mostly consisted of temperatures, from which radiances are derived by convolving the Planck function over the band averaged spectral response functions. Many of these were inserted into the equations in Section 2; some of the telemetry are used in the stability assessment such as the FPA, electronics, and instrument temperatures.
Some of the input parameters, such as [14], , and [18], were measured in previous testing and their derivation will not be described in this work.
The path difference radiances were determined from Equation (1) for a given source and then inserted with the corresponding into Equation (4). Fits of the radiometric calibration coefficients were performed over all valid data within the fitting range defined earlier in this section. Then the retrieved radiance and performance metrics were derived using these coefficients. The SNR was fit over the same range and the fit is used to estimate the SNR and NEdT at . Lastly, the uncertainty was propagated to the retrieved radiance level.
To determine the saturation and gain transition scene temperatures, partial views of the BCS and TMCBB as VIIRS scanned across the sources were used. Here the scan averaged dark offset was subtracted from each pixel of the scan across the sources profiles; the largest was averaged over all scans in a data collection and then converted into a scene radiance using Equation (5), from which the scene temperature was determined via Planck’s law.
3.2. Radiometric Performance
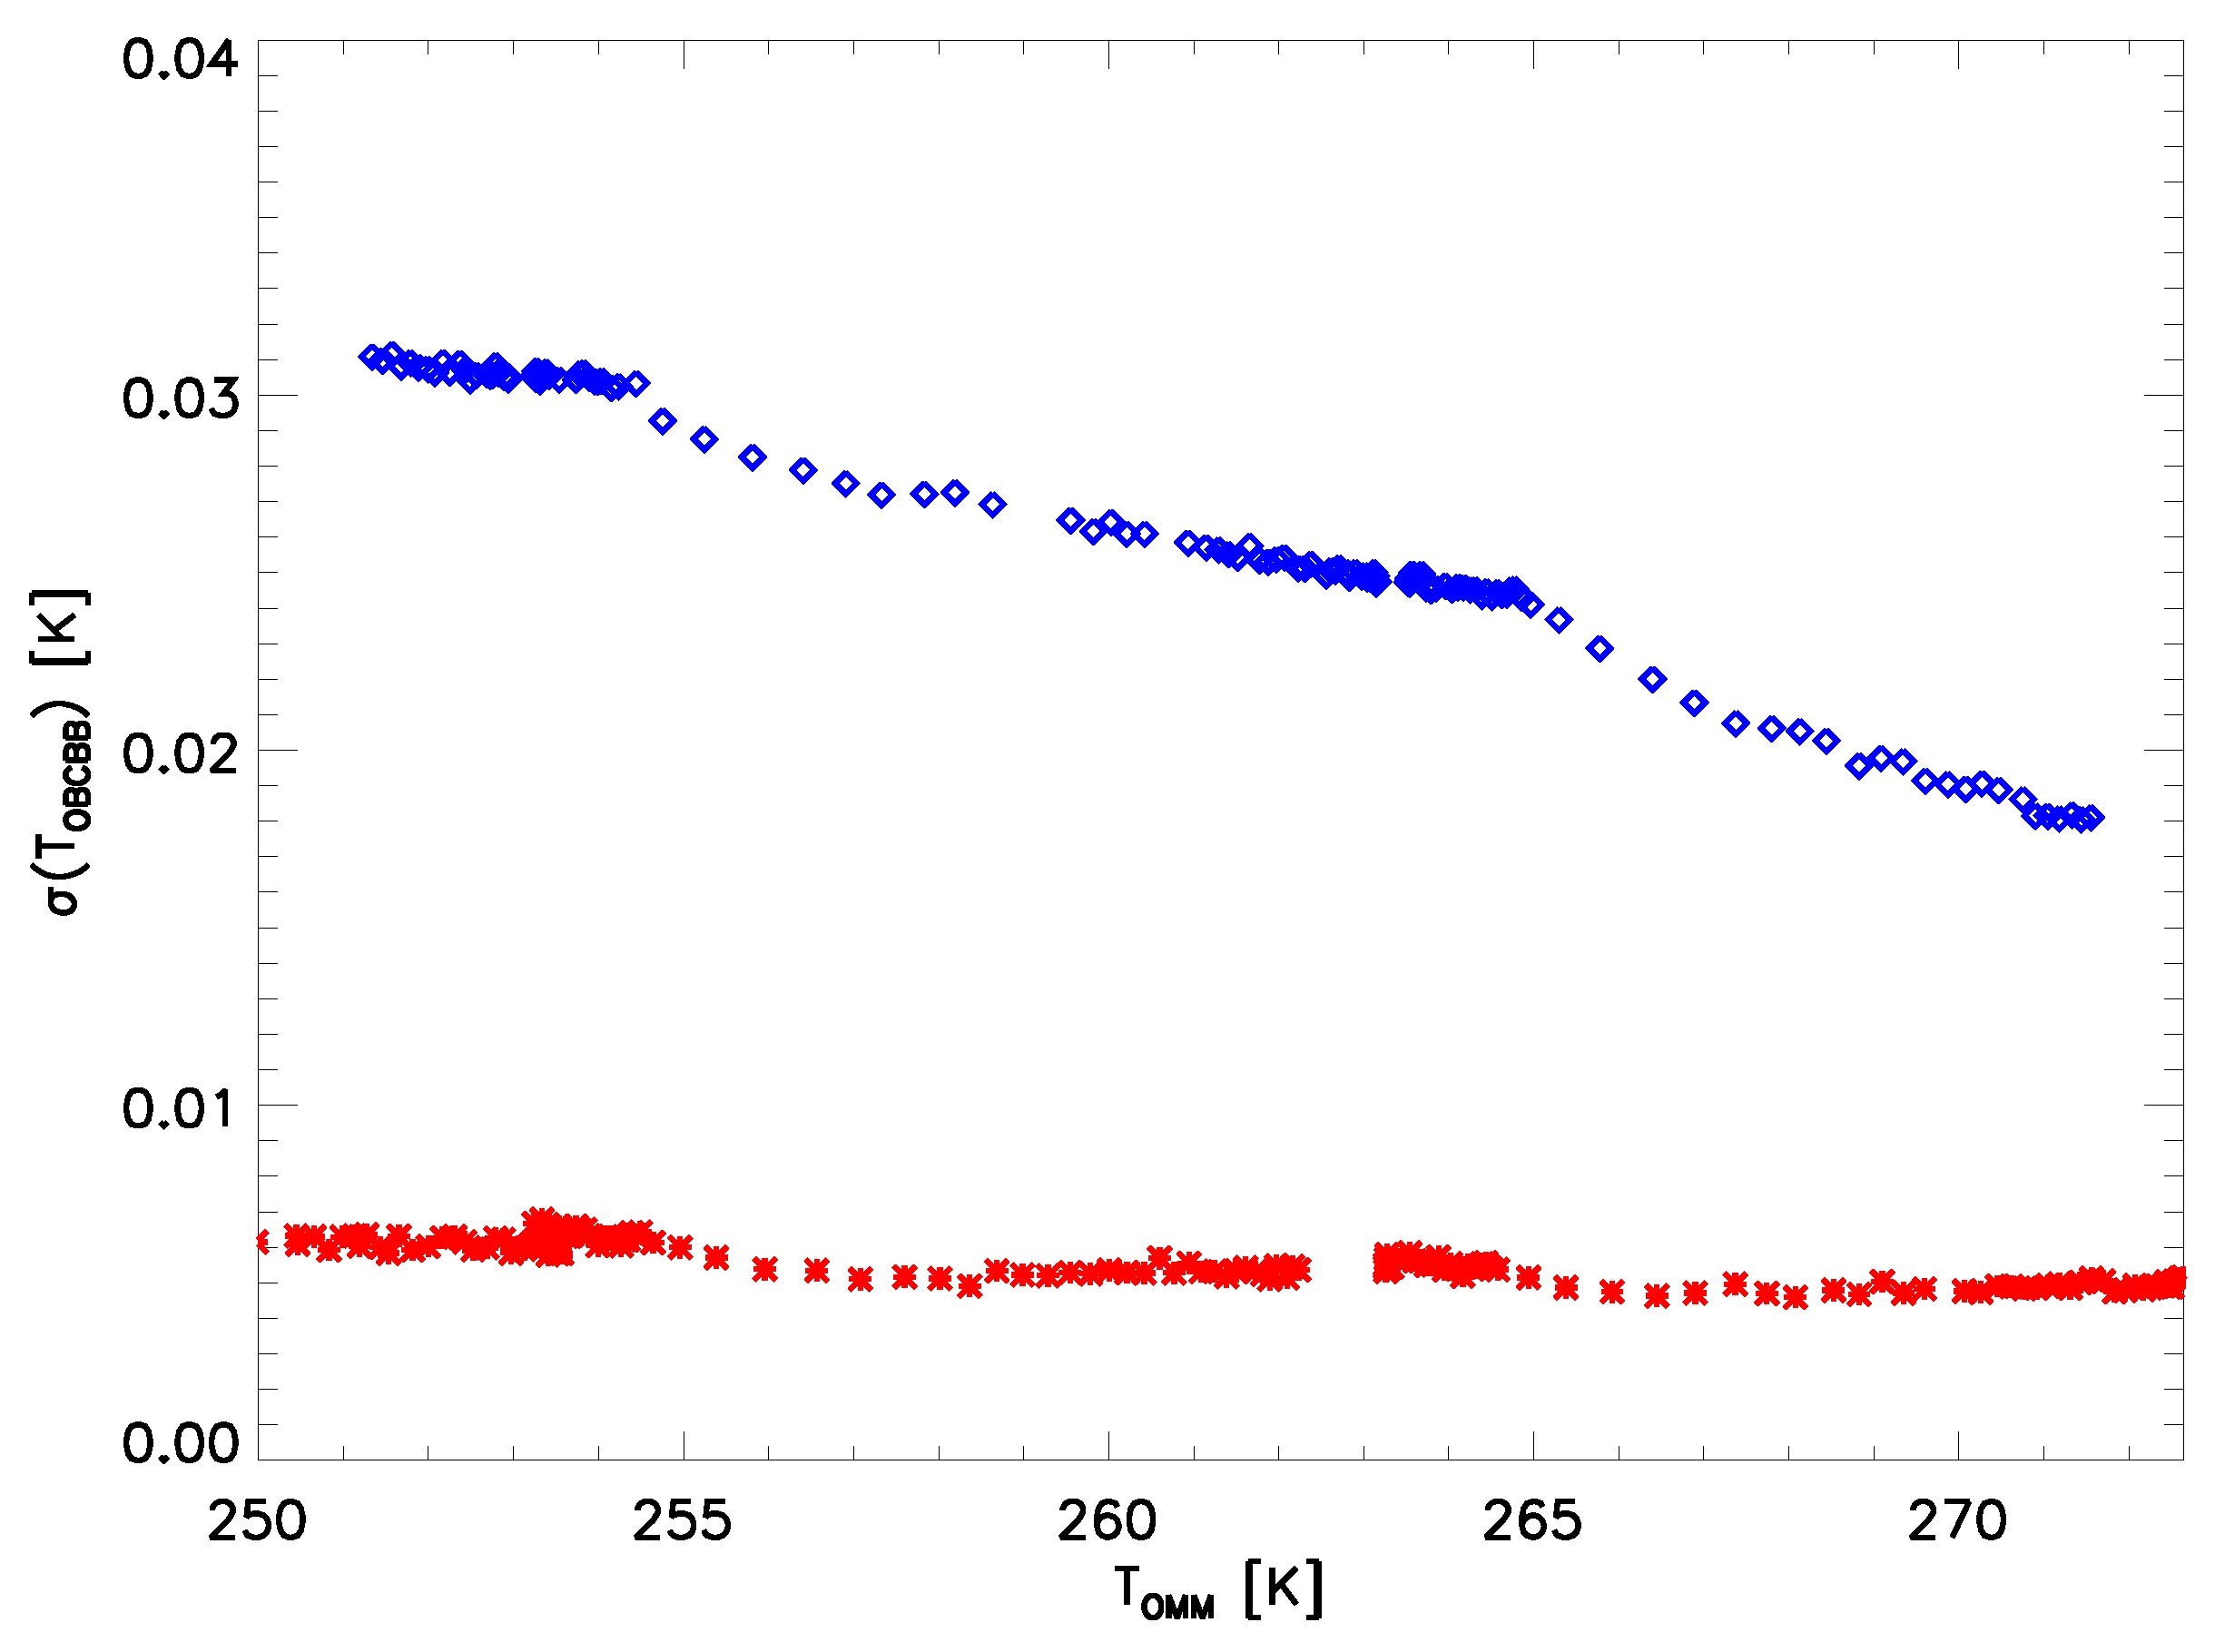
The OBCBB was kept at about 292 K for most of thermal vacuum testing (see Table 2) and has six thermistors embedded in the back. The standard deviation of the six thermistor readings was used to track the uniformity of the OBCBB temperature as seen by VIIRS (the design requirement was less than 30 mK). Figure 2 plots this standard deviation versus the instrument temperature. For JPSS-2 VIIRS (shown in blue), the standard deviation was as high as 31 mK and decreases with instrument temperature to around 18 mK. The sensor vendor traced the root cause to the bonding of the heater to the back of the blackbody. The comparable pre-launch measurements of the JPSS-1 VIIRS OBCBB uniformity are shown in red, and are around 5–7 mK over the entire temperature range. Based on SNPP and JPSS-1 VIIRS experience, the instrument temperature on-orbit is around 260–265 K. This nonuniformity will be in addition to the expected day/night cycle observed in earlier VIIRS instruments on-orbit [1,3] of up to about 30 mK (under nominal operating conditions at 292 K during daytime). This expected JPSS-2 non-uniformity of up to 50–60 mK could potentially lead to biases in the MWIR bands of up to 0.2% and in the LWIR bands of up to 0.1%.
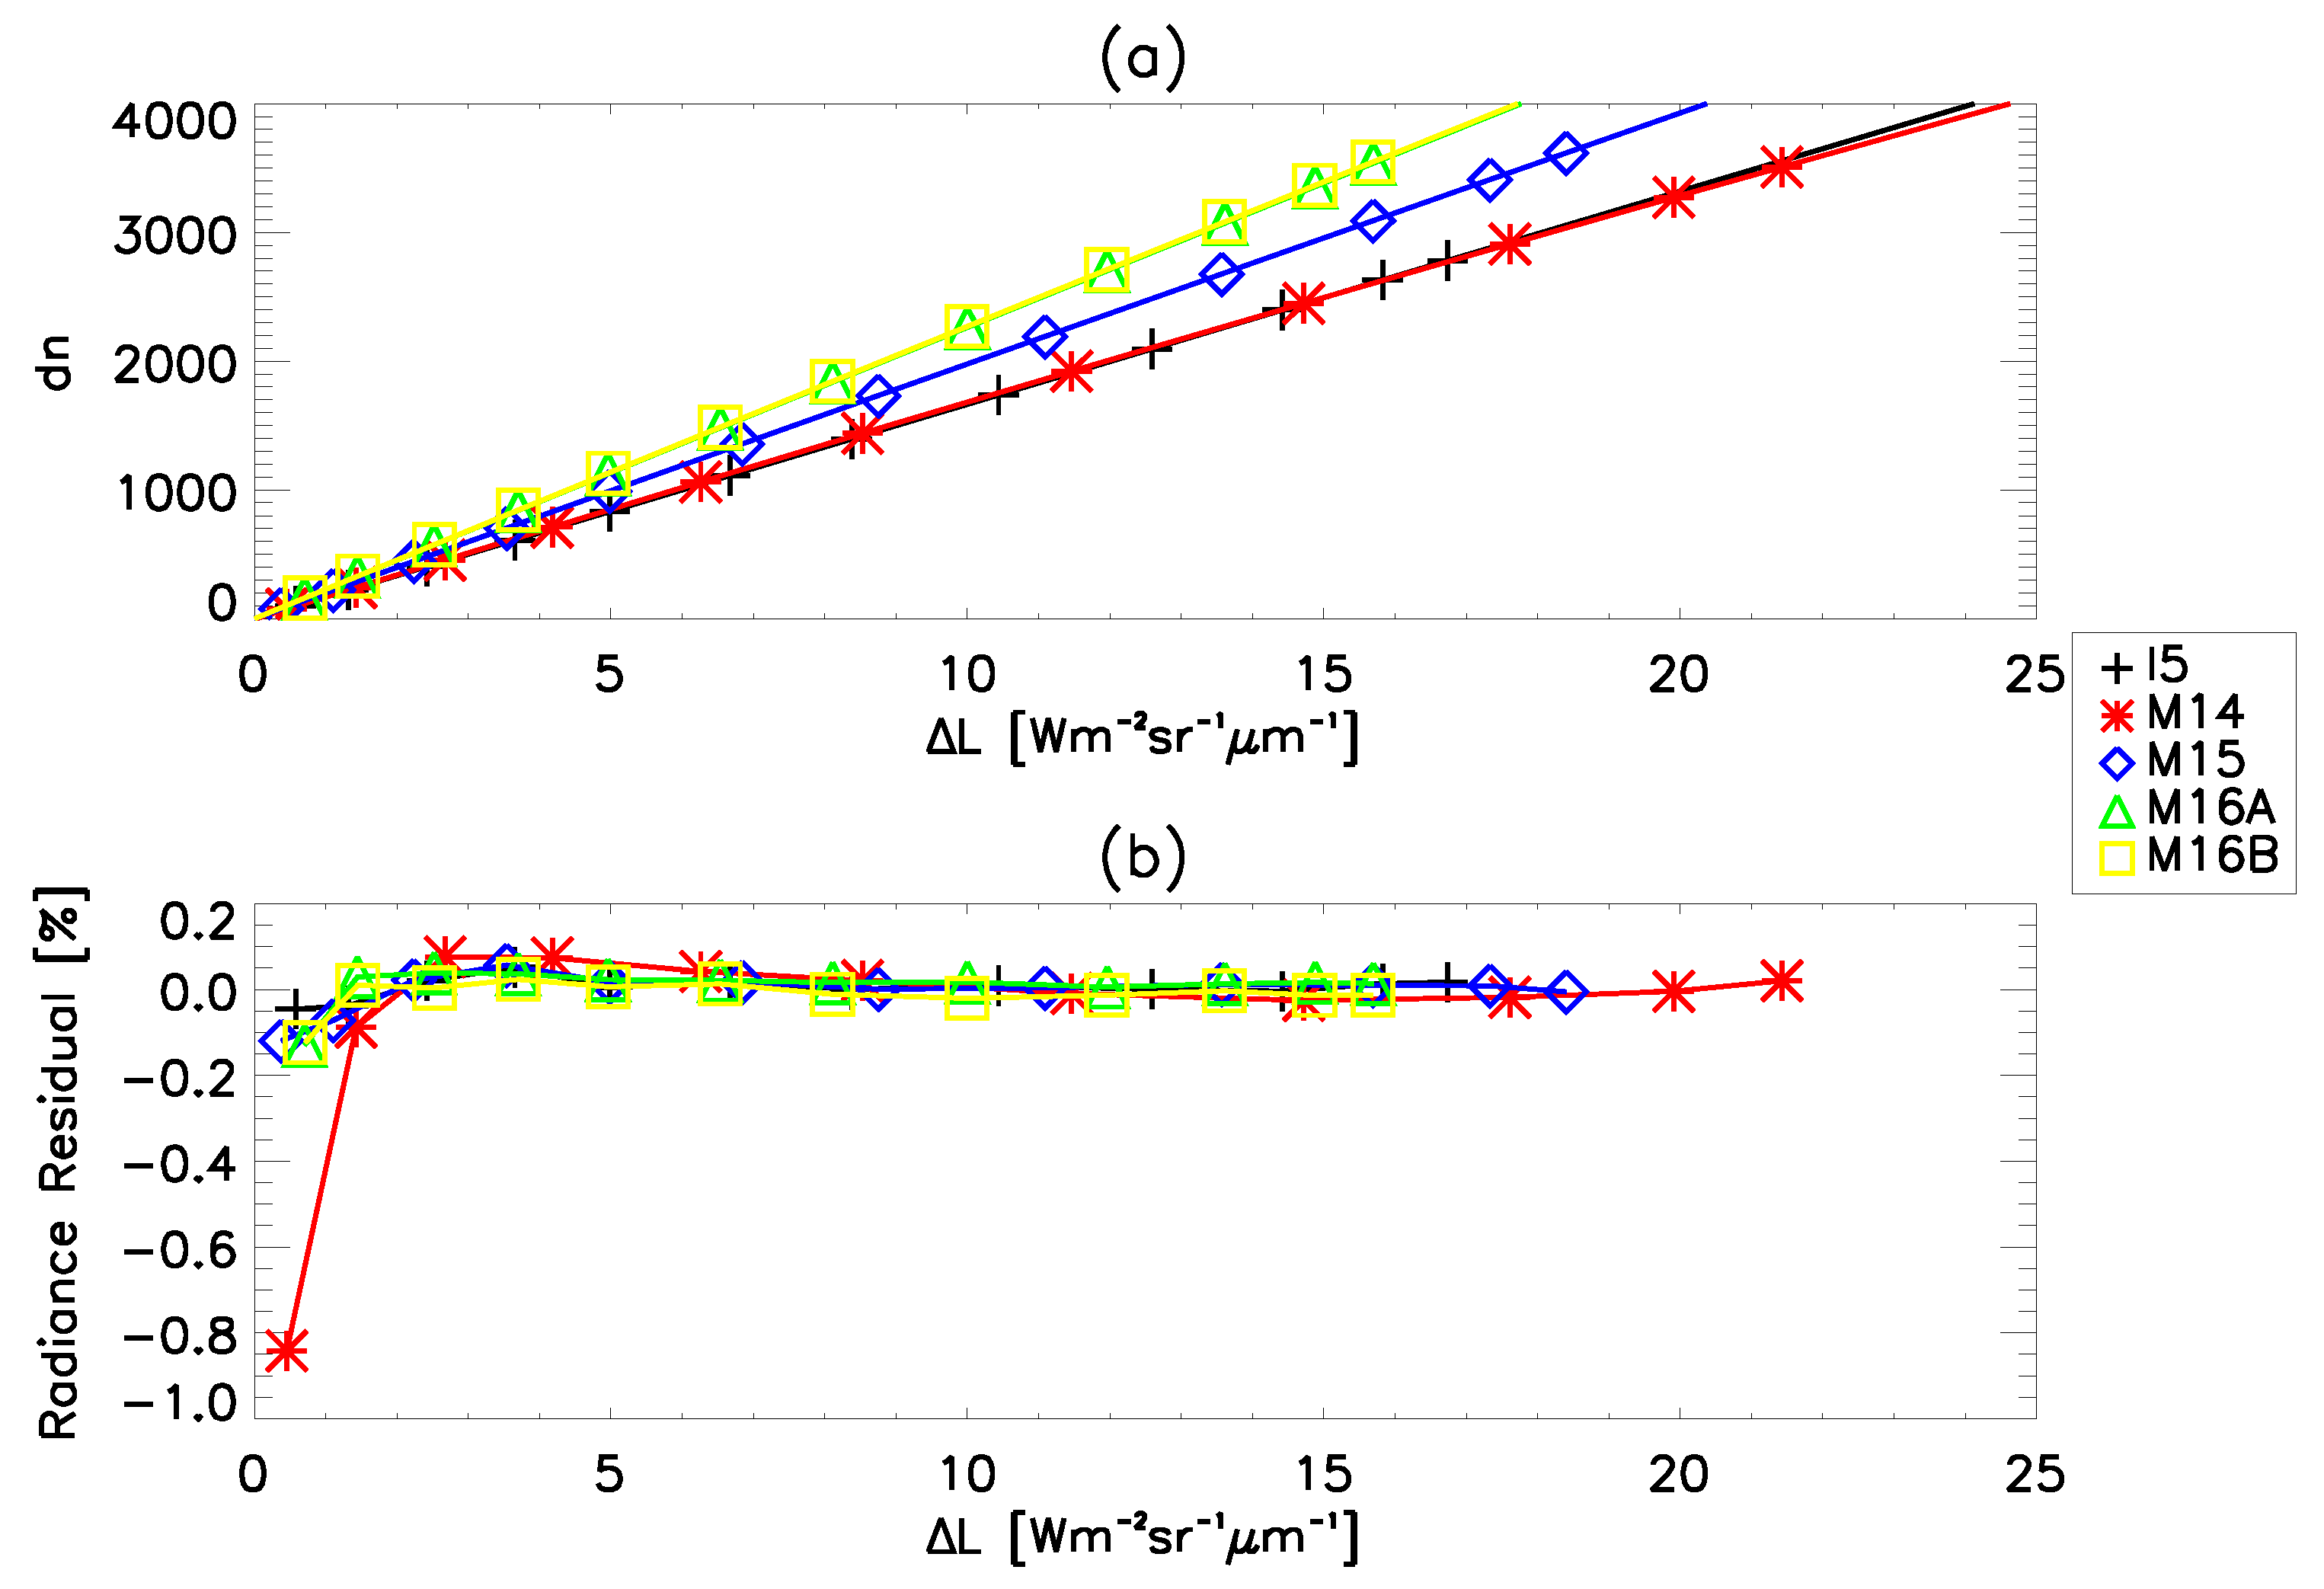
Fits of the offset corrected detector response to the path difference radiance are shown in Figure 3a for detector nine of the MWIR bands using BCS data (the corresponding radiance residuals are shown in Figure 3b). These detectors were representative of all the detectors in a given band. A significant portion of the 12 bit analog-to-digital converter range was used (about 75%). The radiance residuals were small except at very low radiances where the residuals increase (up to ∼4%); for this spectral region, a 230 K scene produces very low radiances and is therefore a large constraint on the fitting (due to noise uncertainty). This behavior is also observed at around 355 K for M13 low gain (the low end of its dynamic range). Figure 4a,b show the same plots for the LWIR bands. The majority of the 12 bit analog-to-digital converter range was used (above 90%) for these bands. The radiance residuals are very small over the entire radiance range for all of the LWIR bands (less than 0.2%), except band M14 where there is a small increase at the lowest radiance level (still less than 1.0%). The data shown in the figures was measured during the nominal instrument temperature plateau with the FPA at 82 K, but the results measured at other instrument conditions (temperature plateaus, FPA temperatures, HAM sides, and electronics sides) were generally consistent in terms of the fitting behavior and residuals. In addition, the comparable measurements made during the JPSS-1 VIIRS test campaign also showed similar behavior to the current results [12].
The radiometric calibration coefficients defined in Equation (4) were determined by fitting the radiance in Equation (1) to the offset corrected instrument response. The linear term dominates the fitting, indicating that the system is generally very linear. The band average gains () are listed in Table 3 for all of the performance measurements; the gains were comparable to previous sensors except that for JPSS-2 VIIRS the M15 and M16 gains have been increased by about 10%. Some odd–even detector dependence was observed, but to a smaller degree than on previous sensors where large odd-even dependence was observed in bands M12 and M13. For most bands, the gains tend to increase slightly with instrument temperature (band M14 is the exception, where the gains tend to decrease with instrument temperature); the gain changes over the roughly ∼20 K temperature range by between 1–3% for the LWIR bands and less than 1% for the MWIR bands (but the detector dependence does not noticeably change for any band). This temperature variation (as well as the variation between electronics sides) is largely outside the two-sigma error bars. For electronics side A at the nominal plateau, the coefficients were determined at three different focal plane temperature settings; the gains for the MWIR bands were consistent across FPA temperature whereas the LWIR gains decreased with FPA temperature by between 7–20% over 4 K (this behavior was also observed on the JPSS-1 VIIRS).
The offset () and nonlinear term () were subdominant. The offset term is in general on the order of or less and fairly consistent over instrument temperatures and electronics sides; the offset for band M14 is slightly higher (between 0.01 and 0.05). The MWIR bands appear to have no noticeable dependence on instrument temperature while the LWIR bands trend slightly higher with instrument temperature. In the majority of cases, the two-sigma error bars overlap for the different plateaus (electronics side dependent), indicating that is generally consistent over instrument temperature conditions; the only exception is band M14, which indicates some instrument temperature dependence. The detector dependence is fairly stable across instrument conditions for the LWIR bands, while some variation with detector was observed for the MWIR bands. There does not appear to be any clear dependence on FPA temperature based on the three nominal plateau, A side electronics measurements. The derived for M13 low gain is slightly negative (between −0.1 and 0 [W/m2/sr/m]). The behavior observed for JPSS-2 VIIRS is generally very consistent with that observed for JPSS-1 VIIRS.
The nonlinear term () is on the order of or less for all bands. There is no noticeable detector pattern for the MWIR bands, but the LWIR bands show a clear pattern over different measurements. The two-sigma error bars for different plateau and electronic side measurements generally overlap, indicating that there is not much dependence on either quantity. The term is negative for the MWIR bands and positive for the LWIR bands which implies that the curvature of the fitting is in opposite directions for the two groups. The LWIR bands also show a clear dependence on the FPA temperature, with the small, positive nonlinear coefficient noticeably increasing with FPA temperature.
The above coefficients were derived using BCS data, which is traceable to NIST standards. On-orbit, the calibration is maintained using the OBCBB. Therefore it is important to compare measurements from the two sources pre-launch. The calibration coefficients derived using the OBCBB were compared to those computed from BCS data using a truncated fitting range that approximates the measured OBCBB range from instrument ambient to 315 K. For most cases in the MWIR bands and band I5, the two-sigma error bars overlapped; the error bars did not overlap for bands M14–M16 in the majority of cases.
The band maximum saturation values for each band are listed in Table 4. All of the thermal bands saturate above their design requirements [9] and they all digitally saturate first (including both M13 gain stages). Bands I4 and M12 were observed to exhibit analog saturation at higher radiances within the measurement range. For both of these bands, analog saturation causes the response to decrease as the radiance increases until it reaches zero. The behavior on-orbit leads to two possible radiance values for each response value; fortunately, scenes with temperatures above saturation for these bands are usually fires, and can be correlated to M13 for quality control. For all bands the variation between instrument conditions is less than 3 K. Bands I4 and M12 saturate less than 10 K above their design requirement; all other bands exceed the design specifications by a larger margin. The saturation temperatures are comparable to those observed for JPSS-1 VIIRS except for bands M15 and M16, which have decreased by 7 K to 10 K. This is largely the reflection of the increased gain in these bands noted previously.
To estimate a lower bound on the dynamic range (), the radiance at which the SNR was equal to 5 was calculated. The equivalent scene temperature was estimated, the band average of which is listed in Table 4 using nominal plateau data. In most cases, this value was below the design requirements [9]. Bands I4 and M14 were the exceptions; I4 has high noise and for M14 the is large enough that the offset corrected response becomes negative at the lowest measured scene temperatures. Note that there was some uncertainty in this estimate for bands I5, M13 low gain, M15, and M16 due to extrapolation well below the measured range.
Band M13 gain transition was determined to occur between 342 K and 348 K. There was about a 2 K spread in transition temperature with detector (largely due to detector-to-detector gain differences) and about a 3 K variation over instrument temperature (resulting from increasing background emission at higher instrument temperatures). This is slightly larger than the design specification [9], but has been deemed low risk to the science products (the ground measurements cover a much wider range than the usual on-orbit operating conditions). Similar behavior was observed for JPSS-1 VIIRS.
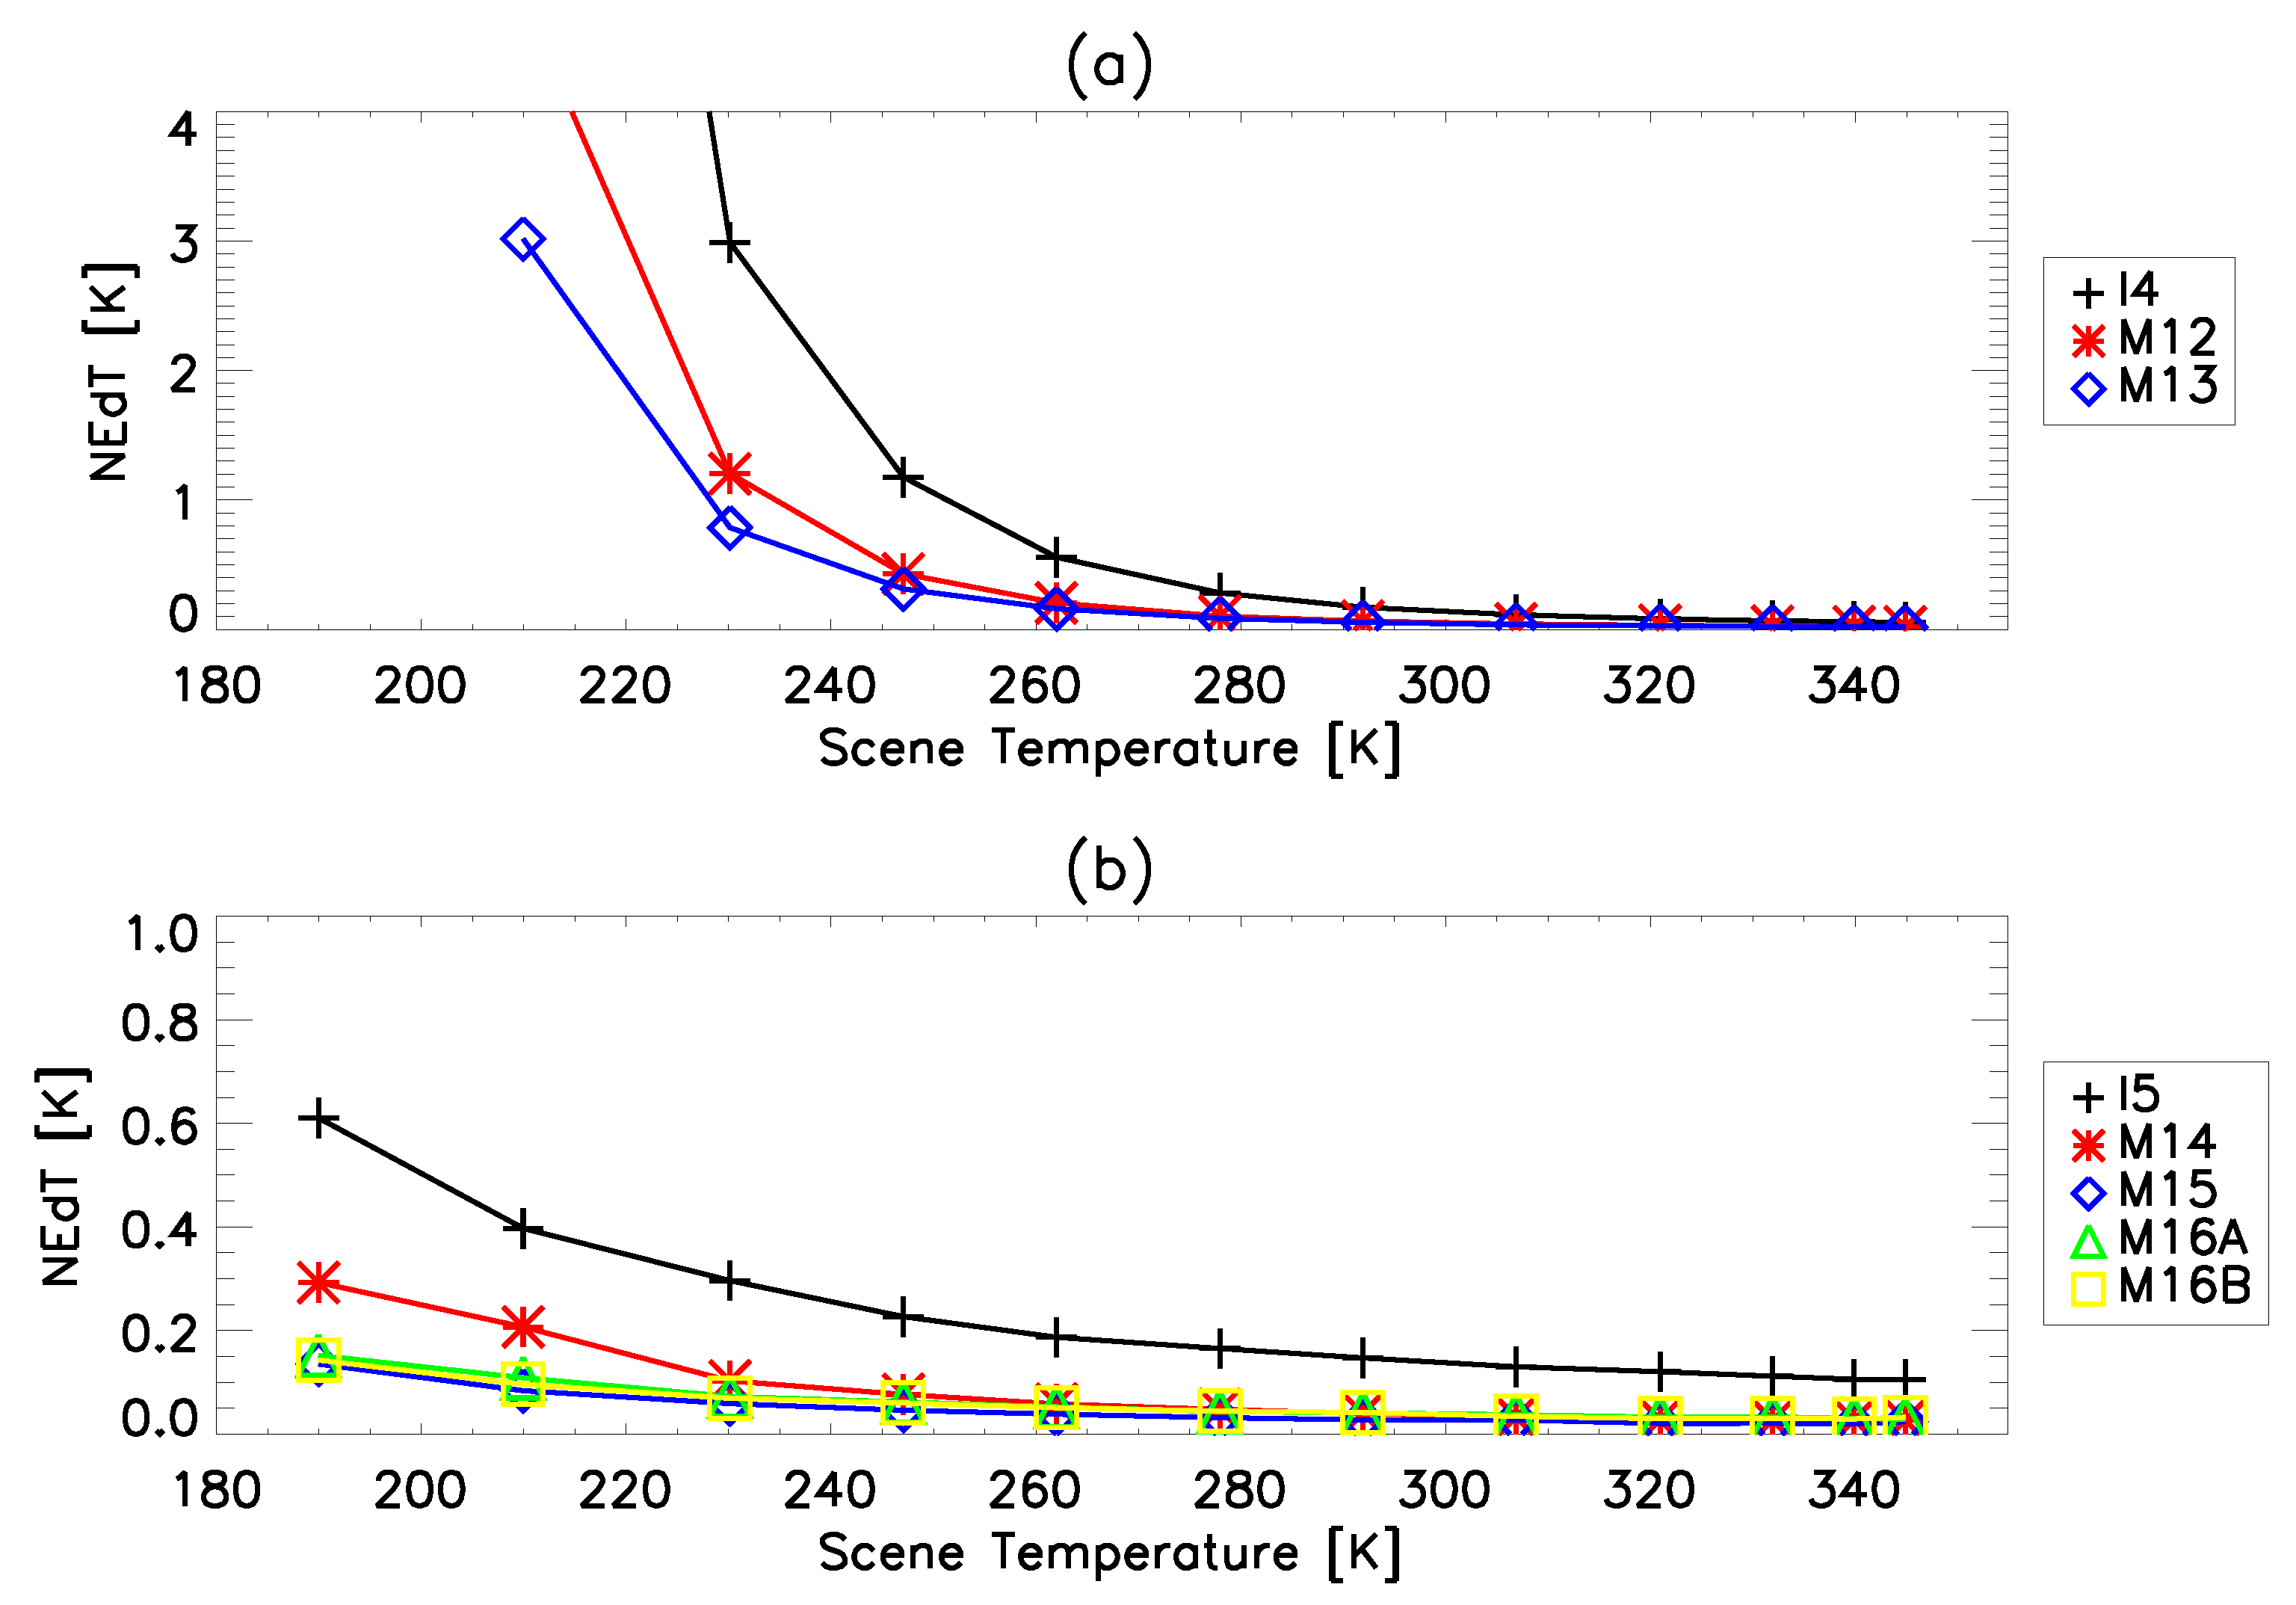
Figure 5 shows the NEdT plotted as a function of scene temperature for detector 9 of all bands except M13 low gain. The NEdT decreases as the scene temperature increases for all bands due to the influence of the derivative of the Planck function in Equation (6). The NEdT was as high as about 1 K for bands M12 and M13 high gain and about 3 K for band I4 at 230 K and lower as the scene temperature increased; the NEdT was less than about 0.6 K for I5 and less than about 0.3 K for all scene temperatures for the remaining LWIR bands. The NEdT was not very sensitive to changing the instrument conditions, with the exception of the LWIR bands when increasing the focal plane temperature which correspondingly increases the NEdT. M13 low gain is not shown, but behaves similarly to the other bands; the NEdT was below ∼0.2 K for scene temperatures above about 400 K and increased to up to ∼0.5 K below 400 K.
The band maximum NEdT at for nominal plateau, electronic side A are listed in Table 4 along with the design specification. All bands were well below the limit for all conditions measured. The NEdT at was very consistent over the range of instrument conditions tested, both in terms of magnitude and detector dependence. There was a slight increase with instrument temperature for all bands and both electronics sides. This was the result of the increasing background emission in the detectors that occurs at higher instrument temperatures. The NEdT at also showed a small but noticeable increase with focal plane temperature for the LWIR bands. The behavior of both the NEdT and NEdT at were very similar to that observed for JPSS-1 VIIRS.
The nonlinearity metric (NL) is also shown in Table 4 (which is the maximum over detectors). In general there is very little variation over instrument conditions, except with focal plane temperature where there is an increase in nonlinearity for band M14, and to a small extent M15 and M16. The largest nonlinearity was observed in band M14 at around 0.8%, while all other bands showed about 0.2% or less (the design limit was 1.0%).
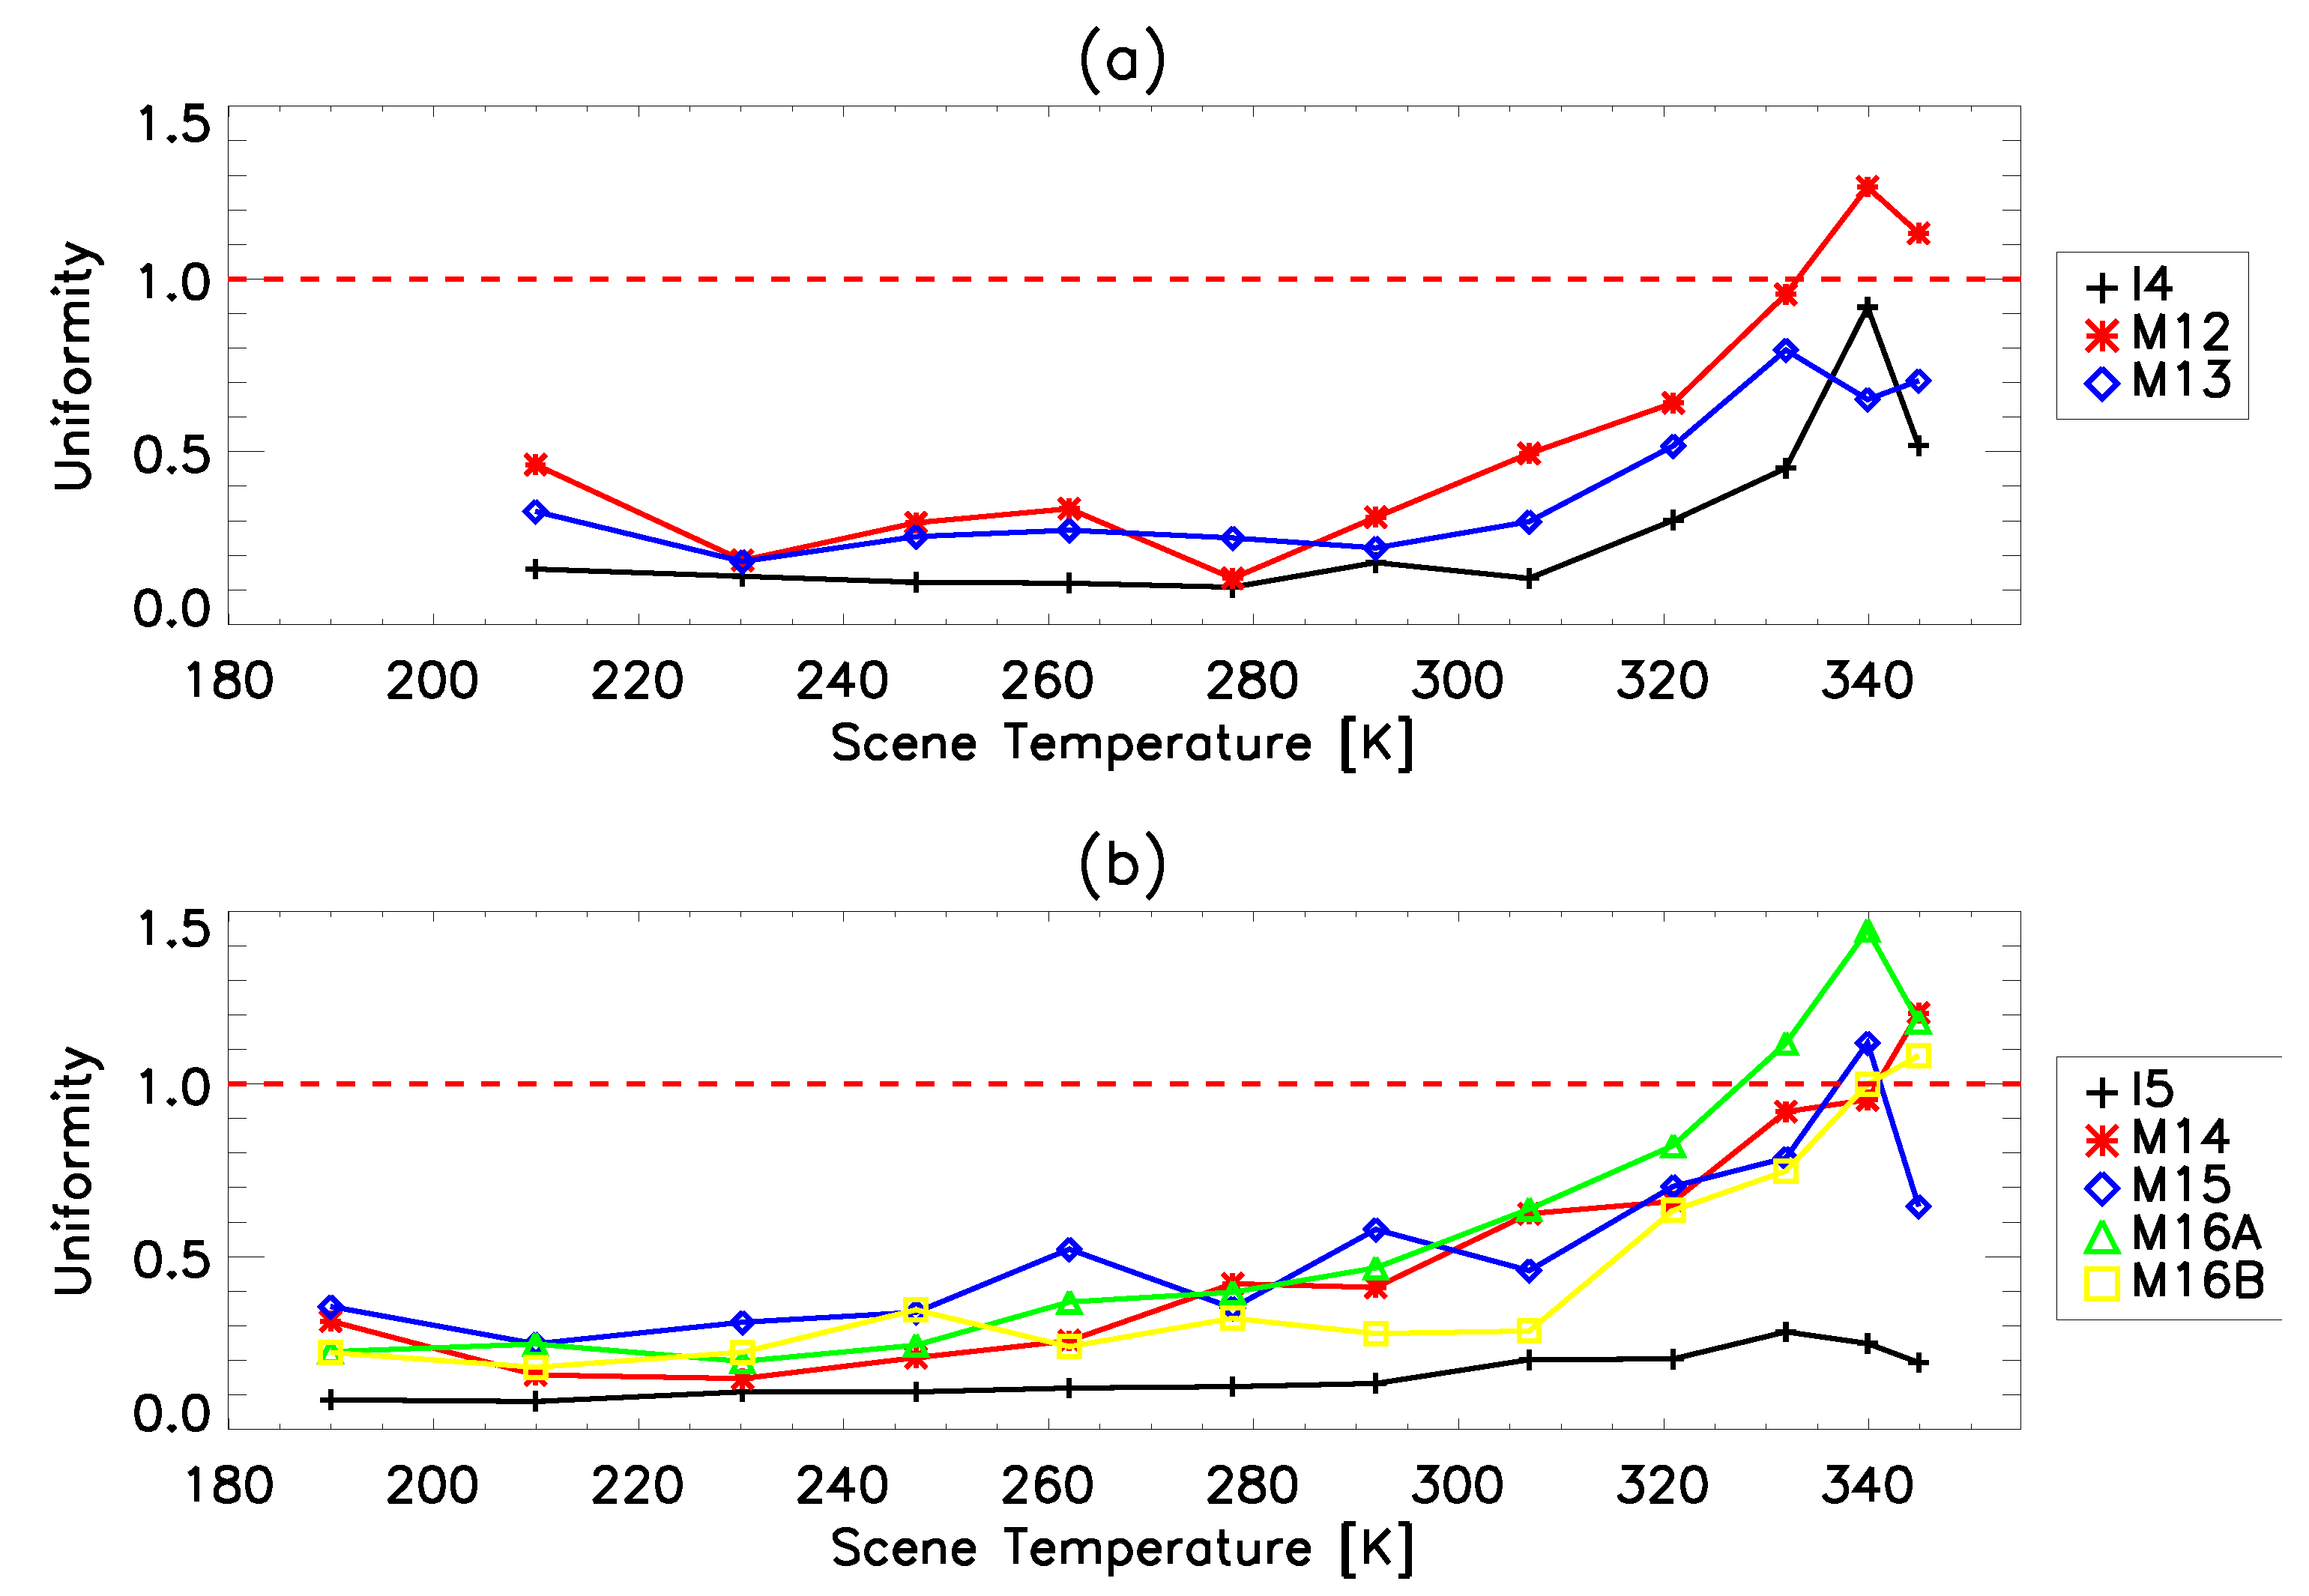
Figure 6 plots the detector-to-detector striping as measured by the uniformity metric for the worst case detector per band. If the value was greater than one, that indicates there was a potential for striping (the dashed red lines in the plots) [9]. This metric gradually increased with scene temperature and so the potential for striping correspondingly increased with scene temperature. Many bands exceed one at the highest two or three measured scene temperatures (above about 330 K). This was largely driven by the leveling off of the NEdL with increasing scene temperature as the deviation of the retrieved radiance from the band average increases; the result is a steadily increasing uniformity metric. M13 low gain, while not shown, will have very little opportunity for striping due to the sparsity of measurements available. Note that JPSS-1 VIIRS showed similar uniformity results in terms of trend, but slightly higher in terms of magnitude for some bands at high scene temperatures.
3.3. Radiometric Stability
A number of different radiometric stability tests were performed for JPSS-2 VIIRS, listed in Table 2, where stability was measured versus time, instrument temperature, bus voltage, and FPA temperature. The design requirements limit the variation to 0.1% between successive calibrations [9]. For the stability versus time tests, the change in the linear gain between successive calibrations was measured (on-orbit successive calibrations occur every other scan for the thermal bands or every fourth scan for band M13 through observations of the OBCBB). The maximum change for each band was measured over the length of the test was divided by the test time (usually 6–8 h) multiplied by twice the scan period; for all cases the maximum linear gain variation was 0.0002%.
Three transitions between instrument temperature plateaus were performed during which stability measurements were made in terms of two different instrument temperatures (electronics and optical modules or ELEC and OMM): the first from the lowest instrument temperature settings to the cold performance plateau (OMM temperatures ranging from 250–253 K and ELEC temperatures ranging from 262–268 K); the second from cold to nominal performance plateaus (OMM temperatures ranging from 253–262 K and ELEC temperatures ranging from 268–281 K); and the last from nominal to hot performance plateaus (OMM temperatures ranging from 263–273 K and ELEC temperatures ranging from 281–295 K). The transitions were performed such that while the ELEC temperature was increasing the OMM temperature was relatively stable and vice versa; thus, the effects of the two instrument temperatures on the sensor stability were to a large degree separated. During these transitions between instrument temperature plateaus, the stability of the linear gain was determined per degree K. The gain variation for all bands was between −0.01–0.03% (ELEC) and −0.18–0.06% (OMM) per degree K. The variation with ELEC temperatures was generally flat or very small, while the trending with OMM temperature was slightly positive for the MWIR bands and negative for the LWIR bands. On-orbit, the sensitivity to instrument temperature variation determined in these tests will be used to remove residual influences in the thermal model.
The bus voltage was also varied in stability testing, where the voltage was reduced from 32 Volts to 27 Volts in 1 Volt intervals. The observed variation was less than 0.09% per Volt for all bands.
Lastly, a test was performed where the FPA temperature was set to 82 K and then cooled down to 78 K. The change in linear gain for the MWIR bands was small (below 0.11%) whereas the linear gain for the LWIR bands varied by between 1.8% for band M15 and 5.7% for band M14. This is consistent with the radiometric performance results shown in Section 3.2.
These stability testing results are very similar to those observed on JPSS-1 VIIRS in terms of both magnitude and behavior.
3.4. Uncertainty
Propagating the uncertainty to the EV retrieved radiance for a single un-aggregated pixel based on the methodology described above results in the curves shown in Figure 7 (worst case detector and scan angle). For the LWIR bands, the uncertainty was below 0.5 K above scene temperatures of 200 K and below about 0.2 K above 250 K; the only exception is band I5 which had a slightly higher uncertainty around 0.7 K for a 200 K scene and below about 0.3 K for scenes above 250 K. For the MWIR bands, the uncertainties were smaller than 0.3 K above scenes of 290 K, but rise rapidly for lower scene temperatures (up to about 2 K for bands M12 and M13 around scenes of 220–230 K and up to 2 K for I4 below scene temperatures of 240 K. The calculated total uncertainties (in % radiance) are listed in Table 5 at the scene temperatures required by the design specifications. Band M12 at 230 K is the only case where the requirement was exceeded; however, this is a very low scene temperature for this band and is therefore not expected to greatly impact the science data products.
The two largest individual contributors to the total uncertainty for the MWIR bands are and . The uncertainty was roughly constant with scene temperature at about 0.2–0.3% and was the dominant contributor above about 290 K for bands M12 and M13 and above about 320 K for band I4. The was smaller at high scene temperatures and rises rapidly as the scene temperature decreases where it was the dominant contribution. The was driven by statistical uncertainty, so when a large data set is used this contribution will be reduced. In this case, the uncertainty will dominate down to scenes of 260–270 K where the uncertainty becomes the largest contributor (which then rises rapidly as the scene temperature decreases). This effect will reduce the uncertainty for band M12 at 230 K in Table 5, thereby satisfying the requirement.
In the LWIR bands, no single contributor tends to dominate at the highest scene temperatures, but at scenes of about 260 K and below the and are the main contributors. Both sources of uncertainty rise as the the scene temperature decreases. I5 is the exception in that it has higher detector noise, so that the stands out at higher temperatures. However, this contribution will decrease when large data sets are used.
How the uncertainty varied across the EV was also investigated. Two effects occur here: the EV was separated into three types of pixel aggregation (1:1, 2:1, and 3:1) with the corresponding reduction in noise with number of pixels aggregated and the change in the across scan which can increase the effects of the contributions from the thermal background. The effect of aggregation on the uncertainty was important in the MWIR bands and band I5, where detector noise was dominant; this effect increased as the scene temperature deceased. The change across scan affects bands M14 and M15 where the highest uncertainties are at the end of scan and the lowest at the beginning of scan. Band M16 showed a mix of the two effects.
Because many of the covariance terms in the uncertainty propagation are difficult to determine directly, a worst case estimate was calculated using the Schwarz inequality. For all bands, the uncertainty only marginally increased at ∼292 K (where the calibration is tied to the OBCBB) and increased as the scene temperature increased or decreased. For the majority of modeled scene temperatures, the increase did not exceed 0.15%; the exceptions were the lowest scene temperatures for bands I4, M12, M13, and M14 as well as high temperature for band I4.
The impact of model validity was also investigated by performing linear, quadratic, and cubic fits, and propagating the errors separately for each. In general, only marginal improvement in the uncertainty was derived by increasing the polynomial order from 2 to 3 (the biggest differences were at low temperature in the MWIR bands); in contrast, the quadratic model was a significant improvement over the linear model (especially for M14).
3.5. Comparison to SNPP and JPSS-1 VIIRS
In general, the overall performance of the three VIIRS sensors to date (SNPP, JPSS-1, and JPSS-2) are very similar. There are some small differences of note. The OBCBB nonuniformity was higher during ground testing (around 25 mK for JPSS-2 VIIRS compared to around 6 mK for JPSS-1 VIIRS at operational temperatures). This could complicate the on-orbit gain correction by introducing orbital oscillations and increase the overall uncertainty by limiting temperature knowledge of the OBCBB; uncorrected, this could produce a 0.1% to 0.2% effect. On JPSS-2 VIIRS there were no significant outliers among detectors in relation to their spectral bands; on SNPP M12 detector 1, M16A detector 9, and I5 detector 31 were outliers while on JPSS-1 M16B detector 5 was an outlier. This will reduce one potential cause of striping. For JPSS-2 VIIRS the detector gains for bands M15 and M16 were about 10% higher than SNPP and JPSS-1. This had the effect of reducing the saturation by 7–10 K, which will limit their use supplementing the fire detection band M13. The uniformity metric appears to be improved for JPSS-2 as the potential for striping at the highest scene temperatures is reduced. Overall, the comparable pre-launch performance between the three sensors is likely to lead to JPSS-2 VIIRS thermal band science data products of as high a quality as is currently observed for SNPP and JPSS-1 VIIRS [1,3].
4. Conclusions
The performance of the JPSS-2 VIIRS thermal bands was tested and characterized prior to launch at the Raytheon Space and Airborne Systems facility, largely in 2016–2017. This testing was performed in order to ensure high quality science data products are delivered once the sensor is on-orbit. Assessment of the thermal band calibration has found that the instrument has met its design requirements for the majority of cases, and for those few cases where it does not, the risk to science data products is low. The measured performance for the dynamic range exceeded the design limits (except at very low scene temperatures for bands I4 and M14); the NEdT was as expected and below the specified limits at typical scene temperatures; detector-to-detector uniformity was within the proscribed limits; radiometric stability was well within the required limits; and uncertainty on the retrieved radiance was below the design requirements except at very low scene temperatures. The on-board blackbody did show higher than expected non-uniformity which is expected to have some small impact on-orbit. Overall, the JPSS-2 VIIRS performance is largely comparable to that observed for both SNPP and JPSS-1 VIIRS, both of which are now providing high quality science data on-orbit.
Author Contributions
J.M. wrote the manuscript. J.M. and D.M. independently performed the analysis contained in this work. H.O. and X.X. contributed to the design of this study and to the development of the manuscript.
Acknowledgments
The authors would like to thank the following: the Raytheon test team including Tung Wang for conducting the performance tests and for developing much of the analysis methodology, and members of the government data analysis working group including James McCarthy for valuable comments. The above mentioned provided valuable information and support to the analysis presented in this work.
Conflicts of Interest
The authors declare no conflict of interest.
References
- Xiong, X.; Butler, J.; Chiang, K.; Efremova, B.; Fulbright, J.; Lei, N.; McIntire, J.; Oudrari, H.; Sun, J.; Wang, Z.; et al. VIIRS on-orbit calibration methodology and performance. J. Geophys. Res. Atmos. 2014, 119, 5065–5078. [Google Scholar] [CrossRef] [Green Version]
- Cao, C.; De Luccia, F.J.; Xiong, X.; Wolfe, R.; Weng, F. Early on-orbit performance of the visible infrared imaging radiometer suite onboard the Suomi National Polar-Orbiting Partnership (S-NPP) satellite. IEEE Trans. Geosci. Remote Sens. 2014, 52, 1142–1156. [Google Scholar] [CrossRef]
- Xiong, X.; Angal, A.; Butler, J.; Chen, H.; Chiang, K.; Lei, N.; Li, Y.; Twedt, K. Performance assessments and comparisons of S-NPP and NOAA-20 (JPSS-1) VIIRS on-orbit calibration. In Proceedings of the International Society for Optics and Photonics, Sensors, Systems, and Next-Generation Satellites XXII, Berlin, Germany, 11 October 2018; Volume 10785, p. 1078514. [Google Scholar]
- Barnes, W.L.; Salomonson, V.V. MODIS: A global imaging spectroradiometer for the Earth Observing System. In Proceedings of the International Society for Optics and Photonics, Optical Technologies for Aerospace Sensing: A Critical Review, Boston, MA, USA, 16 November 1992; Volume 10269, p. 102690G. [Google Scholar]
- Holben, B.; Kaufman, Y.; Kendall, J. NOAA-11 AVHRR visible and near-IR inflight calibration. Int. J. Remote Sens. 1990, 11, 1511–1519. [Google Scholar] [CrossRef]
- McClain, C.; Hooker, S.; Feldman, G.; Bontempi, P. Satellite data for ocean biology, biogeochemistry, and climate research. EOS Trans. Am. Geophys. Union 2006, 87, 337–343. [Google Scholar] [CrossRef]
- King, M.D.; Menzel, W.P.; Kaufman, Y.J.; Tanré, D.; Gao, B.C.; Platnick, S.; Ackerman, S.A.; Remer, L.A.; Pincus, R.; Hubanks, P.A. Cloud and aerosol properties, precipitable water, and profiles of temperature and water vapor from MODIS. IEEE Trans. Geosci. Remote Sens. 2003, 41, 442–458. [Google Scholar] [CrossRef] [Green Version]
- Justice, C.O.; Vermote, E.; Townshend, J.R.; Defries, R.; Roy, D.P.; Hall, D.K.; Salomonson, V.V.; Privette, J.L.; Riggs, G.; Strahler, A.; et al. The Moderate Resolution Imaging Spectroradiometer (MODIS): Land remote sensing for global change research. IEEE Trans. Geosci. Remote Sens. 1998, 36, 1228–1249. [Google Scholar] [CrossRef]
- Joint Polar Satellite System (JPSS) VIIRS Product Requirement Document (PRD); Technical Report, Revision D; Goddard Space Flight Center: Greenbelt, MD, USA, 2014.
- Oudrari, H.; McIntire, J.; Xiong, X.; Butler, J.; Ji, Q.; Schwarting, T.; Angal, A. An Overall Assessment of JPSS-2 VIIRS Radiometric Performance Based on Pre-launch Testing. Remote Sens. 2018, 10, 1921. [Google Scholar] [CrossRef]
- (JPSS) General Test Plan (GTP) Visible Infrared Radiometer Suite (VIIRS); Technical Report, Revision B; Raytheon: El Segundo, CA, USA, 2014.
- McIntire, J.; Moyer, D.; Oudrari, H.; Xiong, X. Pre-launch radiometric characterization of JPSS-1 VIIRS thermal emissive bands. Remote Sens. 2016, 8, 47. [Google Scholar] [CrossRef]
- Joint Polar Satellite System (JPSS) Visible Infrared Radiometer Suite (VIIRS) Sensor Data Records (SDR) Algorithm Theoretical Basis Document (ATBD); Technical Report; Goddard Space Flight Center: Greenbelt, MD, USA, 2013.
- McIntire, J.; Moyer, D.; Chang, T.; Oudrari, H.; Xiong, X. Pre-Launch JPSS-2 VIIRS Response versus Scan Angle Characterization. Remote Sens. 2017, 9, 1300. [Google Scholar] [CrossRef]
- Oudrari, H.; McIntire, J.; Xiong, X.; Butler, J.; Lee, S.; Lei, N.; Schwarting, T.; Sun, J. Prelaunch radiometric characterization and calibration of the S-NPP VIIRS sensor. IEEE Trans. Geoscie. Remote Sens. 2015, 53, 2195–2210. [Google Scholar] [CrossRef]
- Taylor, J.R. An Introduction to Error Analysis, 2nd ed.; University Science Books: New York, NY, USA, 1997. [Google Scholar]
- Taylor, B.N.; Kuyatt, C.E. Guidelines for Evaluating and Expressing the Uncertainty of NIST Measurement Results; US Department of Commerce: Washington, DC, USA, 1994.
- Monroy, E. Performance Verification Report—VIIRS J1 Emissive Band Calibration; Technical Report; Raytheon: El Segundo, CA, USA, 2015. [Google Scholar]
Figure 1.
Specified dynamic ranges shown for VIIRS thermal bands (black lines). Maximum and minimum scene temperatures used in the fitting as shown with blue lines. Saturation and low temperature signal to noise ratio (SNR) threshold are also shown (red lines).
Figure 1.
Specified dynamic ranges shown for VIIRS thermal bands (black lines). Maximum and minimum scene temperatures used in the fitting as shown with blue lines. Saturation and low temperature signal to noise ratio (SNR) threshold are also shown (red lines).

Figure 2.
The standard deviation of the six thermistors in the on-board blackbody (OBCBB) plotted versus instrument temperature (with JPSS-1 VIIRS in red and JPSS-2 VIIRS in blue).
Figure 2.
The standard deviation of the six thermistors in the on-board blackbody (OBCBB) plotted versus instrument temperature (with JPSS-1 VIIRS in red and JPSS-2 VIIRS in blue).

Figure 3.
The offset corrected detector response (a) and the radiance residual in % (b) shown versus path difference radiance. The symbols in (a) represent measured data and the lines indicate quadratic fits. The measured data was taken from nominal plateau, HAM side A, electronics side A, FPA temperature 82 K using detector 9 (using BCS data).

Figure 4.
The offset corrected detector response (a) and the radiance residual in % (b) shown versus path difference radiance. The symbols in (a) represent measured data and the lines indicate quadratic fits. The measured data was taken from nominal plateau, HAM side A, electronics side A, FPA temperature 82 K using detector 9 (using BCS data).

Figure 5.
Plots show the measured NEdT as a function of scene temperature for the MWIR bands (a) and for the LWIR bands (b). Measured data was taken from nominal plateau, HAM side A, electronics side A, FPA temperature 82 K using detector 9.
Figure 5.
Plots show the measured NEdT as a function of scene temperature for the MWIR bands (a) and for the LWIR bands (b). Measured data was taken from nominal plateau, HAM side A, electronics side A, FPA temperature 82 K using detector 9.

Figure 6.
Plots show the measured uniformity metric as a function of scene temperature for the MWIR bands (a) and for the LWIR bands (b). Measured data was taken from nominal plateau, HAM side A, electronics side A, FPA temperature 82 K using the worst case detector.
Figure 6.
Plots show the measured uniformity metric as a function of scene temperature for the MWIR bands (a) and for the LWIR bands (b). Measured data was taken from nominal plateau, HAM side A, electronics side A, FPA temperature 82 K using the worst case detector.

Figure 7.
Plots show the modeled total temperature uncertainty as a function of scene temperature for the MWIR bands (a) and for the LWIR bands (b).
Figure 7.
Plots show the modeled total temperature uncertainty as a function of scene temperature for the MWIR bands (a) and for the LWIR bands (b).


Table 1.
VIIRS thermal bands with center wavelengths, bandwidths, gain mode, spatial resolution at nadir, upper and lower dynamic range limits, and typical scene temperature as defined by the sensor specification [9]. SG, HG, and LG refer to single gain, high gain, and low gain, respectively.
Table 1.
VIIRS thermal bands with center wavelengths, bandwidths, gain mode, spatial resolution at nadir, upper and lower dynamic range limits, and typical scene temperature as defined by the sensor specification [9]. SG, HG, and LG refer to single gain, high gain, and low gain, respectively.
| Band | Gain Mode | Wavelength [m] | Bandwidth [m] | Resolution [m] | [K] | [K] | [K] |
|---|---|---|---|---|---|---|---|
| I4 | SG | 3.740 | 0.380 | 375 | 210 | 270 | 353 |
| I5 | SG | 11.450 | 1.900 | 375 | 190 | 210 | 340 |
| M12 | SG | 3.700 | 0.180 | 750 | 230 | 270 | 353 |
| M13 | HG | 4.050 | 0.155 | 750 | 230 | 300 | 343 |
| M13 | LG | 4.050 | 0.155 | 750 | 343 | 380 | 634 |
| M14 | SG | 8.550 | 0.300 | 750 | 190 | 270 | 336 |
| M15 | SG | 10.763 | 1.000 | 750 | 190 | 300 | 340 |
| M16 | SG | 12.013 | 0.950 | 750 | 190 | 300 | 340 |
Table 2.
Radiometric testing performed for JPSS-2 VIIRS emissive bands during environmental testing [11]. C, N, and H refer to cold, nominal, and hot instrument plateaus; T refers to transitions between instrument plateaus. A and B denote the primary and redundant electronic hardware configuration settings.
| Test | Instrument | Electronics | |||||
|---|---|---|---|---|---|---|---|
| Type | Plateaus | Sides | [K] | [K] | [K] | [K] | [V] |
| Performance | C, N, H | A, B | 190–345 | 294–375 | 292 | 82 | 28 |
| Performance | C, N | A | 190–345 | 294–375 | 292 | 80 | 28 |
| Performance | N | A | 190–345 | 294–375 | 292 | 78 | 28 |
| Performance | C, N, H | A, B | 345 | 388–763 | 292 | 82 | 28 |
| Performance | C, N, H | A | 300 | 294 | Amb-315 | 82 | 28 |
| Stability | C, N, H | A, B | 270 | 294 | 292 | 82 | 28 |
| Stability | T | A | 270 | 294 | 292 | 82 | 28 |
| Stability | C, H | A, B | 270 | 294 | 292 | 82 | 27–32 |
| Stability | N | A | 270 | 294 | 292 | 78–82 | 28 |
Table 3.
Averaged gains () over all detectors and half-angle mirror (HAM) sides measured during radiometric performance testing for all instrument temperature plateaus, electronics sides (A or B), and focal plane temperatures using BCS data.
Table 3.
Averaged gains () over all detectors and half-angle mirror (HAM) sides measured during radiometric performance testing for all instrument temperature plateaus, electronics sides (A or B), and focal plane temperatures using BCS data.
| Cold | Cold | Nominal | Nominal | Nominal | Hot | Cold | Nominal | Hot | |
|---|---|---|---|---|---|---|---|---|---|
| Band | A | A | A | A | A | A | B | B | B |
| 80 K | 82 K | 78 K | 80 K | 82 K | 82 K | 82 K | 82 K | 82 K | |
| I4 | 1130.7 | 1129.1 | 1131.1 | 1132.0 | 1130.2 | 1135.2 | 1124.7 | 1130.4 | 1131.7 |
| I5 | 175.8 | 163.4 | 185.4 | 175.8 | 163.4 | 165.8 | 162.3 | 164.2 | 166.5 |
| M12 | 1112.0 | 1111.2 | 1111.6 | 1113.3 | 1112.8 | 1117.9 | 1109.1 | 1114.0 | 1115.4 |
| M13 HG | 641.1 | 640.5 | 641.7 | 641.9 | 640.8 | 644.0 | 639.7 | 641.2 | 643.5 |
| M13 LG | 6.9 | 6.9 | – | – | 6.9 | – | 6.9 | 6.9 | 6.9 |
| M14 | 191.6 | 172.5 | 205.8 | 190.6 | 171.0 | 169.8 | 169.9 | 168.6 | 167.1 |
| M15 | 207.3 | 199.4 | 213.3 | 206.7 | 199.0 | 200.6 | 198.5 | 199.9 | 201.2 |
| M16A | 237.1 | 222.4 | 247.6 | 236.4 | 221.9 | 225.2 | 220.9 | 223.6 | 226.1 |
| M16B | 242.9 | 228.0 | 253.7 | 242.3 | 227.5 | 230.7 | 226.5 | 229.0 | 231.8 |
Table 4.
Band maximum , , and as well as the band average measured during radiometric performance testing at the nominal instrument temperature plateau, electronics sides A, and 82 K focal plane temperature compared to their respective sensor specifications [9].
Table 4.
Band maximum , , and as well as the band average measured during radiometric performance testing at the nominal instrument temperature plateau, electronics sides A, and 82 K focal plane temperature compared to their respective sensor specifications [9].
| Band | [%] | NEdT at [K] | [K] | [K] | ||||
|---|---|---|---|---|---|---|---|---|
| Meas | Spec | Meas | Spec | Meas | Spec | Meas | Spec | |
| I4 | 0.1 | 1.0 | 0.402 | 2.500 | 356 | 353 | 232 | 210 |
| I5 | 0.1 | 1.0 | 0.460 | 1.500 | 380 | 340 | 167 | 190 |
| M12 | 0.2 | 1.0 | 0.163 | 0.396 | 360 | 353 | 221 | 230 |
| M13 HG | 0.2 | 1.0 | 0.052 | 0.107 | 363 | 343 | 214 | 230 |
| M13 LG | 0.1 | 1.0 | 0.263 | 0.423 | 652 | 634 | 274 | 343 |
| M14 | 0.8 | 1.0 | 0.062 | 0.091 | 352 | 336 | 196 | 190 |
| M15 | 0.2 | 1.0 | 0.029 | 0.070 | 350 | 340 | 173 | 190 |
| M16A | 0.1 | 1.0 | 0.040 | 0.072 | 356 | 340 | 154 | 190 |
| M16B | 0.2 | 1.0 | 0.044 | 0.072 | 354 | 340 | 154 | 190 |
Table 5.
Estimated uncertainty (% radiance) compared to the sensor specifications [9].
Table 5.
Estimated uncertainty (% radiance) compared to the sensor specifications [9].
| Band | 190 K | 230 K | 267 K | 270 K | 310 K | 340 K | |
|---|---|---|---|---|---|---|---|
| I4 | Spec | – | – | 5.00 | – | – | – |
| Meas | – | – | 1.83 | – | – | – | |
| I5 | Spec | – | – | 2.50 | – | – | – |
| Meas | – | – | 0.34 | – | – | – | |
| M12 | Spec | – | 7.00 | – | 0.70 | 0.70 | 0.70 |
| Meas | – | 8.40 | – | 0.69 | 0.34 | 0.33 | |
| M13 | Spec | – | 5.70 | – | 0.70 | 0.70 | 0.70 |
| Meas | – | 5.50 | – | 0.57 | 0.28 | 0.27 | |
| M14 | Spec | 12.30 | 2.40 | – | 0.60 | 0.40 | 0.50 |
| Meas | 2.39 | 0.63 | – | 0.28 | 0.20 | 0.18 | |
| M15 | Spec | 2.10 | 0.60 | – | 0.40 | 0.40 | 0.40 |
| Meas | 1.09 | 0.35 | – | 0.19 | 0.14 | 0.13 | |
| M16A | Spec | 1.60 | 0.60 | – | 0.40 | 0.40 | 0.40 |
| Meas | 0.78 | 0.26 | – | 0.15 | 0.12 | 0.11 | |
| M16B | Spec | 1.60 | 0.60 | – | 0.40 | 0.40 | 0.40 |
© 2019 by the authors. Licensee MDPI, Basel, Switzerland. This article is an open access article distributed under the terms and conditions of the Creative Commons Attribution (CC BY) license (http://creativecommons.org/licenses/by/4.0/).
Share and Cite
MDPI and ACS Style
McIntire, J.; Moyer, D.; Oudrari, H.; Xiong, X. Pre-launch Radiometric Characterization of JPSS-2 VIIRS Thermal Emissive Bands. Remote Sens. 2019, 11, 732. https://0-doi-org.brum.beds.ac.uk/10.3390/rs11060732
AMA Style
McIntire J, Moyer D, Oudrari H, Xiong X. Pre-launch Radiometric Characterization of JPSS-2 VIIRS Thermal Emissive Bands. Remote Sensing. 2019; 11(6):732. https://0-doi-org.brum.beds.ac.uk/10.3390/rs11060732
Chicago/Turabian StyleMcIntire, Jeff, David Moyer, Hassan Oudrari, and Xiaoxiong Xiong. 2019. "Pre-launch Radiometric Characterization of JPSS-2 VIIRS Thermal Emissive Bands" Remote Sensing 11, no. 6: 732. https://0-doi-org.brum.beds.ac.uk/10.3390/rs11060732
Note that from the first issue of 2016, this journal uses article numbers instead of page numbers. See further details here.