Mapping Paddy Rice Using Sentinel-1 SAR Time Series in Camargue, France

 , , , ,
  ,
, 
Abstract
:
1. Introduction
2. Materials
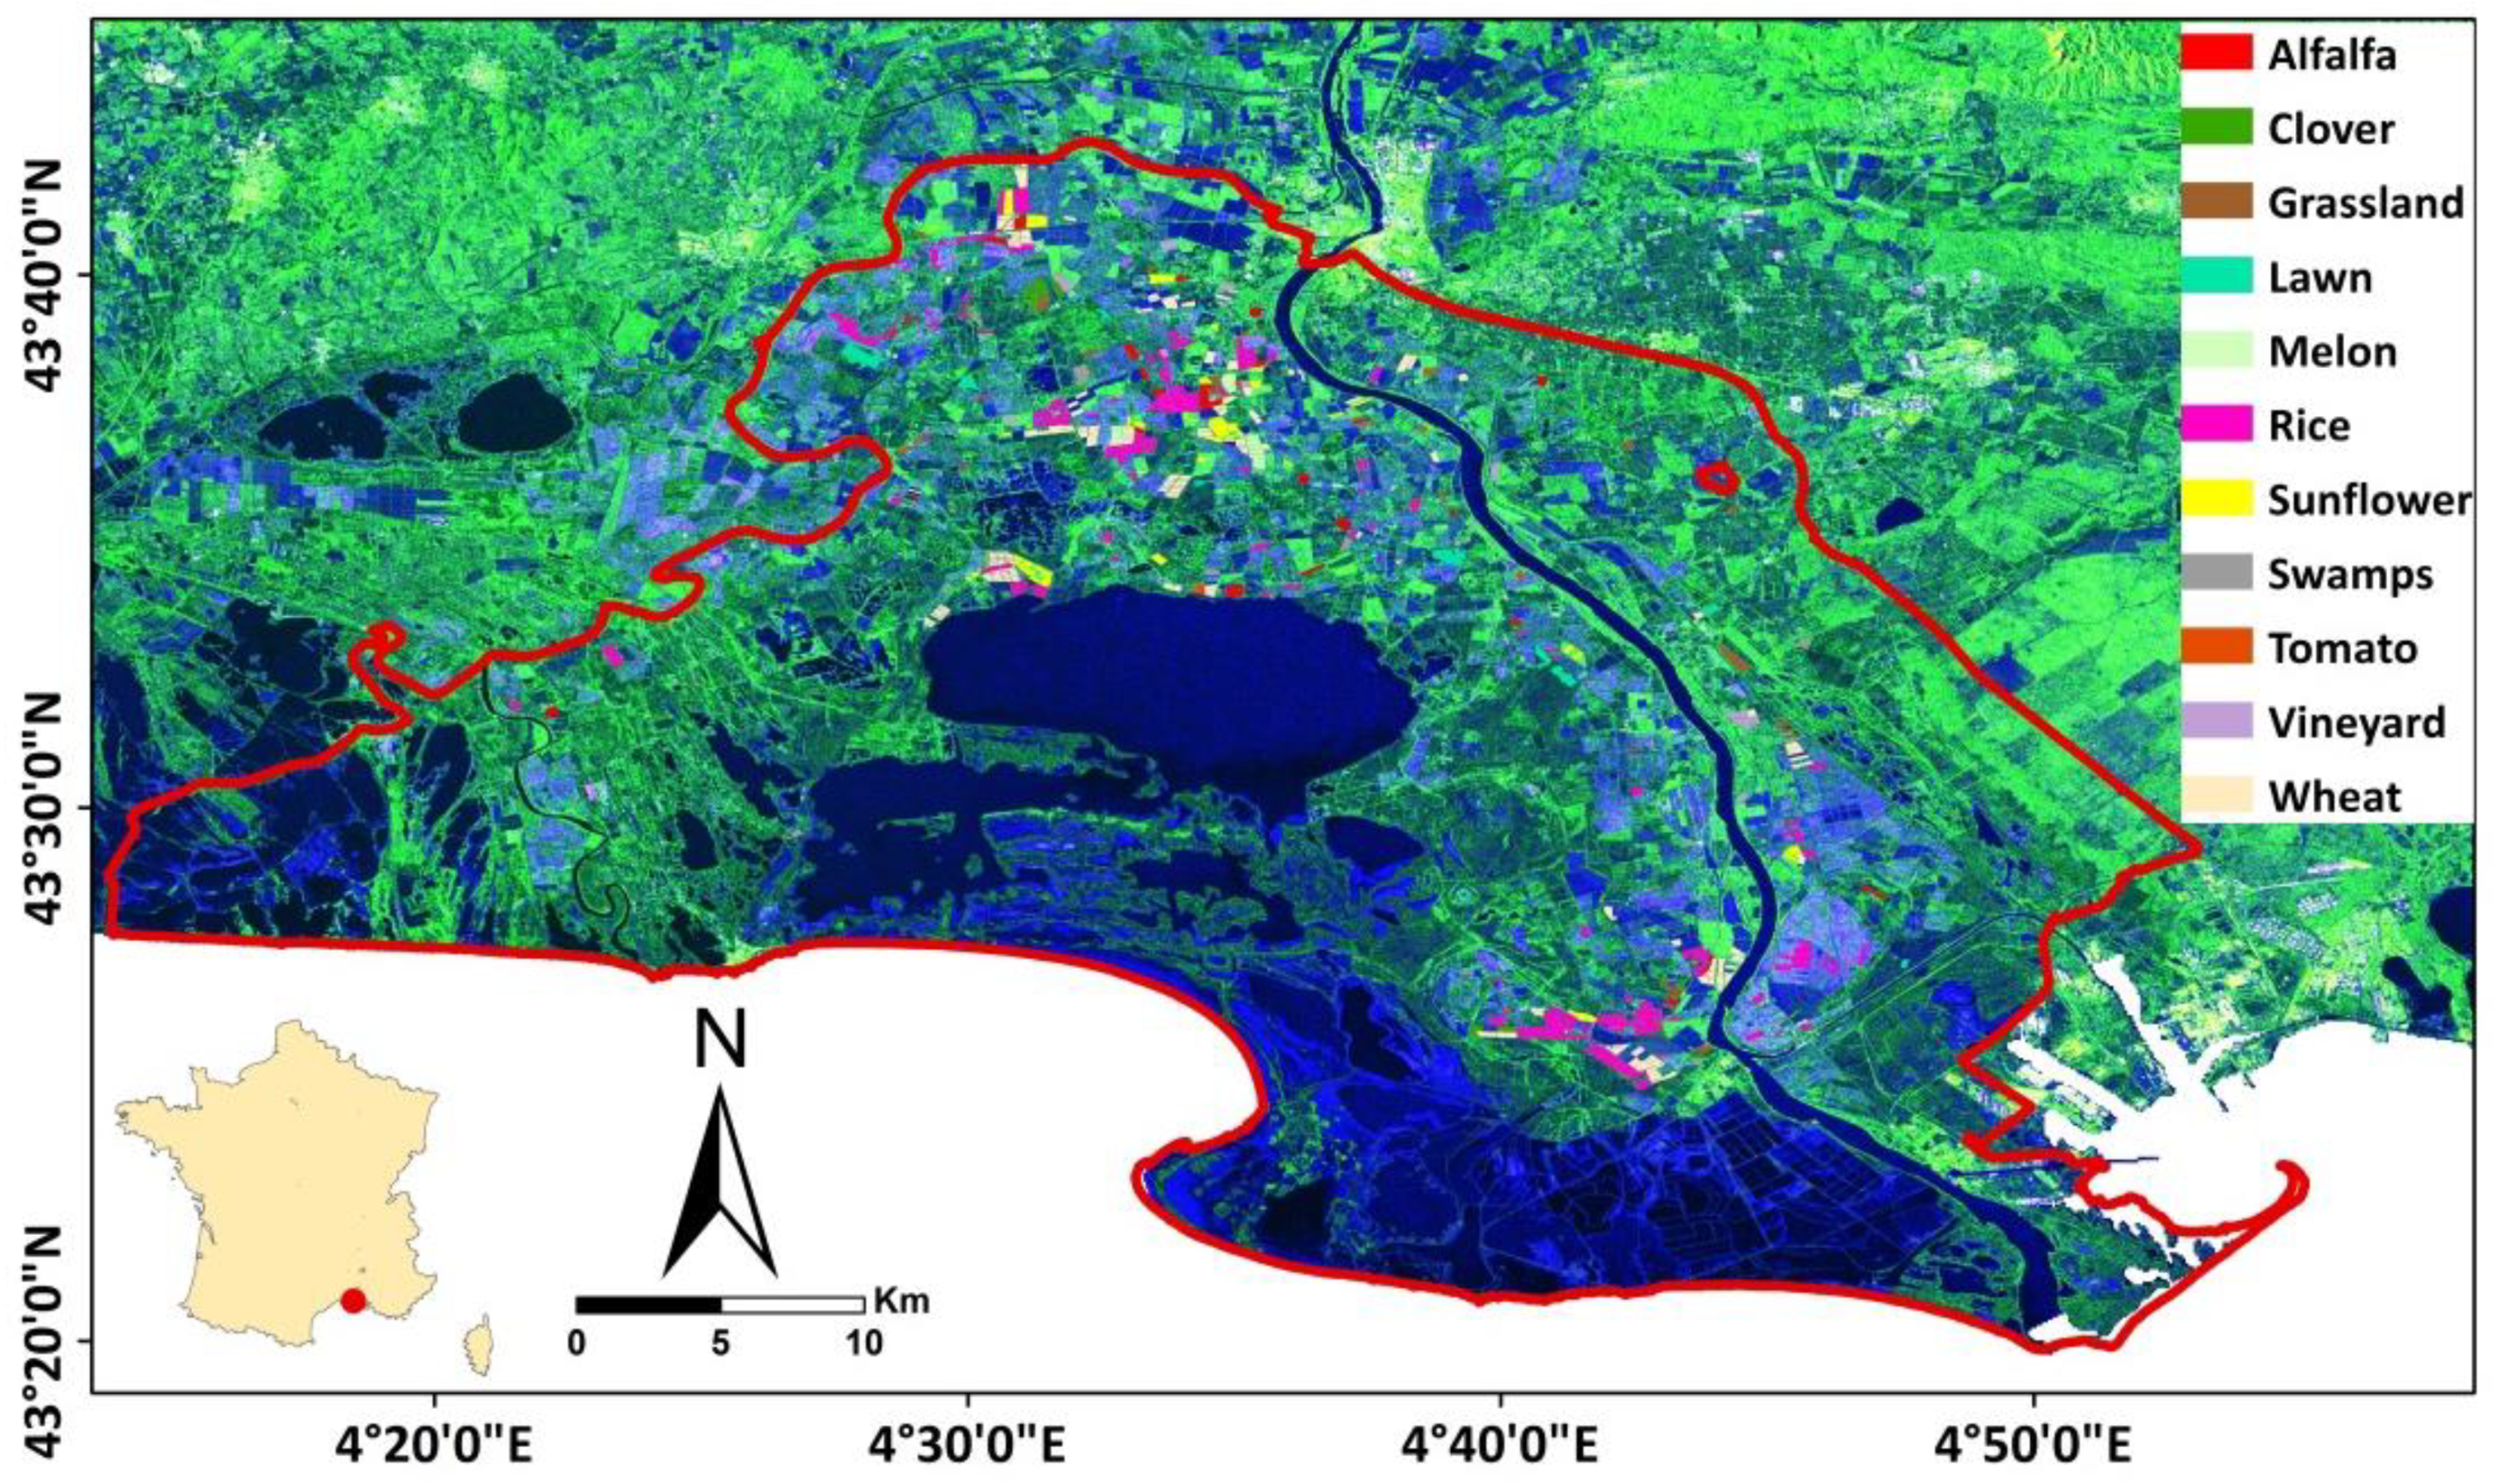
2.1. Study Site
2.2. Ground Data
2.3. SAR Data
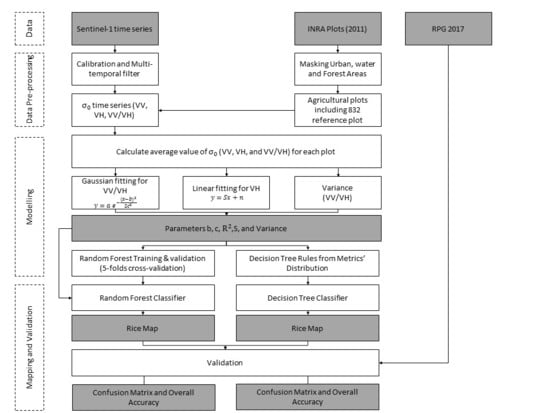
3. Methodology
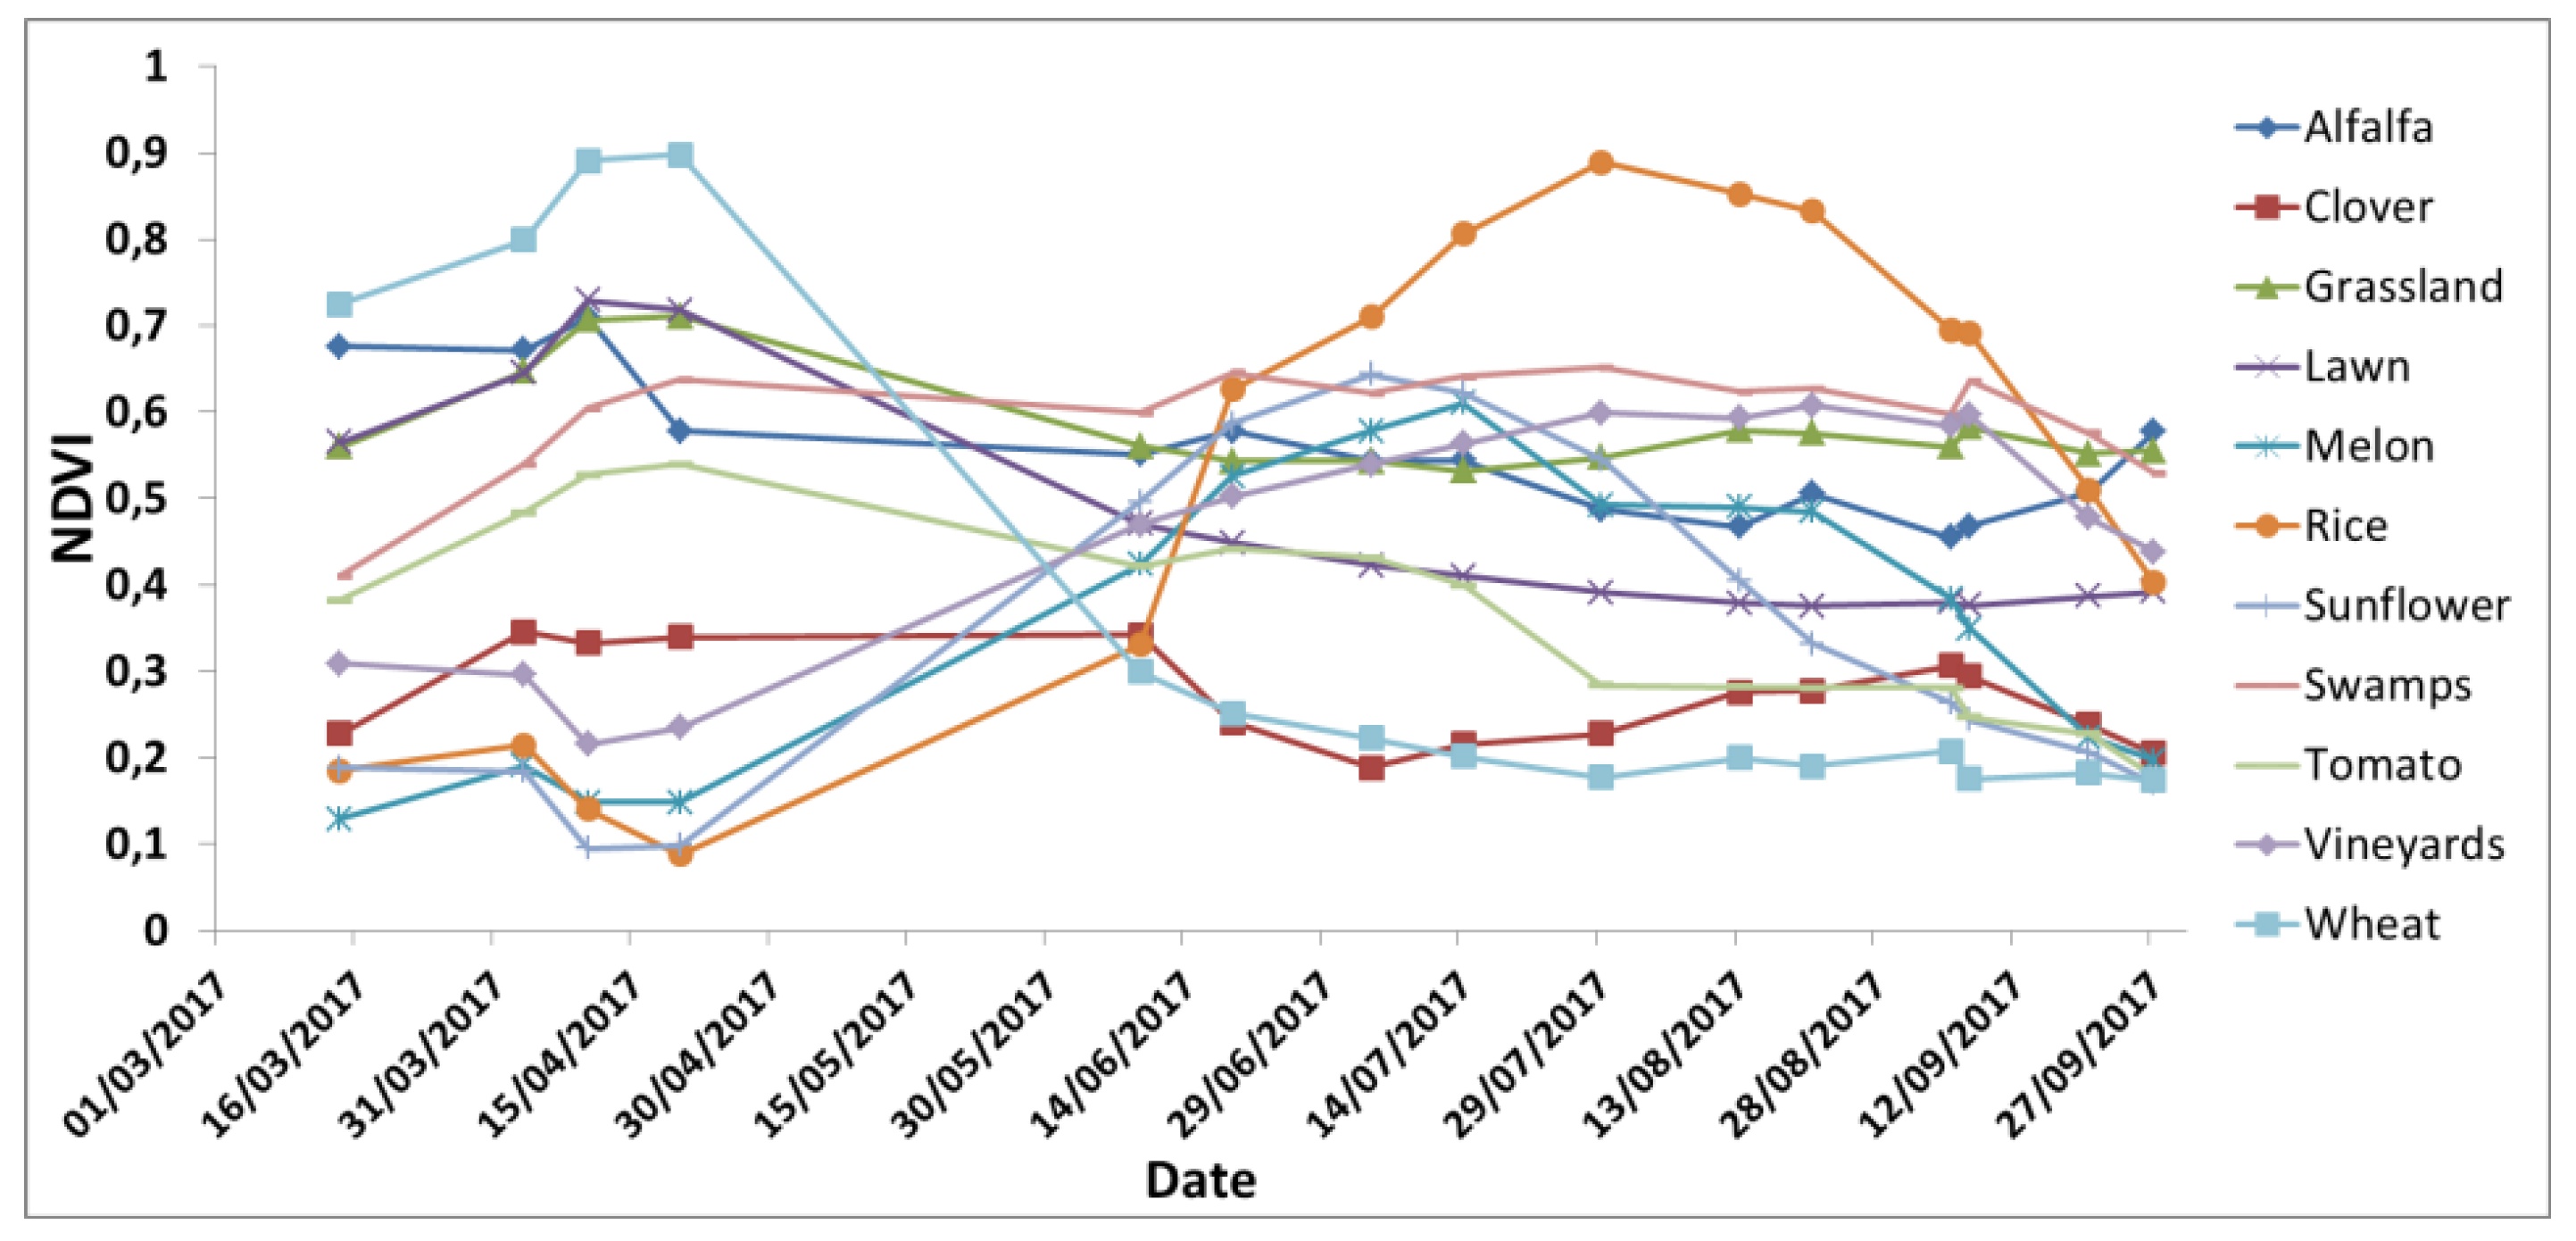
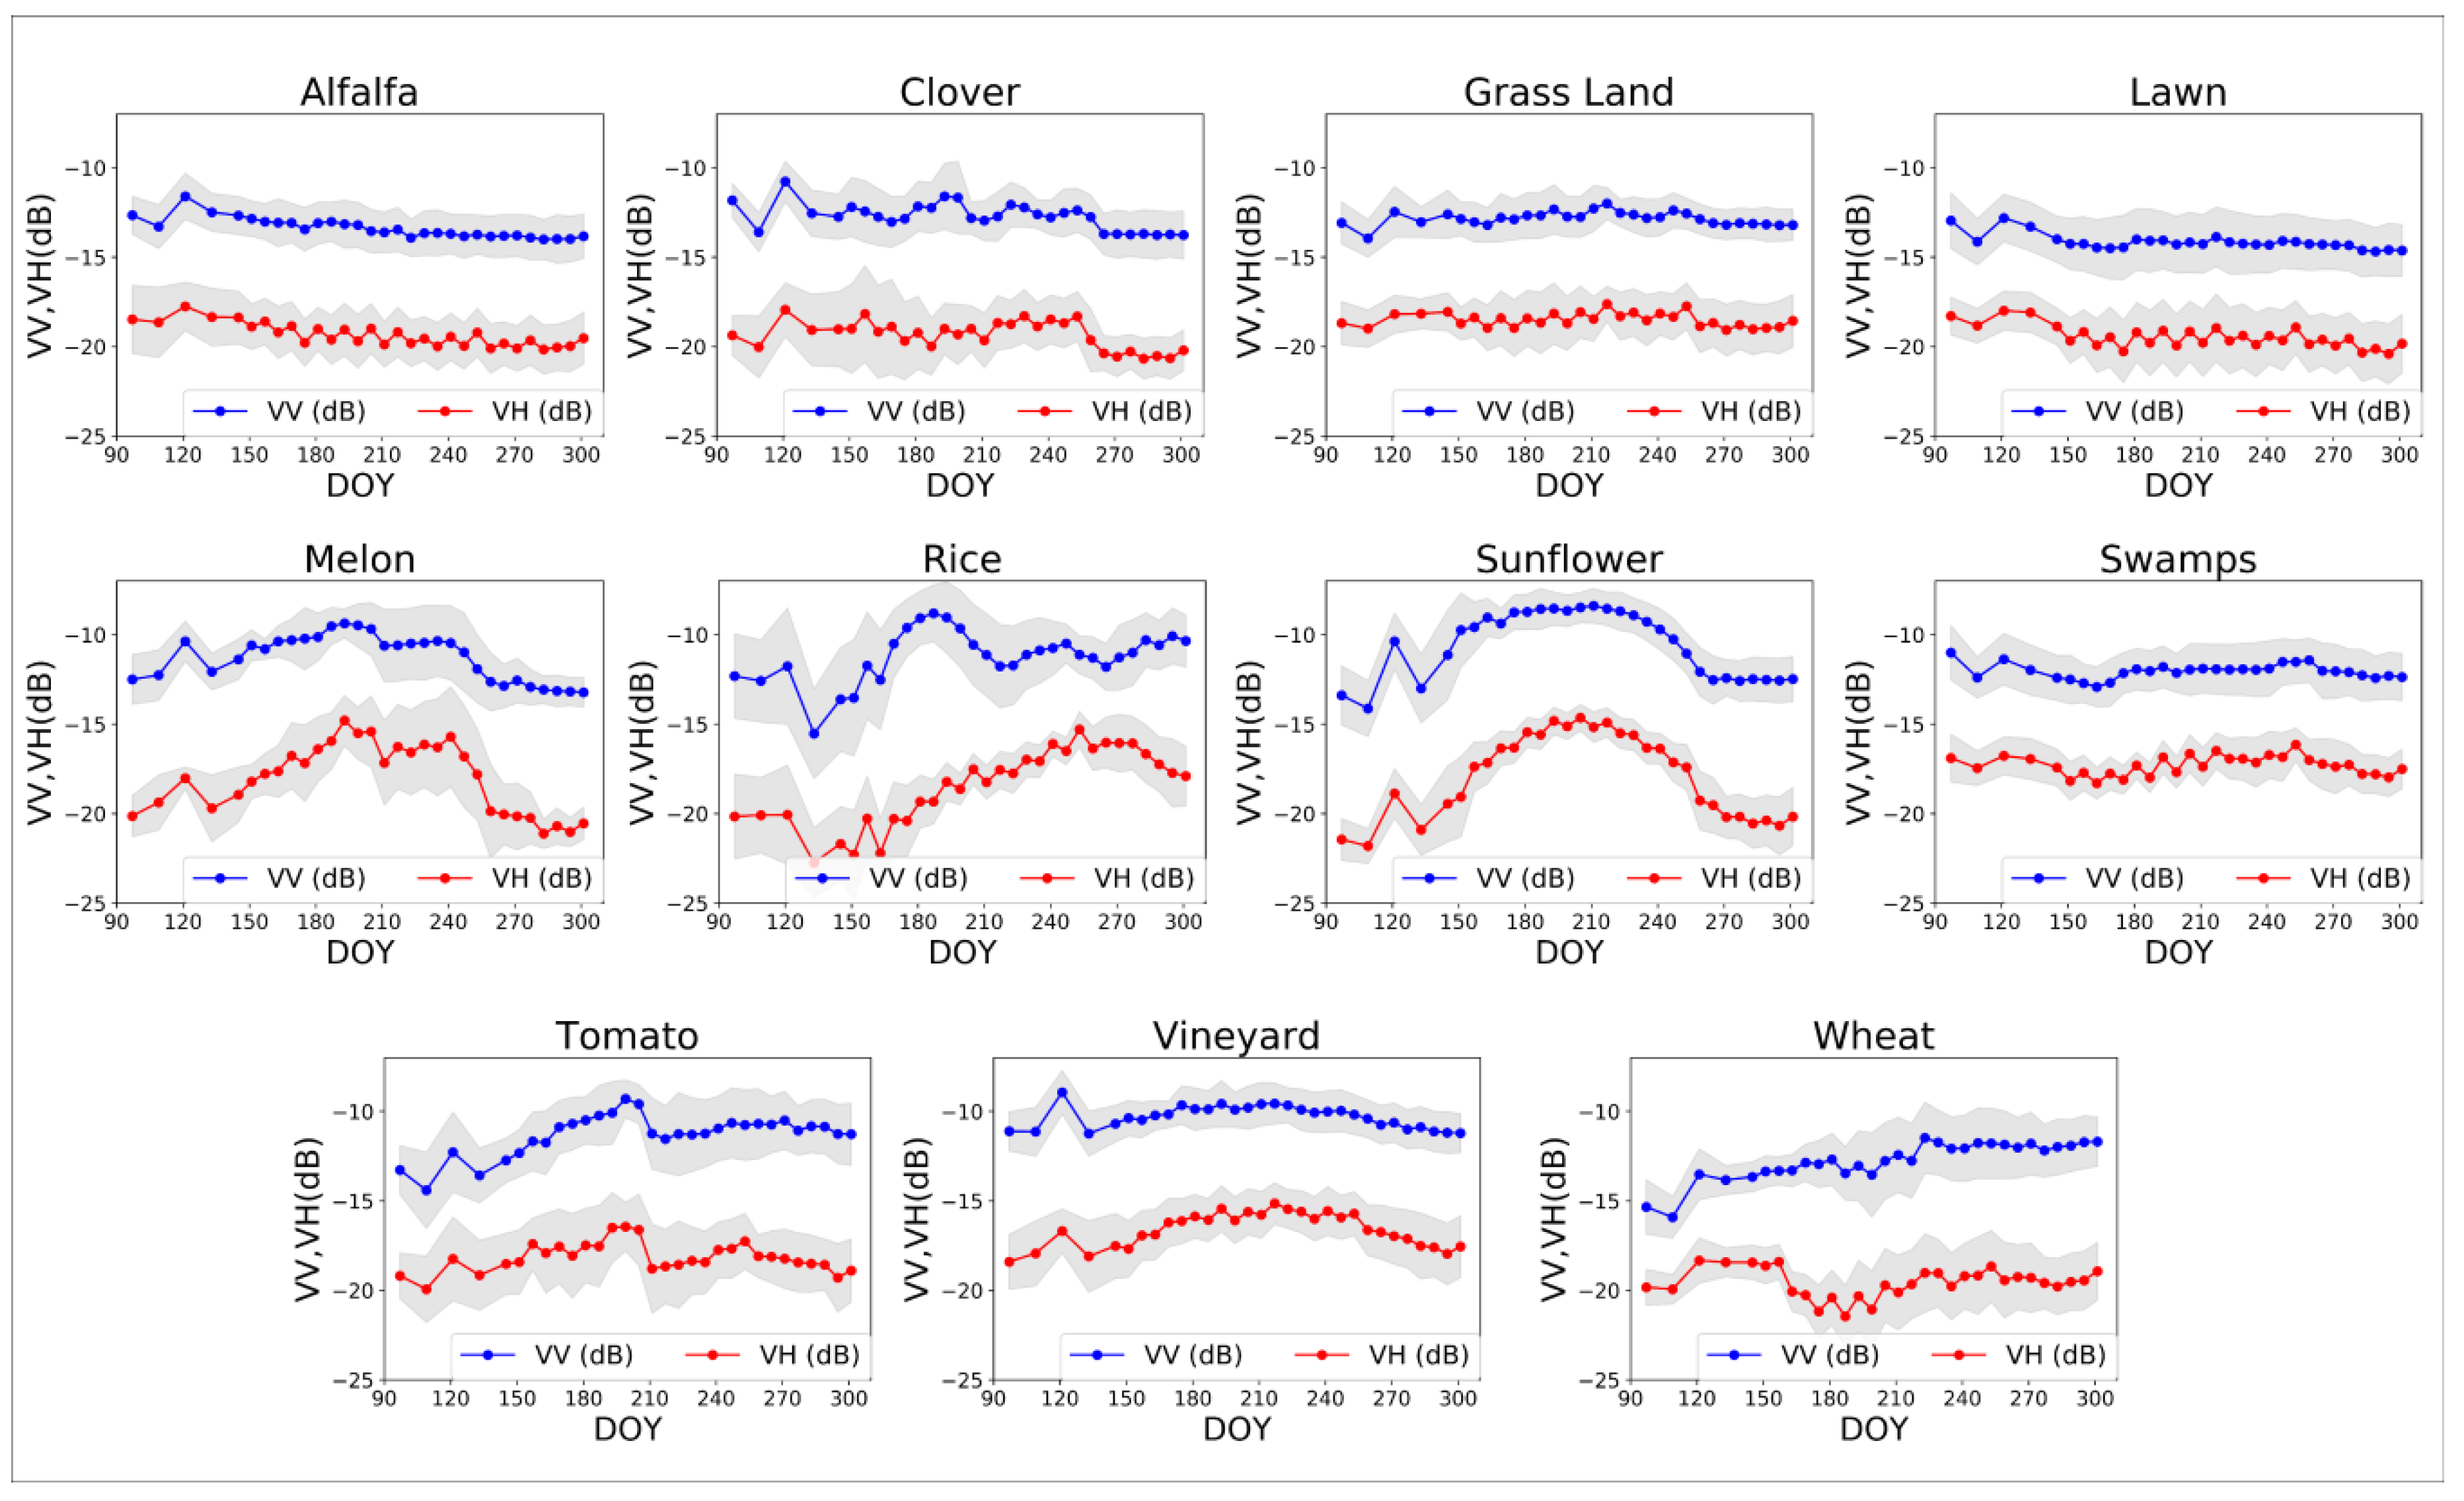
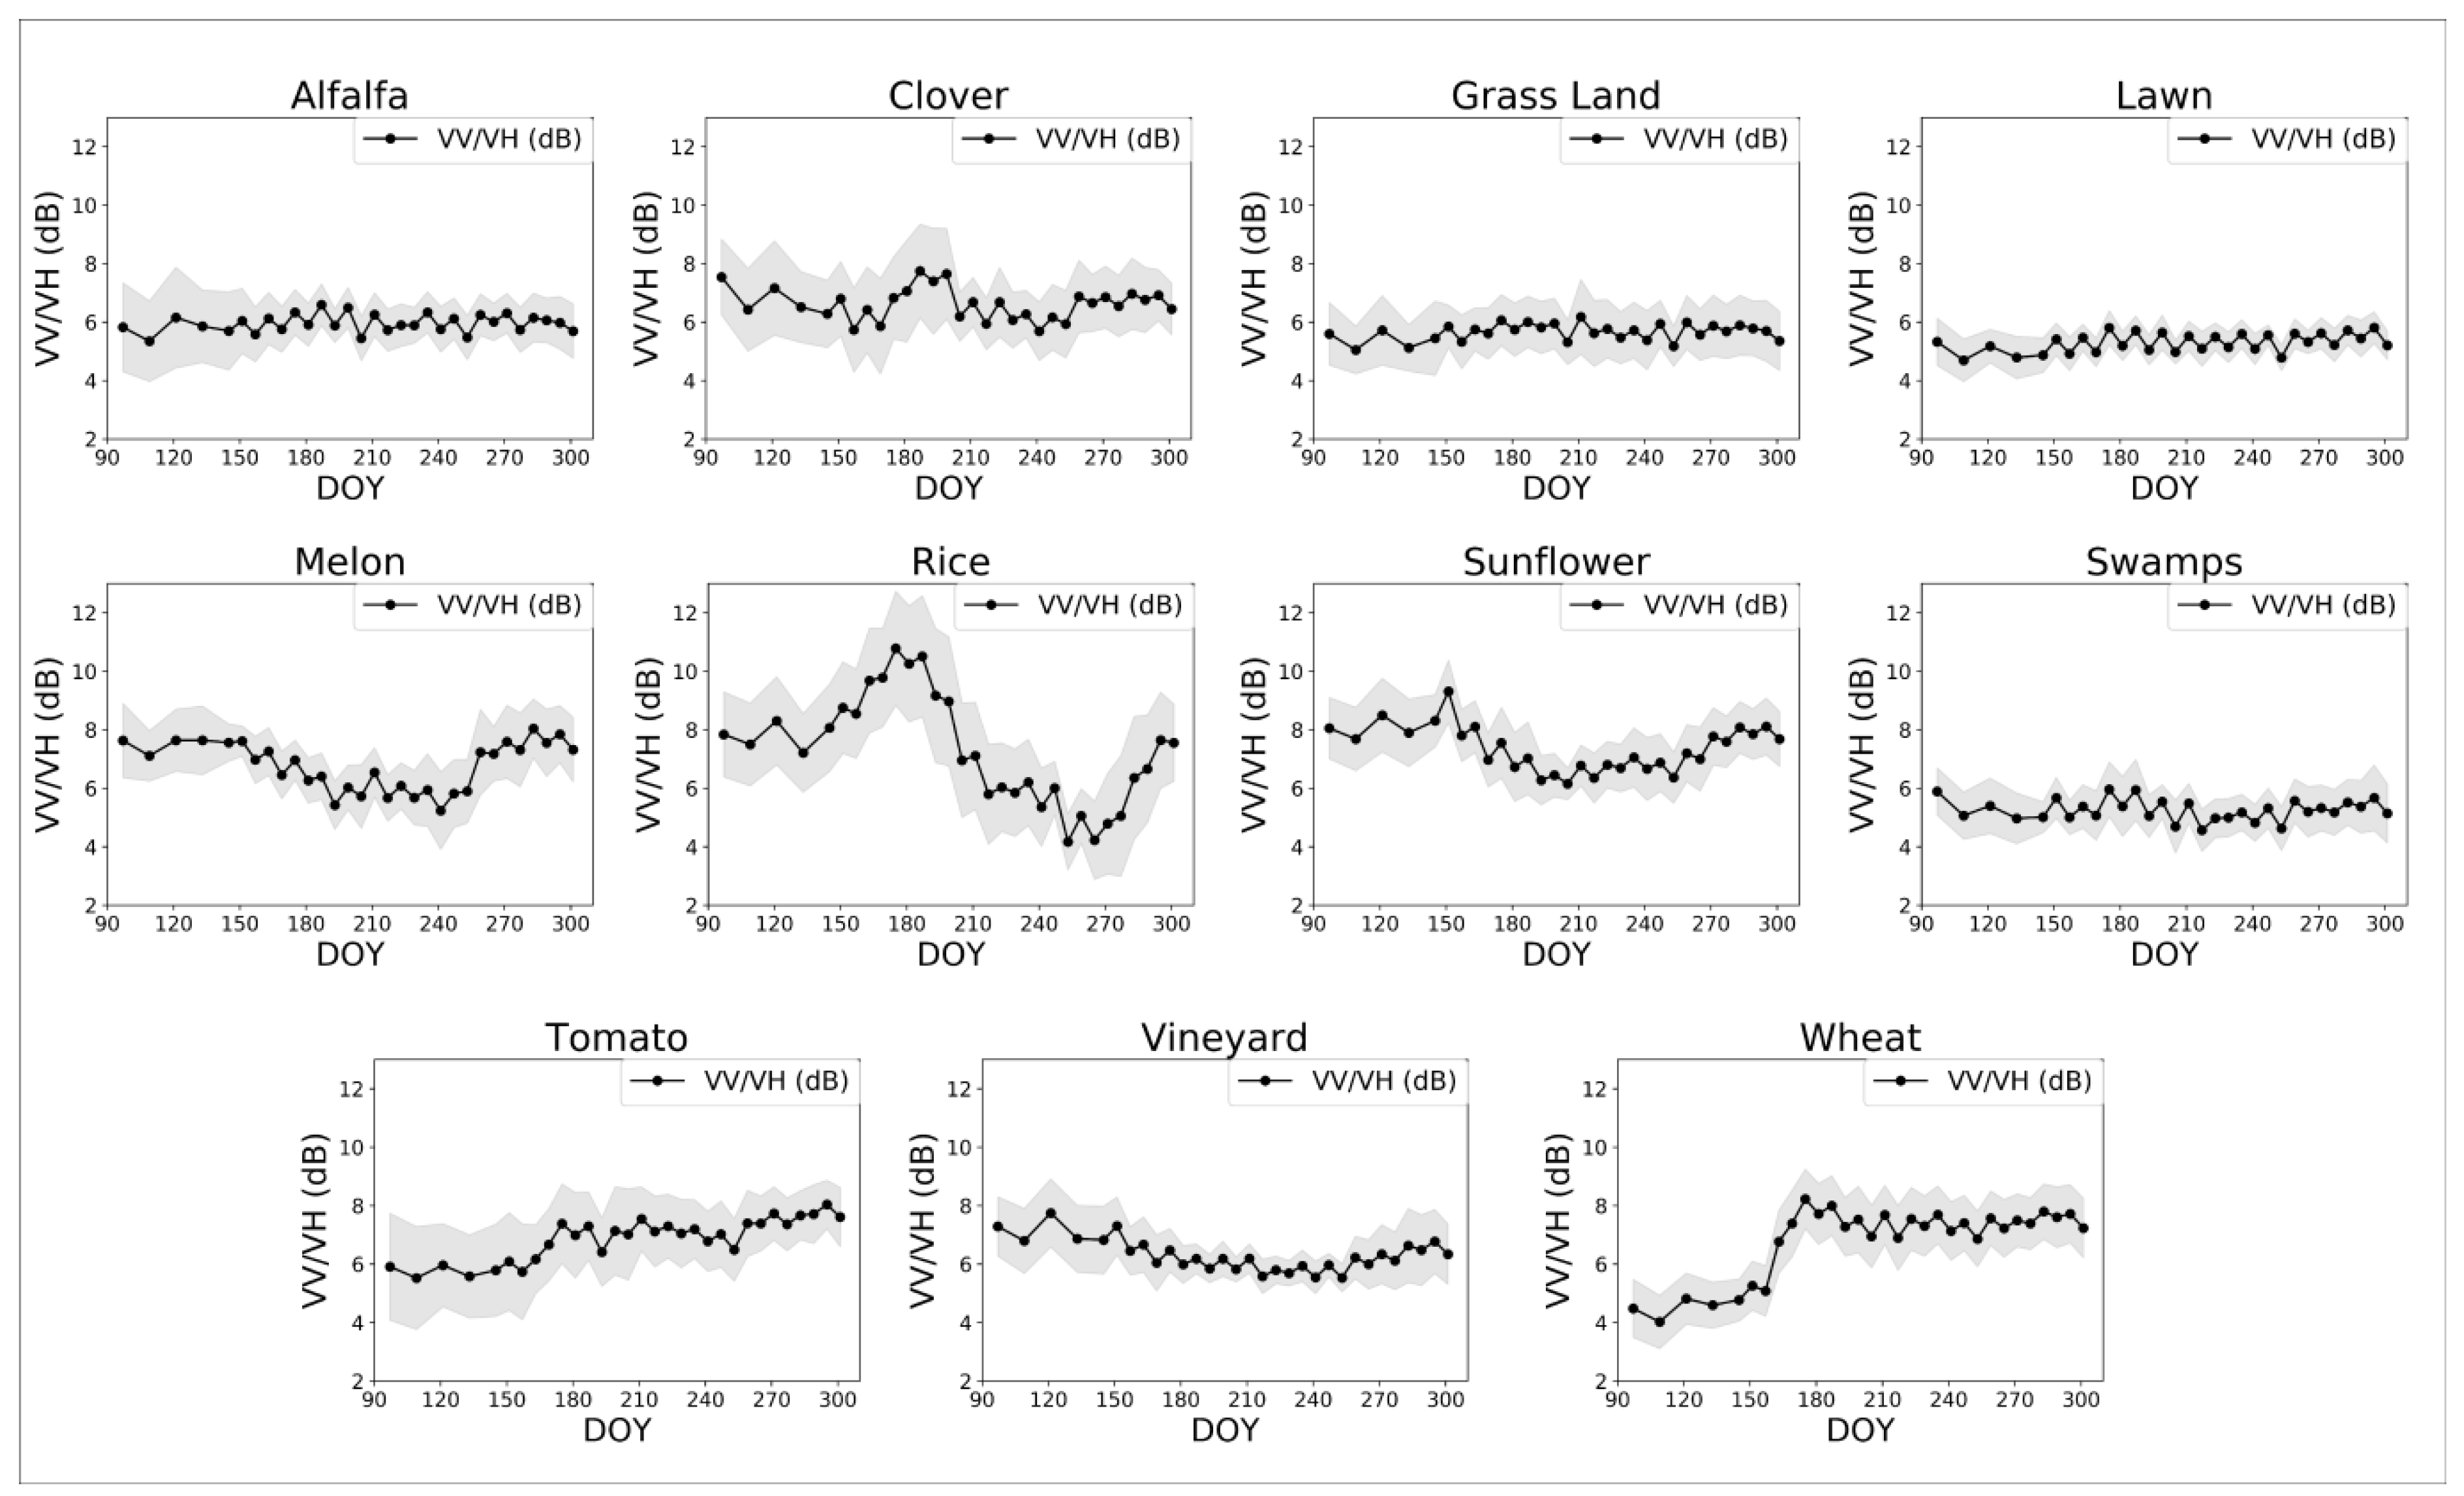
3.1. Temporal Behavior of σ° SAR Backscattering over Agricultural Plots
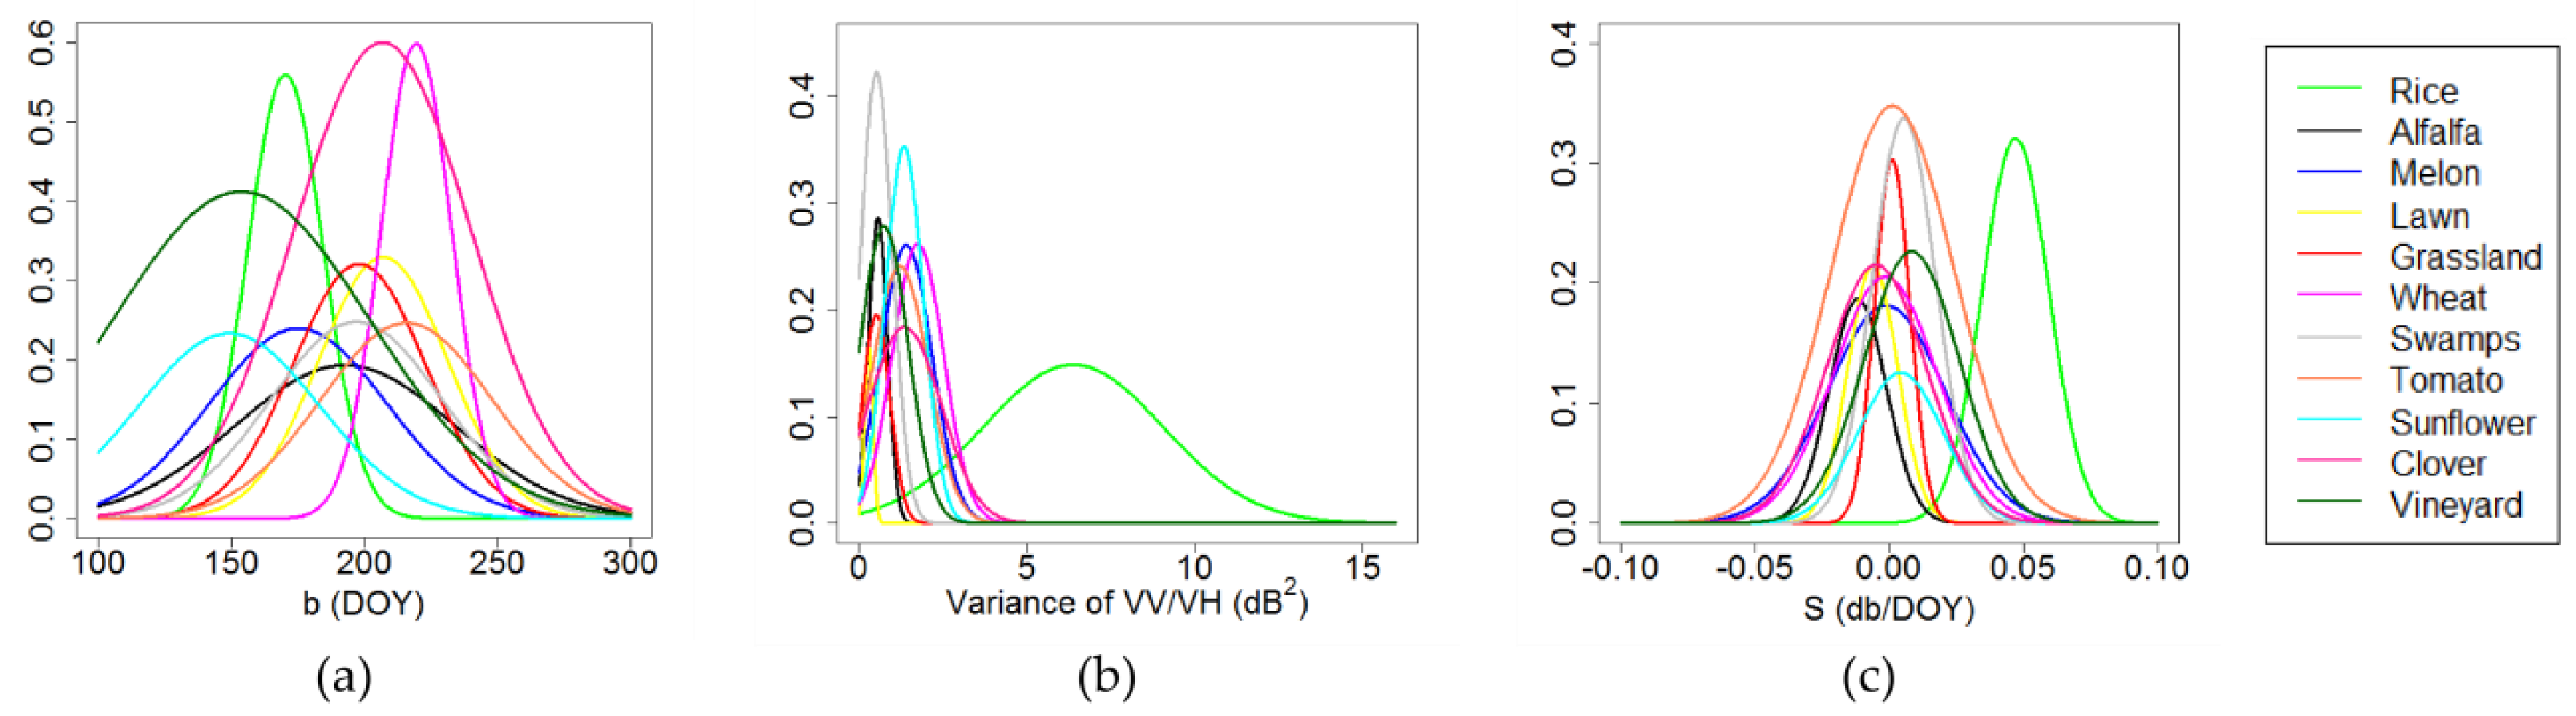
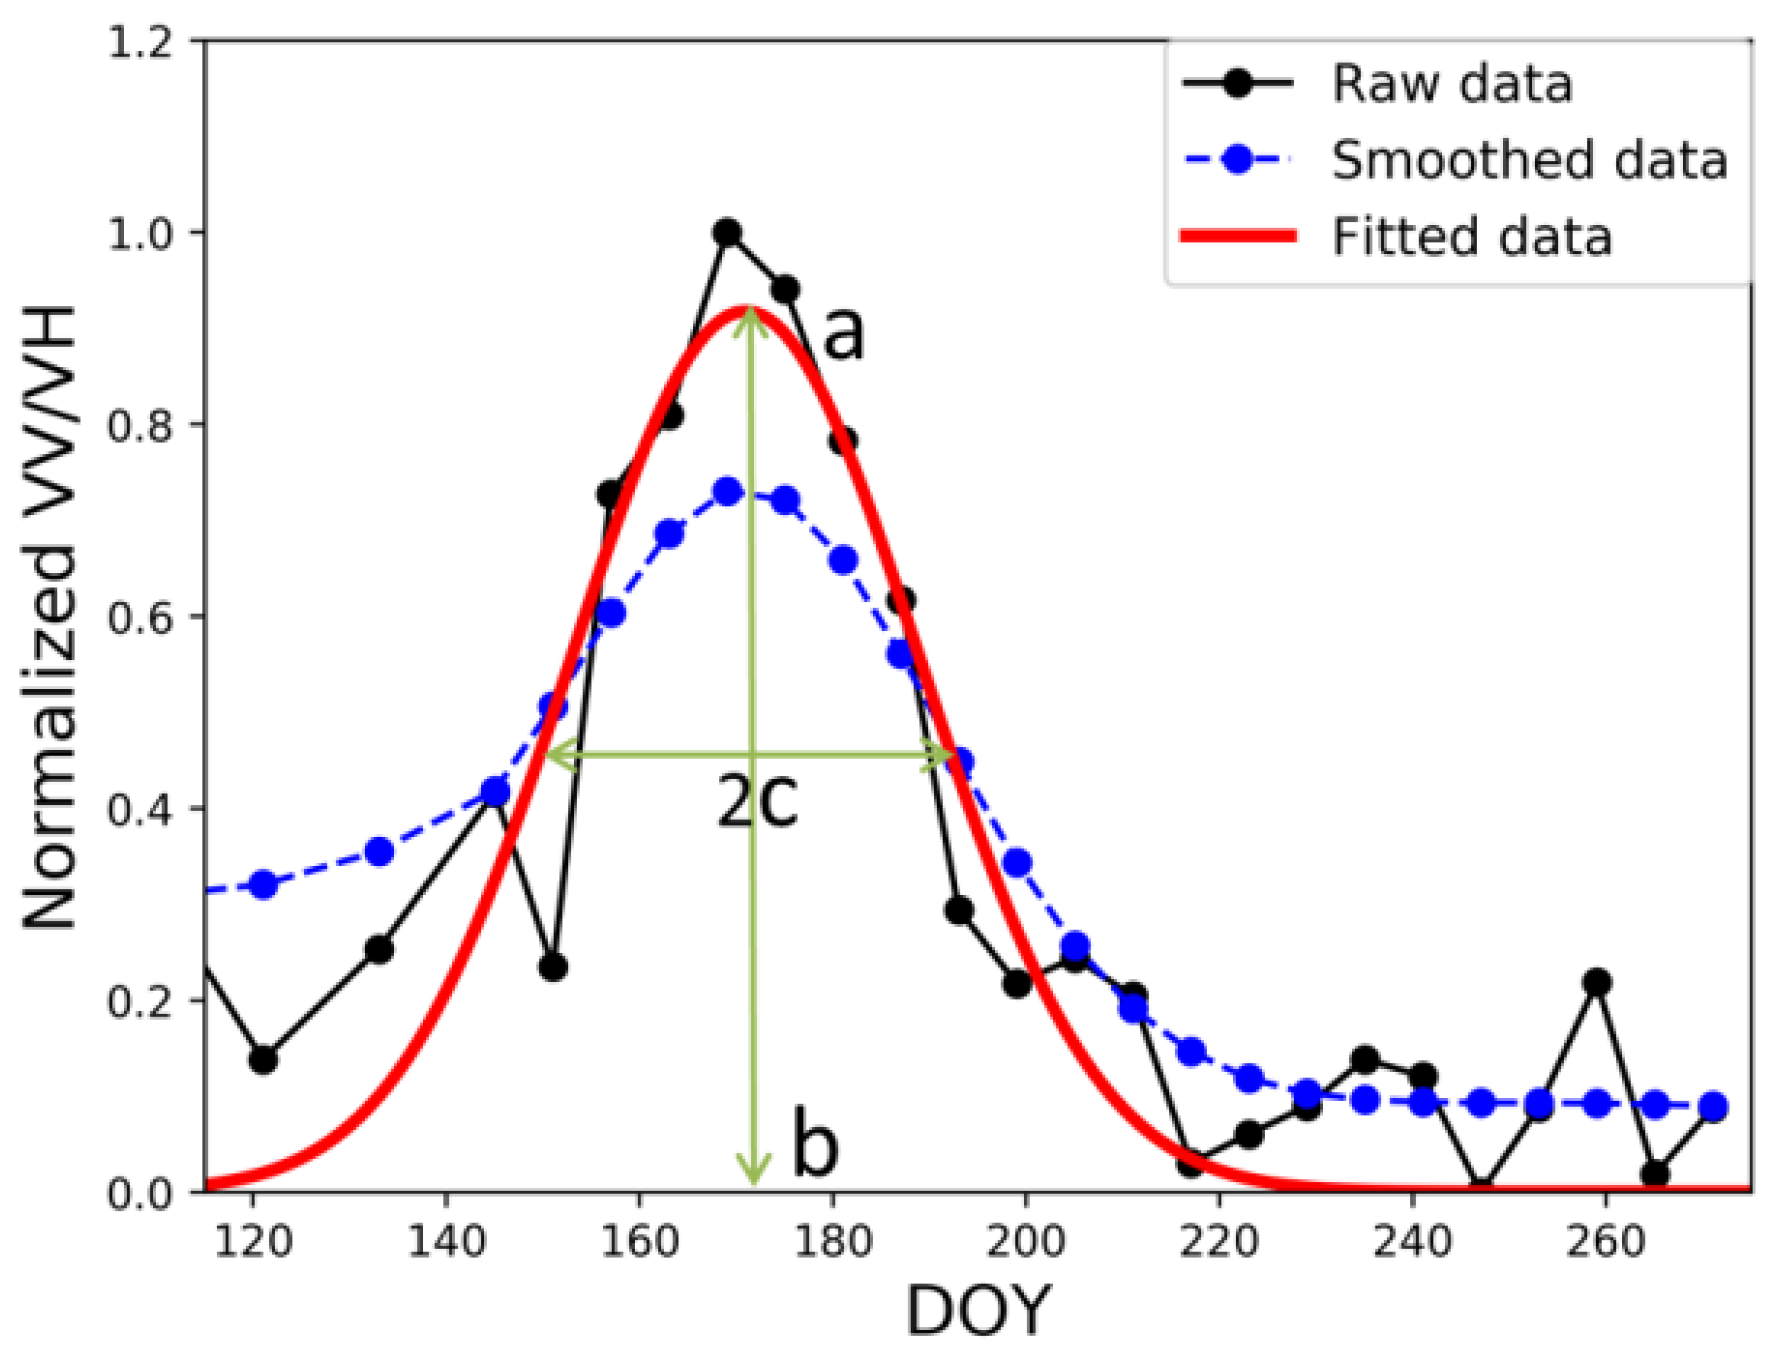
3.1.1. Gaussian Fitting of VV/VH
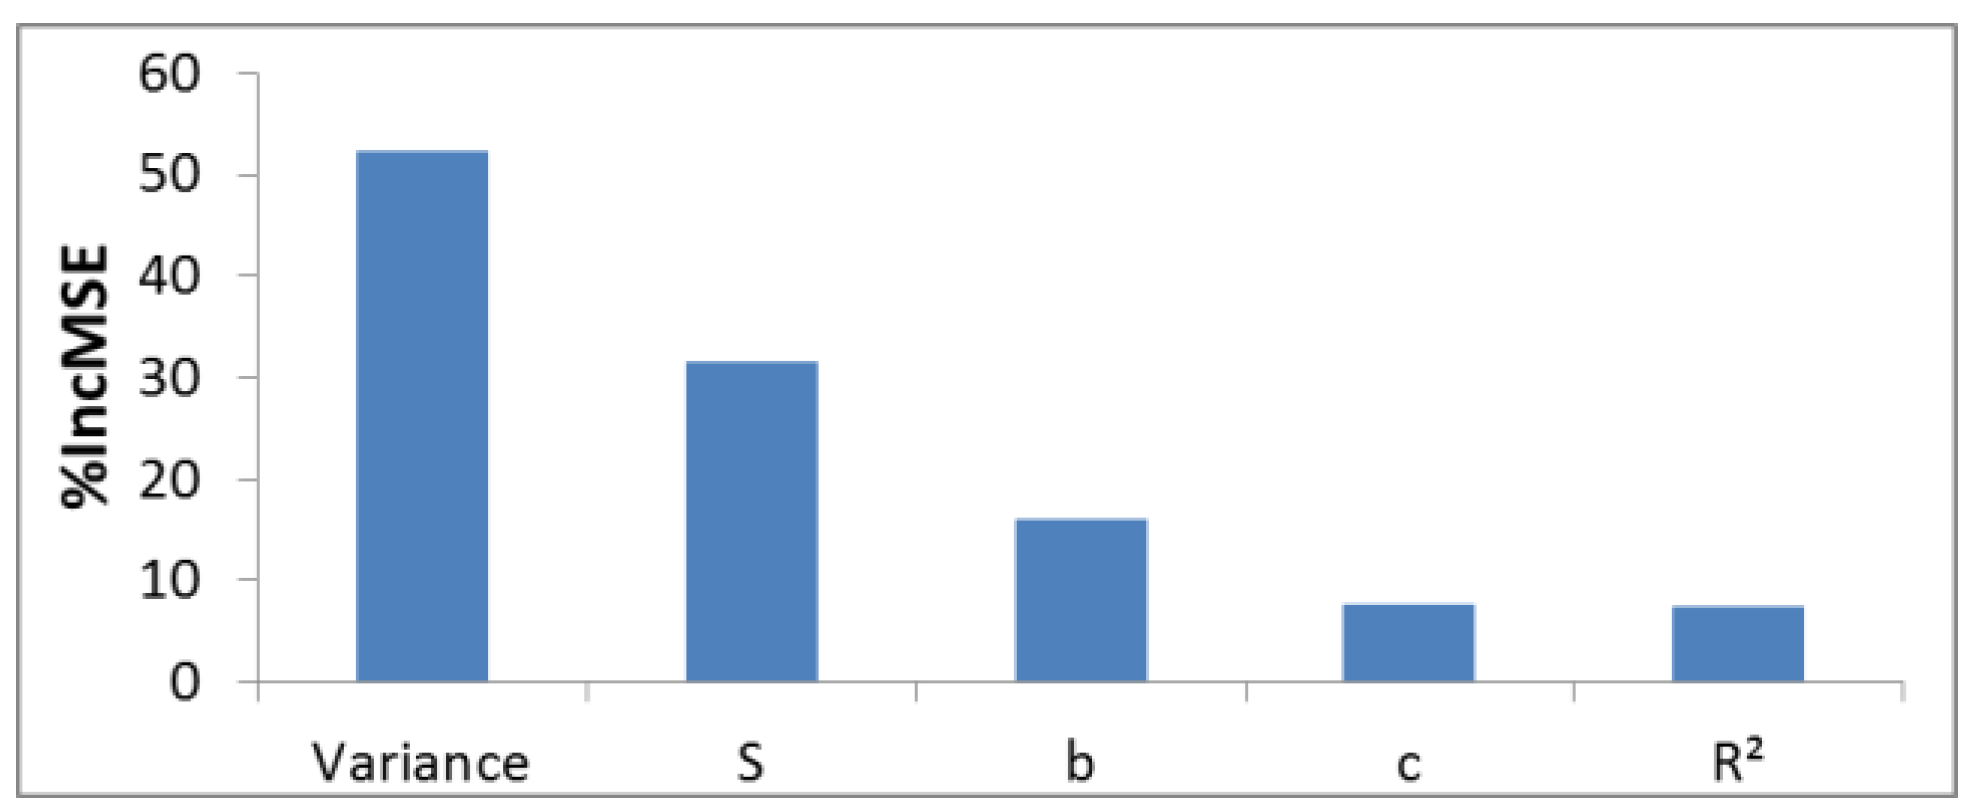
3.1.2. VV/VH Signal Variance
3.1.3. VH Linear Fitting
3.2. Decision Tree Classification
3.3. Random Forest Classification
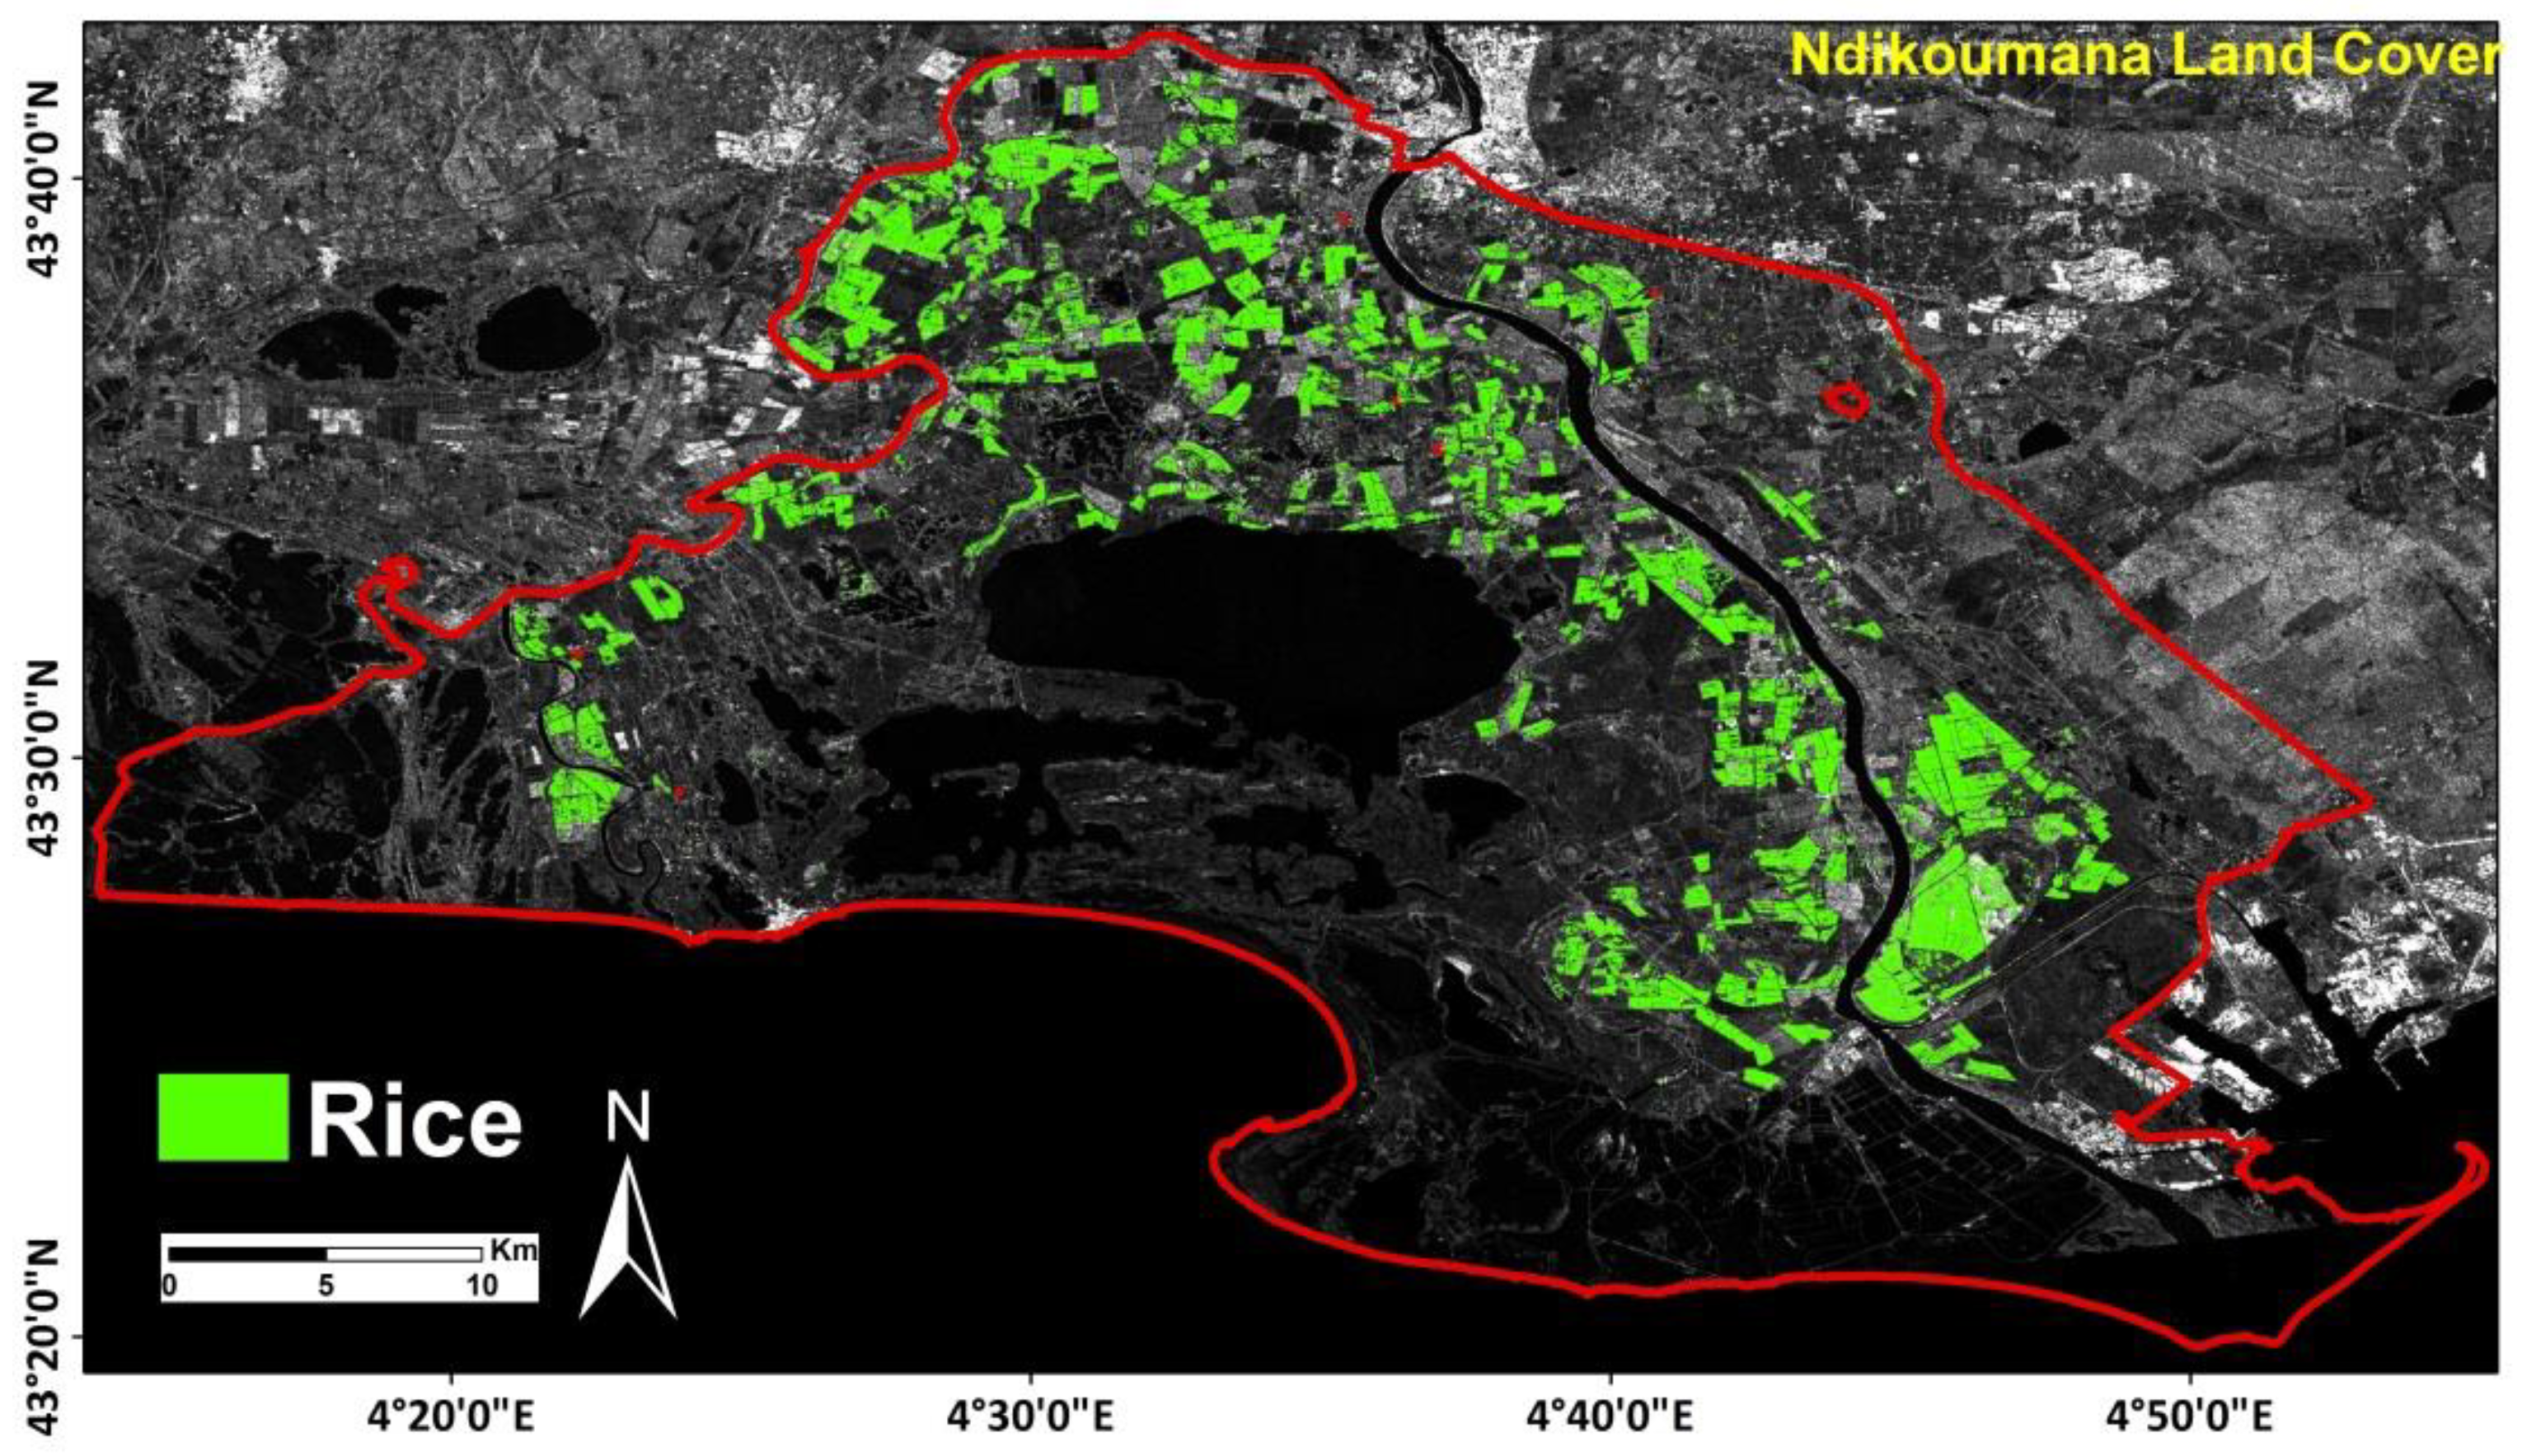
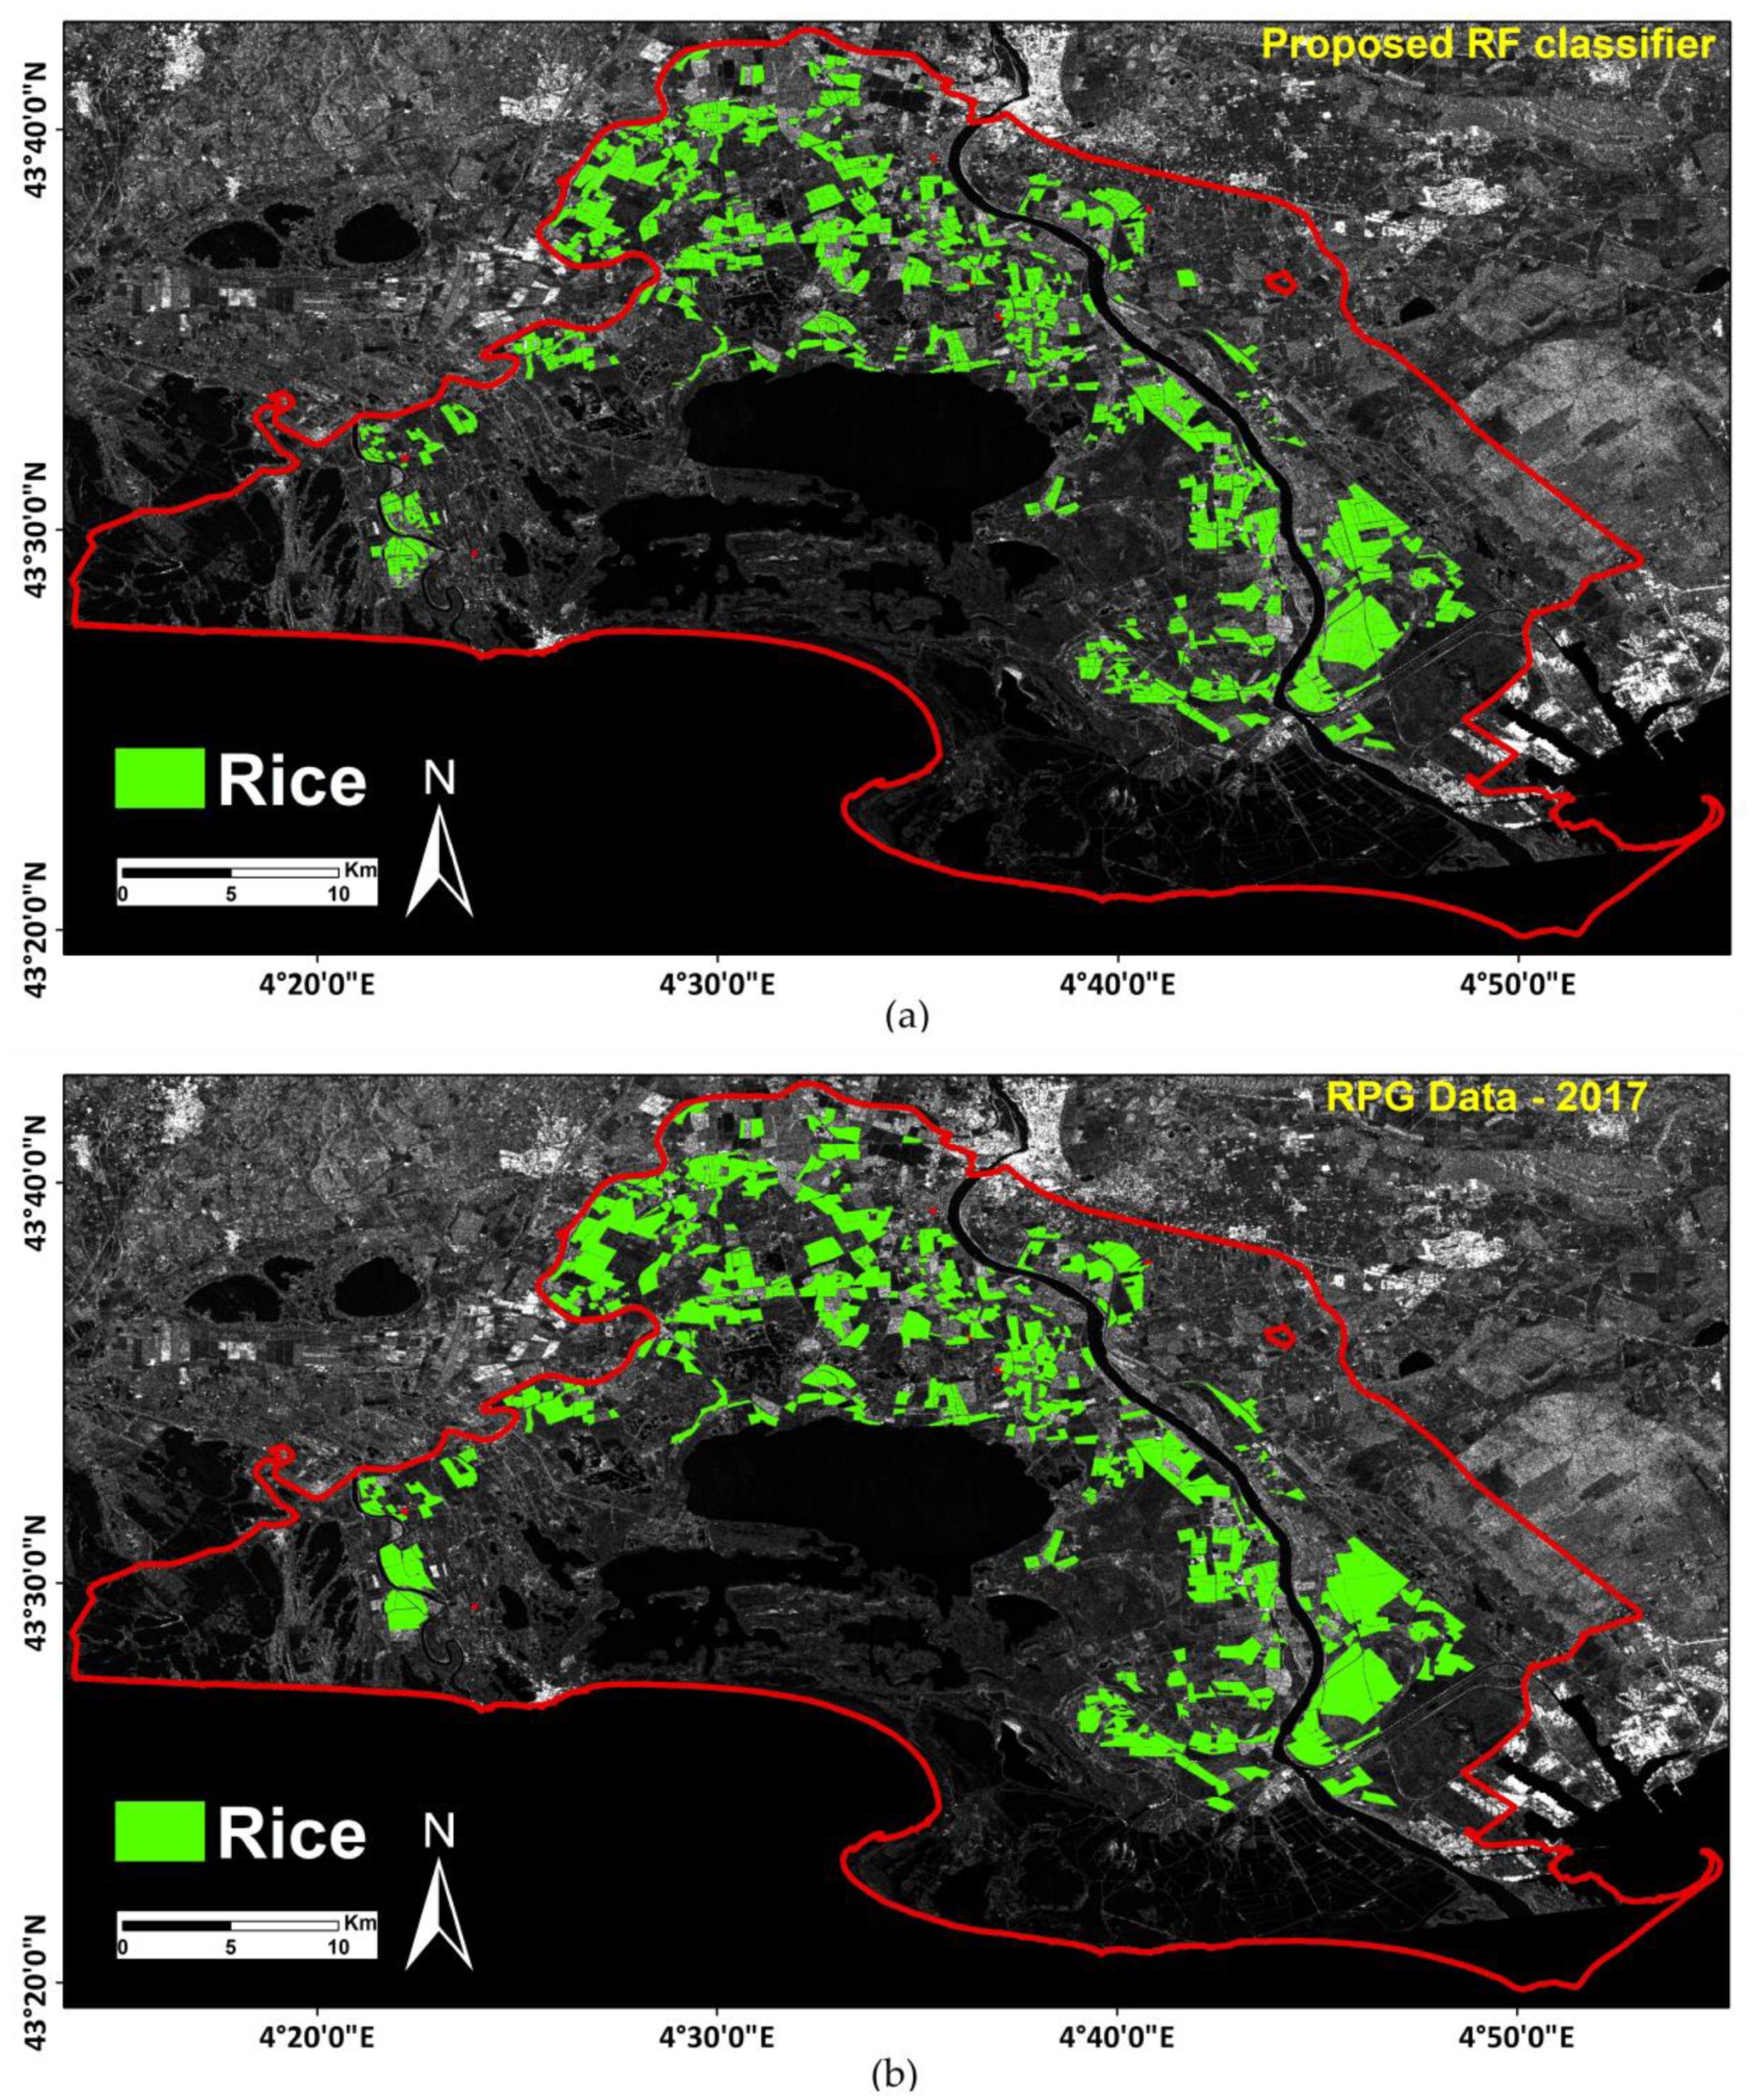
4. Results
5. Discussion
6. Conclusions
Author Contributions
Funding
Acknowledgments
Conflicts of Interest
References
- FAO. FAO Rice Market Monitor. 2018, Volume XXI. Available online: http://www.fao.org/3/I9243EN/i9243en.pdf (accessed on 28 March 2019).
- Delmotte, S.; Tittonell, P.; Mouret, J.-C.; Hammond, R.; Lopez-Ridaura, S. On farm assessment of rice yield variability and productivity gaps between organic and conventional cropping systems under Mediterranean climate. Eur. J. Agron. 2011, 35, 223–236. [Google Scholar] [CrossRef]
- El Hajj, M.; Baghdadi, N.; Zribi, M.; Belaud, G.; Cheviron, B.; Courault, D.; Charron, F. Soil moisture retrieval over irrigated grassland using X-band SAR data. Remote Sens. Environ. 2016, 176, 202–218. [Google Scholar] [CrossRef] [Green Version]
- El Hajj, M.; Baghdadi, N.; Zribi, M.; Bazzi, H. Synergic Use of Sentinel-1 and Sentinel-2 Images for Operational Soil Moisture Mapping at High Spatial Resolution over Agricultural Areas. Remote Sens. 2017, 9, 1292. [Google Scholar] [CrossRef]
- Gao, Q.; Zribi, M.; Escorihuela, M.; Baghdadi, N.; Segui, P. Irrigation Mapping Using Sentinel-1 Time Series at Field Scale. Remote Sens. 2018, 10, 1495. [Google Scholar] [CrossRef]
- Nasrallah, A.; Baghdadi, N.; Mhawej, M.; Faour, G.; Darwish, T.; Belhouchette, H.; Darwich, S. A Novel Approach for Mapping Wheat Areas Using High Resolution Sentinel-2 Images. Sensors 2018, 18, 2089. [Google Scholar] [CrossRef] [PubMed]
- Aubert, M.; Baghdadi, N.N.; Zribi, M.; Ose, K.; El Hajj, M.; Vaudour, E.; Gonzalez-Sosa, E. Toward an Operational Bare Soil Moisture Mapping Using TerraSAR-X Data Acquired Over Agricultural Areas. IEEE J. Sel. Top. Appl. Earth Obs. Remote Sens. 2013, 6, 900–916. [Google Scholar] [CrossRef] [Green Version]
- Baghdadi, N.N.; El Hajj, M.; Zribi, M.; Fayad, I. Coupling SAR C-Band and Optical Data for Soil Moisture and Leaf Area Index Retrieval Over Irrigated Grasslands. IEEE J. Sel. Top. Appl. Earth Obs. Remote Sens. 2016, 9, 1229–1243. [Google Scholar] [CrossRef]
- Xiao, X.; Boles, S.; Liu, J.; Zhuang, D.; Frolking, S.; Li, C.; Salas, W.; Moore, B. Mapping paddy rice agriculture in southern China using multi-temporal MODIS images. Remote Sens. Environ. 2005, 95, 480–492. [Google Scholar] [CrossRef]
- Son, N.-T.; Chen, C.-F.; Chen, C.-R.; Duc, H.-N.; Chang, L.-Y. A Phenology-Based Classification of Time-Series MODIS Data for Rice Crop Monitoring in Mekong Delta, Vietnam. Remote Sens. 2013, 6, 135–156. [Google Scholar] [CrossRef] [Green Version]
- Sakamoto, T.; Sprague, D.S.; Okamoto, K.; Ishitsuka, N. Semi-automatic classification method for mapping the rice-planted areas of Japan using multi-temporal Landsat images. Remote Sens. Appl. Soc. Environ. 2018, 10, 7–17. [Google Scholar] [CrossRef]
- Zhang, X.; Wu, B.; Ponce-Campos, G.; Zhang, M.; Chang, S.; Tian, F. Mapping up-to-Date Paddy Rice Extent at 10 M Resolution in China through the Integration of Optical and Synthetic Aperture Radar Images. Remote Sens. 2018, 10, 1200. [Google Scholar] [CrossRef]
- Clauss, K.; Yan, H.; Kuenzer, C. Mapping Paddy Rice in China in 2002, 2005, 2010 and 2014 with MODIS Time Series. Remote Sens. 2016, 8, 434. [Google Scholar] [CrossRef]
- Li, P.; Xiao, C.; Feng, Z. Mapping Rice Planted Area Using a New Normalized EVI and SAVI (NVI) Derived from Landsat-8 OLI. IEEE Geosci. Remote Sens. Lett. 2018, 99, 1–5. [Google Scholar] [CrossRef]
- Wang, L.-F.; Kong, J.A.; Ding, K.H.; Le Toan, T.; Ribbes, F.; Floury, N. Electromagnetic scattering model for rice canopy based on monte carlo simulation. Prog. Electromagn. Res. 2005, 52, 153–171. [Google Scholar] [CrossRef]
- Bouvet, A.; Le Toan, T. Use of ENVISAT/ASAR wide-swath data for timely rice fields mapping in the Mekong River Delta. Remote Sens. Environ. 2011, 115, 1090–1101. [Google Scholar] [CrossRef] [Green Version]
- Nguyen, D.; Clauss, K.; Cao, S.; Naeimi, V.; Kuenzer, C.; Wagner, W. Mapping Rice Seasonality in the Mekong Delta with Multi-Year Envisat ASAR WSM Data. Remote Sens. 2015, 7, 15868–15893. [Google Scholar] [CrossRef] [Green Version]
- Lopez-Sanchez, J.M.; Ballester-Berman, J.D.; Hajnsek, I. First Results of Rice Monitoring Practices in Spain by Means of Time Series of TerraSAR-X Dual-Pol Images. IEEE J. Sel. Top. Appl. Earth Obs. Remote Sens. 2011, 4, 412–422. [Google Scholar] [CrossRef]
- Shao, Y.; Fan, X.; Liu, H.; Xiao, J.; Ross, S.; Brisco, B.; Brown, R.; Staples, G. Rice monitoring and production estimation using multitemporal RADARSAT. Remote Sens. Environ. 2001, 76, 310–325. [Google Scholar] [CrossRef]
- Nelson, A.; Setiyono, T.; Rala, A.; Quicho, E.; Raviz, J.; Abonete, P.; Maunahan, A.; Garcia, C.; Bhatti, H.; Villano, L.; et al. Towards an Operational SAR-Based Rice Monitoring System in Asia: Examples from 13 Demonstration Sites across Asia in the RIICE Project. Remote Sens. 2014, 6, 10773–10812. [Google Scholar] [CrossRef] [Green Version]
- Nguyen, D.B.; Gruber, A.; Wagner, W. Mapping rice extent and cropping scheme in the Mekong Delta using Sentinel-1A data. Remote Sens. Lett. 2016, 7, 1209–1218. [Google Scholar] [CrossRef]
- Clauss, K.; Ottinger, M.; Leinenkugel, P.; Kuenzer, C. Estimating rice production in the Mekong Delta, Vietnam, utilizing time series of Sentinel-1 SAR data. Int. J. Appl. Earth Obs. Geoinf. 2018, 73, 574–585. [Google Scholar] [CrossRef]
- Forino, G.; Nunziata, F.; Mascolo, L.; Pugliano, G.; Migliaccio, M. Rice Mapping and Sowing Date Estimation Using CSK SAR Data. In Proceedings of the 2018 IEEE 4th International Forum on Research and Technology for Society and Industry (RTSI), Palermo, Italy, 10–13 September 2018; pp. 1–4. [Google Scholar]
- Lasko, K.; Vadrevu, K.P.; Tran, V.T.; Justice, C. Mapping Double and Single Crop Paddy Rice with Sentinel-1A at Varying Spatial Scales and Polarizations in Hanoi, Vietnam. IEEE J. Sel. Top. Appl. Earth Obs. Remote Sens. 2018, 11, 498–512. [Google Scholar] [CrossRef]
- Ndikumana, E.; Ho Tong Minh, D.; Baghdadi, N.; Courault, D.; Hossard, L. Deep Recurrent Neural Network for Agricultural Classification using multitemporal SAR Sentinel-1 for Camargue, France. Remote Sens. 2018, 10, 1217. [Google Scholar] [CrossRef]
- Schwerdt, M.; Schmidt, K.; Tous Ramon, N.; Klenk, P.; Yague-Martinez, N.; Prats-Iraola, P.; Zink, M.; Geudtner, D. Independent System Calibration of Sentinel-1B. Remote Sens. 2017, 9, 511. [Google Scholar] [CrossRef]
- Quegan, S.; Yu, J.J. Filtering of multichannel SAR images. IEEE Trans. Geosci. Remote Sens. 2001, 39, 2373–2379. [Google Scholar] [CrossRef]
- Landis, J.R.; Koch, G.G. The measurement of observer agreement for categorical data. Biometrics 1977, 33, 159–174. [Google Scholar] [CrossRef]
- Fawcett, T. An introduction to ROC analysis. Pattern Recognit. Lett. 2006, 27, 861–874. [Google Scholar] [CrossRef]
- Mansaray, L.; Huang, W.; Zhang, D.; Huang, J.; Li, J. Mapping Rice Fields in Urban Shanghai, Southeast China, Using Sentinel-1A and Landsat 8 Datasets. Remote Sens. 2017, 9, 257. [Google Scholar] [CrossRef]
- Zhang, M.; Lin, H.; Wang, G.; Sun, H.; Fu, J. Mapping Paddy Rice Using a Convolutional Neural Network (CNN) with Landsat 8 Datasets in the Dongting Lake Area, China. Remote Sens. 2018, 10, 1840. [Google Scholar] [CrossRef]
- Park, S.; Im, J.; Park, S.; Yoo, C.; Han, H.; Rhee, J. Classification and Mapping of Paddy Rice by Combining Landsat and SAR Time Series Data. Remote Sens. 2018, 10, 447. [Google Scholar] [CrossRef]
- Zhang, Y.; Wang, C.; Wu, J.; Qi, J.; Salas, W.A. Mapping paddy rice with multitemporal ALOS/PALSAR imagery in southeast China. Int. J. Remote Sens. 2009, 30, 6301–6315. [Google Scholar] [CrossRef]
- Clauss, K.; Ottinger, M.; Kuenzer, C. Mapping rice areas with Sentinel-1 time series and superpixel segmentation. Int. J. Remote Sens. 2018, 39, 1399–1420. [Google Scholar] [CrossRef]


| Crop Type | Number of Plots | Surface Area (ha) |
|---|---|---|
| Alfalfa | 45 | 139 |
| Clover | 26 | 76 |
| Grassland | 49 | 157 |
| Lawn | 27 | 201 |
| Melon | 23 | 76 |
| Rice | 319 | 1072 |
| Sunflower | 78 | 230 |
| Swamps | 19 | 101 |
| Tomato | 14 | 48 |
| Vineyards | 28 | 119 |
| Wheat | 204 | 650 |
| Total | 832 | 2869 |
| Class Value | Rice | Other Crop | Total | User Accuracy |
|---|---|---|---|---|
| Rice | 3120 | 325 | 3445 | 90.5% |
| Other Crop | 47 | 6475 | 6522 | 99.2% |
| Total | 3167 | 6800 | 9967 | |
| Producer Accuracy | 98.5% | 95.2% | ||
| Overall Accuracy | 96.3% | |||
| Kappa | 91.5% | |||
| F1 score | 94.3% | |||
| Class Value | Rice | Other Crop | Total | User Accuracy |
|---|---|---|---|---|
| Rice | 3179 | 266 | 3445 | 92.3% |
| Other Crop | 68 | 6454 | 6522 | 98.9% |
| Total | 3247 | 6720 | 9967 | |
| Producer Accuracy | 97.9% | 96.0% | ||
| Overall Accuracy | 96.6% | |||
| Kappa | 92.5% | |||
| F1 score | 95.0% | |||
| Class Value | Rice | Other Crop | Total | User Accuracy |
|---|---|---|---|---|
| Rice | 3042 | 403 | 3445 | 88.3% |
| Other Crop | 153 | 6369 | 6522 | 97.6% |
| Total | 3159 | 6772 | 9967 | |
| Producer Accuracy | 95.2% | 94.0% | ||
| Overall Accuracy | 94.4% | |||
| Kappa | 87.5% | |||
| F1 score | 91.6% | |||
© 2019 by the authors. Licensee MDPI, Basel, Switzerland. This article is an open access article distributed under the terms and conditions of the Creative Commons Attribution (CC BY) license (http://creativecommons.org/licenses/by/4.0/).
Share and Cite
Bazzi, H.; Baghdadi, N.; El Hajj, M.; Zribi, M.; Minh, D.H.T.; Ndikumana, E.; Courault, D.; Belhouchette, H. Mapping Paddy Rice Using Sentinel-1 SAR Time Series in Camargue, France. Remote Sens. 2019, 11, 887. https://0-doi-org.brum.beds.ac.uk/10.3390/rs11070887
Bazzi H, Baghdadi N, El Hajj M, Zribi M, Minh DHT, Ndikumana E, Courault D, Belhouchette H. Mapping Paddy Rice Using Sentinel-1 SAR Time Series in Camargue, France. Remote Sensing. 2019; 11(7):887. https://0-doi-org.brum.beds.ac.uk/10.3390/rs11070887
Chicago/Turabian StyleBazzi, Hassan, Nicolas Baghdadi, Mohammad El Hajj, Mehrez Zribi, Dinh Ho Tong Minh, Emile Ndikumana, Dominique Courault, and Hatem Belhouchette. 2019. "Mapping Paddy Rice Using Sentinel-1 SAR Time Series in Camargue, France" Remote Sensing 11, no. 7: 887. https://0-doi-org.brum.beds.ac.uk/10.3390/rs11070887