Tracking and Simulating Pedestrian Movements at Intersections Using Unmanned Aerial Vehicles


1
College of Civil Engineering, Shenzhen University, Shenzhen 518060, China
2
Guangdong Key Laboratory of Urban Informatics, Shenzhen Key Laboratory of Spatial Smart Sensing and Services, and Research Institute of Smart Cities, Shenzhen University, Shenzhen 518060, China
3
Key Laboratory for Geo-Environmental Monitoring of Coastal Zone of Ministry of Natural Resources, Shenzhen University, Shenzhen 518060, China
4
Department of Urban Informatics, School of Architecture and Urban Planning, Shenzhen University, Shenzhen 518060, China
*
Author to whom correspondence should be addressed.
Remote Sens. 2019, 11(8), 925; https://0-doi-org.brum.beds.ac.uk/10.3390/rs11080925
Submission received: 5 March 2019
/
Revised: 8 April 2019
/
Accepted: 12 April 2019
/
Published: 16 April 2019
(This article belongs to the Section Urban Remote Sensing)
Abstract
:For a city to be livable and walkable is the ultimate goal of future cities. However, conflicts among pedestrians, vehicles, and cyclists at traffic intersections are becoming severe in high-density urban transportation areas, especially in China. Correspondingly, the transit time at intersections is becoming prolonged, and pedestrian safety is becoming endangered. Simulating pedestrian movements at complex traffic intersections is necessary to optimize the traffic organization. We propose an unmanned aerial vehicle (UAV)-based method for tracking and simulating pedestrian movements at intersections. Specifically, high-resolution videos acquired by a UAV are used to recognize and position moving targets, including pedestrians, cyclists, and vehicles, using the convolutional neural network. An improved social force-based motion model is proposed, considering the conflicts among pedestrians, cyclists, and vehicles. In addition, maximum likelihood estimation is performed to calibrate an improved social force model. UAV videos of intersections in Shenzhen are analyzed to demonstrate the performance of the presented approach. The results demonstrate that the proposed social force-based motion model can effectively simulate the movement of pedestrians and cyclists at road intersections. The presented approach provides an alternative method to track and simulate pedestrian movements, thus benefitting the organization of pedestrian flow and traffic signals controlling the intersections.

1. Introduction
With rapid economic development, the use of automobiles has greatly increased in developing countries, especially in China, India, and Vietnam, where vehicles are replacing bicycles as the dominant transportation mode [1,2]. Facing this great change, the space allocated to automobiles has been expanded, thus alleviating traffic congestion, which encroaches on the space for cyclists and pedestrians and constrains bicycling and walking. Consequently, potential conflicts of vehicles, cycles, and pedestrians not only exacerbate travel delays but also increase the randomness of pedestrian movements, substantially threatening pedestrian safety. In a recent traffic safety report released by the World Health Organization (WHO), road collisions are the world’s leading cause of preventable death; over 1.25 million people die annually on the roads (especially at intersections) because of traffic collisions [3]. In some ways, active transportation users, such as cyclists and pedestrians, are more vulnerable to injuries than other road users due to their labile speed and direction [4]. Therefore, a walkable city for people is regarded as one ultimate goals of future cities [5]. Urban planners have taken several actions to encourage walking, such as configuring special walkable lanes, designing good walking interfaces, building friendly walkable infrastructures, etc. These actions also highlight the necessity of pedestrian tracking and simulation.
Traditionally, pedestrian safety inspection largely relies on historical collision records. However, due to the lack of detailed and precise historical data and the infrequent occurrence of collisions, the task of inspection often cannot be fully accomplished. Recently, the use of pedestrian conflicts as an alternative for collisions to analyze road safety has attracted significant interest [6,7,8]. Pedestrian conflicts can provide detailed information concerning road dynamics at intersections, allowing the detection of the series of events that lead to collisions [9,10]. Pedestrian conflict analysis can be conducted by detecting and tracking moving traffic objects or flawed design elements that may be causing safety issues [10]. The introduction of computer vision algorithms has greatly strengthened pedestrian conflict and violation analysis by automating the extraction of accurate movements of traffic objects, overcoming many shortcomings of manual pedestrian analysis techniques [11]. Furthermore, considering the interactions of pedestrians, cyclists, and vehicles, this study aims to track and simulate pedestrian movements at complex traffic intersections using advanced computer vision algorithms. These algorithms will provide microscopic simulations of traffic intersections to optimize traffic organization and promote pedestrian safety.
Recently, many methods have been developed to track pedestrians and vehicles, including the microwave-based method [12], the global positioning system (GPS)-based method [13,14], the induction coil-based method, the video-based method [15,16], and the laser radar-based method [17,18]. Favored for its easy data acquisition, the video-based method, which typically uses videos of traffic intersections to monitor objects, has been extensively applied. Currently, video-based target recognition and tracking can simultaneously target multiple objects of interest (e.g., pedestrians, vehicles, and animals) [19,20]. A set of methods involved in this process, i.e., mean shift, particle filter, and Kalman filter, are typically generative approaches and achieve satisfactory target recognition results [21]. Tracked pedestrians or vehicles are treated as foreground targets. Detectors with online learning or offline training (including random forest and support vector machine) are utilized to distinguish foreground targets from the background, and therefore obtain the positions of the foreground targets. On the other hand, because of their good performance in target detection and localization, deep learning methods have provided new approaches for target recognition and positioning [22,23,24], including the recurrent-convolutional neural network (R-CNN) [25], faster R-CNN [26], single shot multi-box detector (SSD) [27], you only look once v3 (YOLOv3) [28], cascade R-CNN [29], and especially the parallel feature pyramid network (PFPNet) [30], which obtained remarkable performance on many public datasets while maintaining a relatively high execution speed. Therefore, this study improves PFPNet and accurately extracts the trajectories of pedestrians, cyclists, and vehicles from high-resolution unmanned aerial vehicle (UAV) videos to accurately simulate pedestrian movement at traffic intersections.
Microscopic traffic simulation has been extensively employed as an effective tool to analyze the movements of vehicles and pedestrians. Widely employed microscopic traffic simulation models include the cellular automata, lattice gas, and social force models [31,32]. The social force model (SFM) transforms the internal motivation of individual movement into a corresponding force and describes the force that pedestrians experience using a force vector. By establishing a traditional SFM, Helbing and Molnar [32] and Helbing et al. [33,34,35,36,37,38] successfully simulated the self-organizing phenomenon in one- and two-way pedestrian flows under normal conditions. Alternative SFMs were subsequently developed by combining actual situations of pedestrian movements and modifying or adding new elements. For example, Hou et al. [39] observed that pedestrians are more inclined to follow leading pedestrians during an evacuation in emergencies, further investigated the impacts of leading pedestrians during an evacuation process, and established a social force evacuation model. Zeng et al. [40,41] analyzed the peculiarities of pedestrian movements at signalized traffic intersections and proposed the control of traffic signals for pedestrian movements on crosswalks. They improved the structure and parameters of the social force model and established a microscopic pedestrian model for traffic intersections. Liu et al. [42] explored various interactions of pedestrians on crosswalks by considering the collision avoidance behaviors of pedestrians moving backward and the follow-up behaviors of leading pedestrians, and established a microscopic model to incorporate the interactions between pedestrians and surrounding pedestrians. These studies provided valuable insights into microscopic pedestrian traffic simulation. However, the impacts of cyclists and vehicles on pedestrians have not been well investigated and integrated into microscopic traffic simulation. Additionally, high-resolution trajectories of pedestrians and other objects, especially cyclists and vehicles, at complex intersections is lacking.
A UAV is an effective tool to monitor geographical contexts with simple deployment and a low cost [43,44,45,46]. This study employs a UAV to automatically identify and track moving objects, including pedestrians, cyclists, and vehicles at complex traffic intersections, and to simulate the pedestrian movements. Especially, we consider interactions between pedestrians and the surrounding environment and simulate pedestrian movements at intersections affected by cyclists and vehicles. The traditional social force model is modified to integrate the boundary effects of zebra crossings and mutual interactions between pedestrians, cyclists, and vehicles. In addition, the model parameters are calibrated based on the maximum likelihood estimation (MLE) method. An experiment in Shenzhen City was conducted to evaluate the performance of the presented approach. The results demonstrate that the presented approach can accurately simulate pedestrian movements at traffic intersections. The improved social force model describes complex interactions within a complex intersection environment and outperforms the traditional social force model.
The main contributions of this study are summarized as follows: (1) This study successfully and accurately extracts high-resolution movements of pedestrians, cyclists, and vehicles at intersections using a UAV and a convolutional neural network. (2) The classic SFM is improved to integrate the interactions among cyclists, vehicles, and pedestrians, and the inherent law of pedestrians is verified and revealed. (3) The MLE method is introduced to calibrate the model parameters and quantify the range and extent of the impacts of surrounding pedestrians, cyclists, right-turning vehicles, and boundaries, which provide a useful reference for subsequent research on further calibration.
2. Study Area and Methodology
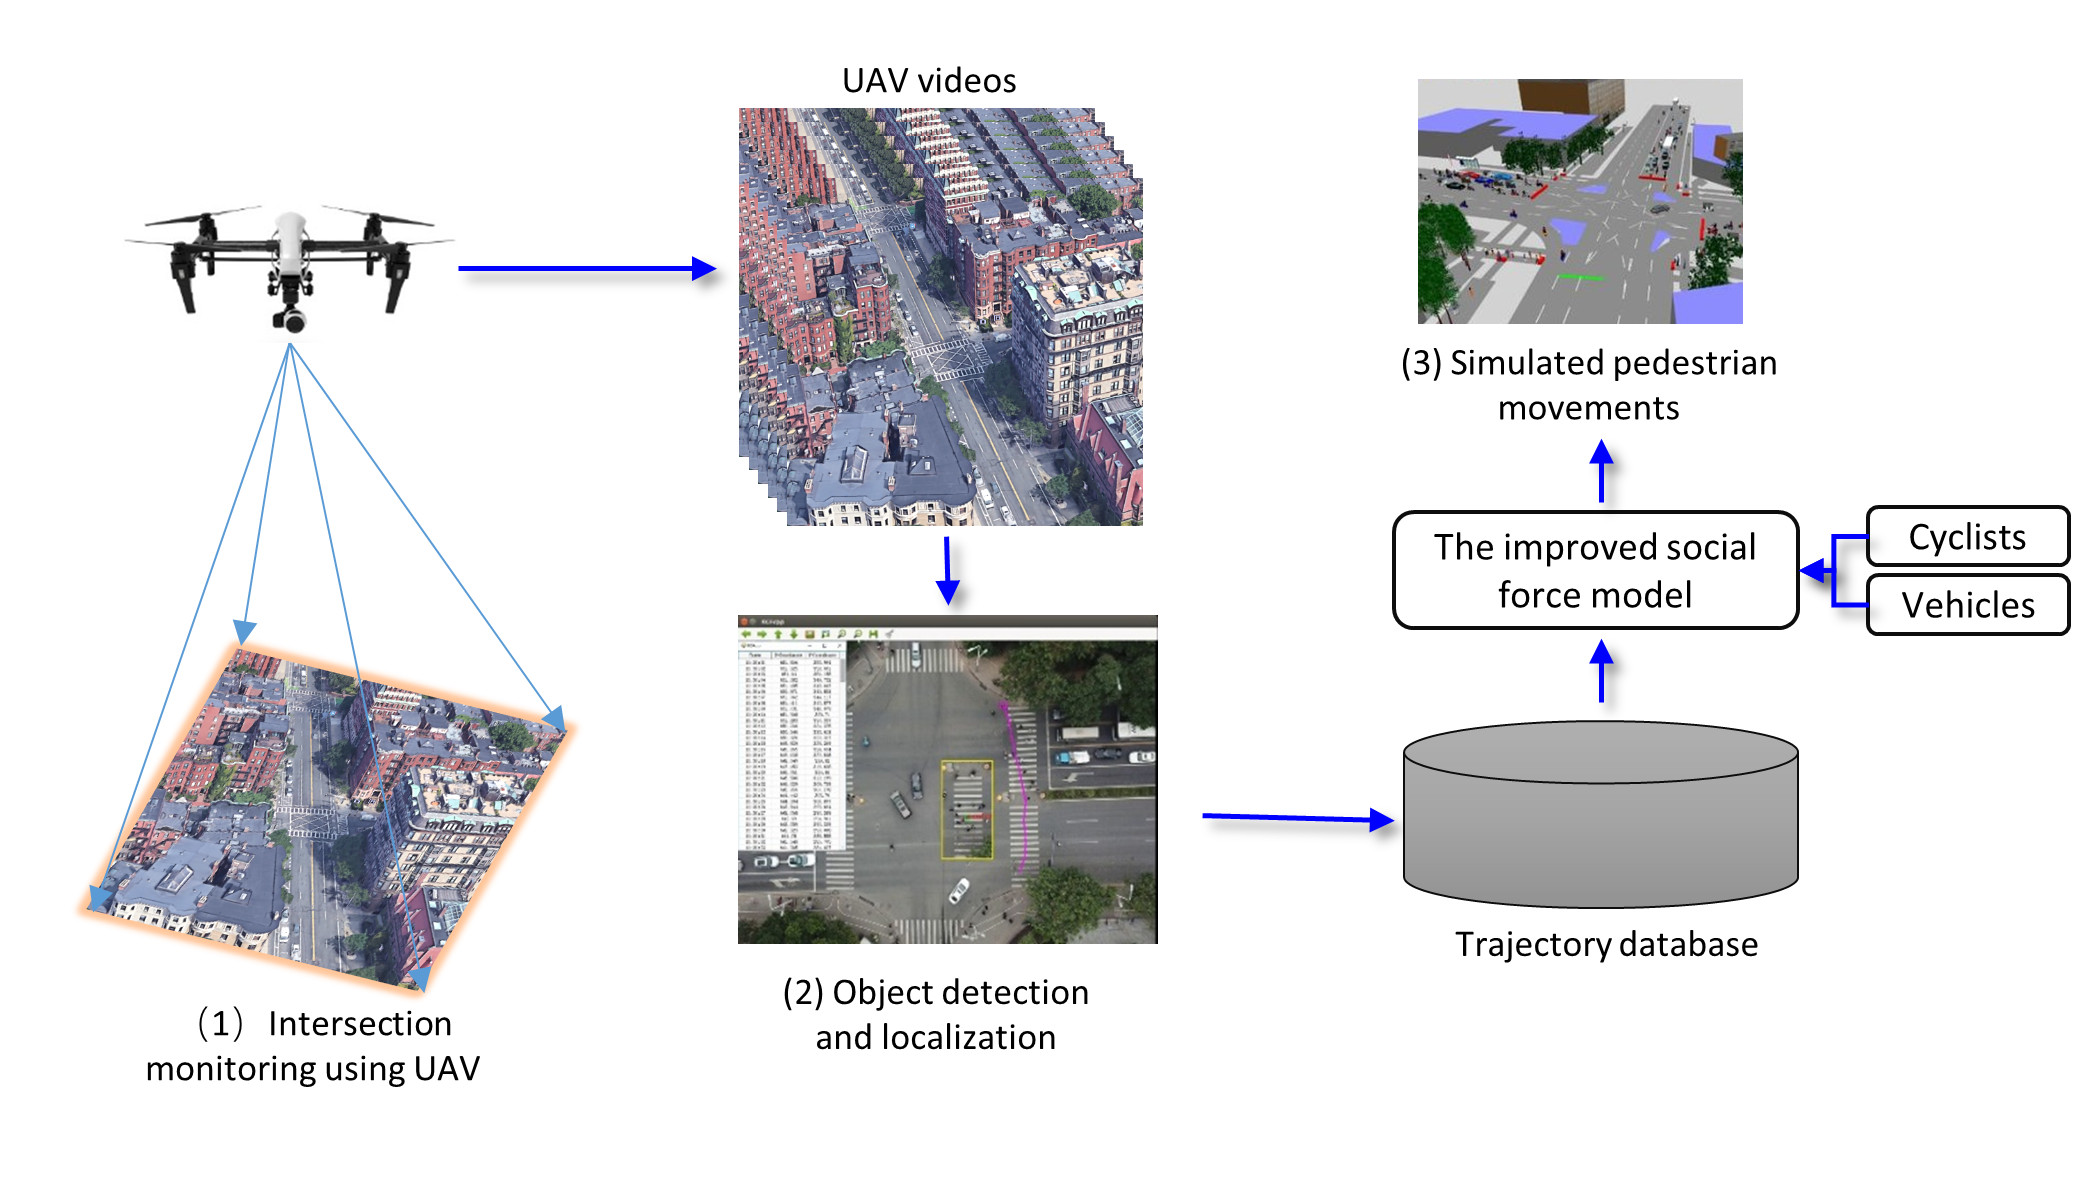
The study was conducted in Shenzhen City, the first special economic zone of China, covering 1996 km2. Since the foundation in 1979, Shenzhen has experienced fast urban growth. The population has increased from 0.6 million to 18 million in 2018. Shenzhen has become one of the highest density cities in China. During rush hour, the pedestrian density at some complex traffic intersections may be up to 2–5 persons/m2. Therefore, there are highly potential conflicts for pedestrians at these intersections, which highlights the importance of pedestrian monitoring. Here, we present a UAV-based approach to monitor pedestrians, cyclists, and vehicles at complex traffic intersections and simulate pedestrian movements with an improved social force model. The workflow of the presented approach is displayed in Figure 1. First, UAVs are used to capture pedestrians, cyclists, and vehicles. Objects are recognized and localized using state-of-the-art PFPNet. High-resolution trajectories are produced for further microscopic traffic simulation. Considering cyclists and vehicles, an improved social force-based motion model is developed to simulate pedestrian movements at intersections.
2.1. Pedestrian, Cyclist, and Vehicle Detection Using a UAV
To obtain high-quality data and reduce noisy information contained in traffic videos, we use a UAV to capture pedestrians, cyclists, and vehicles at road intersections. Compared with a traditional camera installed along the roadside or at intersections [45], the UAV surveillance approach has the following advantages: the hovering location and flying height of the UAV can be conveniently set and changed; the camera scope is substantially greater than that of traditional cameras; and high-resolution UAV videos can simultaneously capture richer information about pedestrians, cyclists, and vehicles.
Using high-resolution UAV videos, we extract pedestrian and cyclist trajectories. The PFPNet [30] is used to detect pedestrian and cyclist locations. Compared with current object detection methods, PFPNet constructs a feature pyramid by widening the network instead of increasing the depth, which aims to predict the locations of “hard-to-detect” objects, such as small (e.g., pedestrians are considerably smaller than vehicles), occluded (e.g., pedestrians can be in close proximity to each other), and blurred (e.g., the camera can shake) objects. Therefore, PFPNet is suitable for pedestrian, cyclist, and vehicle detection.
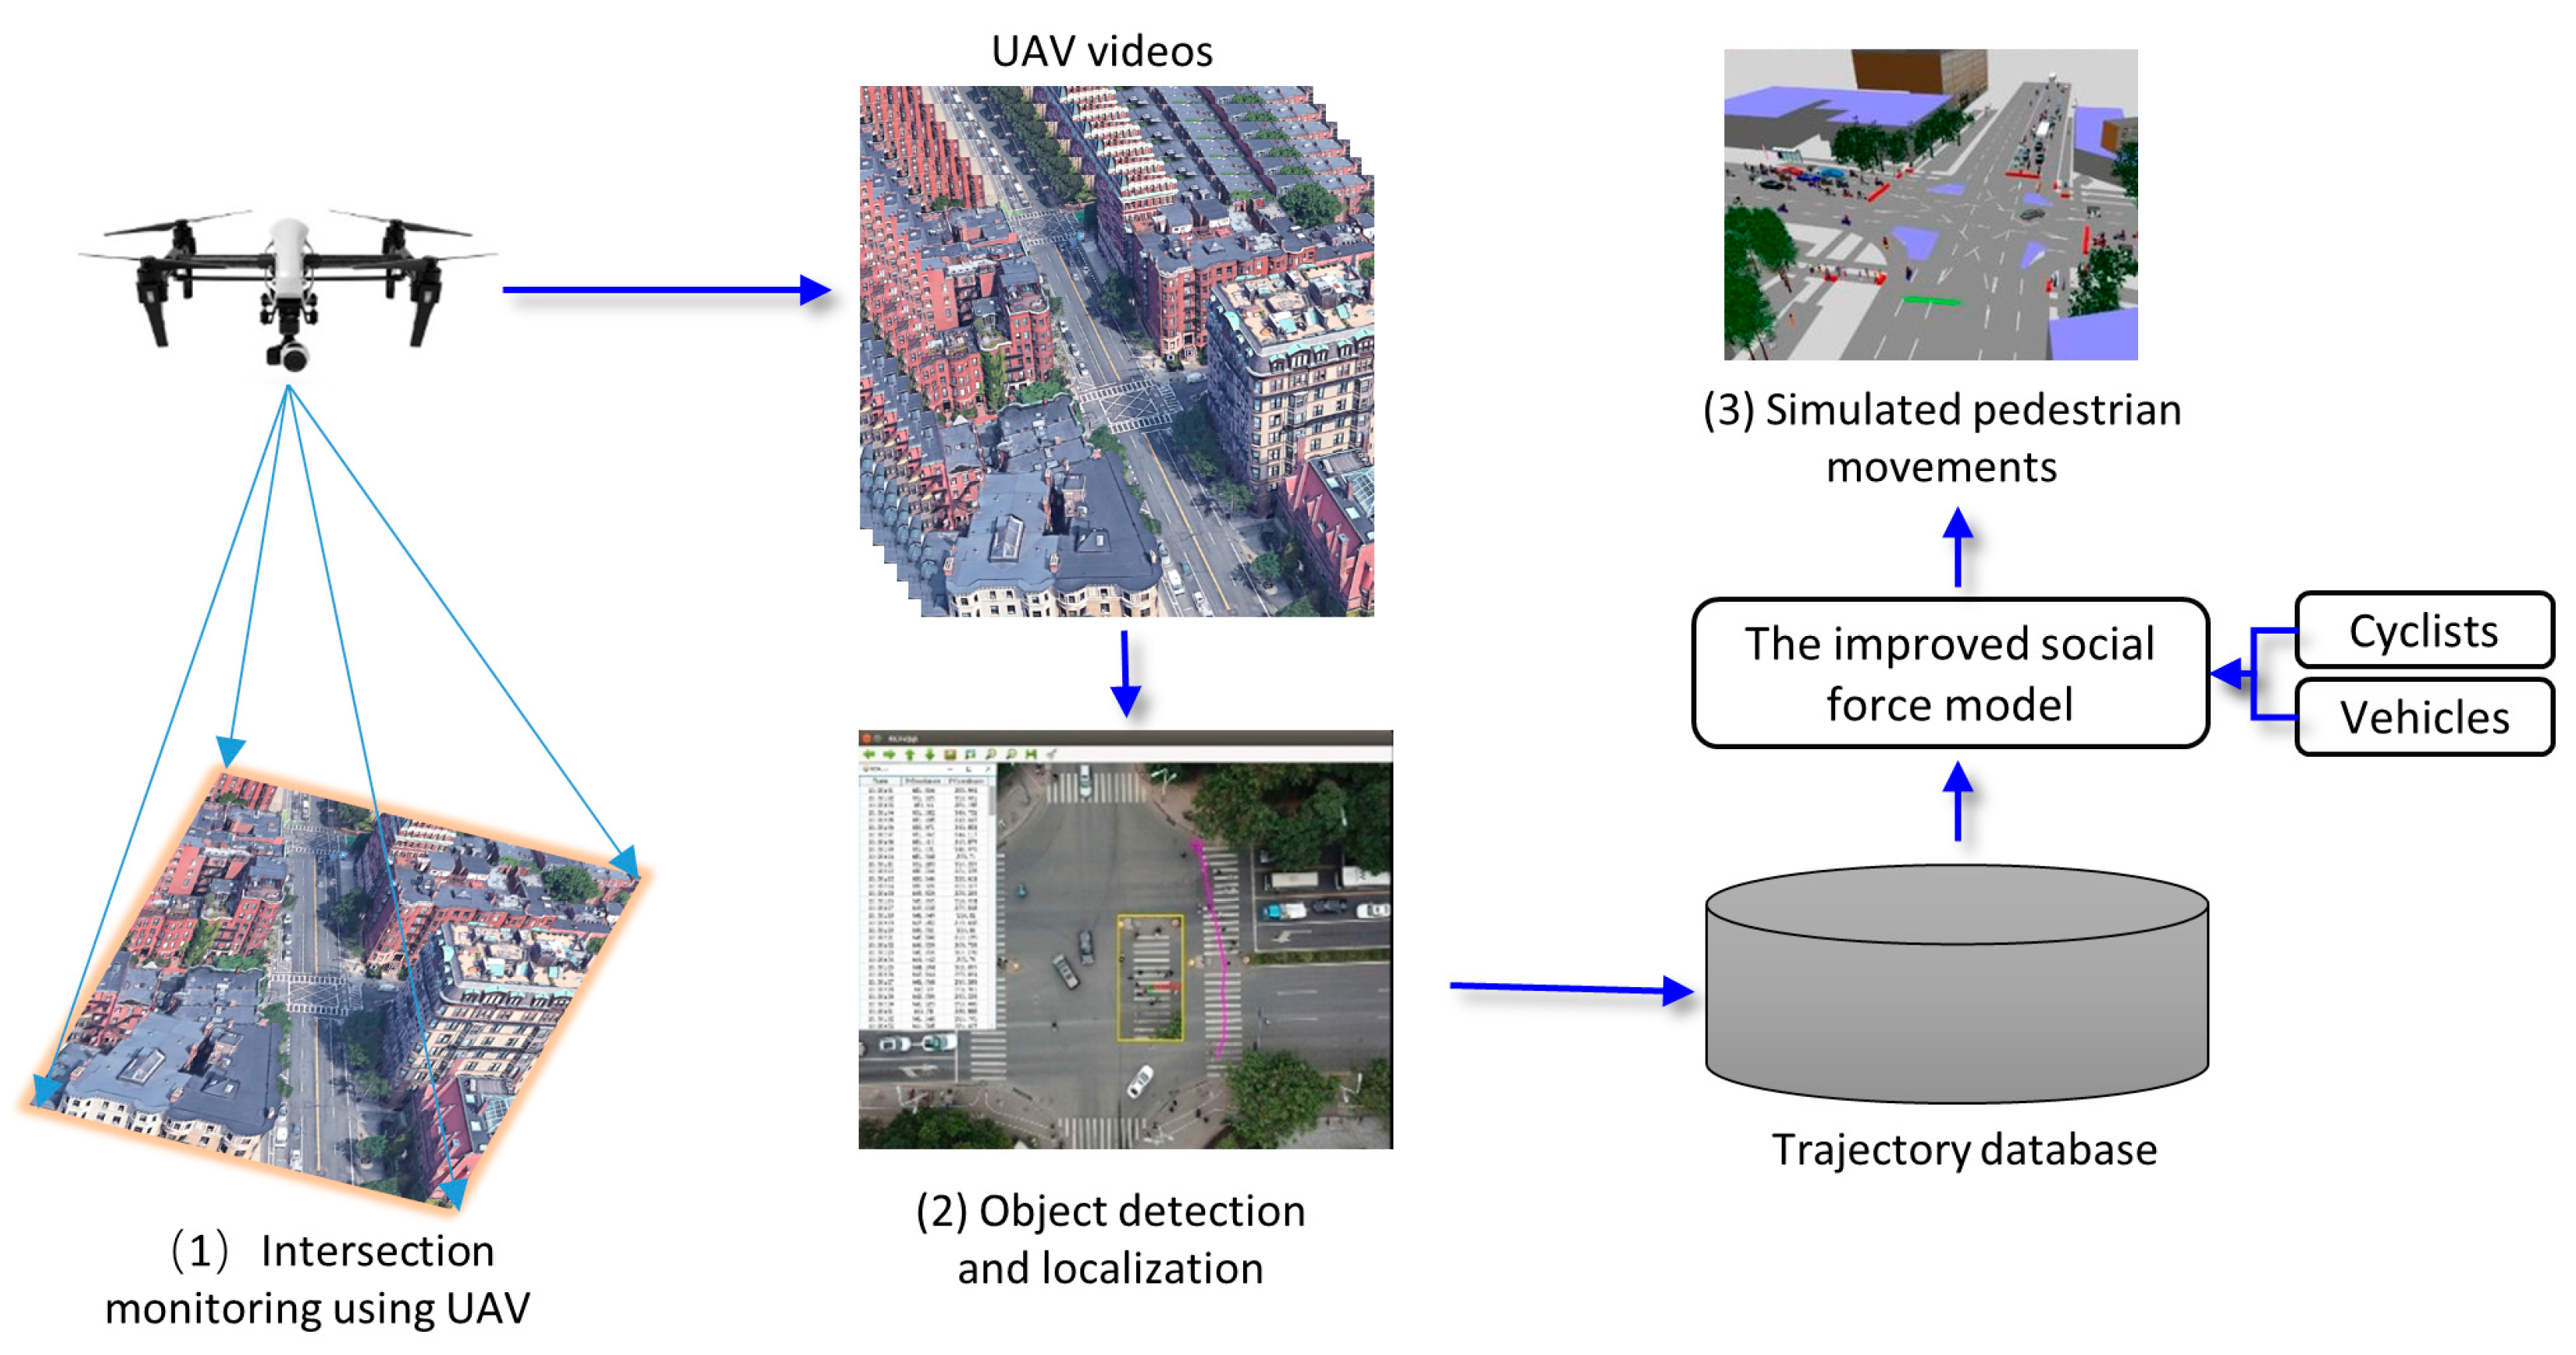
The architecture of PFPNet is illustrated in Figure 2. First, the base network produces a output feature map with channels. Second, spatial pyramid pooling (SPP) [23] is employed to generate a wide feature pyramid (FP) pool with feature maps of various sizes. An additional feature abstraction strategy is applied to these feature maps in a parallel manner to balance the semantic abstraction levels. The multiscale context aggregation (MSCA) module rescales the feature maps to a uniform size and aggregates their contents to produce different levels of the final FP. Each MSCA module is followed by a prediction subnet, which is used to classify and localize objects, such as pedestrians and cyclists.
The base network is important for object detection and localization. We employ the prevalent VGGNet-16 [47] as the base network. The fully-connected layers are replaced with newly designed convolutional layers with downsampling. The modified VGGNet is pre-trained on the ILSVRC dataset [47]. A set of bottleneck layers [48] are employed in PFPNet for the feature transformation. In the bottleneck layer, a convolution is used to reduce the channel number to half of the original count. Batch normalization [49] without shift and the rectified linear unit (ReLU) [50] are used for normalization and activation.
The workflow to detect pedestrians, cyclists, and vehicles is displayed in Figure 2. Given a UAV image (a), the modified VGGNet-16 is employed as the base network to generate the input feature map. The high-dimensional FP pool (b) is formed via the SPP module, and the low-dimensional FP pool (c) is obtained by feature transformation with the bottleneck layer. Using these feature maps, these MSCA modules produce the final FP for multiscale object detection. The FP is fed into the prediction subnets to obtain the detected objects (e). Non-maximum suppression [51] is used to guarantee that each prediction corresponds to a single object.
After detection, we track the movements of pedestrians, cyclists, and vehicles at the crosswalks in videos. With the PFPNet results, the kernelized correlation filter (KCF) [52] is used to track a single object. The objective of a KCF tracker is to teach a classifier to distinguish the objects from their surrounding environment. Unlike other trackers that focus on the objects of interest, the KCF tracker develops circulant matrices to obtain additional environment samples (e.g., locations and scales of image patches) to train the classifier and produce the diagonal matrix with a discrete Fourier transformation, thus reducing the computational complexity. We select a single target from the PFPNet results, send its bounding box to the KCF, track pedestrian, cyclist, and vehicle movements, and collect its location in the UAV video to generate a two-dimensional point set. When the objects of interest are no longer on the crosswalk, the tracking is finished. These generated trajectories are reported in the final frame for further pedestrian movement simulation.
2.2. Pedestrian Movement Modeling
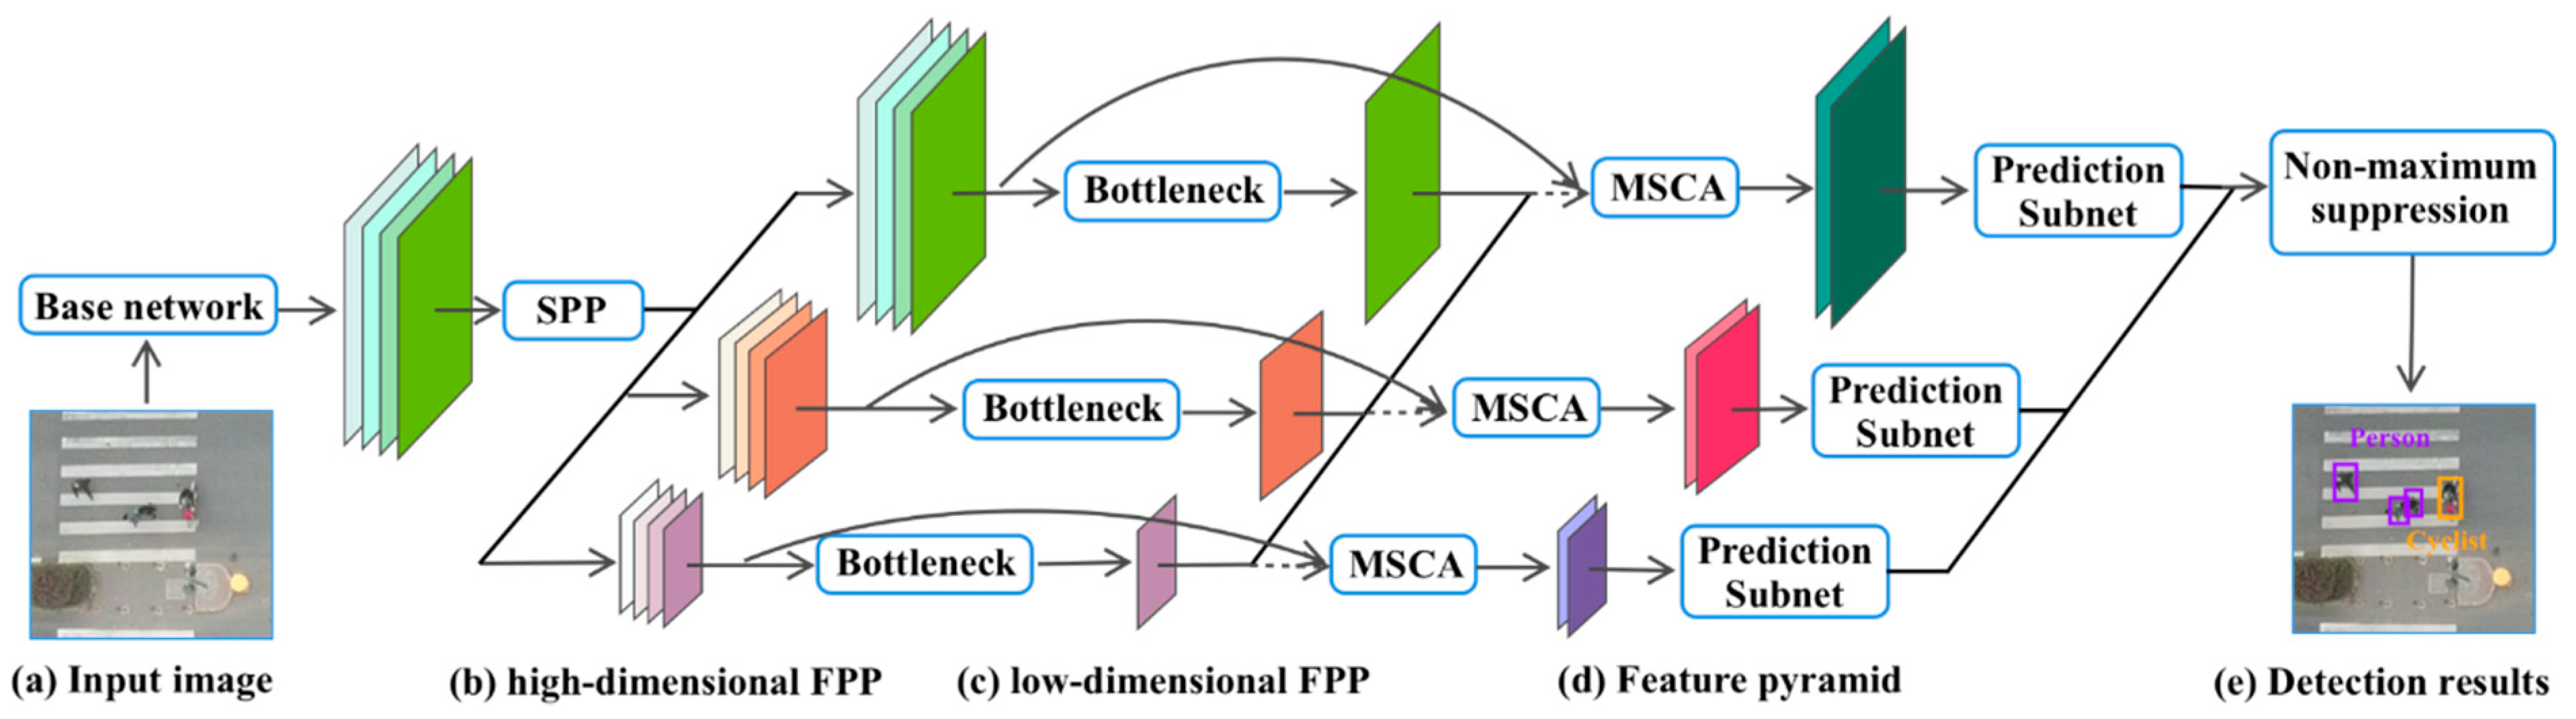
Using acquired trajectories of pedestrians, cyclists, and vehicles, the SFM is improved to simulate pedestrian movements at traffic intersections. Regarding pedestrians as particles satisfying the laws of mechanics, the classic SFM models the movements of a pedestrian as being derived from the combined effects of the self-driving force (), boundary (B) force (), and repulsive force from the surrounding pedestrians (). Given the strong influences of cyclists and vehicles on the movement of pedestrians at intersections, the improved SFM simulates two additional forces: the repulsive force of a cyclist () and the disturbing force of a right-turning vehicle on . Hence, the joint force on a pedestrian, , is defined as Equation (1).
where is the random fluctuation term of the joint force, which indicates the movement of a pedestrian that accidentally deviates from the normal movement. Figure 3 gives an example of the impacts on pedestrian movements considered.
2.2.1. Self-Driving Force
When pedestrians are moving toward their destinations at an expected speed, they are inevitably influenced by their surrounding environments. Therefore, a deviation emerges between the actual velocity and the expected velocity. In this context, following Helbing et al. [38], the self-driving force tends to restore the actual velocity to the expected velocity . Assuming that the time needed to restore the current speed to the expected speed value is , the self-driving force of a pedestrian can be expressed as Equation (2), where M is the weight of the pedestrian.
2.2.2. Boundary Force
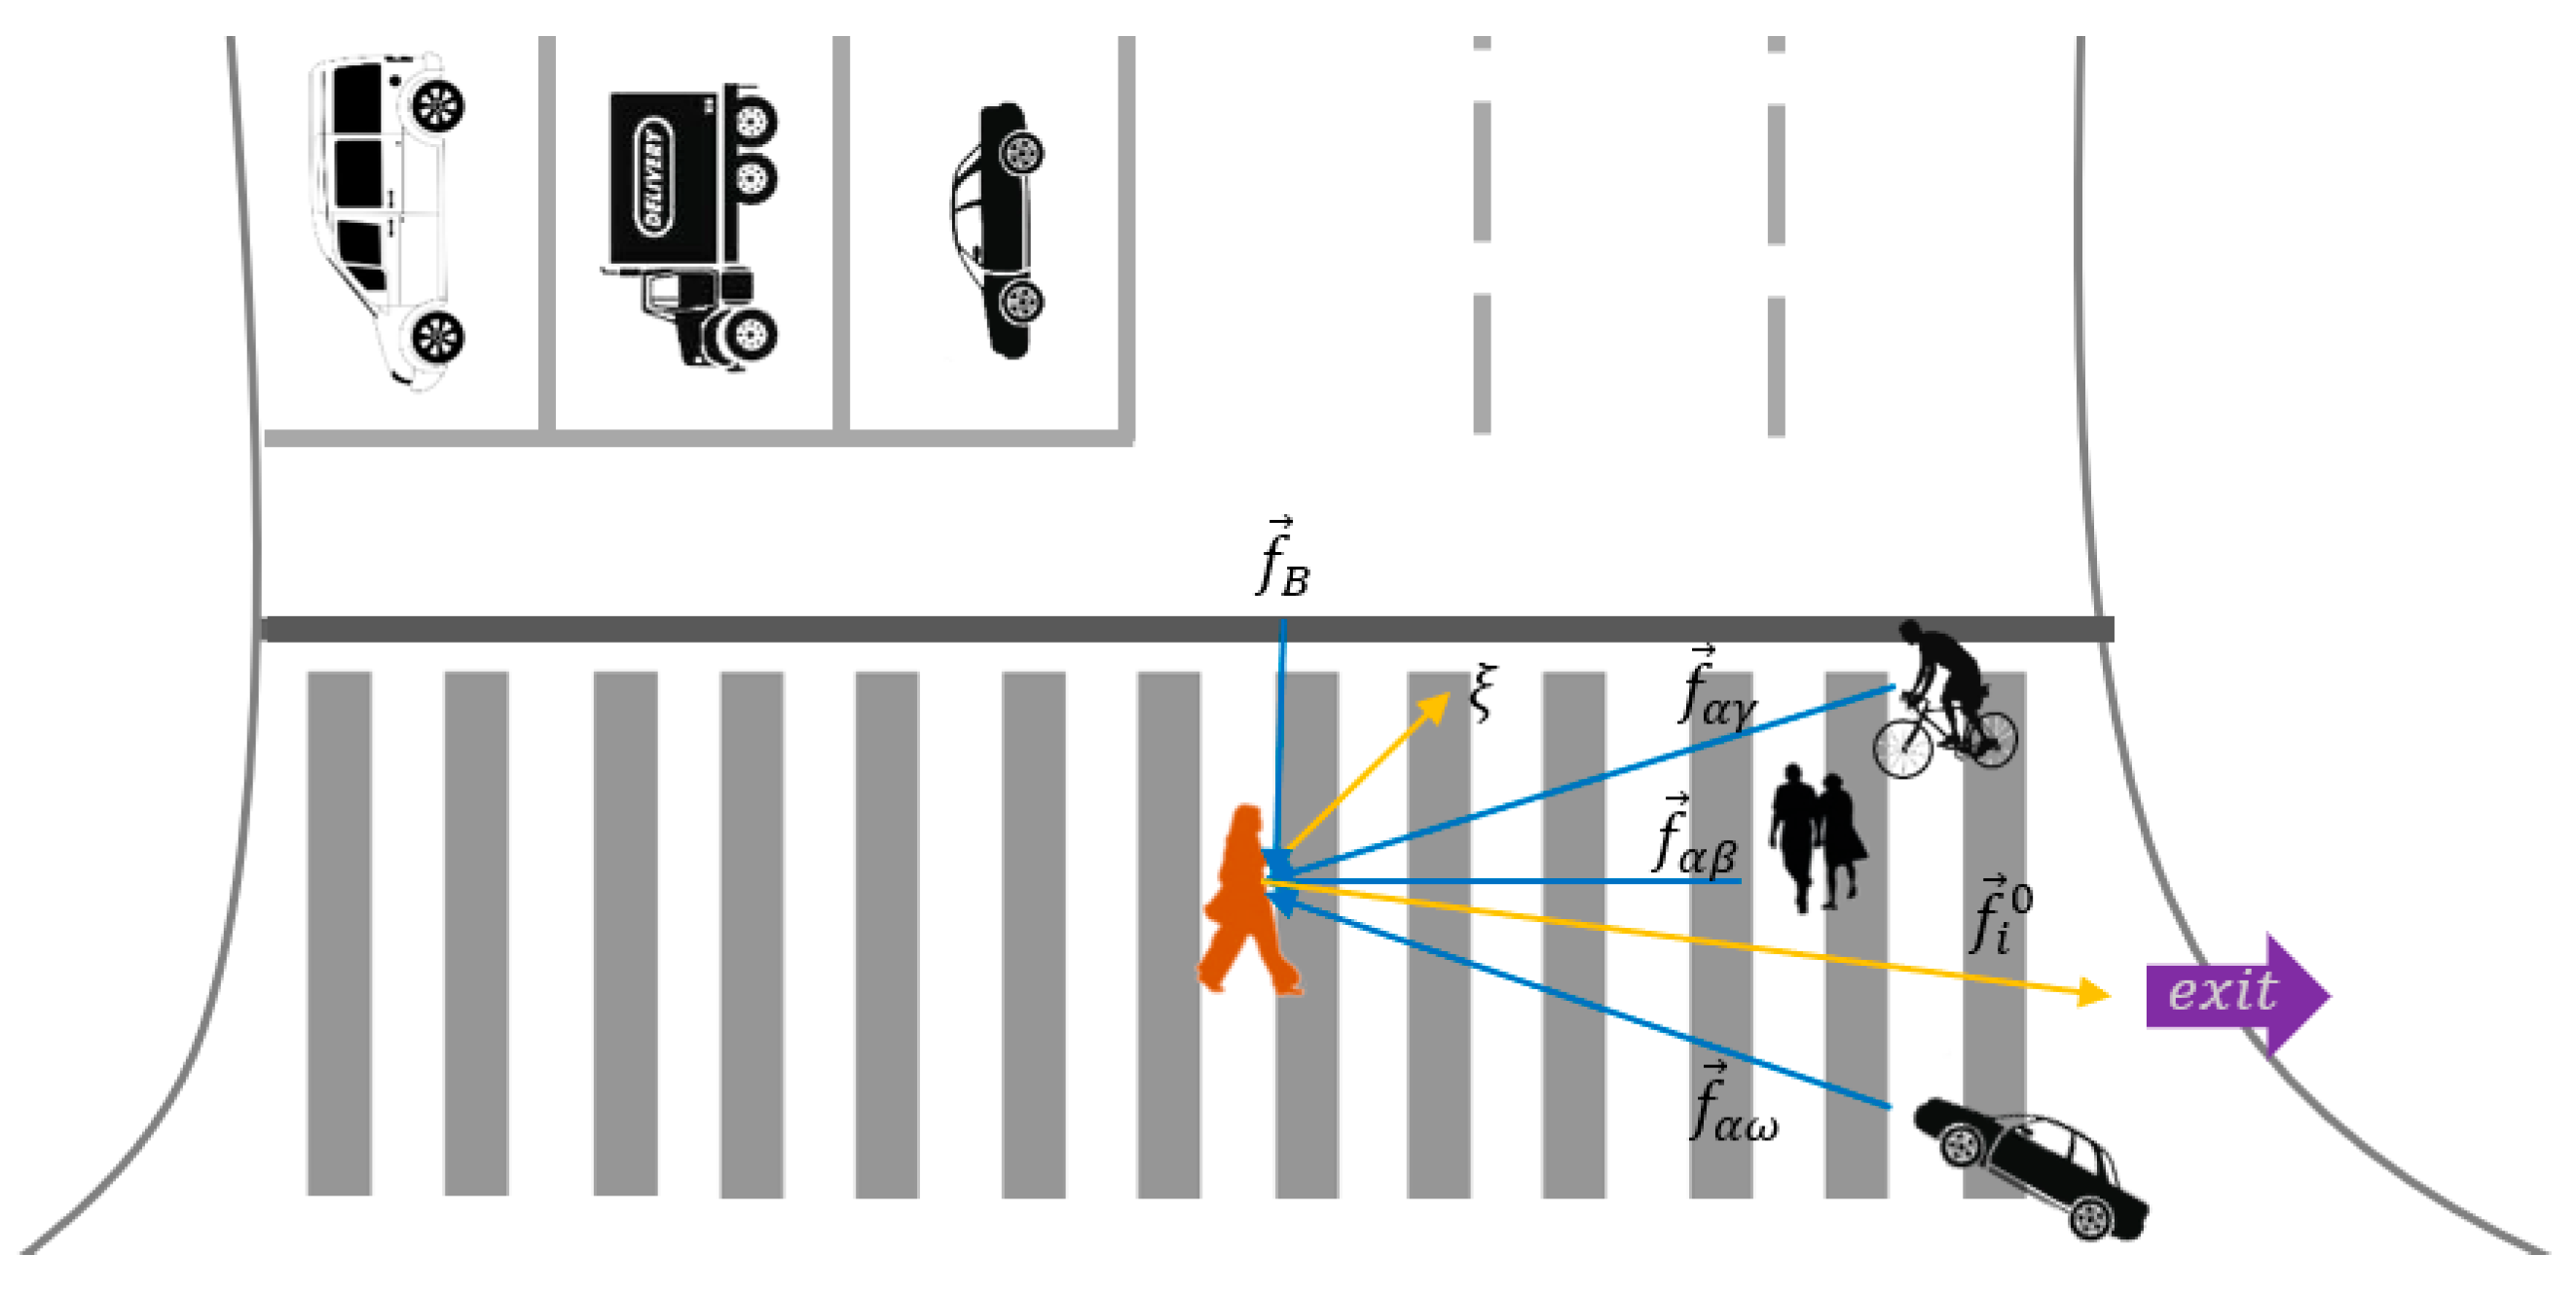
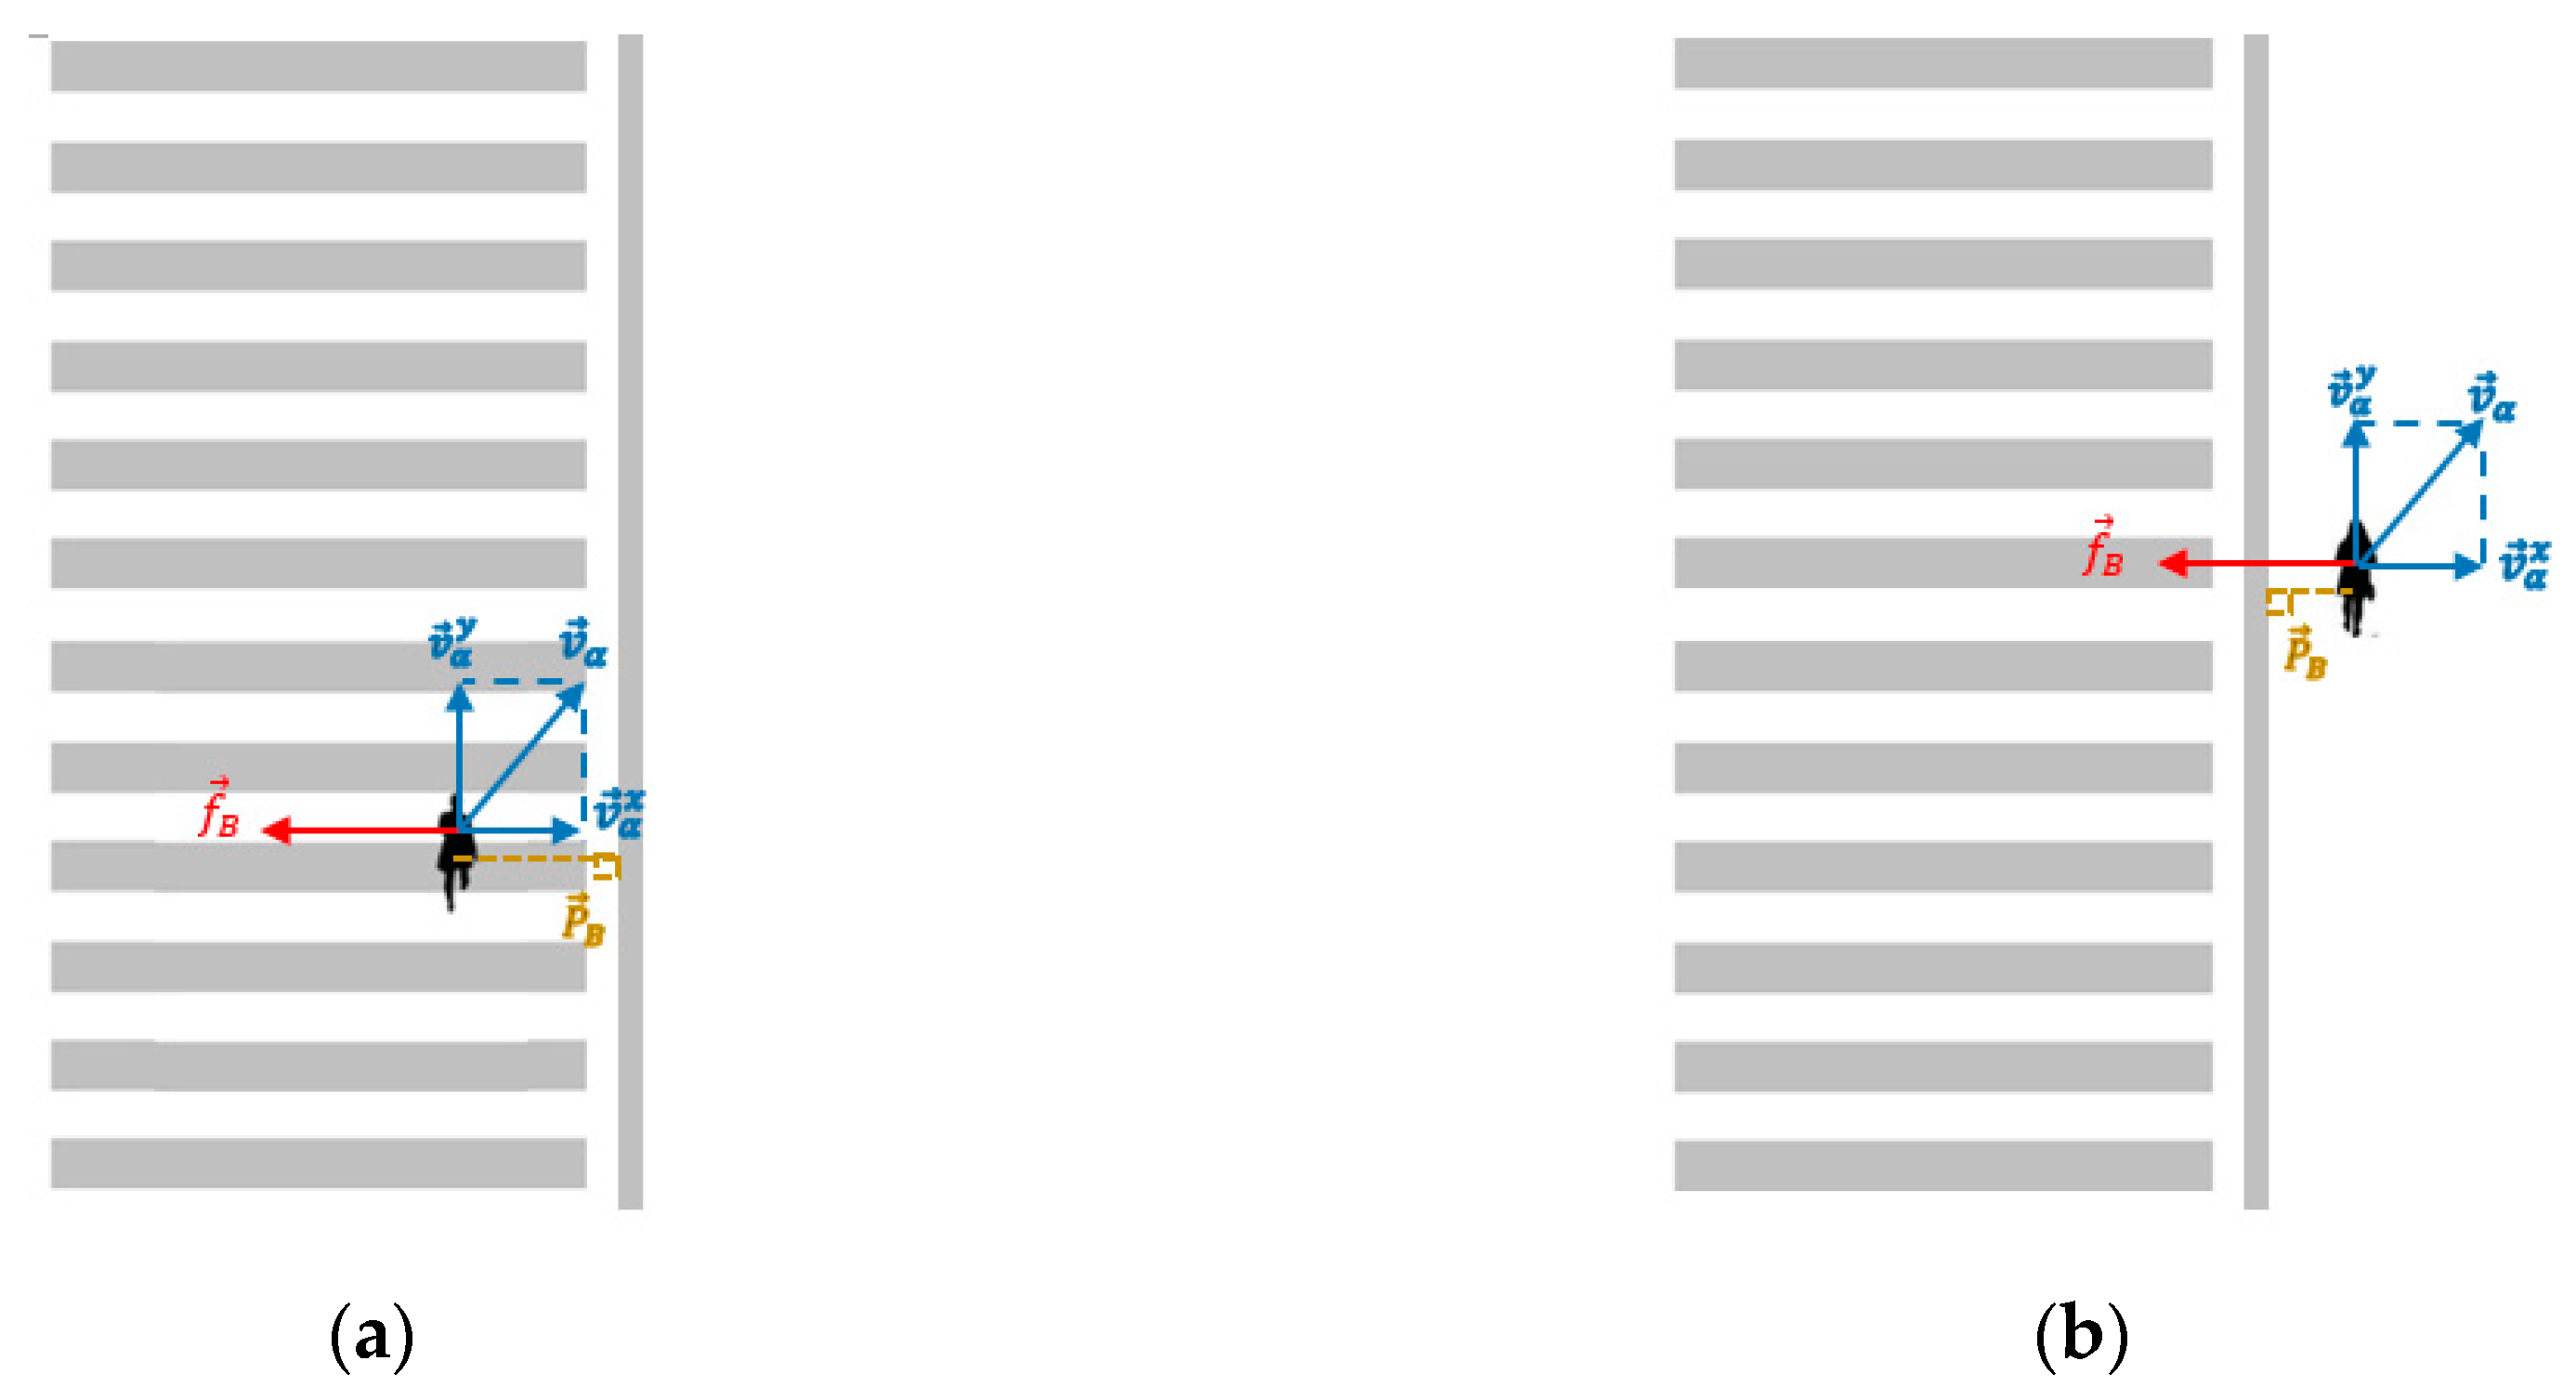
In general, pedestrians always walk within a crosswalk boundary. When an outward object exists at the crosswalk boundary, the boundary will exert a repulsive force to maintain a certain safe distance between the pedestrian and the boundary (Figure 4a). However, when there are high-density pedestrians, for example, 2–5 persons/m2 at some intersections in Shenzhen, pedestrians may walk out of the crosswalk to avoid serious conflict with other pedestrians. Conversely, the boundary force becomes attractive rather than repulsive when a pedestrian steps out of the crosswalk (Figure 4b) to attract the pedestrian to return to the crosswalk [40]. Therefore, the force exerted by the boundary on pedestrians can be expressed as an exponentially decreasing function of the distance, as follows:
where is current position of a pedestrian , is the closest position at the crosswalk boundary to pedestrian , is the Euclidean distance between them, is the boundary force strength, is the boundary force extent, and is the unit vector between the pedestrian and the boundary; becomes with a direction from the boundary B to the pedestrian when the pedestrian is within the boundary. Conversely, becomes with a direction from pedestrian to boundary B when the pedestrian steps out of the boundary.
2.2.3. Repulsive Force Exerted by Other Pedestrians
Pedestrians at traffic intersections tend to repel each other to create a comfortable walking space. The elliptical potential field of human interaction is generally employed to describe the interaction among pedestrians in the traditional SFM, which disregards crowding and bumping. Specifically, following Johansson et al. [38], the repulsive force between pedestrians can be expressed as follows:
where denotes the gradient operator, is the vector from pedestrian to pedestrian , is the potential field.
Assuming that elliptical equipotential lines exist in this potential field I, an exponentially decreasing function should exist as Equation (6), depending on the short semi-axis of the ellipse (), where is the strength of the repulsive force between two pedestrians and , is the extent of the repulsive force between two pedestrians.
where is the short semi-axis of the elliptical potential field defined as:
where is the walking velocity of pedestrian is the simulation time step.
According to the relationship between the potential field and the force, we obtain:
Combining and = to simplify the operation (7), thus, we obtain:
2.2.4. Repulsive Force Exerted by Cyclists on Pedestrians
According to China transportation regulations, cyclists should walk in the crosswalk at traffic intersections, following traffic lights. Cyclists have an equal road right to the pedestrian. Consequently, cyclists have an important impact on pedestrian movements at complex traffic intersections. Given the potential conflict between pedestrian movements and cyclists, we improve the classic SFM and assume another potential field II for the repulsive force of a cyclist , , as follows:
where is the vector from the cyclist to pedestrian , is the potential field following the exponentially decreasing function as follows:
Considering the difference in speed between cyclists and pedestrians, the short semi-axis of the elliptical potential field II () is assumed to be:
where is the vector from cyclist to pedestrian , is the velocity of the cyclist, and is the walking velocity of the pedestrian.
To verify the superiority of elliptical potential field II over the elliptical potential field I in describing the cyclist impact mode, two scenarios are simulated to compare the two potential fields. Assuming that the cyclist is stationary, , the short semi-axis is obtained according to Equation (11) in elliptical potential field II.
According to Equation (6) in the elliptical potential field I, we can obtain:
(1) Scenario 1
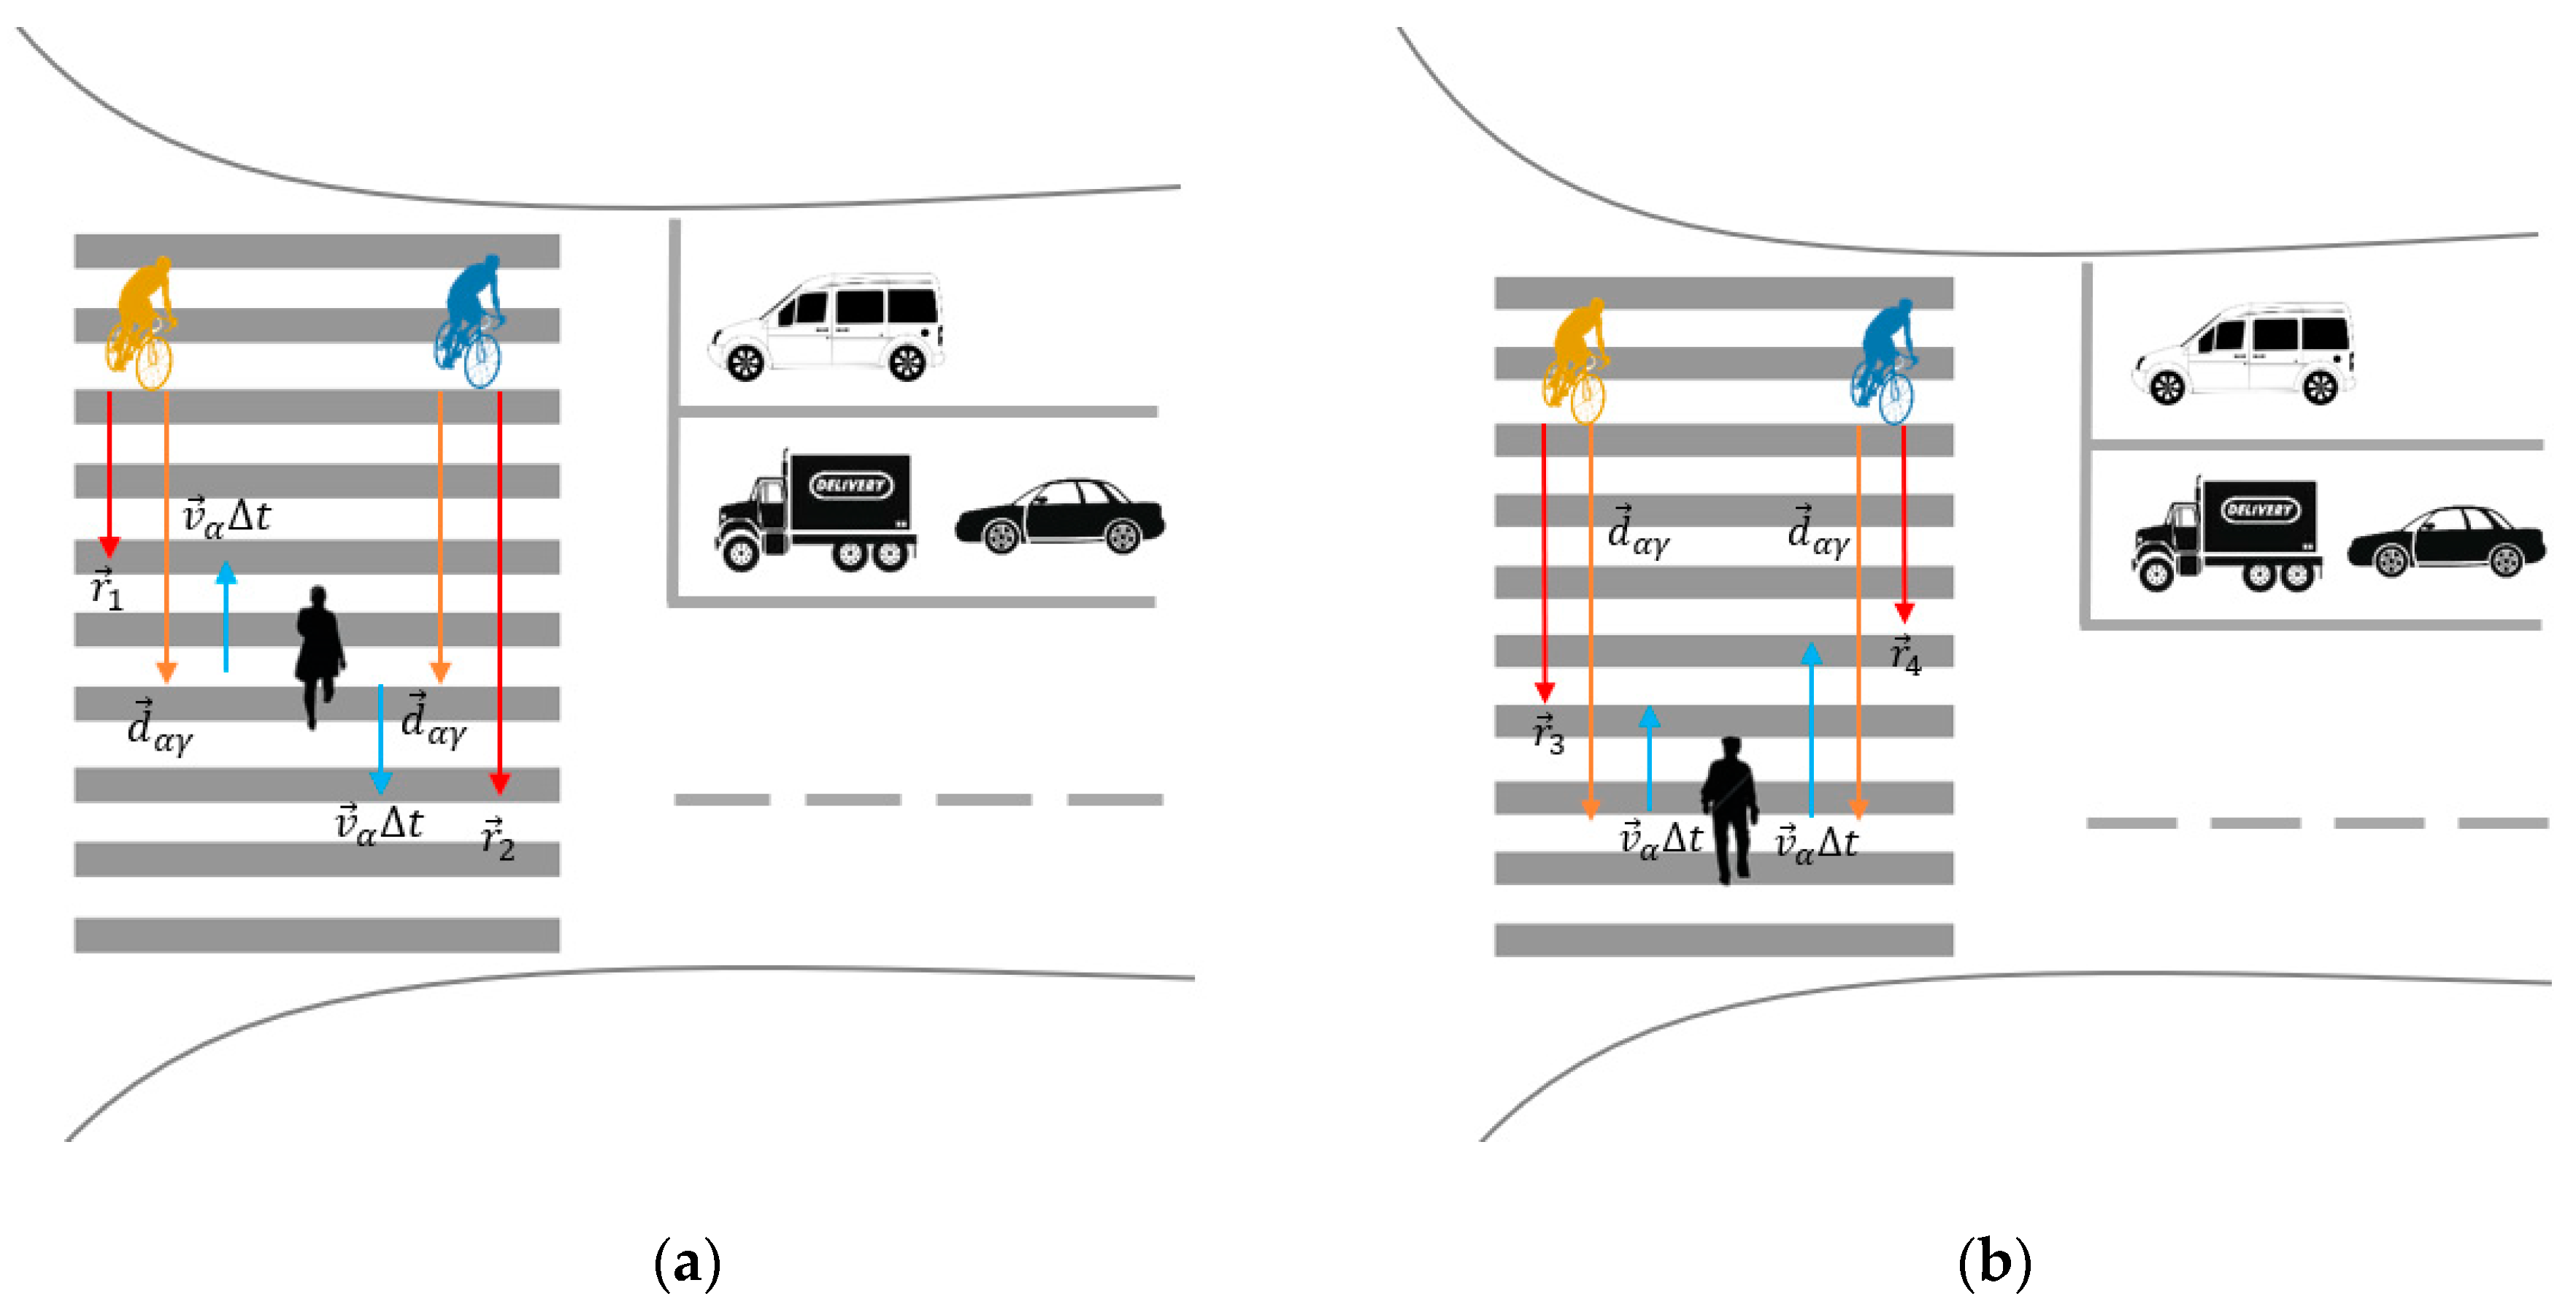
When the pedestrian moves in the same or opposite direction as a cyclist with a common speed of , they share the same values of and but have slightly different values of . As shown in Figure 5a, is smaller than . As the repulsive force monotonously decreases with the short semi-axis , the repulsive force exerted by the cyclist on the pedestrian when they are moving in the opposite directions () is greater than the force when they are moving in the same direction (), which is consistent with the real-world experience of the pedestrian. In elliptical potential field I, is a constant value, which indicates equal disturbing forces in both scenarios and no influence of the relative movement direction on the disturbing force exerted by the cyclist.
(2) Scenario 2
When pedestrian moves toward cyclists with different speeds of and () (Figure 5b), the pedestrian will respond to the larger repulsive force exerted by the cyclist moving at a higher speed, which is also consistent with real-world experiences. Conversely, the elliptical potential field I is not sensitive to speed, and the repulsive force exerted by a cyclist is not related to the speed of pedestrian and only related to the distance between the cyclist and the pedestrian.
2.2.5. Vehicle Force
According to Chinese traffic law, vehicles in China are allowed to turn right at a traffic signal even if it is red. However, drivers do not always yield to pedestrians. Instead, they tend to take advantage of short pedestrian clearance intervals to pass through intersections; therefore, they exert repulsive forces on pedestrians and force pedestrians to decelerate and avoid the vehicles. Given the different speeds of vehicles and pedestrians, similarly, the force of a turning vehicle on a pedestrian in elliptical potential field II can be expressed as follows:
where is the vector from the vehicle to pedestrian , is the potential field following the exponentially decreasing function as below:
where is the strength of the repulsive of a vehicle on pedestrian , and is the extent of the vehicle force.
The short semi-axis of the ellipse of can be expressed as follows:
where is the velocity of the vehicle, and is the walking velocity of the pedestrian.
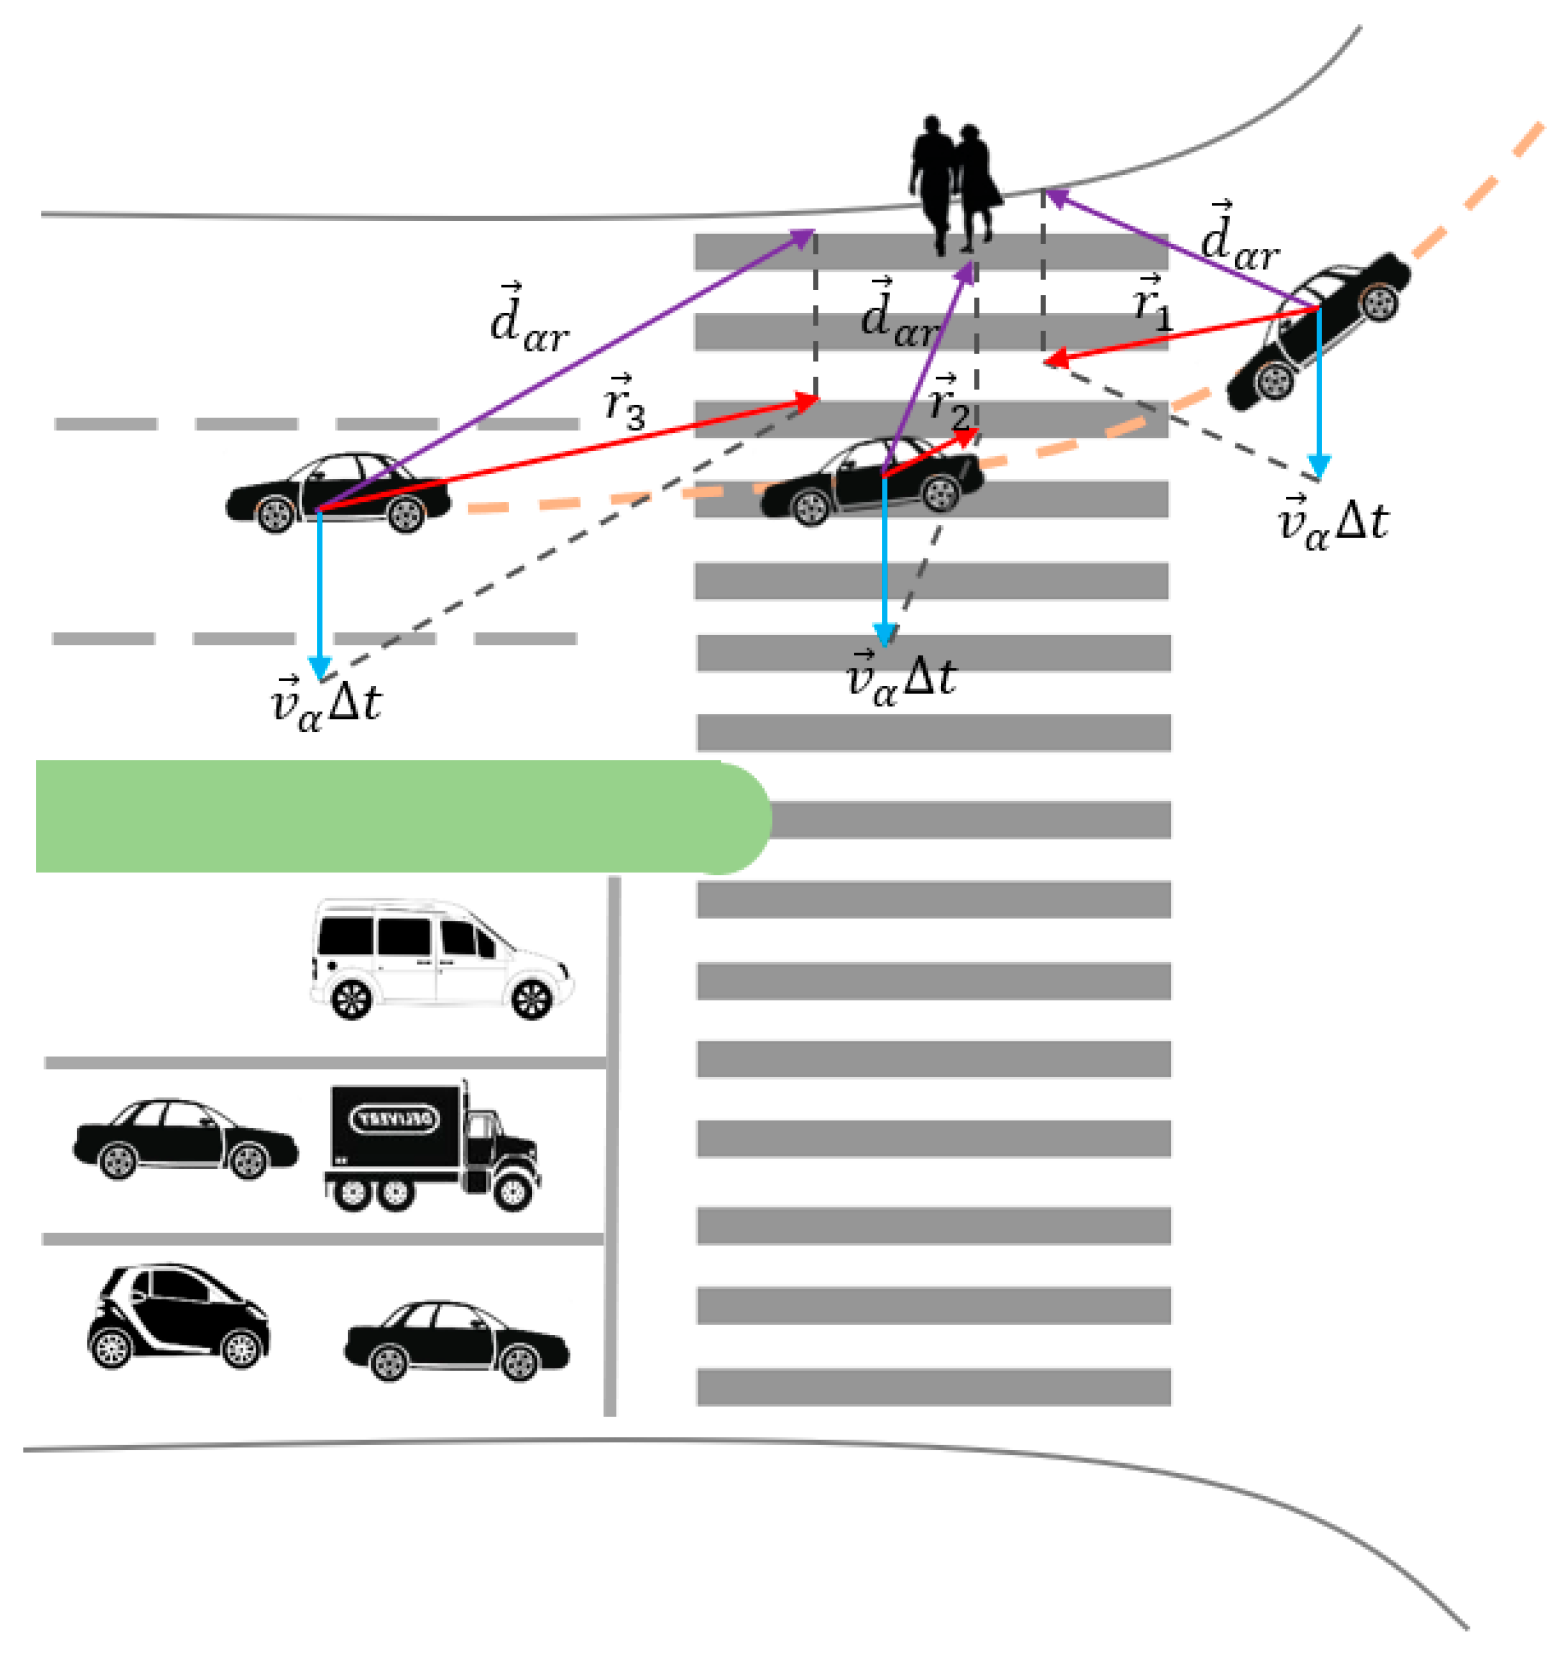
As shown in Figure 6, right-turning vehicles are assumed to be stationary at different positions. When the pedestrian moves toward the opposite exit at the speed , a shorter distance between the pedestrian and the vehicle corresponds to a smaller elliptical short semi-axis of the force potential field and to a larger force experienced by the pedestrian. The repulsive force exerted by the right-turning vehicle is inversely proportional to the distance between the vehicle and the pedestrian.
2.3. Simulation of Pedestrian Movements at Complex Traffic Intersections
According to the aforementioned influential factors of pedestrian movements, the classic SFM model is improved to generate an acceleration vector of pedestrians to simulate the movements at complex traffic intersections. To evaluate the simulation results, the Verlet algorithm is employed to estimate the pedestrian trajectory. The purpose of the Verlet algorithm is to update the position of a pedestrian () at time using the position () and the acceleration a() of the pedestrian at time and the sample interval . First, we perform the Taylor expansion on and :
By adding these two expressions, we can obtain the following positional expression:
By differentiating these two expressions, we obtain the speed and acceleration:
By substituting b(t) in Equation (22) into Equation (20), we can obtain updated equations for pedestrian speed and position:
where is a fixed time interval and accelerations and are calculated by the improved SFM.
2.4. Calibration of the Pedestrian-Cyclist Conflict Model
The improved SFM involves a variety of parameters, including the free speed of a pedestrian and the strength and range of forces exerted by the boundary, cyclists, other pedestrians, and vehicles (see Table 1). The MLE method, a widely used parameter calibration method based on statistical principles, is employed, using the extracted trajectories of pedestrians, cyclists, and vehicles. The position of a pedestrian in the next simulation time step, , is assumed to be predicted by the model parameter . The moving distance from points and obeys the normal distribution with a mean and a standard deviation . According to the observed trajectories, the mean and a standard deviation of the single step distance are estimated. The likelihood function concerning is obtained:
For simplicity, both sides of Equation (24) are converted by logarithmic functions. Therefore, the value of that corresponds to the maximum of can be obtained:
3. Experiment and Result Analysis
3.1. Experimental Configuration
To evaluate the performance of the proposed approach, this study used the DJI Inspire 1 Pro to conduct experiments in the high-tech development zone at Nanshan district, Shenzhen. The used DJI Inspire 1 Pro is equipped with a GPS receiver and a built-in inertial measurement unit (IMU), which incorporates both a 6-axis gyroscope and an accelerometer for movement compensation. The camera mounted by the used DJI Inspire 1 Pro is capable of stably recording road traffic at 4K (3840 X 2187) resolution (30fps). The experimental area is located in the center of the Science and Technology Park, which is a key intersectional area in terms of the massive traffic around the commercial and industrial parks. Data were acquired by experienced drone pilots during peak hours (on- and off-duty hours and lunch breaks) when the pedestrian flow is large to ensure sufficient numbers of pedestrians, cyclists, and vehicles. The hovering height of the UAV was set to 50 meters above the ground. Videos of five road intersections were captured and processed. Flying permission was guaranteed by the local transportation administration. Extreme weather events (i.e., rain, winds, etc.) were avoided to ensure the safety.
3.2. Pedestrian and Cyclist Detection and Localization
To build the training set, we subsampled the raw UAV videos every 60 frames to generate the image set and manually annotated categories and locations of ground objects, such as pedestrians, cyclists, and vehicles. We trained PFPNet using these annotated images. Then, testing images were fed into the trained detector to produce sets of predicted boxes with class confidence scores, which were used to generate final trajectories.
To evaluate the performance of the proposed detection and tracking algorithm, we counted the number of pedestrians, cyclists, and vehicles in a sample of the obtained UAV videos. To be more specific, we used PFPNet to detect the ground objects (203 in total) and employed the KCF algorithm to keep track of them. We used the bounding box coordinates to mark the type and the location of the tracked objects. Hence, counting was done by simply tallying the number of bounding boxes. We quantitatively evaluated the counting result via the correctness (Cor), completeness (Com), and quality (Qua), which are defined in [45] as:
The true positives value (TP) denotes the number of correctly detected ground objects, the false positives value (FP) represents the number of invalid detections, and the false negatives value (FN) denotes the number of missed objects. Among the three evaluation criteria, quality is most important, since it considers both the correctness and completeness of detection algorithms.
We report the count results for all types of ground objects in Table 1. The detection and tracking algorithm works very well, and nearly all types of ground objects are accurately detected and tracked, especially vehicles, which achieve 100% quality. We noted that a few pedestrians and cyclists cannot be correctly recognized as the quality of the results for pedestrian and cyclist are 94.3% and 87.9%, respectively. These results occurred because some bicycles were largely occluded by their cyclists, making them look very similar to pedestrians from the bird’s eye view of the high-resolution UAV videos.
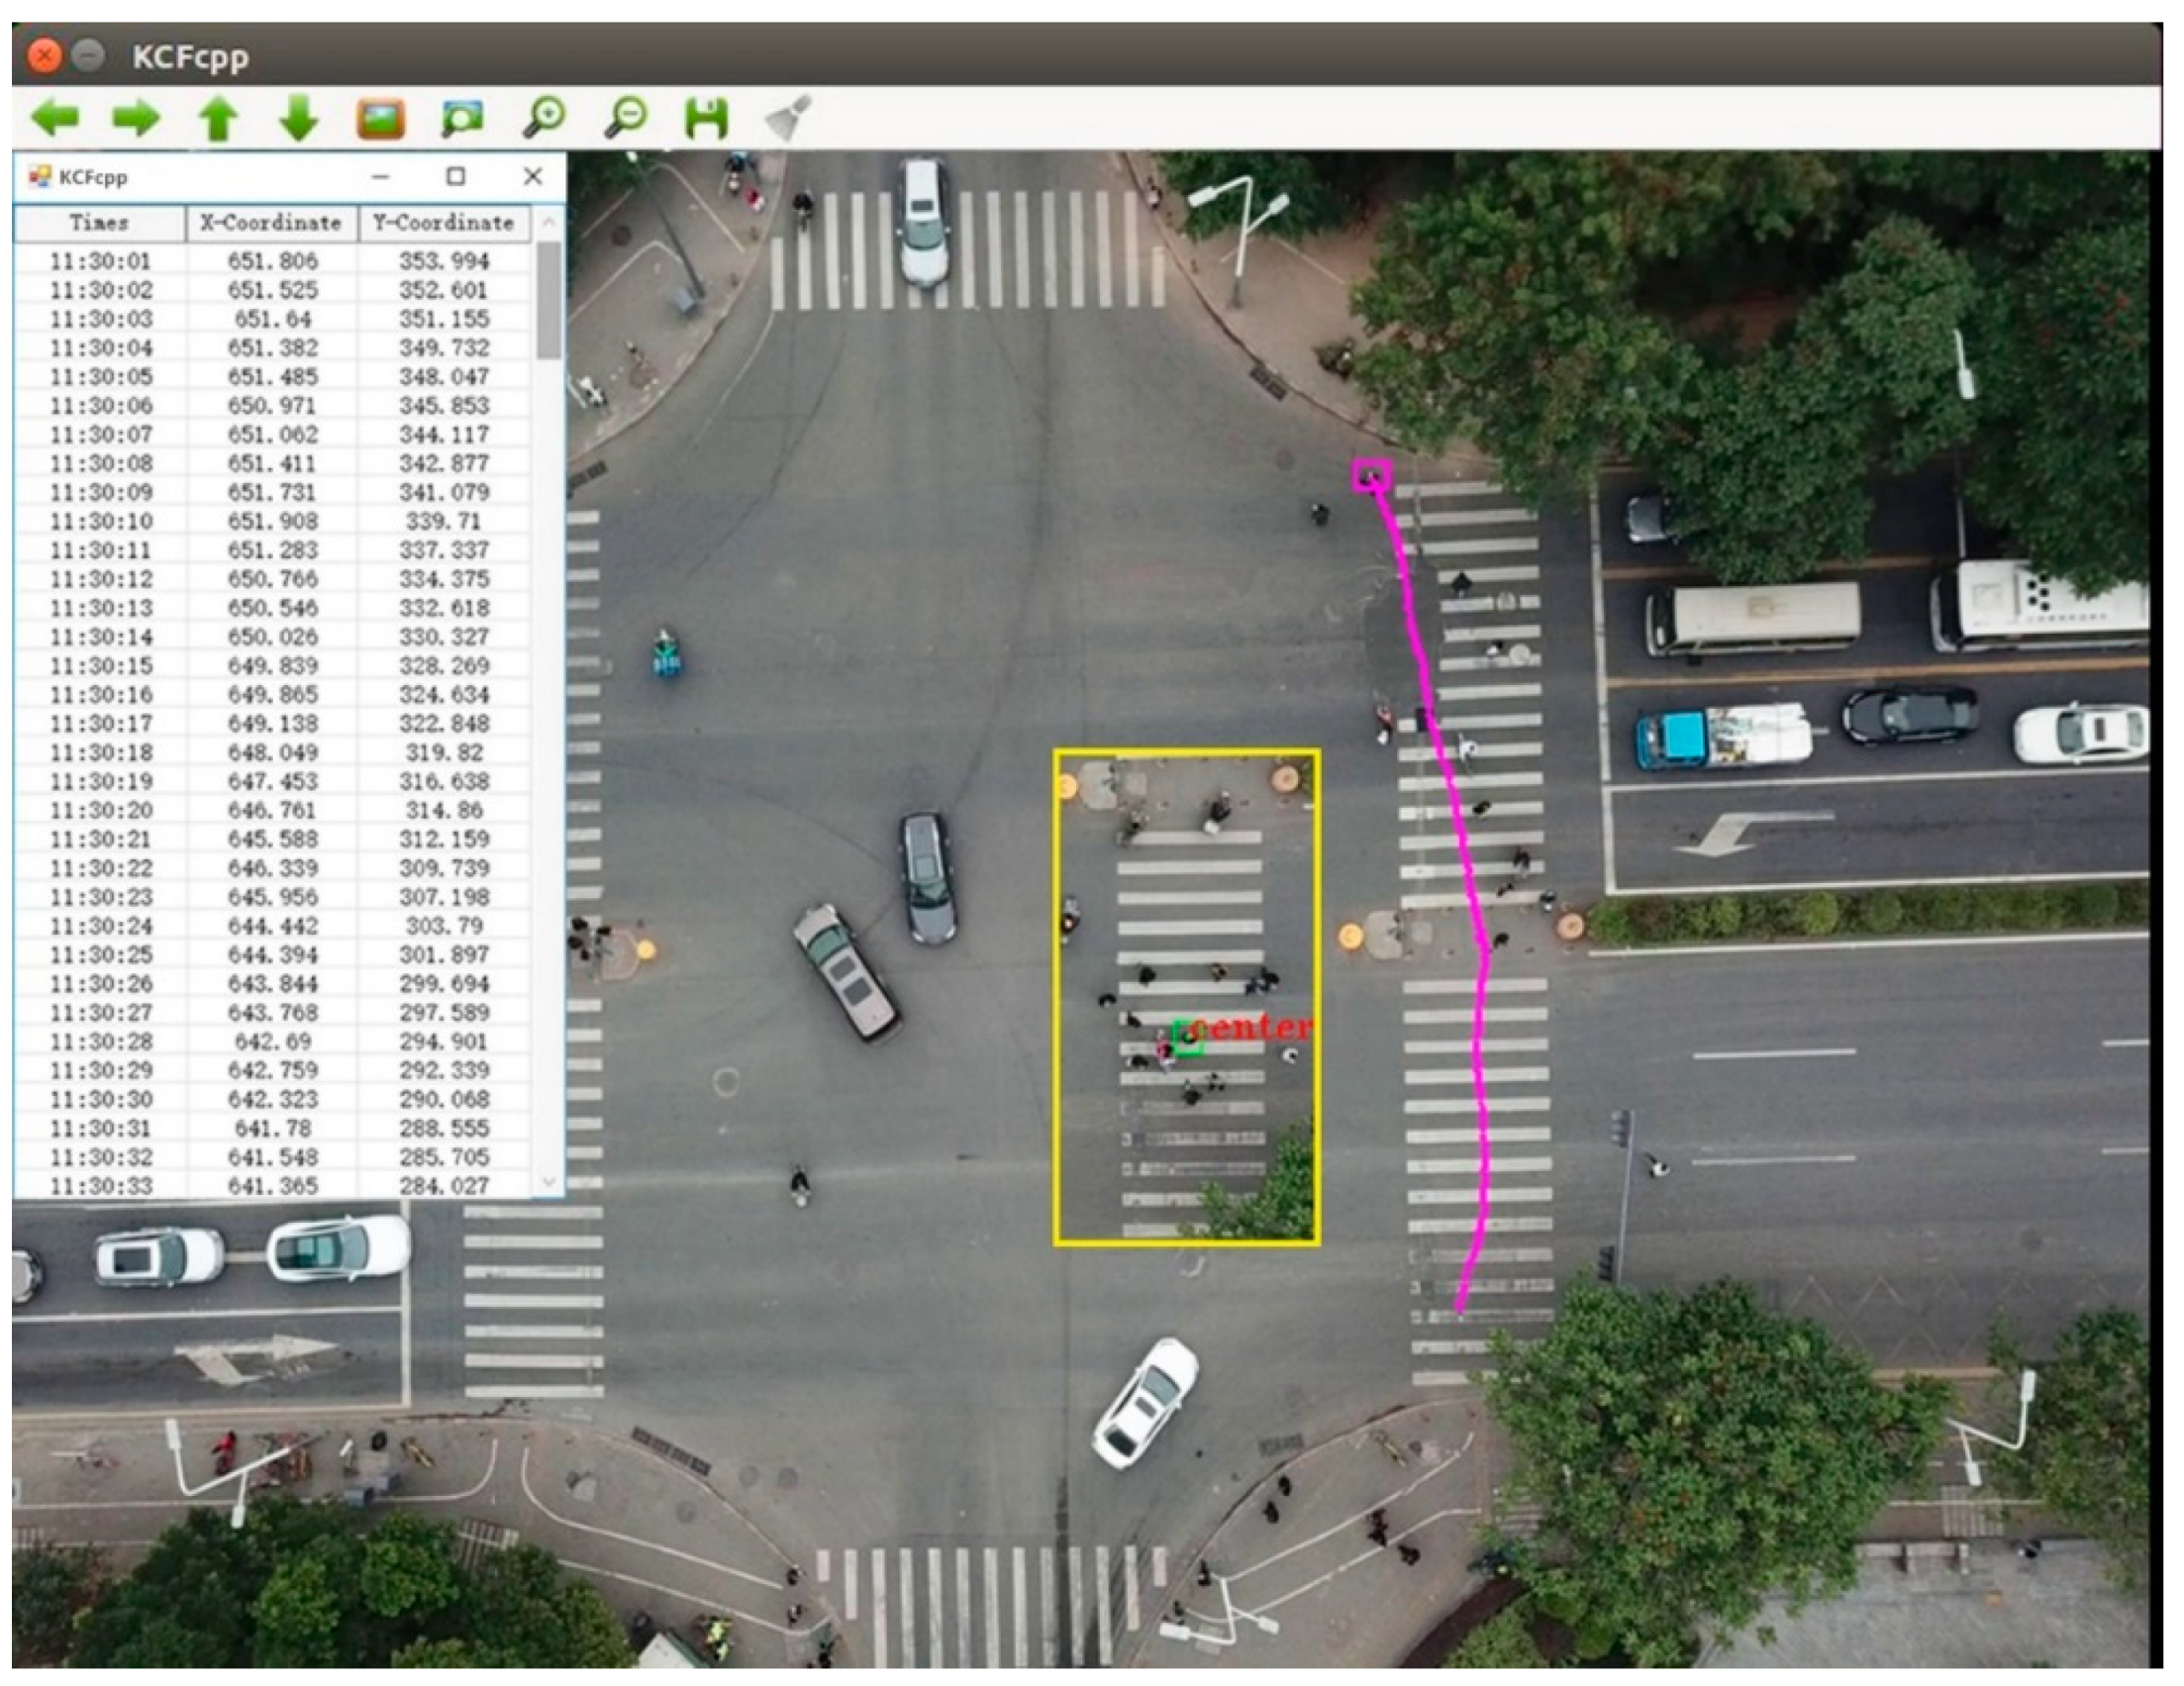
After processing the UAV videos, we extracted 2134 trajectories of pedestrians, cyclists, and vehicles. A total of 203 trajectories were of pedestrians and were impacted by cyclists, vehicles, or both. Figure 7 provides an example of an extracted pedestrian trajectory at one intersection.
3.3. Performance of the Improved Social Force Model
To assess the performance of the improved SFM, 80% of the pedestrian trajectories were selected to calibrate the SFM. The remaining 20% of the pedestrian trajectories were employed to simulate pedestrian movements at complex traffic intersections to evaluate the SFM’s accuracy.
The improved SFM contains a set of parameters, including the free speed of a pedestrian and the strength and range of forces exerted by the boundary, cyclists, other pedestrians, and vehicles. The parameters that are measurable but difficult to derive from the observed dataset were set by referring to related studies. Other parameters that do not have concrete physical meanings but can be indirectly derived from the pedestrian trajectories were calibrated by MLE in the MATLAB program. According to related studies, the free passage speed can be 1.5 m/s and the time needed for a pedestrian to recover from their actual speed to the expected speed is 0.5 s. The p-value of the strength and range of each force is less than 0.05 at the 95% confidence level; all the parameters in the improved SFM are significant.
Both the classic and improved SFM were used to simulate pedestrian positions at complex traffic intersections, assuming a pedestrian mass ranging from 45 to 75 kilograms and a simulation time step ∆t of 0.2 s. The simulation results were compared with the corresponding pedestrian trajectories acquired by the UAV, in terms of absolute positioning accuracy and mean average percent error (MAPE). The obtained results are reported in Table 2. The results demonstrate that the classical SFM achieves a positioning accuracy of 0.33 meters, with a MAPE of 12.43%. By considering additional influences of cyclists and vehicles, the improved SFM provides better performance, with a positioning accuracy of 0.25 meters and a MAPE of 9.04%.
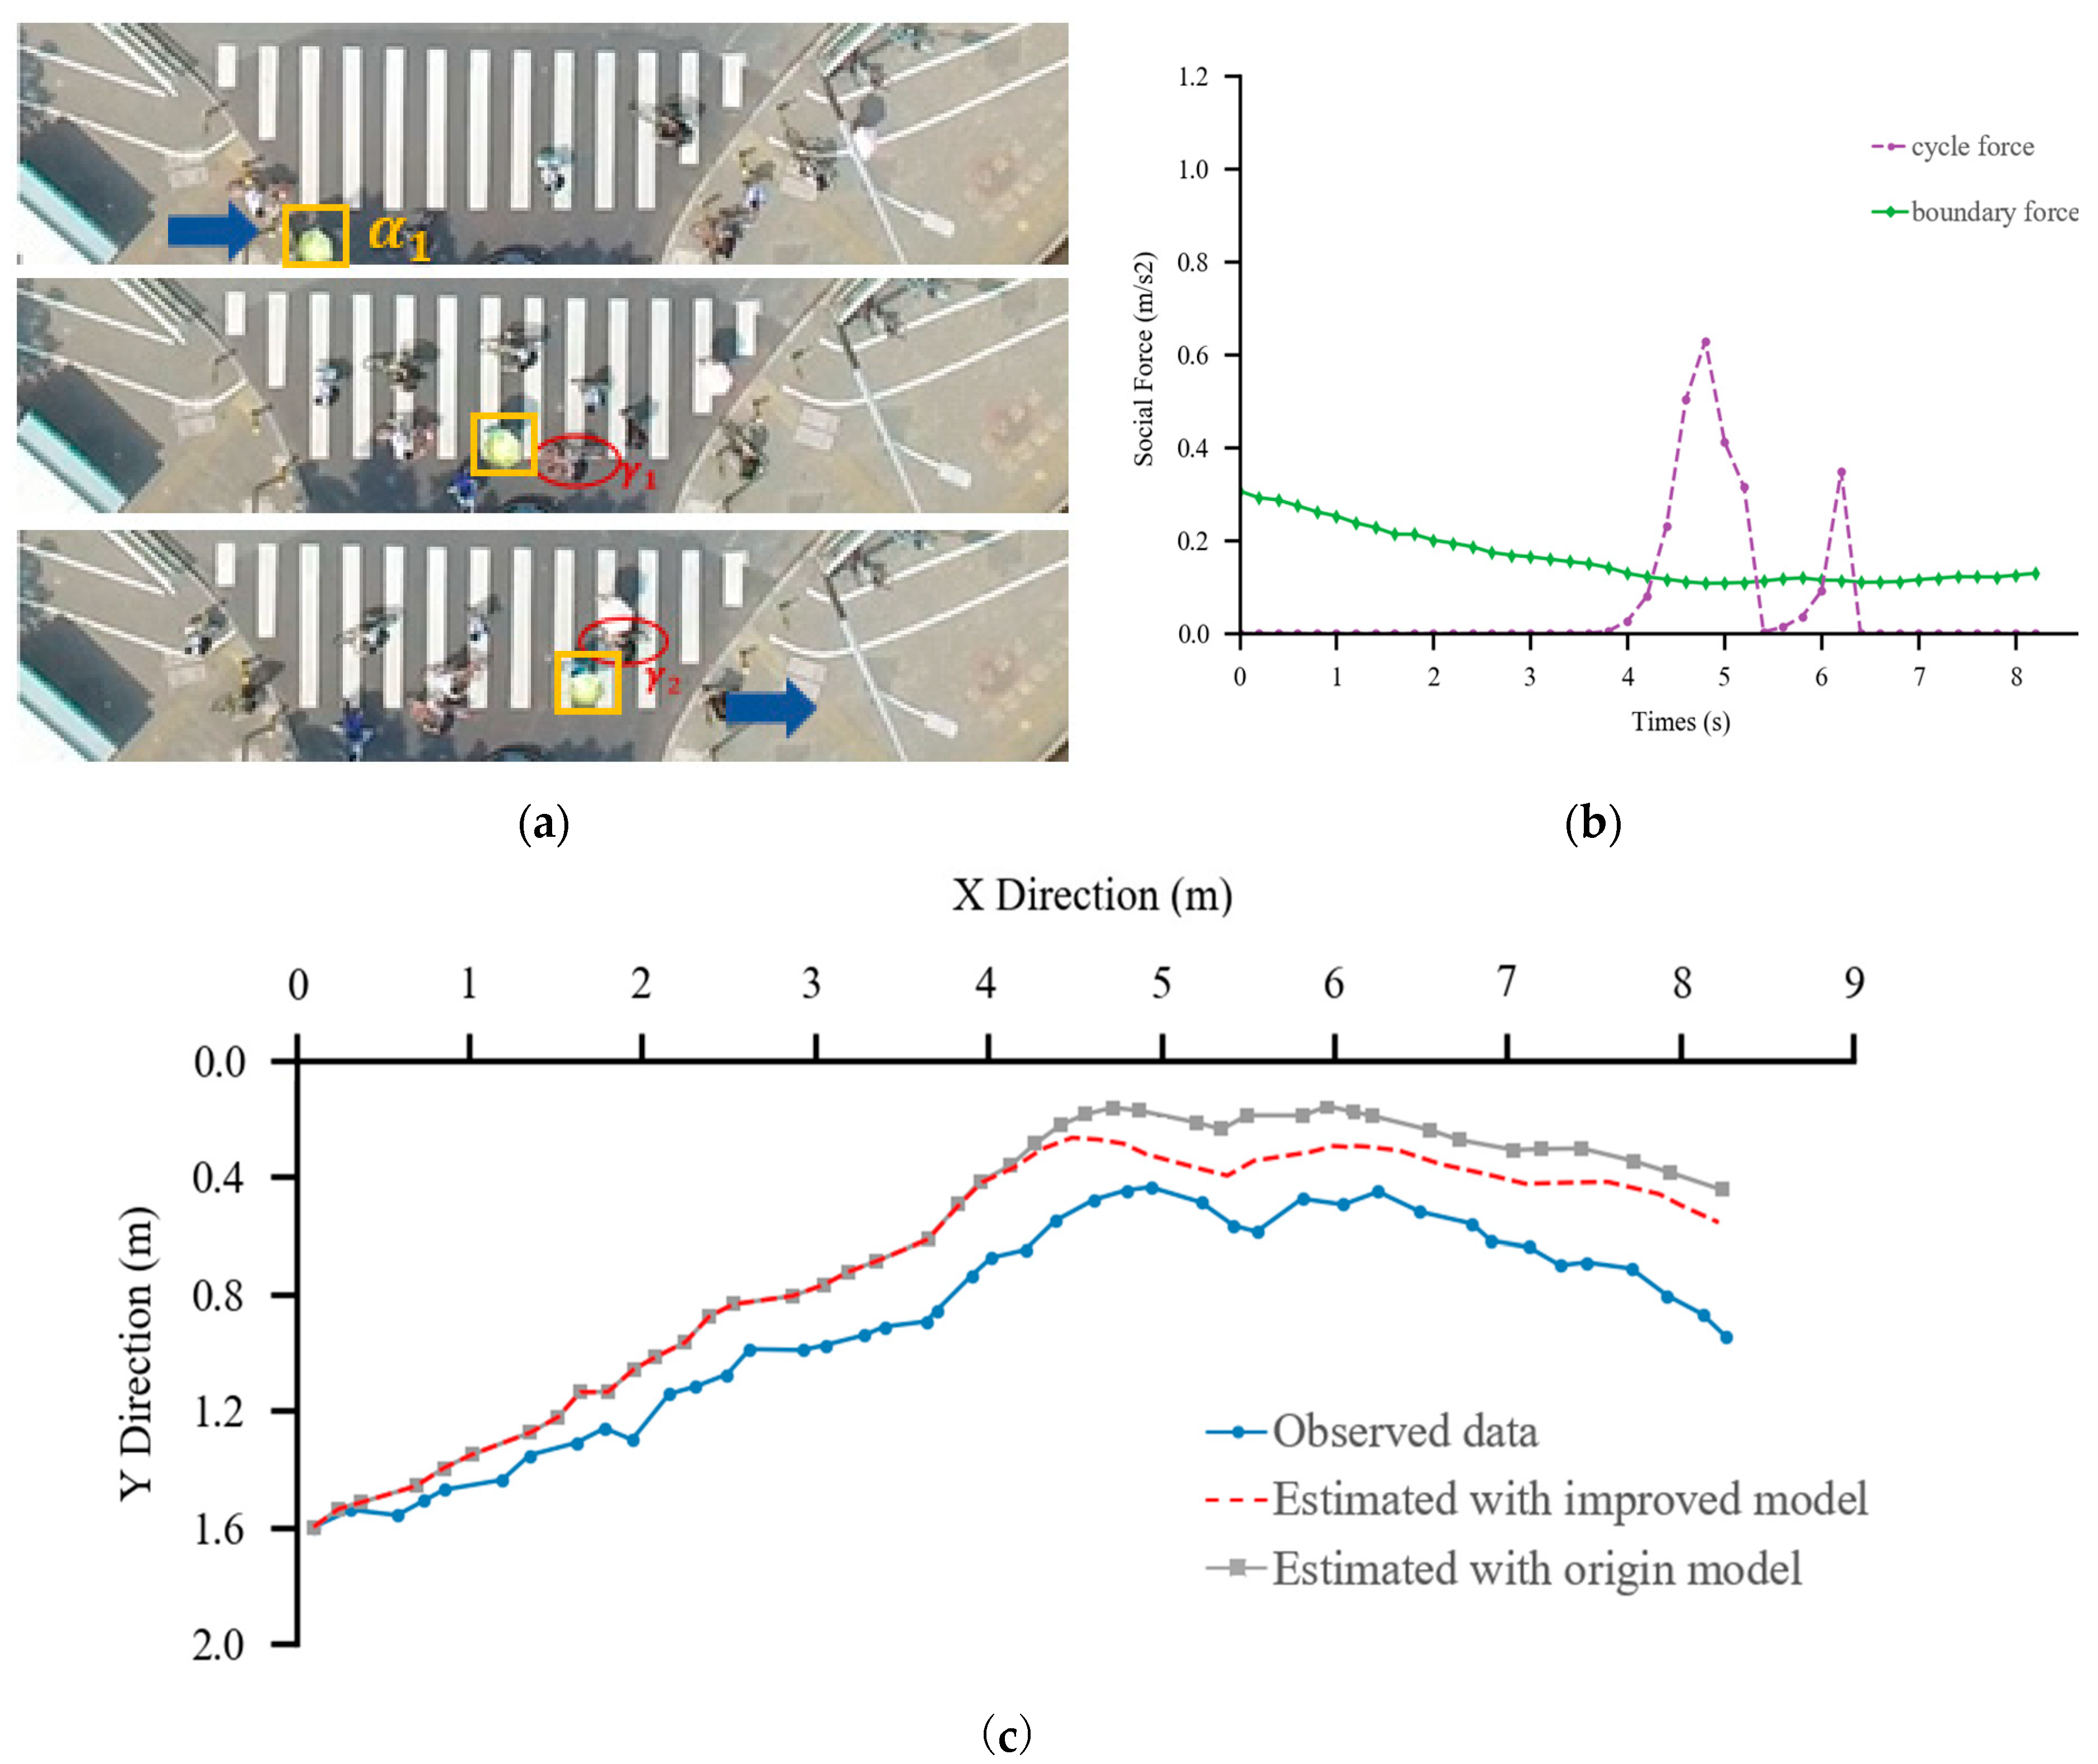
Figure 8 provides an example to evaluate the performance of the improved SFM. Figure 8a shows the recognition results of the pedestrian movements influenced by the boundary and cyclists. Figure 8b illustrates the force that the pedestrian experiences in the improved SFM. The boundary force always exists when the pedestrian is crossing an intersection. The boundary force behaves as an attractive force during the first 17 s when the pedestrian is within the crosswalk, and the force strength is proportional to the distance between the pedestrian and the boundary. As the pedestrian enters the crosswalk, the boundary force becomes a repulsive force with a strength that is inversely proportional to the distance between the pedestrian and the boundary. The initial repulsive force exerted by cyclists is 0. During the time interval between 19 and 32 s, conflicts among the pedestrian and cyclists and emerge. Because the distance between them is small, the repulsive forces suddenly increase. Once the pedestrian passes a cyclist, the force exerted by the cyclist gradually reduces to zero. Figure 8c shows the estimated position and trajectory of pedestrian in different models. To visually analyze the model performance, the MAPEs of estimated trajectories in the x and y directions are calculated. The maximum error of the improved SFM is 0.21 m, less than 0.47 m for classic SFM. The difference between the two models is primarily observed in the conflict area between pedestrians and cyclists. The improved model can estimate the pedestrian position and trajectory better than the traditional model.
Figure 9 shows another pedestrian’s movement affected by the boundary, cyclists, and nearby pedestrians. Figure 9a illustrates the recognized pedestrians and cyclists. Figure 9b shows that the cyclist force has the largest influence on the pedestrian’s movement, which is determined by their speeds and the distance between the cyclist and the pedestrian. The force exerted by surrounding pedestrians has the second largest impact on the pedestrian’s movement, which primarily occurs during the first 40 s when conflicts among pedestrians emerge; its strength is inversely proportional to the distance between two pedestrians. The boundary force always exists as the pedestrian remains within the crosswalk. Figure 9c displays the extracted and simulated trajectories. The maximum error of the improved SFM is 0.58 m, less than 0.88 m for classic SFM, which demonstrates the better performance of the improved SFM in describing the pedestrian movement as impacted by complex disturbances. In addition, the MAPE, which reflects the average error of the estimated position in each step of the simulation, is evenly distributed in the conflict area throughout the simulation process, which causes an indistinct difference in the model simulation accuracy.
4. Conclusions
Simulation of intersections is important to track and simulate pedestrian movements at these intersections. Correspondingly, a UAV-based method is proposed to track and simulate pedestrian movements at complex traffic intersections. High-resolution UAV videos of the intersections are employed to extract high-resolution movements of pedestrians, cyclists, and vehicles. Given the potential conflicts among pedestrians, cyclists, and vehicles, an improved social force model that considers the surrounding pedestrians, boundaries, cyclists, and right-turning vehicles is proposed and calibrated for pedestrian movement simulation. Videos acquired of intersections in Shenzhen City are utilized for high-precision pedestrian movement simulation. The results demonstrate that
In this study, a UAV is employed as a pedestrian monitoring platform to provide high-precision pedestrian trajectories at complex traffic intersections for the improved social force model, which significantly improves the simulation accuracy. The following aspects require additional attention in future research: (1) the UAV-based method is subject to slight drift during flight, which reduces the accuracy of trajectory data acquisition. Ground control points can assist in UAV image correction and improve absolute positioning accuracy. On the other hand, additional factors associated with pedestrians movements should be included in the presented SFM, such as pedestrian’s psychology and pedestrian density. (2) Following the connected UAV approach [53,54], the experiment at one traffic intersection will be extended to monitoring and simulating pedestrian movements at a set of intersections, simultaneously using connected UAVs [55] and cloud services [43].
Author Contributions
Author contributions: J.Z. and S.C. conceived and designed the experiments; S.C. and W.T performed the experiments; S.C. and K.S. analyzed the data; S.C and W.T. wrote the paper.
Funding
This work was supported in part by the National Natural Science Foundation of China under Grant 41871329 and 7181101150, in part by the Shenzhen Future Industry Development Funding Program under Grant 201607281039561400, and in part by the Shenzhen Scientific Research and Development Funding Program under Grant JCYJ20180305125113883 and JCYJ20170818092931604, and China Scholarship Council 201708440434.
Conflicts of Interest
The authors declare no conflict of interest. The founding sponsors had no role in the design of the study; in the collection, analysis, or interpretation of data; in the writing of the manuscript, and in the decision to publish the results.
References
- Wu, Y.; Zhang, S.J.; Hao, J.M.; Liu, H.; Wu, X.M.; Hu, J.N.; Walsh, M.P.; Wallington, T.J.; Zhang, K.M.; Stevanovic, S. On-road vehicle emissions and their control in China: A review and outlook. Sci. Total Environ. 2017, 574, 332–349. [Google Scholar] [CrossRef]
- Fishman, E.; Washington, S.; Haworth, N. Bike share’s impact on car use: Evidence from the united states, Great Britain, and Australia. Transp. Res. Part D Transp. Environ. 2014, 31, 13–20. [Google Scholar] [CrossRef]
- WHO. Global Status Report on Road Safety 2015. World Health Organization, 2015. Available online: https://www.who.int/violence_injury_prevention/road_safety_status/2015/en/ (accessed on 2 April 2019).
- Transport Canada. Canadian Motor Vehicle Traffic Collision 2014. Transport Canada, 2016. Available online: https://www.tc.gc.ca/media/documents/roadsafety/cmvtcs2014_eng.pdf (accessed on 2 April 2019).
- Jan Gehl. Cities for People. Isl. Press, 2013. Available online: https://islandpress.org/books/cities-people (accessed on 15 April 2019).
- Svensson, A.; Pauna-Gren, J. Safety at cycle crossings: The relationship between motor vehicle driver’s yielding behavior and cyclists’ traffic safety. In Proceedings of the 28th ICTCT Workshop, Ashdod, Israel, 29–30 October 2015. [Google Scholar]
- Lee, J.; Abdel-Aty, M.; Cai, Q. Intersection crash prediction modeling with macro-level data from various geographic units. Accid. Anal. Prev. 2017, 102, 213–226. [Google Scholar] [CrossRef] [PubMed]
- Battiato, S.; Farinella, G.M.; Giudice, O.; Cafiso, S.; Graziano, A.D. Vision based traffic conflict Analysis. In Proceedings of the AEIT Annual Conference, Mondello, Italy, 3–5 October 2013. [Google Scholar]
- Brow, G.R. Traffic conflicts for road user safety studies. Can. J. Civ. Eng. 1994, 21, 1–15. [Google Scholar] [CrossRef]
- Zaki, M.H.; Sayed, T. Automated Analysis of Pedestrians’ Nonconforming Behavior and Data Collection at an Urban Crossing. Transp. Res. Rec. 2014, 2443, 123–133. [Google Scholar] [CrossRef]
- Sacchi, E.; Sayed, T.; Deleur, P. A comparison of collision-based and conflict-based safety evaluations: The case of right-turn smart channels. Accid. Anal. Prev. 2013, 59, 260–266. [Google Scholar] [CrossRef] [PubMed]
- Li, J.; Shao, C.; Xu, W.T. Real-time system for tracking and classification of pedestrians and bicycles. Transp. Res. Rec. 2010, 2198, 83–92. [Google Scholar] [CrossRef]
- Cao, R.; Zhu, J.; Tu, W.; Li, Q.; Cao, J.; Liu, B.; Zhang, Q.; Qiu, G. Integrating Aerial and Street View Images for Urban Land Use Classification. Remote Sens. 2018, 10, 1553. [Google Scholar] [CrossRef]
- Tu, W.; Cao, J.Z.; Yue, Y.; Shaw, S.L.; Zhou, M.; Wang, Z.S.; Chang, X.M.; Xu, Y.; Li, Q.Q. Coupling mobile phone and social media data: A new approach to understanding urban functions and diurnal patterns. Int. J. Geogr. Inf. Sci. 2017, 31, 2331–2358. [Google Scholar] [CrossRef]
- Veeraraghavan, H.; Masoud, O.; Papanikolopoulos, N.P. Computer vision algorithms for intersection monitoring. IEEE Trans. Int. Transp. Syst. 2003, 4, 78–89. [Google Scholar] [CrossRef] [Green Version]
- Kaur, S.; Nieuwenhuijsen, M.J.; Colvile, R.N. Fine particulate matter and carbon monoxide exposure concentrations in urban street transport microenvironments. Atmos. Environ. 2007, 41, 4781–4810. [Google Scholar] [CrossRef]
- Dimitrievski, M.; Veelaert, P.; Philips, W. Behavioral pedestrian tracking using a camera and LiDAR sensors on a moving vehicle. Sensors 2019, 19, 391. [Google Scholar] [CrossRef] [PubMed]
- Wu, J.Q.; Xu, H.; Zheng, Y.C.; Tian, Z. A novel method of vehicle-pedestrian near-crash identification with roadside LiDAR data. Accid. Anal. Prev. 2018, 121, 238–249. [Google Scholar] [CrossRef]
- Kastrinaki, V.; Zervakis, M.; Kalaitzakis, K. A survey of video processing techniques for traffic applications. Image Vis. Comput. 2003, 21, 359–381. [Google Scholar] [CrossRef] [Green Version]
- Zhou, H.; Kong, H.; Wei, L.; Creighton, D.; Nahavandi, S. Efficient road detection and tracking for unmanned aerial vehicle. IEEE Trans. Int. Transp. Syst. 2015, 16, 297–309. [Google Scholar] [CrossRef]
- Joshi, K.A.; Thakore, D.G. A survey on moving object detection and tracking in video surveillance system. Int. J. Soft Comput. Eng. 2012, 2, 44–48. [Google Scholar]
- Kim, S.W.; Kook, H.; Sun, J.; Kang, M.; Ko, S. Parallel feature pyramid network for object detection. In Proceedings of the European Conference on Computer Vision (ECCV 2018), Munich, Germany, 8 September 2018. [Google Scholar]
- He, K.; Zhang, X.; Ren, S.; Sun, J. Spatial pyramid pooling in deep convolutional networks for visual recognition. IEEE Trans. Int. Transp. Syst. 2015, 37, 1904–1916. [Google Scholar] [CrossRef]
- Hussein, M.; Sayed, T. Validation of an agent-based microscopic pedestrian simulation model in a crowded pedestrian walking environment. Transp. Plan. Technol. 2019, 42, 1–22. [Google Scholar] [CrossRef]
- Liang, M.; Hu, X.L. Recurrent Convolutional Neural Network for Object Recognition. In Proceedings of the IEEE Conference on Computer Vision and Pattern Recognition, Boston, MA, USA, 7–12 June 2015; pp. 3367–3375. Available online: https://www.cv-foundation.org/openaccess/content_cvpr_2015/papers/Liang_Recurrent_Convolutional_Neural_2015_CVPR_paper.pdf (accessed on 15 April 2019).
- Girshick, R. Fast R-CNN. In Proceedings of the IEEE International Conference on Computer Vision, Las Condes, Chile, 11–18 December 2015; pp. 1440–1448. Available online: https://www.cv-foundation.org/openaccess/content_iccv_2015/papers/Girshick_Fast_R-CNN_ICCV_2015_paper.pdf (accessed on 15 April 2019).
- Liu, W.; Anguelov, D.; Erhan, D.; Szegedy, C.; Reed, S.; Fu, C.Y. Ssd: Single shot multibox detector. In Proceedings of the European Conference on Computer Vision, Amsterdam, The Netherlands, 8–16 October 2016; pp. 21–37. Available online: https://arxiv.org/abs/1512.02325 (accessed on 15 April 2019).
- Redmon, J.; Farhadi, A. YOLOv3: An Incremental Improvement. arXiv: Computer Vision and Pattern Recognition. 2018. Available online: https://arxiv.org/abs/1804.02767 (accessed on 1 April 2019).
- Cai, Z.W.; Vasconcelos, N. Cascade r-cnn: Delving into high quality object detection. In Proceedings of the IEEE Conference on Computer Vision and Pattern Recognition, Salt Lake City, UT, USA, 18–22 June 2018; pp. 6154–6162. Available online: https://arxiv.org/abs/1712.00726 (accessed on 15 April 2019).
- Kim, S.W.; Kook, H.K.; Sun, J.Y.; Kang, M.C.; Ko, S.J. Parallel feature pyramid network for object detection. In Proceedings of the European Conference on Computer Vision (ECCV), Munich, Germany, 8–14 September 2018; Available online: https://0-link-springer-com.brum.beds.ac.uk/chapter/10.1007/978-3-030-01228-1_15 (accessed on 1 April 2019).
- Kerner, B.S.; Klenov, S.L. A microscopic model for phase transitions in traffic flow. J. Phys. A Math. Gen. 2002, 35, 31–43. [Google Scholar] [CrossRef]
- Lovas, G.G. Modeling and simulation of pedestrian traffic flow. Transp. Res. Part B Meth. 1994, 28, 429–443. [Google Scholar] [CrossRef]
- Helbing, D.; Molnar, P. Social force model for pedestrian dynamics. Phys. Rev. E 1995, 51, 4282–4286. [Google Scholar] [CrossRef] [Green Version]
- Helbing, D.; Farkas, I.J.; Vicsek, T. Simulating dynamical features of escape panic. Nature 2000, 407, 487–490. [Google Scholar] [CrossRef] [Green Version]
- Helbing, D.; Johansson, A. Pedestrian, crowd and evacuation dynamics. Encycl. Complex. Syst. Sci. 2010, 16, 6475–6495. [Google Scholar]
- Helbing, D.; Molnar, P.; Farkas, I.J.; Bolay, K. Self-organizing pedestrian movement. Environ. Plan. B 2001, 28, 361–384. [Google Scholar] [CrossRef]
- Helbing, D.; Buzna, L.; Johansson, A.; Werner, T. Self-organized pedestrian crowd dynamics: Experiments, simulations, and design solutions. Transp. Sci. 2005, 39, 1–24. [Google Scholar] [CrossRef]
- Johansson, A.; Helbing, D.; Pradyumn, K.S. Specification of the social force pedestrian model by evolutionary adjustment to video tracking data. Adv. Complex Syst. 2007, 10, 271–288. [Google Scholar] [CrossRef]
- Hou, L.; Liu, J.G.; Pan, X. A social force evacuation model with the leadership effect. Physica A 2014, 400, 93–99. [Google Scholar] [CrossRef]
- Zeng, W.L.; Chen, P.; Nakamura, H.; Iryo-Asano, M. Application of social force model to pedestrian behavior analysis at signalized crosswalk. Transp. Res. Part C Emerg. Technol. 2014, 40, 143–159. [Google Scholar] [CrossRef]
- Zeng, W.L.; Nakamura, H.; Chen, P. A modified social force model for pedestrian behavior simulation at signalized crosswalks. Procedia Soc. Behav. Sci. 2014, 138, 521–530. [Google Scholar] [CrossRef]
- Liu, M.X.; Zeng, W.L.; Chen, P.; Wu, X.Y. A microscopic simulation model for pedestrian-pedestrian and pedestrian-vehicle interactions at crosswalks. PLoS ONE 2017, 12, e0180992. [Google Scholar] [CrossRef]
- Salamí, E.; Gallardo, A.; Skorobogatov, G.; Barrado, C. On-the-Fly Olive Tree Counting Using a UAS and Cloud Services. Remote Sens. 2019, 11, 316. [Google Scholar] [CrossRef]
- Zhu, J.; Sun, K.; Jia, S.; Lin, W.; Hou, X.; Liu, B.; Qiu, G. Bidirectional Long Short-Term Memory Network for Vehicle Behavior Recognition. Remote Sens. 2018, 10, 887. [Google Scholar] [CrossRef]
- Zhu, J.S.; Sun, K.; Jia, S.; Li, Q.Q.; Hou, X.X.; Lin, W.D.; Liu, B.Z.; Qiu, G.P. Urban Traffic Density Estimation Based on Ultrahigh-Resolution UAV Video and Deep Neural Network. IEEE J. Sel. Top. Appl. Earth Obs. Remote Sens. 2018, 12, 4968–4981. [Google Scholar] [CrossRef]
- Khan, M.A.; Ectors, W.; Bellemans, T.; Janssens, D.; Wets, G. Unmanned Aerial Vehicle-Based Traffic Analysis: A Case Study for Shockwave Identification and Flow Parameters Estimation at Signalized Intersect. Remote Sens. 2018, 10, 458. [Google Scholar] [CrossRef]
- Simonyan, K.; Zisserman, A. Very Deep Convolutional Networks for Large-scale Image Recognition. 2015. Available online: https://arxiv.org/pdf/1409.1556.pdf (accessed on 3 April 2019).
- Russakovsky, O.; Deng, J.; Su, H.; Krause, J.; Satheesh, S.; Ma, S. ImageNet Large Scale Visual Recognition challenge. Int. J. Comput. Vis. 2014, 115, 211–252. [Google Scholar] [CrossRef]
- Huang, G.; Liu, Z.; Laurens, V.D.M.; Weinberger, K.Q. Densely Connected Convolutional Networks. In Proceedings of the Conference on Computer Vision and Pattern Recognition (CVPR 2017), Honolulu, HI, USA, 21–26 July 2017; pp. 2261–2269. [Google Scholar]
- Ioffe, S.; Szegedy, C. Batch Normalization: Accelerating Deep Network Training by Reducing Internal Covariate Shift. In Proceedings of the International Conference on Machine Learning (ICML 2015), Lille, France, 6–11 July 2015; pp. 448–456. [Google Scholar]
- Neubeck, A.; Gool, L.J. Efficient Non-maximum Suppression. In Proceedings of the 18th International Conference on Pattern Recognition (ICPR 2006), Hong Kong, China, 20–24 August 2006. [Google Scholar]
- Leitloff, J.; Rosenbaum, D.; Kurz, F.; Meynberg, O.; Reinartz, P. An Operational System for Estimating Road Traffic Information from Aerial Images. Remote Sens. 2014, 6, 11315–11341. [Google Scholar] [CrossRef] [Green Version]
- Tuyishimire, E.; Bagula, A.; Rekhis, S.; Boudriga, N. Cooperative Data Muling From Ground Sensors to Base Stations Using UAVs. In Proceedings of the 2017 IEEE Symposium on Computers and Communications, Heraklion, Crete, Greece, 3–6 July 2017. [Google Scholar]
- Tuyishimire, E.; Adiel, I.; Rekhis, S.; Bagula, B.A.; Boudriga, N. Internet of Things in Motion: A Cooperative Data Muling Model Under Revisit Constraints. In Proceedings of the 2016 International IEEE Conferences on Ubiquitous Intelligence & Computing, Advanced and Trusted Computing, Scalable Computing and Communications, Cloud and Big Data Computing, Internet of People, and Smart World Congress, Toulouse, France, 18–21 July 2016; pp. 1123–1130. [Google Scholar]
- Tuyishimire, E.; Bagula, A.; Ismail, A. Clustered Data Muling in the Internet of Things in Motion. Sensors 2019, 19, 484. [Google Scholar] [CrossRef] [PubMed]
Figure 1.
Workflow of tracking and simulating pedestrian movements at intersections using an unmanned aerial vehicle.
Figure 1.
Workflow of tracking and simulating pedestrian movements at intersections using an unmanned aerial vehicle.

Figure 2.
Overview of object detection using the improved PFPNet

Figure 3.
The forces on a pedestrian at a traffic intersection

Figure 4.
Repulsive and attractive forces at the crosswalk boundary. (a) Repulsive boundary force; (b) attractive boundary force.
Figure 4.
Repulsive and attractive forces at the crosswalk boundary. (a) Repulsive boundary force; (b) attractive boundary force.

Figure 5.
The interaction of a pedestrian and cyclists. (a) Scenario 1: pedestrian α moves in the same or opposite direction of cyclists r_1 and r_1, respectively. (b) Scenario 2: pedestrian α moves toward cyclists with two different speeds.
Figure 5.
The interaction of a pedestrian and cyclists. (a) Scenario 1: pedestrian α moves in the same or opposite direction of cyclists r_1 and r_1, respectively. (b) Scenario 2: pedestrian α moves toward cyclists with two different speeds.

Figure 6.
Repulsive force exerted by a vehicle at different positions on a pedestrian.

Figure 7.
An example of a pedestrian trajectory. The image with the yellow boundary is the tracking result of one pedestrian in one frame. After processing one UAV video, the table at the upper left is obtained, showing the location set of the target.
Figure 7.
An example of a pedestrian trajectory. The image with the yellow boundary is the tracking result of one pedestrian in one frame. After processing one UAV video, the table at the upper left is obtained, showing the location set of the target.

Figure 8.
Illustration of the modeled pedestrian movements affected by the boundary and a cyclist. (a) The recognized pedestrian and cyclist. (b) Forces exerted by the boundary and the cyclist in the improved SFM. (c) Comparison of traditional and improved social force models.
Figure 8.
Illustration of the modeled pedestrian movements affected by the boundary and a cyclist. (a) The recognized pedestrian and cyclist. (b) Forces exerted by the boundary and the cyclist in the improved SFM. (c) Comparison of traditional and improved social force models.

Figure 9.
Illustration of the modeled pedestrian movements affected by the boundary, cyclists, and other pedestrians. (a) The recognized pedestrian and cyclists. (b) Forces exerted by the boundary, cyclists, and pedestrians in the improved SFM. (c) Comparison of traditional and improved social force models.


Table 1.
Count results from the test UAV video
| Type | TP | FP | FN | Correctness | Completeness | Quality |
|---|---|---|---|---|---|---|
| Pedestrian | 132 | 5 | 3 | 0.964 | 0.978 | 0.943 |
| Cyclist | 29 | 2 | 2 | 0.935 | 0.935 | 0.879 |
| Vehicle | 37 | 0 | 0 | 1.0 | 1.0 | 1.0 |
| Overall | 198 | 7 | 5 | 0.966 | 0.975 | 0.943 |
Table 2.
Accuracy of simulation results using the social force model
| Classical SFM | Improved SFM | |
|---|---|---|
| Positioning accuracy (meters) | 0.33 | 0.25 |
| MAPE | 12.43% | 9.04% |
© 2019 by the authors. Licensee MDPI, Basel, Switzerland. This article is an open access article distributed under the terms and conditions of the Creative Commons Attribution (CC BY) license (http://creativecommons.org/licenses/by/4.0/).
Share and Cite
MDPI and ACS Style
Zhu, J.; Chen, S.; Tu, W.; Sun, K. Tracking and Simulating Pedestrian Movements at Intersections Using Unmanned Aerial Vehicles. Remote Sens. 2019, 11, 925. https://0-doi-org.brum.beds.ac.uk/10.3390/rs11080925
AMA Style
Zhu J, Chen S, Tu W, Sun K. Tracking and Simulating Pedestrian Movements at Intersections Using Unmanned Aerial Vehicles. Remote Sensing. 2019; 11(8):925. https://0-doi-org.brum.beds.ac.uk/10.3390/rs11080925
Chicago/Turabian StyleZhu, Jiasong, Siyuan Chen, Wei Tu, and Ke Sun. 2019. "Tracking and Simulating Pedestrian Movements at Intersections Using Unmanned Aerial Vehicles" Remote Sensing 11, no. 8: 925. https://0-doi-org.brum.beds.ac.uk/10.3390/rs11080925
Note that from the first issue of 2016, this journal uses article numbers instead of page numbers. See further details here.