1. Introduction
The moon has been recognized as a very stable reflectance reference for satellite radiometer calibration owing to its intrinsically stable surface reflectance properties, lack of atmosphere and related weathering processes, and its availability to most satellite radiometers. Although most modern satellite radiometers are equipped with a solar diffuser (SD), and in many cases together with a solar diffuser stability monitor (SDSM), studies [
1,
2,
3] have shown that even with the best practices of utilizing the SD and SDSM onboard, residual degradations may not be all accounted for due to uncertainties in the characterization of various optical components. As a result, lunar calibration is recognized as a significant complement to the solar diffuser-based calibration as demonstrated by previous studies of the MODIS and VIIRS [
1,
2,
3].
On the other hand, despite the irrefutable stability of the lunar surface reflectance, the lunar radiance or irradiance has significant variability, primarily as a function of lunar phase angle, and to a smaller extent due to the libration, spectral variation, and distances between the earth and moon, as well as the moon and sun. As a result, absolute lunar calibration still has large uncertainties, although studies have shown that the uncertainties in the stability trending can be considerably smaller, or better than 0.1% [
4]. To reduce the uncertainties, extensive efforts have been made by the calibration community to improve the lunar irradiance models which predict the lunar irradiance/radiance given a particular time and observation geometry. The latest efforts include the Global Space-based Inter-calibration System (GSICS) Robotic Lunar Observatory (ROLO) model (also known as GIRO) which is a community effort involving many space and meteorological satellite agencies [
5,
6]. However, models rely on observations by well-characterized radiometers over a long period of time at specific angles, which are not widely available.
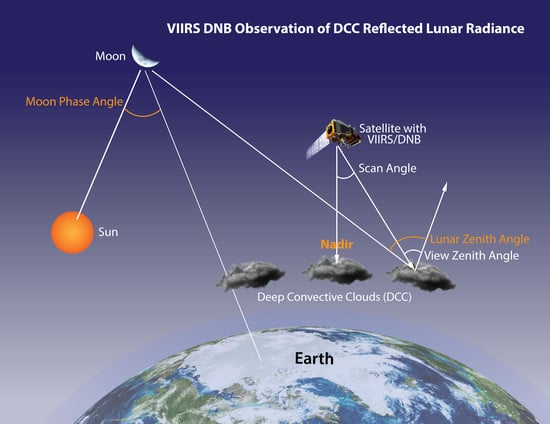
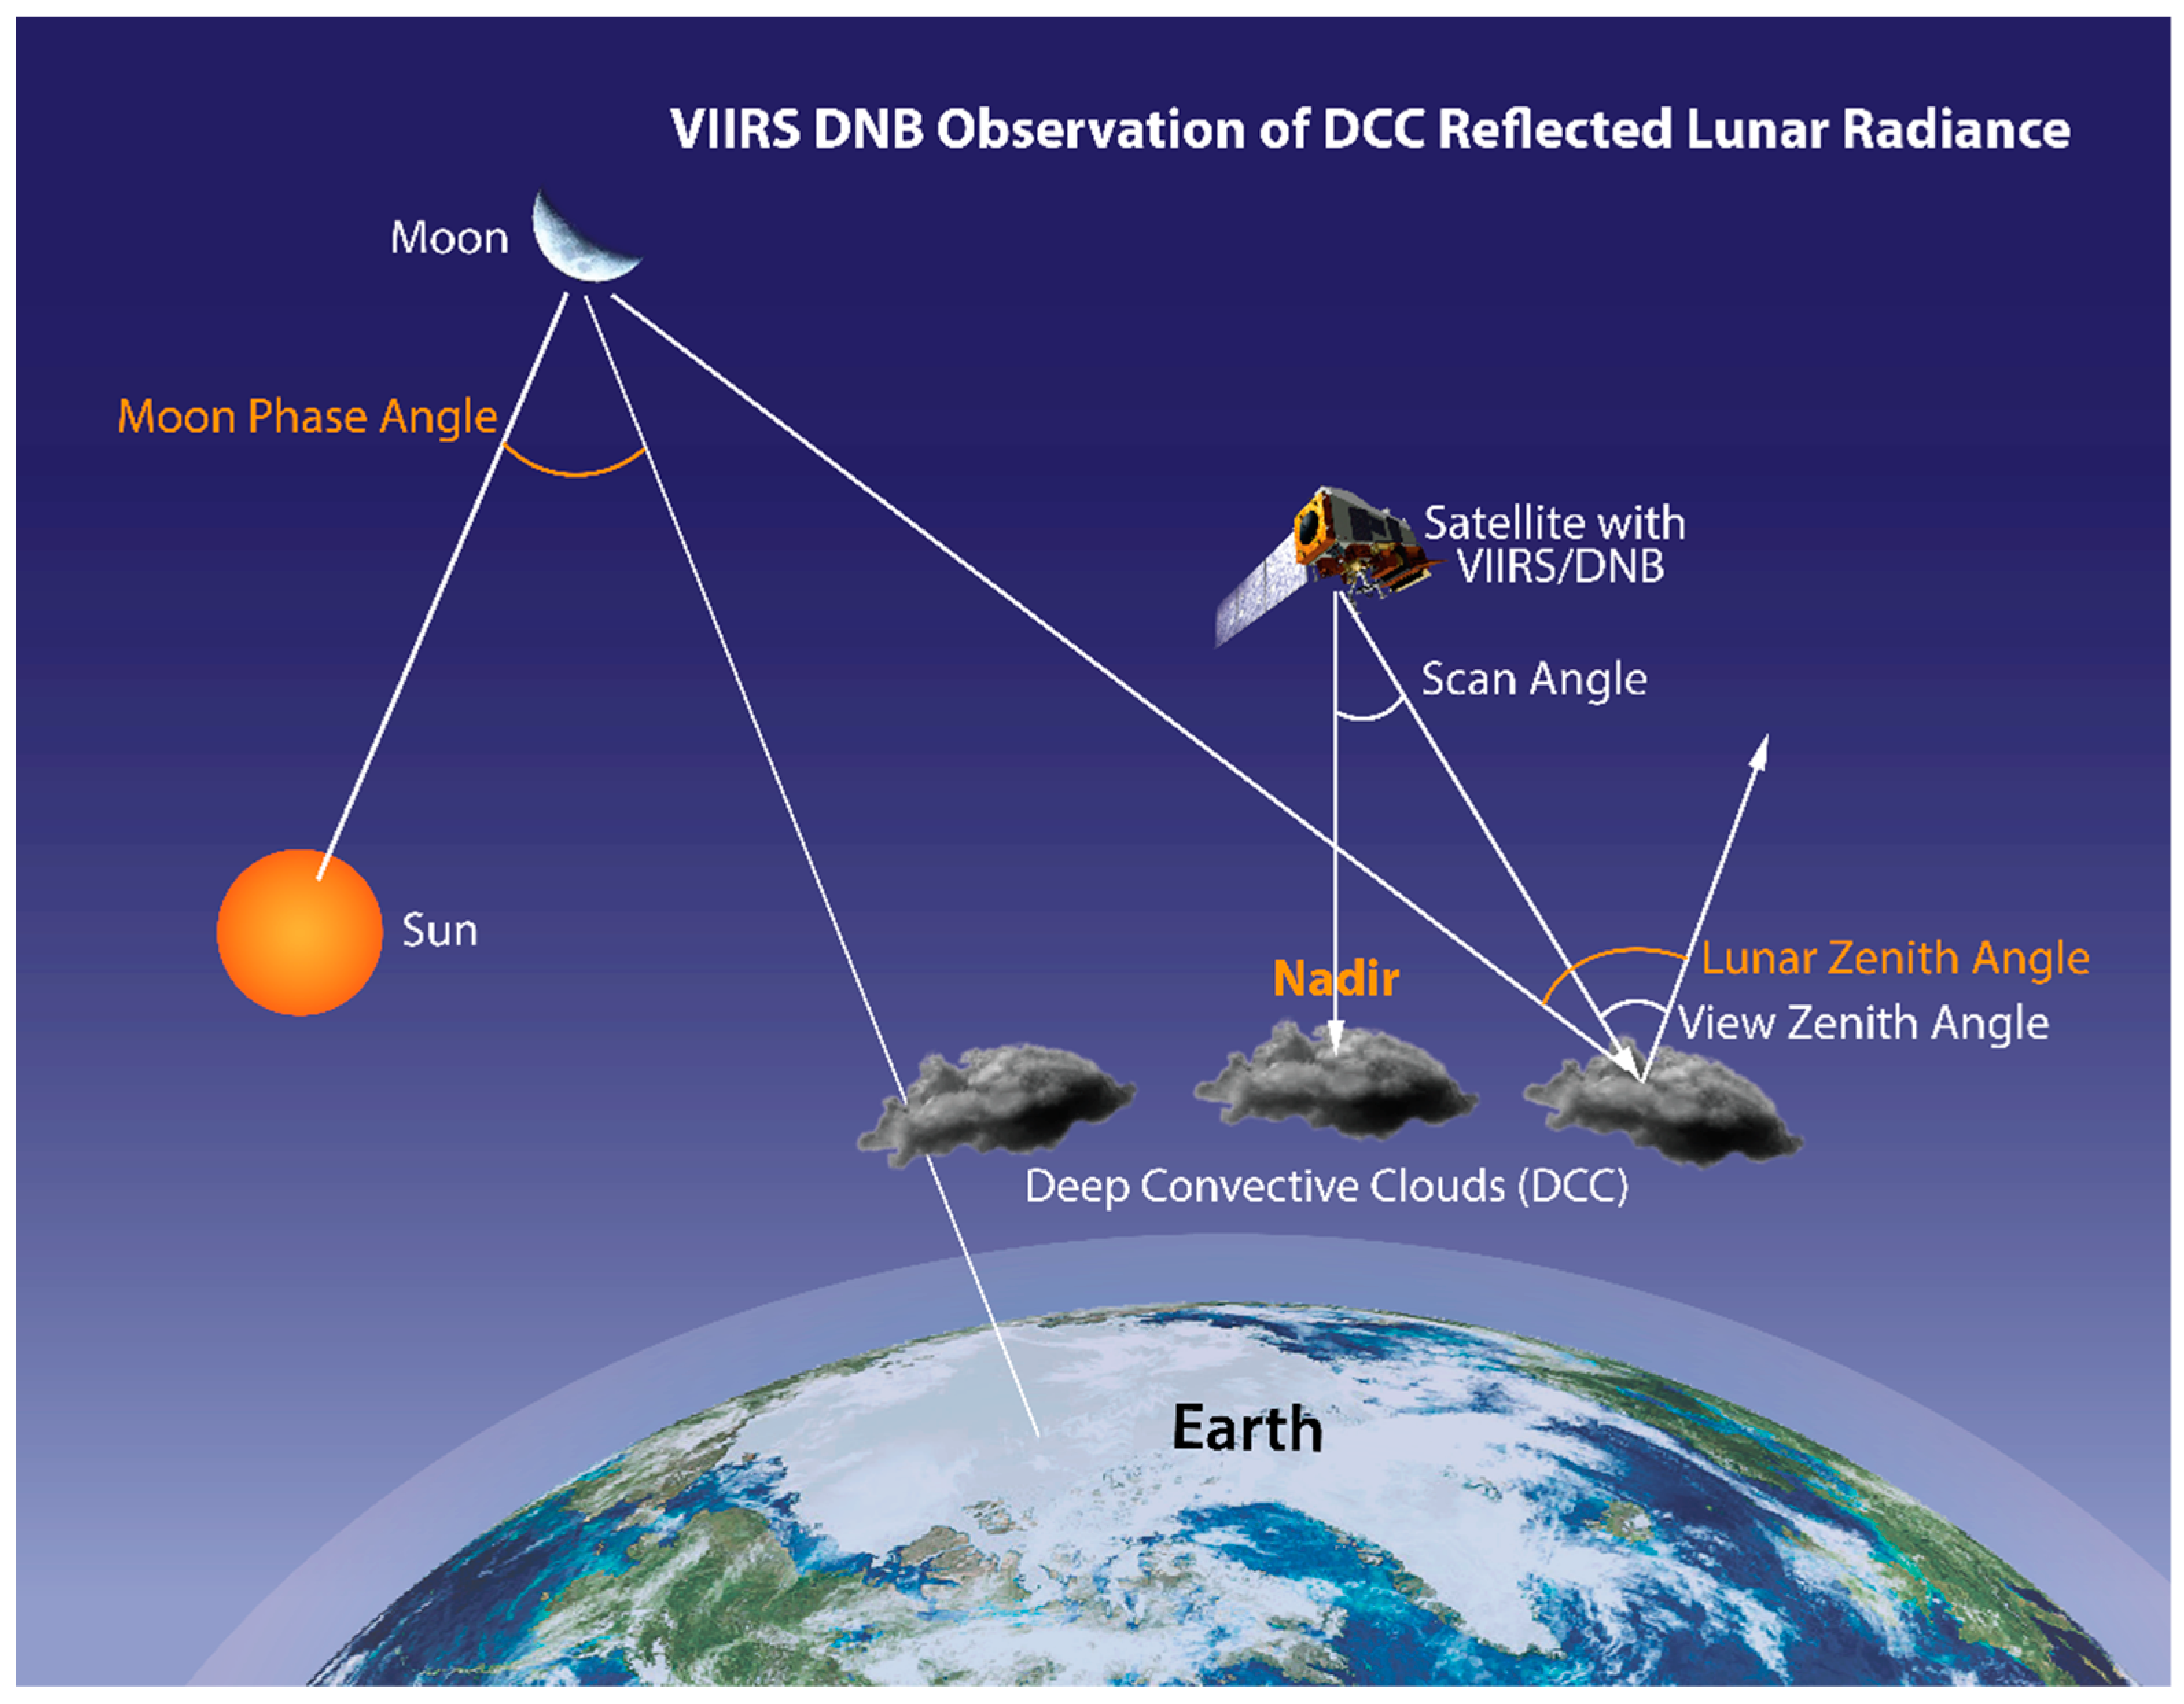
In this study, we present independent measurements of the lunar radiance reflected by the deep convective clouds (DCC) at nighttime by the VIIRS Day/Night Band (DNB) on Suomi NPP and NOAA-20 over time and as a function of lunar phase and zenith angles with an 86 second sampling interval. The lunar observations by Suomi NPP and NOAA-20 VIIRS DNB (the latter reached validated maturity in summer 2018) are compared by lunar phase angle to evaluate their consistency, and the data are also compared to the lunar irradiance model predictions by the GIRO and another independent model published in [
7], i.e., the MT2009. A time series is generated to compare the observations with model predictions, and the differences in the predicted values between the two lunar models are also evaluated.
The DNB on Suomi NPP is well characterized postlaunch and most importantly, has been very stable at least in the last three years. The small gain degradation of ~1% per year [
8] has also been calibrated out in the operational products, which provides sub-percent level uncertainties in the stability. Because the absolute radiances may still have uncertainties greater than 1%, the current study focuses on the lunar radiance reflected from the DCC mainly as a function of lunar phase angle. Therefore, this study primarily depends on the calibration stability of the instrument, since the DCC reflectance has been shown to be statistically stable (better than 1%) based on previous studies [
9,
10,
11,
12,
13,
14]. This paper is organized as follows.
Section 2 reviews the background and previous studies.
Section 3 introduces the methodology and data.
Section 4 compares the observations between VIIRS DNB from Suomi NPP and NOAA-20, and also compares with lunar model predictions.
Section 5 provides the conclusions.
2. Background and Previous Studies
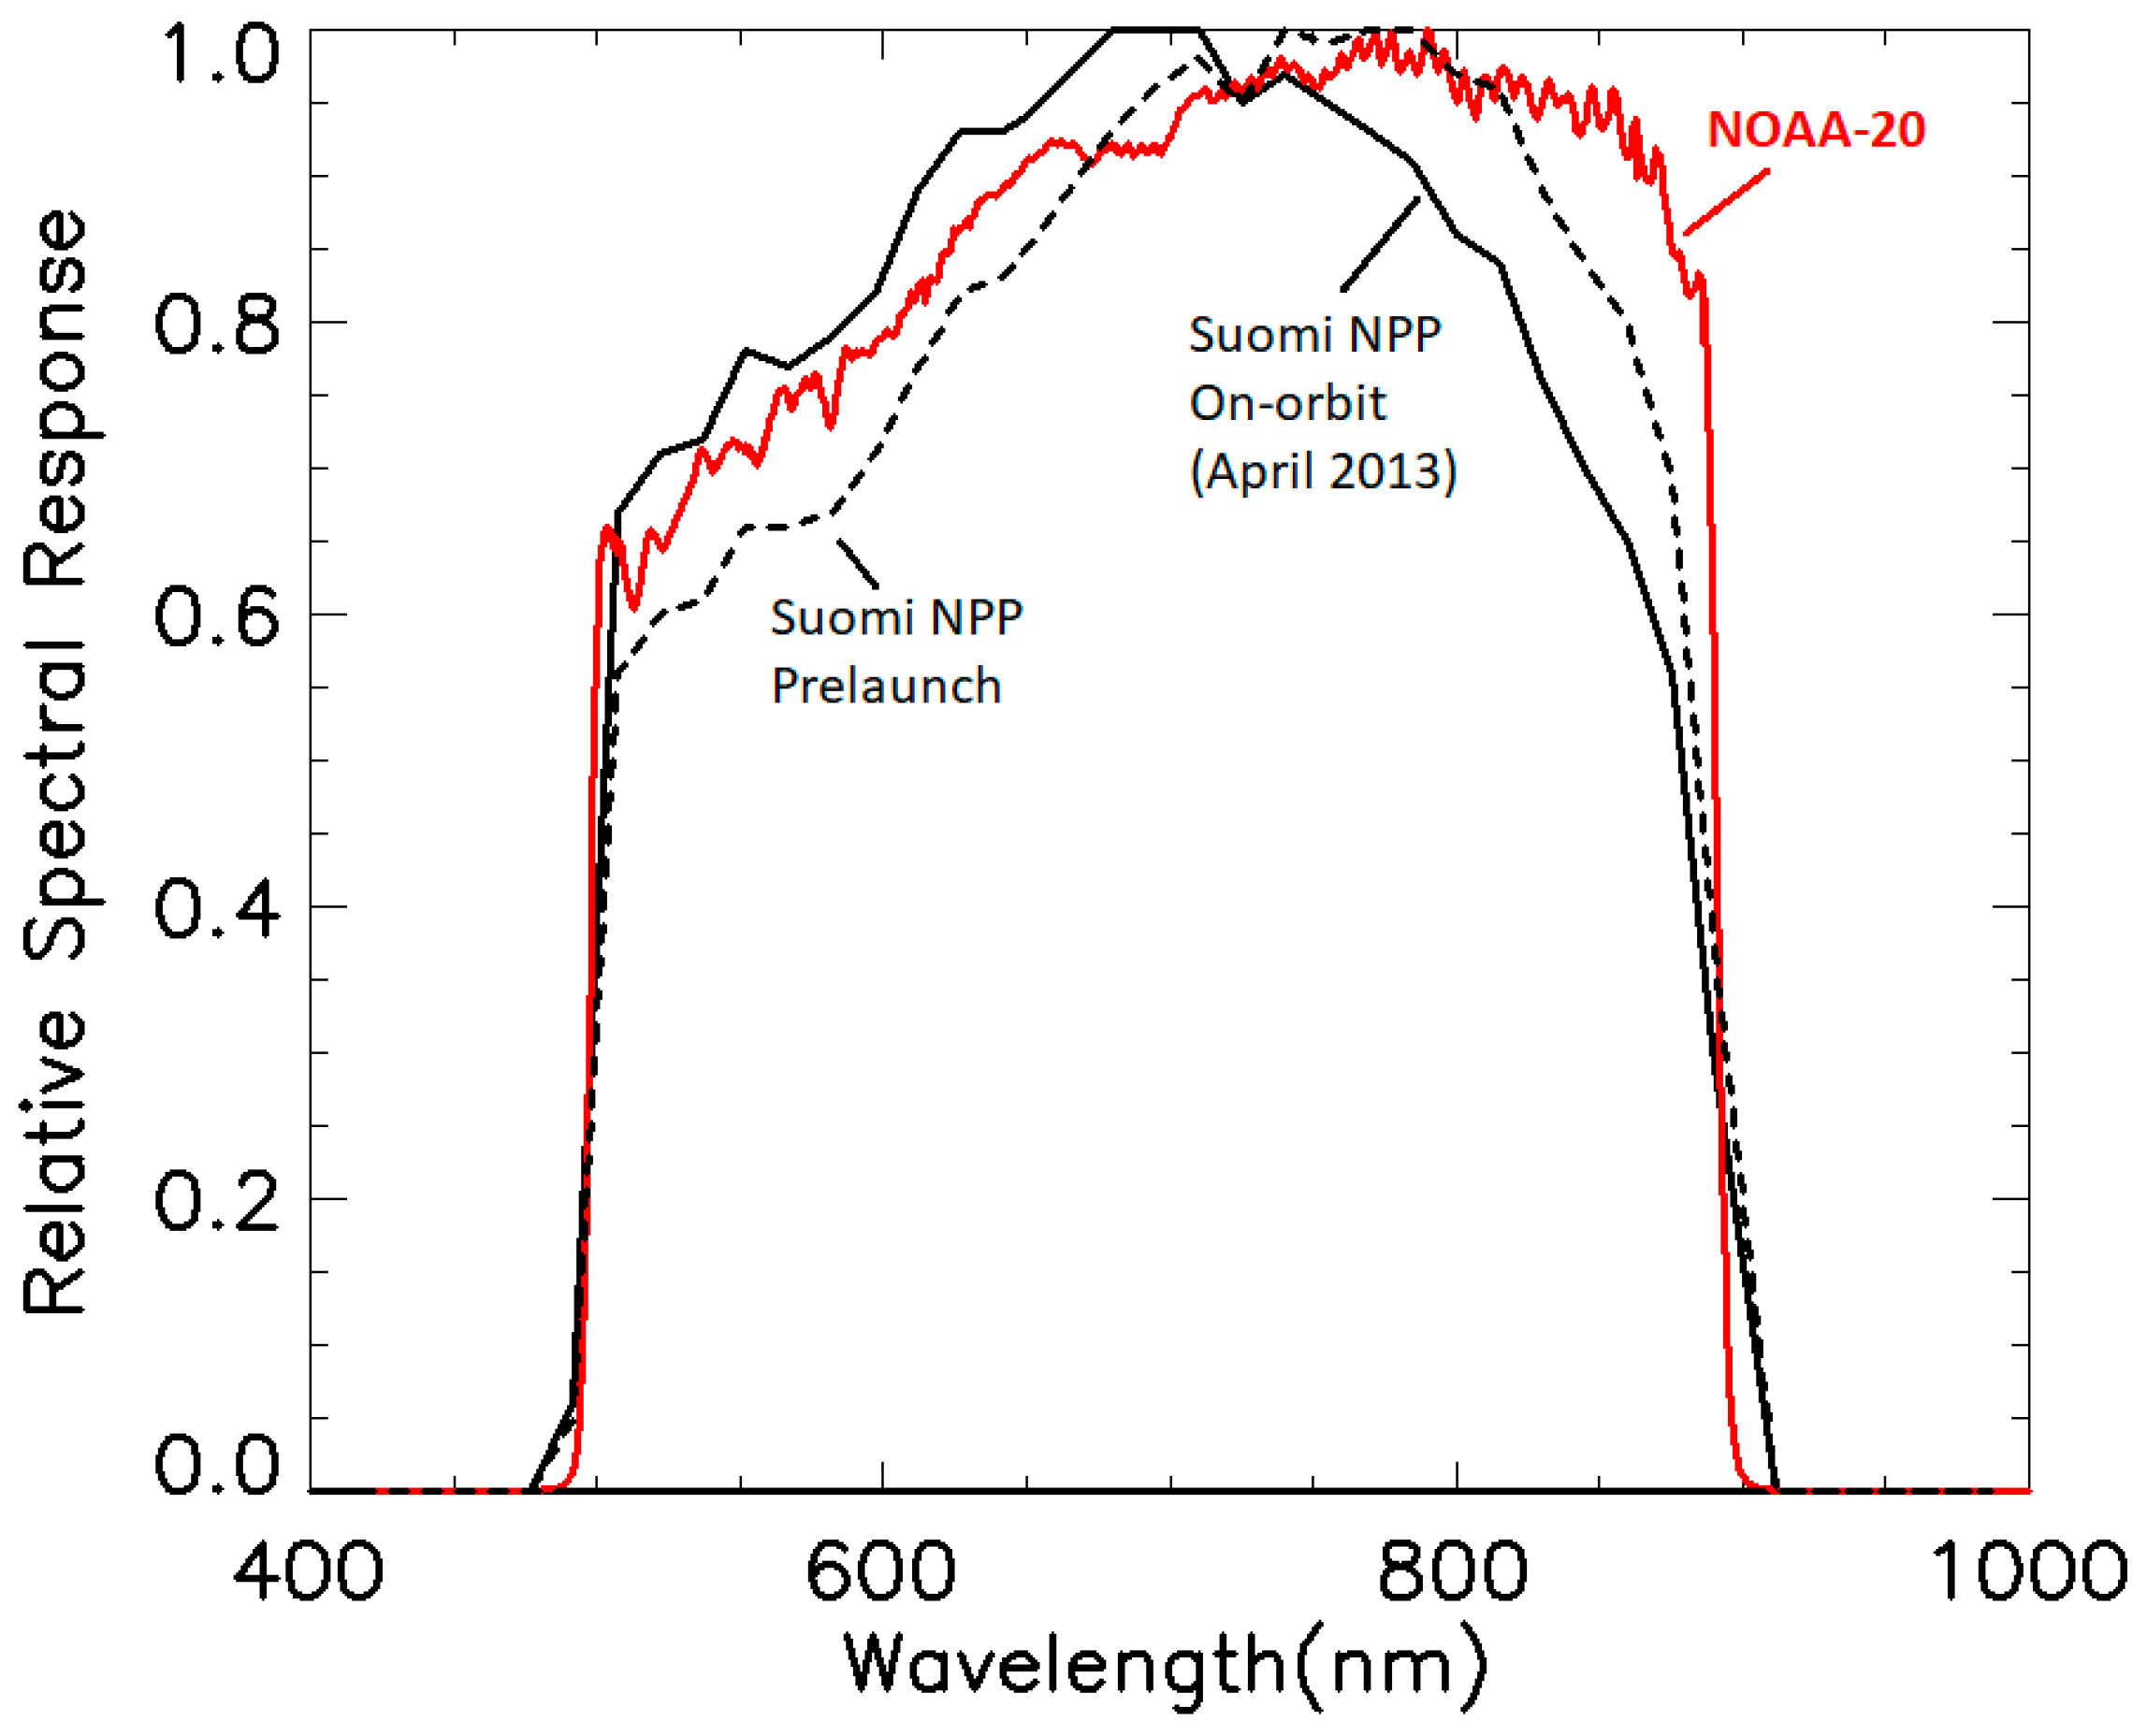
The Suomi NPP satellite was launched in October 2011, and the data became available a month later. However, the VIIRS DNB focal plane array was not cooled to its nominal operating temperature until January 20, 2012 when the cryo-radiator cooler door was opened. The VIIRS sensor data record (SDR) (also known as Level 1b calibrated and geolocated radiance data) has gone through extensive calibration/validation, and the data achieved beta maturity on 2 May 2012, provisional maturity on 13 March 2013, and validated maturity on 17 April 2014. There have been several changes in the VIIRS DNB SDR including the spectral response shift due to the rotating telescope Assembly (RTA) mirror degradation (
Figure 1) [
15,
16], geolocation improvements including terrain correction, and changes in methodology using onboard vs. dark ocean for calibration offset since 12 January 2017 [
17]. Therefore, to avoid complications due to these changes, we focus on more recent data collected in 2018–2019.
The VIIRS DNB is well known for its ability to detect low lights at night [
18,
19,
20,
21]. It has three gain stages which allow for a wide measurement range spanning from 1 × 10
−11 to 0.02 W/(cm
2·sr). The high gain stage can detect radiances typically ranging from 1 × 10
−11 to 10
−6 W/(cm
2·sr) although the actual range depends on the scan angles from nadir. This is because 32 zones are used between nadir and end of scan (referred to as aggregation zones), and each zone uses different number of subpixels in the aggregation to derive one pixel to achieve constant spatial resolution across scan [
22]. The DNB HGS noise is around 2.5 × 10
−11 W/(cm
2·sr) (1σ) at aggregation zone 1 (as of 21 February 2012), and increased about 8% by the end of 2016. The noise is higher at high aggregation zones, and up to 10 times at the end of the scan than that at the nadir. By comparison, the lunar radiance reflected from the DCC has a nominal range of 1 × 10
−9 W/(cm
2·sr) at half-moon to > 50 × 10
−9 W/(cm
2·sr) near full moon. Therefore, the VIIRS DNB is able to measure reflected lunar radiances from the DCC with the high gain stage which is essential for this study.
The illuminating capabilities of the VIIRS DNB for nighttime remote sensing are well demonstrated in [
18,
19,
20]. A comprehensive review of the instrument characteristics and early on-orbit performance was fully covered in [
19] which also included an early validation result using the vicarious site at the Railroad Valley. The result showed that the DNB measurements are in agreement with vicarious calibration on the order of 15%. This was followed by other ground based vicarious studies [
21,
23,
24]. A major drawback of the ground based vicarious studies is that the validation relies on in situ measurements with atmospheric correction, and is limited to a short time period, or in some cases just a single event. Also, since the VIIRS DNB can detect very small signals (as small as lights from a 1 kW light bulb within a 1 km
2 area), the earth’s atmosphere becomes a significant source of uncertainties for the ground based validation, as discussed in [
19]. In this paper, the term uncertainty refers to a “parameter associated with the result of a measurement that characterizes the dispersion of the values that could reasonably be attributed to the measurand” [
25]. Uncertainty plays an important role in the International Systems of Units (SI) traceability, which is defined as “property of a measurement result whereby the result can be related to a reference through a documented unbroken chain of calibrations, each contributing to the measurement uncertainty” [
26]. To reduce the uncertainties due to atmosphere, researchers explored alternative techniques such as the Dome C, DCC, and stars [
23,
27,
28].
The stability of the DCC reflectivity in the visible spectrum and its use for calibration has been studied for many years by the science community. Extensive studies of vicarious calibration using DCC have been performed in the past for many satellite instruments [
9,
10,
11,
12,
13,
14]. However, most of the previous studies were for day time DCC observations with reflected solar radiance, for example, for the VIIRS reflective solar bands (RSB) [
11,
12], or VIIRS DNB but again at day time with its Low Gain Stage (LGS) [
10].
A more relevant study was found in [
29], in which vicarious calibration of SNPP/VIIRS DNB was performed using DCC at night under lunar illumination. It demonstrated the viability, advantages and disadvantages of this approach. It concluded that for a one year period from August 2012 to July 2013, the DNB calibration is −4.9% with ± 8.8% uncertainty range “near full moon.” While this study demonstrated the value of DCC for vicarious calibration for the VIIRS DNB, there are several limitations. First, it uses daily averaged data based on “a 2.5 by 2.5 latitude by longitude grid for four seasonal months” for comparisons. Second, the comparison was performed in reflectance instead of radiance, in which all data were converted to reflectance, thus requiring the conversion of all data to reflectance, which depends on models and associated uncertainties, while both the original DNB product and the lunar model output are in irradiance/radiance. Third, previous studies have shown that lunar irradiance “near full moon” have greater uncertainties due to opposition effects [
30]. For example, the GIRO lunar irradiance model is unable to generate irradiance near full moon due to large uncertainties [
31]. Fourth, the lunar model used in that study is known to have uncertainties on the order of 7–12% [
7]. Thus, the authors [
29] concluded that their study is not an absolute calibration, but “more of a consistency check between the simulated values and the DNB calibration.”
In contrast to the previous efforts, the current study made new advances in the following areas: (1) A unique dataset was developed in our study with a much finer temporal sampling interval, at every 86 seconds (or 48 VIIRS scan lines) when the satellite passes over the DCC. This allows us to investigate the lunar phase angle dependent calibration. Given the fact that the lunar phase angle changes only 0.012 degrees at this sampling rate, the uncertainties associated with lunar irradiance changes due to temporal sampling is eliminated. This DNB-DCC lunar dataset can potentially be available continuously for the next decades with the planned launch of two more VIIRS DNB for a variety of studies; (2) Our study compared the lunar phase angle dependent radiances between VIIRS DNB on two satellites: Suomi NPP and NOAA-20, which had not been done before; 3) We compared the Suomi NPP VIIRS DNB measurements with the latest state-of-the-art GIRO model predictions, and also characterized its differences from MT2009 by lunar phase angle. The range of radiances in our current comparison study is between ~0.5 and ~60 nanowatts (nW)/(cm
−2·sr) (for reference, the minimum radiance specification (L
min) for VIIRS DNB is 3 nW/(cm
−2·sr) [
19].
With this unique dataset and methodology presented in this paper, there are several fundamental science questions can be asked: can VIIRS DNB measure the lunar radiances as a function of lunar phase angle? What physical/mathematical functions does this relationship follow? How does the bi-directional reflection of the DCC affect the functions? Is the function dependent on waning and waxing phases of the moon? How does the function compare to existing lunar models? Finally, can the long-term observations from the VIIRS DNB be used to improve the GIRO as well as the DCC bi-directional reflectance models.
To verify the stability of the VIIRS DNB calibration for the period of our study, we also examined the DNB long term stability during day time with reflected solar radiance over DCC in its Low Gain Stage (LGS).
Figure 2 shows the time series of the Suomi NPP (and NOAA-20) daytime monthly DCC reflectance. First, the Suomi NPP VIIRS DNB observations over DCC has been very stable after mid-2013. Second, the DCC reflectance was increasing from 2012 to mid-2013 (0.83 to 0.92). This was due to the spectral shift of the DNB caused by the Suomi NPP VIIRS RTA mirror degradation which modulated the spectral response function of the DNB, as discussed earlier. Since mid-2013, the RTA mirror degradation has become stabilized, and more importantly, the DNB spectral response function was updated in the operational calibration [
32] which corrected the bias and led to a stable trend after mid-2013 shown in
Figure 2. The estimated calibration variability after mid 2013 is on the order of 0.5% in the DCC time series which is very stable. We also see that the stability in 2018–2019 is as good as that in earlier periods.
Figure 2 also shows that NOAA-20 VIIRS DNB LGS calibration, with a much shorter time series, became stable after the latest on-orbit calibration update on 27 April 2018.
In contrast to a solar diffuser typically used for the onboard calibration of satellite radiometers, DCC does not have a fixed location or shape, and has variability in reflectance due to a number of parameters, However, statistically the DCC reflectance is very stable given a large enough samples, for example, each data point in
Figure 2 is aggregated from one month of DCC data which consists of millions of individual samples. In statistical analysis of DCC, it is typical to use the mode value of the samples, as opposed to the mean value to filter out extreme values that are out of the range for smaller variability in the trend.
The VIIRS DNB calibration is performed using the low gain stage (LGS) with the onboard solar diffuser using incident sunlight, then the calibration is transferred to the medium gain (MGS) and high gain stages (HGS) using observations near the terminator, where all gain stage data are available. Given the fact that the low gain stage data is stable and traceable to solar calibration, it can be assumed that the high gain stage calibration is also relatively stable. It is known that the absolute radiometric accuracy for the high gain stage is significantly reduced due to the calibration transfer, but since we rely on the stability (as opposite to the absolute accuracy) of the calibration in analyzing the lunar phase dependent reflected radiances from the DCC, the most critical factor in this study is the high gain stage radiometric stability.
To further assure the stability of the HGS, we also analyzed the gain changes of the DNB HGS over time. We found that the gain change is at the rate of about 1% per year from 2016 to 2018 based on analysis of onboard calibration data and monthly observations of the dark ocean [
8]. Therefore, after the operational routine calibration update, we validated that the stability of the HGS radiance data is at a fraction of a percent for the period of study as a residual of gain change correction in the operational calibration.
4. Results and Discussion
The scatterplot between the VIIRS DNB observed reflected lunar radiance from the deep convective clouds and the lunar phase angle is a primary result for this study. In this section, we examine the results in detail in three separate subsections.
4.1. VIIRS DNB Observed DCC Reflected Lunar Radiance as a Function of Lunar Phase Angle
Figure 4 provides an example of the relationship between VIIRS DNB observed lunar radiance reflected from DCC vs. lunar phase angle. The data shown here are from 7 November 2019 to 7 December 2018 (also referred to as the November-December 2018 lunar cycle) which covers a full lunar cycle from new moon to full moon and then to new moon again. From the figure we can see that the lunar radiance increases during waxing with decreasing lunar phase angle from new moon (lunar phase angle ~ 180 degrees) to full moon (lunar phase angle approaching 0 degree), while in the waning phase, the lunar radiance decreases from full moon towards new moon. The change in radiance is approximately two orders of magnitude, with ~5 0 × 10
−9 W/(cm
2·sr) near full moon, and down to ~0.5 × 10
−9 (W/cm
2·sr) at lunar phase angle of 110 degrees.
In the analysis, we experimented with different methods such as using mean vs. mode radiance in generating the “near-nadir-samples”. Our findings confirmed previous studies that the mode values better represented the granule values compared to the mean values because the mean values are prone to a few but extreme values that are out of range due to the nature of DCC reflectance variability as discussed earlier. Therefore, in the analysis, we only use the near-nadir-samples with mode radiance values for the lunar radiance study. It is also noted that few data points are available for lunar phase angles near zero, i.e., full moon, although this varies month by month. This is because the SNPP/NOAA-20 have an orbital period of ~101 minutes and the DCC samples are taken only in the tropical regions, while the lunar phase angle changes ~0.51 degrees/hour. As a result, not all months capture the DCC during full moon (within 2 degrees lunar phase angle). However, we found that when the full moon data were present in the near-nadir-samples, the curve near the full moon becomes extremely nonlinear, again due to lunar opposition surge [
30]. Therefore, in this study we selected the November-December 2018 lunar cycle which does not have such full moon samples and focused on the data points between 7–90 degrees in lunar phase angle.
Figure 4 also shows that although there is a general relationship between VIIRS DNB observed radiance and the lunar phase angle, waxing and waning phases appear to follow different patterns. A more detailed analysis reveals that this large difference between waxing and waning lunar radiances is primarily due to the lunar zenith angle changes that occurred in the Suomi NPP orbit between waxing and waning phases of the moon. It is understood that there are lunar irradiance differences in the waxing and waning phase according to a previous study in which a separate correction had to be made to the MT2009 model for waxing and waning effects [
27], but that difference is much smaller than what we see here, as further discussed in
Section 4.3.
Figure 5 shows that at the same value for lunar phase angle, the lunar zenith angles at satellite nadir can be very different between lunar waxing and waning phases. For example, at 50 degree lunar phase angle, the lunar zenith angle is about 70 degrees in the waxing phase, while it is about 40 degrees during the waning phase. According to Equation (2), the lunar zenith angle plays a large role in the reflected radiances. In this specific case, the latter is 2.24 times of the former (cosine of 70 degrees vs. cosine of 40 degrees), even if the lunar irradiances are the same.
Another feature shown in
Figure 5 is that during the waxing phase, the lunar zenith angle change is in sync with the lunar phase angle change. However, for the waning phase, the lunar zenith angle change progressively lagged behind as the lunar phase angle increases. This may have an impact on the lunar radiance comparisons with models, as discussed in
Section 4.3. It is also noted that for NOAA-20, the relationship between lunar zenith angle and lunar phase angle are nearly identical to that of Suomi NPP as shown in
Figure 5 (the data points overlapped), since these two satellites are in the sun-synchronous orbit with the same orbital plane, except with ~50 minutes separation, and with the same local equator crossing time. As a result, near the equator, the lunar phase angle (as well as the lunar zenith angle) differences in the near-nadir-samples between Suomi NPP and NOAA-20 VIIRS DNB are within 0.43 degrees (given the lunar phase angle rate of 0.51 degree/h). This makes the direct comparison of the near-nadir-samples between Suomi NPP and NOAA-20 VIIRS DNB viable. It should be noted that due to earth rotation, the two satellites are not observing the same DCC cloud at nadir near the equator. Thus it is assumed that all DCCs have the same characteristics in reflectance, and any difference would contribute to the scatter in the plot.
4.2. VIIRS DNB Direct Lunar Radiance Comparison between Suomi NPP and NOAA-20
Based on the discussion in the previous section, the Suomi NPP and NOAA-20 VIIRS DNB observations of DCC reflected lunar radiance can be directly compared as a function of lunar phase angle, and the results can be quantified. It is assumed that this function is relatively stable due to the stability of both the deep convective cloud reflectance and the Suomi NPP VIIRS DNB instrument calibration as discussed earlier for the period of study. Changes in this function would be primarily due to the lunar irradiance changes from month to month and the lunar zenith angle variations at the time of observation. It is also noted that this lunar-DCC curve can not only be used to quantify the calibration biases between VIIRS DNB on different satellites, but also can potentially be used to monitor the calibration changes over time for the same instrument once a long-term time series over several years is established.
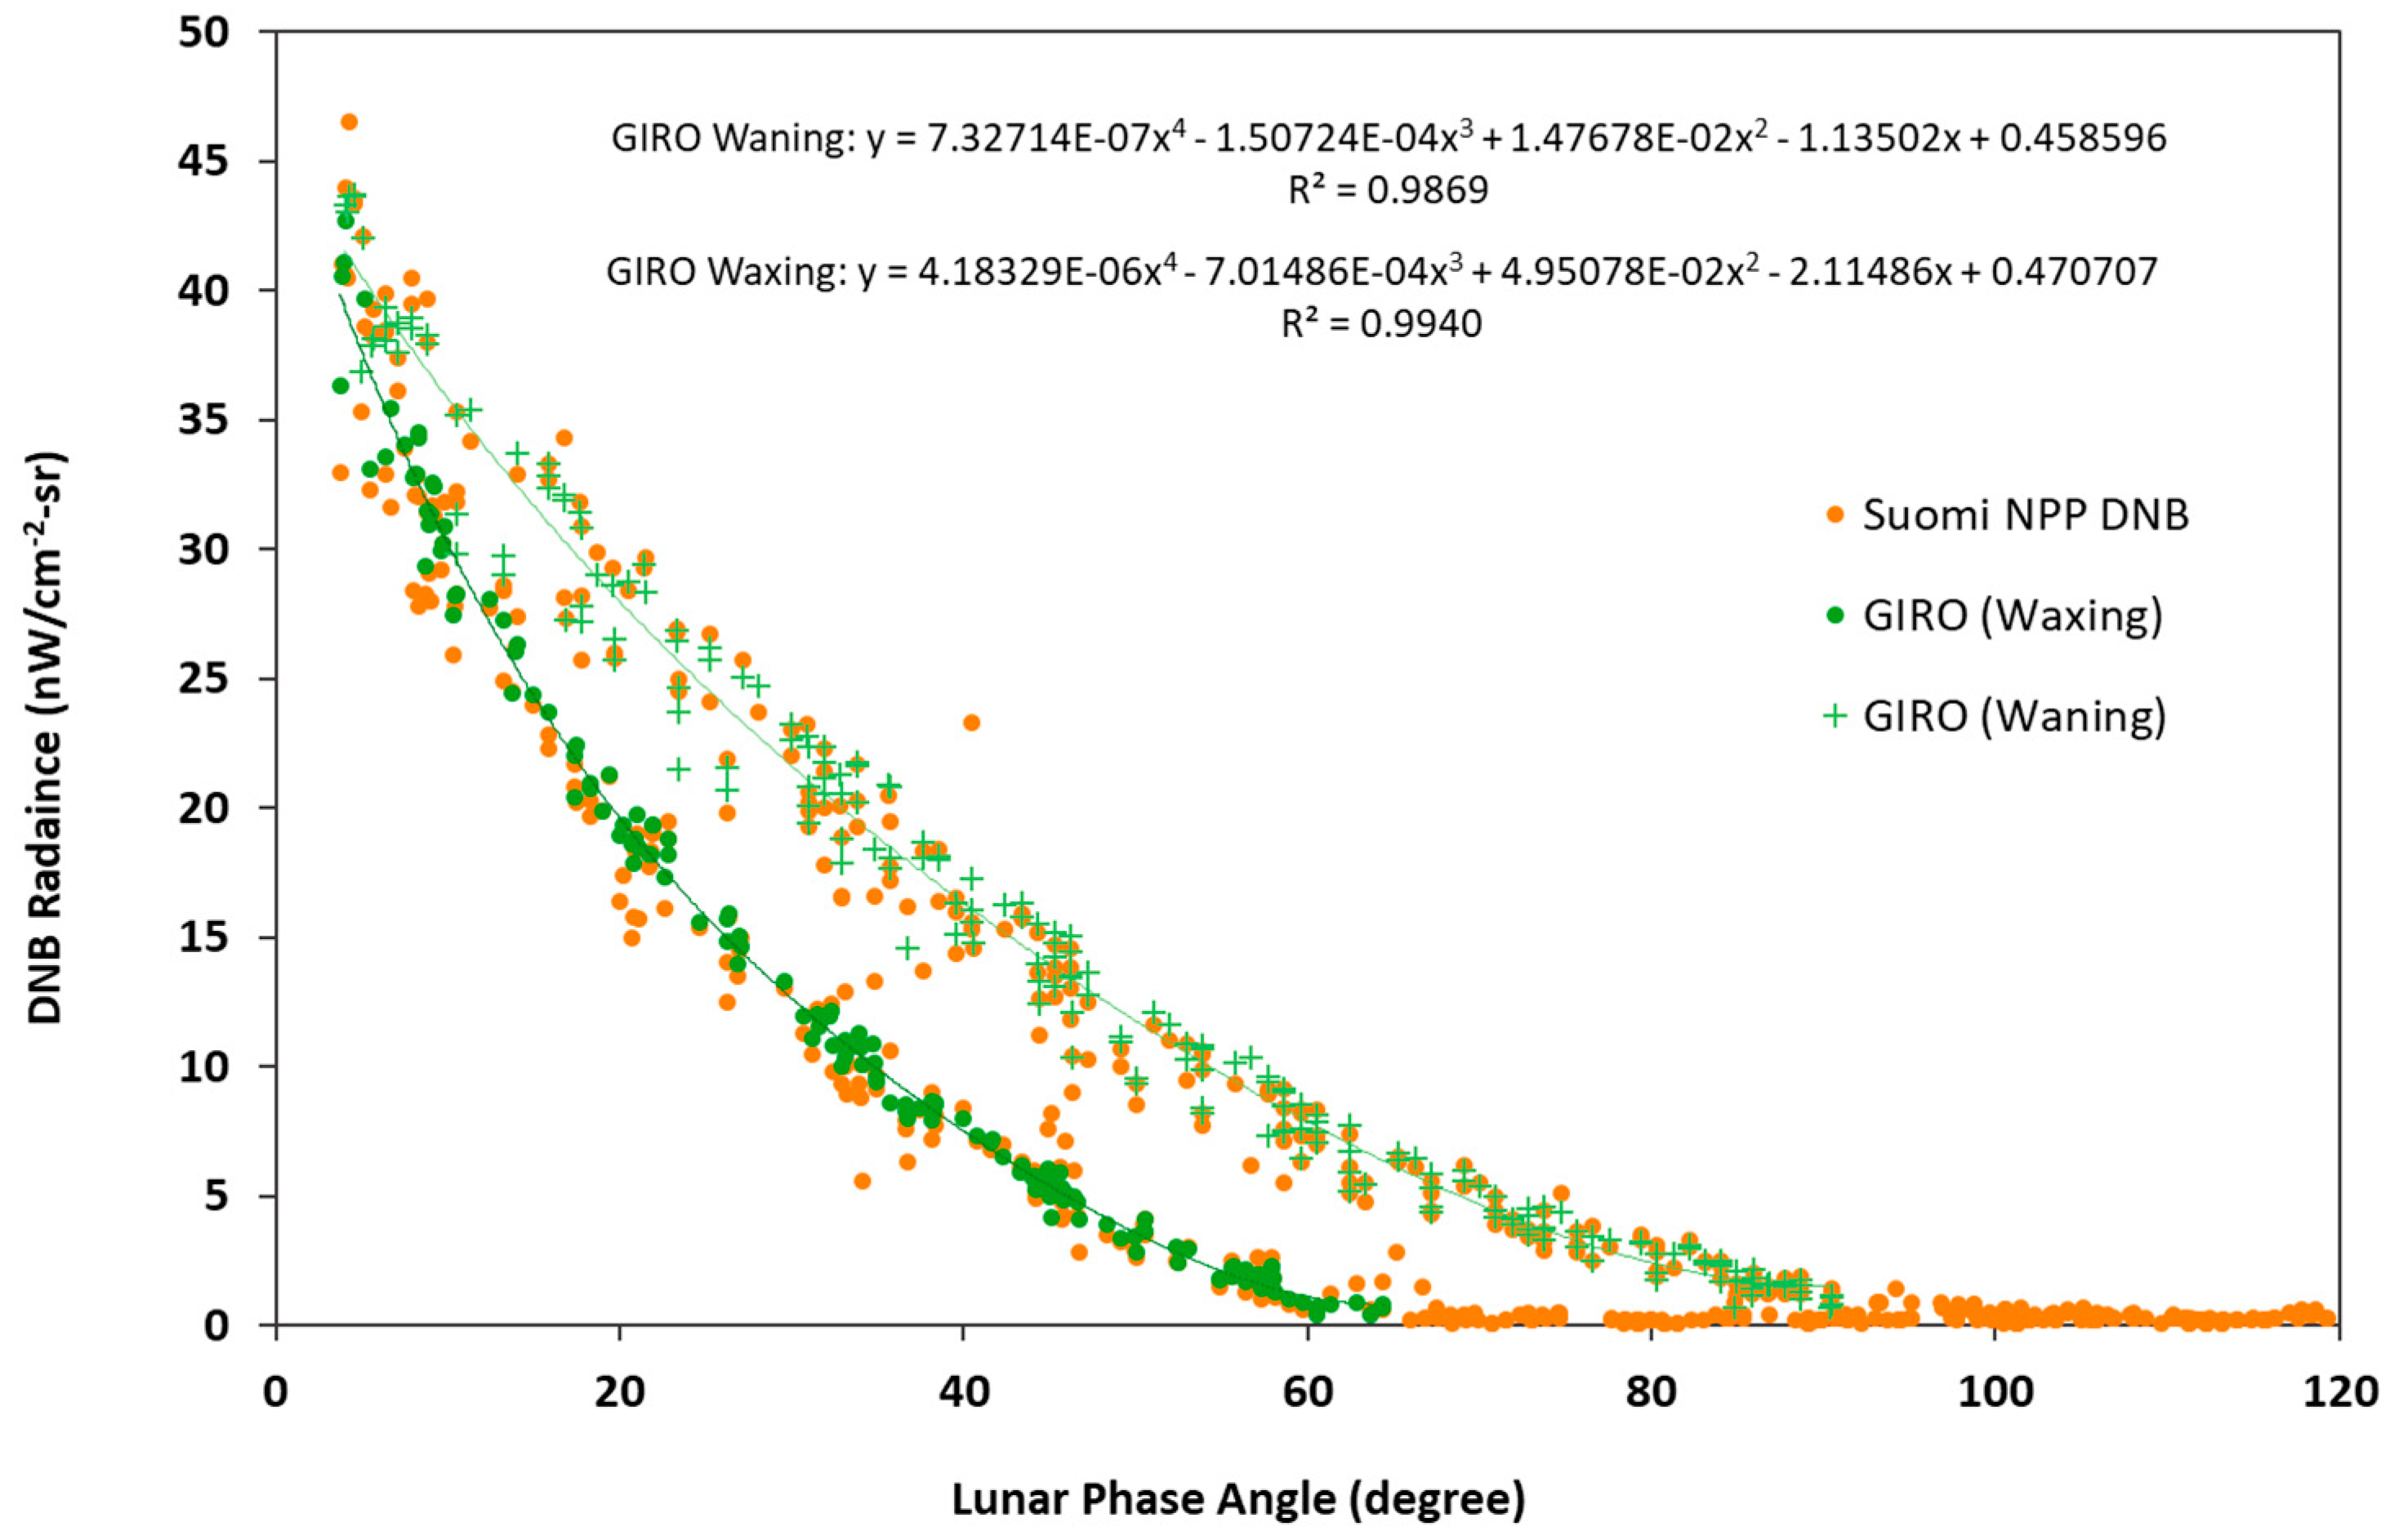
Figure 6 compares the lunar-DCC radiance curves from both VIIRS DNB on Suomi NPP and NOAA-20. The data used here are from 7 November 2018 to 6 December 2019. Visual inspection of
Figure 6 suggests that the VIIRS DNB calibration between Suomi NPP and NOAA-20 agree very well at all lunar phase angles if the data are grouped by waxing and waning phases separately. Apparently there are two separate patterns depending on the lunar phase, as discussed in
Section 4.1, primarily due to lunar zenith angles in each phase. Further quantitative comparison is also performed by generating a polynomial regression for each data set with equation (3), and the coefficients for the polynomials are provided in
Table 1.
where:
L is the DNB measured lunar radiance (nW/(cm
−2·sr));
x is the lunar phase angle; and
C0 to C4 are coefficients (see
Table 1).
It should be noted that although the 4th order polynomial function forms remain valid overall from month to month, the coefficients do not remain the same because the lunar irradiance varies from month to month due to such factors as lunar phase angle and lunar zenith angle variations relative to the sun-synchronous satellite orbit, and earth-moon distance variations. This is further discussed in
Section 4.3 where a time series is shown. Based on the above coefficients, the radiometric biases between VIIRS DNB on NOAA-20 vs. Suomi NPP can be calculated and plotted as shown in
Figure 7.
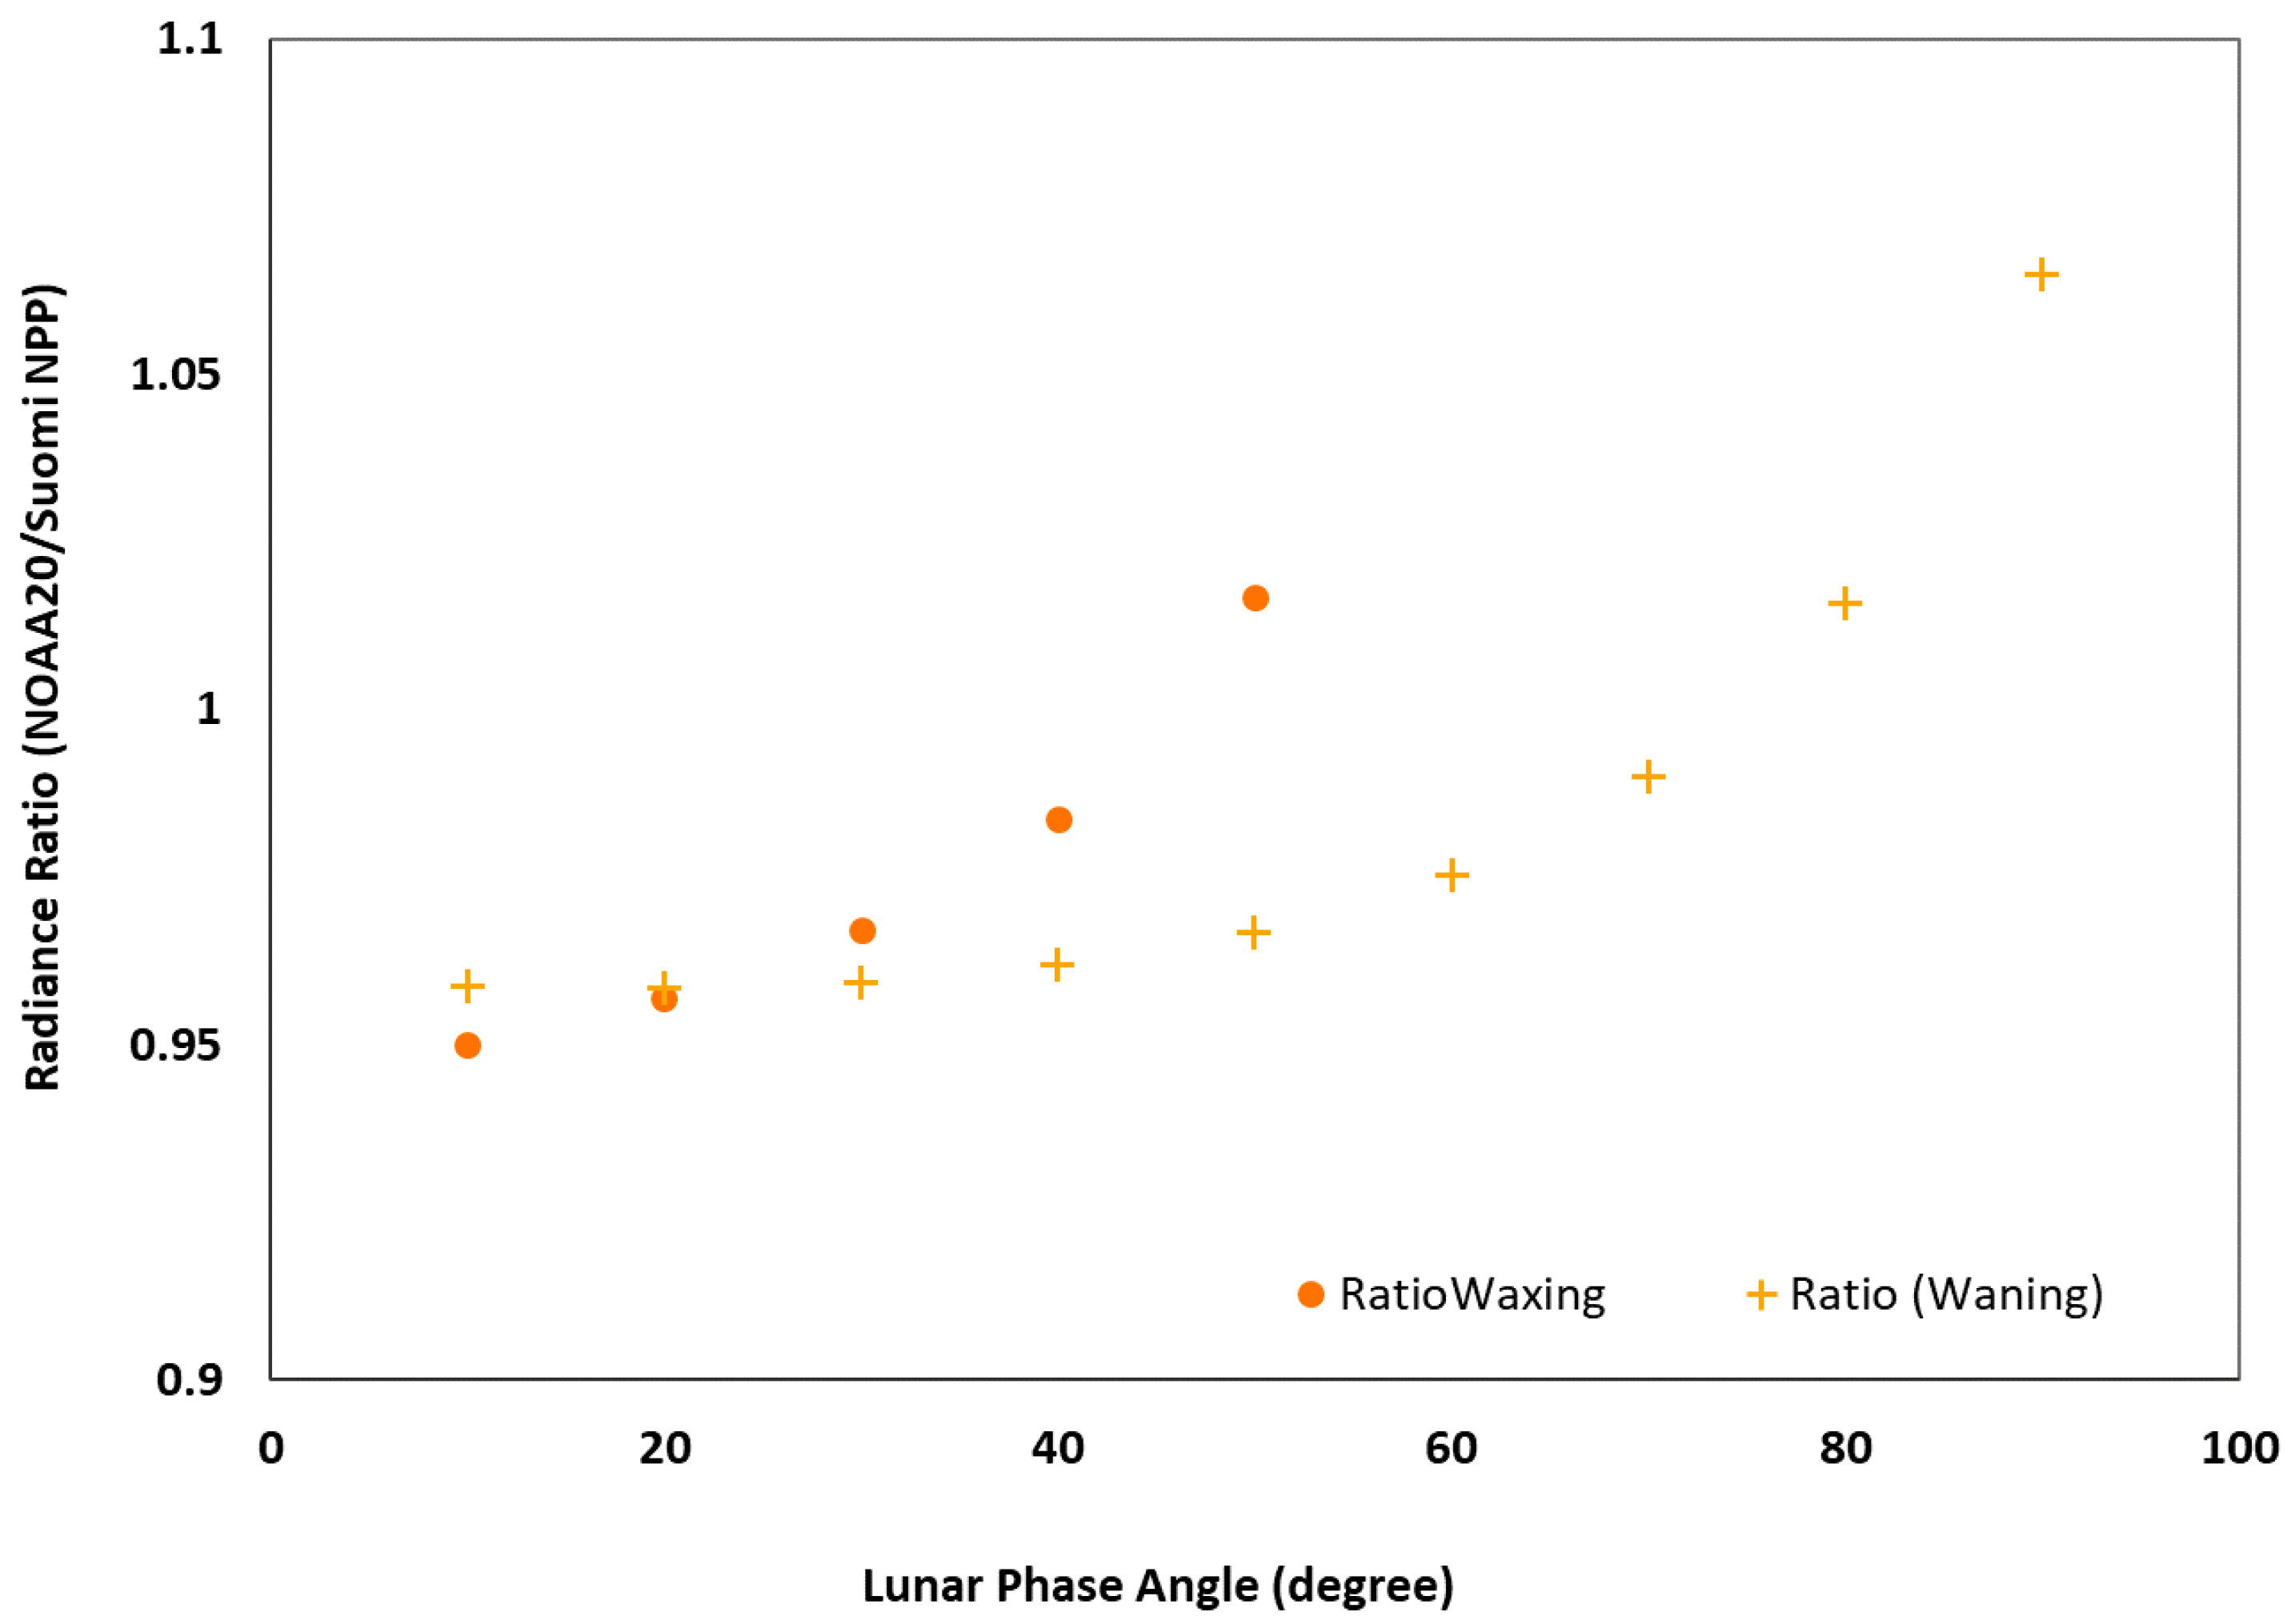
It can be seen in
Figure 7 that the lunar radiance measured by VIIRS DNB on NOAA-20, in general, has a lower value (up to ~5%) relative to Suomi NPP for both waxing and waning phases of the moon, especially at low lunar phase angles. There are several factors that might have contributed to the biases here. First, the half orbit separation between the NOAA-20 and Suomi NPP leads to small lunar phase and lunar zenith angle differences in the observing the DCC pixels. However, this effect is mitigated by the polynomial function through interpolation which addresses this observation time differences. Also, since Suomi NPP is always trailing the NOAA-20, the lunar phase angle effect for the near-nadir-samples would have opposite effects in the bias during waxing and waning phases, which contradicts to the consistent bias shown in
Figure 7. The lunar zenith angle difference at the time of observation between SNPP and NOAA-20 might introduce biases due to the bi-directional reflection of the DCC as discussed in
Section 4.3. However,
Figure 5 showed that they have nearly identical lunar phase vs. zenith angle patterns. This is further confirmed through orbital simulations.
Identifying the root cause of the bias is beyond the scope of the current study. However, we have identified two sources of biases and both lead to a high in-band solar irradiance in the Suomi NPP VIIRS DNB operational data production: a ~2% bias due to spectral response differences (
Figure 1) between VIIRS DNB on NOAA-20 and Suomi NPP, and a 1.1% bias due to solar irradiance spectrum differences used in the operational data processing systems (outdated version used for Suomi NPP processing) [
34]. The remaining ~2% bias is not well understood, except that it is noted that the low bias in NOAA-20 VIIRS DNB is consistent with other independent studies which concluded that NOAA-20 VIIRS solar band calibration are systematically lower than that of the Suomi NPP by ~2%, likely due to prelaunch characterization uncertainties according to recent investigations [
35,
36,
37]. The absolute radiance differences become smaller with increasing lunar phase angle, mainly because the lunar radiance also decreases significantly, e.g., down to 1-2 nW/cm
−2·sr at 90 degrees lunar phase angle as shown in
Figure 6. As a result, a small difference in radiance can be a significant percentage of the radiance, which leads to larger uncertainties in percentage at very low radiances. Analysis of other months from July 2018 to March 2019 showed similar results, and all of them followed a 4th order polynomial functional form despite the coefficient differences.
4.3. Comparison between Observed and Lunar Irradiance Model Predicted Radiances
Despite the good agreement between the VIRIS DNB measurements from the two satellites, Suomi NPP and NOAA-20, the comparison made in the previous section does not give any indication of the absolute accuracy of the radiance values from the DNB measurements. To address this issue, in this section we compare the Suomi NPP VIIRS DNB measured radiances with lunar irradiance model output results.
It is recognized that there are uncertainties in both lunar irradiance model predictions (GIRO and MT2009) and VIIRS DNB observations. For the GIRO model, no official uncertainty statement is found but it has been demonstrated in previous studies that the uncertainty in the absolute lunar irradiance produced by the model is estimated to be within 10% [
6], although the stability is much better, on the order of <1%. For the DNB observations, the uncertainty is mainly caused by a number of factors in the earth view observations. This includes but is not limited to: (1) variabilities in the DCC reflectance depend on the view geometry, cloud optical thickness, cloud fraction, and small regional differences in the cloud properties, and (2) lunar zenith angle variations leads to bidirectional reflectance effects.
A brief review of the two lunar models is necessary here to clarify the differences between them. The GIRO is a joint effort among different institutions, including the European Organisation for the Exploitation of Meteorological Satellites (EUMETSAT), the United States Geological Survey (USGS), the Centre National d’Etudes Spatiales (CNES), the Japan Aerospace Exploration Agency (JAXA), and the National Aeronautics and Space Administration (NASA). The effort is led by EUMETSAT, with an objective to make the lunar model publicly available, verified and validated, uncertainties characterized, and to establish traceability for the predicted irradiances [
5,
38]. There is also discussion of further improvements from the baseline model, based on new observations such as from the CNES mission Pleiades-HR (High Resolution) satellite constellation [
39]. In contrast, the MT2009 [
7] is an independent model developed for a different application. It was originally developed to compute the lunar spectral irradiance for the VIIRS DNB for geophysical retrievals under lunar illumination. The model produces 1-nm resolution irradiance spectra over the spectral interval [0.3, 1.2 um] for a given date and time. The model itself is based on multiple sources of lunar observations. The model takes into account of the lunar phase angle, Sun-to-Moon, and Moon-to-Earth distances. The model output is actually interpolated based on lunar irradiance samples from the pre-calculated database, for lunar phase angles ranging from 0 degrees to 180 degrees. However, neither lunar libration nor waxing/waning effects are considered in this model. The uncertainty of the MT2009 model is estimated to be 7%–12% [
7]. The purpose of using this model in the current study is that it provides an independent comparison with the VIIRS DNB observed lunar radiances such that any differences or discrepancies would be uncorrelated with the other model for the validation. In addition, since the MT2009 does not treat waning vs. waxing separately in the model predictions, it helps us diagnose the patterns between the waxing and waning phases of the VIIRS DNB data used in this study.
The lunar models generate lunar irradiance at top of the atmosphere given the time, location and view geometry of the observation. The lunar irradiance values are then converted to DNB in-band radiance by convolving with the DNB spectral response function and with Equation (2). For both models used, the unit required conversion to make the comparison consistent.
Several observations can be made from
Figure 8. First, predicted lunar radiances matched very well with the DNB observations. Both the cosine function and bi-directional reflection correction to the GIRO predicted values in Equation (2) played important roles based on testing by omitting each of the terms individually. Second, similar to the VIIRS DNB observed radiances, the GIRO model predicted radiances can be fitted with the 4th order polynomial function which are shown in
Figure 8. Third, the GIRO predictions did not agree well for very small lunar phase angles near full moon, where the observed values are higher than the model predictions, although there are only a few such data points. Finally, the polynomial coefficients, together with those presented in
Table 1 for the DNB observed functions, are used in generating
Table 2, which quantifies the differences between the model predicted and the DNB observed values at representative lunar phase angles from 10 to 80 degrees.
The DNB to GIRO radiance ratio in
Table 2 quantifies the agreement between observation and model predictions. A value of 1.0 would indicate perfect agreement, while deviating from 1.0 would give the percent difference. The table shows that during the waxing phase, the agreement between DNB observation and GIRO model predictions is within ±5% (0.96 to 1.05) for lunar phase angles from 10 to 50 degrees. Note that according to
Figure 8, the radiance at 50 degrees of lunar phase angle is about 3 DNB radiance units (nW/cm
−2·sr) which is at the DNB minimum radiance specification L
min. The large differences at 60 degrees is likely due to the very small radiance value and artifacts of the polynomial fit in that area, while at 70 and 80 degrees the radiance values decreases below L
min according to
Figure 8. On the other hand, for the waning phase, the agreement is within ±5% in the lunar phase angle range between 10 and 70 degrees, although the best agreement can be around 1% at low lunar phase angles.
As with any statistical analysis, the polynomial fits to both the DNB observations and GIRO model predictions have uncertainties. The standard error in the estimate using the 4th order polynomial fit is on the order of 1.19 (nW/cm−2·sr) radiance unit, which is about 3% at the radiance level of 40 nW/cm−2·sr, but can become significant in percentage at low radiances such as Lmin. On the other hand, the R-square or goodness of fit for our polynomial curve fitting is typically better than 0.98. It was found that the ADM is very useful in accounting for the DCC BRDF effects and reducing the biases. However, the ADM was developed for day time applications under solar illumination, and its fitness for lunar illumination needs to be further evaluated despite the positive results in this study. It is possible that the ADM can potentially be further refined with long-term VIIRS DNB observations of the reflected lunar radiance over DCC.
To ensure the consistency of our study results, we also performed comparison between the Suomi NPP and GIRO predicted time series with the near-nadir-samples (with an 86 second sampling interval), and the ADM correction to account for DCC bi-directional reflectance effects. The major inputs to ADM are the lunar zenith angle from the DNB data, and view zenith angle of 10 degrees (half of the view zenith angle range used in the DCC granule level sampling), which is ±8.8 degrees from nadir. In this part of the analysis, an additional criterion for filtering the data with a threshold of >400 DCC pixels for each granule is applied, which reduced the standard deviation of the biases. The results are presented in
Figure 9 below.
In this figure, the lower panel (left vertical axis) shows the observed vs. GIRO predicted radiances. The maximum lunar radiance changes month by month, thus leading to different coefficients for the polynomial functions in the curve fitting as discussed earlier. We also found that for some months, such as January 2019, a few granules contained data near full moon (lunar phase angle < 2 degrees) in which case the GIRO failed to generate a result because it is out of the range and capability of the model The upper panel of the figure (right vertical axis) shows the radiance ratio (DNB observed/GIRO predicted). A statistical analysis of the ratio shows that the mean ratio is ~0.97, and the standard deviation is 0.05, which suggests that the DNB observations are lower than the model predicted values by ~3%, with an uncertainty of ±5%. This result is slightly better than but consistent with what we found earlier in this section. Another observation from the ratio plot is that the spread in the ratio values appear to become larger with increasing phase angles (away from the peak radiance) due to lower radiances at high lunar phase angles as expected.
Finally, we also compared sample outputs from the GIRO and MT2009 models for the November-December 2018 lunar cycle.
Figure 10 shows the ratio between the two model generated irradiances (ratio=MT2009/GIRO) for this time period. The figure shows that predictions from GIRO and MT2009 agree within ±7% for a large range of lunar phase angles. However, differences grow in the waning phase up to ~17% for lunar phase angles beyond 50 degrees. MT2009 underestimated the lunar irradiance near full moon while overestimated at lunar phase angles above 10 degrees in this particular study. This is expected given the intended application and accuracy estimates of the MT2009 as stated in [
7].


