Multispectral Approach for Identifying Invasive Plant Species Based on Flowering Phenology Characteristics

1
Department of Sensing, Information and Mechanization Engineering, Institute of Agricultural Engineering, Agricultural Research Organization, Volcani Center 5025001, Israel
2
The Remote Sensing Laboratory, Jacob Blaustein Institutes for Desert Research, Ben-Gurion University of the Negev, Sede-Boker Campus 8499000, Israel
*
Author to whom correspondence should be addressed.
Remote Sens. 2019, 11(8), 953; https://0-doi-org.brum.beds.ac.uk/10.3390/rs11080953
Submission received: 10 March 2019
/
Revised: 14 April 2019
/
Accepted: 16 April 2019
/
Published: 21 April 2019
(This article belongs to the Special Issue Upscaling and Downscaling Modelling and/or Identification of Relevant Scales and Thresholds for Environmental Impacts in Ecology by Remote Sensing)
Abstract
:Invasive plant species (IPS) are the second biggest threat to biodiversity after habitat loss. Since the spatial extent of IPS is essential for managing the invaded ecosystem, the current study aims at identifying and mapping the aggressive IPS of Acacia salicina and Acacia saligna, to understand better the key factors influencing their distribution in the coastal plain of Israel. This goal was achieved by integrating airborne-derived hyperspectral imaging and multispectral earth observation for creating species distribution maps. Hyperspectral data, in conjunction with high spatial resolution species distribution maps, were used to train the multispectral images at the species level. We incorporated a series of statistical models to classify the IPS location and to recognize their distribution and density. We took advantage of the phenological flowering stages of Acacia trees, as obtained by the multispectral images, for the support vector machine classification procedure. The classification yielded an overall Kappa coefficient accuracy of 0.89. We studied the effect of various environmental and human factors on IPS density by using a random forest machine learning model, to understand the mechanisms underlying successful invasions, and to assess where IPS have a higher likelihood of occurring. This algorithm revealed that the high density of Acacia most closely related to elevation, temperature pattern, and distances from rivers, settlements, and roads. Our results demonstrate how the integration of remote-sensing data with different data sources can assist in determining IPS proliferation and provide detailed geographic information for conservation and management efforts to prevent their future spread.
1. Introduction
Invasive plant species (IPS) cause ecological damage as well as substantial economic costs worldwide [1]. They rapidly extend and alter the world’s biodiversity [2] and are a significant threat to the natural ecosystem after habitat alteration [3,4]. IPS cause functional and structural degradation of the invaded ecosystem, including alteration and modification of fire regime, hydrology, carbon storage, and nutrient dynamics [5]. The expansion of IPS is usually divided into four stages: transport, colonization, establishment, and spread in the landscape [6]. Once an IPS is introduced into a new environment and is established locally, the rate of infestation is controlled by biotic factors and demographic processes that regulate its spread [7,8]. The spread of IPS varies according to the community composition [9], the patterns of disturbance [10], and the invader’s performance in establishing, maintaining, and growing in the invaded environment [11]. The IPS interact with environmental factors (topographical and climatic), such as soil type, elevation, aspect, temperature, wind speed, and precipitation, leading to complex interactions between the invasive plants and the invaded environment [12]. Therefore, an essential requirement for effective management of IPS is the identification and delineation of both the spatial extent and severity (invasion stage) of infestation [13]. Predicting the future spread of the invading species also requires identifying the pattern of IPS in the landscape, the mechanisms underlying successful invasion processes, and their response to environmental and human factors [12].
Traditional survey methods, such as ground mapping using global positioning systems (GPS), have high accuracy and are species-specific methods for small management areas, but might be technically, logistically, and financially unfeasible for larger areas or multi-species invasions [14]. Therefore, remote sensing has become an increasingly popular approach for identifying and monitoring IPS [15,16,17,18]. However, since the reflectance signal from remote sensing sensors is generally determined by biochemical and biophysical characteristics of the plant, the invasive species must have some unique characteristic (i.e., biochemical, structural, or phenological) in order to be detectable by remote sensors [19]. Recently, significant advances in spatial, spectral, and temporal resolutions of sensors have made IPS identification increasingly feasible and accurate [14,19]. IPS detection was applied with different remote sensing platforms including aerial photographs, multispectral, and hyperspectral sensors. Among these, imaging spectroscopy (IS) is a promising technique for species identification in general, and IPS in particular [15,17,20]. IS acquires images across many narrow contiguous spectral bands, throughout the visible, near infrared, and shortwave-infrared spectral regions. The results of IS can then be used to identify and map species based on their unique spectral signatures [21,22].
Several IS sensors have been used to detect IPS. Among the sensors extensively used for IPS detection are Hyperion, Airborne Visible/Infrared Imaging Spectrometer (AVIRIS), Compact Airborne Spectrographic Imager (CASI), Carnegie Airborne Observatory (CAO), Airborne Imaging Spectroradiometer for Applications (AISA), and HyMap [23,24,25]. The drawback of the IS approach, even using state-of-the-art sensors, is that it does not incorporate cost-benefit considerations. IS data are mostly acquired by using ground spectrometers or with airborne and unmanned aerial vehicle (UAV) sensors, with limited spatial coverage [26]. Moreover, IS usually has a high cost, poor accessibility, and requires qualifications and skills in processing and handling these large and complex datasets [27]. The prevailing opinion is that moderate resolution multispectral satellite imagery is less suitable to identify species and more successful in mapping communities because the spatial and spectral resolution is generally too coarse to distinguish individual species unless a species exists as a monodominant [28,29]. Although IS is essential for monitoring invasion rates at various stages, multispectral satellite sensors offer advantages in identifying and monitoring IPS. They provide larger coverage areas, higher revisit times, are easier processing, and have more available archived images compared to the narrow band hyperspectral sensors. Therefore, judicious sensor selection is desirable for useful, repeated, and reliable IPS identification and monitoring, and required for integrating data from multispectral and hyperspectral imagery. This approach could then provide on-the-ground management guidelines [30].
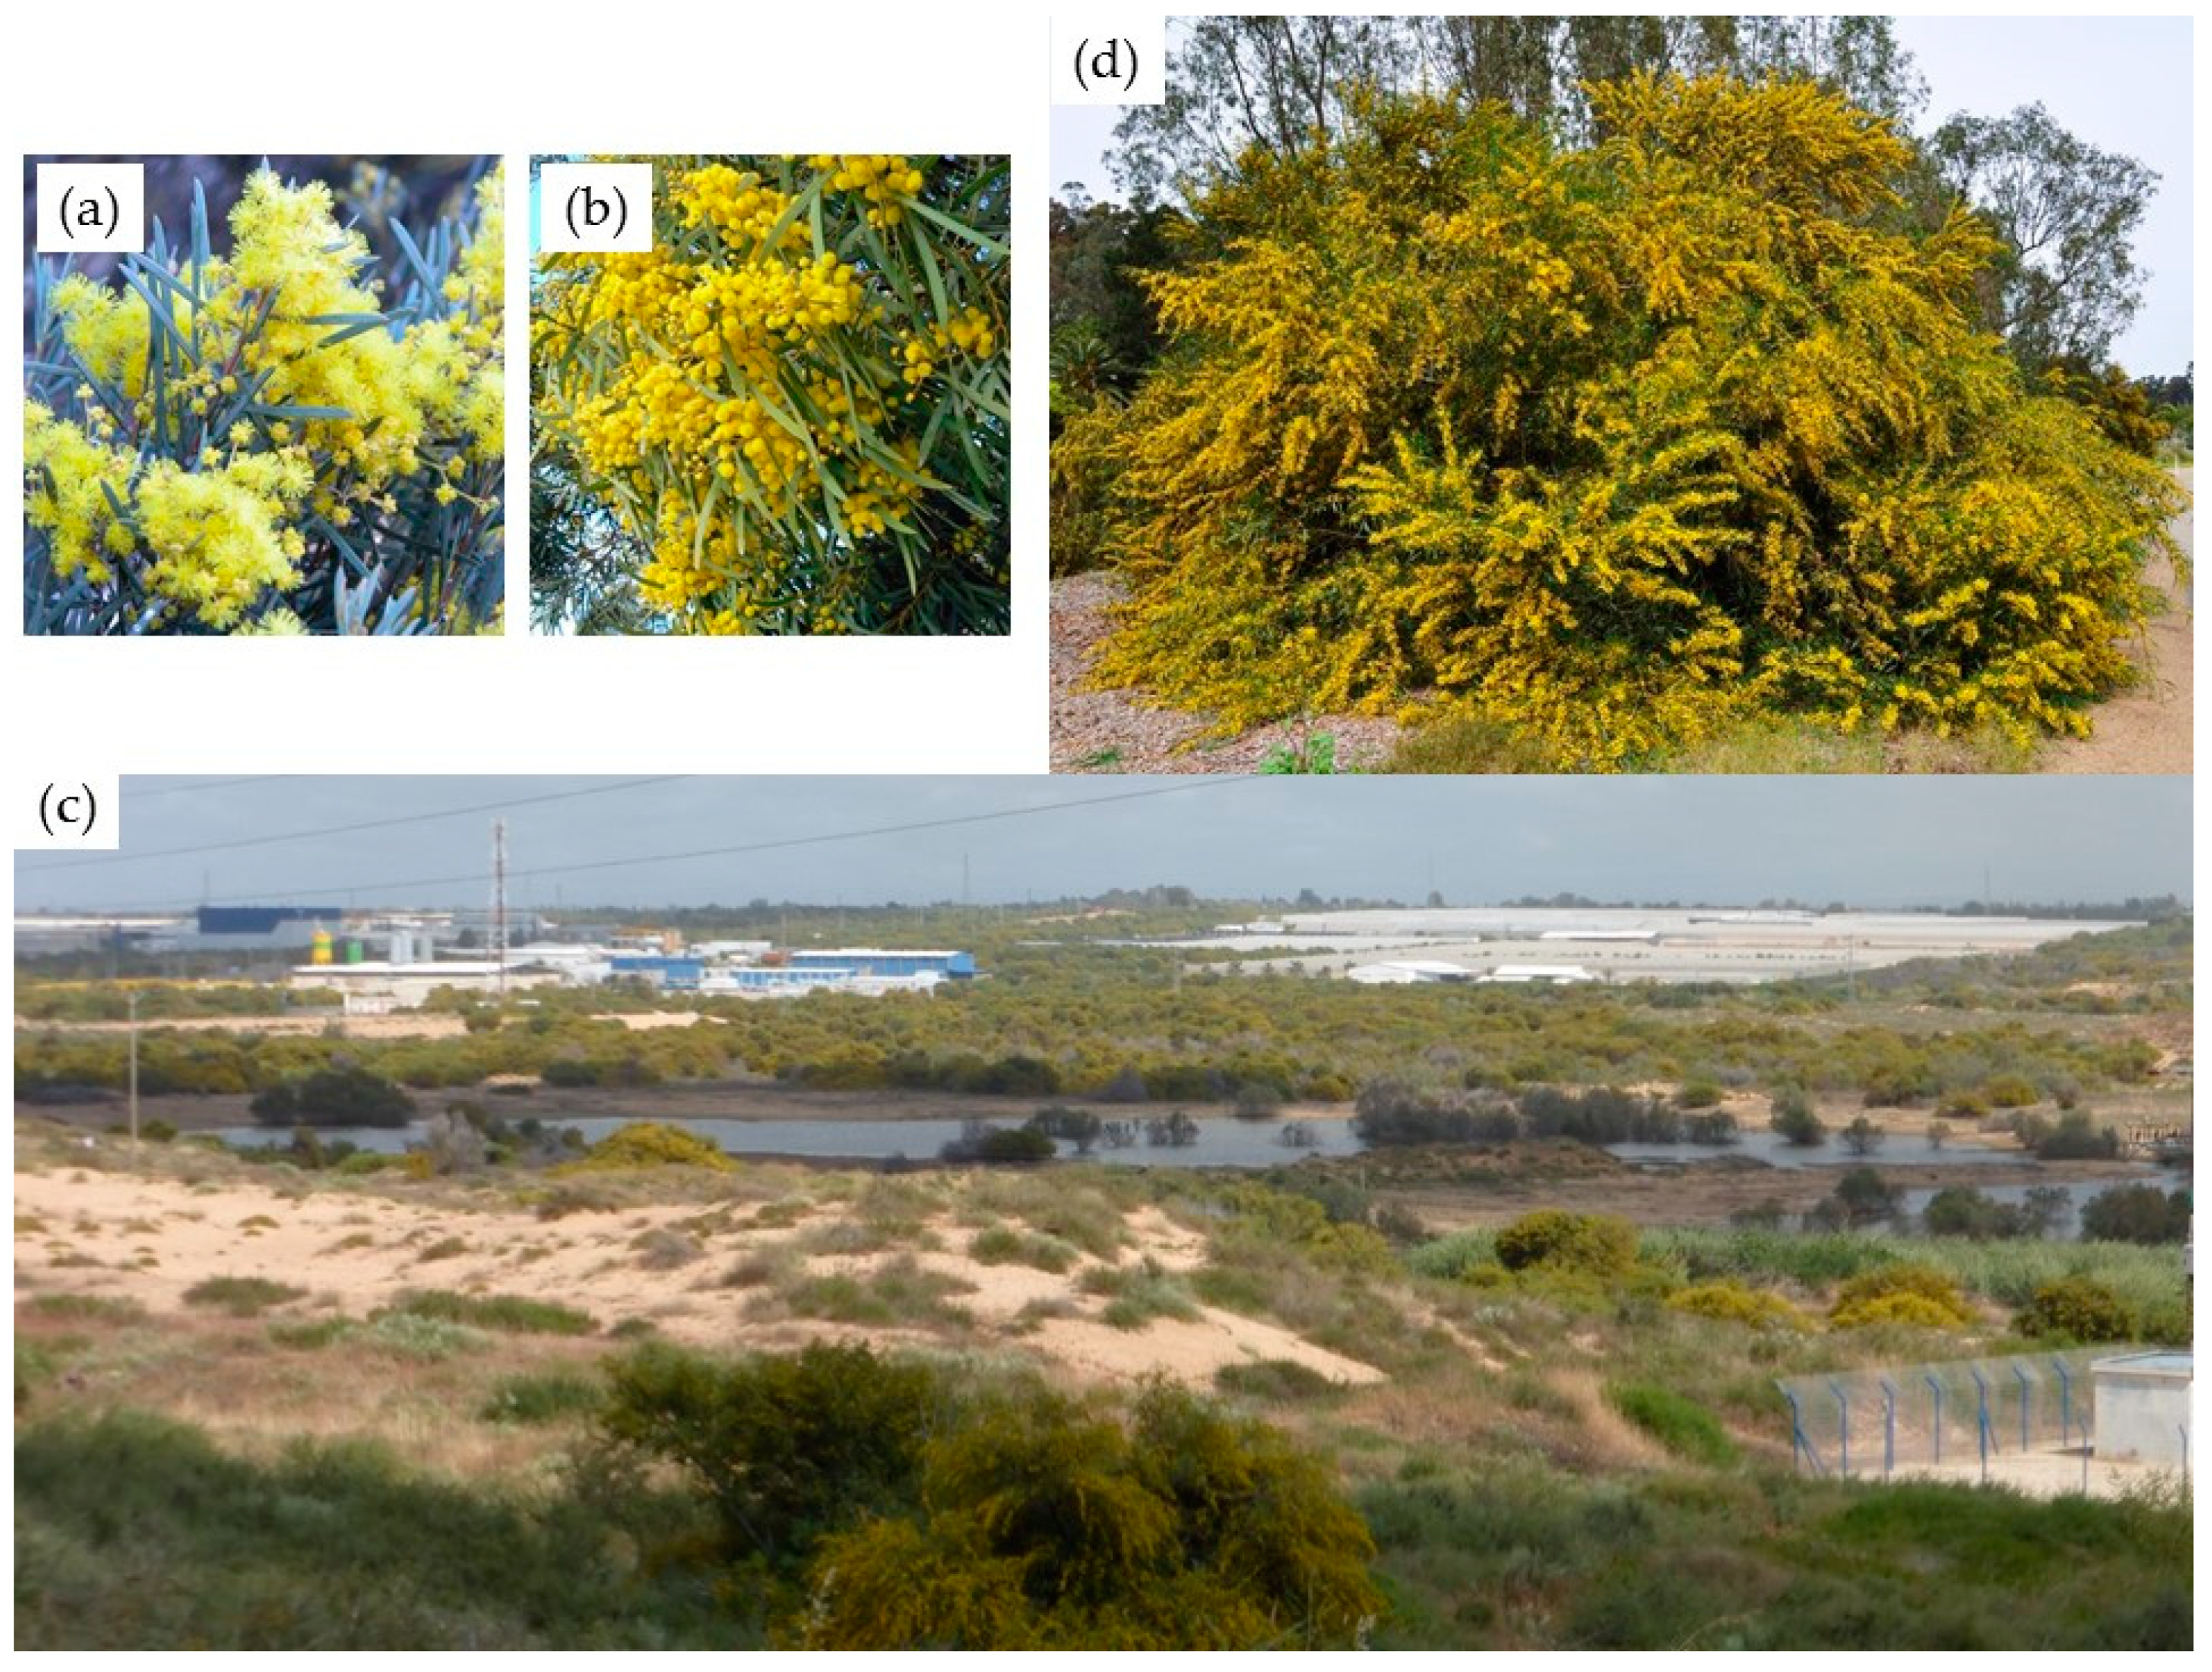
In this study, we focus on two highly invasive species in Israel, Acacia salicina Lindl. and Acacia saligna (Labill.) H.L.Wendl., (hereafter: Acacia), which spread over large areas in the coastal plain of Israel, creating dense clusters of trees with prominent yellow flowers that bloom in late winter to early spring (March to April) (Figure 1). We took advantage of Acacia’s flowering stage to study and detect their distribution. Detecting IPS flowers is a promising approach because it can be identified by multispectral and color aerial photos [31]. Therefore, using specific phenological timing of the IPS (life cycle) might improve the detection and reduce the high spectral resolution requirement for plant species identification [14,32,33]. Furthermore, several studies have found that multispectral images could provide suitable classification accuracy in contrast with hyperspectral imagery, especially when target plant species have distinct spectral properties that distinguish them from their environment [34]. Another notable challenge was the need to distinguish between the spectral properties of the IPS signals, i.e., yellow flowering, from other similar yellow flowering signals, particularly the annuals in Israel. Therefore, our goals for the current study are twofold. First, to develop an integrated approach for detecting and identifying Acacia by training data from hyper to multispectral sensors. The integration was achieved by using species distribution maps developed by Paz-Kagan et al. [35], which is based on high spatial and spectral resolution airborne IS data. We used these maps to train lower resolution multispectral satellite data for detecting Acacia’s flowering stage over a large spatial area. Second, to explore the influence of various environmental and human factors on the spread of IPS, in order to understand the successful mechanisms of invasions.
2. Materials and Methods
2.1. Study Area
The study was conducted within an area of 100 km2 in the southern coastal plain of Israel (Figure 2). The area is a Mediterranean climate zone and characterized by an environmental gradient of precipitation and temperature. The average annual precipitation and the average temperature range from 383 to 480 mm and from 20.3 to 19.5 °C, respectively, from south to north. Extensive land-use changes have occurred in these areas [36], due to massive agricultural cultivation, increased population and urbanization, road development, and water infrastructure. Also, large afforestation programs led by the Jewish National Fund (JNF) were carried out in the region and altered the species composition and patterns in the area [37]. We purposely selected this area to study the IPS pattern, since it constitutes a mosaic of diverse land-use that was extensively invaded.
2.2. Study Species
A. saligna and A. salicina, of the mimosa (Mimosaceae) family and legume (Leguminosae) order, spread as shrubs or single-stemmed trees, which can reach up to 9 m in height [38]. They were transported from Australia to many countries around the world, including Italy, New Zealand, Portugal, South Africa, Spain, and the US [39]. Both species were also brought to Israel as early as the beginning of the 20th century by the British colonists and the first Jewish settlers for afforestation of exposed lands, soil conservation, and to stabilize shifting sands dunes. The impressive reproductive strength of Acacia is related to their ability to reach maturity in four years and to produce thousands of viable seeds that form a dense understory under each tree [40]. Since first being planted in Israeli coastal dunes, Acacia spread rapidly, at an annual growth rate estimated at 3% [38].
2.3. Remote Sensing Methodology
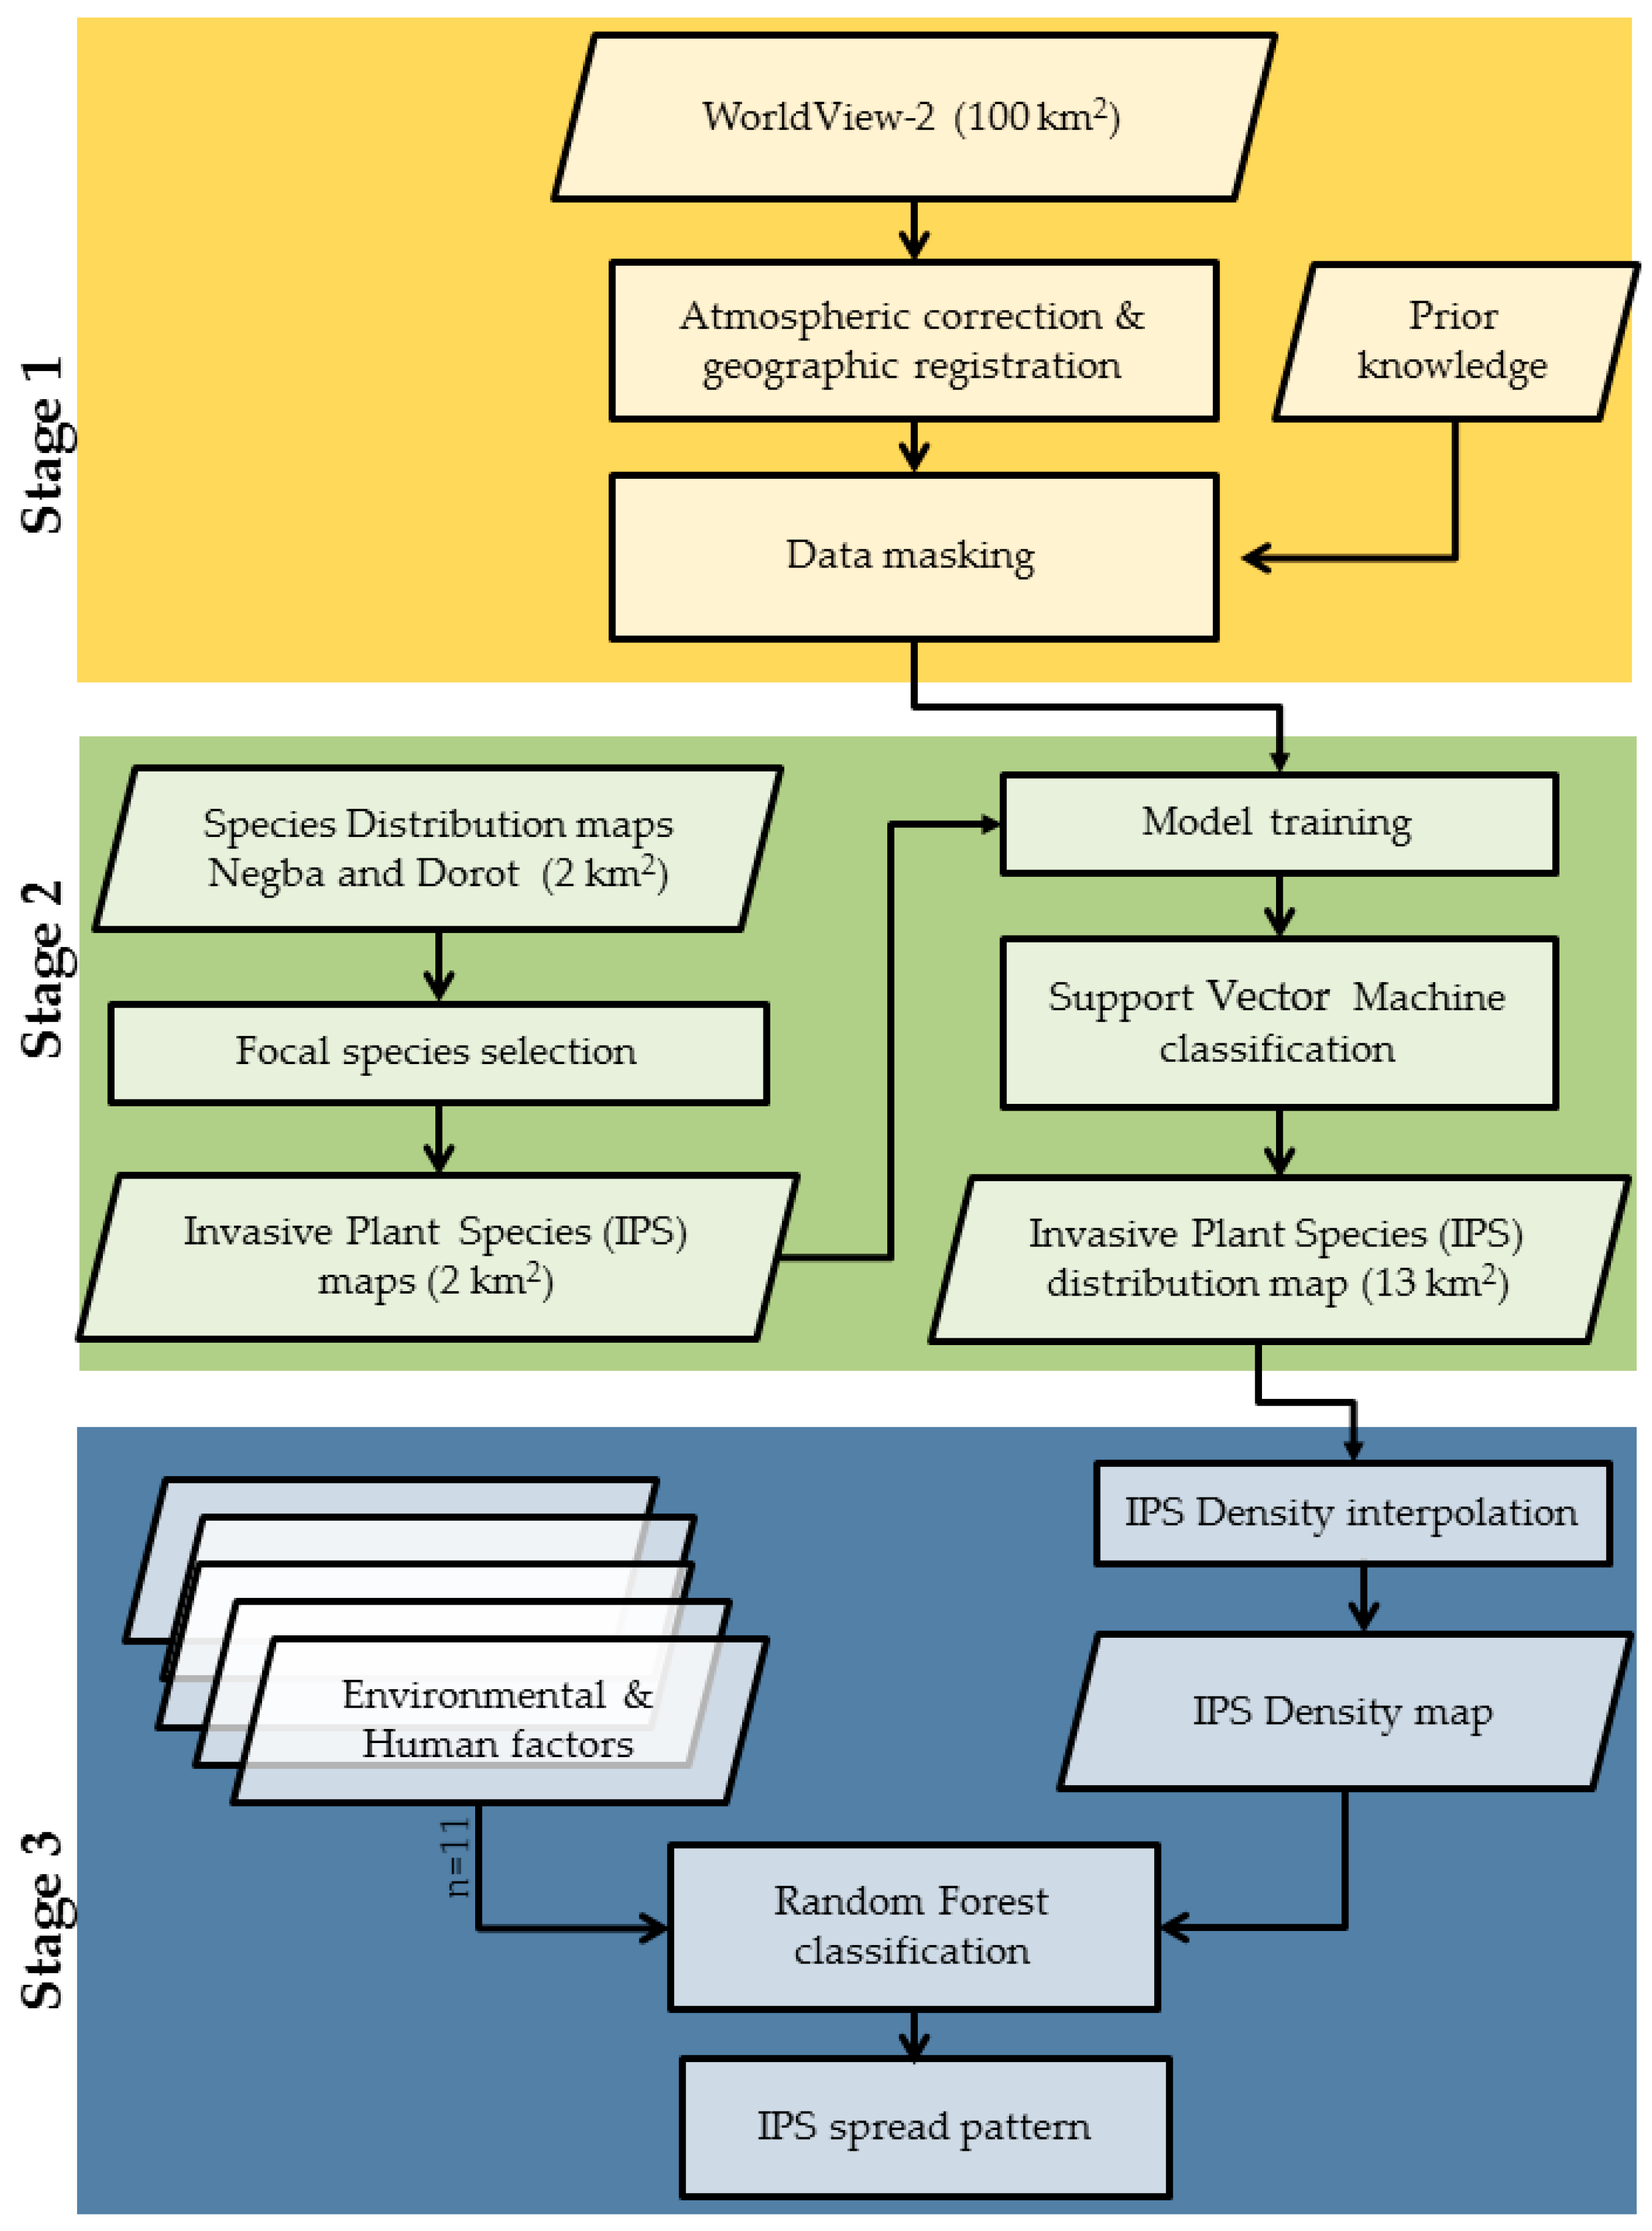
In the following sections, we describe the approach and methodology for mapping IPS based on multispectral imagery and studying the environmental and human factors that determined IPS spread in the landscape (Figure 3). Our approach included the use of species distribution maps developed by Paz-Kagan et al. [35] to train the lower resolution of multi-spectral satellite data, in conjunction with IPS identification. Then, we developed IPS density maps for studying the environmental and human factor mediation their spreads.
2.3.1. Potential Area for Invasion
The first stage included image processing and a masking procedure. We used two inputs: (1) WorldView-2 images with 2 m spatial resolution and eight spectral bands, acquired on 1 April, 2017, and covering the 100 km2 study area. The spring season was selected because the Acacia flowering is at its peak; (2) The AisaFENIX airborne hyperspectral system was used by Paz-Kagan et al. [35] to create species distribution maps of two sub-areas, the Dorot and Negba sites, totaling 2 km2. This system was characterized by continuous wavelengths, covering the visible, near infrared, and short-wave infrared regions (380–2500 nm) with 448 spectral bands. The sensor flew at 762 m altitude, on September 19, 2014, above the two study sites that enabled 1 m spatial resolution for woody species identification. The product, i.e., the species distribution maps, were used to train the WorldView-2 images. The pre-processed procedure of the multispectral WorldView-2 images data included Atmospheric/Topographic Correction using (ATCOR) software [41], which was followed by a geographic registration. A masking procedure was carried out using prior knowledge databases, which included extensive information on the different land-uses and planted trees, as well as areas adjacent to rivers, and roads. We applied this mask to the WorldView-2 image, in order to exclude settlements and agricultural areas and include only open and natural landscape, to produce an invasion area map in which IPS can potentially grow. The total area of potential growth of IPS was 13 km2 within the 100 km2.
2.3.2. Classification for Detecting Invasive Plant Species
The second stage included two consecutive steps: (1) identification of the focal IPS, using the species distribution maps of the two sub-areas that were based only on leaf spectral signals, and (2) IPS mapping based on the flowering signal from multispectral data over the full study area that was trained based on the first step. Paz-Kagan, et al. [35], developed species maps that included overall 28 woody plant species in the two sub-areas. We used these species distribution maps for developing an IPS map by selecting the focal species class and integrating all the other classes to woody vegetation. We used more than 720 crowns or clumps of crowns of the Acacia to train the multispectral imagery for IPS mapping. An SVM classification was applied to the multispectral image, based on the following characteristics: bare soils, Acacia flowering trees, annual yellow flowering, other trees, and other annuals. These classes were identified and mapped in the field for validation. A post-classification confusion matrix was tested, based on the calibration and a validation split (70:30) dataset that was randomly selected. The classification output was subjected to a low-pass majority filter to reduce the “salt and pepper” noise [42]. The final product of this procedure was the IPS distribution map within the potential invasive area (a total area of 13 km2). The classification procedures were implemented in ENVI 4.8 software, in an IDL 8.2 environment [43], together with procedures using R software (R Development Core Team, 2014).
2.4. Environmental and Human Factors
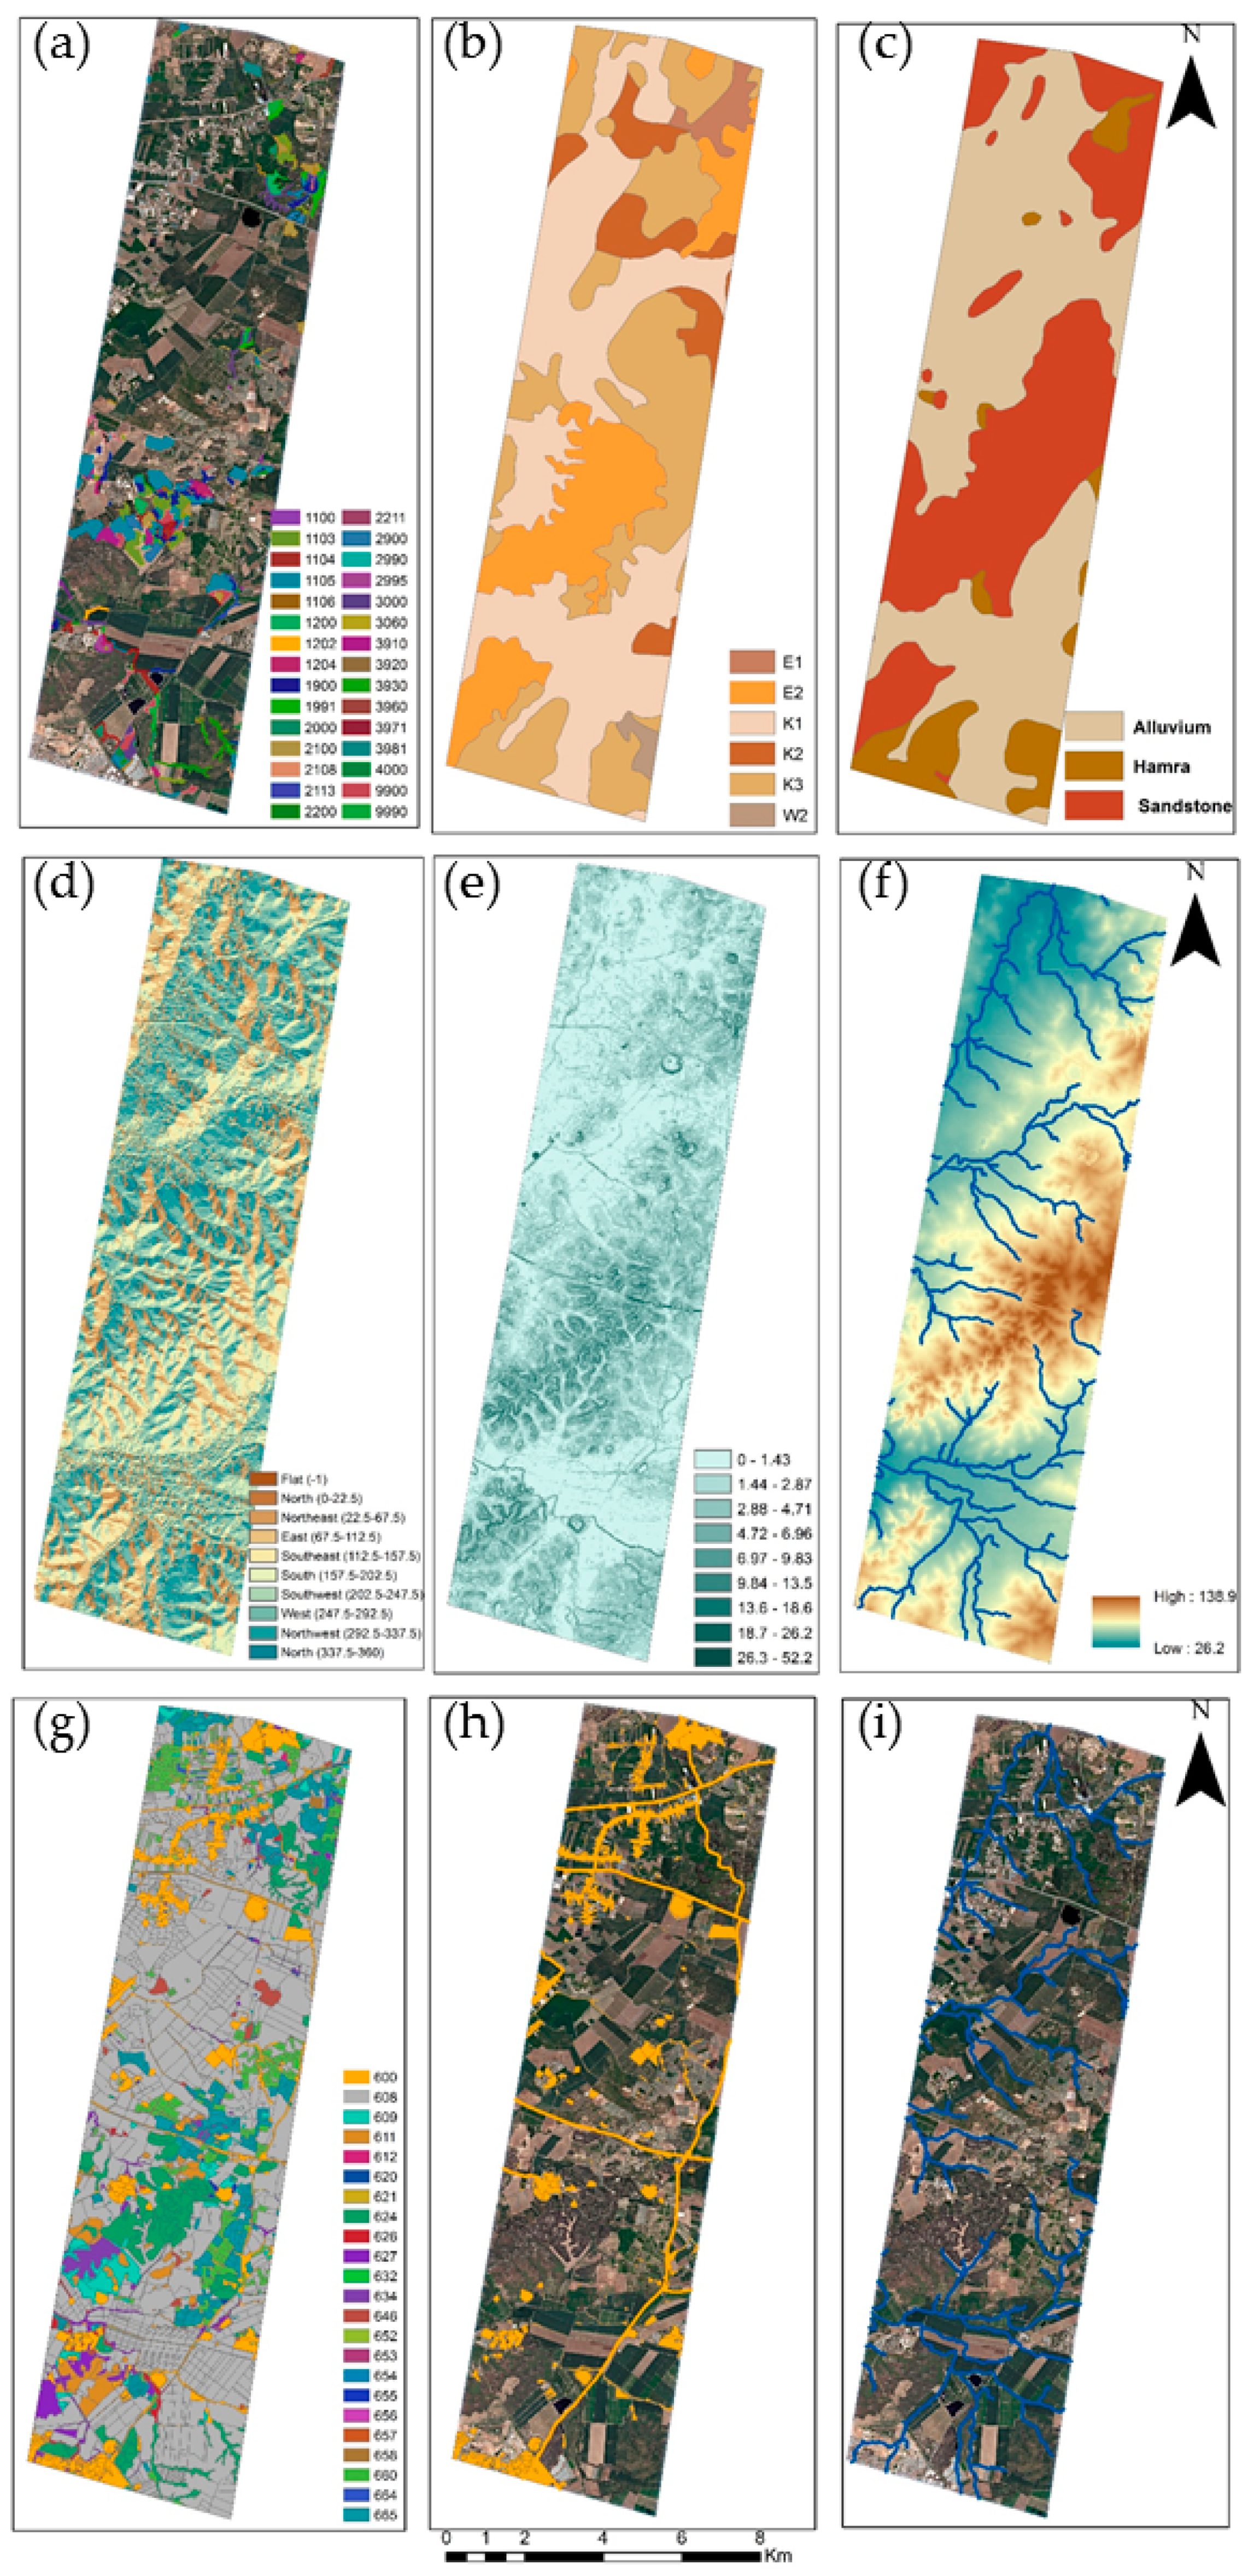
The final procedure (Stage 3) addressed the environmental and human factors that affect the pattern of the IPS in the landscape. The underlying assumption was that the densest areas of the IPS represented higher site stability for invasion. We developed a density map of the IPS that was calculated as the density of central points in the crown or clumps of crowns of the Acacia within a 100 m radius [44]. We assembled a set of 11 environmental and human factors as potential predictor variables for Acacia density (Figure 4, Table 1). Three topographic factors, slope, aspect, and elevation, were calculated from the digital elevation model (DEM), which is a terrain product at 4 m resolution from the Survey of Israel and created with the geomorphometric and gradient metrics toolbox [45]. The Euclidean distance algorithms derived from the DEM were used to calculate the distance from rivers, applying the Arc Hydro Toolbox [46] and implemented with ESRI ArcGIS software (ESRI 155 2014. ArcMap® 10.2.2 Redlands California). The substrate factors, including soil classification and lithology, were based on the official Survey of Israel Protection developed in 2004. The forest type was based on Israel’s forest authority maps (JNF) developed in 2015. We calculated the distance from populated areas (settlements) or roads using the Euclidean distance algorithm derived from the populated area from land-use maps. The land surface temperature map was based on a Landsat-8 image with 100 m resolution of land surface temperature (TIR radiance), which was acquired in proximity to the WorldView-2 (April 5, 2017), to represent temperature patterns in the landscape. Normalized difference vegetation index (NDVI), presenting vegetation productivity, was based on the 2017 WorldView-2 image. Each of these environmental and human factors was scaled up or down to match, the 2m resolution grid so that all the maps were geospatially aligned. All the maps were projected into ITM (Israeli Transverse Mercator) coordinate system projection (Figure 4). Before the analysis, the correlation between predictor variables was assessed using the Spearman rank correlation test, to prevent redundancy in the environmental factors (Table A1) [47].
With the above-listed variables, the second objective, exploring the influence of different environmental and human factors on the IPS spreading pattern, was addressed by using a random forest (RF) machine learning regression analysis. The Acacia density was the response variable to all the environmental and human factors [48,49,50]. We tested the relative importance of the predictor variables to IPS density by selecting meta-variables such as tree complexity/depth of the algorithm, the learning rate, and the number of trees [45]. We compared partial dependence plots (PDPs), in order to identify the nature of the relationships between Acacia density and environmental and human factors. The PDPs display the change in the probability over the range of one predicting factor, while all other factors stayed constant [51]. All the analyses were conducted using the R software [50,52] machine-learning platform.
3. Results
3.1. Species Classification Map
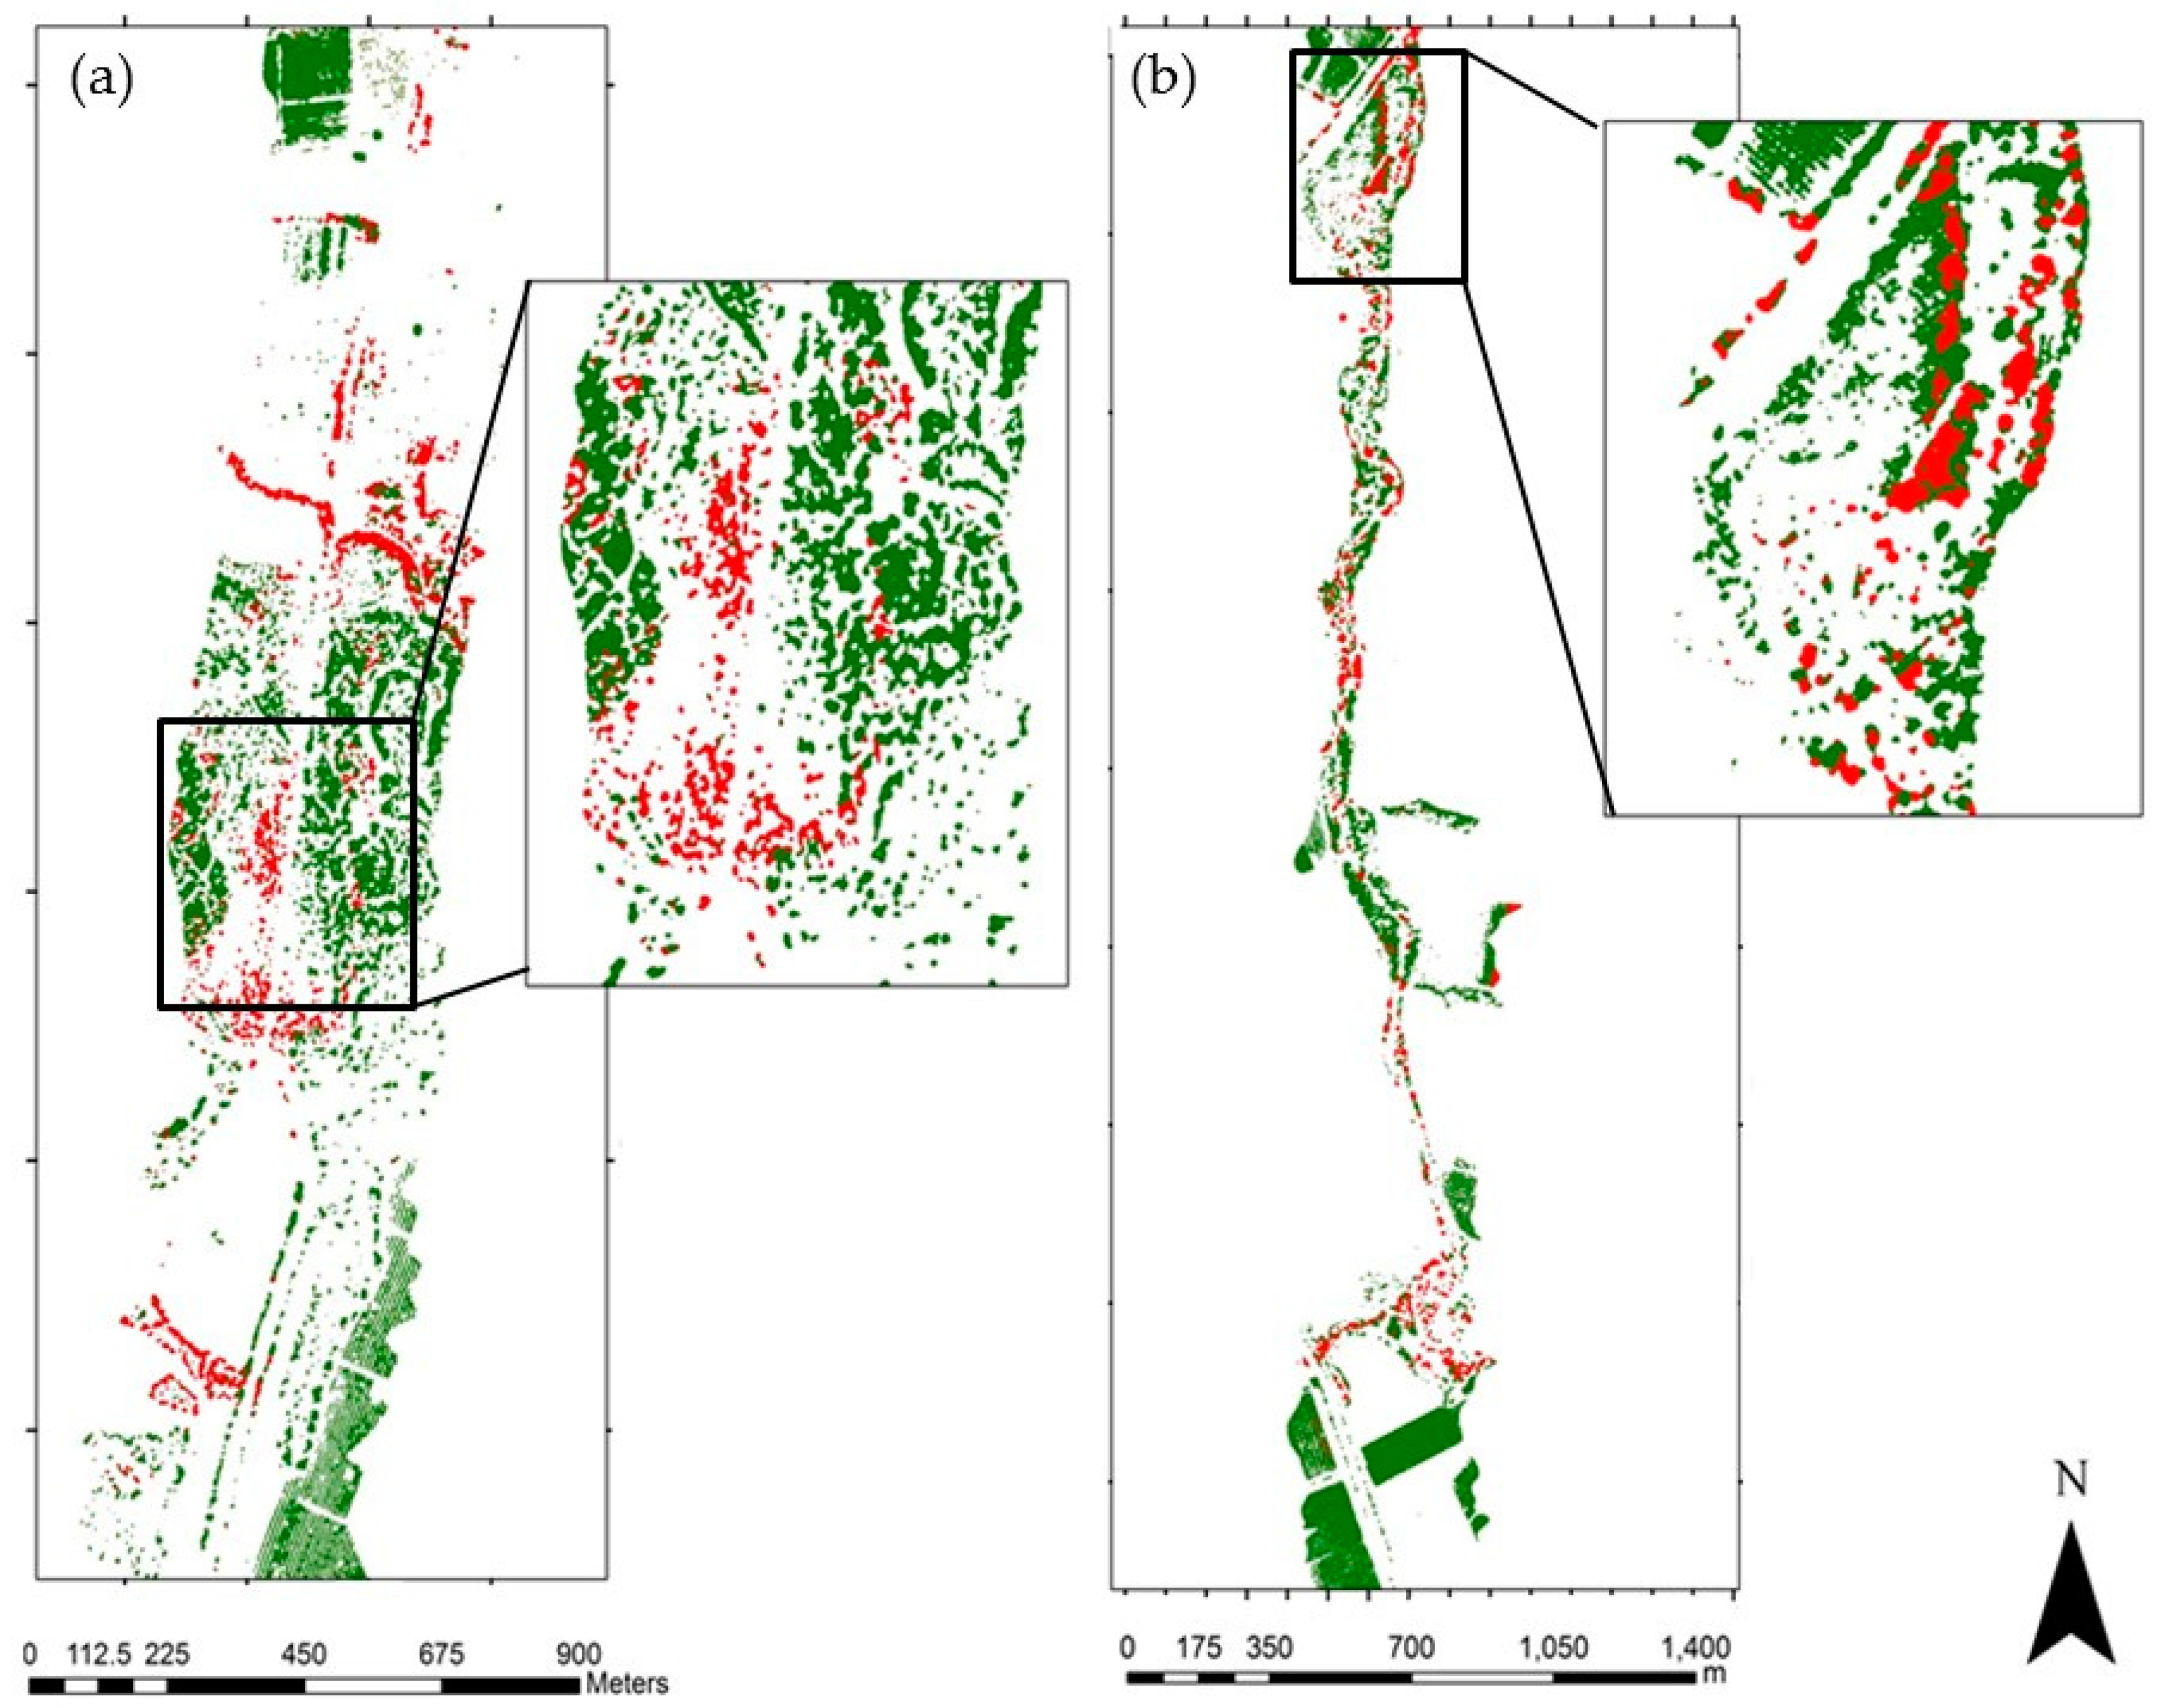
Figure 5 shows the IPS map for the Dorot and Negba sites that were developed from the species distribution maps based on Paz-Kagan et al. [35]. The Acacia covers 18.15% of the area in Dorot and 17.7% of the Negba site. It was shown that the accuracy of the class Acacia identification was 0.75 and 0.74 for the Dorot and Negba sites, respectively. Note that the Acacia classification was related to the leaf spectral signal, and not to the flowering signal in the hyperspectral image. Detailed information on the species mapping and classification can be found in Paz-Kagan et al. [35].
3.2. Invasive Plant Species Classification
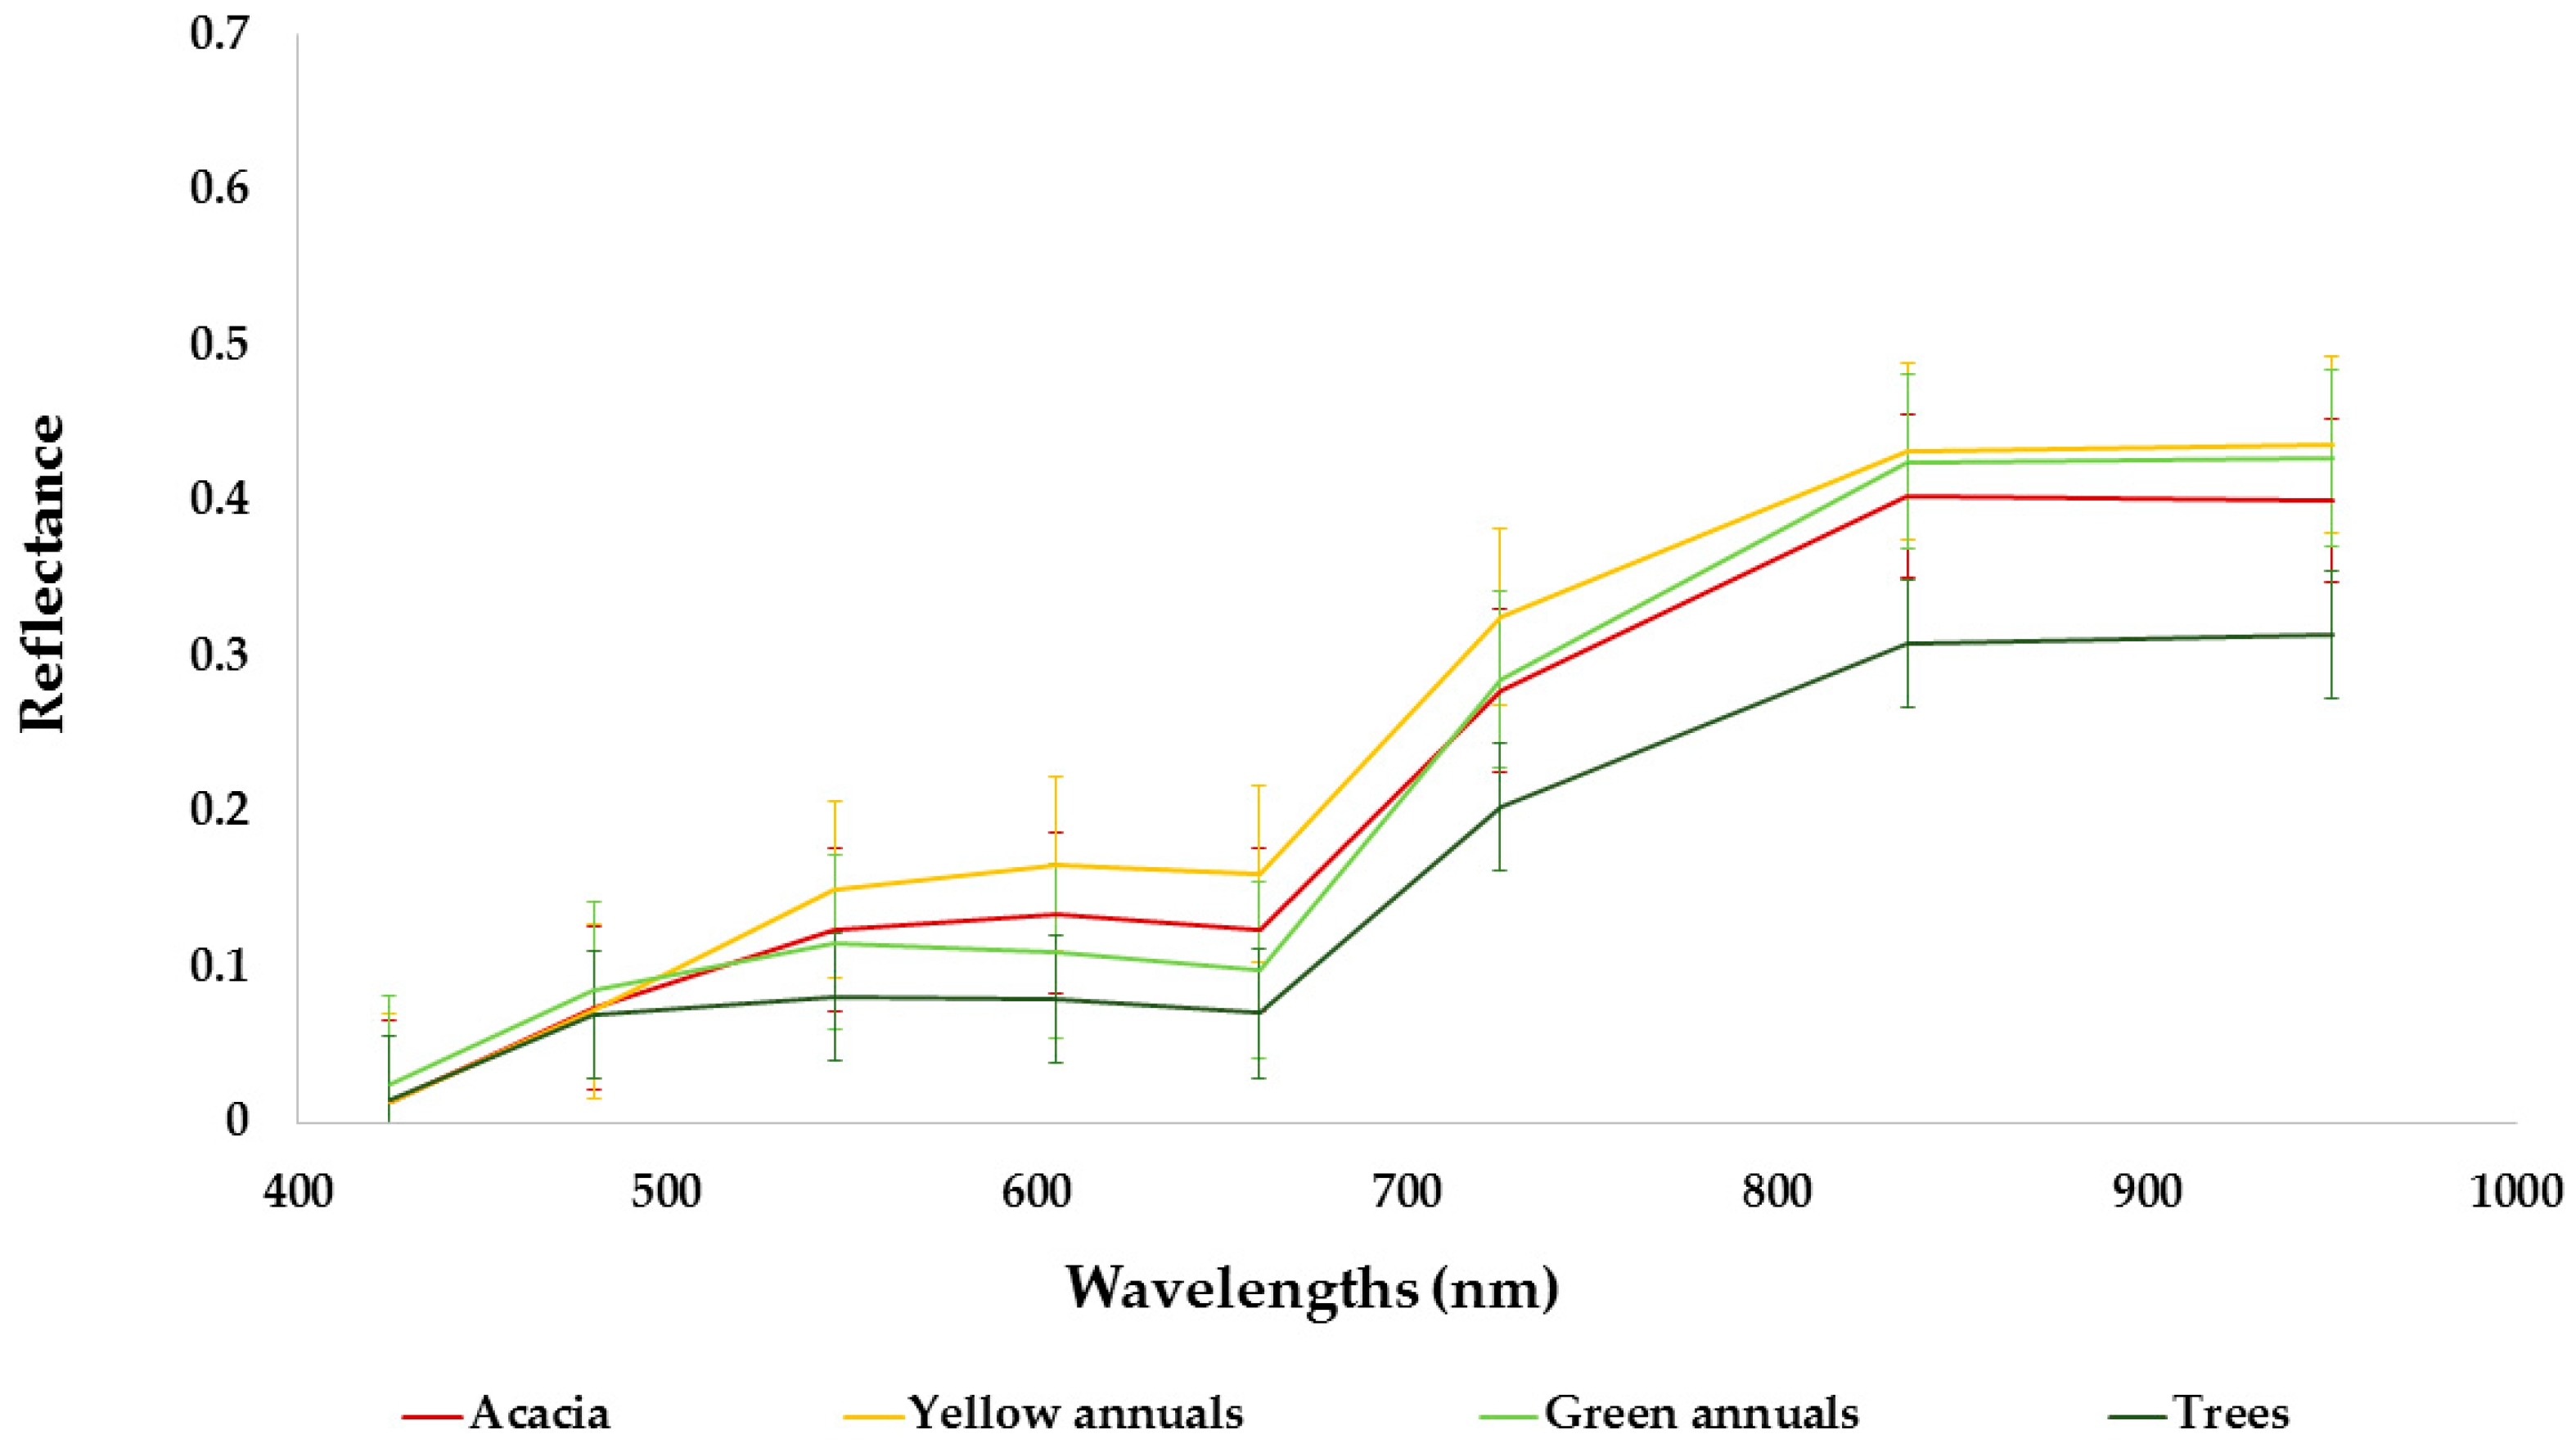
The potential invasive area spreads over 13 km2 within the 100 km2 covered by the WorldView-2 image. This map of potential areas was used for developing the IPS distribution map. Validation of the optimal SVM model yielded a prediction of Acacia’s location with high overall accuracy (0.89) and was subsequently used to identify and map the IPS distribution map at the landscape scale. The resulting Acacia distribution map had different levels of predictive accuracy for each class (Table 2). Classes with high accuracy were the ‘Acacia’ class (0.93), green annuals (0.95), dark soils (0.93) and other trees (0.98) (Table 2). The classes that had moderate accuracy were yellow annuals (0.74), and bright soils (0.77). The resulting spatial pattern agreed with our knowledge of Acacia distribution, complemented the findings of Paz-Kagan et al. [35] at the study sites, and matched additional ground training data with 88% accuracy. The ground training includes 30 sites in the study area where we verified by presence and absence of the IPS. The spectral signature of the different classes is shown in Figure 6. The spectral signature of Acacia and the annual yellow flowering were similar. Nevertheless, we were able to classify the yellow annuals with 0.74% accuracy. The prediction of Acacia in the 13-km2 area was about 10% cover. The spatial distribution of Acacia was not random and displayed a clear pattern in the landscape (Figure 7).
3.3. Environmental and Human Factors
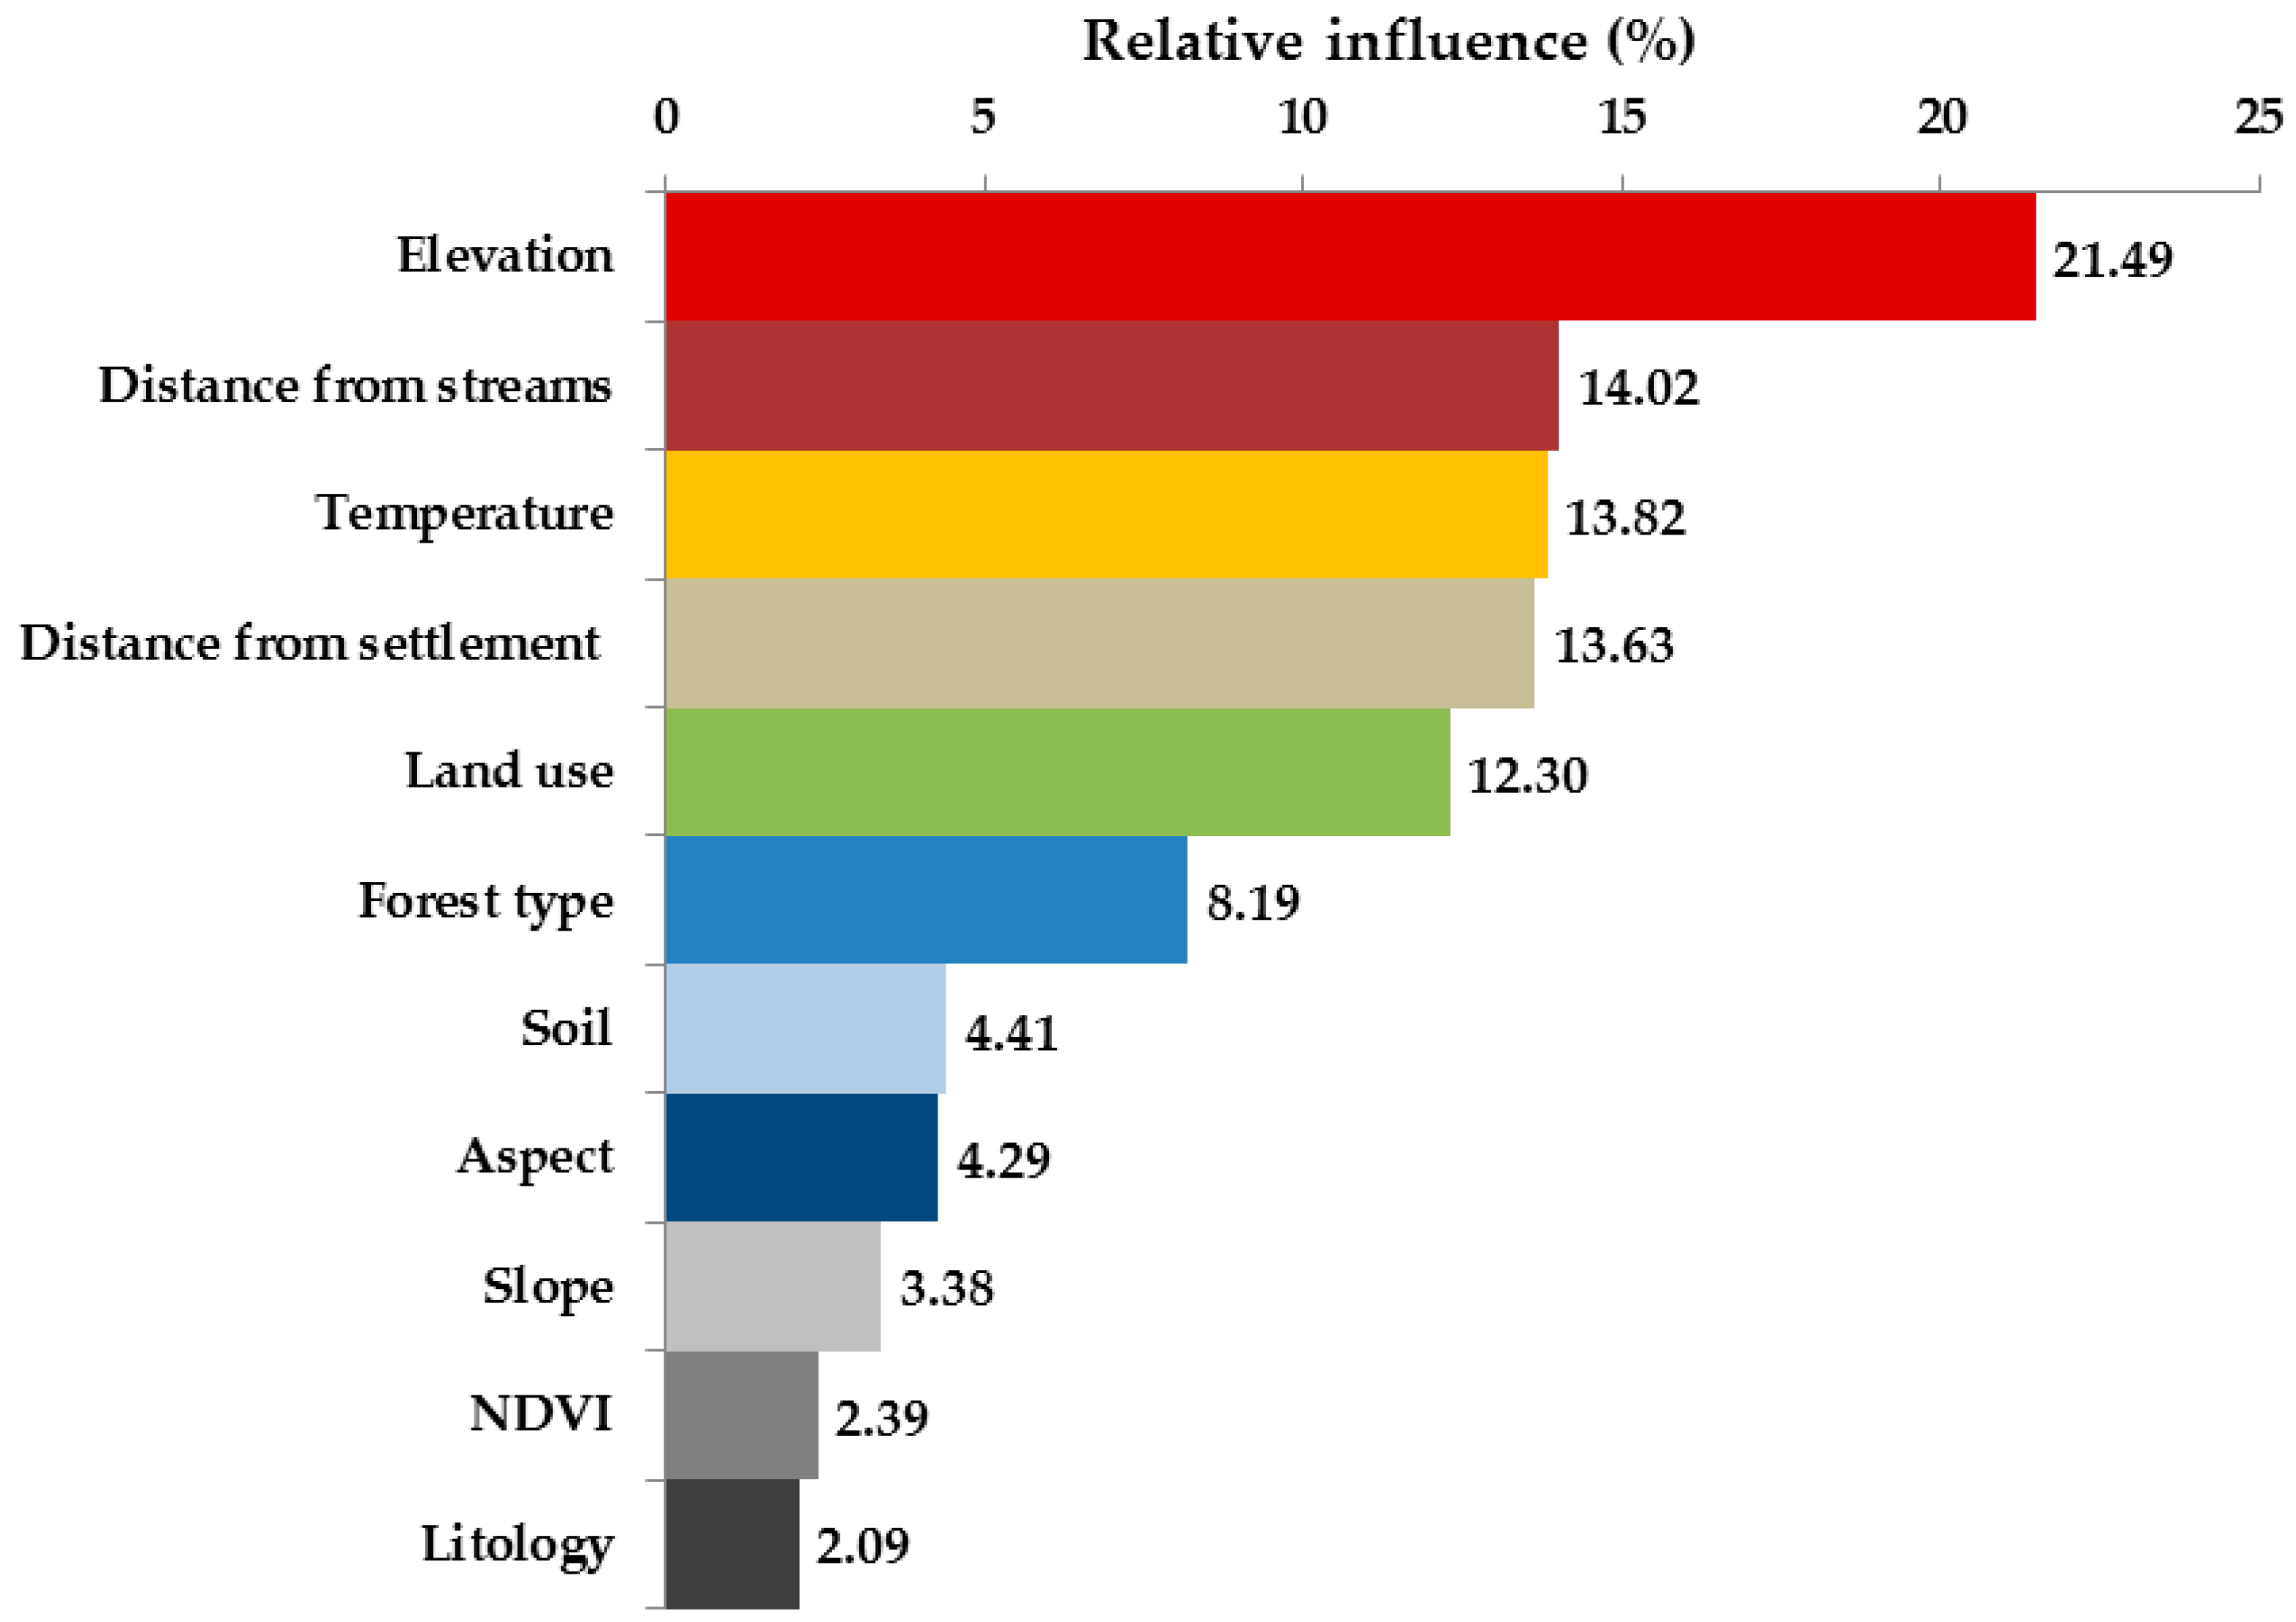
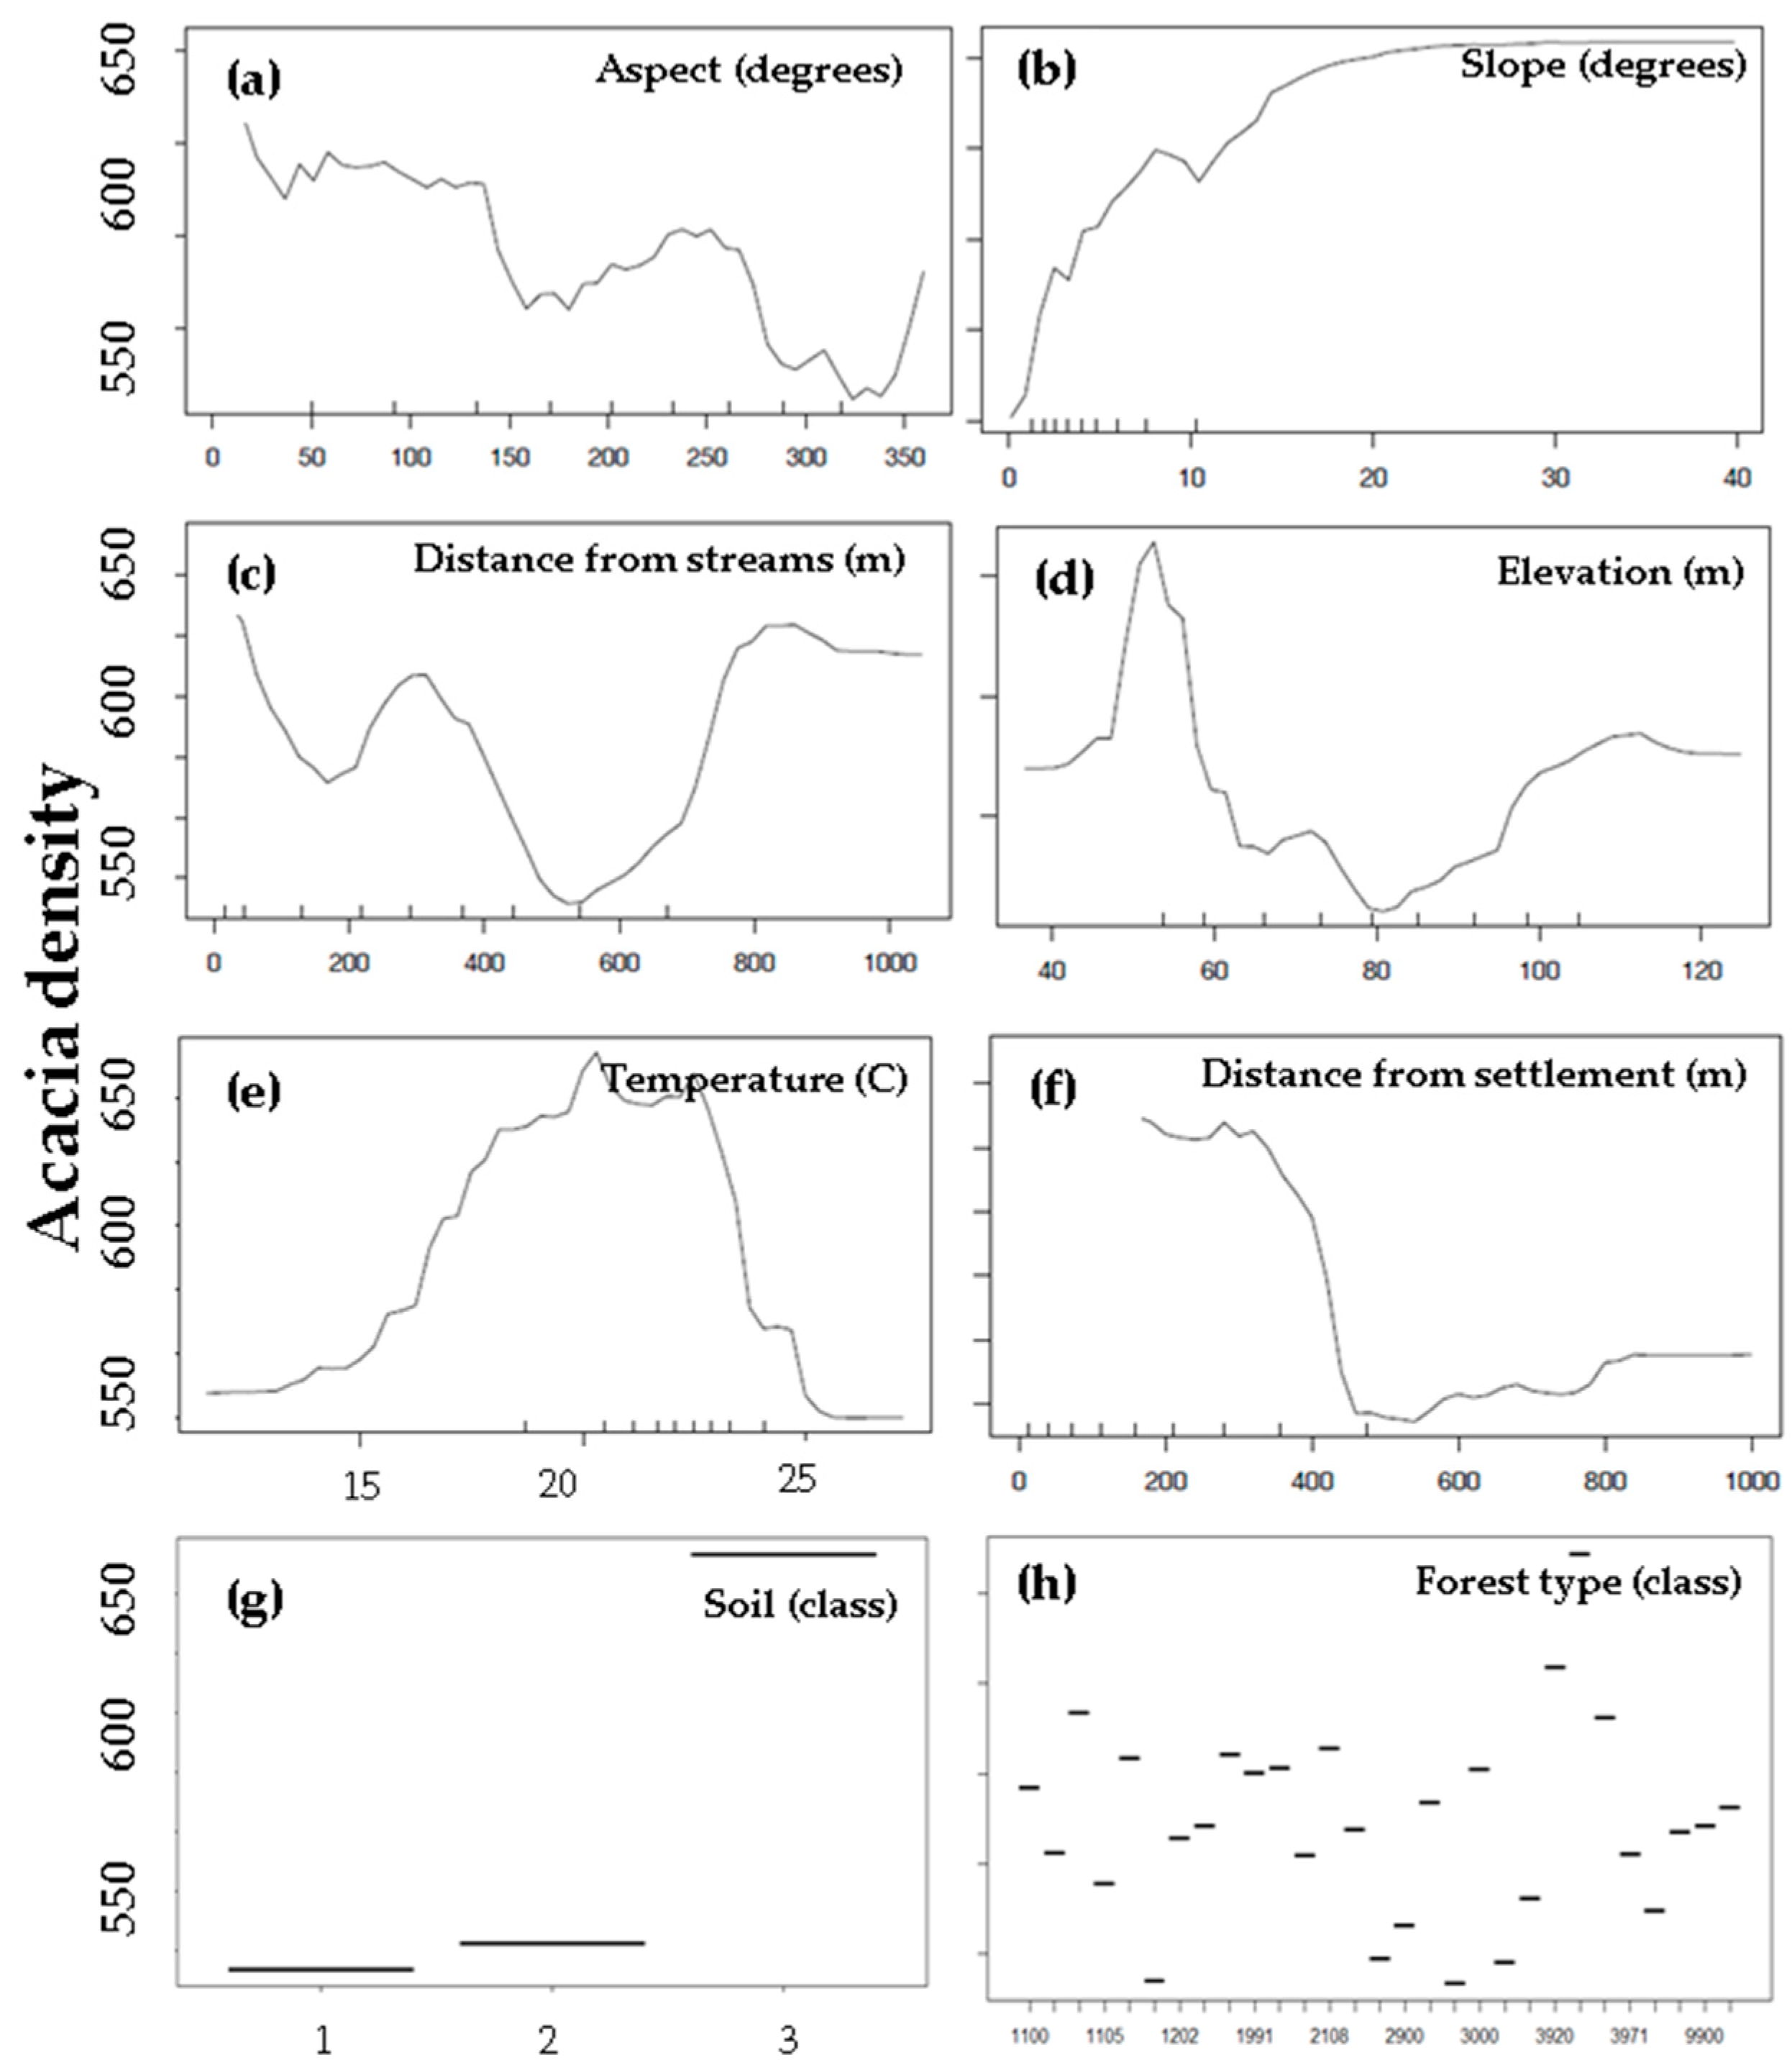
The performance of the RF machine-learning model had a coefficient of determination (R2) of 0.85 for the Acacia density and indicated a hierarchy of environmental factors. Figure 8 shows the results of the relative influence of the potential explanatory environmental factors used in the RF model to assess Acacia density (Figure 8). Partial dependency plots (PDP) based on the RF model were used to explore how individual predictor values influenced the Acacia density (Figure 9). PDPs do not highlight the nonlinear interactions between variables since all variables except for the one being examined that are held constant [53]. The PDPs indicate the non-linear probability of higher density of the invasive species. In addition, we found that there was a greater probability for a higher density of the invasive species in temperatures of 20 °C. Increased distance from settlements and roads was related to a lower density of the invasive species. We found that topography played an essential role in mediating the invaded species density: a significantly higher probability of Acacia density was found on steeper slopes and northern-facing slopes. Regarding soil classifications, we found that sandy soil showed a higher density of the invasive species. Finally, pine forests and open areas with natural vegetation also displayed a higher density of the invasive species based on the forest classification map.
4. Discussion
We sought to identify and better understand the key factors influencing IPS distribution of invasive Acacia trees in the coastal plain of Israel. IPS identification was based on the leafing and flowering phenological stage, using multispectral imagery at the species level. We showed that the phenological stage required the integration of several sources of data and additional prior knowledge regarding the potential invasion area of the species. Acacia distribution and density maps were developed based on high classification accuracy, which provided an accurate extent with an overall accuracy of 89.3% accuracy and 93.7% for the Acacia class, using the multispectral image. Examining the effect of environmental and human factors on invasive species density revealed that elevation, distance from settlements roads and rivers, and temperature patterns had the highest relative impact on Acacia density. We suggest that these environmental factors demonstrate the effect of site suitability for the invader. Moreover, we found that the invasive species density was significantly affected by human disturbance, perceptible by the distance from settlements, roads, and the effect of planted forest type.
4.1. Integrated Hyper and Multi-Spectral Data
Remote sensing plays an active role in the efforts to detect, monitor, and manage IPS. Paz-Kagan et al. [35] developed species distribution maps based on leaf spectral data using IS. These were successfully used to identify and train IPS in the communities they invade, enabling accurate identification of future areas of potential invasion [43]. The ability to train species distribution maps based on IS to multispectral satellite data might minimize the need for extensive, traditional ground survey methods, thus enabling coverage of large areas. The unique bands of WorldView-2, especially the yellow band, could be considered as essential for distinguishing yellow flowering in Acacia stands. Previous studies that used WorldView-2 images have also shown the importance of the new yellow and red-edge bands in improving woody vegetation discrimination, due to the detection of pigment contents in canopies [54]. Furthermore, the high spatial resolution of the WorldView-2 image enables distinguishing between the differences of Acacia crowns and other yellow flowering annuals.
The strategy of training species distribution maps based on IS, together with satellite imagery targeted at the flowering stage enabled identifying IPS and tracking their spread. These findings could help in determining the ecological consequences of the IPS, and provide detailed geographic information for management efforts to prevent future Acacia spread. Applying our suggested approach on a yearly basis would enable studying the rate and the range of invasive species spread and infestation, which have a negative impact on natural ecosystems worldwide in general, and in Israel in particular [38,55]. It was found that IPS such as Acacia significantly reduced the richness of local species in some areas, and is the first colonizer that can be found in most edge areas [35]. The four stages of invasion, transport, colonization, establishment, and landscape spread, appeared at different spatial and temporal scales [6]. The identification of invasion at the early stage may enable us to understand the interaction between the IPS and environmental characteristics. Furthermore, early detection of IPS could allow cost-effective management of the IPS using multispectral imagery. Our approach could be applied using satellite data with high revisit frequencies on large spatial scales to improve IPS detection at early stages of invasion. Broadening the scale of observation is especially important in the case of IPS phenology monitoring to identify the stages of invasion since damage to the ecosystem can accelerate detection of the IPS.
4.2. Environmental and Human Factors
The pattern of the spatial distribution of Acacia was not random, and rather it was influenced by environmental and human factors. After mapping the invasive plant distribution and modeling density, we found that elevation, distances from settlements roads and rivers, and temperature pattern were potential drivers of invader performance at the landscape scale. These factors relate to the preferences of the species distributions and site suitability. Several studies suggested that IPS performance is driven by environmental factors, and is context dependent [11]. Environmental factors constrain plant establishment and dispersal and usually determine invasion success [56]. IPS performance shows greater success (dominance or high density) in favorable environmental conditions, which indicate where and how these environmental factors constrain invasion success [57]. As demonstrated in the RF analysis, the above-mentioned environmental conditions interact, and may constrain the success of IPS. In such cases, the host plant community outperformed the IPS.
For example, land surface temperature, an environmental factor that showed high relative influence on IPS density, could be related to the flowering signal. Morais and Freitas [58], suggested that the phenology phases of Acacia species were strongly associated with temperature patterns and conditions, the temperature being the most significant predictor of the phenological cycle [59]. Also, studies using remote sensing application [60] have shown that land surface temperature contributes to predicting ecological niches and species distributions. Another example of environmental factors affecting IPS density is soil type. Sandy soil, a favorable environment for Acacia, has been attributed to Acacias’ pre-adaptation to the Mediterranean climate and the ability to cope with nutrient-poor soils [40]. Studies have shown that invasive Acacia increases the nitrogen status of the soil, which may provide these species with a competitive advantage over the native vegetation in poor sandy soils [61]. A third environmental effect could be IPS productivity success represented by NDVI since IPS have high abundance or dominance due to a higher growth rate, higher resource use efficiency, and reproductive success relative to local native species [12]. However, we did not find a high relative influence of NDVI on Acacia density.
As is well known, anthropogenic causes are the primary factor in the dispersal of invasive plant species [62]. Human disturbances alter the landscape and spatial arrangement of various elements that affect the spread of IPS [6], which disperse best through strips of human-disturbed habitat or ‘disturbance corridors’ and pathways [63]. In the current study, we found that distance from roads and settlements had a high relative influence on IPS density. These include roads, trails, and power lines that serve as intact habitats or vectors for dispersal of the invasive species [64]. Disturbed corridors result from the removal of native vegetation, creating corridors with disturbed soil, high illumination levels, altered hydrology, and destruction of the native seed bank [63], become a pathway for dispersal. Often, these disturbances create favorable conditions for colonization and establishment of IPS [6]. Our results show that distance from settlements and roads provide corridors and pathways for the dispersal of Acacia. The main reasons for the IPS establishment along corridors are related to edge effects and fragmentation where edge-effect related to abrupt transition between habitats or ecosystems introduce changes characterized in resource distribution and biotic interaction change, which affect plant and animal species distribution [65] These contusions are typically related to disturbed habitat, thus favorable for invasive species [66,67,68].
The potential of IPS to spread from a disturbed area to the native community increases fragmentation and edge effects [68]. Spatial information on the fragmentation and edge effects and on pathways of IPS are essential for monitoring, risk assessment, management of IPS and controlling their future spread. Management and control of IPS are very costly and required sustained investment over long pried of time, especially when the IPS have large and long-living seed bank, like the Acacias [69]. Our understanding of large-scale invasion mechanisms may help us to narrow management efforts to specific areas, in which control and management may be adequate to prevent future spread of the Acacia. The suggested framework could assist in identifying and delineating the pathway of dispersal, in directing restoration efforts and in controlling the stage of infestation. This highlights the importance of studying the effect of both human and environmental factors on IPS dispersal. Future studies should focus on the vectors for dispersal and pathway of disturbance to minimize future plant invasions.
Overall, our results reveal that environmental and human factors can identify where the IPS is likely to spread successfully. Our understanding of large-scale and spatially explicit species performance may help managers to monitor where IPS are likely to be successful invaders. One of the limitations of this approach is the need for accurate and high-resolution environmental and human factors data. For example, high-resolution digital elevation models, detailed soil maps, and climatic data may improve understanding of IPS patterns in the landscape they invaded [12]. Fine-scale environmental conditions such as nutrient availability, temperature pattern, and precipitation, or wind speed may drive invasion within small areas and improve our understanding of the mechanisms underlying successful plant invasions.
5. Conclusions
Our study has shown that integrating different sources of remote sensing data (hyper and multispectral) to identify IPS can be applied at the landscape scale and can be used for understanding the mechanisms underlying successful invasions. IS could be used to identify the IPS based on leaf signal, whereas satellite data further reinforced identification of the species utilizing the flowering signal. Acacia, an aggressive invasive species, can be monitored and managed on a large scale, based on unique phenological signals. Our suggested approach could aid management efforts in preventing future spread. The species distribution model and density maps were used to isolate environmental and human factors that constrain invasion success. Our knowledge concerning the outcome, spread and severity of invasion can prioritize management strategies and mitigate adverse impacts. Our suggested approach could assist in determining the environmental consequences of IPS and provide detailed geographic information for management and conservation efforts to prevent future spread. Knowing where and why invasion patterns change throughout the landscape will enable managers to deploy the site- and species-specific controls on IPS spread in the landscape.
Author Contributions
The contributions of the authors include: Conceptualization, T.P.-K. and A.K.; methodology, T.P.-K. and M.S.; software, T.P.-K., N.P., and M.S.; validation, T.P.-K.; formal analysis, T.P.-K., N.P., and M.S.; writing—original draft preparation, T.P.-K.; writing—review and editing, T.P.-K., A.K., and M.S.; visualization, T.P.-K. and A.K.; funding acquisition, A.K.
Funding
This research was partially funded by the Jewish National Fund (JNF) contract no. 40-02-044-14 and by the European Union Horizon 2020 Research and Innovation Programme under grant agreements no. 641762 “Improving Future Ecosystem Benefits through Earth Observations” (Ecopotential). and no. 654359 “Long-Term Ecosystem Research in Europe” (eLTER).
Conflicts of Interest
The authors declare no conflict of interest.
Appendix A

Table A1.
The Spearman Rank Correlation Test between predictor variables of the selected environmental factors. The bold number represents a correlation that is higher than R ≥ 0.5.
Table A1.
The Spearman Rank Correlation Test between predictor variables of the selected environmental factors. The bold number represents a correlation that is higher than R ≥ 0.5.
| Elevation | Aspect | Slope | Distance from Settlement | Distance from Streams | NDVI | Temperature | Land-Use | Soil | Lithology | Forest Type | |
|---|---|---|---|---|---|---|---|---|---|---|---|
| Elevation | 1.00 | ||||||||||
| Aspect | −0.01 | 1.00 | |||||||||
| Slope | 0.40 | −0.06 | 1.00 | ||||||||
| Distance from settlement | 0.20 | −0.03 | 0.09 | 1.00 | |||||||
| Distance from Streams | 0.60 | 0.10 | 0.23 | 0.09 | 1.00 | ||||||
| NDVI | −0.24 | 0.02 | −0.14 | −0.11 | −0.23 | 1.00 | |||||
| Temperature | 0.00 | −0.03 | −0.03 | 0.01 | 0.06 | −0.08 | 1.00 | ||||
| Land-use | 0.07 | −0.04 | 0.03 | 0.29 | 0.05 | −0.05 | −0.12 | 1.00 | |||
| Soil | 0.60 | 0.02 | 0.28 | 0.11 | 0.50 | −0.26 | −0.02 | 0.03 | 1.00 | ||
| Lithology | −0.07 | 0.01 | −0.11 | −0.14 | −0.04 | 0.08 | 0.07 | −0.07 | 0.01 | 1.00 | |
| Forest type | −0.18 | 0.05 | −0.03 | −0.20 | −0.19 | 0.07 | 0.01 | −0.24 | −0.10 | 0.12 | 1.00 |
Table A2.
The class code for the environmental variables shown in Figure 4 and Figure 9. The classes include data from pedology, lithology, JNF forest type, and land-use type.
| Pedology Class | Lithology Class | Forest Type | Land Use | ||||
|---|---|---|---|---|---|---|---|
| E1 | Alkaline soils | 1 | Clay, silt, sand, gravel (Alluvium soil) | 1103 | Pinus brutia | 600 | Settlements and roads |
| E2 | Pre-Randzina | 6 | Red silty sandstone loam | 1104 | Stone pine | 608 | Cultivated -agriculture |
| K1 | Dark brown sandy land | 5 | Sandstone | 1105 | Pinus halepensis | 609 | Abandoned cultivated area |
| K2 | Brown soils | 1106 | Pinus canariensis C. Smith | 611 | Stony area covered with vegetation | ||
| K3 | Ranzina | 1100 | Pinus | 612 | Sandy soils covered with vegetation | ||
| W3 | Sandy soils | 1200 | Cupressus | 620 | Forest | ||
| 1204 | Mediterranean cypress | 621 | Forest | ||||
| 1900 | Mixed coniferous forest | 624 | Planted Forest | ||||
| 1991 | Mixed coniferous forest | 626 | Grove | ||||
| 2000 | Broad-leafed trees | 627 | Shrubland | ||||
| 2100 | Eucalyptus | 632 | Inactive floodplain | ||||
| 2108 | Eucalyptus omphocephala | 634 | Badlands | ||||
| 2113 | Eucalyptus camaldulensis | 646 | Disturbed area | ||||
| 2200 | Acacia | 652 | Garden or park | ||||
| 2211 | Acacia saligna | 653 | Sports ground | ||||
| 2900 | Broad-leafed Mixed forest | 654 | Playground | ||||
| 2990 | Fruit trees | 655 | Open area | ||||
| 2995 | Ceratonia siliqua | 656 | Plastered surface | ||||
| 3000 | Flora Palaestina | 657 | Junkyard | ||||
| 3060 | Tamarisk | 658 | Garbage dump area | ||||
| 3910 | Natural Mediterranean forest | 660 | Orchards | ||||
| 3920 | Natural Mediterranean forest | 664 | Grapevine | ||||
| 3930 | Natural Mediterranean forest | 665 | Citrus orchard | ||||
| 3960 | Natural Mediterranean forest | ||||||
| 3971 | Natural Mediterranean forest | ||||||
| 3981 | Natural Mediterranean forest | ||||||
| 4000 | Natural Mediterranean forest | ||||||
| 9900 | open landscape | ||||||
| 9990 | open landscape | ||||||
References
- Pimentel, D.; McNair, S.; Janecka, J.; Wightman, J.; Simmonds, C.; O’connell, C.; Wong, E.; Russel, L.; Zern, J.; Aquino, T. Economic and environmental threats of alien plant, animal, and microbe invasions. Agric. Ecosyst. Environ. 2001, 84, 1–20. [Google Scholar] [CrossRef]
- Hobbs, R.J. Invasive Species in a Changing World; Island Press: Washington, DC, USA; Covelo, CA, USA, 2000. [Google Scholar]
- Vilà, M.; Espinar, J.L.; Hejda, M.; Hulme, P.E.; Jarošík, V.; Maron, J.L.; Pergl, J.; Schaffner, U.; Sun, Y.; Pyšek, P. Ecological impacts of invasive alien plants: A meta-analysis of their effects on species, communities and ecosystems. Ecol. Lett. 2011, 14, 702–708. [Google Scholar] [CrossRef] [PubMed]
- Bartz, R.; Kowarik, I. Assessing the environmental impacts of invasive alien plants: A review of assessment approaches. NeoBiota 2019, 43, 69. [Google Scholar] [CrossRef]
- MacDougall, A.S.; Turkington, R. Are invasive species the drivers or passengers of change in degraded ecosystems? Ecology 2005, 86, 42–55. [Google Scholar] [CrossRef]
- Theoharides, K.A.; Dukes, J.S. Plant invasion across space and time: Factors affecting nonindigenous species success during four stages of invasion. New Phytol. 2007, 176, 256–273. [Google Scholar] [CrossRef]
- Gallien, L.; Münkemüller, T.; Albert, C.H.; Boulangeat, I.; Thuiller, W. Predicting potential distributions of invasive species: Where to go from here? Divers. Distrib. 2010, 16, 331–342. [Google Scholar] [CrossRef]
- With, K.A. The landscape ecology of invasive spread. Conserv. Biol. 2002, 16, 1192–1203. [Google Scholar] [CrossRef]
- Mata, T.; Haddad, N.; Holyoak, M. How invader traits interact with resident communities and resource availability to determine invasion success. Oikos 2013, 122, 149–160. [Google Scholar] [CrossRef]
- DeGasperis, B.G.; Motzkin, G. Windows of opportunity: Historical and ecological controls on berberis thunbergii invasions. Ecology 2007, 88, 3115–3125. [Google Scholar] [CrossRef]
- Alpert, P.; Bone, E.; Holzapfel, C. Invasiveness, invasibility and the role of environmental stress in the spread of non-native plants. Perspect. Plant Ecol. Evol. Syst. 2000, 3, 52–66. [Google Scholar] [CrossRef]
- Barbosa, J.M.; Asner, G.P.; Hughes, R.F.; Johnson, M.T. Landscape-scale gpp and carbon density inform patterns and impacts of an invasive tree across wet forests of hawaii. Ecol. Appl. 2017, 27, 403–415. [Google Scholar] [CrossRef]
- Simberloff, D.; Martin, J.-L.; Genovesi, P.; Maris, V.; Wardle, D.A.; Aronson, J.; Courchamp, F.; Galil, B.; García-Berthou, E.; Pascal, M.; et al. Impacts of biological invasions: What’s what and the way forward. Trends Ecol. Evol. 2013, 28, 58–66. [Google Scholar] [CrossRef] [PubMed]
- Huang, C.-Y.; Asner, G.P. Applications of remote sensing to alien invasive plant studies. Sensors 2009, 9, 4869–4889. [Google Scholar] [CrossRef]
- Niphadkar, M.; Nagendra, H. Remote sensing of invasive plants: Incorporating functional traits into the picture. Int. J. Remote Sens. 2016, 37, 3074–3085. [Google Scholar] [CrossRef]
- Rocchini, D.; Andreo, V.; Förster, M.; Garzon-Lopez, C.X.; Gutierrez, A.P.; Gillespie, T.W.; Hauffe, H.C.; He, K.S.; Kleinschmit, B.; Mairota, P.; et al. Potential of remote sensing to predict species invasions: A modelling perspective. Prog. Phys. Geogr. 2015, 39, 283–309. [Google Scholar] [CrossRef]
- Skowronek, S.; Ewald, M.; Isermann, M.; Van De Kerchove, R.; Lenoir, J.; Aerts, R.; Warrie, J.; Hattab, T.; Honnay, O.; Schmidtlein, S.; et al. Mapping an invasive bryophyte species using hyperspectral remote sensing data. Biol. Invasions 2017, 19, 239–254. [Google Scholar] [CrossRef]
- Thenkabail, P.S.; Lyon, J.G. Hyperspectral Remote Sensing of Vegetation; CRC Press: London, NY, USA, 2016. [Google Scholar]
- Ustin, S.L.; Gamon, J.A. Remote sensing of plant functional types. New Phytol. 2010, 186, 795–816. [Google Scholar] [PubMed] [Green Version]
- Yelenik, S.G.; DiManno, N.; D’Antonio, C.M. Evaluating nurse plants for restoring native woody species to degraded subtropical woodlands. Ecol. Evol. 2015, 5, 300–313. [Google Scholar] [CrossRef] [PubMed]
- Féret, J.-B.; Asner, G.P. Mapping tropical forest canopy diversity using high-fidelity imaging spectroscopy. Ecol. Appl. 2014, 24, 1289–1296. [Google Scholar] [CrossRef] [PubMed]
- Somers, B.; Asner, G.P. Tree species mapping in tropical forests using multi-temporal imaging spectroscopy: Wavelength adaptive spectral mixture analysis. Int. J. Appl. Earth Observ. Geoinf. 2014, 31, 57–66. [Google Scholar] [CrossRef]
- Ustin, S.L.; Roberts, D.A.; Gamon, J.A.; Asner, G.P.; Green, R.O. Using imaging spectroscopy to study ecosystem processes and properties. BioScience 2004, 54, 523–534. [Google Scholar] [CrossRef]
- He, K.S.; Rocchini, D.; Neteler, M.; Nagendra, H. Benefits of hyperspectral remote sensing for tracking plant invasions. Divers. Distrib. 2011, 17, 381–392. [Google Scholar] [CrossRef] [Green Version]
- Narumalani, S.; Mishra, D.R.; Wilson, R.; Reece, P.; Kohler, A. Detecting and mapping four invasive species along the floodplain of north platte river, nebraska. Weed Technol. 2009, 23, 99–107. [Google Scholar] [CrossRef]
- Weil, G.; Lensky, I.M.; Resheff, Y.S.; Levin, N. Optimizing the timing of unmanned aerial vehicle image acquisition for applied mapping of woody vegetation species using feature selection. Remote Sens. 2017, 9, 1130. [Google Scholar] [CrossRef]
- Adam, E.; Mutanga, O.; Rugege, D. Multispectral and hyperspectral remote sensing for identification and mapping of wetland vegetation: A review. Wetl. Ecol. Manag. 2010, 18, 281–296. [Google Scholar] [CrossRef]
- Dewey, S.A.; Price, K.P.; Ramsey, D. Satellite remote sensing to predict potential distribution of dyers woad (isatis tinctoria). Weed Technol. 1991, 5, 479–484. [Google Scholar] [CrossRef]
- Lawrence, R.L.; Wood, S.D.; Sheley, R.L. Mapping invasive plants using hyperspectral imagery and breiman cutler classifications (randomforest). Remote Sens. Environ. 2006, 100, 356–362. [Google Scholar] [CrossRef]
- Fernandes, M.R.; Aguiar, F.C.; Silva, J.M.; Ferreira, M.T.; Pereira, J.M. Optimal attributes for the object based detection of giant reed in riparian habitats: A comparative study between airborne high spatial resolution and worldview-2 imagery. Int. J. Appl. Earth Observ. Geoinf. 2014, 32, 79–91. [Google Scholar] [CrossRef]
- Everitt, J.H.; Anderson, G.L.; Escobar, D.E.; Davis, M.R.; Spencer, N.R.; Andrascik, R.J. Use of remote sensing for detecting and mapping leafy spurge (euphorbia esula). Weed Technol. 1995, 9, 599–609. [Google Scholar] [CrossRef]
- Andrew, M.E.; Ustin, S.L. The role of environmental context in mapping invasive plants with hyperspectral image data. Remote Sens. Environ. 2008, 112, 4301–4317. [Google Scholar] [CrossRef]
- Andrew, M.E.; Ustin, S.L. Habitat suitability modelling of an invasive plant with advanced remote sensing data. Divers. Distrib. 2009, 15, 627–640. [Google Scholar] [CrossRef]
- Belluco, E.; Camuffo, M.; Ferrari, S.; Modenese, L.; Silvestri, S.; Marani, A.; Marani, M. Mapping salt-marsh vegetation by multispectral and hyperspectral remote sensing. Remote Sens. Environ. 2006, 105, 54–67. [Google Scholar] [CrossRef]
- Paz-Kagan, T.; Caras, T.; Herrmann, I.; Shachak, M.; Karnieli, A. Multiscale mapping of species diversity under changed land use using imaging spectroscopy. Ecol. Appl. 2017, 27, 1466–1484. [Google Scholar] [CrossRef] [PubMed]
- Rozenstein, O.; Karnieli, A. Comparison of methods for land-use classification incorporating remote sensing and gis inputs. Appl. Geogr. 2011, 31, 533–544. [Google Scholar] [CrossRef]
- Mussery, A.; Leu, S.; Lensky, I.; Budovsky, A. The effect of planting techniques on arid ecosystems in the northern negev. Arid Land Res. Manag. 2013, 27, 90–100. [Google Scholar] [CrossRef]
- Bar, P.; Cohen, O.; Shoshany, M. Invasion rate of the alien species acacia saligna within coastal sand dune habitats in israel. Israel J. Plant Sci. 2004, 52, 115–124. [Google Scholar]
- Thompson, G.D.; Bellstedt, D.U.; Richardson, D.M.; Wilson, J.R.; Le Roux, J.J. A tree well travelled: Global genetic structure of the invasive tree acacia saligna. J. Biogeogr. 2015, 42, 305–314. [Google Scholar] [CrossRef]
- Witkowski, E. Growth and competition between seedlings of protea repens (l.) l. And the alien invasive, acacia saligna (labill.) wendl. In relation to nutrient availability. Funct. Ecol. 1991, 5, 101–110. [Google Scholar] [CrossRef]
- Richter, R.; Schläpfer, D. Atmospheric/Topographic Correction for Satellite Imagery; DLR Report DLR-IB; ATCOR 2/3 User Gide, Version 9.3; DLR—German Aerospace Center: Wessling, Germany; ReSe Applications: Wil, Switzerland, 2005. [Google Scholar]
- Lu, D.; Weng, Q. A survey of image classification methods and techniques for improving classification performance. Int. J. Remote Sens. 2007, 28, 823–870. [Google Scholar] [CrossRef] [Green Version]
- R Core Team. R: A Language and Environment for Statistical Computing; R Core Team: Vienna, Austria, 2018. [Google Scholar]
- Paz-Kagan, T.; Vaughn, N.R.; Martin, R.E.; Brodrick, P.G.; Stephenson, N.L.; Das, A.J.; Nydick, K.R.; Asner, G.P. Landscape-scale variation in canopy water content of giant sequoias during drought. For. Ecol. Manag. 2017, 419, 291–304. [Google Scholar] [CrossRef]
- Evans, J.S.; Murphy, M.A.; Holden, Z.A.; Cushman, S.A. Modeling species distribution and change using random forest. In Predictive Species and Habitat Modeling in Landscape Ecology; Springer: London, NY, USA, 2011; pp. 139–159. [Google Scholar]
- Maidment, D.R.; Morehouse, S. Arc Hydro: Gis for Water Resources; ESRI, Inc.: Redland, CA, USA, 2002; Volume 1. [Google Scholar]
- Zuur, A.F.; Ieno, E.N.; Elphick, C.S. A protocol for data exploration to avoid common statistical problems. Methods Ecol. Evol. 2010, 1, 3–14. [Google Scholar] [CrossRef]
- Ai, F.-F.; Bin, J.; Zhang, Z.-M.; Huang, J.-H.; Wang, J.-B.; Liang, Y.-Z.; Yu, L.; Yang, Z.-Y. Application of random forests to select premium quality vegetable oils by their fatty acid composition. Food Chem. 2014, 143, 472–478. [Google Scholar] [CrossRef] [PubMed]
- Biau, G.; Devroye, L.; Lugosi, G. Consistency of random forests and other averaging classifiers. J. Mach. Learn. Res. 2008, 9, 2015–2033. [Google Scholar]
- Breiman, L. Random forests. Mach. Learn. 2001, 45, 5–32. [Google Scholar] [CrossRef]
- Friedman, J.H. Greedy function approximation: A gradient boosting machine. Ann. Stat. 2001, 29, 1189–1232. [Google Scholar] [CrossRef]
- Cutler, D.R.; Edwards, T.C., Jr.; Beard, K.H.; Cutler, A.; Hess, K.T.; Gibson, J.; Lawler, J.J. Random forests for classification in ecology. Ecology 2017, 88, 2783–2792. [Google Scholar] [CrossRef]
- Paz-Kagan, T.; Brodrick, P.G.; Vaughn, N.R.; Das, A.J.; Stephenson, N.L.; Nydick, K.R.; Asner, G.P. What mediates tree mortality during drought in the southern sierra nevada? Ecol. Appl. 2017, 27, 2443–2457. [Google Scholar] [CrossRef]
- Pu, R.; Landry, S. A comparative analysis of high spatial resolution ikonos and worldview-2 imagery for mapping urban tree species. Remote Sens. Environ. 2012, 124, 516–533. [Google Scholar] [CrossRef]
- Richardson, D.M.; Kluge, R.L. Seed banks of invasive australian acacia species in south africa: Role in invasiveness and options for management. Perspect. Plant Ecol. Evol. Syst. 2008, 10, 161–177. [Google Scholar] [CrossRef]
- Brooks, W.R.; Jordan, R.C. Propagule pressure and native species richness effects drive invasibility in tropical dry forest seedling layers. Perspect. Plant Ecol., Evol. Syst. 2013, 15, 162–170. [Google Scholar] [CrossRef]
- Barbosa, J.M.; Asner, G.P.; Martin, R.E.; Baldeck, C.A.; Hughes, F.; Johnson, T. Determining subcanopy psidium cattleianum invasion in hawaiian forests using imaging spectroscopy. Remote Sens. 2016, 8, 33. [Google Scholar] [CrossRef]
- Morais, M.; Freitas, H. Phenological dynamics of the invasive plant acacia longifolia in portugal. Weed Res. 2015, 55, 555–564. [Google Scholar] [CrossRef]
- Buermann, W.; Saatchi, S.; Smith, T.B.; Zutta, B.R.; Chaves, J.A.; Milá, B.; Graham, C.H. Predicting species distributions across the amazonian and andean regions using remote sensing data. J. Biogeogr. 2008, 35, 1160–1176. [Google Scholar] [CrossRef]
- Bobrowski, M.; Bechtel, B.; Böhner, J.; Oldeland, J.; Weidinger, J.; Schickhoff, U. Application of thermal and phenological land surface parameters for improving ecological niche models of betula utilis in the himalayan region. Remote Sens. 2018, 10, 814. [Google Scholar] [CrossRef]
- Yelenik, S.; Stock, W.; Richardson, D. Ecosystem level impacts of invasive acacia saligna in the south african fynbos. Restor. Ecol. 2004, 12, 44–51. [Google Scholar] [CrossRef]
- Hastings, A.; Cuddington, K.; Davies, K.F.; Dugaw, C.J.; Elmendorf, S.; Freestone, A.; Harrison, S.; Holland, M.; Lambrinos, J.; Malvadkar, U.; et al. The spatial spread of invasions: New developments in theory and evidence. Ecol. Lett. 2005, 8, 91–101. [Google Scholar] [CrossRef]
- Walker, L.R. Ecosystems of Disturbed Ground; Elsevier: Amsterdam, The Netherlands, 1999; Volume 16. [Google Scholar]
- Trombulak, S.C.; Frissell, C.A. Review of ecological effects of roads on terrestrial and aquatic communities. Conserv. Biol. 2000, 14, 18–30. [Google Scholar] [CrossRef]
- Harris, L.D. Edge effects and conservation of biotic diversity. Conserv. Biol. 1988, 2, 330–332. [Google Scholar] [CrossRef]
- Cerboncini, R.A.S.; Roper, J.J.; Passos, F.C. Edge effects without habitat fragmentation? Small mammals and a railway in the atlantic forest of southern brazil. Oryx 2016, 50, 460–467. [Google Scholar] [CrossRef]
- Holway, D.A. Edge effects of an invasive species across a natural ecological boundary. Biol. Conserv. 2005, 121, 561–567. [Google Scholar] [CrossRef]
- Pardini, R. Effects of forest fragmentation on small mammals in an atlantic forest landscape. Biodivers. Conserv. 2004, 13, 2567–2586. [Google Scholar] [CrossRef]
- Le Maitre, D.C.; Gaertner, M.; Marchante, E.; Ens, E.J.; Holmes, P.M.; Pauchard, A.; O’Farrell, P.J.; Rogers, A.M.; Blanchard, R.; Blignaut, J.; et al. Impacts of invasive australian acacias: Implications for management and restoration. Divers. Distrib. 2011, 17, 1015–1029. [Google Scholar] [CrossRef]
Figure 1.
Acacia saligna and Acacia salicina flowering branch (a,b); Acacia saligna during the flowering stage - flowering canopy (c); expansion of the A. saligna and A. salicina invasive species in the study area (d).
Figure 1.
Acacia saligna and Acacia salicina flowering branch (a,b); Acacia saligna during the flowering stage - flowering canopy (c); expansion of the A. saligna and A. salicina invasive species in the study area (d).

Figure 2.
(a) Location of the study area in the southern coastal plain of Israel; (b) True color WorldView-2 image of the study area. The two overpasses of the hyperspectral flights over Negba and Dorot sites are marked in red. The green areas indicate the possible areas of the invasive species.
Figure 2.
(a) Location of the study area in the southern coastal plain of Israel; (b) True color WorldView-2 image of the study area. The two overpasses of the hyperspectral flights over Negba and Dorot sites are marked in red. The green areas indicate the possible areas of the invasive species.

Figure 3.
The conceptual framework of an integrated approach by training species maps based on airborne imaging spectroscopy data to multi-spectral satellite data for invasive plant species mapping, and for understanding the environmental effect on their spread pattern in the landscape. The framework includes three stages: (1) data preprocessing, filtering, and masking; (2) data classification; and (3) interpolation of the data to IPS density for studying the environmental factors influences using a random forest machine-learning algorithm.

Figure 4.
Selected examples of the potential explanatory environmental factors used to assess the Acacia density: (a) Forest type (class), (b) pedology (classes), (c) lithology (classes), (d) topographic aspect (class), (e) slope steepness (degree), (f) elevation above sea level (m), (g) land-use (classes) (h) human settlements and roads used to calculate the Euclidean distance, and (i) river streams use to calculate the Euclidean distance. All classes’ values are detailed in Table A2.

Figure 5.
Acacia salicina and Acacia saligna classification maps based on species distribution maps from Paz-Kagan et al. [35]. (a) Invasive plant species map of the Negba site with a zoom to the specific invasive location. (b) Invasive plant species map of the Dorot site with a zoom to the specific invasive location. The green color represents the other woody species, and the red color represents the location of Acacia trees.

Figure 6.
Spectral signatures used for classifying the invasive plant species in the study area based on WorldView-2 imagery with standard deviation (SD). The number of pixels that were used to train the support vector machine (SVM) classification is shown in Table 2.
Figure 6.
Spectral signatures used for classifying the invasive plant species in the study area based on WorldView-2 imagery with standard deviation (SD). The number of pixels that were used to train the support vector machine (SVM) classification is shown in Table 2.

Figure 7.
The Acacia invasion plant species distribution (IPS) map based on WorldView-2 imagery (a), zoomed for the two study sites (b,c). The green color represents the potential invasion area, and the red color represents the location of Acacia trees. The IPS distribution map was used to develop a density map of the focal species.

Figure 8.
Relative influence of the potential explanatory environmental factors used in the random forest model to assess Acacia density.
Figure 8.
Relative influence of the potential explanatory environmental factors used in the random forest model to assess Acacia density.

Figure 9.
Partial dependence plots (PDPs) display the change in the Acacia density over the range of one predictor factor. The environmental factors include: (a) aspect (degrees); (b) slope steepness (degrees); (c) distance from streams (m); (d) elevation (m); (e) temperature (°C); (f) distance from settlements (m); (g) lithology (class); and (h) land-use (classes).

Table 1.
Environmental and human factors considered for analysis of Acacia density.
| Categories Enveromantal | Factors | Units |
|---|---|---|
| Topography | Elevation | m |
| Slope | degree | |
| Aspect | degree | |
| Distance from rivers or streams | m | |
| Substrate | Pedology | Class |
| Lithology | Class | |
| Land Surface | Temperature | °C |
| Productivity | NDVI | unitless |
| Categories/human | ||
| Forest structure | Forest type | Class |
| Land-use | Land-use | Class |
| Distance from roads and settlements | m |
Table 2.
Confusion matrix for the Acacia species mapping on the validation dataset using the support vector machine (SVM) model.
Table 2.
Confusion matrix for the Acacia species mapping on the validation dataset using the support vector machine (SVM) model.
| Classes | Acacia | Annual Green | Dark Soil | Bright Soil | Trees | Yellow Annuals | Total Pixels |
|---|---|---|---|---|---|---|---|
| Acacia | 548 | 5 | 0 | 1 | 1 | 23 | 578 |
| Green annual | 15 | 375 | 1 | 3 | 2 | 2 | 398 |
| Dark soil | 3 | 0 | 300 | 32 | 2 | 0 | 337 |
| Bright soil | 1 | 0 | 24 | 145 | 0 | 2 | 172 |
| Trees | 6 | 1 | 0 | 0 | 995 | 0 | 1002 |
| Yellow annuals | 12 | 0 | 0 | 6 | 0 | 79 | 97 |
| Total pixels | 585 | 381 | 325 | 187 | 1000 | 106 | 2584 |
| Total accuracy | 93.68 | 95.91 | 92.02 | 77.54 | 98.71 | 74.53 | 89.32 |
© 2019 by the authors. Licensee MDPI, Basel, Switzerland. This article is an open access article distributed under the terms and conditions of the Creative Commons Attribution (CC BY) license (http://creativecommons.org/licenses/by/4.0/).
Share and Cite
MDPI and ACS Style
Paz-Kagan, T.; Silver, M.; Panov, N.; Karnieli, A. Multispectral Approach for Identifying Invasive Plant Species Based on Flowering Phenology Characteristics. Remote Sens. 2019, 11, 953. https://0-doi-org.brum.beds.ac.uk/10.3390/rs11080953
AMA Style
Paz-Kagan T, Silver M, Panov N, Karnieli A. Multispectral Approach for Identifying Invasive Plant Species Based on Flowering Phenology Characteristics. Remote Sensing. 2019; 11(8):953. https://0-doi-org.brum.beds.ac.uk/10.3390/rs11080953
Chicago/Turabian StylePaz-Kagan, Tarin, Micha Silver, Natalya Panov, and Arnon Karnieli. 2019. "Multispectral Approach for Identifying Invasive Plant Species Based on Flowering Phenology Characteristics" Remote Sensing 11, no. 8: 953. https://0-doi-org.brum.beds.ac.uk/10.3390/rs11080953
Note that from the first issue of 2016, this journal uses article numbers instead of page numbers. See further details here.