Article

High Temporal Resolution Monitoring of Suspended Matter Changes from GOCI Measurements in Lake Taihu

1
State Key Laboratory of Lake Science and Environment, Nanjing Institute of Geography and Limnology, Chinese Academy of Sciences, Nanjing 210008, China
2
State Key Laboratory of Hydrology-Water Resources and Hydraulic Engineering, Nanjing Hydraulic Research Institute, Nanjing 210029, China
3
University of Chinese Academy of Sciences, Beijing 100049, China
4
School of Geographic Science, Nanjing Normal University, Nanjing 210023, China
*
Author to whom correspondence should be addressed.
Submission received: 15 March 2019 / Revised: 11 April 2019 / Accepted: 23 April 2019 / Published: 25 April 2019
(This article belongs to the Special Issue Remote Sensing of Inland Waters and Their Catchments)

Abstract

:
The Tiaoxi River is the main source of water for Lake Taihu and can result in plumes in the lake after heavy precipitation events. These plumes have played a crucial role in the water quality changes within the lake. High temporal resolution GOCI (Geostationary Ocean Color Imager) data were used to study the spatial distribution of the total suspended matter concentration in Lake Taihu after heavy precipitation events in the Tiaoxi River Basin via an empirical model. The plumes were analyzed after two heavy precipitation events in 2011 and 2013 using 16 GOCI images, which indicated that the Tiaoxi River had a great influence on the spatial distributions of total suspended matter and algal blooms. It was concluded that the main factors affecting the plumes in the Tiaoxi River were precipitation intensity, runoff, and total suspended matter concentration. Human activity, such as sand excavation also played a crucial role in sediment discharge. The results of this study demonstrate that the visualization of GOCI data makes it possible to use remote sensing technology to continuously monitor an inland water environment on an hourly scale, which is of great significance for studying the diffusion and evolution of river plumes.

Graphical Abstract

1. Introduction

Coastal estuarine areas generally have a large river flow and high amounts of suspended matter, nutrients, and other substances, which results in plumes that affect ocean water quality [1,2,3,4,5]. Similarly, precipitation events bring large amounts of dissolved and particulate substances into lakes [6,7,8]. During a precipitation event, the local water quantity increases, which increases the water flow into the lake and forms a plume in the estuary area of the lake similar to the formation of plumes in coastal estuarine areas. Therefore, the large amounts of substances that flow into lakes as a result of precipitation events are bound to have an impact on the water quality. At present, there are numerous studies on plumes in the estuaries of major rivers that flow into the ocean [9,10,11]. However, relevant research on the impacts of plumes in inland lakes is still rare.
Traditionally, the water quality constituents for inland water have been obtained from in situ-measured samples. The use of a limited number of samples to represent the overall temporal and spatial distributions of water quality constituents has proven to be problematic in lake waters with high spatial and temporal variations, especially for lakes with large spatial scales [12,13]. Satellite remote sensing technology, as a large-scale observation method, can acquire an entire spectrum of lake water characteristics. Many scholars have made remarkable achievements in this field in recent decades through continuous advances in remote sensing technology [14,15].
MODIS (Moderate Resolution Imaging Spectroradiometer) data are high temporal resolution monitoring data that are widely used for inland water monitoring, and these data are acquired by Terra MODIS and Aqua MODIS with a temporal resolution of one day. Many studies have used MODIS data to research the optical characteristics and water quality parameters of inland water [16,17,18]. With advances in satellite technology, COMS (Communication, Ocean and Meteorological Satellite), which is the world’s first geosynchronous orbit satellite, was equipped with a Geostationary Ocean Color Imager (GOCI) sensor and launched on 27 June, 2010 [19]. The main purpose of this satellite is to continuously observe the ocean color around the Korean Peninsula and study any rapid changes in the ocean, land, and atmosphere from a stationary platform at a high temporal resolution. One of the most important features of GOCI data is the high temporal resolution, as it improved the temporal resolution from days to hours. GOCI can obtain eight images of the same area from 8:00 am to 15:00 pm each day. The high temporal resolution of GOCI data can be used to study the movement trends of optically active constituents over a long period of time from a macroscopic view.
Although GOCI was designed for ocean waters [20,21], many studies have evidenced that it also can be applied to inland waters. For example, some scholars developed a new method for estimating the total suspended solid concentration in Chinese turbid inland lakes using GOCI data [22]. Others used GOCI data to estimate the chlorophyll concentrations in turbid inland lakes [23,24].
Lake Taihu is a typical shallow water body, and the area is 2338 km2 [25]. Because the water quality parameters are moving along with the lake current rapidly [26,27,28], GOCI data with extremely high time resolution is suitable for the work to monitor the lake. For instance, Huang used GOCI to monitor the distribution of suspended matter and algae in Lake Taihu [29,30], and Bao monitored chlorophyll concentration in Lake Taihu by GOCI [31]. The plumes can affect Lake Taihu water quality in a short period of time, therefore MODIS data used in the existing study is obviously unable to accurately obtain the variation tendency of the plume [8]. GOCI data, therefore, have great potential and application value.
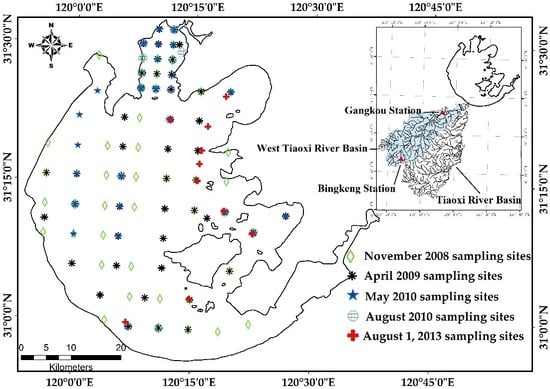
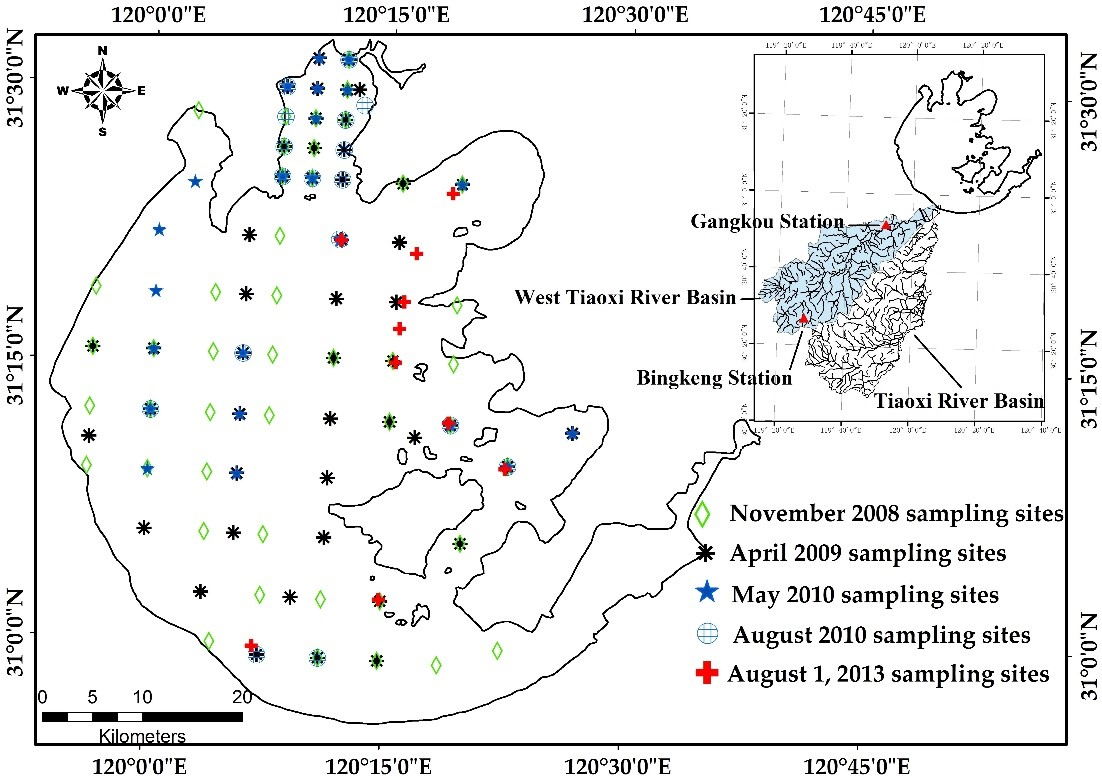
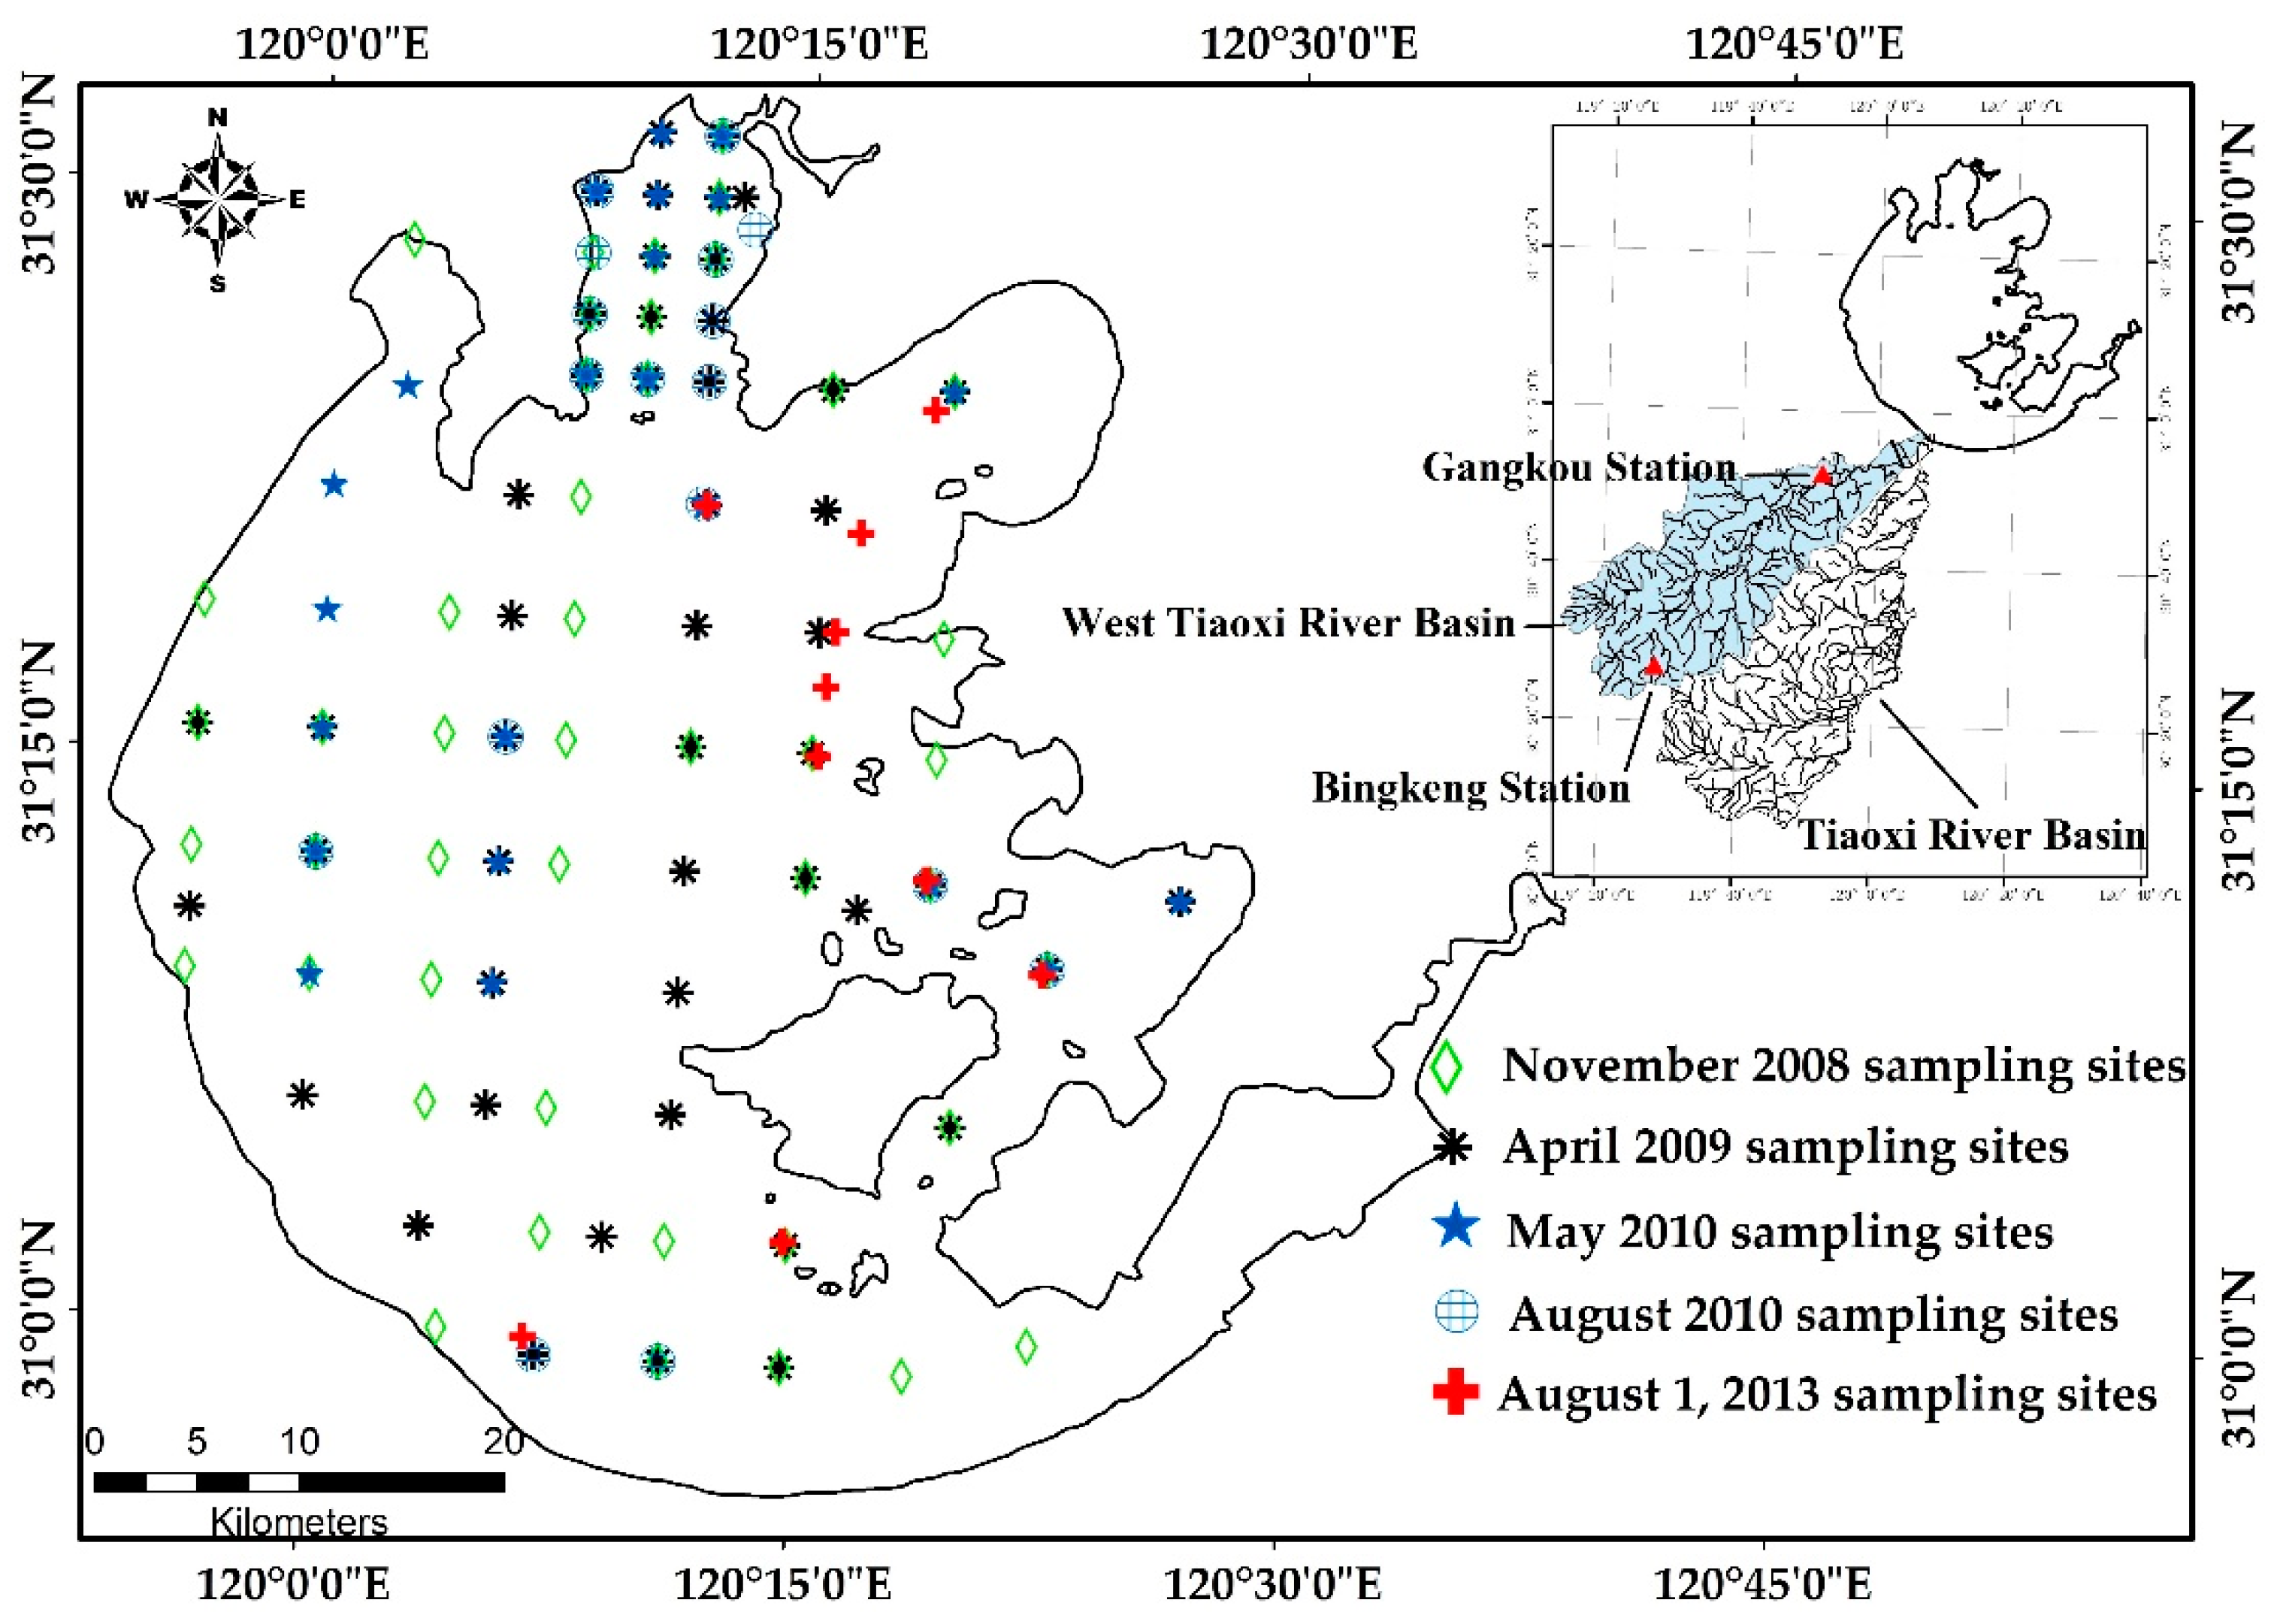
Lake Taihu and the Tiaoxi River Basin were used as the study areas in this research. GOCI data and in situ observation data were used to evaluate the total suspended material (TSM) concentration following heavy precipitation events in the Tiaoxi River Basin. Throughout this research, we study the relationship between lake water quality parameter and river plumes and provide a basis for further research on the changes in lake water quality caused by external inputs.

2. Materials and Methods

2.1. Study Area

Lake Taihu is a typical large eutrophic shallow lake in China (30°55′40″–31°33′58″N, 119°52′32″–120°36′10″E). It has a maximum depth of no more than 2.6 m and a mean depth of only 1.9 m, and the water retention time of the lake is approximately 284 d [25,32]. Tiaoxi River is the only north–south natural river in the Lake Taihu Basin without an independent outlet to the sea. It flows through seven counties of the cities of Hangzhou and Huzhou, including Lin’an, Yuhang, Deqing, Anji, Huzhou Linghu, Chengxing, and Changxing. There are two tributaries of the Tiaoxi River, the East Tiaoxi River and the West Tiaoxi River. The Tiaoxi River main stream length is 157.4 km, and the total area of the basin is 4576.4 km2 [33,34,35].

2.2. GOCI Image Acquisition and Preprocessing

The GOCI data used in this study were 17 GOCI L1B images that were taken from 1 September 2011 to 4 September 2011; 5 October 2013 to 14 October 2013; and on 1 August 2013 (Table 1). The data were acquired from the KOSC (Korea Ocean Satellite Center) website. The image preprocessing mainly included the radiometric calibration, geometric correction, atmospheric correction, and identification and elimination of algal bloom and aquatic plant areas.
The radiometric calibration was made in the GDPS (GOCI Data Processing System) software provided by KOSC, the geometric correction was implemented in the ENVI 5.3 (Environment for Visualizing Images) image analysis software with Landsat 8 OLI reference data, and the atmospheric correction was achieved through the 6S (Second Simulation of the Satellite Signal in the Solar Spectrum) model. The 6S model was mainly used to estimate the radiation in the solar spectrum of 0.25–4 μm obtained by remote sensing satellites in the absence of clouds [36,37].
Because there was an algal bloom in Lake Taihu during the study period, and most of the information obtained by the remote sensing sensor comes from the bloom when a large number of algae floats on the water surface, it was difficult to detect the parameter information from the water body. Therefore, it is necessary to eliminate the algal blooms during data preprocessing. This study refers to previous research experience and uses the method of setting a band ratio threshold to remove the blooms [21,29,38]. As the primary producer in lake ecosystems, aquatic plants have significant environmental and ecological functions. Their presence results in substantial improvements to the physical and chemical environment of a lake. Aquatic plants are widespread in eastern Lake Taihu and mixed pixels caused by aquatic plants will affect the accuracy of satellite retrieved water quality data. Therefore, the aquatic plant areas in eastern Lake Taihu were masked by the band ratio threshold method in ENVI 5.3. This area of the lake was excluded from the TSM retrieval [39,40].

2.3. Field Data Collection

The in situ dataset contained 132 water samples and 142 Rrs (remote sensing reflectance) data samples that were collected from five field sampling experiments. In this study, the models were constructed using the in situ measured data (48 points) collected in April 2009. The data collected in November 2008 (45 points), May 2010 (22 points), and August 2010 (17 points) were used to verify the accuracy of the models. In addition, the accuracy verification of atmospheric correction was used for the in situ measured spectral data from 1 August 2013 (10 points) as combined with the image data from 1 August 2013 (12:15). The spatial distribution of all sampling sites in Lake Taihu can be found in Figure 1.

2.3.1. Measurement of Water Quality Parameters

The water samples were filtered through Whatman GF/F fiberglass filters with a mean pore size of 0.7 μm. The 0.7 μm GF/F filters were precombusted at 550 °C for 4 h to remove organic traces that may impede the determination of TSM. Then, the filters were preweighed and stored in numbered Petri dishes. After filtration and rinsing, we stored the filters at 4 °C. The filters were dried at 105 °C for 4 h and reweighed. The TSM weight was obtained by subtracting the second weight measurement from the first measurement. The TSM concentration was then obtained by dividing the weight by the filtered volume [41].

2.3.2. Remote Sensing Reflectance Measurement

An Analytical Spectral Devices FieldSpec spectroradiometer was used to measure spectral reflectance. The sensor had a viewing field of 25° and a sensitivity range from 350 to 1050 nm in 1.58 nm increments with 512 wavelengths. The above-water method was used to measure the spectra from the water surface [42]. An optical fiber was positioned on a mount extending approximately 1 m from the boat and the spectra were sampled at an azimuth angle of 90–135° from the sun and a viewing angle of 30–45° to effectively minimize the influence of shadows from the boat and direct solar radiance. The radiance spectra of the reference panel, the water, and the sky were measured ten times for each site. The spectra at each sampling site were averaged to obtain Rrs. During the process of extracting Rrs, the skylight reflectance at the air–water surface was 2.2% for calm weather, 2.5% for wind speeds of up to 5 m/s, and 2.6%–2.8% for wind speeds of approximately 10 m/s, and the reflectance of the gray panel was accurately calibrated to 30% [43].

2.4. Hydrological and Meteorological Data

Hydrological and meteorological data mainly included precipitation, sediment discharge, wind speed, and wind direction data. The sediment discharge and precipitation data from 2006 to 2013 were acquired from the Annual Hydrological Report of the People’s Republic of China and corresponded to a total of 44 ground rainfall stations. We also collected the wind speed and direction data for the Lake Taihu area from 12–14 October 2013, as provided by the Lake Ecosystem Research Taihu Station of the Chinese Academy of Sciences.

2.5. Statistical Analysis and Accuracy Assessment

Statistical analyses of the mean, maximum, and minimum values and linear and nonlinear regressions were performed using the SPSS 17.0 software (Statistical Program for Social Sciences) [44]. Pearson correlation analysis was used to investigate the relationships between the variables. Significance levels were reported as significant (p < 0.05) or not significant (p > 0.05). We assessed the accuracy of the algorithms developed using relative error (RE), mean absolute percent error (MAPE), and the root-mean-square error (RMSE) between the measured and predicted values using the following equations.
RE = | Y meaured Y estimated | Y meaured * 100 %
MAPE = 1 N i = 1 N | Y meaured , i Y estimated , i | Y meaured , i * 100 %
RMSE = 1 N i = 1 N ( Y meaured , i Y estimated , i ) 2

3. Results

3.1. In Situ Measured TSM Distribution

The TSM concentration, determined from the field samples, showed high dynamic range and substantial variability (Table 2). The data measured in November 2008 ranged between 8.6 and 154.7 mg/L with a mean value of 34.7 mg/L (standard deviation = 23.3 mg/L). The mean TSM during the sampling period in April 2009 was 72.4 mg/L (SD = 58.3mg/L), with a maximum of 244.9 mg/L and a minimum of 11.4 mg/L. The data measured in May 2010 and August 2010 ranged from 14.3 to 76.8 mg/L and 14.1 to 76.8 mg/L, with a mean value of 32.9 mg/L and 62.2 mg/L, respectively. The mean TSM during the sampling period in August 1, 2009 was 41.3 mg/L (S.D. = 18.4mg/L), with a maximum of 72.0 mg/L and a minimum of 20.6 mg/L.

3.2. Analysis of Atmospheric Correction Results

In this study, GOCI data from 12:15 pm on 1 August 2013 were combined with the in situ measured spectral data, which were used to simulate the band settings of GOCI, to verify the effect of the atmospheric correction of the image. Table 3 shows the Pearson correlation coefficients and RE for each band of the atmospheric correction results. Because the bands used in the model were B7 to B8, their correlation coefficients and RE were 0.6623, 0.8716, and RE were 0.2577, 0.4039. Figure 2 shows the comparison of the atmospheric correction results, and we found that the correlation coefficient between the corrected results and the in situ measured data was 0.9630, with a mean RE of 0.2576. Therefore, the accuracy of the atmospheric correction was acceptable.

3.3. Algorithm Development and Validation of GOCI Data

Based on the spectral characteristics of TSM and the band settings of GOCI, an empirical model for the TSM retrieval for Lake Taihu was constructed.

3.3.1. Development and Validation of the TSM Model

To determine the best band or band combination for the study, a correlation analysis between TSM concentration and simulated GOCI Rrs was carried out. The noticeably high correlation between the in-situ measurements of TSM and the Rrs (B5) to Rrs (B8) derived from the GOCI sensor had values as 0.7112, 0.7371, 0.8980 and 0.8980. These results were comparable to many previous studies in which red and near-infrared bands were used for the TSM retrieval [18,45,46]. The MAPE and RMSE were used to evaluate the derived model.
The linear, quadratic, and other models of TSM against a single band or their combinations were calibrated with the least-squares technique. The quadratic function of Rrs(B7 + B8) resulted in the best precision with the highest determination coefficient (R2 = 0.8274; p < 0.001) and the lowest MAPE (26.99%) and RMSE (9.71 mg/L) (Figure 3a). The GOCI-based model derived Rrs(B7 + B8) data were defined by Equation (4):
TSM = 32517 * ( R rs ( B 7 + B 8 ) ) 2 + 1327.2 * ( R rs ( B 7 + B 8 ) ) + 0.5
Because the TSM empirical model of this study was based on the measured data of Lake Taihu, therefore it was currently only available in monitoring the concentration of TSM in this lake. The applicability to other inland turbid water may need to be validated further.

3.3.2. Validation of the GOCI-Based TSM Model

The proposed model performed well on the validation dataset (Figure 3b). The RE of the proposed model for the validation dataset varied from 1.21% to 48.30%, with a MAPE value of 23.78% (RMSE = 9.41 mg/L). The validation samples with RE values above 48.3% used in the proposed model were less than 9.52% of the total number of samples. Comparisons between the in situ measured TSM and the TSM estimated using simulated GOCI data showed that these values were in good agreement, with a highly significant linear relationship (R2 = 0.8001, p < 0.001). The in situ measured and estimated TSM values were evenly distributed along the 1:1 line (Figure 3b).
Furthermore, one GOCI image collected on 1 August 2013 at 12:15 pm (Table 1) was used to validate the GOCI-based model, and there was a total of 10 points in the GOCI-based validation image that were measured on that day near 12:00 pm. Figure 3c shows that there was a significant correlation between the measured TSM data and the GOCI-based TSM values, at a significance level of p < 0.001, and shows the agreement between the measured TSM and the GOCI-based TSM, where the uncertainties in the model include a MAPE of 26.99%, and a RMSE of 9.71 mg/L of their relative difference. The in situ and estimated TSM values were evenly distributed along the 1:1 line (Figure 3c).
These results indicated that the proposed model based on the GOCI derived Rrs(B7+B8) data could be used to accurately retrieve the TSM for the validation dataset in Lake Taihu.

3.4. Spatial Distribution of TSM

The proposed model (Equation (4)) was used to retrieve TSM from the GOCI images for the two extreme weather events of heavy precipitation that occurred in the Tiaoxi River Basin in August 2011 and October 2013. The GOCI-derived TSM results for Lake Taihu are presented in Figures 4 and 6. Figures 4 and 6 show the distribution of the TSM in Lake Taihu in early September 2011 and mid-October 2013, respectively. Figures 5 and 7 are histograms of the different TSM concentrations that account for the percentage of the total lake area.

3.4.1. Spatial Pattern Distribution of TSM after Heavy Precipitation in August 2011

The TSM concentration in Lake Taihu in early September 2011 was high overall. The highest cumulative concentration of TSM was found at 13:15 pm on 4 September 2011 (Figure 4h) with a mean concentration of 109.27 mg/L. The lowest cumulative concentration was found at 9:15 am on 4 September 2011 (Figure 4g) with a mean concentration of 66.15 mg/L. The mean TSM concentration for the entire monitoring period was 92.65 mg/L. The TSM concentrations were high in the southwestern part of Lake Taihu and the Tiaoxi River estuary area, and the distribution trend showed high TSM values in the south and west and low values in the north and east.
The histogram in Figure 5 and Table 4 show that the high TSM concentration of 100–150 mg/L accounted for 25.98% of the total lake area at 13:15 pm on 4 September 2011. From 9:15 am to 11:15 am on 4 September 2011, the area where the TSM concentration was 100–150 mg/L increased from 11.30% to 16.59% of the total lake area.

3.4.2. Spatial Distribution Patterns of TSM after Heavy Precipitation in October 2013

In early October 2013, the waters in Lake Taihu were characterized by high TSM after heavy precipitation. The result with the highest mean concentration of TSM for the entire lake was found at 12:15 pm on 13 October 2013 (Figure 6e) with 100.13 mg/L. Conversely, the lowest mean concentration was 60.08 mg/L, which was found at 9:15 am on 5 October 2013 (Figure 6a), before precipitation occurred in this basin. The mean TSM concentration during the monitoring period was 73.79 mg/L. The analysis of the continuous monitoring results indicated the TSM concentration in Lake Taihu tended to first increase and then decrease over time. Figure 7 shows that after precipitation, a large mass of turbid water could be observed in the Tiaoxi River estuary area southwest of Lake Taihu. The turbid water mass moved with the currents in Lake Taihu, and the distribution of TSM in the lake also showed a similar trend to that in September 2011 (Figure 6).
Figure 7 and Table 4 shows that the highest mean concentration of TSM was in 13 October 2013 at 12:15 pm, with TSM concentrations of 50–100 mg/L, 100–150 mg/L, and 150–200 mg/L accounting for 34.01%, 20.29%, and 3.97% of the total lake area, respectively.

4. Discussion

4.1. The Use of High Temporal Resolution Satellites to Monitor the Diffusion of Matter in Inland Waters

Inland water bodies, such as lakes, are constantly in motion and through these movements, various dissolved solids and materials also migrate and spread. Prior to the launch of COMS, MODIS data, with a temporal resolution of 1 day, were used to monitor large inland waters [47]. Although the temporal resolution of MODIS data was higher than that of Landsat 8 (16-day revisit time), MERIS (3-day revisit time), and GF1 (2-day revisit time) data, the monitoring of water quality parameters was still lacking [48,49,50]. GOCI data now make such monitoring possible.
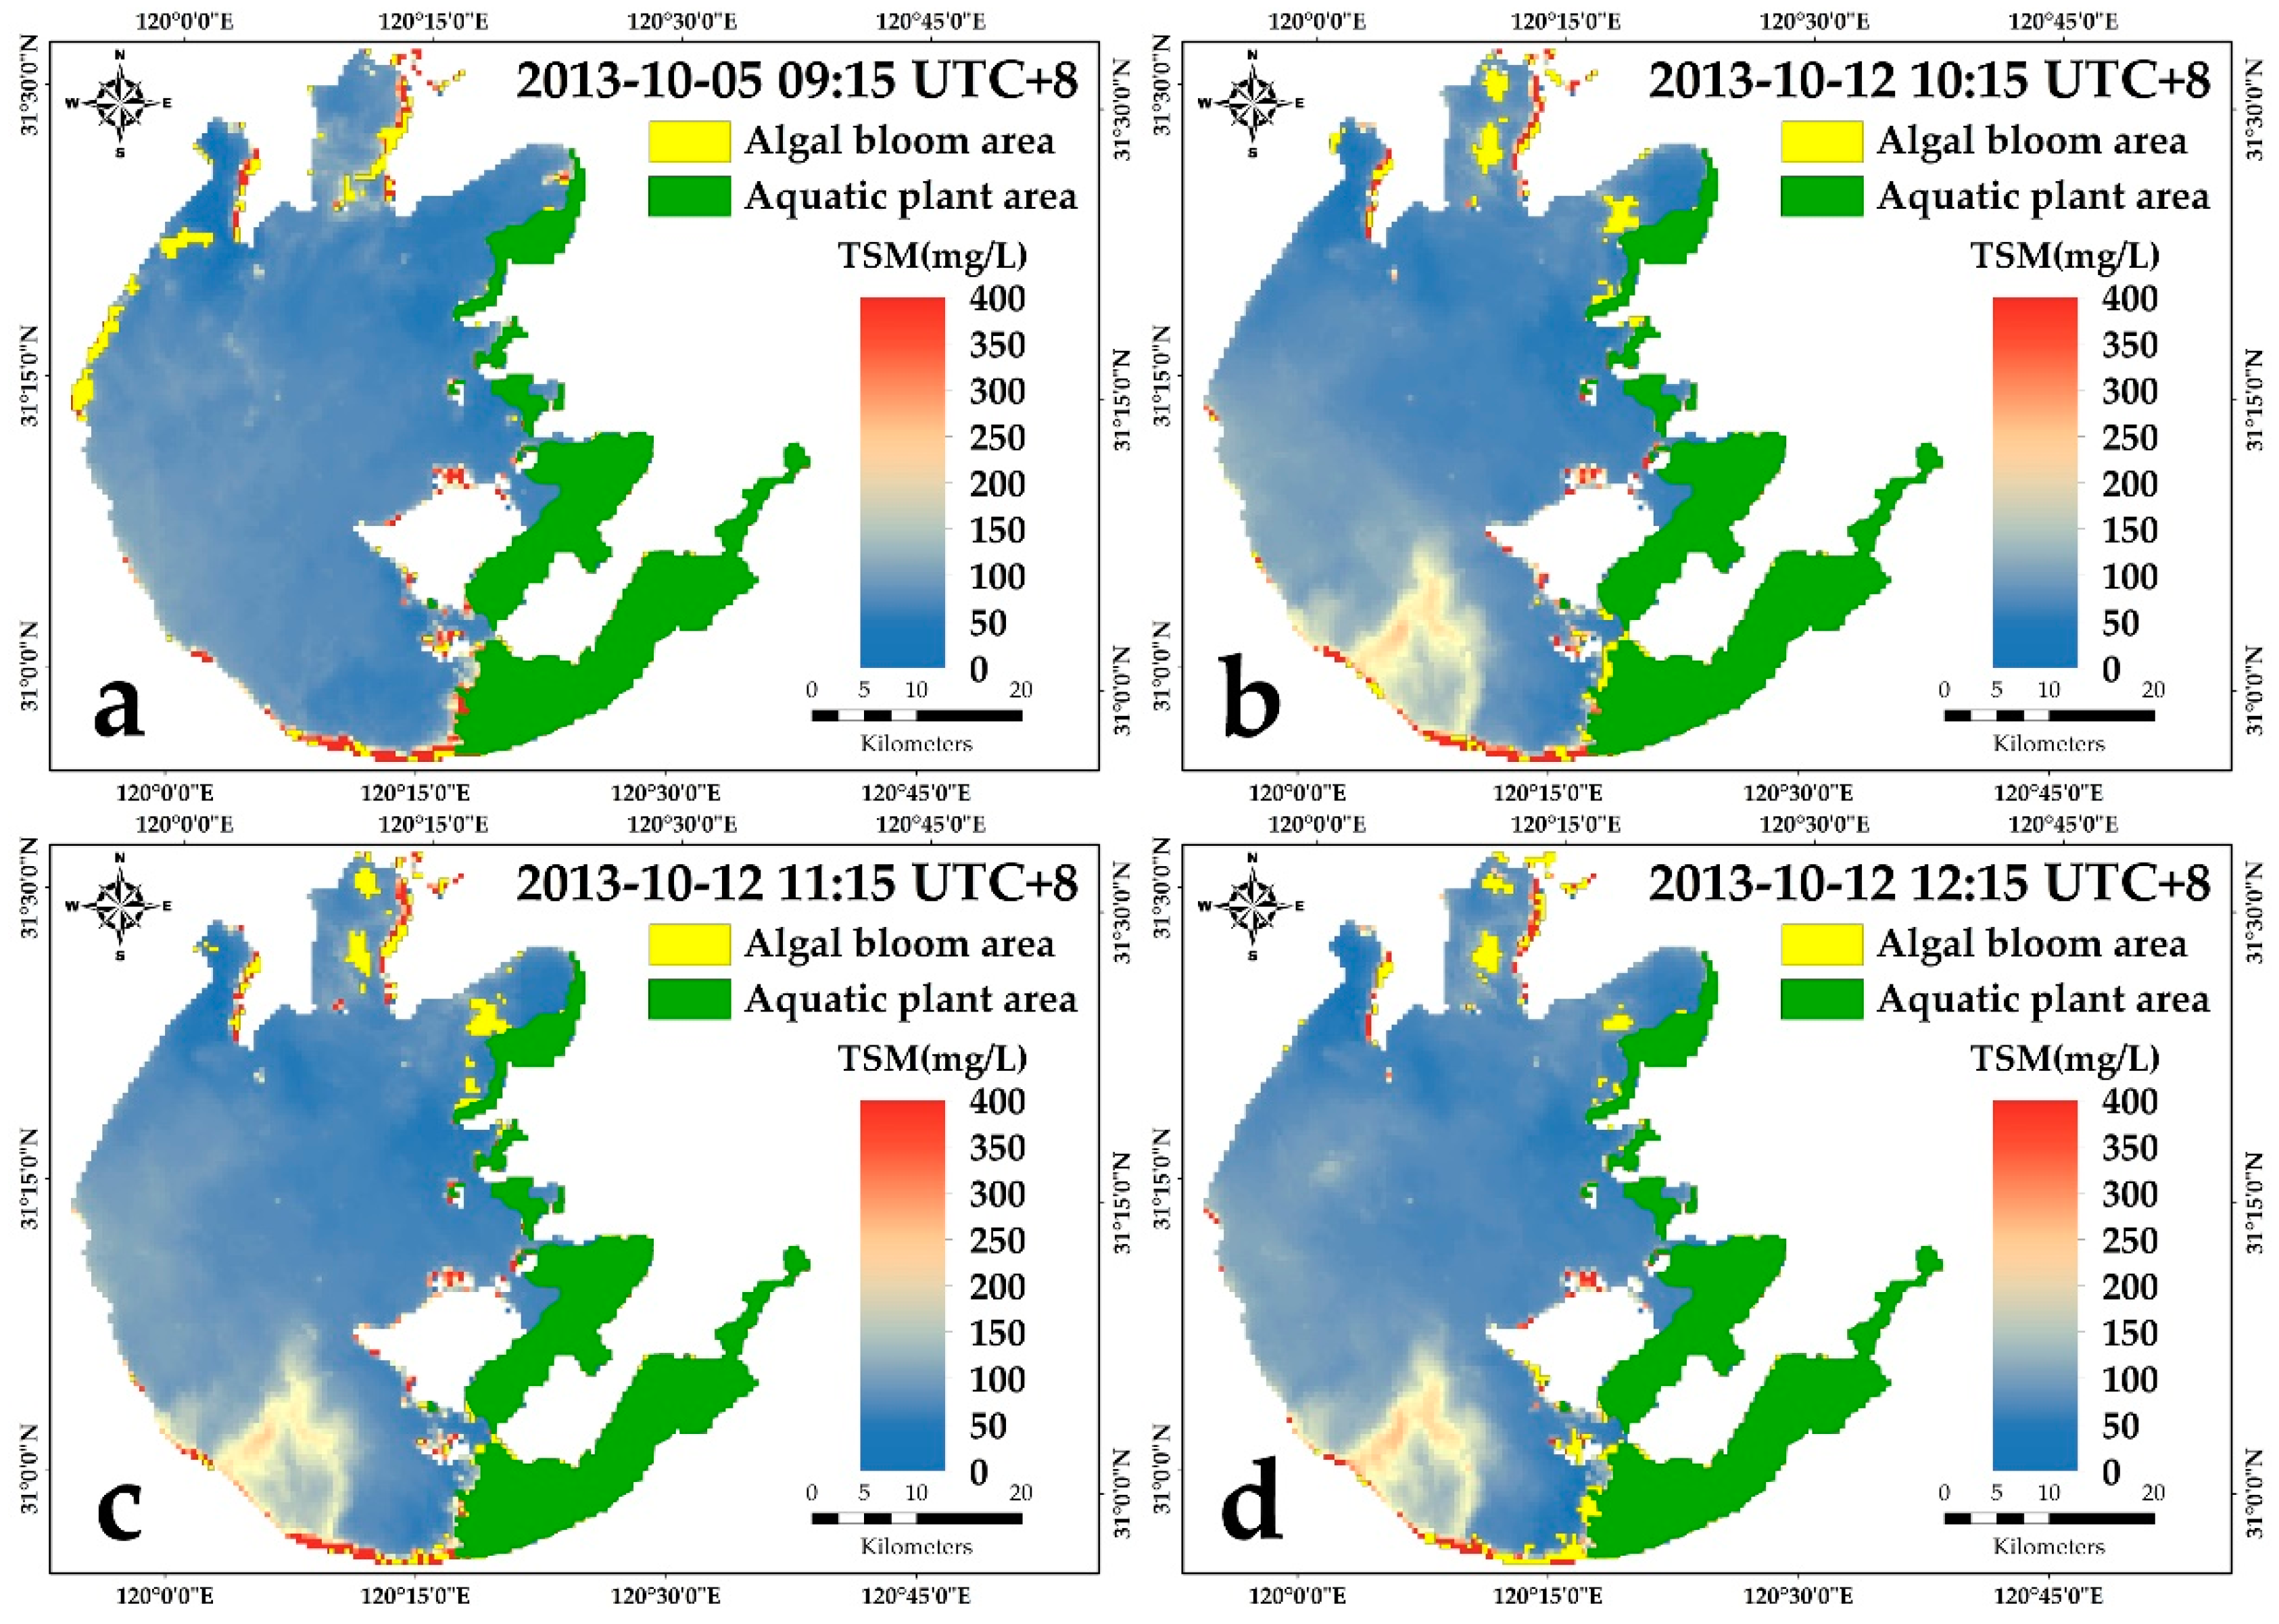
The 2013 monitoring data (including two consecutive observations from 10:15 am to 12:15 pm on 12 October and from 10:15 am to 12:15 pm on 14 October (Figure 6) show that heavy precipitation in the Tiaoxi River Basin transported large amounts of suspended matter into Lake Taihu that diffused significantly with the lake flow. As seen from the October 5 image (
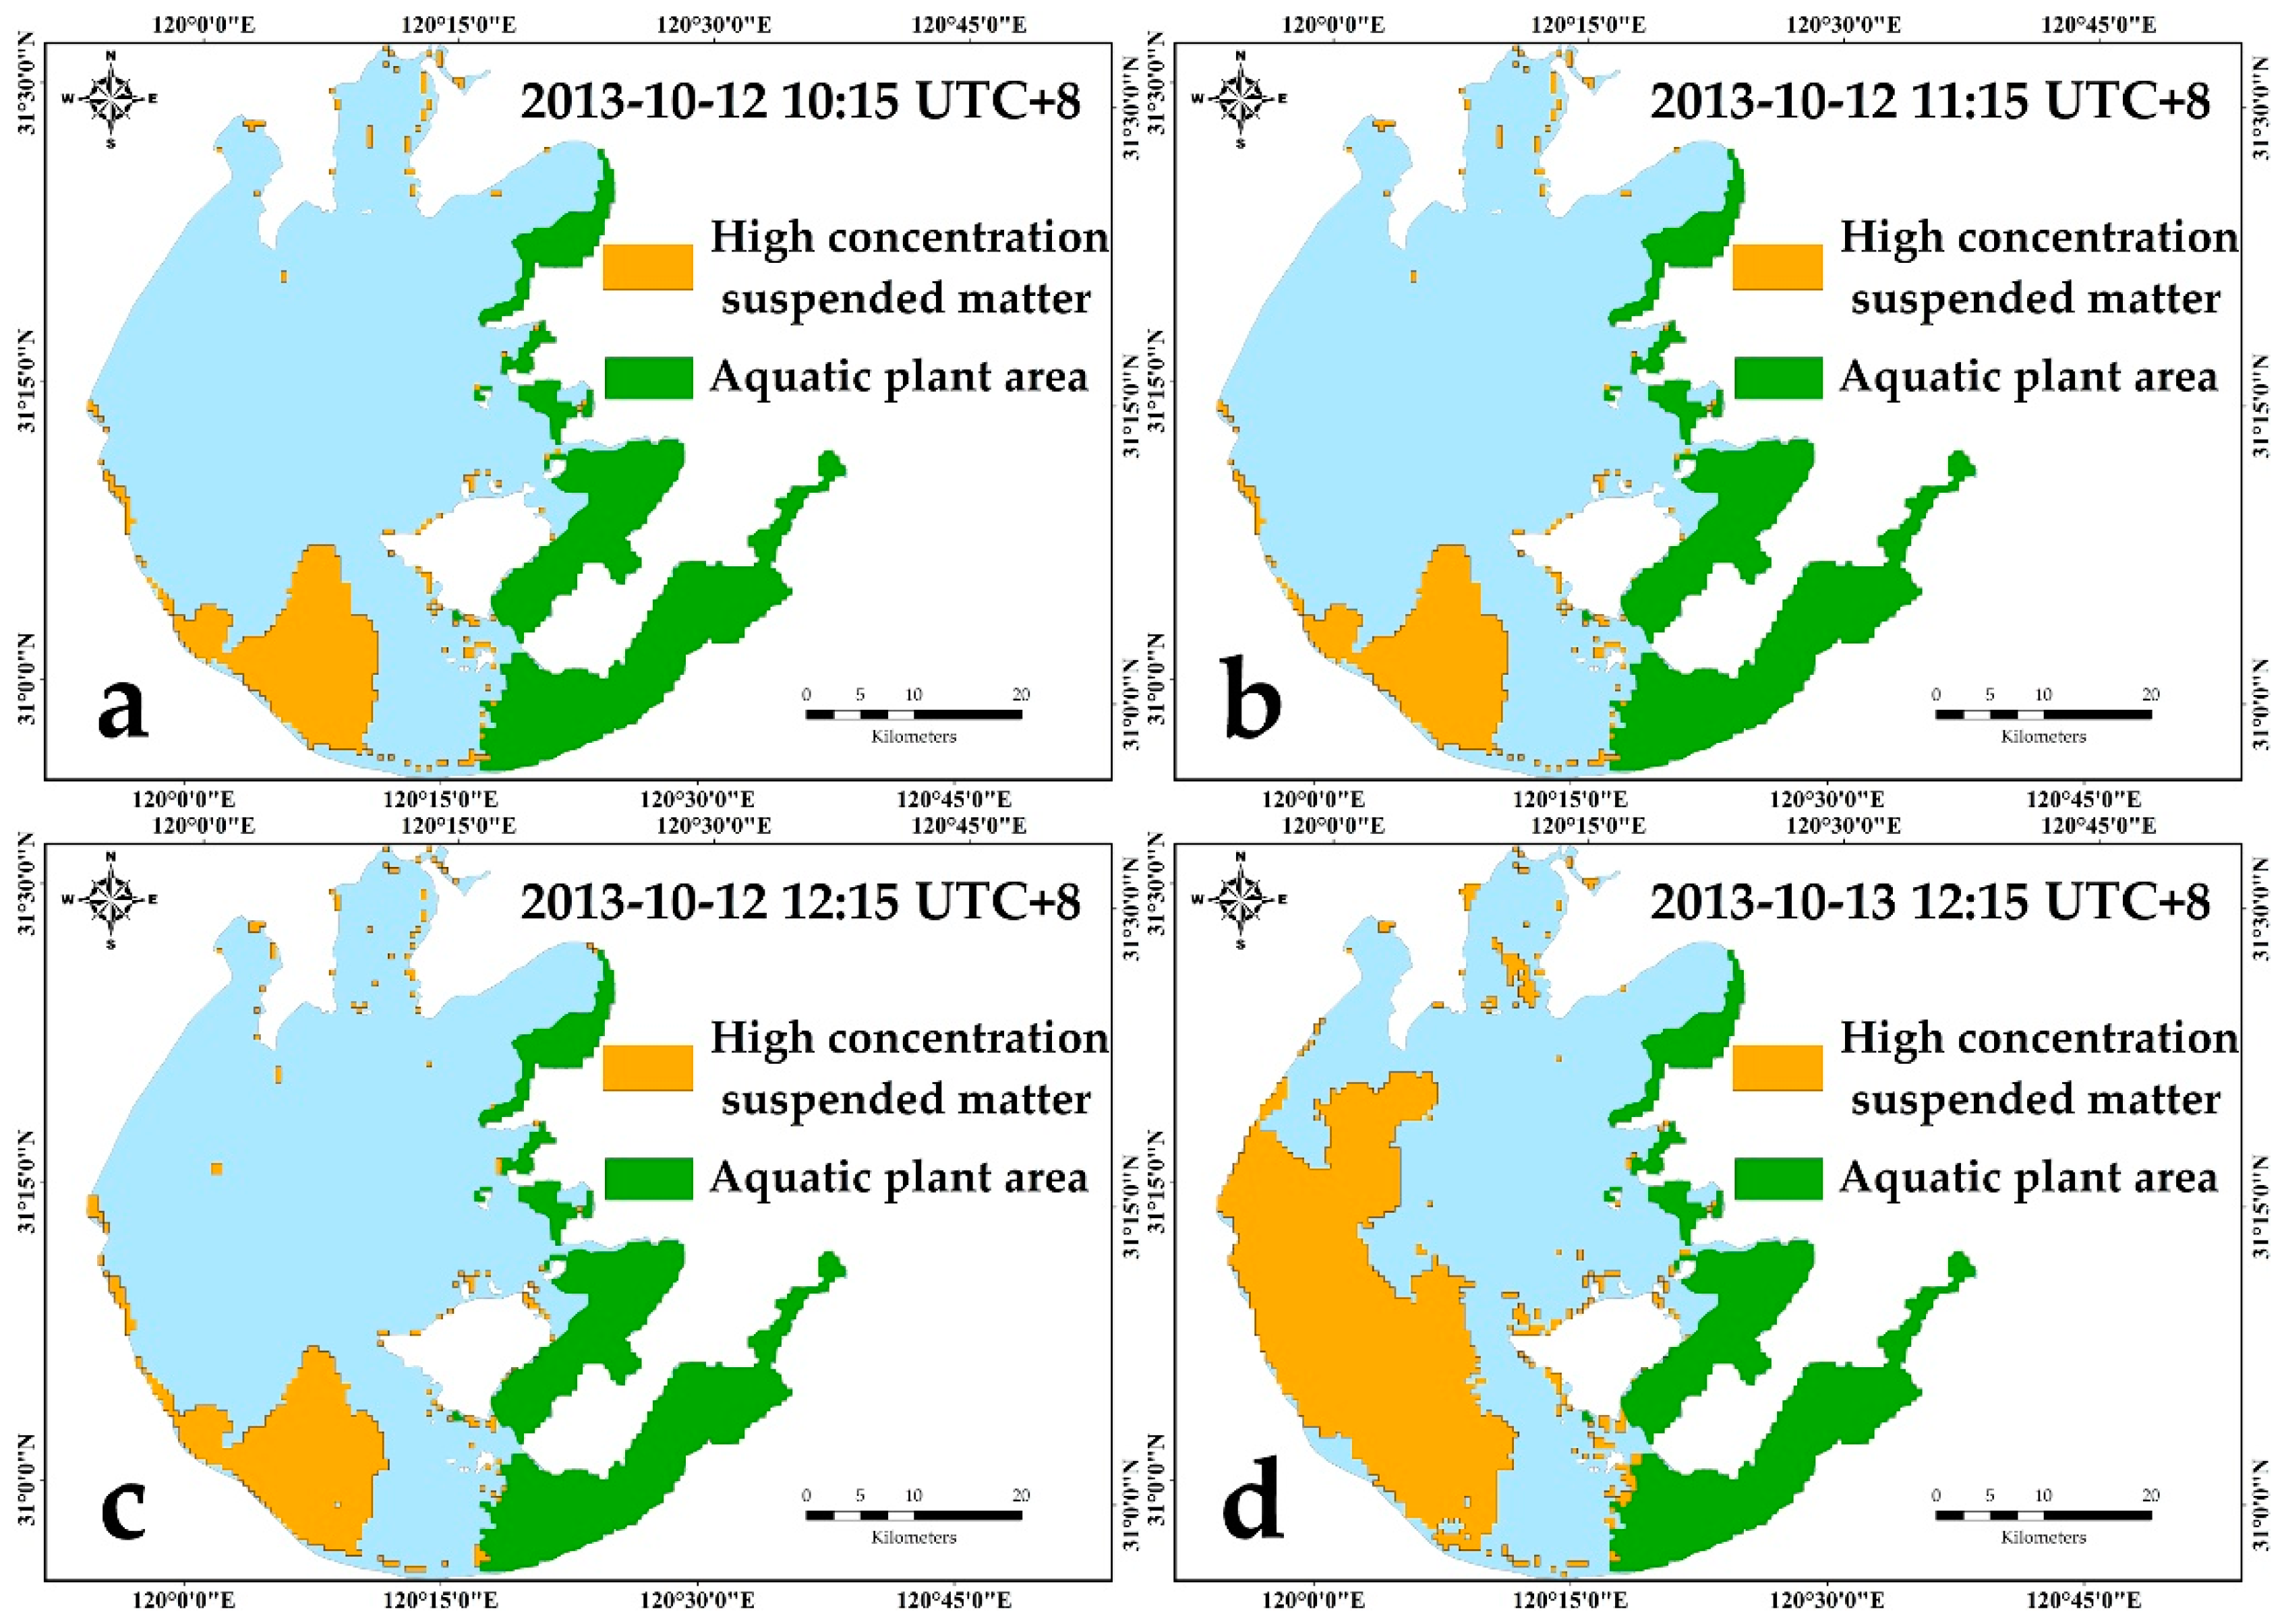
Figure 6a), the suspended matter concentration in the waters of Lake Taihu was still relatively low before the occurrence of precipitation. After the heavy precipitation event in the Tiaoxi River Basin on 12 October, there was a clear plume that carried high concentrations of suspended matter at the mouth of the river. Over time, the plume spread and migrated further. As a result, the concentration of suspended matter in Lake Taihu also changed; the suspended matter concentration in the water body decreased from the original high concentration as suspended plumes were transported to the northeast and the area of water affected by heavy precipitation continued to increase. From 12–13 October 2013, the distributions of suspended matter in Lake Taihu with concentrations above 100 mg/L are shown in Figure 8. The areas where these concentrations were found encompassed 218 km2, 221 km2, 234 km2, and 678.5 km2. By 12:15 pm on 14 October, the entire area of Lake Taihu was affected by this heavy precipitation event (Figure 6h).

4.2. Analysis of the Factors Influencing Plume Diffusion

According to previous research [51,52,53], under normal circumstances, the suspended matter concentration in Lake Taihu is mainly affected by the resuspension of sediments. However, 60% of the flow into Lake Taihu comes from the Tiaoxi River [54], so when heavy rainfall occurs in the basin, a large amount of suspended matter that is carried by the river will be transported into the lake in a short period of time and thus increase the TSM concentration. The scope of influence by the river flow pattern is not limited to the southern part of Lake Taihu at the estuary of the Tiaoxi River; it will also follow the flow to the northwest region, and then affect most areas of Lake Taihu, with the exception of only the southern part of the lake.
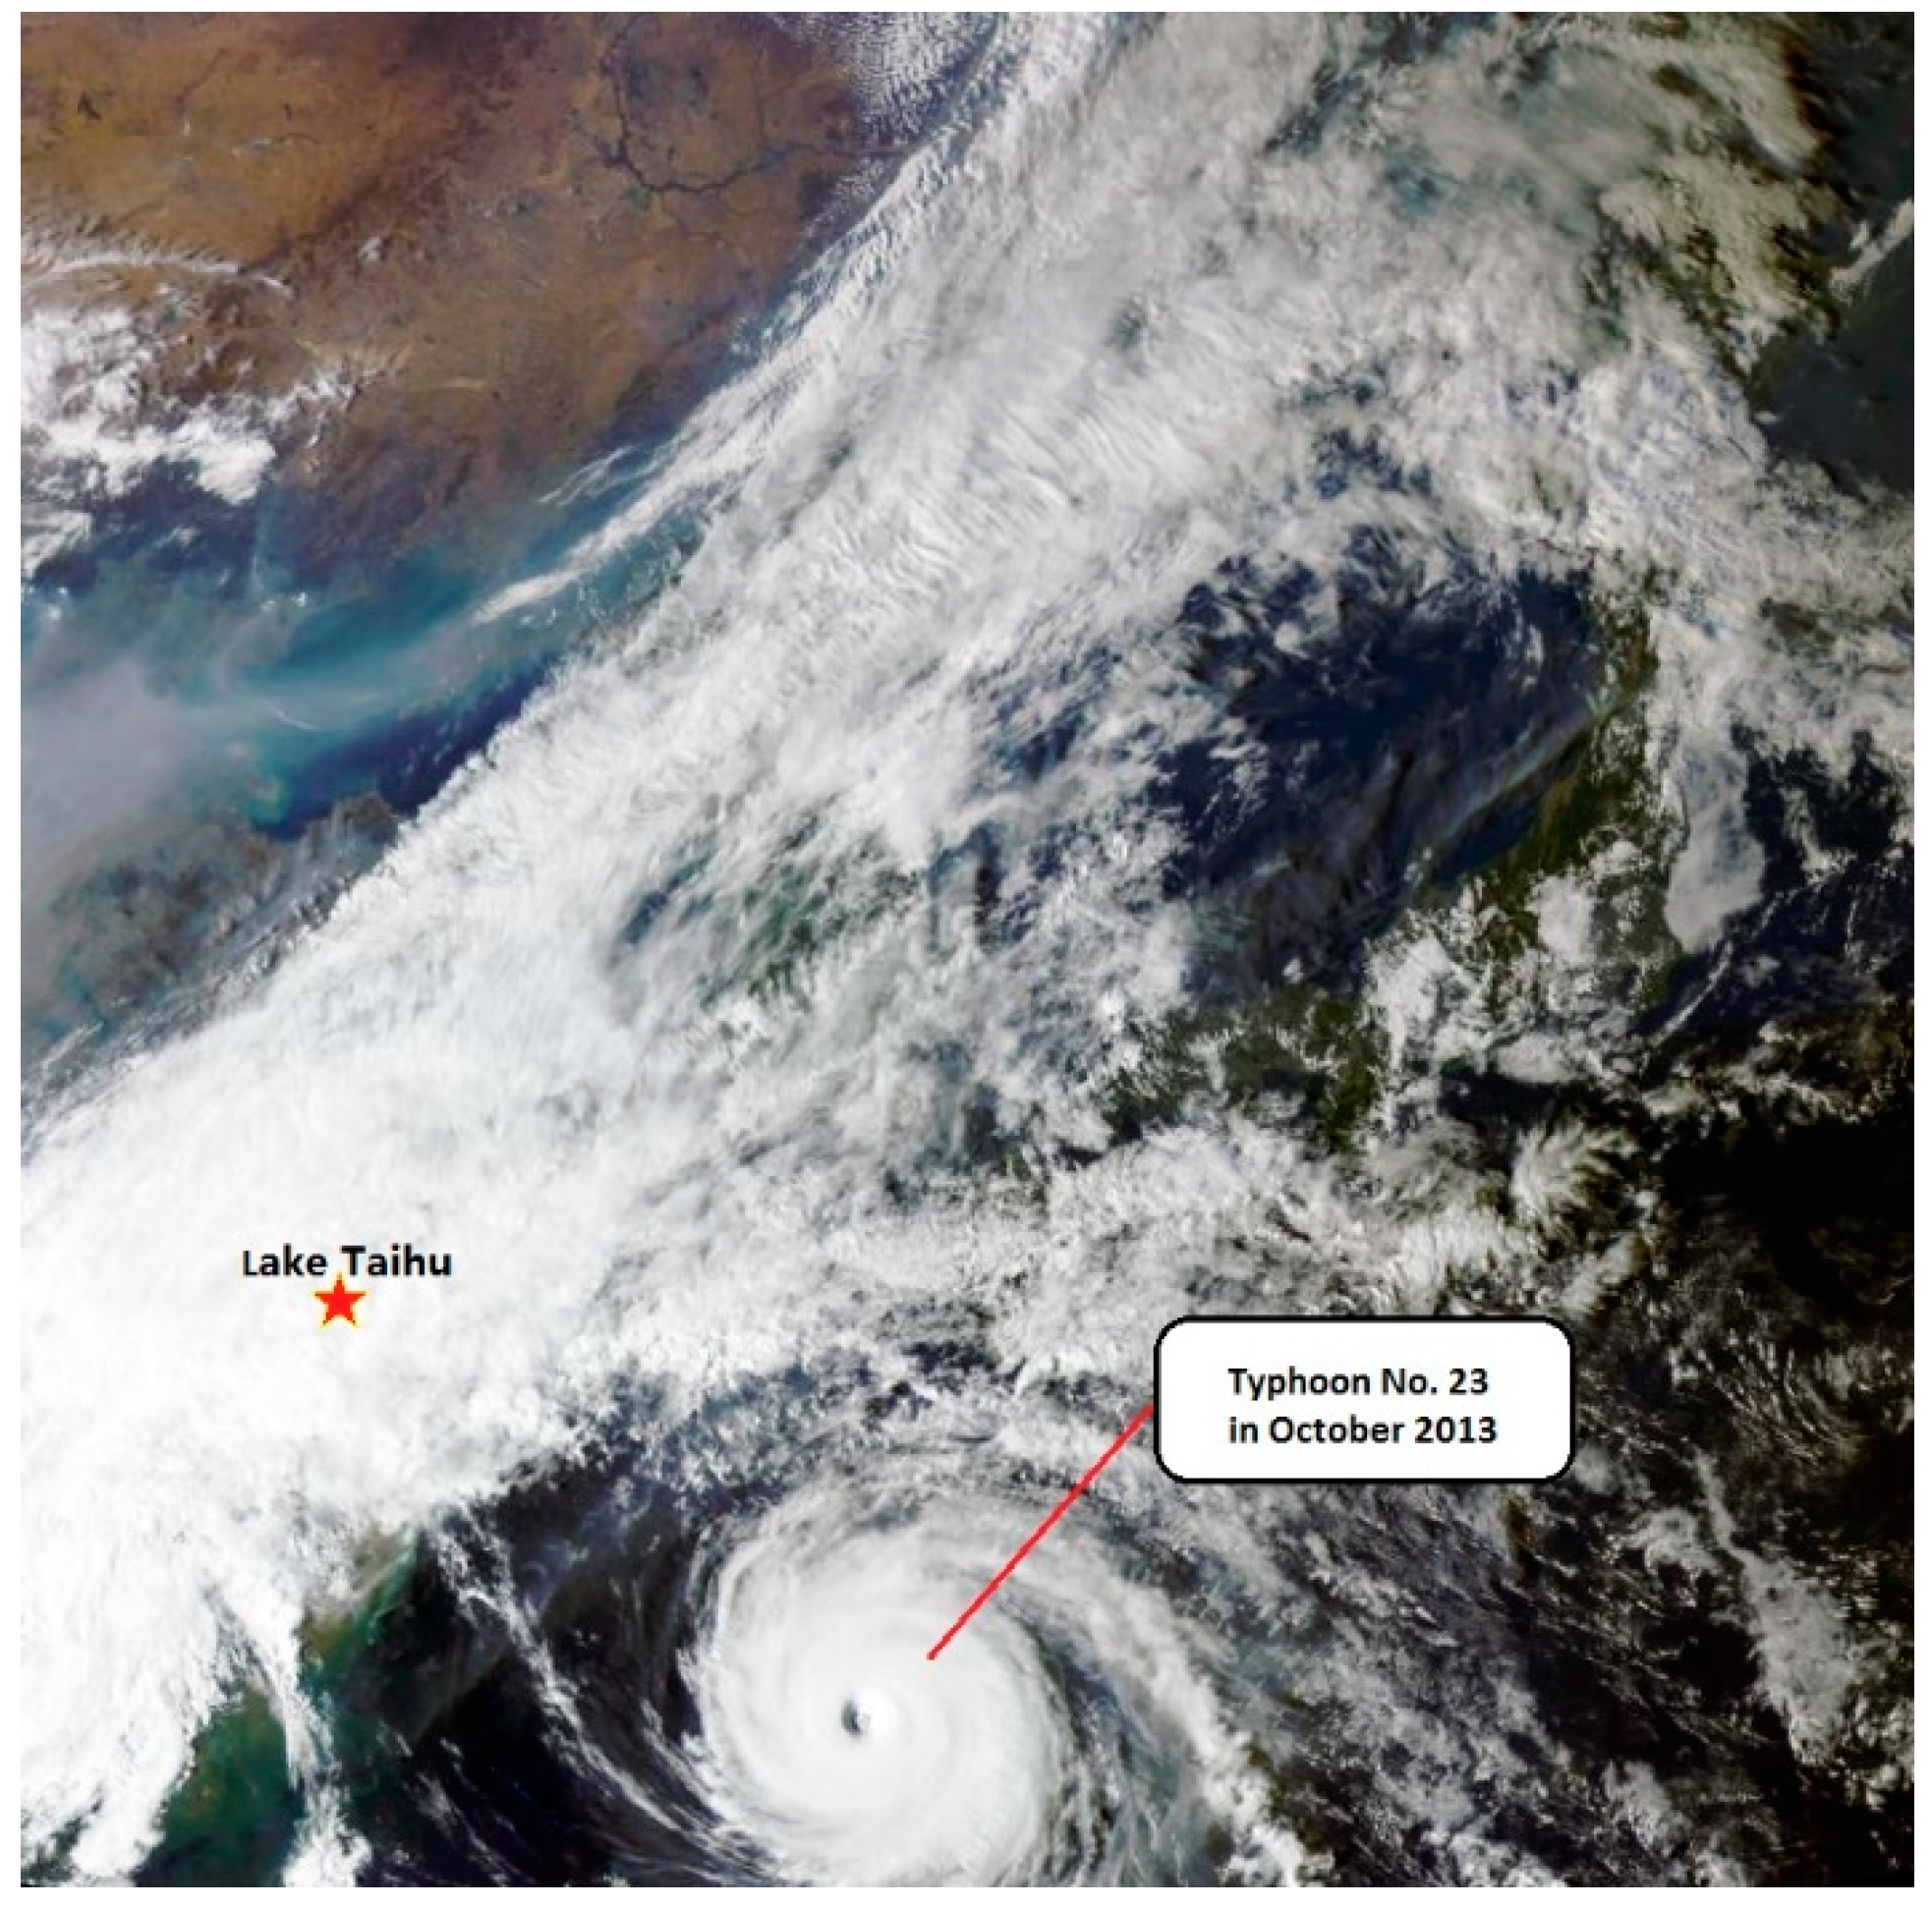
We use heavy precipitation in early October 2013 as an example. From 6–7 October, due to the peripheral cloud systems of Typhoon No. 23 (Figure 9), the maximum daily precipitation in the Tiaoxi River Basin was 319.0 mm (Bingkeng Station on 7 October). According to the annual hydrological report, the rainfall stations within the basin were monitored, and the mean daily precipitation values were calculated by the Tyson polygon method. The values from 5–8 October were 4.5 mm, 116.2 mm, 164 mm, and 9.6 mm. According to national grade of precipitation, this precipitation level was heavy rainstorm.
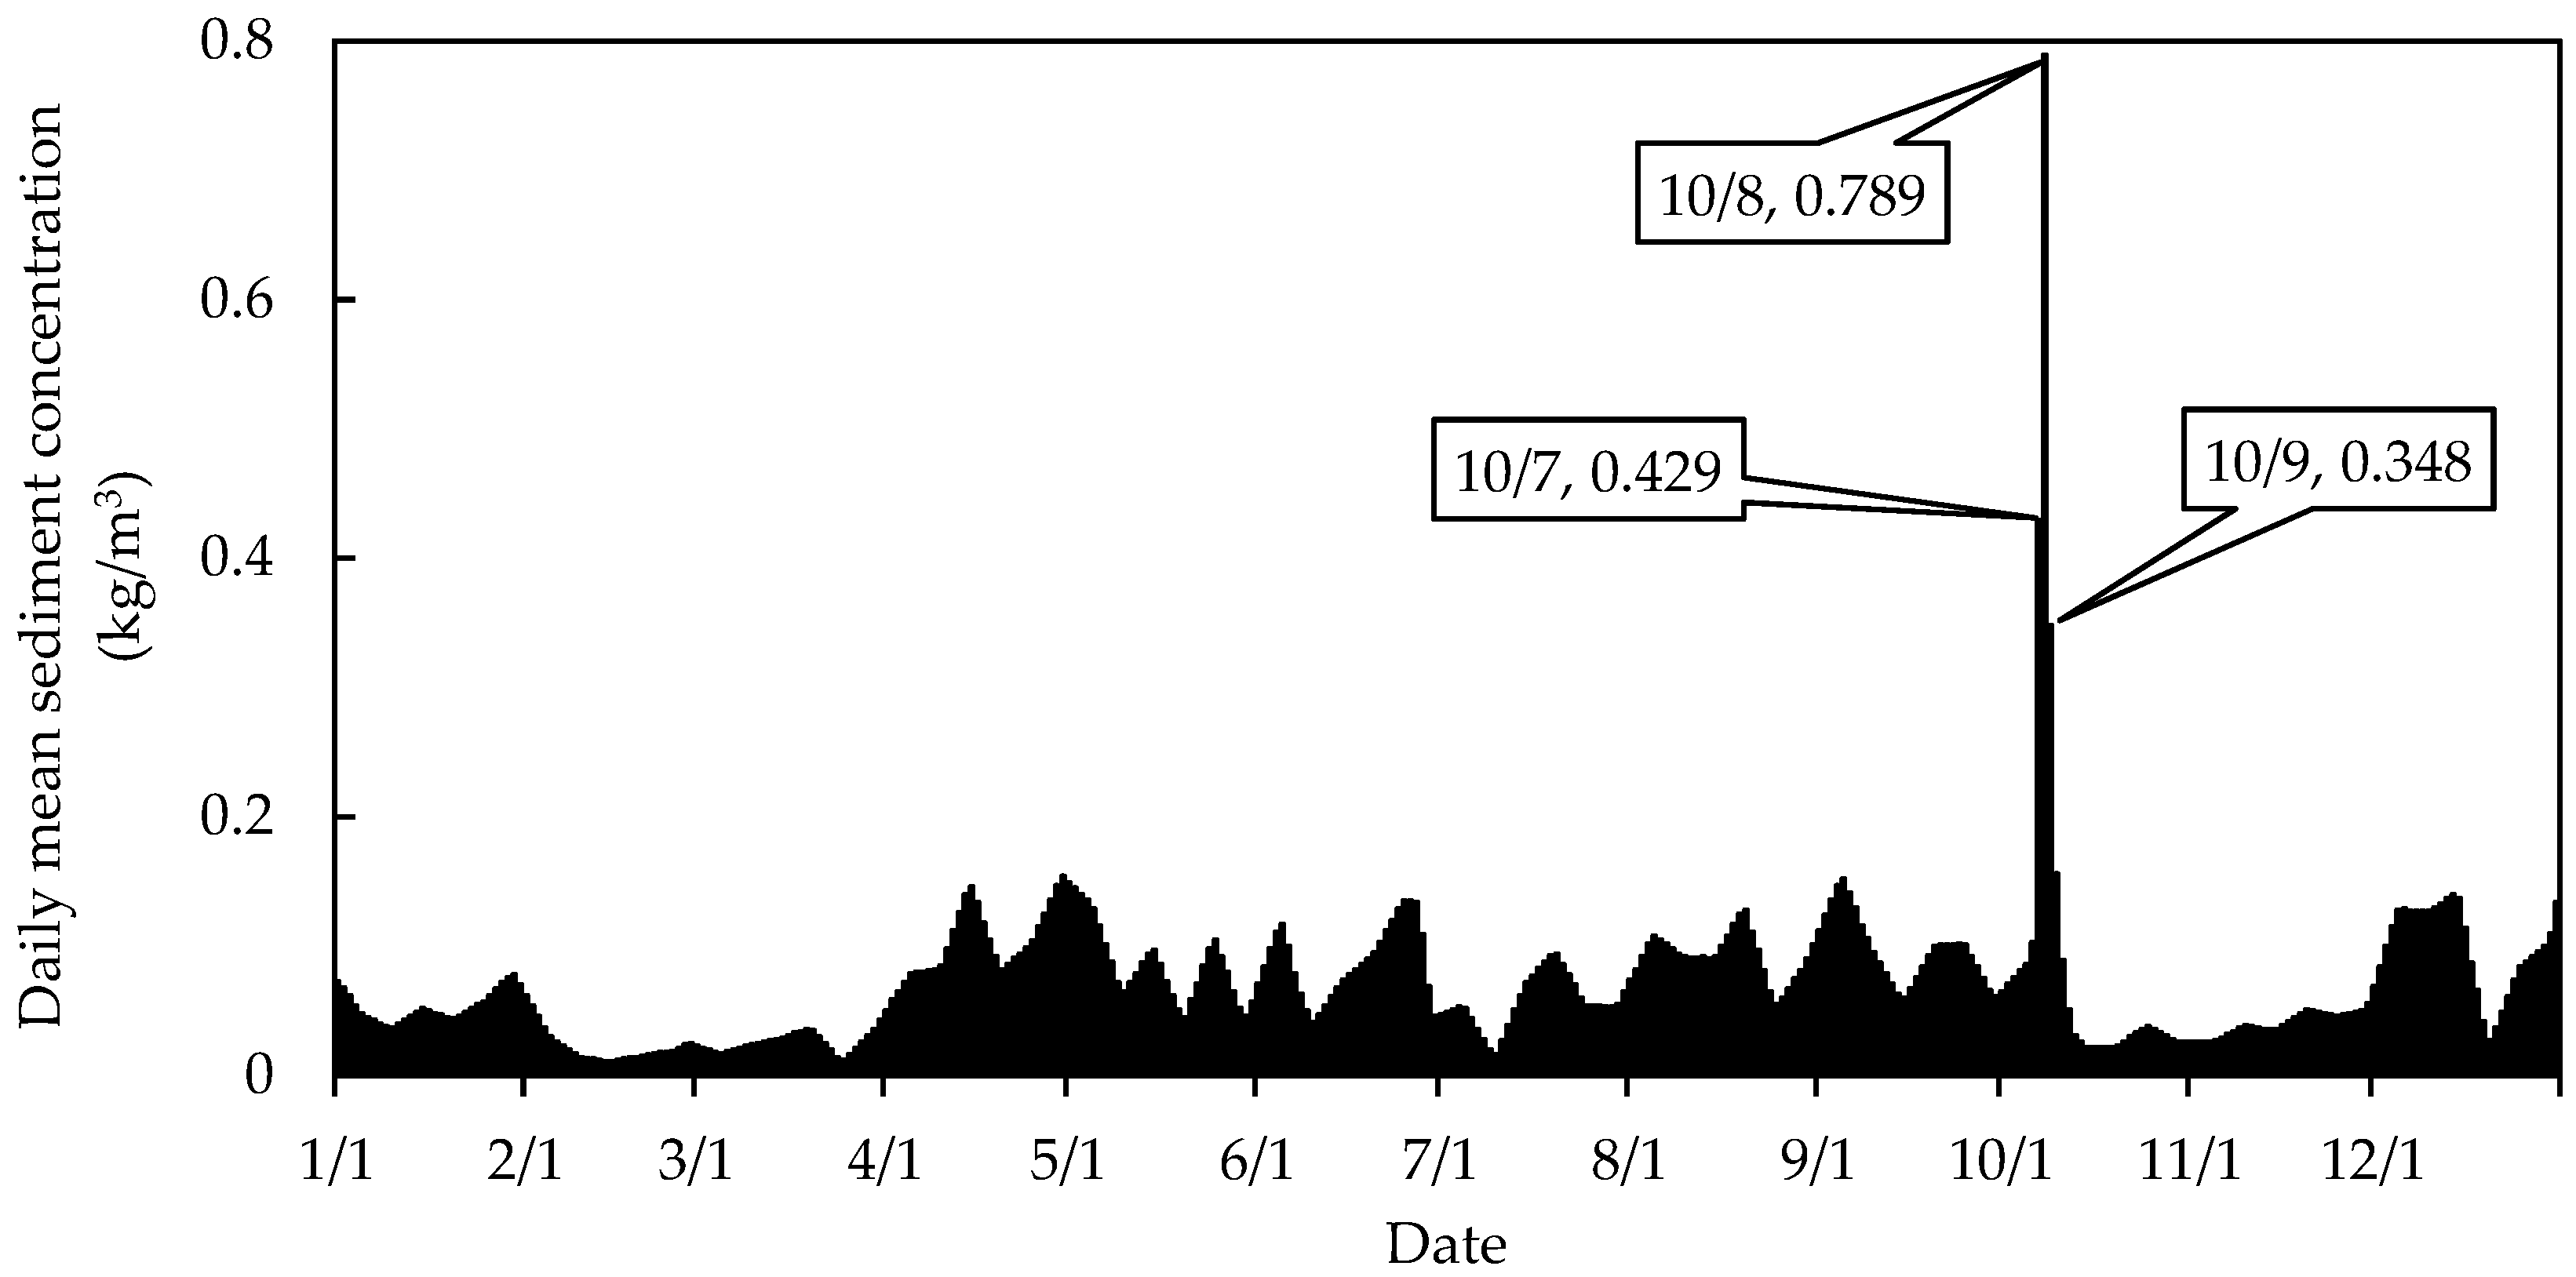
As the only station to monitor sediment discharge in the Tiaoxi River Basin in the annual hydrological report, we used the measured values provided by the Gangkou Station to evaluate the amount of suspended sediments carried by the river. According to the analysis of data from the annual hydrological report, the annual maximum daily mean sediment concentration (0.789 kg/m3) and the maximum daily mean sediment transport rate (649 kg/s) at the Gangkou Station occurred on 8 October, which was one day after the occurrence of heavy precipitation. On 7 and 9 October, the mean daily sediment contents were also much higher than the mean value measured at the monitoring station, which were observed at 0.429 kg/m3 and 0.348 kg/m3, respectively (Figure 10). According to the river flow and the suspended sediment content monitored by the Gangkou Station (Table 5), in events of heavy precipitation in the Tiaoxi River Basin, the amounts of water and suspended sediments in the river drastically increased. The correlation coefficient between daily mean flows and daily mean sediment transport rate and daily mean sediment concentration were 0.781 (p < 0.05) and 0.715 (p < 0.05), respectively. As a result, the amounts of water and suspended matter that were transported into Lake Taihu also greatly increased, which thus affected the water quality of the lake.
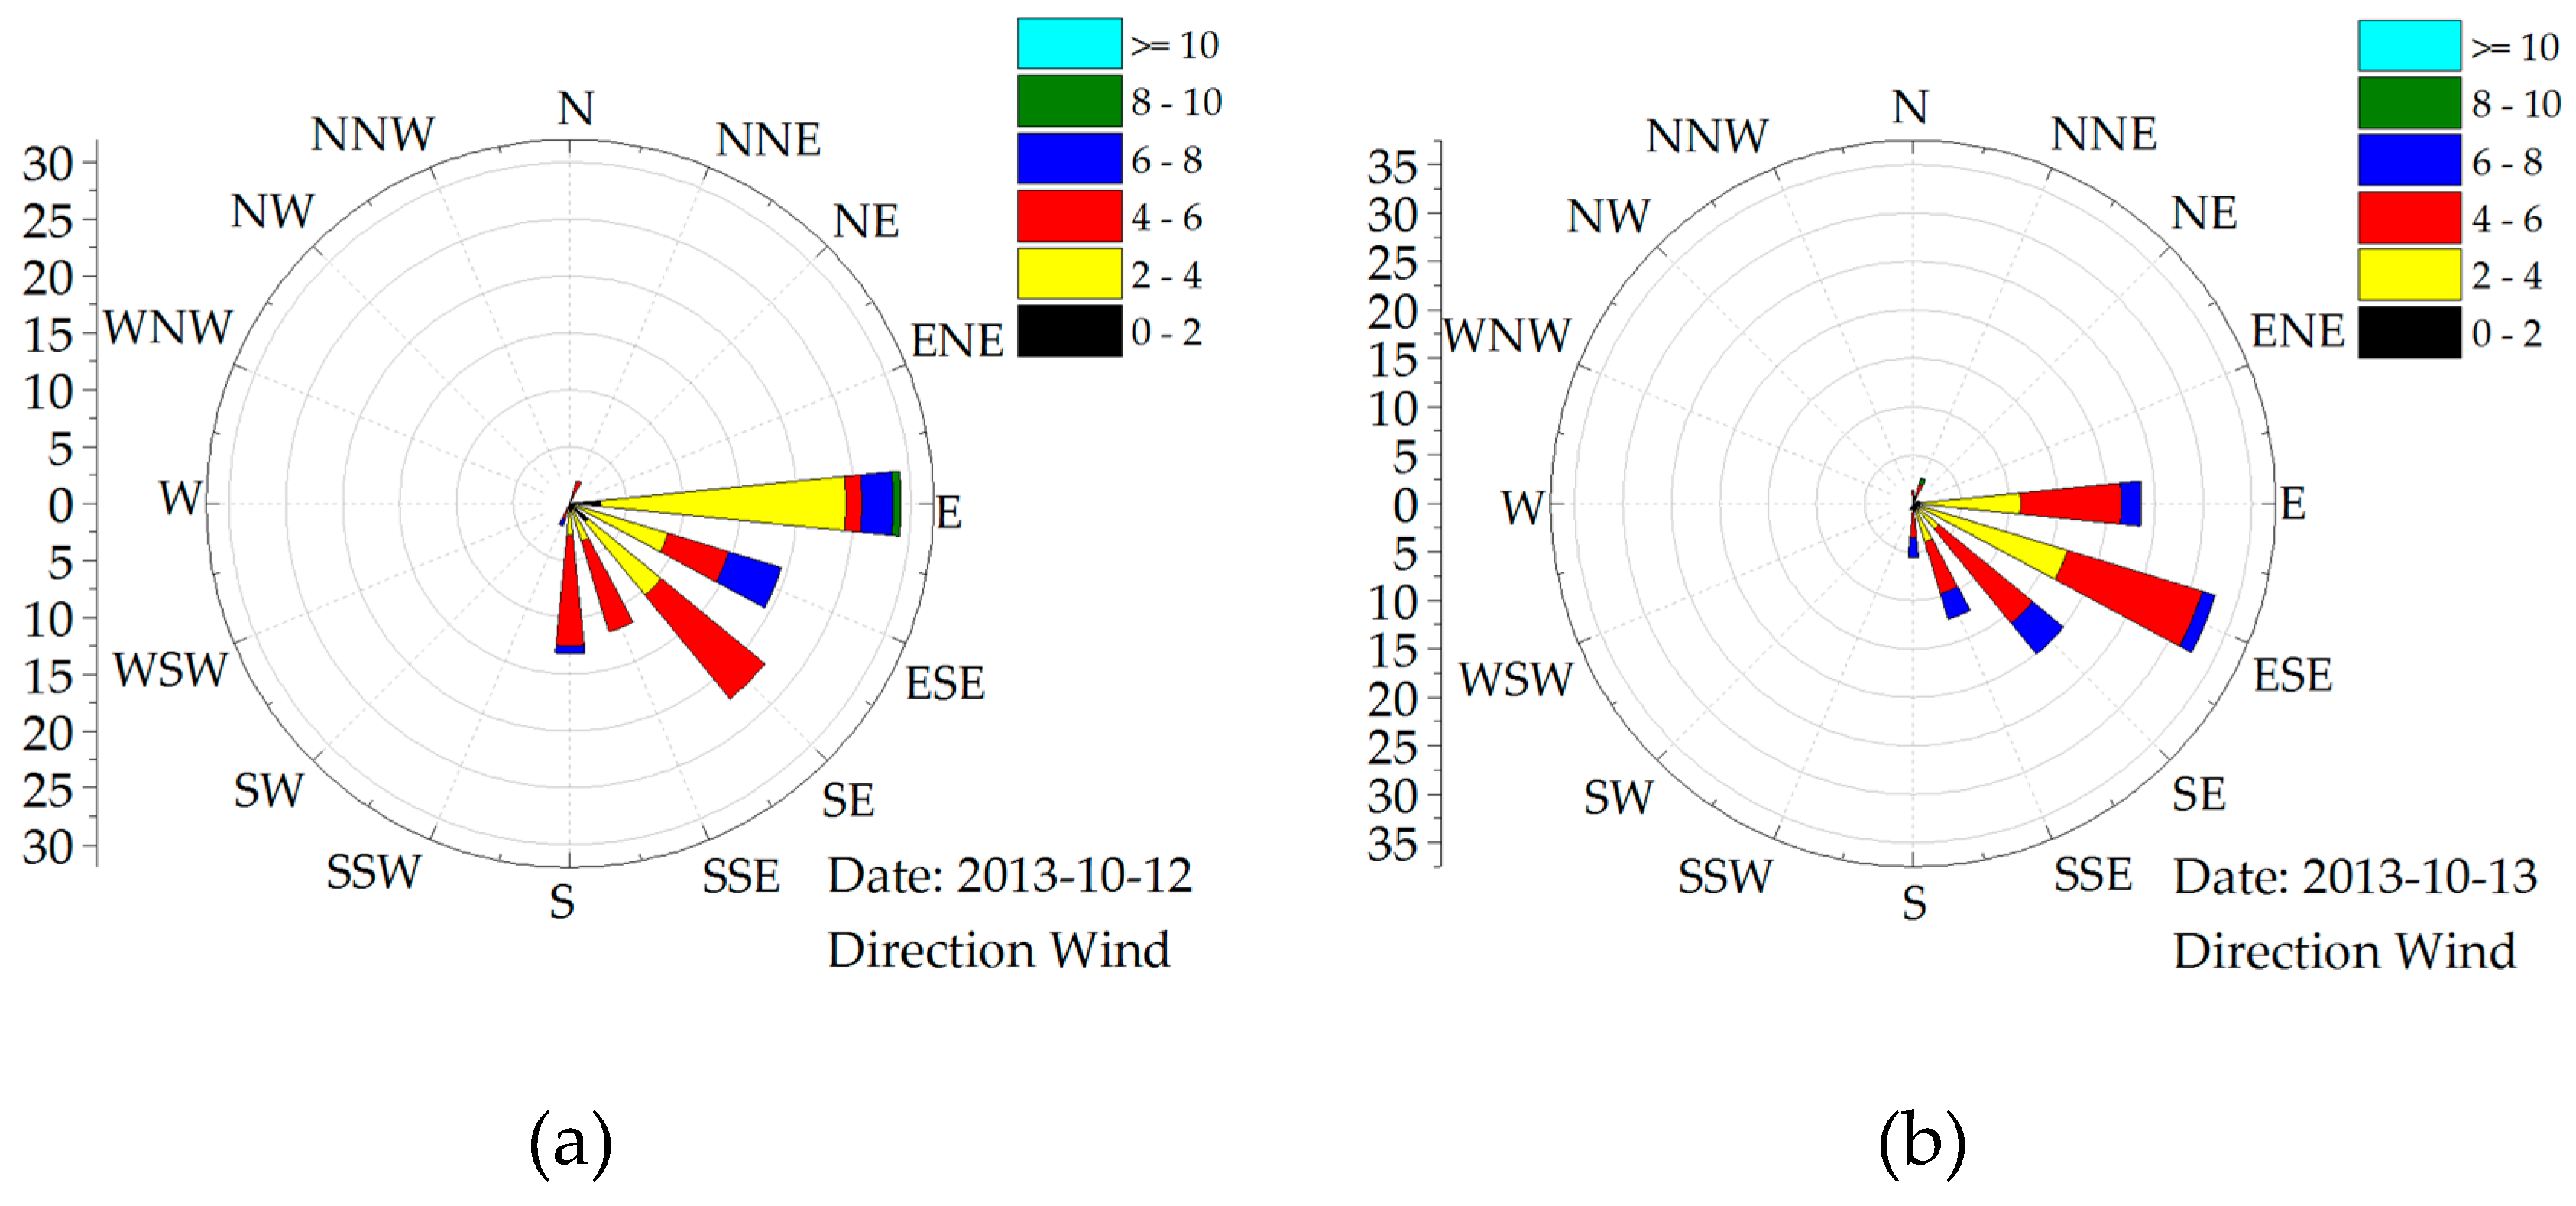
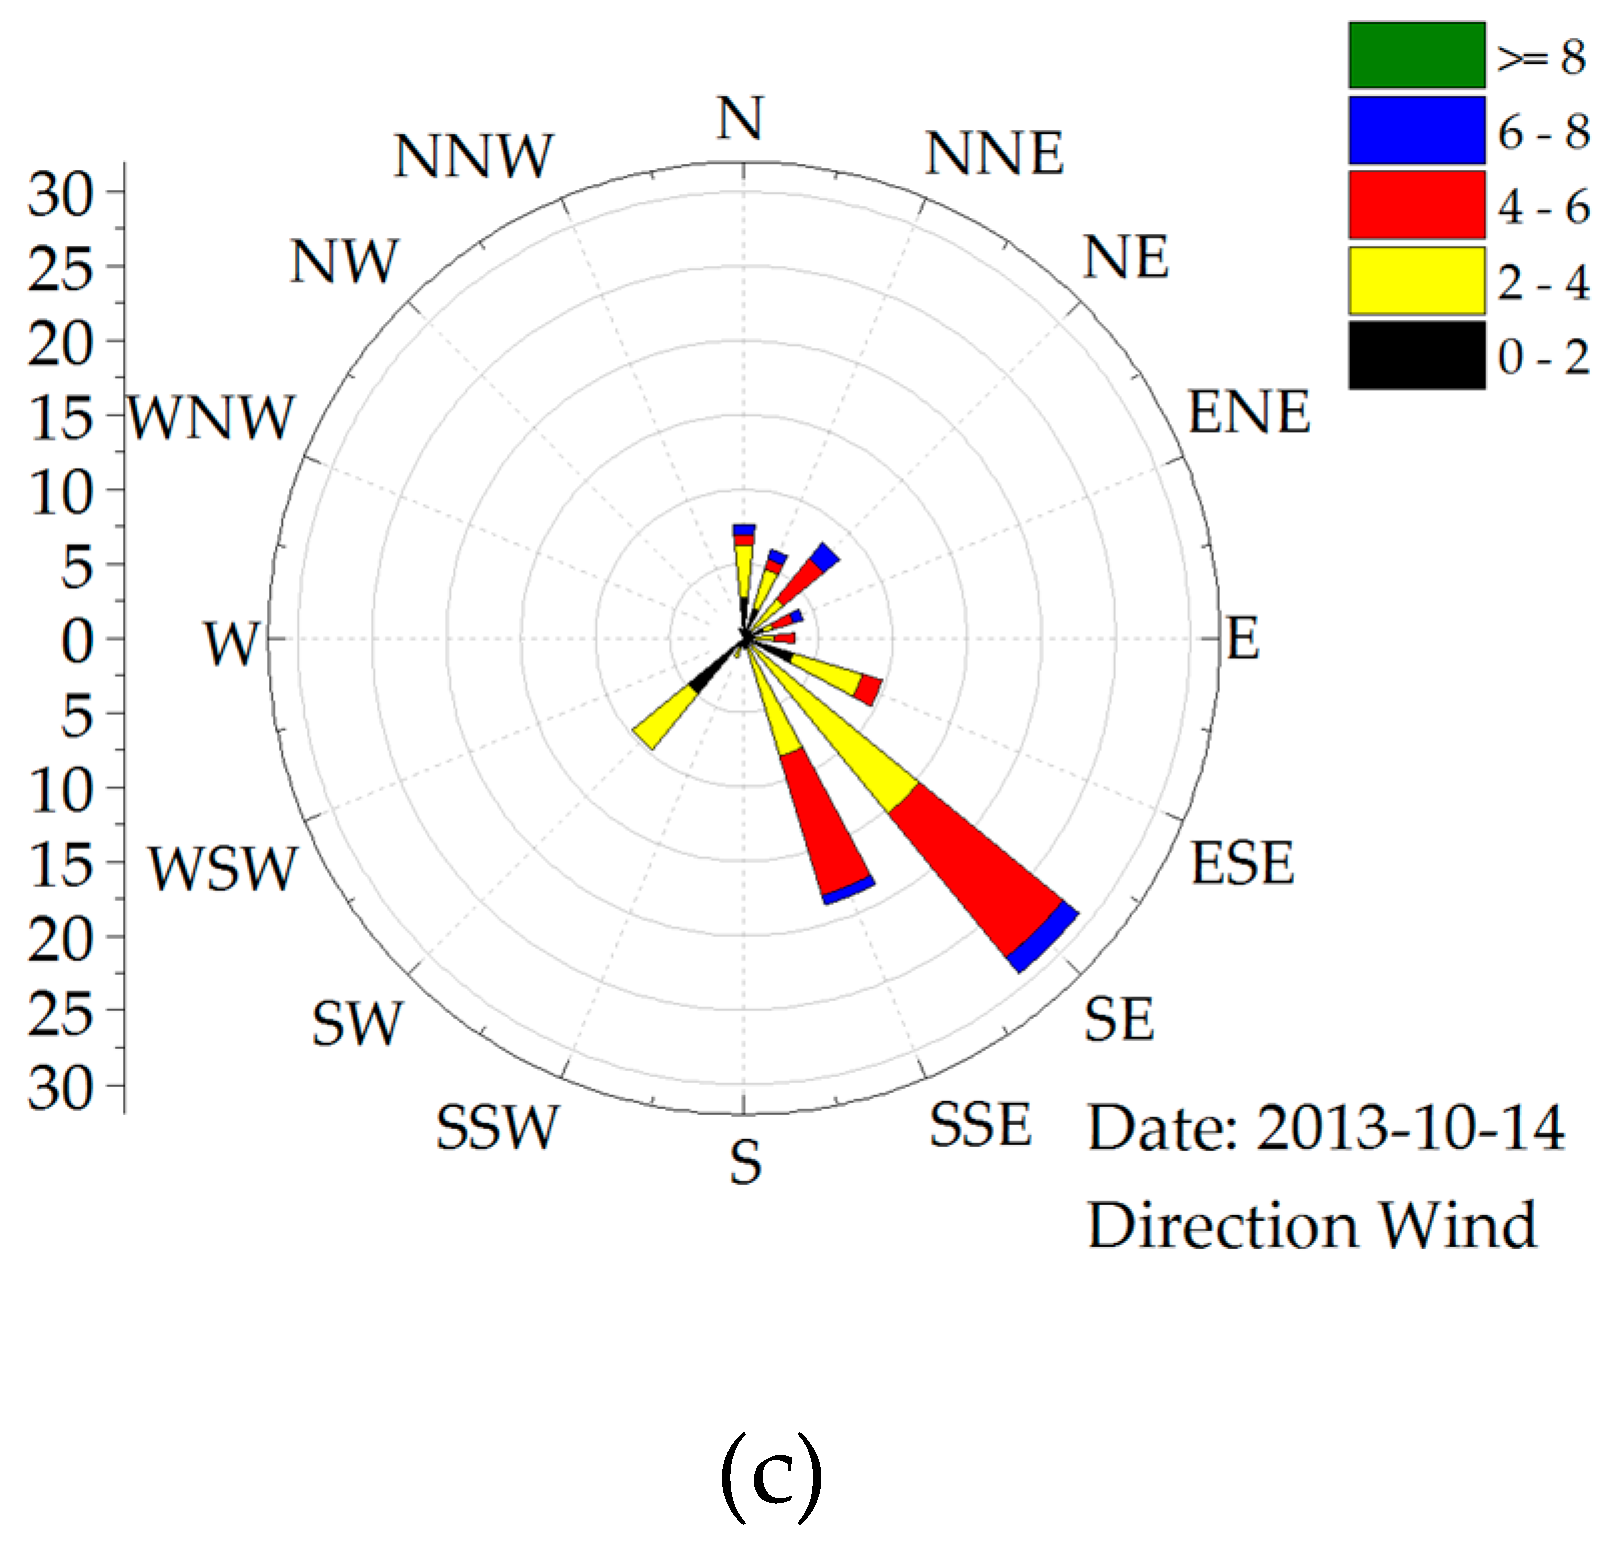
According to the wind speed and direction data from 12–14 October 2013, recorded by the Taihu Laboratory for Lake Ecosystem Research Taihu Station of the Chinese Academy of Sciences, the wind direction in Lake Taihu was mainly southeasterly during this period (Figure 11). The reason for this result was likely the continuation of the impacts caused by Typhoon No. 23 in October 2013. Due to the influence of the wind direction, the plume with high suspended matter concentrations on the surface of Lake Taihu migrated to the north and further moved to the eastern region of the lake.
These results show that the plume in the estuary of the Tiaoxi River is affected by the intensity of precipitation in the basin. When heavy precipitation occurs, the flow of the Tiaoxi River will increase significantly, and a large amount of sediment will flow into the channel along with the rain, causing the amount of water and suspended matter flowing into Lake Taihu to sharply increase. When an algal bloom occurs in the southern part of Lake Taihu at the estuary of the Tiaoxi River, the algal bloom moves and spreads to the northwest part of the lake, along with the plumes from the Tiaoxi River, and may further affect the distribution of alga throughout the lake.

4.3. Analysis of the Relationship Between Precipitation and River Sediment Discharge

Furthermore, we used the sediment discharge data monitored by the Gangkou Station to calculate the monthly mean sediment concentration from 2006 to 2013. The annual total precipitation data were also calculated by the Tyson polygon method in the upper reaches of the Gangkou Station in the West Tiaoxi River Basin (Table 6).
The results indicated that the sediment discharge from the West Tiaoxi River significantly increased from 2006 to 2011. The annual mean sediment concentration increased from 0.17 kg/m3 in 2006 to 0.39 kg/m3 in 2011, and the annual sediment discharge also increased from 2.00 × 10⁵ t in 2006 to 5.09 × 10⁵ t in 2011. Since 2012, there has been a drastic decline in sediment discharge from the West Tiaoxi River. The annual mean sediment discharge decreased to 0.11 kg/m3 in 2012, and in 2013 it further decreased to 0.08 kg/m3. However, there were no obvious changes in the annual total precipitation in the West Tiaoxi River Basin.
According to the information collected on the official website of the Anji County Government [55], from 1999 to 2009, more than 30 million tons of sand was mined from the West Tiaoxi River, and after comparing the aerial photographs of 1999 and 2009, it was found that the river channel of the West Tiaoxi River widened nearly three times. Further studies found that a large number of farmland and beach land on both sides of the West Tiaoxi River became water bodies, and more importantly, the average height of the river bed reached –5m, and some areas even reached –10m, greatly exceeding the control elevation of –3m. Visual observation shows that the West Tiaoxi River changes from clear to turbid after the commercial sand excavation activities. These direct and indirect evidences indicate that the suspended matter content in the water has increased significantly. These sand excavation activities have a great influence on the suspended sediment content in the river channel. Sand excavation machines causes high water turbidity during the sand mining operation, which significantly increases the suspended matter content in the water body [56,57,58,59,60]. In response to this environmental problem, the government of Anji County has banned commercial sand excavation activities in the West Tiaoxi River since 2012, which led to an obvious decline in the suspended sediment content in West Tiaoxi River since then.
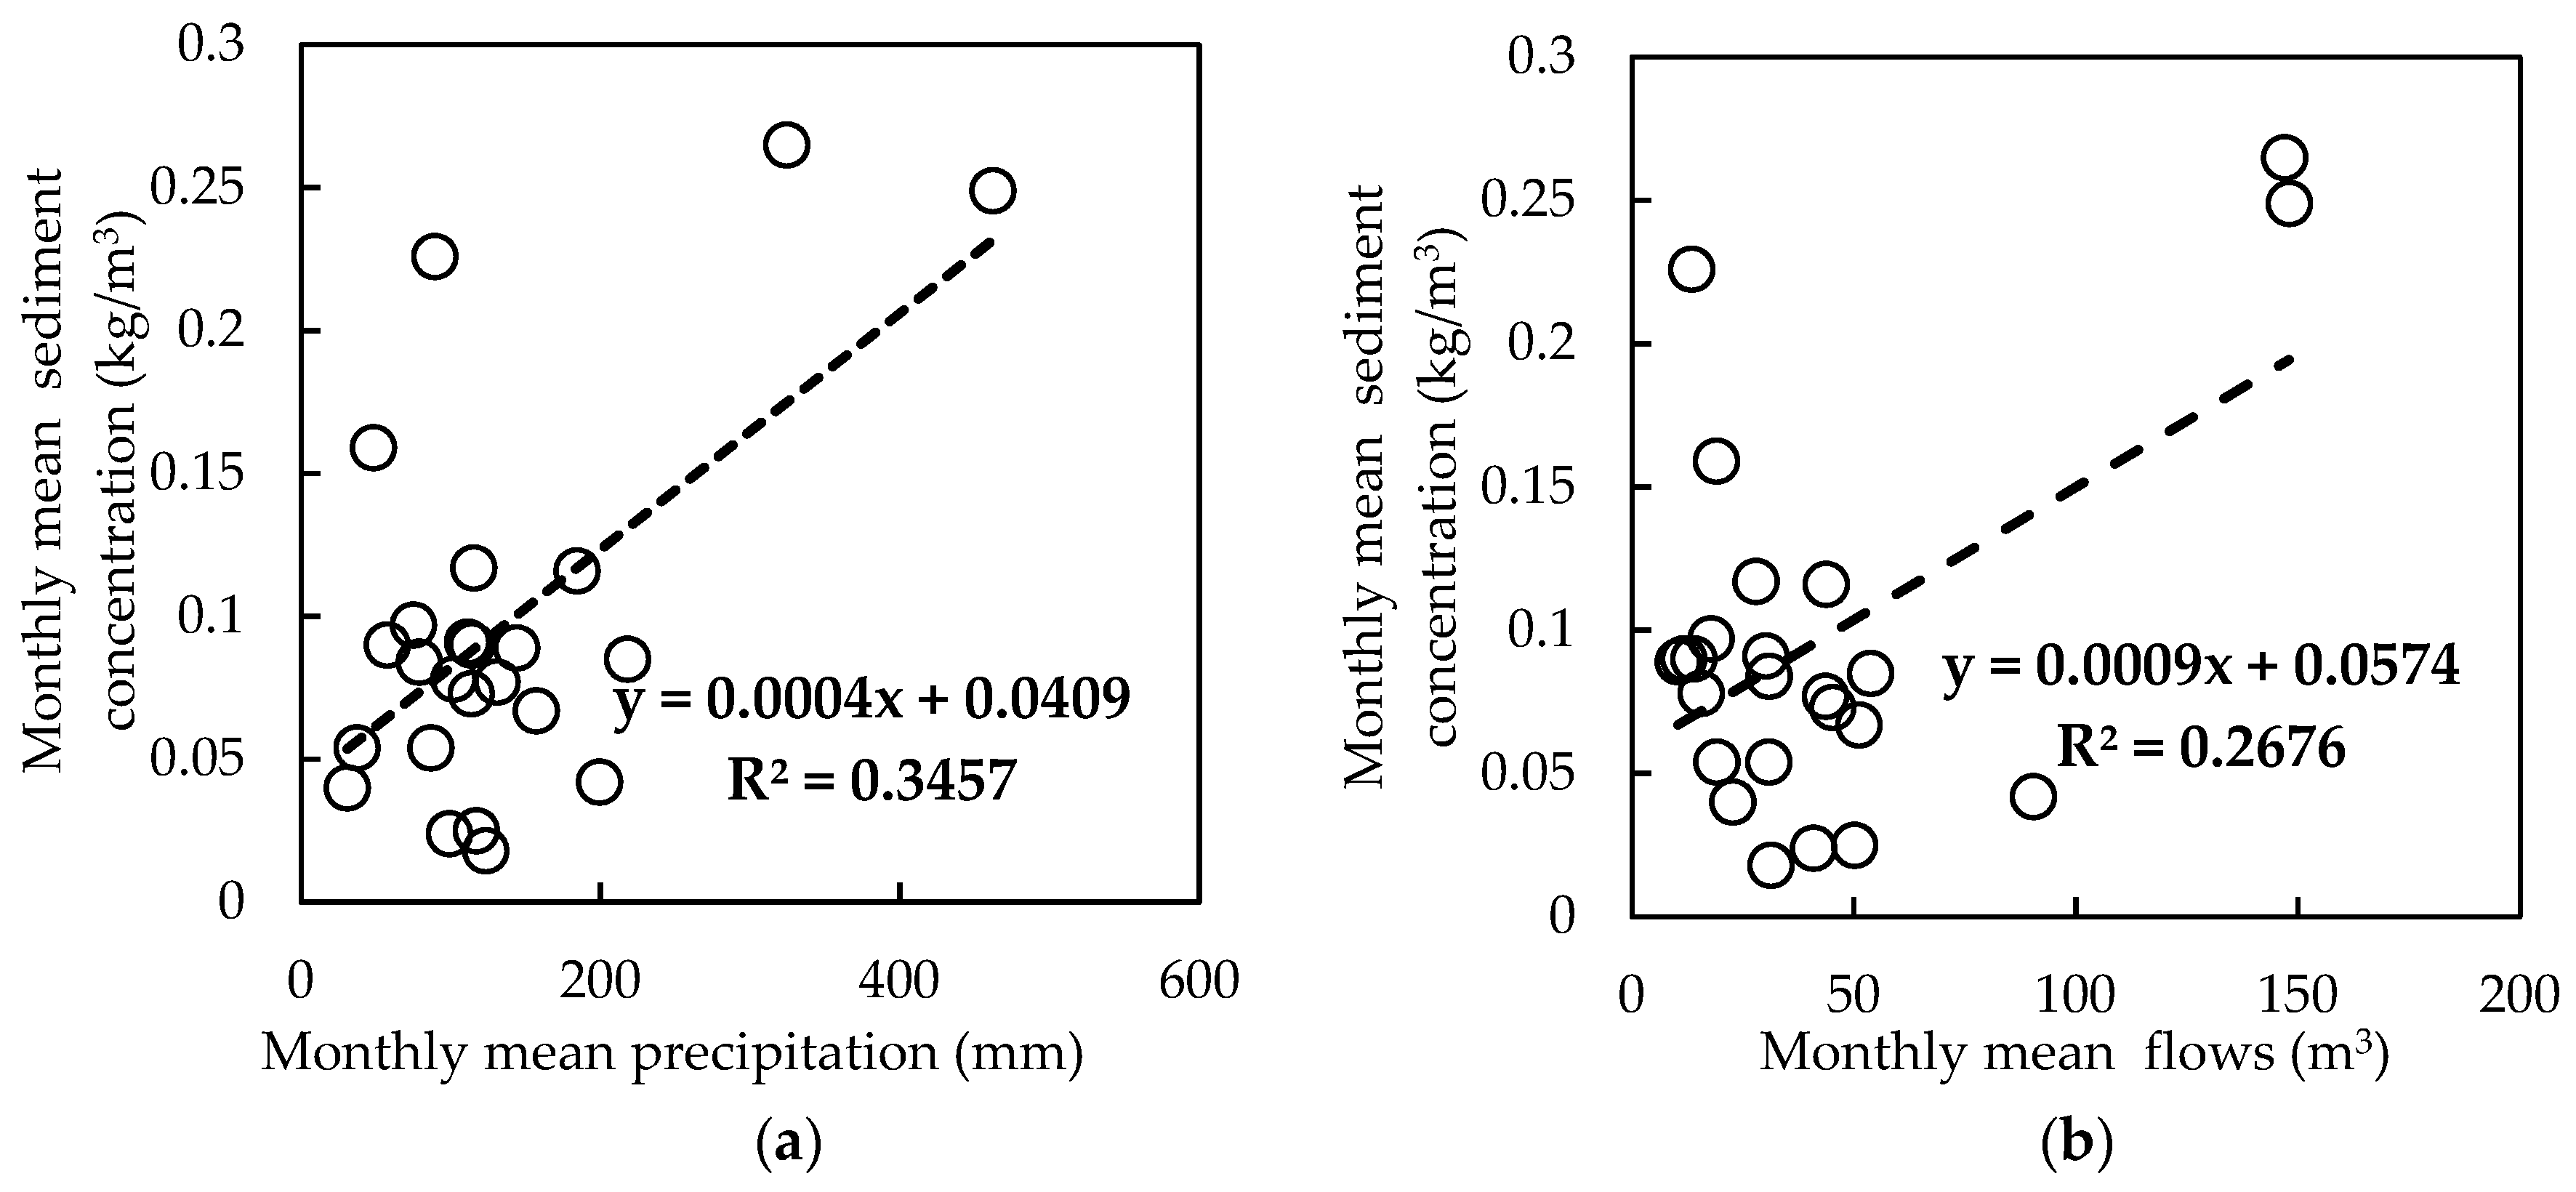
After eliminating the influence of commercial sand excavation activities, we analyzed the correlation between the monthly mean sediment concentration and the monthly mean precipitation and the correlation between the monthly mean sediment concentration and monthly mean flows at the Gangkou Station from 2012 to 2013 in the West Tiaoxi River Basin. The result indicated that the parameters exhibited a positive correlation of 0.5937 and 0.5173 respectively, with a coefficient of determination of 0.3457 and 0.2676, respectively (Figure 12a,b). The lower-level correlation data of these two groups indicate that sediment concentration is correlated with precipitation and flow, but the relationship was not significant. Combined with the results analyzed in Section 4.2, we considered that only when extreme weather conditions such as heavy precipitation occurs in the basin, sediment concentration may have a significant correlation with precipitation and flow. This is because when the precipitation is small, water mainly infiltrates into the soil, only when the precipitation reaches a certain grade, surface runoff will occur, and large amounts of sediment and nutrients will enter the river, which will affect the water environment.
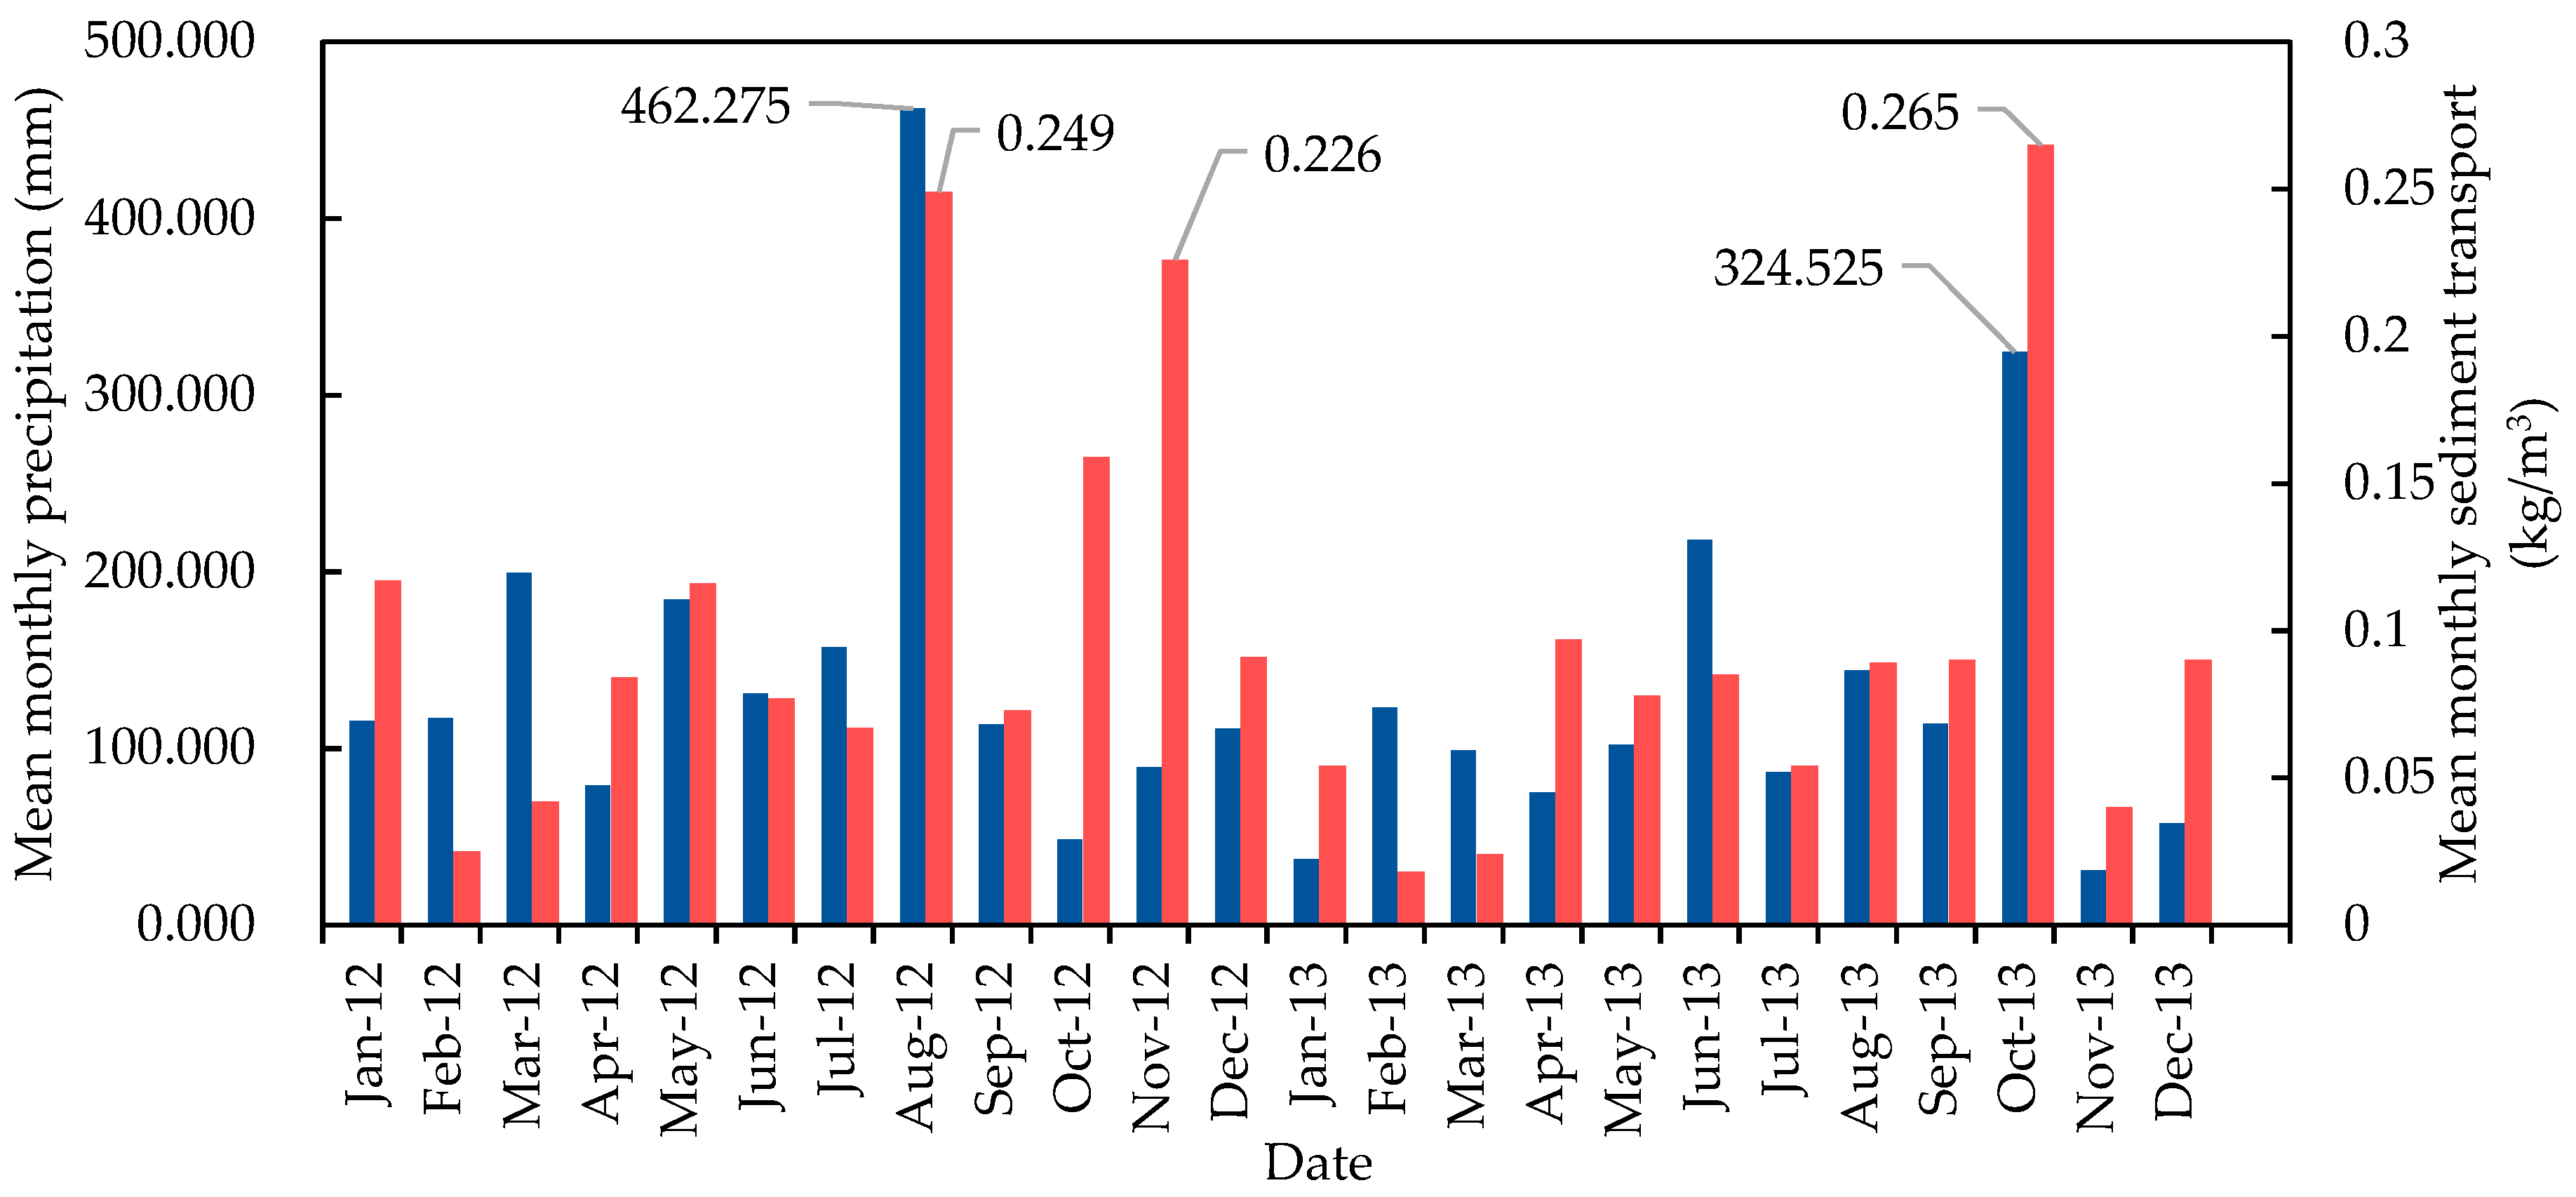
Figure 13 is a histogram of the mean monthly precipitation and mean monthly sediment discharge in the West Tiaoxi River Basin from 2012 to 2013. This figure shows that from 2012 to 2013, three months exhibited abnormal increases in sediment concentration in the river at the Gangkou Station, which occurred in August and November 2012 and October 2013. The quantities were 0.249 kg/m3, 0.226 kg/m3, and 0.265 kg/m3. Except for November 2012, precipitation reached its maximum in the months when the maximum sediment concentration appeared. The precipitation was 462.275 mm in August 2012 (failure to obtain GOCI data for similar periods due to weather conditions), and 322.525 mm in October 2013 (corresponding to the results of GOCI data, Figure 6). This result indicates that when heavy precipitation occurs in the Tiaoxi River Basin, the sediment concentration in the river will increase significantly, and a plume will form after the water flows into Lake Taihu, which will affect the suspended matter concentration in the lake and cause disturbances to Lake Taihu’s water environment. The abnormal increase in sediments in November 2012 may be due to the small number of illegal sand excavation activities in the river.

4.4. Implication for Water Resources Management

The GOCI-derived TSM products in 2011 and 2013 show that the plume of the Tiaoxi River had a great influence on the spatial distribution of TSM in Lake Taihu after heavy precipitation events, and it would make the TSM concentration sharply rise in a short period. These results clearly suggest a significant influence to Lake Taihu water resources from heavy precipitation events in the basin. The issue of water resources security in Lake Taihu has received much attention in recent years. Therefore, the urgent need for high temporal resolution monitoring of the water environment in Lake Taihu has been realized. Water environment monitoring is somewhat limited by using traditional methods and requires a large quantity of time and labors. Thus, the approach developed in this study, while relatively simple, importantly demonstrates the ability to rapidly acquire information about the concentration of TSM from GOCI data. Validated TSM products from GOCI data measurements can provide supporting information derived from existing field sampling activities and can therefore help management agencies make prudent decisions when the water resources are affected. Therefore, we recommend that future lake monitoring plans include satellite water color remote sensing to aid in the interpretation of spatial and temporal patterns of important water quality parameters.

5. Conclusions

In this study, GOCI data, with a high temporal resolution, were used to study the spatial distribution of the TSM concentration in Lake Taihu after heavy precipitation events in the Tiaoxi River Basin. In addition, the influence of the plume on the water quality of Lake Taihu and the hydrological factors affecting the plume were analyzed. Through the analysis of 16 GOCI images after heavy precipitation events in September 2011 and October 2013, we found that the post-precipitation plume had a great influence on the spatial distribution of the TSM concentration in the lake which, in turn, changed the water quality of the entire lake. Moreover, when algal blooms occur in the estuary, a large amount of inflow from the basin will disperse the algal blooms, which may increase the algae concentration in other areas of the lake. Combined with the analysis of data from the hydrological stations within the basin, the plumes entering Lake Taihu from the Tiaoxi River were mainly affected by the precipitation intensity in the basin, as well as the water volume and suspended sediment content in the river channel. In addition, the sand excavation activity in the West Tiaoxi River Basin had a great impact on the sediment discharge from the river at that time.
These results show that high temporal resolution satellite data can be used to continuously observe plumes in inland lakes. To better understand the effects of the plumes on nutrients in lakes, it is necessary to further integrate the basin runoff yield and runoff models to calculate the non-point pollution in the basin. Meanwhile, in situ observations can be used to monitor the rivers and the plumes impacts of heavy precipitation on the transport of suspended matter and nutrients. These in situ observed data can be used to further improve the simulation accuracy of remote sensing models and to characterize this hydrological process in a more specific way. In addition, because the GOCI images have a spatial resolution of 500 m, we could not determine important details for the spatial distribution water parameters in the inland lake. In future studies, satellite data with higher spatial resolution, such as GF4 satellite data, should be used for additional research.

Author Contributions

Conceptualization, Y.X.; Formal analysis, G.Z., Y.Z. and K.S.; Funding acquisition, Y.X.; Investigation, Y.X.; Methodology, Y.X.; Project administration, B.Q.Q.; Resources, Y.M.L., Y.S. and L.C.; Supervision, B.Q.Q.; Validation, Y.X.; Visualization, Y.X.; Writing – original draft, Y.X.; Writing – review & editing, B.Q.Q., G.Z., Y.Z., K.S., Y.M.L., Y.S. and L.C.

Funding

This research was funded by the National Key R&D Program of China (No.2016YFC0402207), the National Natural Science Foundation of China (No. 41601376, No. 51679143 and No. 41621002) and the Special Foundation Project of Basic Scientific Research Operation of Central Public Welfare Research Institutes (No. Y516018)

Acknowledgments

The authors would like to thank Tengfei Hu (Nanjing Hydraulic Research Institute) for his suggestions pertaining to the study, and deeply grateful to three anonymous reviewers and academic editors who provided extensive comments and suggestions to improve the quality of this work.

Conflicts of Interest

The authors declare no conflict of interest.

References

  1. Devlin, M.; Petus, C.; Da Silva, E.; Tracey, D.; Wolff, N.; Waterhouse, J.; Brodie, J. Water quality and river plume monitoring in the Great Barrier Reef: an overview of methods based on ocean colour satellite data. Remote Sens. 2015, 7, 12909–12941. [Google Scholar] [CrossRef]
  2. He, X.; Bai, Y.; Pan, D.; Huang, N.; Dong, X.; Chen, J.; Chen, C.-T.A.; Cui, Q. Using geostationary satellite ocean color data to map the diurnal dynamics of suspended particulate matter in coastal waters. Remote Sens. Environ. 2013, 133, 225–239. [Google Scholar] [CrossRef]
  3. Ibánhez, J.S.P.; Diverrès, D.; Araujo, M.; Lefèvre, N. Seasonal and interannual variability of sea-air CO2 fluxes in the tropical Atlantic affected by the Amazon River plume. Global Biogeochem. Cy. 2015, 29, 1640–1655. [Google Scholar] [CrossRef]
  4. Molleri, G.S.F.; Kampel, M.; de Moraes Novo, E.M.L. Spectral classification of water masses under the influence of the Amazon River plume. Acta Oceanol. Sin. 2010, 29, 1–8. [Google Scholar] [CrossRef]
  5. Yuan, D.; Yang, G.-P.; He, Z. Spatio-temporal distributions of chlorofluorocarbons and methyl iodide in the Changjiang (Yangtze River) estuary and its adjacent marine area. Mar. Pollut. Bull. 2016, 103, 247–259. [Google Scholar] [CrossRef] [PubMed]
  6. Bonvin, F.; Rutler, R.; Chevre, N.; Halder, J.; Kohn, T. Spatial and temporal presence of a wastewater-derived micropollutant plume in Lake Geneva. Environ. Sci. Technol. 2011, 45, 4702–4709. [Google Scholar] [CrossRef]
  7. Tan, J.; Cherkauer, K.A.; Chaubey, I.; Troy, C.D.; Essig, R. Water quality estimation of River plumes in Southern Lake Michigan using Hyperion. J. Great Lakes Res. 2016, 42, 524–535. [Google Scholar] [CrossRef]
  8. Zhang, Y.; Shi, K.; Zhou, Y.; Liu, X.; Qin, B. Monitoring the river plume induced by heavy rainfall events in large, shallow, Lake Taihu using MODIS 250 m imagery. Remote Sens. Environ. 2016, 173, 109–121. [Google Scholar] [CrossRef]
  9. Brando, V.; Braga, F.; Zaggia, L.; Giardino, C.; Bresciani, M.; Matta, E.; Bellafiore, D.; Ferrarin, C.; Maicu, F.; Benetazzo, A. High-resolution satellite turbidity and sea surface temperature observations of river plume interactions during a significant flood event. Ocean Sci. 2015, 11, 909–920. [Google Scholar] [CrossRef] [Green Version]
  10. Petus, C.; Chust, G.; Gohin, F.; Doxaran, D.; Froidefond, J.-M.; Sagarminaga, Y. Estimating turbidity and total suspended matter in the Adour River plume (South Bay of Biscay) using MODIS 250-m imagery. Cont. Shelf Res. 2010, 30, 379–392. [Google Scholar] [CrossRef]
  11. Salisbury, J.; Vandemark, D.; Campbell, J.; Hunt, C.; Wisser, D.; Reul, N.; Chapron, B. Spatial and temporal coherence between Amazon River discharge, salinity, and light absorption by colored organic carbon in western tropical Atlantic surface waters. J. Geophys. Res. Oceans 2011, 116. [Google Scholar] [CrossRef] [Green Version]
  12. Matthews, M.W. A current review of empirical procedures of remote sensing in inland and near-coastal transitional waters. Int. J. Remote Sens. 2011, 32, 6855–6899. [Google Scholar] [CrossRef]
  13. Wang, M.; Shi, W.; Tang, J. Water property monitoring and assessment for China’s inland Lake Taihu from MODIS-Aqua measurements. Remote Sens. Environ. 2011, 115, 841–854. [Google Scholar] [CrossRef]
  14. Koponen, S.; Pulliainen, J.; Kallio, K.; Hallikainen, M. Lake water quality classification with airborne hyperspectral spectrometer and simulated MERIS data. Remote Sens. Environ. 2002, 79, 51–59. [Google Scholar] [CrossRef]
  15. Tebbs, E.; Remedios, J.; Harper, D. Remote sensing of chlorophyll-a as a measure of cyanobacterial biomass in Lake Bogoria, a hypertrophic, saline–alkaline, flamingo lake, using Landsat ETM+. Remote Sens. Environ. 2013, 135, 92–106. [Google Scholar] [CrossRef]
  16. Bergamino, N.; Horion, S.; Stenuite, S.; Cornet, Y.; Loiselle, S.; Plisnier, P.-D.; Descy, J.-P. Spatio-temporal dynamics of phytoplankton and primary production in Lake Tanganyika using a MODIS based bio-optical time series. Remote Sens. Environ. 2010, 114, 772–780. [Google Scholar] [CrossRef]
  17. Huang, C.C.; Li, Y.; Yang, H.; Sun, D.; Yu, Z.; Zhang, Z.; Chen, X.; Xu, L. Detection of algal bloom and factors influencing its formation in Taihu Lake from 2000 to 2011 by MODIS. Environ. Earth Sci. 2014, 71, 3705–3714. [Google Scholar] [CrossRef]
  18. Shi, K.; Zhang, Y.L.; Zhu, G.W.; Liu, X.; Zhou, Y.; Xu, H.; Qin, B.; Liu, G.; Li, Y. Long-term remote monitoring of total suspended matter concentration in Lake Taihu using 250 m MODIS-Aqua data. Remote Sens. Environ. 2015, 164, 43–56. [Google Scholar] [CrossRef]
  19. Wang, M.; Ahn, J.H.; Jiang, L.; Shi, W.; Son, S.H.; Park, Y.J.; Ryu, J.H. Ocean color products from the Korean geostationary ocean color imager (GOCI). Opt. Express. 2013, 21, 3835–3849. [Google Scholar] [CrossRef]
  20. Choi, J.K.; Yang, H.; Han, H.J.; Ryu, J.H.; Park, Y.J. Quantitative estimation of suspended sediment movements in coastal region using GOCI. J. Coastal Res. 2013, 65, 1367–1372. [Google Scholar] [CrossRef]
  21. Lou, X.; Hu, C. Diurnal changes of a harmful algal bloom in the East China Sea: Observations from GOCI. Remote Sens. Environ. 2014, 140, 562–572. [Google Scholar] [CrossRef]
  22. Lyu, H.; Zhang, J.; Zha, G.; Wang, Q.; Li, Y. Developing a two-step retrieval method for estimating total suspended solid concentration in Chinese turbid inland lakes using Geostationary Ocean Colour Imager (GOCI) imagery. Int. J. Remote Sens. 2015, 36, 1385–1405. [Google Scholar] [CrossRef]
  23. Huang, C.; Zou, J.; Li, Y.; Yang, H.; Shi, K.; Li, J.; Wang, Y.; Chan, X.; Zheng, F. Assessment of NIR-red algorithms for observation of chlorophyll-a in highly turbid inland waters in China. ISPRS J. Photogramm. 2014, 93, 29–39. [Google Scholar] [CrossRef]
  24. Duan, H.; Ma, R.; Zhang, Y.; Loiselle, S.A.; Xu, J.; Zhao, C.; Shang, L.; Shang, L. A new three-band algorithm for estimating chlorophyll concentrations in turbid inland lakes. Environ. Res. Lett. 2010, 5. [Google Scholar] [CrossRef]
  25. Qin, B.; Xu, P.; Wu, Q.; Luo, L.; Zhang, Y. Environmental issues of lake Taihu, China. Hydrobiologia 2007, 194, 3–14. [Google Scholar]
  26. Wu, T.; Qin, B.; Zhu, G.; Zhu, M.; Wei, L.; Luan, C. Modeling of turbidity dynamics caused by wind-induced waves and current in the Taihu Lake. Int. J. Sediment Res. 2013, 28, 139–148. [Google Scholar] [CrossRef]
  27. Wu, T.; Qin, B.; Brookes, J.D.; Yan, W.; Ji, X.; Feng, J. Spatial distribution of sediment nitrogen and phosphorus in Lake Taihu from a hydrodynamics-induced transport perspective. Sci. Total Environ. 2019, 650, 1554–1565. [Google Scholar] [CrossRef]
  28. Huang, C.; Li, Y.; Liu, G.; Guo, Y.; Yang, H.; Zhu, A.X.; Song, T.; Huang, T.; Zhang, M.; Shi, K. Tracing high time-resolution fluctuations in dissolved organic carbon using satellite and buoy observations: Case study in Lake Taihu, China. Int. J. Appl. Earth Obs. 2017, 62, 174–182. [Google Scholar] [CrossRef]
  29. Huang, C.; Shi, K.; Yang, H.; Li, Y.; Zhu, A.X.; Sun, D.; Xu, L.; Zou, J.; Chen, X. Satellite observation of hourly dynamic characteristics of algae with Geostationary Ocean Color Imager (GOCI) data in Lake Taihu. Remote Sens. Environ. 2015, 159, 278–287. [Google Scholar] [CrossRef]
  30. Huang, C.C.; Yang, H.; Zhu, A.X.; Zhang, M.L.; Lü, H.; Huang, T.; Zou, J.; Li, Y.M. Evaluation of the Geostationary Ocean Color Imager (GOCI) to monitor the dynamic characteristics of suspension sediment in Taihu Lake. Int. J. Remote Sens. 2015, 36, 3859–3874. [Google Scholar] [CrossRef]
  31. Bao, Y.; Tian, Q.J.; Chen, M. A Weighted Algorithm Based on Normalized Mutual Information for Estimating the Chlorophyll-a Concentration in Inland Waters Using Geostationary Ocean Color Imager (GOCI) Data. Remote Sens. 2015, 7, 11731–11752. [Google Scholar] [CrossRef] [Green Version]
  32. Xu, H.; Paerl, H.W.; Qin, B.; Zhu, G.; Gaoa, G. Nitrogen and phosphorus inputs control phytoplankton growth in eutrophic Lake Taihu, China. Limnol. Oceanogr. 2010, 55, 420–432. [Google Scholar] [CrossRef]
  33. Li, N.; Xu, Y.; Guo, H. Long-term impacts of urbanization on surface runoff in the Xitiaoxi River watershed, eastern China. Acta Scientiarum Naturalium Universitatis Pekinensis 2009, 45, 668–676. (In Chinese) [Google Scholar]
  34. Xu, B.; Li, J.; Huang, Q.; Gong, Q.; Li, L. Impacts of land use patterns and typhoon-induced heavy rainfall event on dissolved organic matter properties in the South Tiaoxi River, China. Environ. Earth Sci. 2016, 75. [Google Scholar] [CrossRef]
  35. Xie, X.; Jiang, G.; Xiao, C.; Wu, T.; Bian, H.; Ma, Y.; Chen, J. Evaluation of ecosystem health in Western Tiaoxi River watershed based on matter element model. Acta Sci. Circumst. 2015, 35, 1250–1258. (In Chinese) [Google Scholar]
  36. Vermote, E.F.; Tanré, D.; Deuze, J.L.; Herman, M.; Morcette, J.-J. Second simulation of the satellite signal in the solar spectrum, 6S: An overview. IEEE T. Geosci. Remote. 1997, 35, 675–686. [Google Scholar] [CrossRef]
  37. Zhao, W.; Tamura, M.; Takahashi, H. Atmospheric and spectral corrections for estimating surface albedo from satellite data using 6S code. Remote Sens. Environ. 2001, 76, 202–212. [Google Scholar] [CrossRef]
  38. MA, R.-H. Spatio-temporal distribution of cyanobacteria blooms based on satellite imageries in Lake Taihu, China. J. Lake Sci. 2008, 20, 687–694. (In Chinese) [Google Scholar] [Green Version]
  39. Shi, K.; Zhang, Y.; Zhou, Y.; Liu, X.; Zhu, G.; Qin, B.; Gao, G. Long-term MODIS observations of cyanobacterial dynamics in Lake Taihu: Responses to nutrient enrichment and meteorological factors. Sci. Rep. UK. 2017, 7. [Google Scholar] [CrossRef]
  40. Zhang, Y.; Qin, B.; Zhu, G.; Shi, K.; Zhou, Y. Profound Changes in the Physical Environment of Lake Taihu From 25 Years of Long-Term Observations: Implications for Algal Bloom Outbreaks and Aquatic Macrophyte Loss. Water Resour. Res. 2018, 54, 4319–4331. [Google Scholar] [CrossRef]
  41. Shi, K.; Zhang, Y.; Liu, X.; Wang, M.; Qin, B. Remote sensing of diffuse attenuation coefficient of photosynthetically active radiation in Lake Taihu using MERIS data. Remote Sens. Environ. 2014, 140, 365–377. [Google Scholar] [CrossRef]
  42. Tang, J.W.; Tian, G.I.; Wang, X.Y.; Wang, X.M.; Song, Q.J. The methods of water spectra measurement and analysis I: above-water method. J. Remote Sens. 2004, 8, 37–44. (In Chinese) [Google Scholar]
  43. Mobley, C.D. Light and Water: Radiative Transfer in Natural Waters, 1st ed.; Academic Press: Cambridge, MA, USA, 1994; pp. 1–592. [Google Scholar]
  44. Pallant, J. SPSS Survival Manual: A Step by Step Guide to Data Analysis using IBM SPSS; Open University Press: London, UK, 2013; pp. 1–354. [Google Scholar]
  45. Ma, W.; Xing, Q.; Chen, C.; Zhang, Y.; Yu, D.; Shi, P. Using the normalized peak area of remote sensing reflectance in the near-infrared region to estimate total suspended matter. Int. J. Remote Sens. 2011, 32, 7479–7486. [Google Scholar] [CrossRef] [Green Version]
  46. Zheng, Z.; Li, Y.; Guo, Y.; Xu, Y.; Liu, G.; Du, C. Landsat-based long-term monitoring of total suspended matter concentration pattern change in the wet season for Dongting Lake, China. Remote Sens. 2015, 7, 13975–13999. [Google Scholar] [CrossRef]
  47. Shi, K.; Zhang, Y.; Zhu, G.; Qin, B.; Pan, D. Deteriorating water clarity in shallow waters: Evidence from long term MODIS and in-situ observations. Int. J. Appl. Earth Obs. 2018, 68, 287–297. [Google Scholar] [CrossRef]
  48. Zhang, Y.; Shi, K.; Liu, X.; Zhou, Y.; Qin, B. Lake topography and wind waves determining seasonal-spatial dynamics of total suspended matter in turbid Lake Taihu, China: assessment using long-term high-resolution MERIS data. PloS One. 2014, 9. [Google Scholar] [CrossRef] [PubMed]
  49. Zhang, Y.; Zhang, Y.; Shi, K.; Zha, Y.; Zhou, Y.; Liu, M. A Landsat 8 OLI-based, semianalytical model for estimating the total suspended matter concentration in the slightly turbid Xin’anjiang Reservoir (China). IEEE J. STARS. 2016, 9, 398–413. [Google Scholar] [CrossRef]
  50. Li, J.; Chen, X.; Tian, L.; Huang, J.; Feng, L. Improved capabilities of the Chinese high-resolution remote sensing satellite GF-1 for monitoring suspended particulate matter (SPM) in inland waters: Radiometric and spatial considerations. ISPRS J. Photogramm. 2015, 106, 145–156. [Google Scholar] [CrossRef]
  51. Zheng, S.; Wang, P.; Wang, C.; Wang, C.; Hou, J.; Qian, J. Distribution of metals in water and suspended particulate matter during the resuspension processes in Taihu Lake sediment, China. Quatern. Int. 2013, 286, 94–102. [Google Scholar] [CrossRef]
  52. Huang, P.; Liu, Z. The effect of wave-reduction engineering on sediment resuspension in a large, shallow, eutrophic lake (Lake Taihu). Ecol. Eng. 2009, 35, 1619–1623. [Google Scholar] [CrossRef]
  53. Li, Y.; Tang, C.; Wang, J.; Acharya, K.; Du, W.; Gao, X.; Luo, L.; Li, H.; Dai, S.; Mercy, J.; Yu, Z.; Pan, B. Effect of wave-current interactions on sediment resuspension in large shallow Lake Taihu, China. Environ. Sci. Pollut. R. 2017, 24, 4029–4039. [Google Scholar] [CrossRef]
  54. Liu, J.; Liang, X.; Yang, J.; Ye, Y.; Su, M.; Nie, Z.; Chen, Y. Size distribution and composition of phosphorus in the East Tiao River, China: The significant role of colloids. J. Environ. Monitor. 2011, 13, 2844–2850. [Google Scholar] [CrossRef]
  55. Protecting land resources, ensuring water clean. Available online: http://www.huzhou.gov.cn/hzzx/xqxx/ajx/20120120/i331435.html (accessed on 9 April 2019). (In Chinese)
  56. Cui, L.; Qiu, Y.; Fei, T.; Liu, Y.; Wu, G. Using remotely sensed suspended sediment concentration variation to improve management of Poyang Lake, China. Lake Reserv. Manage. 2013, 29, 47–60. [Google Scholar] [CrossRef] [Green Version]
  57. Cui, L.; Wu, G.; Liu, Y. Monitoring the impact of backflow and dredging on water clarity using MODIS images of Poyang Lake, China. Hydrol. Process. 2009, 23, 342–350. [Google Scholar] [CrossRef]
  58. Hossain, S.; Eyre, B.D.; McKee, L.J. Impacts of dredging on dry season suspended sediment concentration in the Brisbane River estuary, Queensland, Australia. Estuar. Coast. Shelf S. 2004, 61, 539–545. [Google Scholar] [CrossRef]
  59. Roman-Sierra, J.; Navarro, M.; Muñoz-Perez, J.J.; Gomez-Pina, G. Turbidity and other effects resulting from Trafalgar sandbank dredging and Palmar beach nourishment. J. Waterw. Port C. 2011, 137, 332–343. [Google Scholar] [CrossRef]
  60. Spencer, K.; Dewhurst, R.; Penna, P. Potential impacts of water injection dredging on water quality and ecotoxicity in Limehouse Basin, River Thames, SE England, UK. Chemosphere 2006, 63, 509–521. [Google Scholar] [CrossRef]
Figure 1. Distribution of sampling sites.
Remotesensing 11 00985 g001
Figure 2. Comparisons of atmospheric corrected and in situ simulated data of GOCI. The green line is the mean remote sensing reflectance of the image after atmospheric correction for 10 stations, the brown line is in situ measured mean remote sensing reflectance for 10 stations.
Remotesensing 11 00985 g002
Figure 3. Calibration (a) and validation (b,c) of the proposed model for estimating TSM in turbid Lake Taihu.
Remotesensing 11 00985 g003
Figure 4. Distribution of TSM in Lake Taihu in early September 2011 (ah).
Remotesensing 11 00985 g004aRemotesensing 11 00985 g004b
Figure 5. Percentage of total lake area accounted for by different TSM concentrations (percent) in Lake Taihu in early September 2011.
Remotesensing 11 00985 g005
Figure 6. Distribution of TSM in Lake Taihu in mid-October 2013 (a–h).
Remotesensing 11 00985 g006aRemotesensing 11 00985 g006b
Figure 7. Percentage of total lake area accounted for by different TSM concentrations (percent) in Lake Taihu in mid-October 2013.
Remotesensing 11 00985 g007
Figure 8. The spread of high-concentration TSM plumes on 12–13 October 2013.
Remotesensing 11 00985 g008
Figure 9. GOCI image taken at 14:15 pm on 7 October 2013 (Typhoon No. 23).
Remotesensing 11 00985 g009
Figure 10. The daily mean sediment concentration provided by the Gangkou Station.
Remotesensing 11 00985 g010
Figure 11. Images of the wind speed and direction from 12–14 October 2013 (ac).
Remotesensing 11 00985 g011aRemotesensing 11 00985 g011b
Figure 12. The relationship between the mean monthly sediment concentration and the mean monthly precipitation (a) and the relationship between the mean monthly sediment concentration and the mean monthly flows (b).
Remotesensing 11 00985 g012
Figure 13. Mean monthly precipitation and mean monthly sediment discharge in the West Tiaoxi River Basin from 2012 to 2013.
Remotesensing 11 00985 g013
Table 1. Geostationary Ocean Color Imager (GOCI) images used in the study.
IDAcquisition Date (YYYY/MM/DD HH:MM: SS, UTC+8)IDAcquisition Date (YYYY/MM/DD HH:MM: SS, UTC+8)
12011/09/01 11:15:35102013/10/12 10:15:35
22011/09/02 10:15:37112013/10/12 11:15:35
32011/09/03 09:15:35122013/10/12 12:15:35
42011/09/03 10:15:35132013/10/13 12:15:37
52011/09/03 11:15:35142013/10/14 10:15:36
62011/09/03 12:15:35152013/10/14 11:15:36
72011/09/04 9:15:38162013/10/14 12:15:36
82011/09/04 13:15:38172013/08/01 12:15:37
92013/10/05 09:15:36
Table 2. Statistics describing the variation of TSM concentration (TSM, mg/L), SD is the standard deviation (mg/L), and CV is the coefficient of variation (%).
Statistics2008-112009-042010-052010-082013-08-01
Minimum (mg/L)8.6 11.4 14.3 14.1 20.6
Maximum (mg/L)154.7 244.9 76.8 132.3 72.0
Mean (mg/L)34.7 72.4 32.9 62.2 41.3
SD23.28 58.27 17.57 31.06 18.43
CV67.10% 80.47% 53.36% 49.92% 44.59%
Table 3. Correlation coefficients and relative errors for each band of the atmospheric correction results.
ParameterB1B2B3B4B5B6B7B8
Pearson Correlation Coefficients0.29570.57060.56560.22410.54040.67090.66230.8716
RE0.53380.41970.24840.13980.08550.10160.25770.4039
Table 4. The mean TSM concentrations in Lake Taihu.
Image IDMean TSM Concentration (mg/L)Image IDMean TSM Concentration (mg/L)
20110901_11:1596.820131005_09:1560.1
20110902_10:1566.220131012_10:1562.3
20110903_09:15107.420131012_11:1561.9
20110903_10:1594.920131012_12:1564.8
20110903_11:1599.520131013_12:15100.1
20110903_12:15101.020131014_10:1568.6
20110904_09:1566.220131014_11:1574.3
20110904_13:15109.320131014_12:1598.2
Table 5. The conditions of daily mean flows, daily mean sediment transport rate, and daily mean sediment concentration after heavy precipitation in October 2013.
DateDaily Mean Flows (m3/s)Daily Mean Sediment Transport Rate (kg/s)Daily Mean Sediment Concentration (kg/m3)Mean Daily Precipitation (mm)
5-Oct4.470.3850.0864.5
6-Oct26.8022.7500.103116.2
7-Oct312.00134.0000.429164.0
8-Oct823.00649.0000.7899.6
9-Oct673.00234.0000.348/
10-Oct537.0084.0000.156/
11-Oct466.0041.4000.089/
12-Oct377.0019.2000.051/
13-Oct257.008.0700.031/
14-Oct173.004.4800.026/
15-Oct117.002.5800.022/
Table 6. The annual mean sediment concentrations and annual total precipitation from 2006 to 2013.
YearAnnual Mean Sediment Concentration (kg/m3)Annual Total Precipitation (mm)
20060.171235.61
20070.181477.06
20080.201601.88
20090.231675.58
20100.291593.93
20110.391555.88
20120.111807.60
20130.081411.96

