Pointing Accuracy of an Operational Polarimetric Weather Radar


1
Deutscher Wetterdienst, Observatorium Hohenpeißenberg, Albin-Schwaiger-Weg 10, 82383 Hohenpeißenberg, Germany
2
Deutscher Wetterdienst, Sasel, 22393 Hamburg, Germany
*
Author to whom correspondence should be addressed.
†
These authors contributed equally to this work.
Remote Sens. 2019, 11(9), 1115; https://0-doi-org.brum.beds.ac.uk/10.3390/rs11091115
Submission received: 14 March 2019
/
Revised: 29 April 2019
/
Accepted: 5 May 2019
/
Published: 10 May 2019
(This article belongs to the Special Issue Radar Polarimetry—Applications in Remote Sensing of the Atmosphere)
Abstract
:Exact navigation of detected radar signals is crucial for usage of radar data in meteorological applications. The antenna pointing accuracy in azimuth and elevation of a polarimetric weather research radar depending on position of the sun is assessed using dedicated solar boxscans in a sequence of 10 min. The research radar of the German Meteorological Service (Deutscher Wetterdienst, DWD) is located at the meteorological observatory Hohenpeissenberg. It is identical to the 17 weather radars of the German weather radar network. A non-linear azimuthal variation of azimuthal pointing bias of up to 0.1 is found, which is significant as this is commonly viewed as the target pointing accuracy. This azimuthal variation can be attributed to the mechanical design of the drive train with the angle encoder. This includes the inherent backlash of the gear-drive assembly. The pointing bias estimates based on over 1000 boxscans from 26 days show a small case by case variability, which indicates that dedicated solar boxscans from one day are sufficient to characterize the pointing performance of a particular system. An azimuth and elevation range that is covered with this approach is limited and dependent on the time of the year. At Hohenpeißenberg, an azimuth range up to 50–300 was covered around summer solstice and about 90 boxscans were acquired. It is shown that the pointing bias based on solar boxscan data are consistent with results from the operational assessment of pointing bias using solar hits from operational scanning if we take into account the fact that the DWD operational scan definition has only a maximum elevation of 25. The analysis of a full diurnal cycle of boxscans from four operational radar system shows that the azimuthal dependence of azimuth bias needs to be evaluated individually for each system. For one of the systems, the azimuthal variation of the pointing bias of about 0.2 seems related to the bull gear. A difference of the pointing bias for the horizontal and vertical polarization is an indication of beam squint and, eventually, that of a feed misalignment. Beam squint and, as such, the quality of the antenna assembly can easily be monitored with this method during the life-time of a weather radar.
1. Introduction
High azimuth and elevation pointing accuracy of a radar system are important in order to provide a proper geo-referencing of a radar-sampled precipitation range bin. The ISO-norm for weather radars specifies a positioning accuracy of better than 0.1 [1]. A natural source to determine and monitor the pointing accuracy is the sun. Most radar systems include software packages that determine the radar pointing error using a boxscan where the sun is scanned with high azimuthal and vertical resolution. Using the well-known position of the sun at a given time and location, the difference to the indicated position of the sun based on the radar data determines the pointing accuracy of the radar. The difference between solar position and the radar indicated solar position is commonly compensated applying azimuth and elevation offsets. This approach can be considered as an end-to-end method as it considers not only the angle precision relative to the mechanical gear, but also the pointing characteristics of the antenna dish feed assembly [2]. One has to be aware of a number of caveats when interpreting the results from solar boxscans [3]. This involves pedestal leveling, the angle nonlinearity of the gears as well as the encoders, and the backlash of the gear drive system. Furthermore, the interpretation of a solar signal and the position of the sun are dependent on the vertical variation of the refractive index at low sun elevation [4,5]. Naturally, depending on the latitude and season, a limited range of azimuth and elevation angles are available so that methods solely relying on the sun cannot fully characterize the pointing accuracy of the antenna drive system. This implies that methods based on the sun need to be complemented by other engineering methods to obtain a full characterization of the antenna-pointing accuracy. The monitoring of the pointing accuracy in weather radar networks can be achieved by extracting solar hits during operational scanning. Based on the pioneering work of [4,6], this information can be used to determine the pointing accuracy and the receiver sensitivity. This method is now commonly used by weather services operating radar networks [7,8,9].
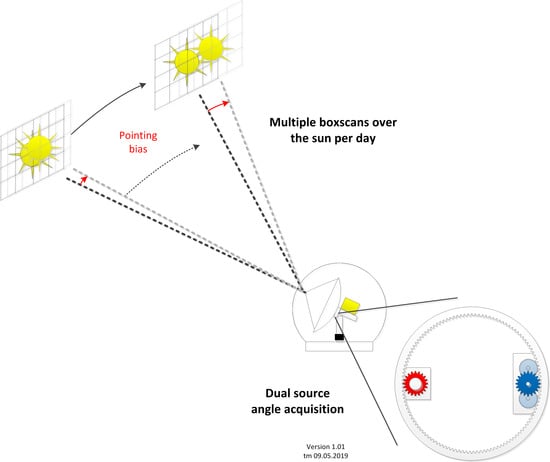
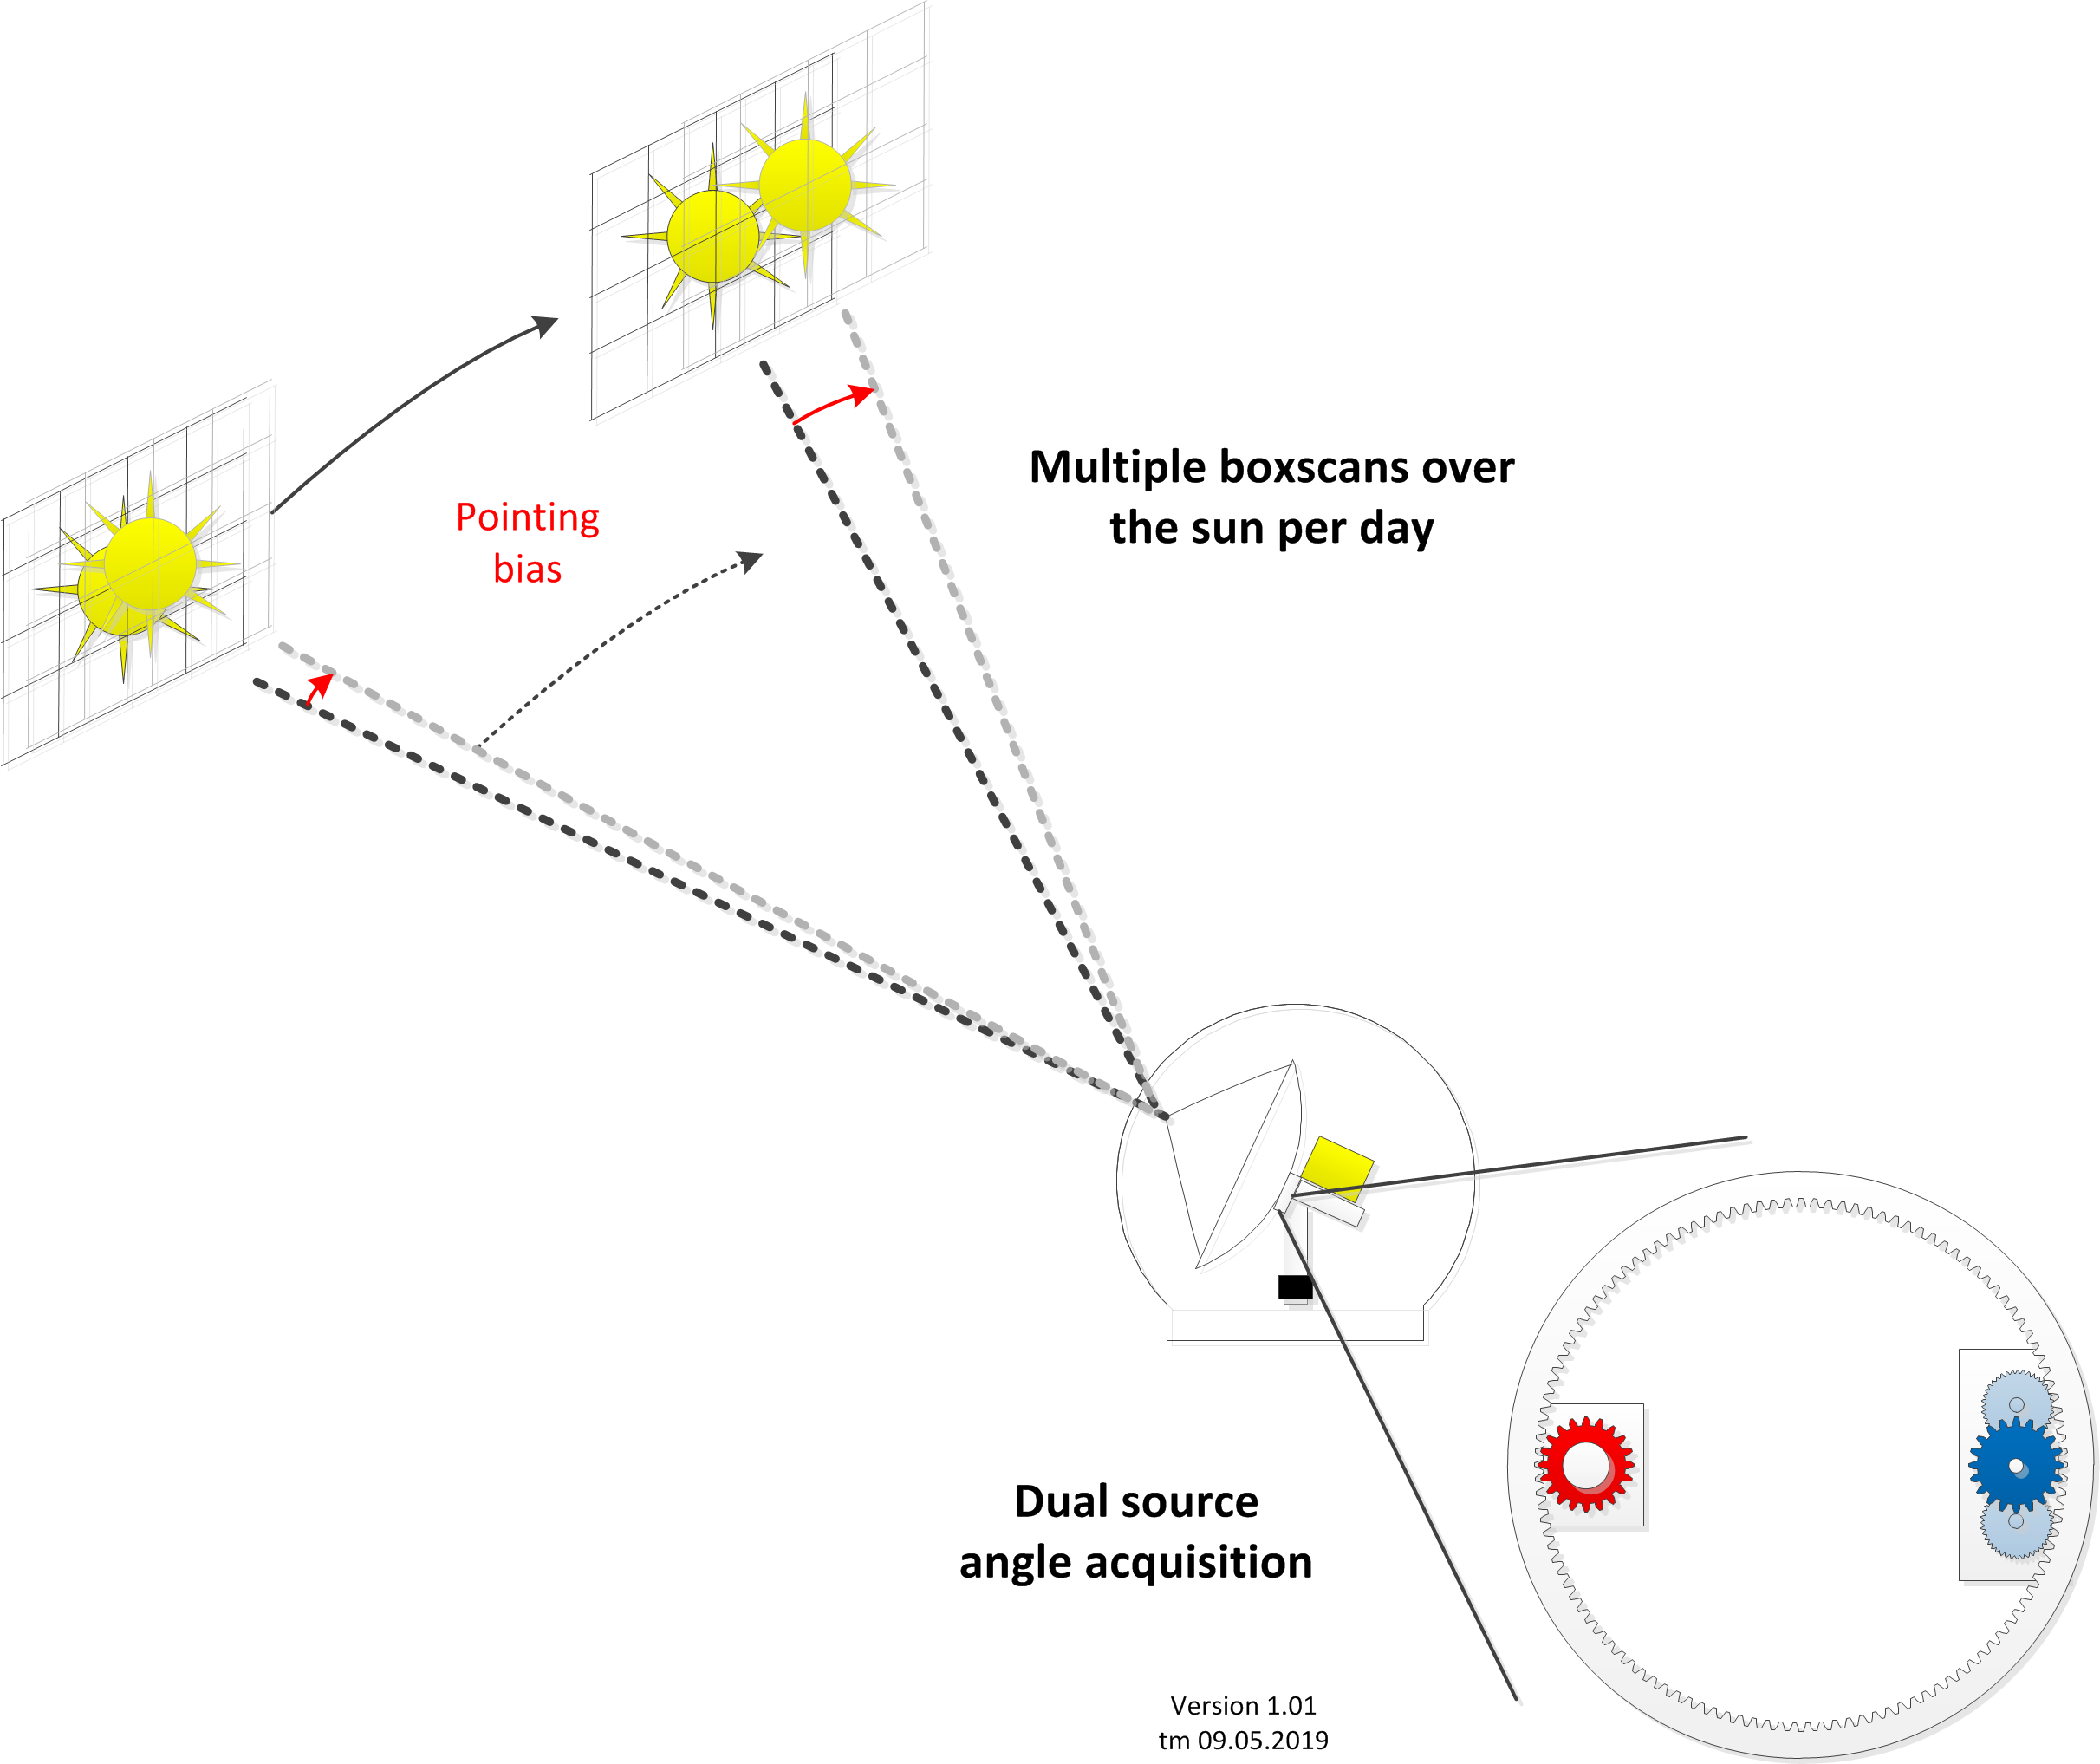
If we consider the sun as a reference, we propose the use of dedicated solar boxscans that are scheduled at a temporal resolution of about 10 min which allows to investigate the azimuthal and elevation dependence of the pointing bias at a angular resolution of about 3 degrees. From those data, we can determine the pointing accuracy of the antenna as a function of azimuth and elevation. Here, we employ the methodology proposed in [4] and [6]. Radar maintenance software which includes a sun track module to determine the pointing accuracy, generally does not offer a automated sequence of sun tracks. In principle, solar boxscans could be integrated in the operational scheduling when there is no precipitation present. Such an event-based adjustment of the scan schedule is not feasible within the DWD weather radar network where spatially and temporal homogeneous data availability across the network is essential. No echo in the data is a valuable source of information to the user as compared to no data at all. Radar data are now used by a multitude of algorithms for e.g., warning management and by numerical weather prediction. Therefore, dedicated diurnal sequences of solar boxscans are proposed as a maintenance procedure every other year or after modifications to the mechanics of the radar system.
For the data set here, up to 90 boxscans are available per day which cover a solar azimuth range of about 50–300 and an elevation range of 0–65 at a angular resolution of about 3. In total, over 1000 solar box scans are used in the analysis. The large number of azimuth and elevation bias estimates provides information about the quality of drive-gear assembly and the accuracy of the angle encoding in relation to the position of the sun. In fact, it provides an end-to-end view on the pointing performance as it includes the antenna assembly because this method uses the same signal path as the normal data acquisition. On the other hand, it can be only viewed as a partial assessment of the gear/drive assembly because of the limited angle range that can be covered by the sun.
The pointing bias results are compared to the operational monitoring of pointing accuracy using the sun hits extracted from the operational scan volumes based on [6]. We also discuss pointing accuracy results from four operational radars of the DWD weather radar network.
This paper is a unique investigation as we are able to perform dedicated scans outside operational scanning by using the DWD research radar which is technically identical to the 17 operational radar systems of the DWD network. This provides insight into the positioning accuracy of a state-of-the-art weather radar system. This work was triggered during the acceptance tests of our radar where tests had to be devised to verify the pointing accuracy specification and to understand the system performance. The paper is structured as follows:
We first introduce elements of a radar system that influence the positioning accuracy of a radar system. This comprises the radar tower, the pedestal and the antenna assembly. Important elements of a radar system are angle encoders which provide the angle reading in elevation and azimuth that are used to tag each transmitted pulse. We discuss the principle encoder characteristics (there are two angle encoder types and therefore two angle sources built into the DWD radar system), the angle data stream and the involved signal processing. These aspects are needed to interpret and understand the results based on the solar box scans.
This is followed by an introduction of the solar boxscan scan strategy and the methodology to determine the pointing accuracy using the position of the sun based on [4]. This methodology is both used for the dedicated solar boxscans and the operational monitoring of the radar based on solar hits which are collected from operational data. We also introduce the beam squint definition which quantifies the pointing mismatch between the horizontal and vertical polarized beam.
We then show and discuss the variation of pointing accuracy as a function of solar azimuth and elevation for two specific days based on dedicated measurements from the Hohenpeissenberg research radar and contrast those results to the bias estimates of the whole data set of more than 1000 solar boxscans. The beamsquint based on those data are computed to assess the characteristics of the dualpol antenna assembly. Bias estimates based on solar boxscans, which are considered as the reference, are then compared to the bias estimates from operational monitoring.
A section is then dedicated to the characteristics of the two built-in angle encoders which can be separately used to tag the pulses with angle data. The relative difference of the computed pointing bias based on data that are tagged by the respective encoder provide insight on the to be expected pointing accuracy depending on the source of the angle data. Furthermore, a boxscan continuously consists of antenna movement in clockwise (cw) and counter-clockwise (ccw) direction. By analyzing only data with cw or ccw movement, we quantify the backlash due to the encoder and the gear-drive assembly.
The methodology of using dedicated solar boxscans is then applied to four operational radar sites of the DWD weather radar network, and the resulting pointing bias estimates are discussed. We then summarize the main findings of this work and provide recommendations in the conclusions.
2. Antenna Pointing
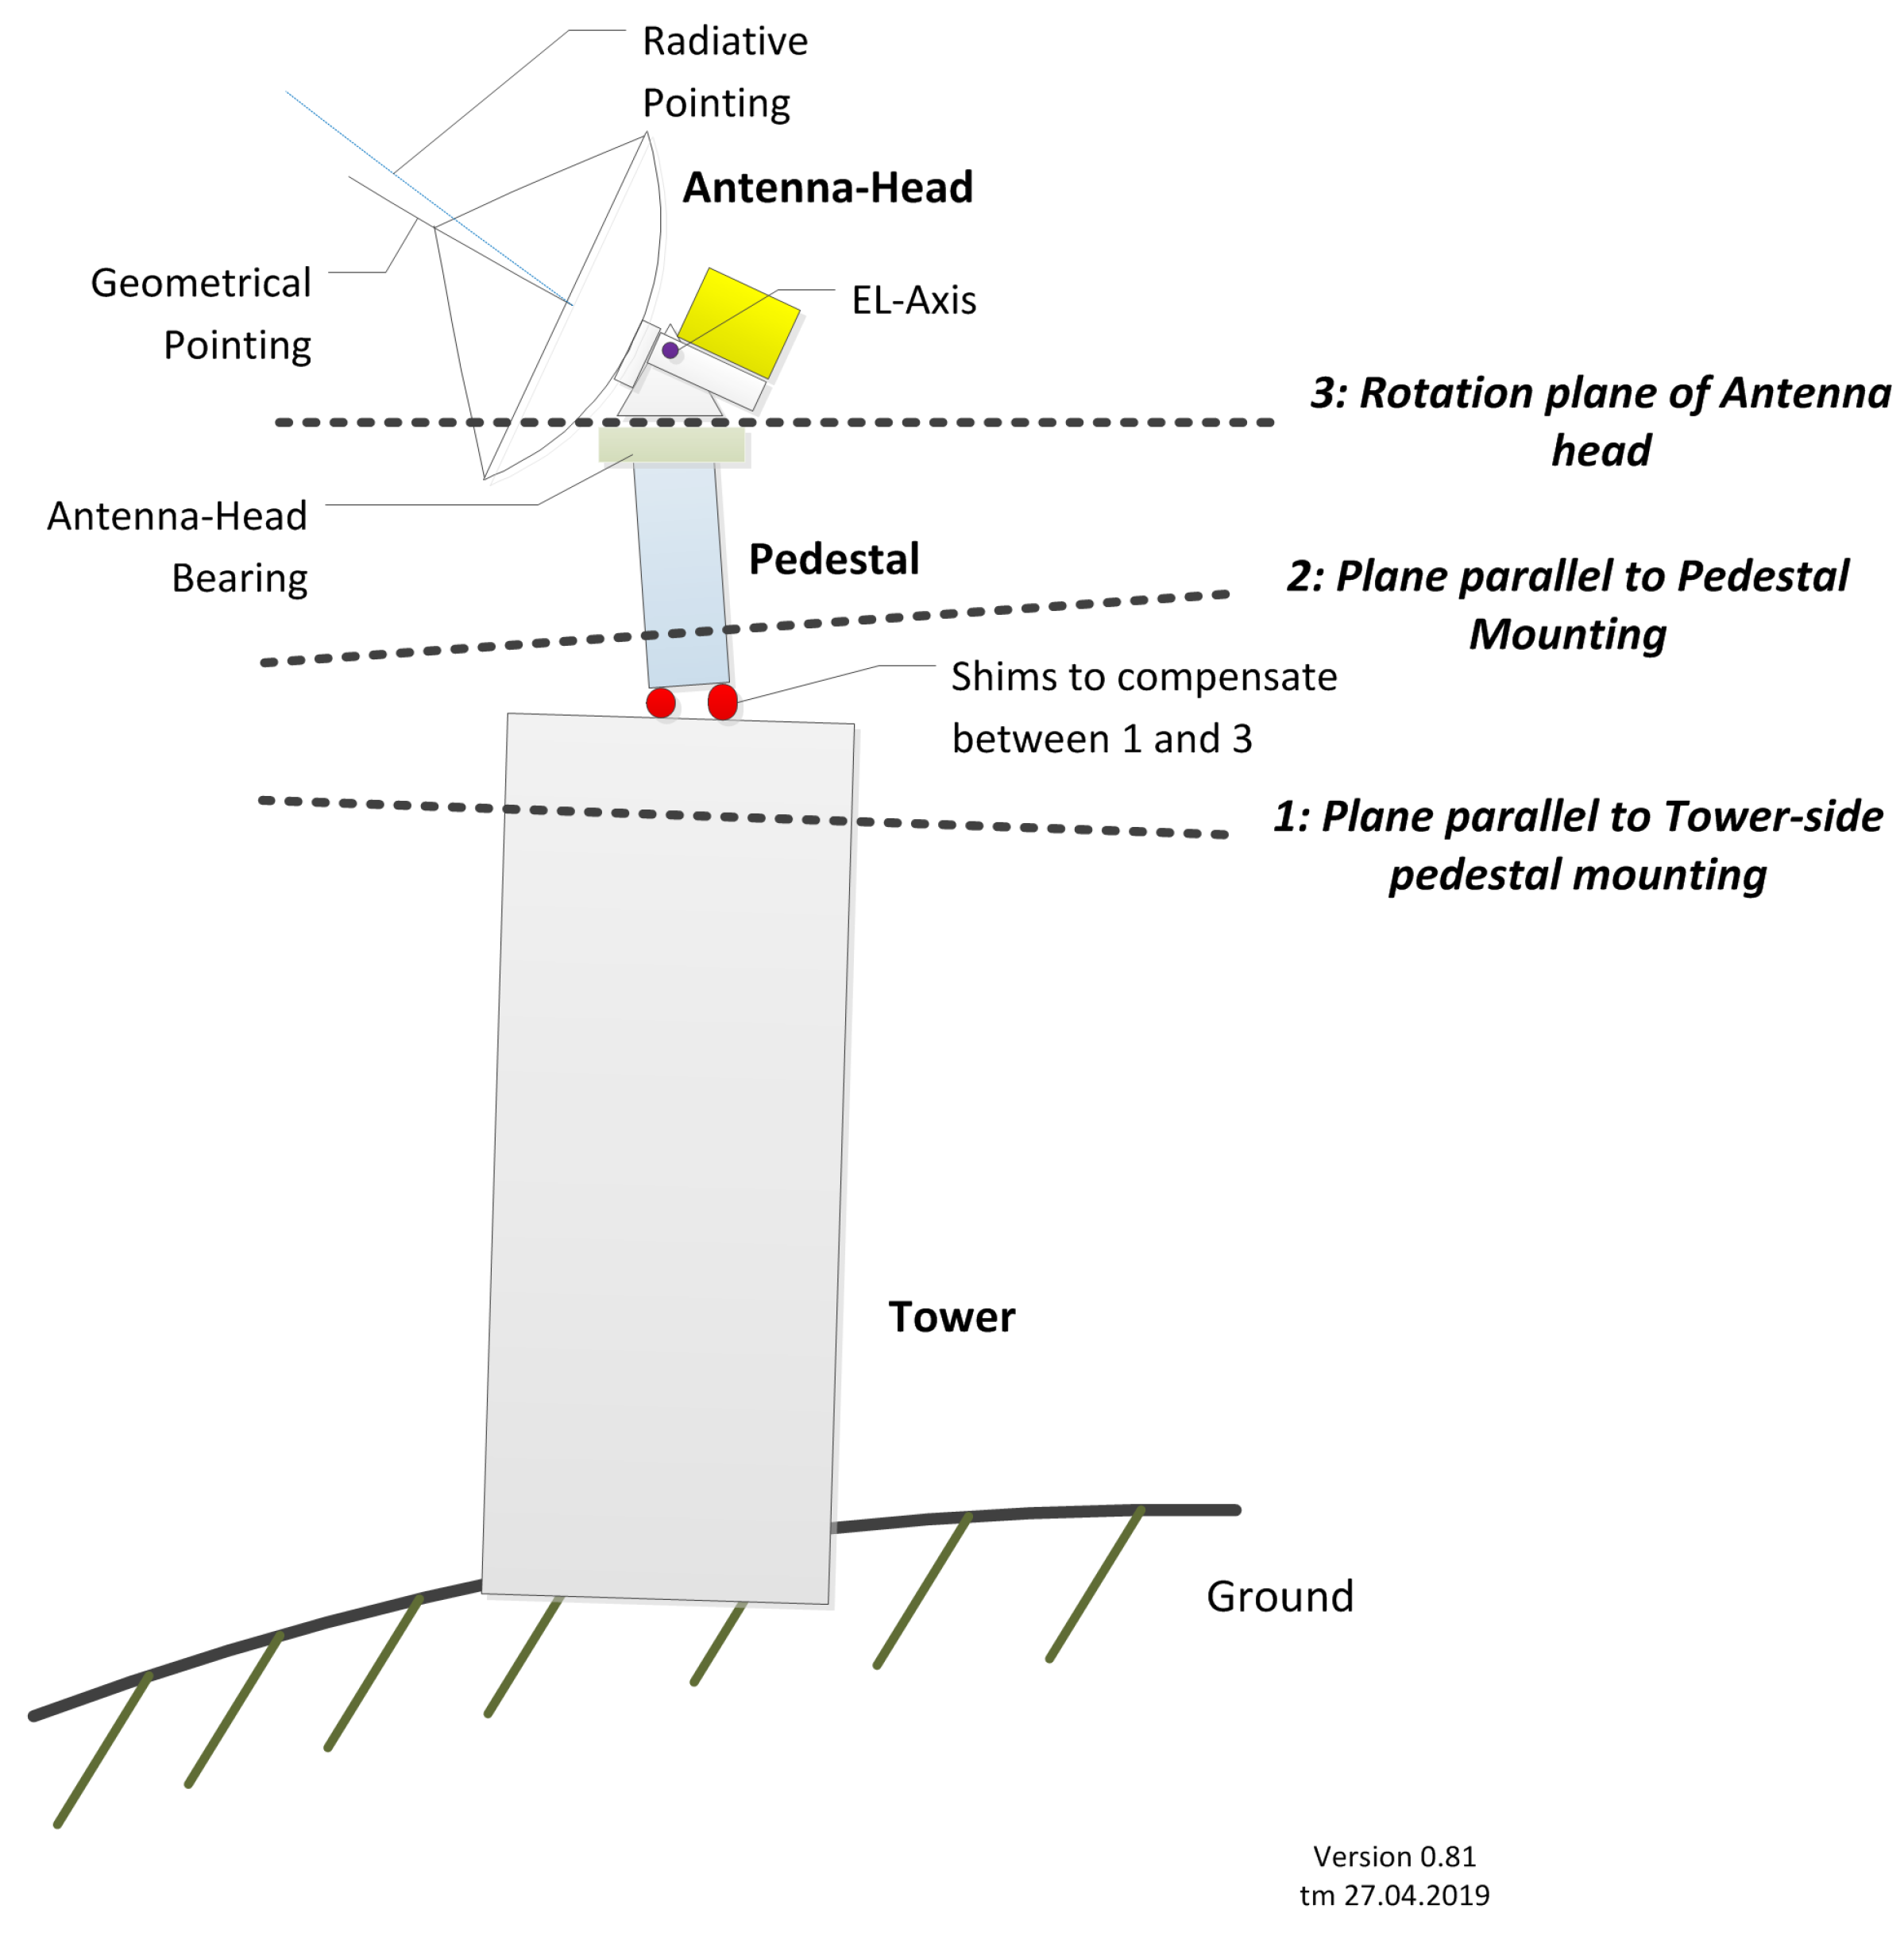
Mechanical drive systems steer a weather radar antenna that is mounted on a pedestal. The reading of the azimuth and elevation angles is relative to the rotation plane. During a radar installation, the rotation plane has to be leveled horizontally. This leveling must consider possible tilts of the radar tower, pedestal and as well as for non-zero angles between the fixed part of the pedestal and the bearing for the antenna head. This is illustrated in Figure 1.
In order to determine the static leveling, we have installed an electronic level parallel to the elevation axis above the azimuth rotation plane. The electronic level must show the same value at all azimuth angles after the proper placement of shims at the interface between the pedestal and radar tower. For our system, the level readings can be accessed remotely and they are stored to keep track on the pedestal leveling. With this method an absolute accuracy of better than can be achieved. During operation, there will be additional time varying tilts, e.g., due to wind load on the tower. Also differential heating of the tower by the sun may result in tilts (we have measured a tilt of >0.1 for a 50 m concrete tower). A method to monitor the leveling of the pedestal by using a sequence of solar boxscans throughout a day is illustrated in this contribution. Other methods are discussed in [3].
Our radar system uses a typical drive to steer the radar antenna. The angle positions are sampled by standard encoders (Figure 2). The drive train has normal gears with some inherent degree of backlash. The absolute encoder itself has anti-backlash gears. Since the drive train consists of normal gears, the adjustment of the pinion gear on the bull gear needs some backlash in order to avoid heavy mechanical stress during operation. Backlash may vary as a function of azimuth and elevation since gears are not precisely circular. The absolute high point of the bull gear in relation to the pinion gear is the reference for the adjustment of minimal backlash. Backlash can be quantified by commanding small angle steps to the motor and then noting the total motor angle step once the the absolute encoder reading changes. This is called the “manual backlash determination”. Since the cogs are not exactly equally distributed over the gear ring, there may be also an angle-dependence of backlash. This is also shown to be true for the anti-backlash gears of the absolute encoder.
There are in principle two angle sources in our system: motor shaft encoder and an absolute encoder (see Figure 2). If the antenna is commanded to a new azimuth position the drive moves the antenna to its new azimuth angle and the motor encoder checks the new angle with the commanded angle. The actual angle value that is used to tag a pulse is recorded by the so called absolute encoder (Figure 3). The absolute encoder samples angles at a rate of 6000 Hz with a theoretical angle resolution of 0.011. The angle readings from the absolute encoder are used to tag each pulse individually. This is done when the received data is digitized. The angle data from the absolute encoder are transmitted through a dedicated serial line to the Intermediate Frequency Digitizer (IFD) where each pulse is tagged with a time stamp and the corresponding angle. This is illustrated in Figure 3. Due to the finite angle sampling, an uncertainty of the angle tagging on the order of ≈0.014 at 18s antenna speed can be expected. In case there is a failure of the absolute encoder we optionally can use the motor encoder angles to tag the pulses with elevation and azimuth angles. Then, the angles are sent to the signal processor via Ethernet. With Ethernet communication an exclusive timely delivery of the angle data cannot be guaranteed, but tests show that this connection can be used as an alternative with sufficient reliability. We mention this here because we will use the relative difference of computed pointing bias from those two options in order to interpret the pointing bias estimates in relation to the drive train system. Those differences have to be known in case the angle acquisition has to be re-configured as a consequence of an absolute encoder failure. Note that the motor angles are from relative encoders, which means that a procedure based on homing sensors is necessary to re-home the antenna after the system was without power. Ideally the navigation performance of a radar should be weakly dependent on azimuth and elevation position. To what degree this is the case will be assessed in this work.
3. Solar Boxscans
The scanning domain of a box scan is centered around the position of the sun at the beginning of the scan. The scan itself takes about 4 min to complete. During this time the scanning domain is not adjusted to account for the movement of the sun. In the analysis of the data we correct for the movement of the sun by computing the position of a ray relative to the sun using the ray time tag from which the position of the sun is computed. The domain of the box has a size of 8 by 5 in azimuth and elevation, respectively. A ray is defined by 128 pulses. With an az-speed of 2/s the ray width is about 0.32 with a PRF of 800 Hz. In elevation we step with 0.1. Range resolution is set to be 250 m and data up to a range of 150 km are acquired.
Prior each boxscan scan a noise sample is taken at the elevation of the sun, and 30 off the azimuth of the sun. The solar boxscan is scheduled every 10 min. Depending on the date, up to 90 box scans are acquired per day. Within a 10 min sequence the sun moves about 3 in elevation and azimuth. The scans were performed when no precipitation was expected during the day. Overcast situations are no limitation to the scans, but most of the time we had clear or only partial cloudy skies. The radar moments for each box scan are saved in a HDF5 format. In this analysis we consider the signal to noise ratio SNRh and SNRv (horizontal and vertical, respectively) which are computed from unfiltered signal power (no Doppler clutter filter is applied) and where only noise is subtracted.
4. Determining Pointing Accuracy from Operational Scanning and Box Scans
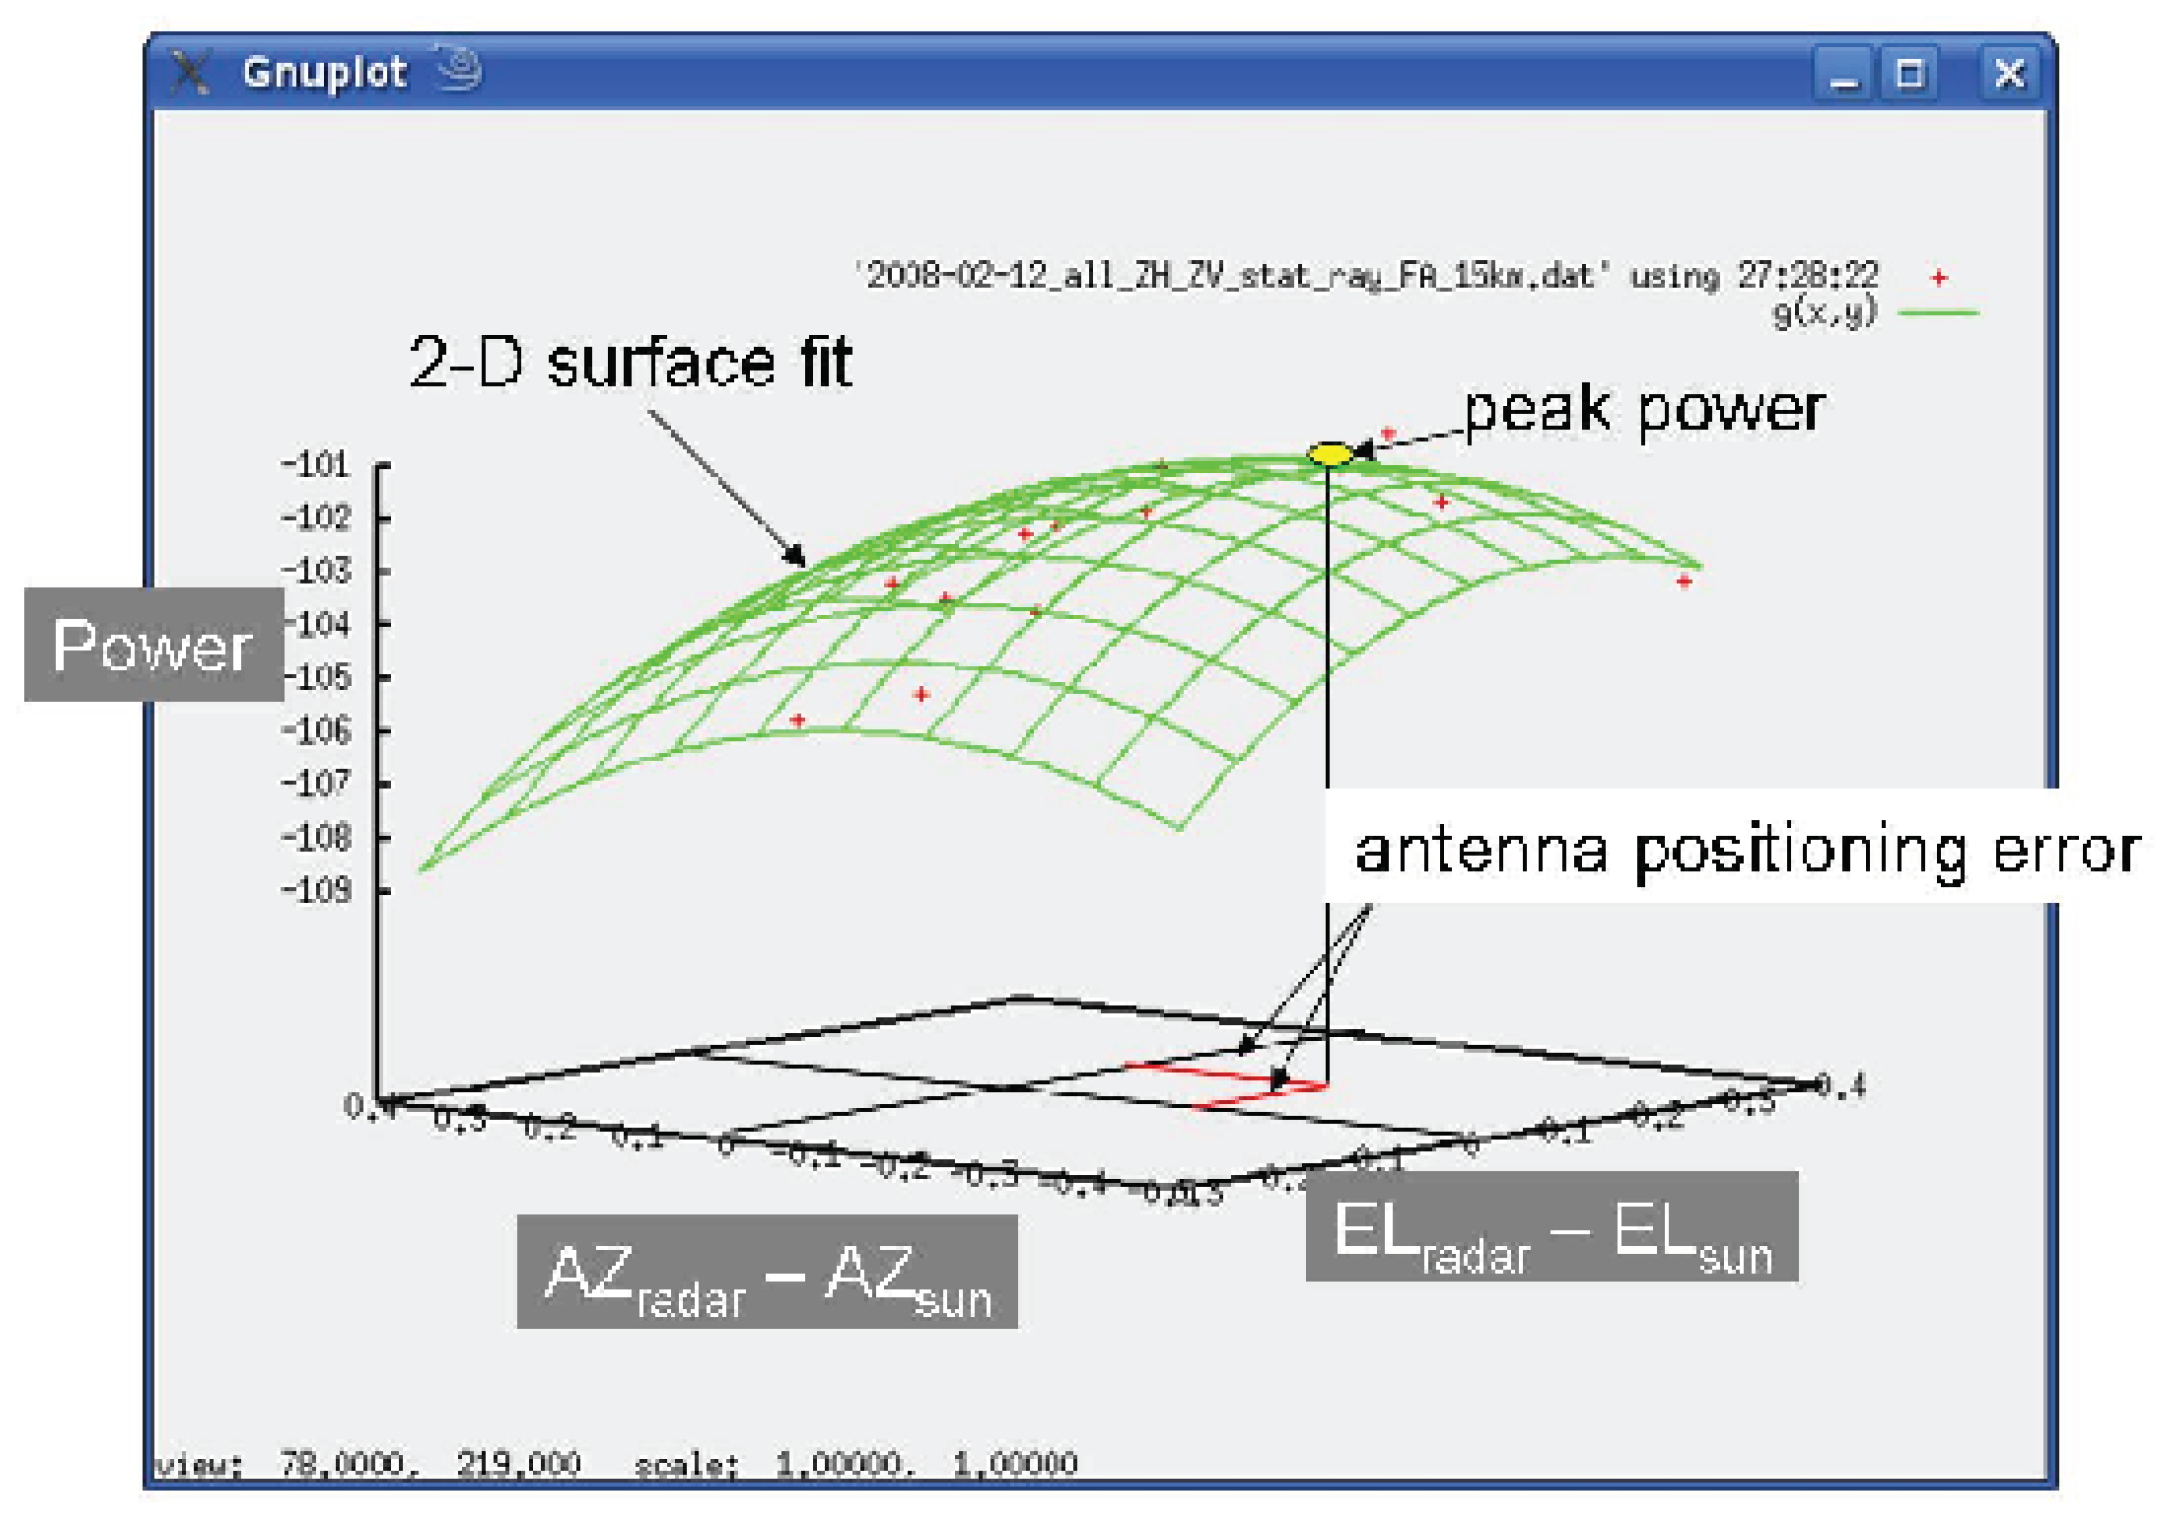
The approach to determine the pointing accuracy based on solar hits during operational scanning is described in [6]. The position accuracy in elevation and azimuth is specified to be better than 0.1 [1]. From a practical point of view this number for example is relevant when optimizing the configuration of the DWD precipitation scan. There, the elevation is azimuth dependent in order to follow the orography as close as possible without being affected by surface clutter. Elevation steps of 0.1 are often sufficient to minimize the clutter signal. Here we summarize the basic aspects of the approach which is also applied to the computation of the pointing error from a solar boxscans. During regular operations there are typically 30 solar interferences with the sun during the day. This is already a sufficient large number of samples to fit a 2-d surface of a Gaussian type to the radar measured solar power in terms of the difference between the antenna position and the solar coordinates, i.e., (Figure 4). The peak solar power is determined from the fitted surface which then can be compared to the independent solar flux measurement [7]. This analysis is carried out independently for both the horizontal and vertical channel and the peak solar power is determined from the fitted 2-d surface (Figure 4). Perfect antenna positioning is found if and . A nonzero value of and quantifies the antenna pointing error. A difference in positioning error between H and V polarization is an indicator for an antenna mis-alignment of the feed in H and V. We define this as the antenna beam squint:
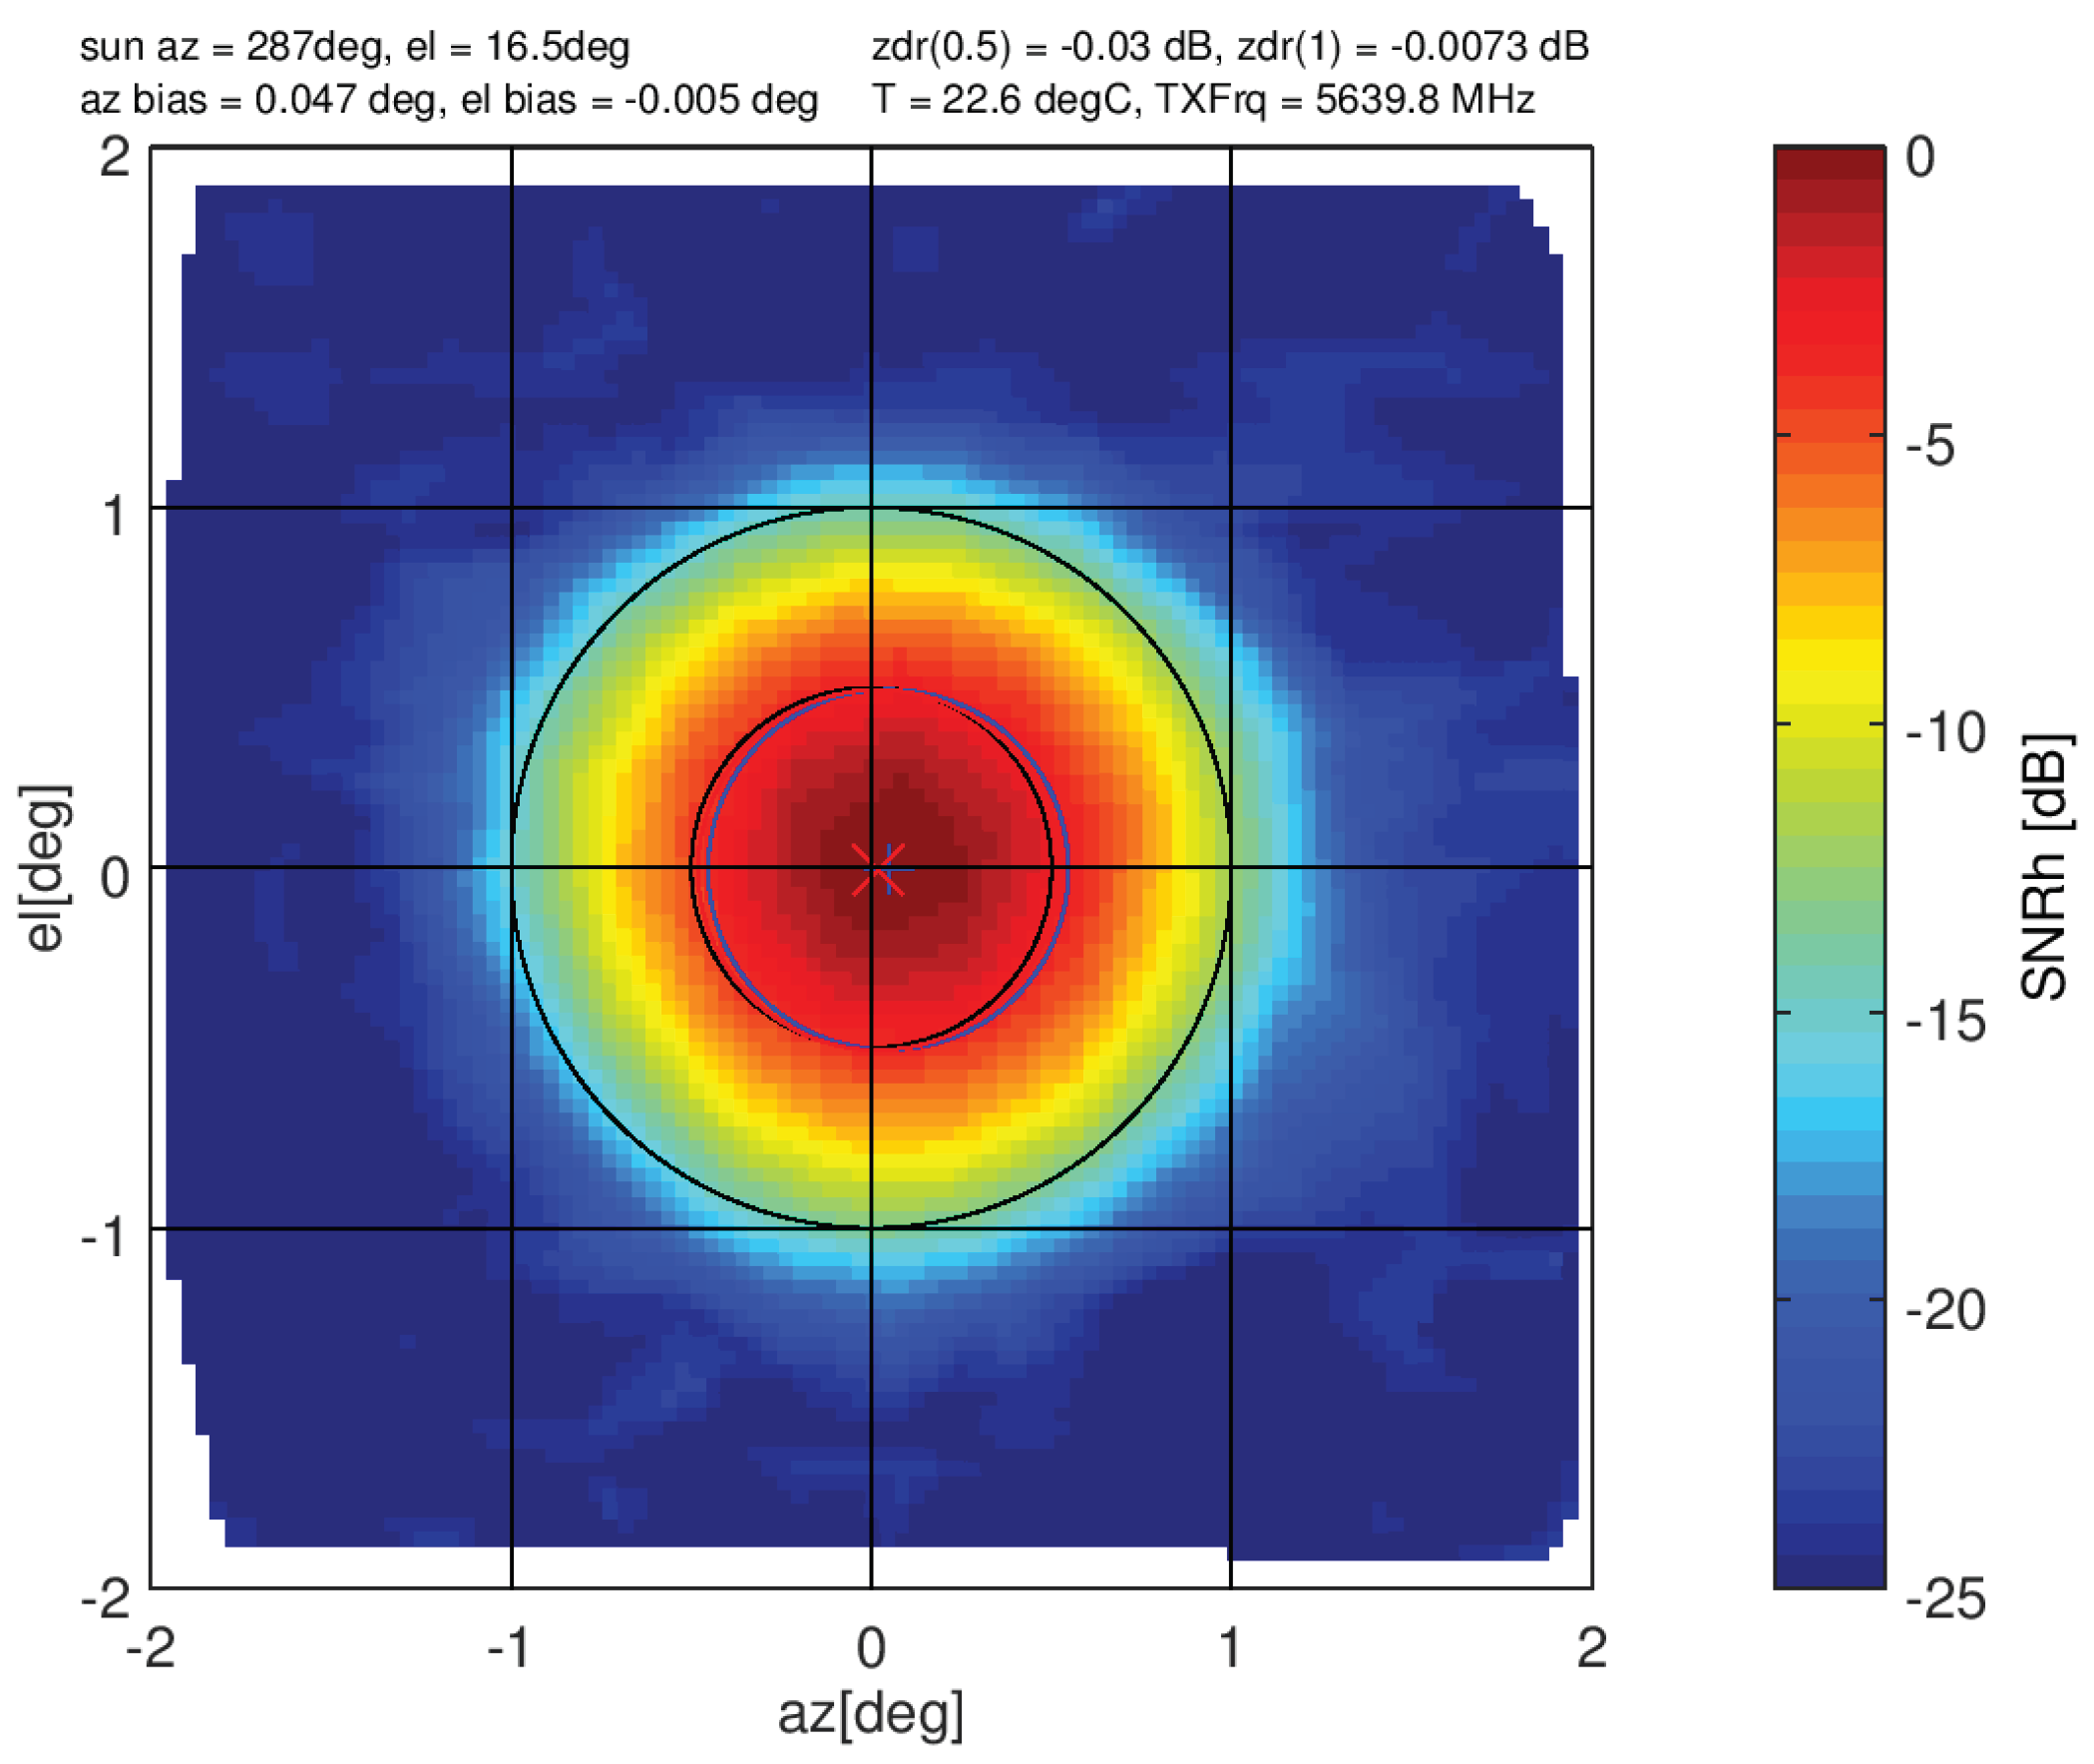
The methodology to characterize pointing accuracy and beam characteristics is applied to both operational data and data from solar boxscans. When processing solar boxscan data, only a range larger 50 km are considered. By doing so it is avoided that clutter may bias the data. However, boxscan domains at low elevation may be contaminated by clutter. Therefore, SNR beamplots have been inspected for spatial SNR fluctuations larger about 1 dB before further analysis. Prior the fitting, a mean SNR is computed from each ray. Each ray is tagged with a synchronized time which is used to calculate the position of the sun. We compensate for the movement of the sun during the boxscan by taking the difference of each ray angle and the corresponding computed solar angle based on the ray time stamp. We then perform the fitting as described above and determine the pointing bias. An example of a solar beam plot of SNRh based on a solar box scan is shown in Figure 5. There, peak SNRh is about 18 dB above noise. Using the aforementioned procedure we have computed the pointing bias based on the location of the peak SNRh. In this example, there is only a small bias which is illustrated by the slight mismatch of the 0.5 circle relative to the circle centered at a relative azimuth and elevation angle of 0, which denotes expected position of the sun. The azimuth bias amounts here to 0.047 and in elevation to −0.005.
5. Pointing Accuracy and Beam Squint from Boxscans
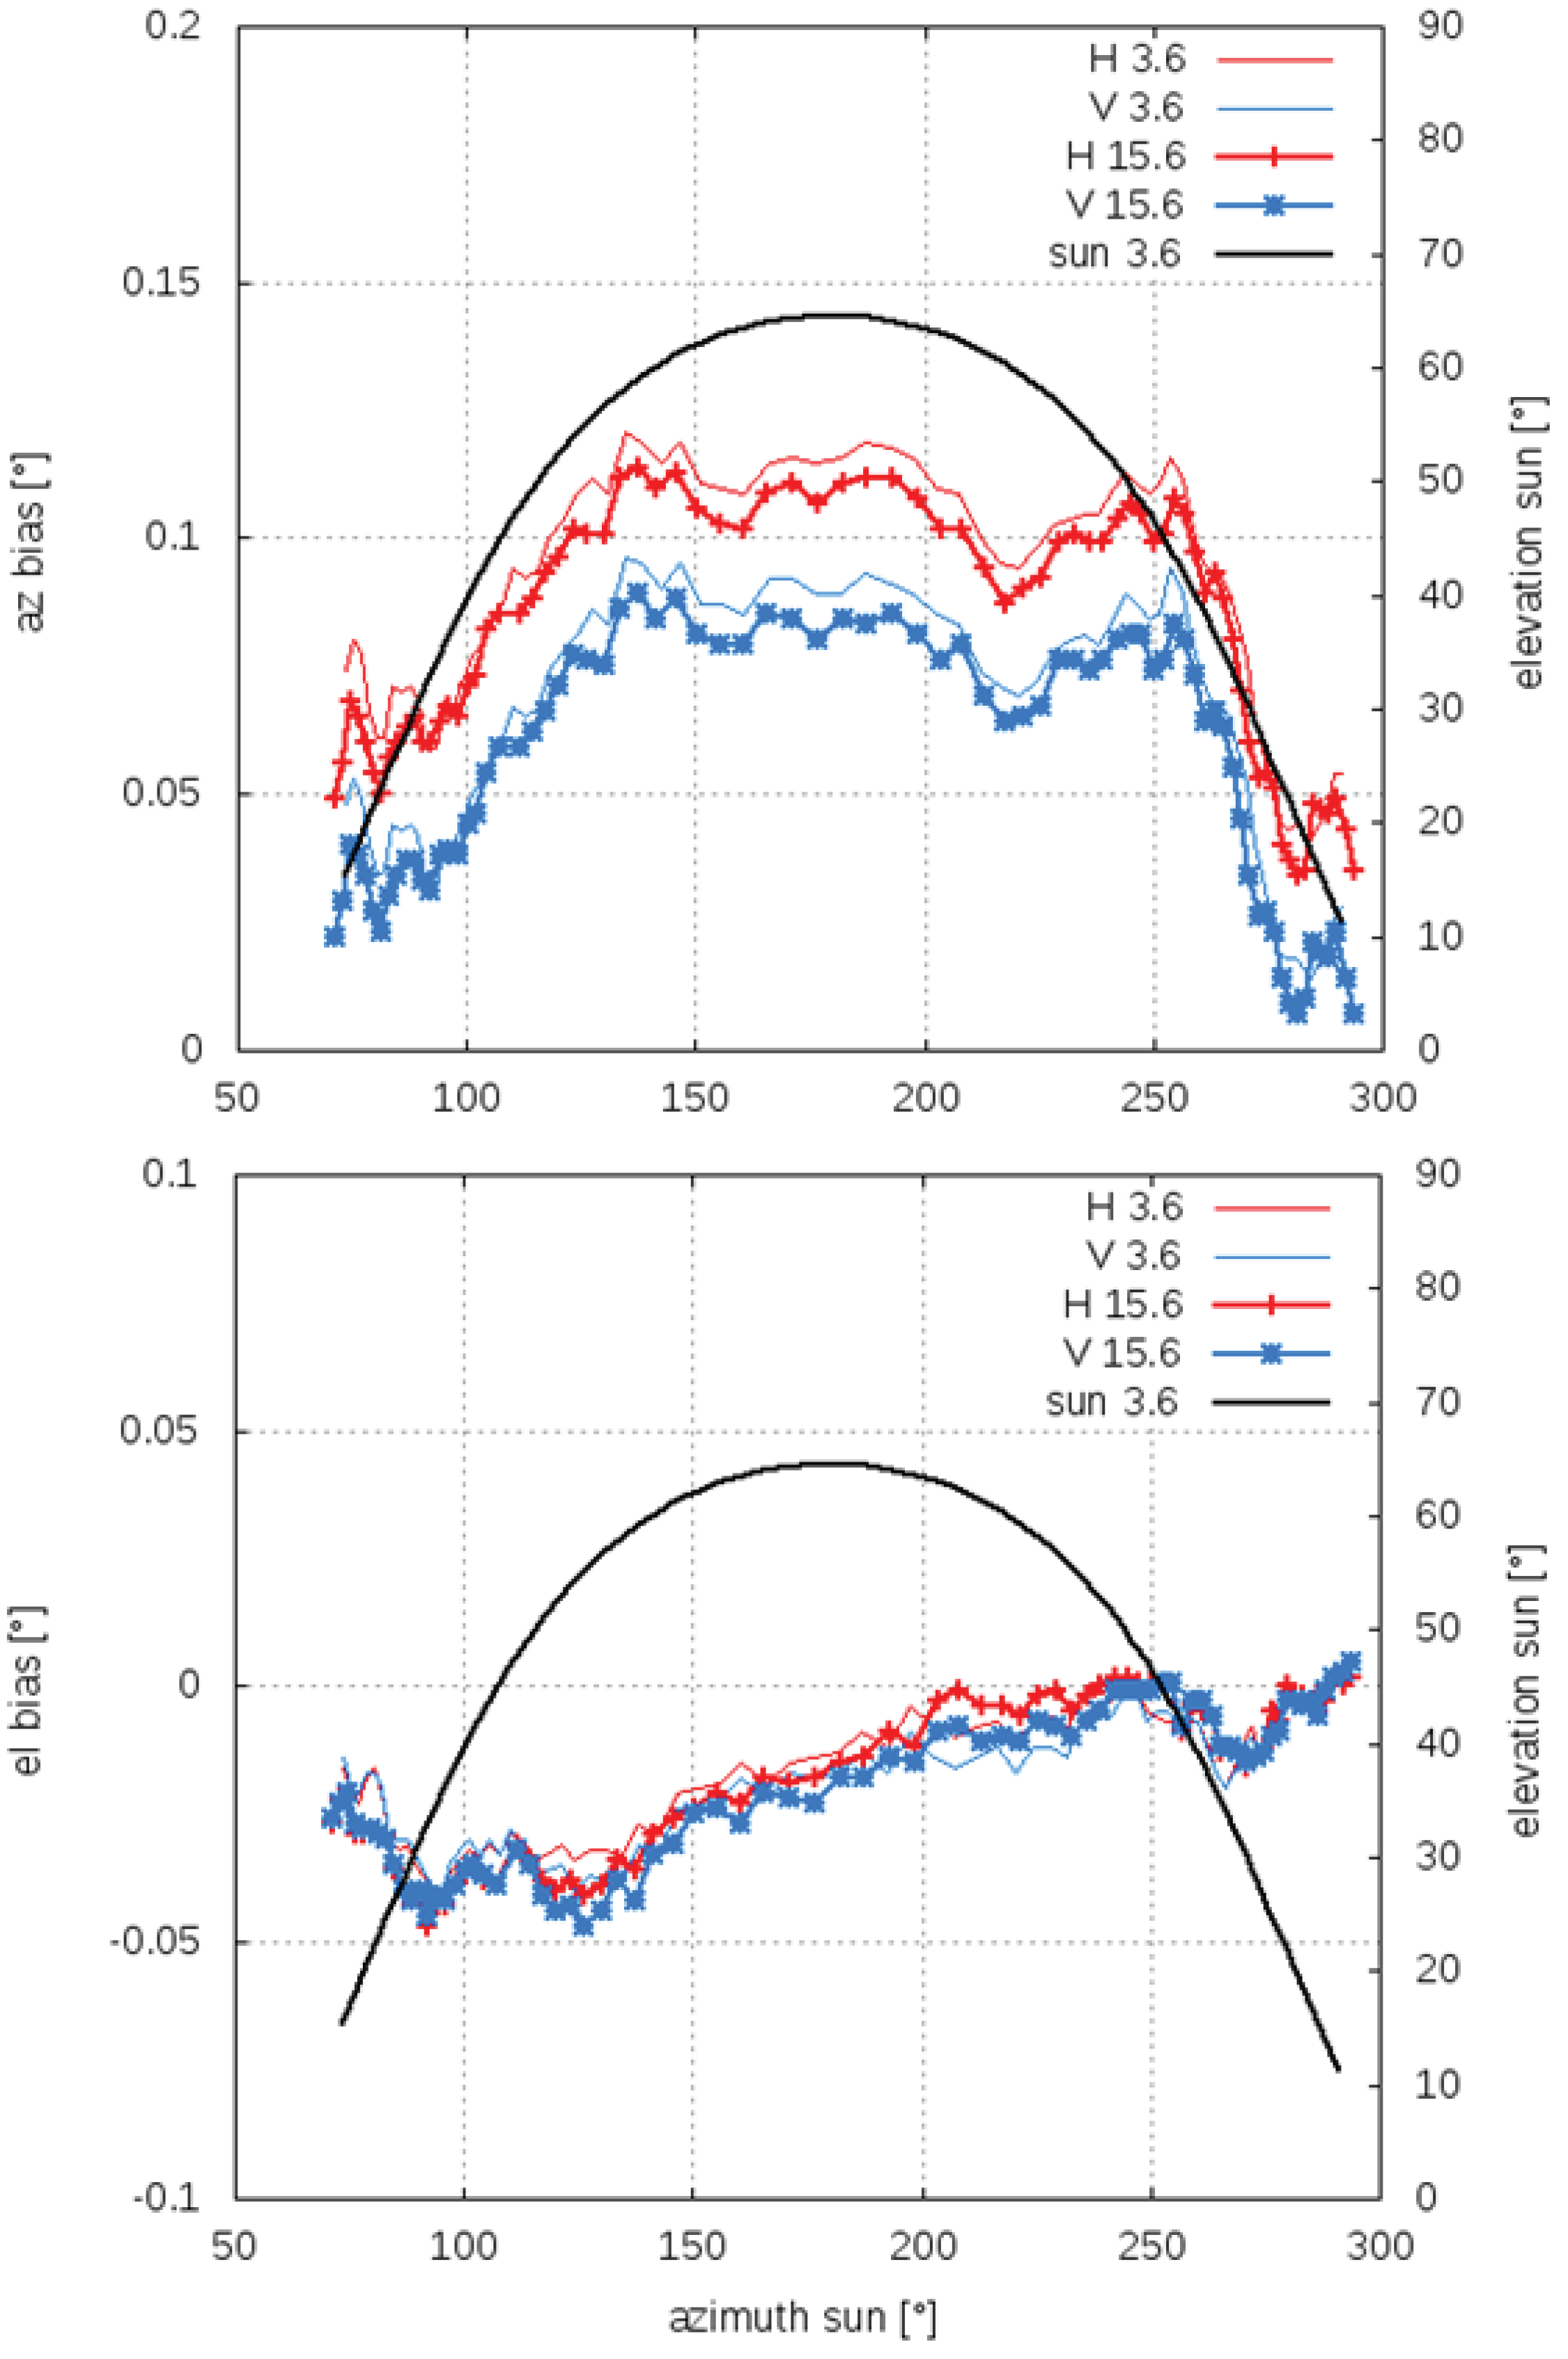
We first discuss the time series of pointing accuracy in azimuth and elevation on 3 and 15 June 2018. The time series of azimuth and elevation bias as a function of solar azimuth are shown in Figure 6. Only data from solar elevations larger than about 10 are shown. This is done in order to minimize the influence of possible strong refractive index gradients at low elevations and the influence of surface clutter. For the horizontal polarization the azimuth bias varies between 0.05 and 0.12. The azimuth bias for the vertical polarization follows a similar pattern, but is separated by a constant offset of about −0.02. The elevation bias varies between −0.005 to 0.0 while the results for the two polarizations are essentially identical. We observe a quasi linear trend in elevation bias, which, though small, is indicative of a slightly tilted pedestal. With respect to the target accuracy of 0.1, the elevation bias is within acceptable limits. The azimuth bias reaches the limits of 0.1 depending on azimuth position which means that an adjustment may have to be considered.
An important aspect is, that the pointing bias is not independent of azimuth position. A perfect gear drive assembly would assume a constant bias as a function of azimuth position. Mechanically this is difficult to achieve, and dependent on the accuracy requirements, a bias correction as a function of azimuth and elevation may be introduced [3]. This is commonly done in the field of satellite communication where substantially stricter pointing accuracies must be achieved.
The difference in azimuth bias in H and V denotes the beam squint (see Equation (1)). The beam squint as a function of solar azimuth for 3 and 15 June 2018 are shown in Figure 7. Our antenna specification asks for a beams quint smaller 0.06 [10]. For this dish the beams quint is smaller 0.03 and is well within the specifications.
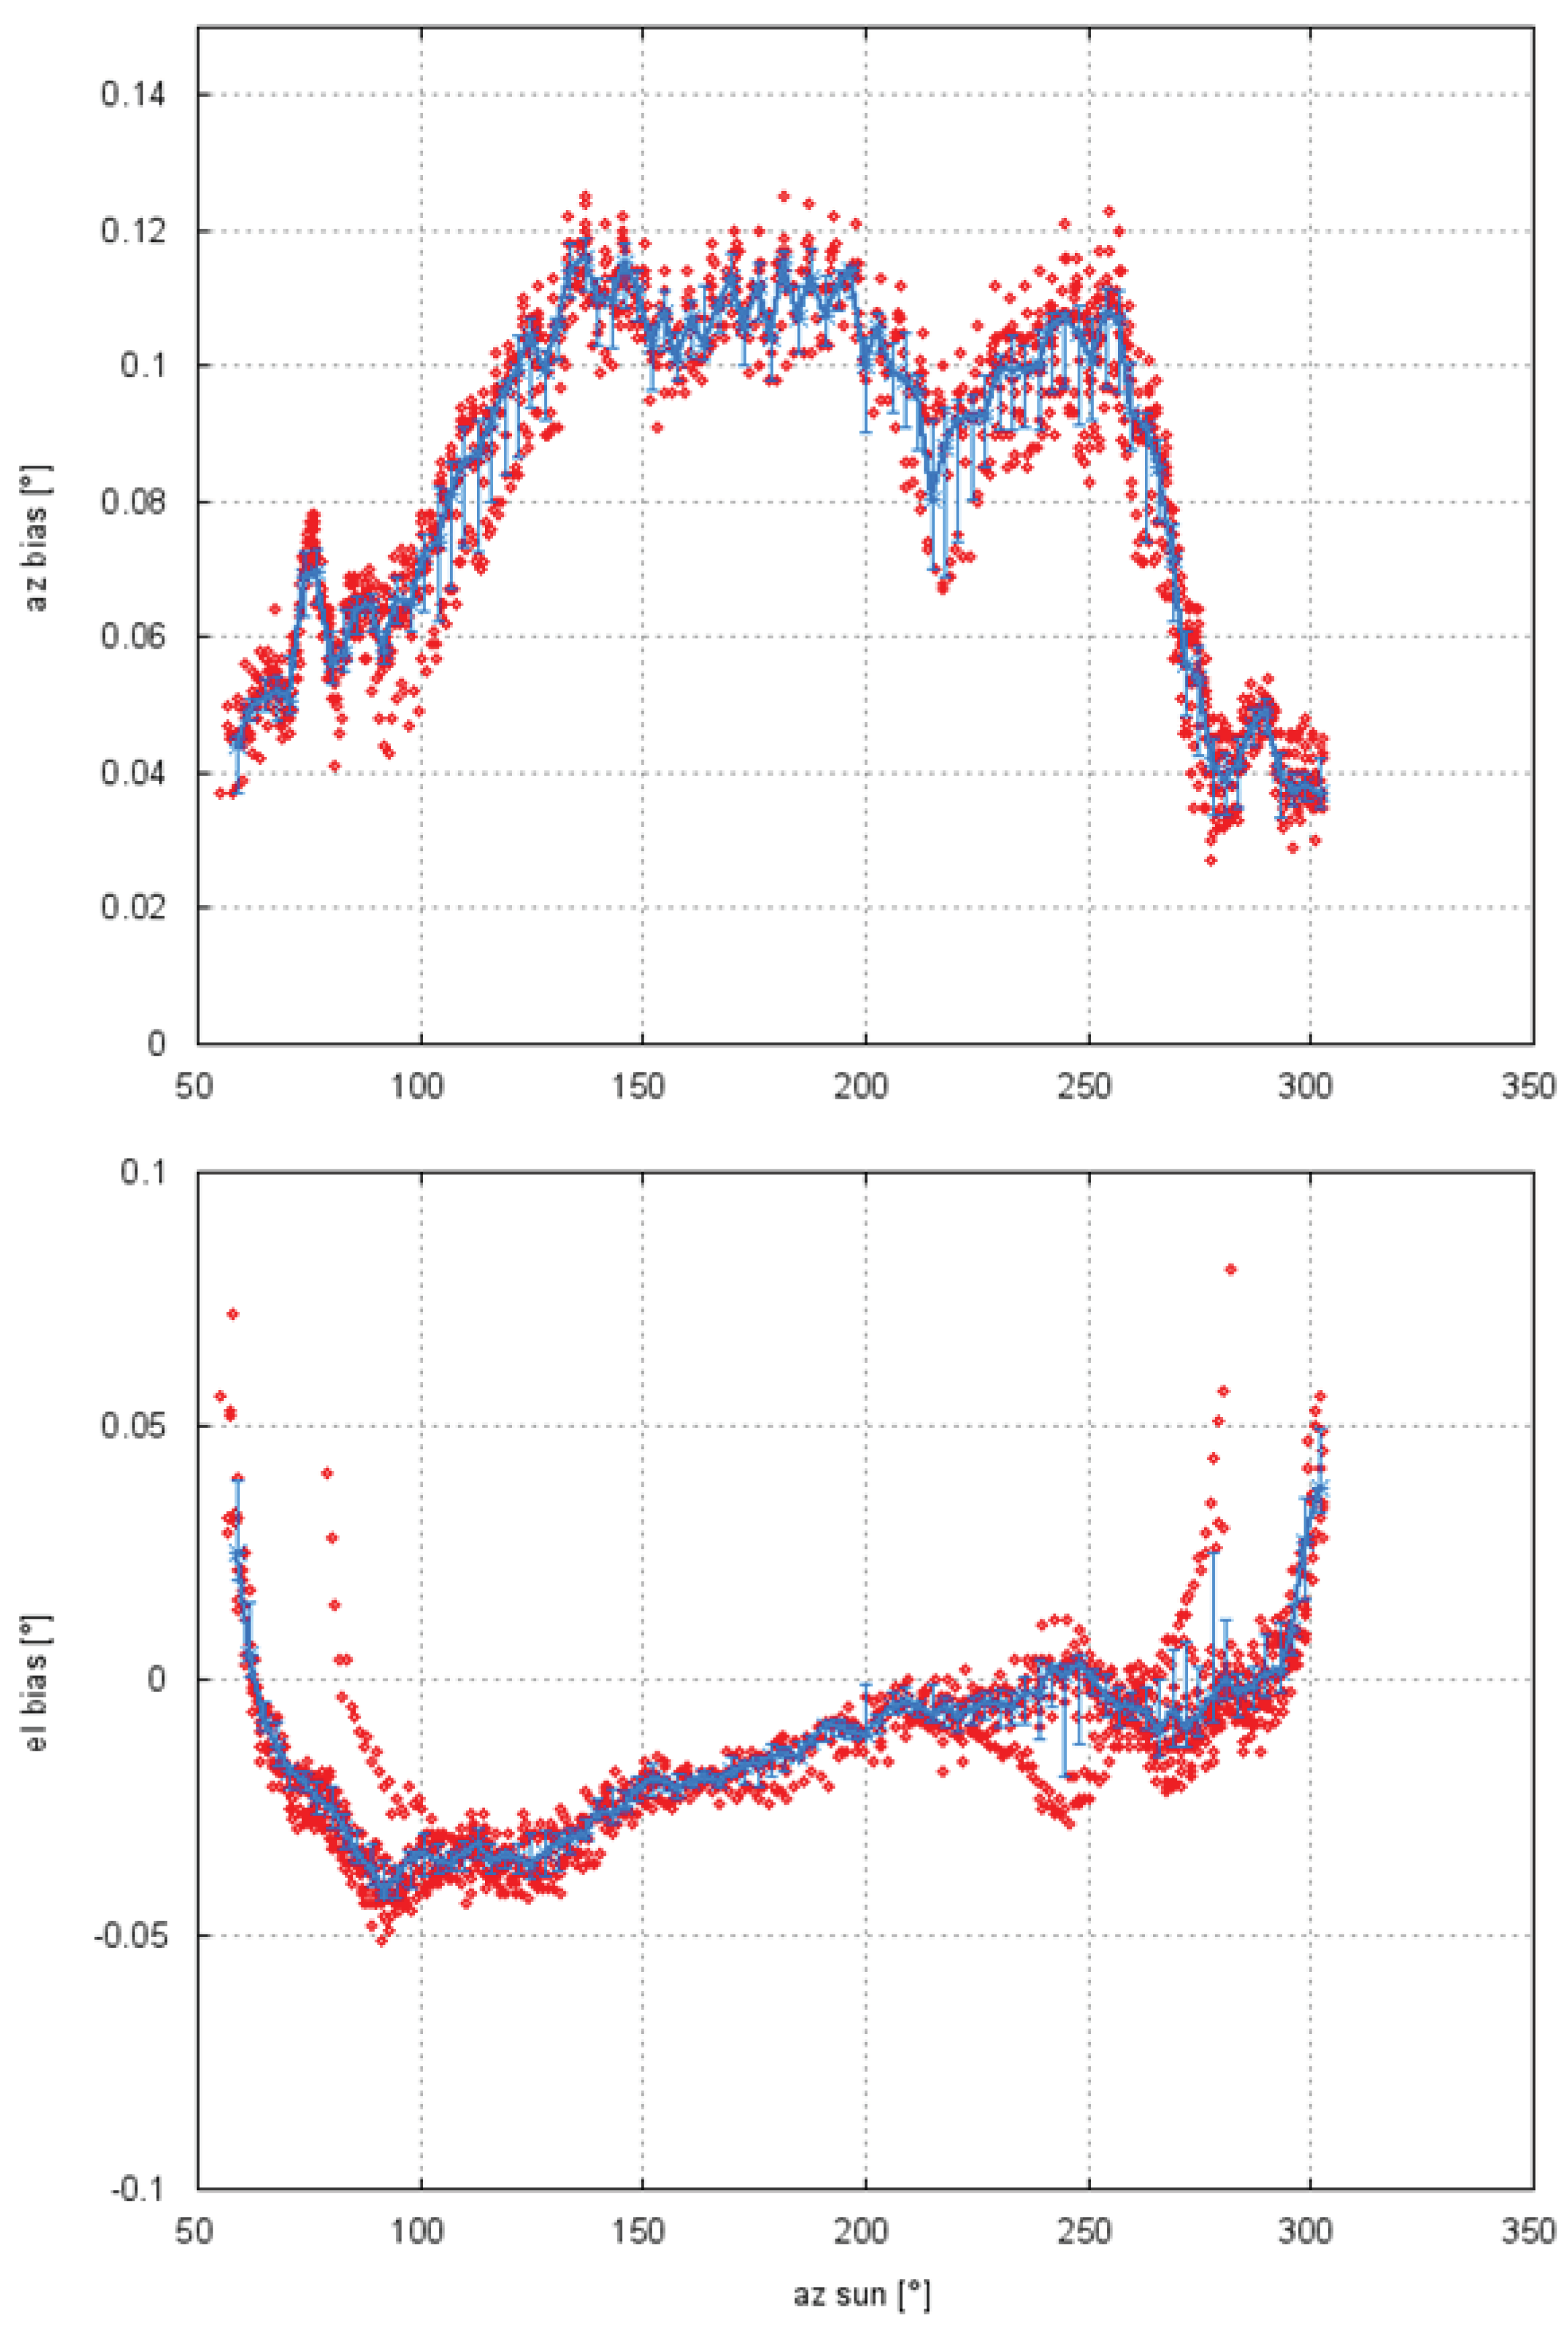
The two cases used here are within the overall bias estimates we have computed from over 1300 boxscans between June and August 2018 (Figure 8). The majority of scans were acquired between 10 June and 8 July 2018. Additional scans were performed on 27 and 28 August 2018. Those two days stick out in the plot of elevation bias estimates as they cover a narrower solar azimuth range as compared to the June data. Nevertheless, the August data show a azimuth dependence of elevation pointing bias that is consistent with the rest of the data. At low elevations (lower than 10, compare with Figure 6), there is an increase of elevation bias that may be in part due to refractive index gradients. When determining the position of the sun, a profile of refractive index for a standard atmosphere is used which always is an approximation of a real refractive index profile [11]. However, the values of elevation bias from different days (Figure 8, lower panel) show a small spread in the morning and evening, which implies that the diurnal variation of the refractive index profile is small. Especially the fact that the morning and evening biases have a similar spread, this suggests a weak sensitivity on the assumptions of a refractive index profile. From a typical diurnal boundary layer cycle we would expect a larger variation of the elevation bias in the morning due to the larger gradients in the refractive index depending on the evolution of the nocturnal boundary layer. The magnitude of the gradient depends on the associated predominant processes of a nocturnal boundary layer which determine the vertical profiles of temperature and humidity [12]. In the evening, it is a fair assumption, that the boundary layer is well mixed in temperature and humidity, so that the gradients in the profile of refractive index are expected to be small. The weak sensitivity on the profile of refractive index may be explained by the location of the radar. The Hohenpeißenberg site is a mountain station situated in the relatively flat Alpine foreland (the height difference is about 400 m). Therefore, this site is often above possibly strong inversion layers so that anomalous radar beam propagation is less likely. To conclude, it is argued that the estimate of the azimuth bias here is not sensitive to the assumption related to the refractive index profile so that the variation of the azimuth bias as a function of azimuth angle can be attributed to the mechanics of the gear drive assembly (Figure 8, upper panel).
6. Pointing Bias from Operational Solar Monitoring Compared to Solar Boxscan Results
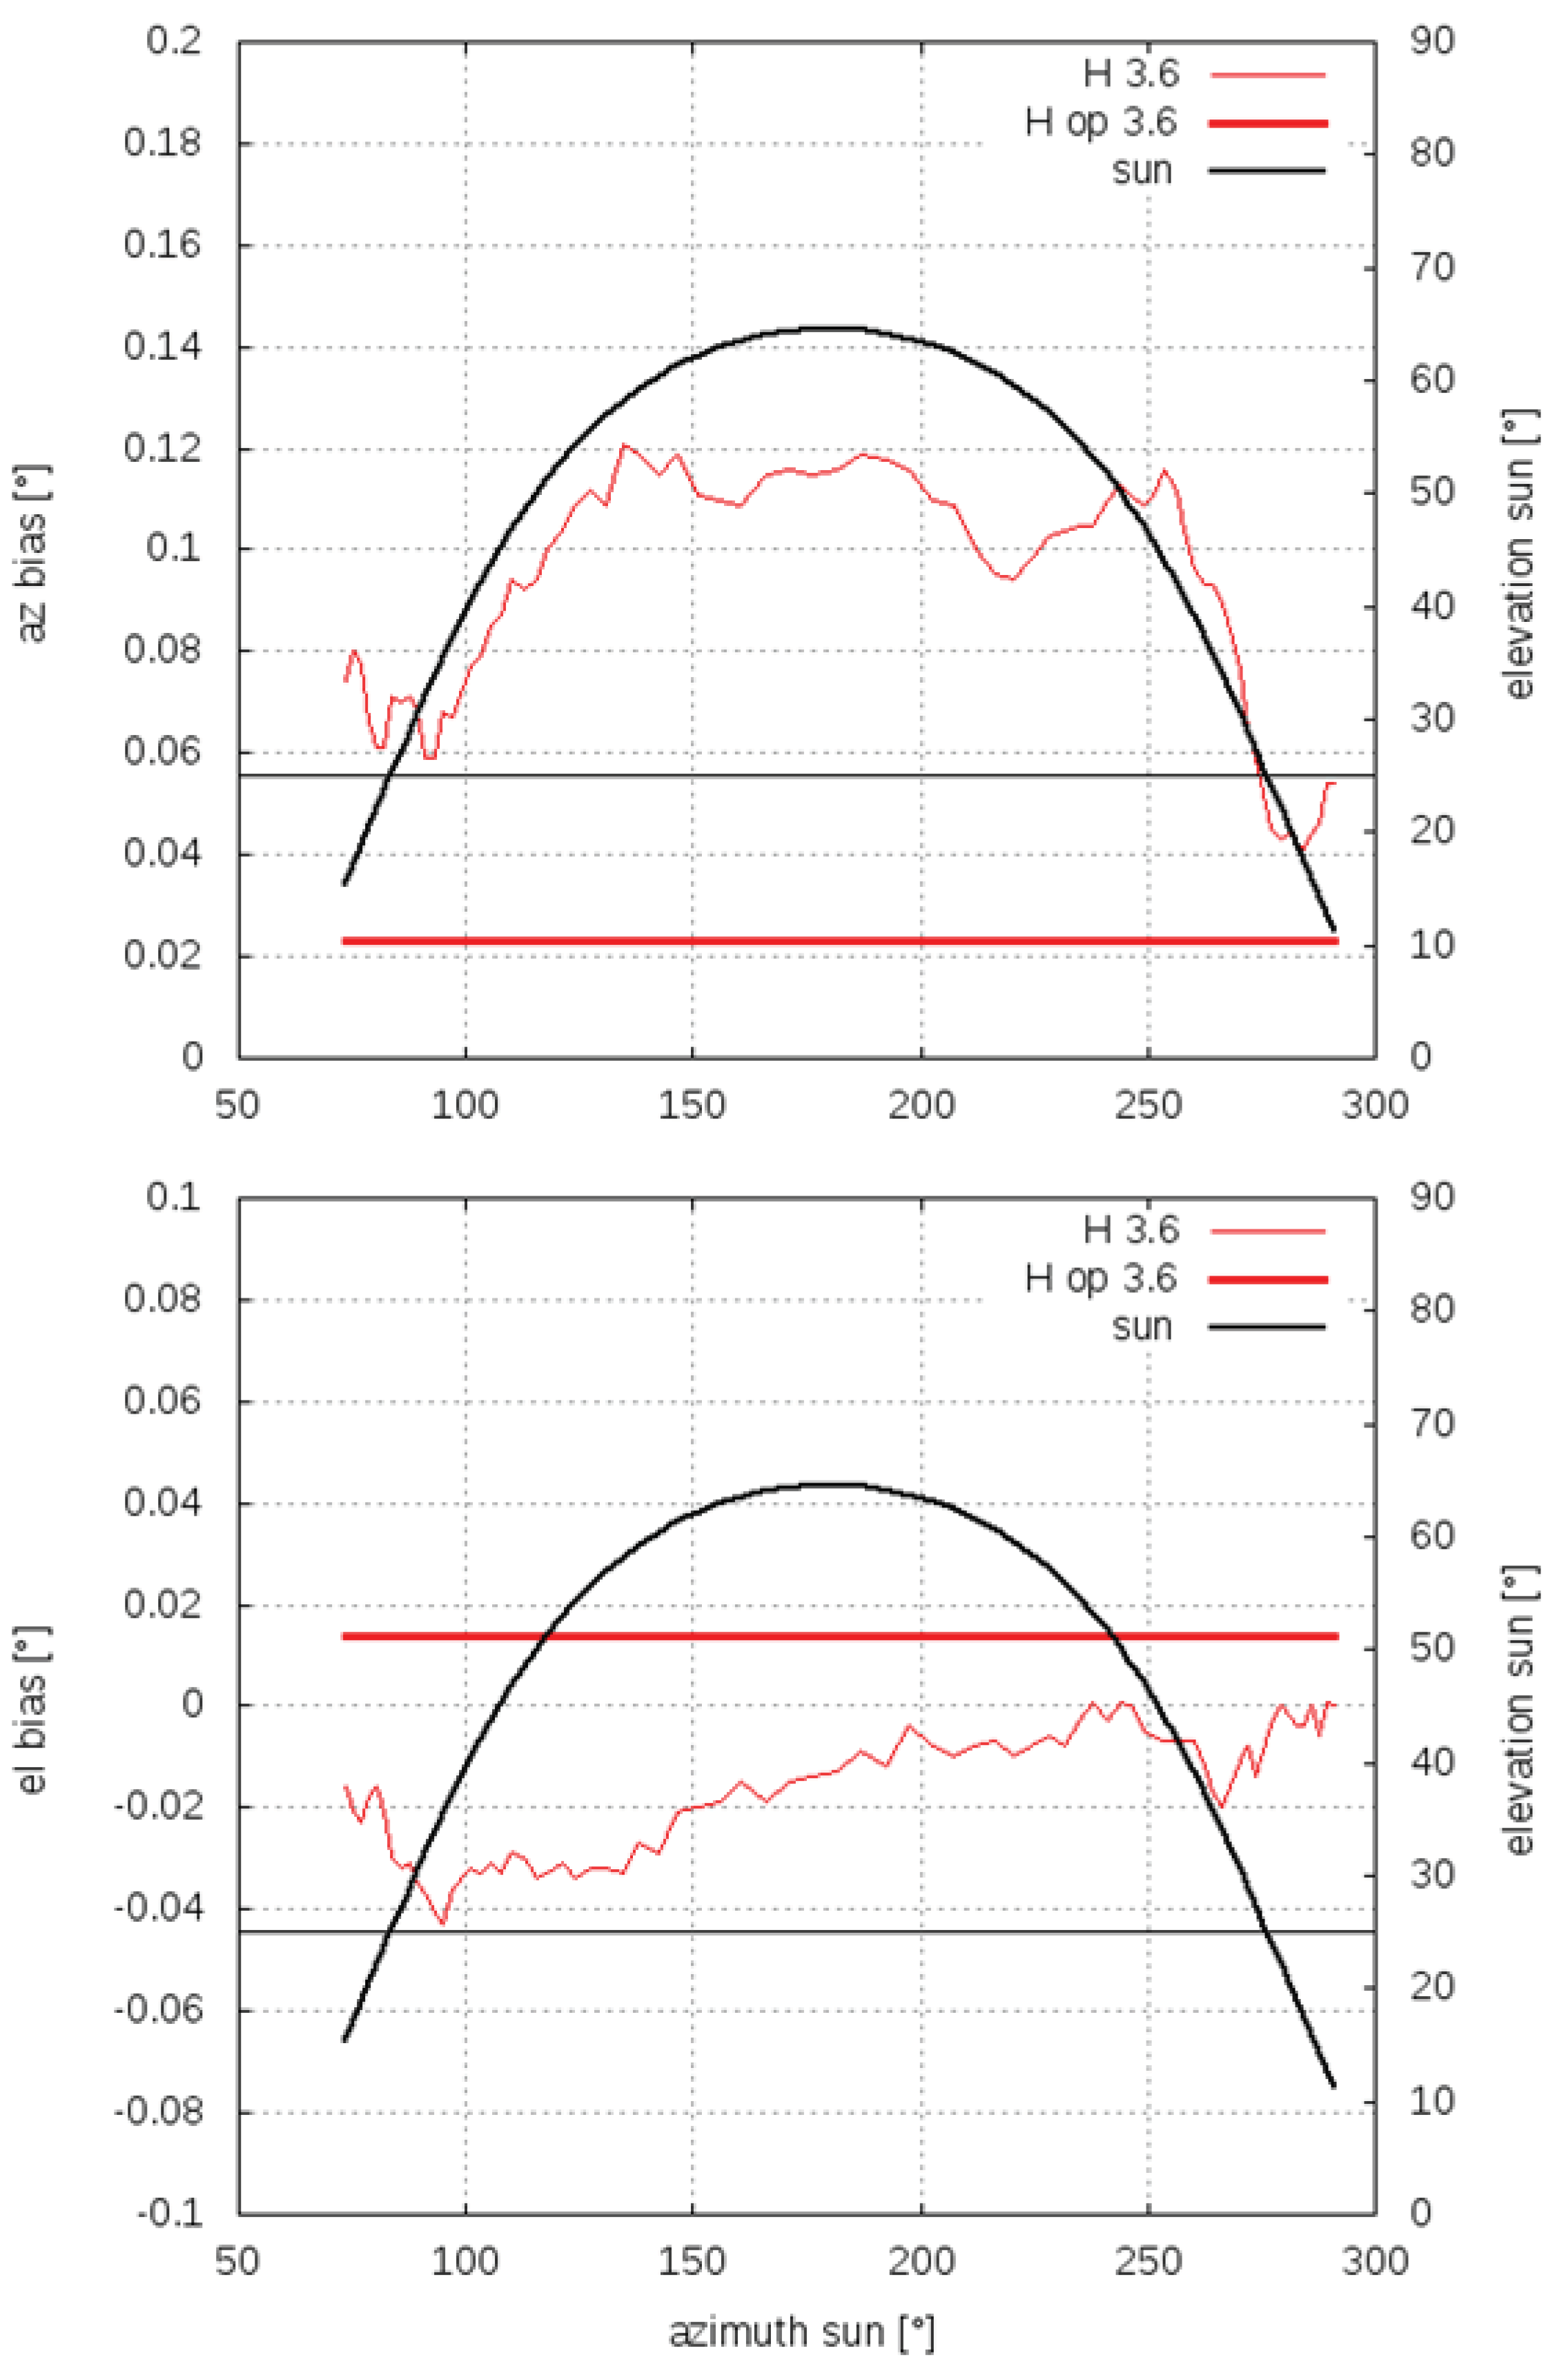
The bias estimates based on the solar boxscans are now compared to the bias estimate based on the evaluation of solar hits extracted from operational scanning [7]. The results are shown in Figure 9. We are considering the results from horizontal polarization, on 3 June 2018. For azimuth pointing bias, the operational analysis indicates a bias of 0.02 (constant red line in Figure 9; there is only one bias estimate per day from operational monitoring). This value has to be compared to the bias estimates from boxscans taken at an sun elevation lower than 25, which corresponds to the highest elevation of DWD’s operational scan pattern. This elevation limit is given by the contant black horizontal line in Figure 9. So for elevations below 25, the azimuth bias in the morning is around 0.07 and 0.04 in the evening, which agrees well with the operational estimate of 0.02.
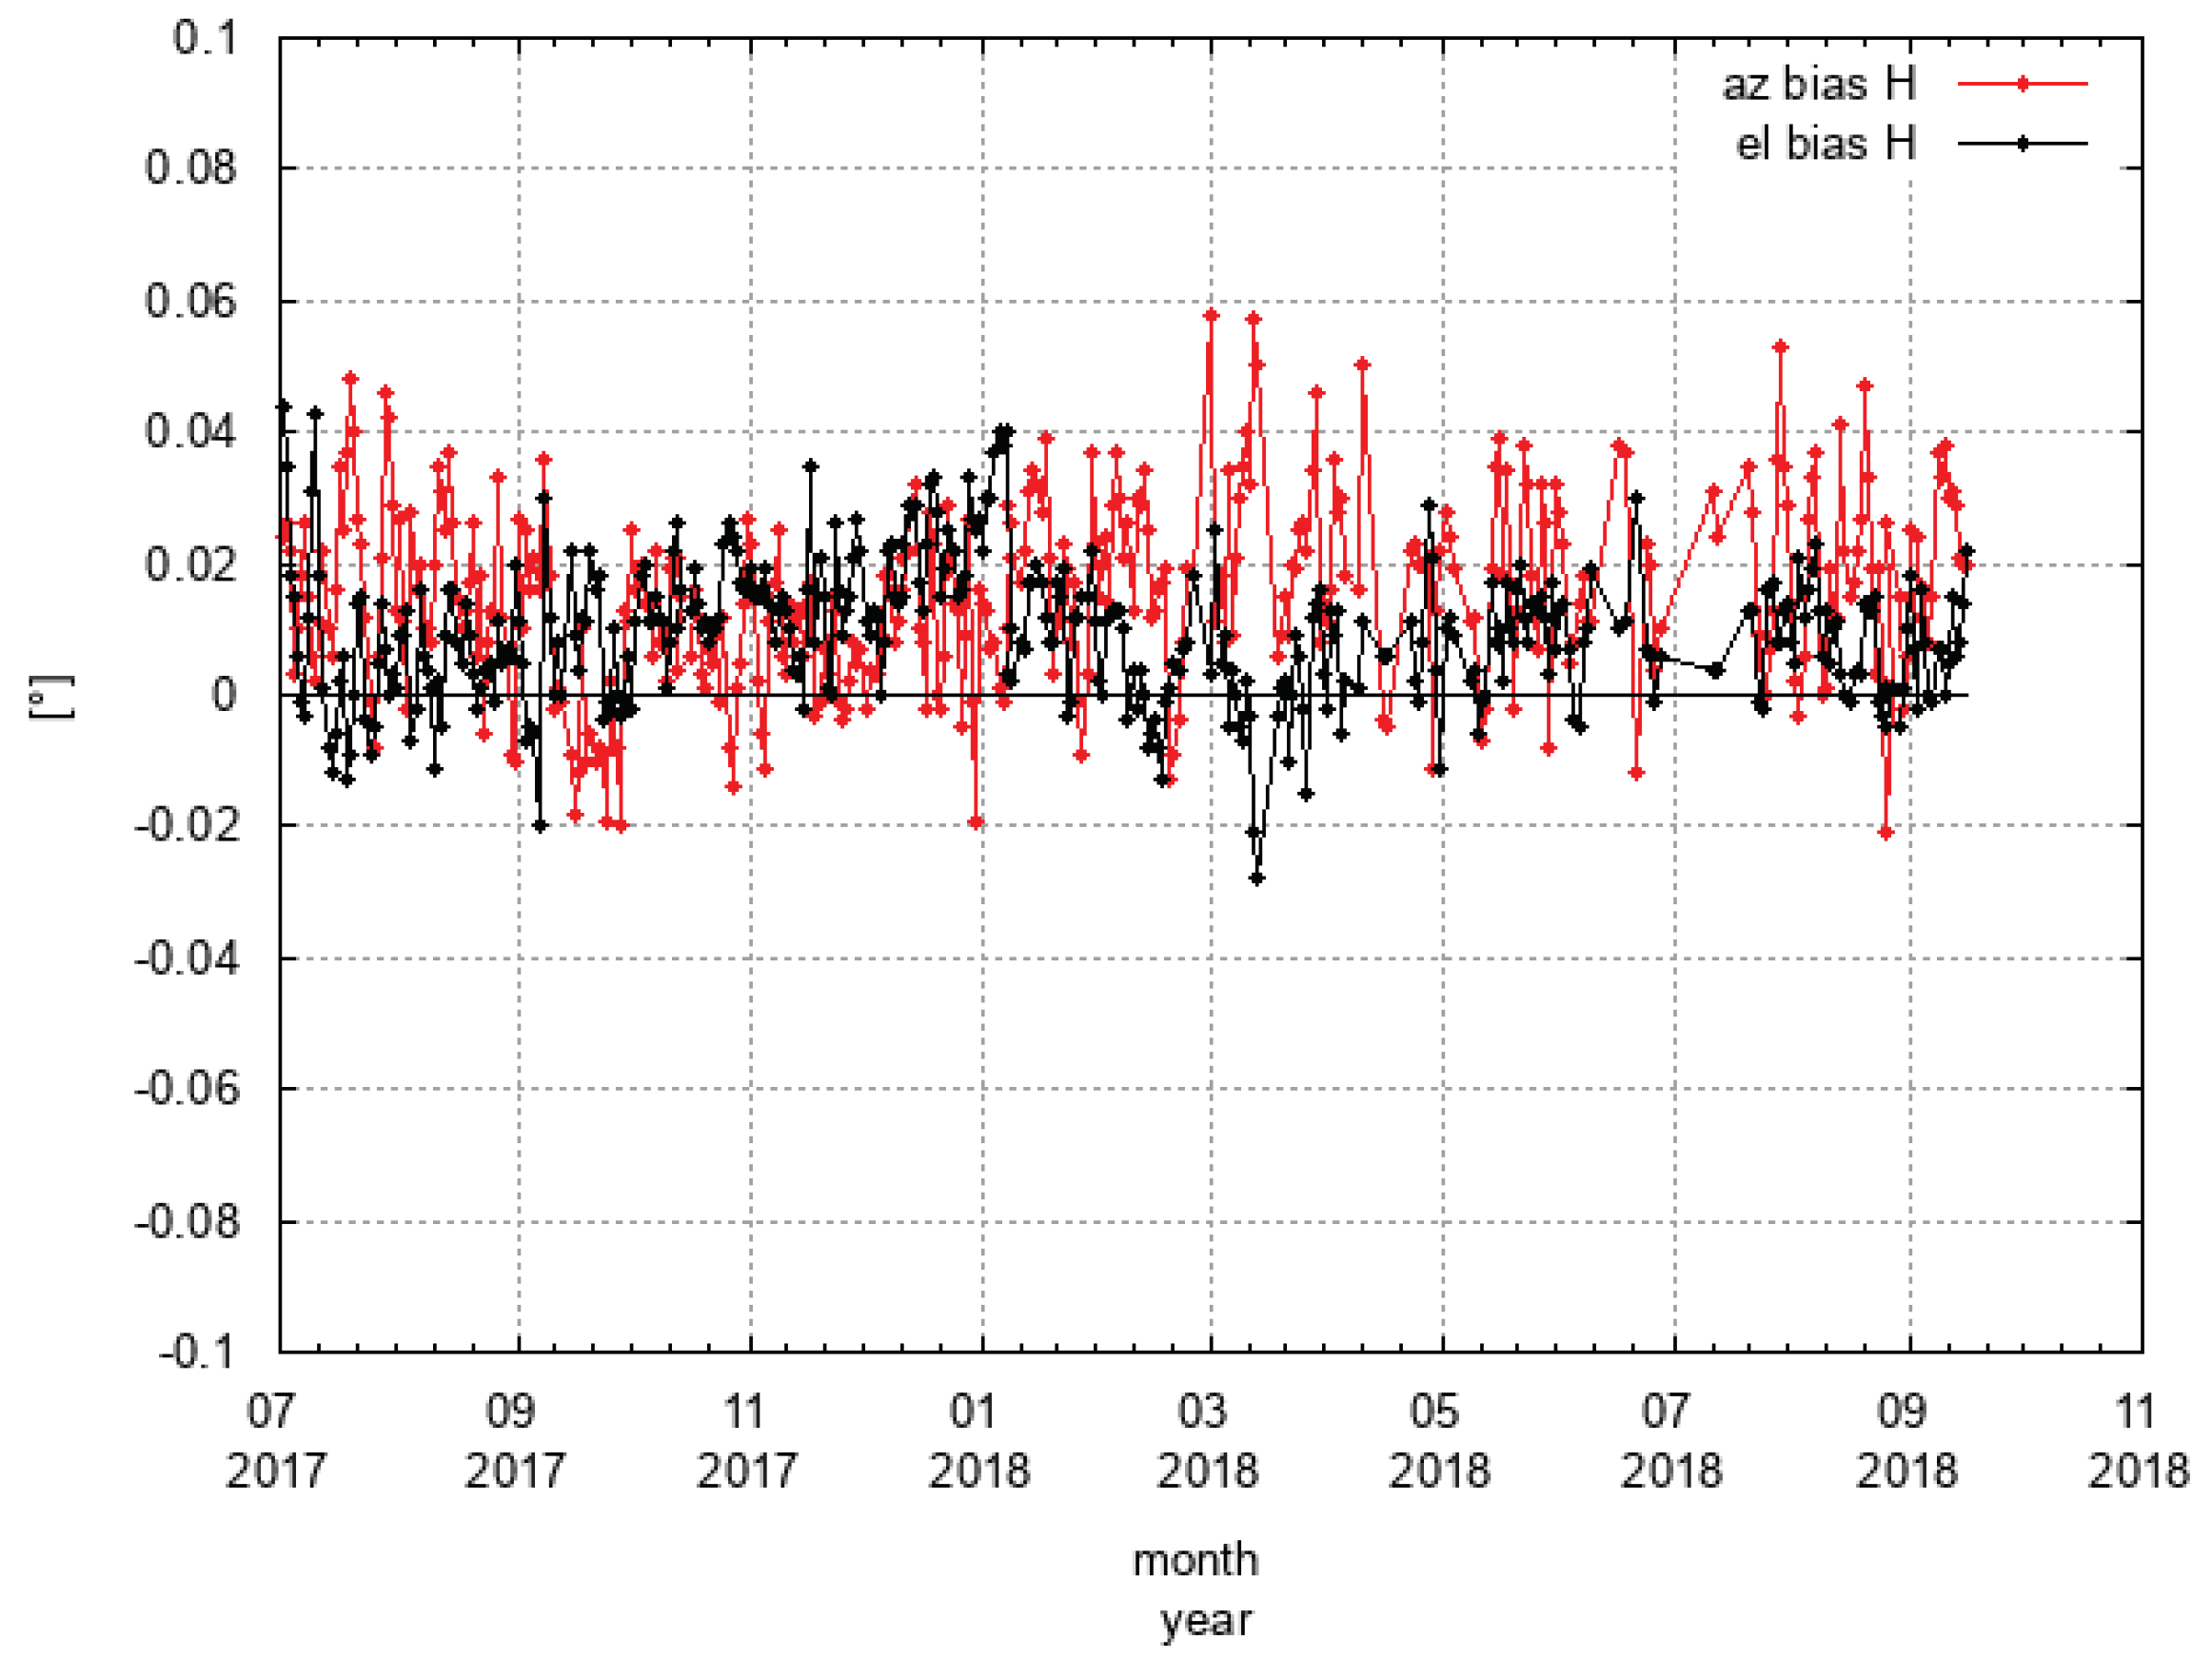
Similarly, the elevation bias is computed to be 0.01 from the operational analysis compared to −0.02 in the morning and −0.01 in the evening. So the elevation bias estimates are within 0.03. Aside from the fact that the operational results are obviously not from the same day as the boxscans, differences may be explained by the smaller sample size from which the pointing bias is determined using operational data (about 30 hits (rays) per day can be expected) compared to about 200 samples (rays) from each boxscan which resolve the main beam. The ray width from the operational scan is 1 (with typically 32 pulses at a antenna speed of typically 18s) compared to that from a box scan with a ray width of 0.32 (with 128 pulses at 2s antenna speed). So the difference in sample size and the different ray widths may explain the difference of pointing bias values. This can also be compared to the variability of the azimuth and elevation bias from July 2017 until September 2018 shown in Figure 10. The day to day variations of azimuth and elevation bias from the operational data are comparable to the difference between the bias estimates from the boxscans and the operational data. We also note, that the day to day elevation bias variations appear smaller than the azimuth bias variation, similar to the findings shown for 3 June 2018 (Figure 9).
Within the DWD radar network, we employ solar monitoring to adjust angle offsets to correct for pointing bias. An adjustment is initiated if the pointing error based on solar monitoring exceeds . This involves an adjustment of angle offsets in the radar configuration. In order to make sure that the proper bias correction has been applied, we point the radar to the expected position of the sun, and note the measured solar SNR before and after applying the new angle offset. An increase of SNR serves as a cross check for a correct angle offset adjustment.
7. Pointing Bias with Respect to Two Different Angle Encoders
We use the option to compute the azimuth pointing bias using the motor encoder angles and compare the results to the bias estimate based on the operational angle acquisition using the absolute encoder. From this we can assess the consistency between the two angle sources which is of relevance for radar operations. The absolute encoder may fail for which case we switch to the angle data of the motor encoder. On 9 July 2018 we configured the system to use the motor encoder angles and performed a full diurnal cycle of solar boxscans. The results are then compared to data from 8 July with the standard angle source configuration. This is shown in Figure 11. First of all the computed bias data from the absolute encoder are very similar to the data shown in Figure 6 where we show data from 15 June 2018. The values are essentially identical. The azimuthal variation of the azimuth bias during the day using the two different angle sources is comparable. They are separated approximately by a constant offset. The difference between the biases is approximately constant (−0.05). Therefore, a constant offset may be applied in order to match the two angle sources. Since both angle sources show similar azimuthal variation, we attribute the variation of azimuth bias to the bull gear which deviates from a circular shape.
In Figure 11 we also show the difference between the two angle sources which are based on a maintenance scan which is typically carried out during maintenance. In principle, the antenna is commanded to a certain azimuth position. The commanded azimuth angle is sent to the motor controller which steers the antenna to the desired angle. The motor encoder then provides the actual motor angle back to the radar software. This motor encoder angle reading is then compared to the corresponding azimuth angle of the independent absolute encoder (see Figure 2). This procedure is carried out for a number of azimuthal positions, with clockwise and counter-clockwise antenna movements. From the latter it is also possible to estimate the backlash of the gear-drive assembly. Based on the maintenance scan, the difference between motor encoder angles and absolute encoder angles appears to be consistent with the results from the boxscan (Figure 11), although the results are more noisy. Obviously, the advantage of the maintenance scan is that it can provide a characterization of the drive gear assembly for a full turn of 360. A disadvantage is the fact, that it does not represent an end-to-end characterization of the angle acquisition and the corresponding pointing accuracy because the antenna assembly including the radome is missing.
8. Backlash
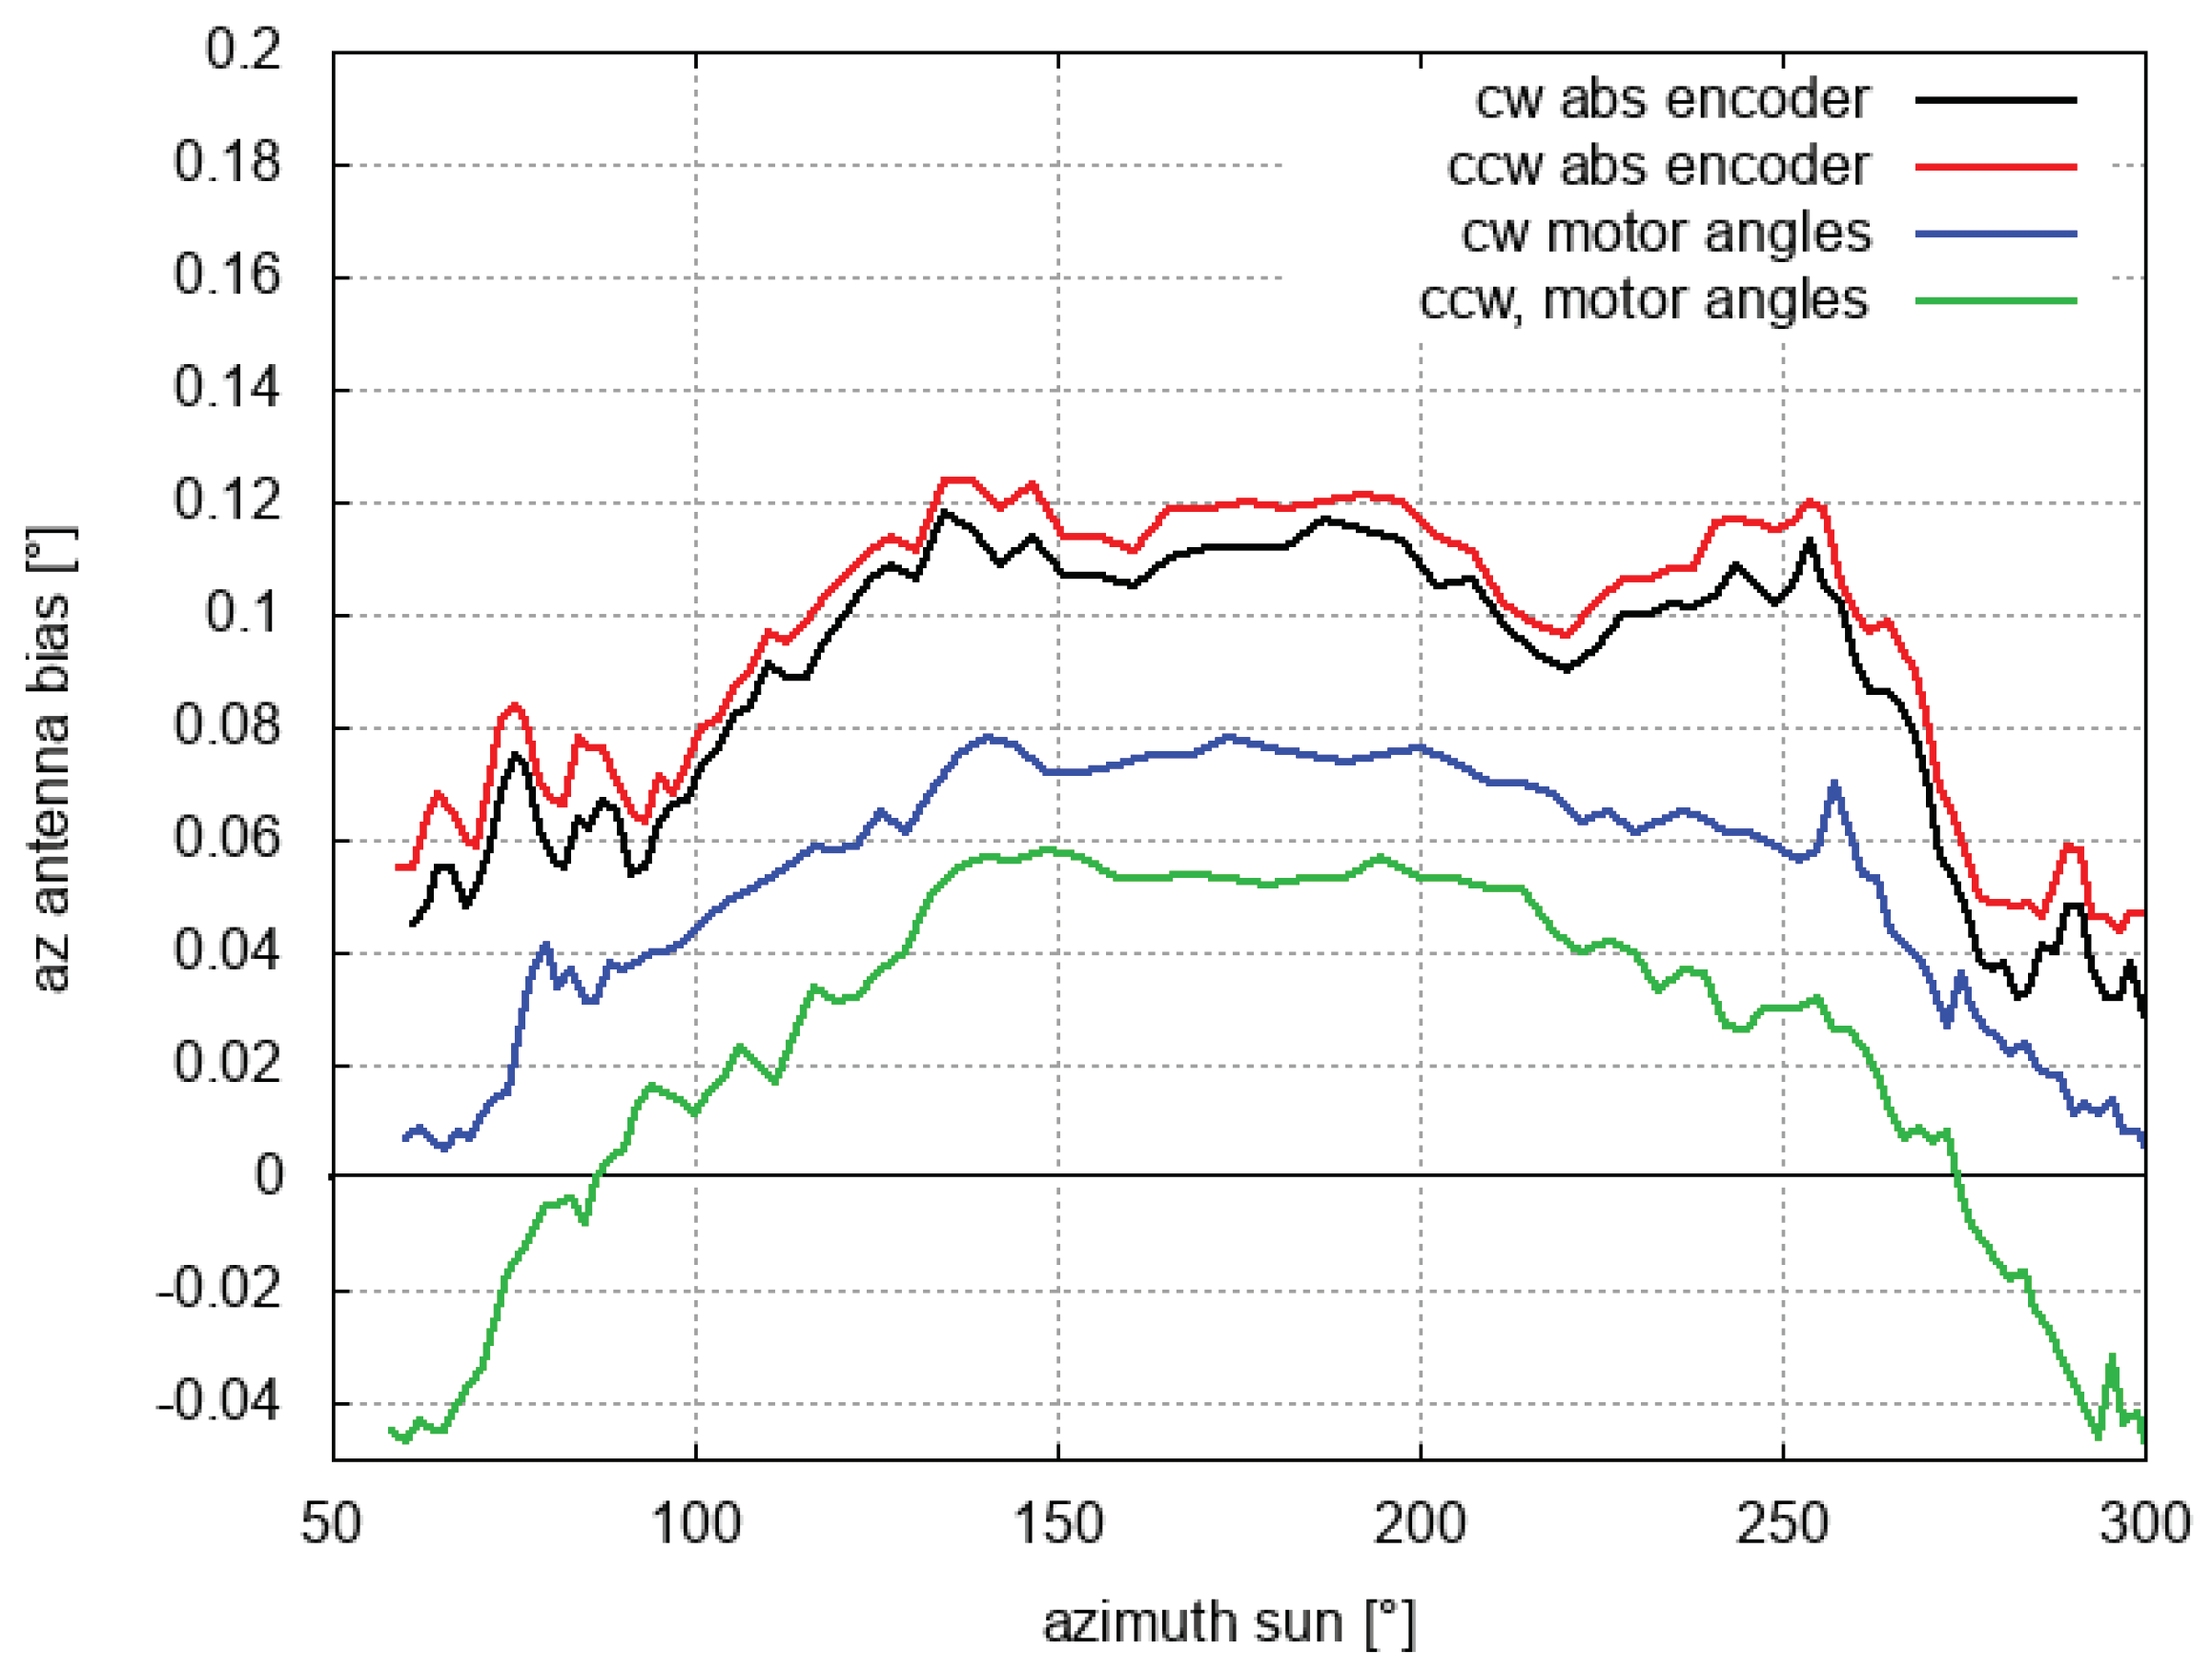
The solar boxscans can also be used to assess the backlash between the bull gear and the absolute encoder, and secondly between the bull gear and the motor of the gear drive system. For a given angle source, this is quantified by computing the pointing bias when either the antenna is moving in clockwise (cw) or counter clockwise direction (ccw). In doing so we effectively use only half of the sample size of each boxscan. The azimuth bias results from this re-sampled data are shown in Figure 12. At a given azimuth position, the difference between the azimuth bias estimate using cw and ccw data is interpreted to be the backlash. The difference is quasi constant (about 0.01) for bias estimates using absolute encoder angles. The differences between cw and ccw azimuth bias estimates are larger and more dependent on the actual azimuth position if the motor angles are used to tag the data. The difference between the cw and ccw azimuth bias has a magnitude up to 0.05. Compared to a target value of 0.04 this result is still considered to be acceptable. Note, some backlash is needed, otherwise the risk of a failure due to a tightly adjusted gear-drive system will increase due to the increase of mechanical stress. The adjustment of the backlash is a tedious task and requires experience.
9. Examples from the Radar Network
Previous results show that the pointing error of a weather radar is a function of azimuth and elevation and as such cannot be viewed as constant. In azimuth, the pointing error has a variation of 0.1 for the Hohenpeissenberg radar (e.g., Figure 8). The question is, to what extent are those results representative for the other 17 radars in the network. This will be investigated in this section. During 2018, we gathered boxscans during a full diurnal cycle from sunrise to sunset from four different operational radar stations (radars Flechtdorf, FLD (27 June 2018), Neuheilenbach, NHB (24 July 2018), Boostedt, BOO (27 June 2018) and Hannover, HNR (24 July 2018)). The diurnal cycle of azimuth and elevation bias are shown in Figure 13. As expected we find for all sites an azimuthal dependence of pointing bias consistent with the findings of the Hohenpeißenberg radar data. However, the azimuthal dependence of azimuth pointing bias is different for all radar systems. The largest variation of azimuth bias is 0.2 which is found for the Hannover radar (HNR). This system also appears to have a larger variation of the elevation bias as a function of azimuth compared to the other three systems. An increase or decrease of elevation bias as a function of azimuth may be attributed to a tilt of the pedestal. For the Hannover (HNR) radar, the increase of elevation bias amounts to about 0.04. The value of 0.04 has been verified independently using readings from an inclinometer mounted on the antenna.
The HNR variation of azimuth bias is considered to be too large. The on-site analysis of the angle acquisition, which involved the replacement of the absolute encoder, suggests that the source of azimuth pointing error can be attributed to the bull gear. Angle acquisition tests (where motor angles are compared to the absolute encoder angles, see e.g., Figure 11 as an example) before and after the replacement of the absolute encoder revealed similar results which are consistent with the azimuth pointing bias using the sun as reference (Figure 13). Therefore, the replacement of the Hannover bull gear needs to considered.
At the radar Boostedt (BOO), we can observe a more or less significant modulation of the azimuth bias at a wave length of about 60. This modulation can be linked to the absolute encoder with its gear ratio of 1:6. For the Boostedt radar the modulation has an amplitude of 0.05. If we require a maximum error in azimuth positioning of 0.1, the absolute encoder adds already 50% to the overall allowed error. This suggests that the encoder adjustment needs to be improved in order to minimize the error contribution from that device. In contrast, the Hannover example shows in fact a very good absolute encoder since we do not observe a modulation similar to the results from Boostedt. The results from the radars in Neuheilenbach (NHB) and Flechtdorf (FLD) are comparable to the results from the BOO radar.
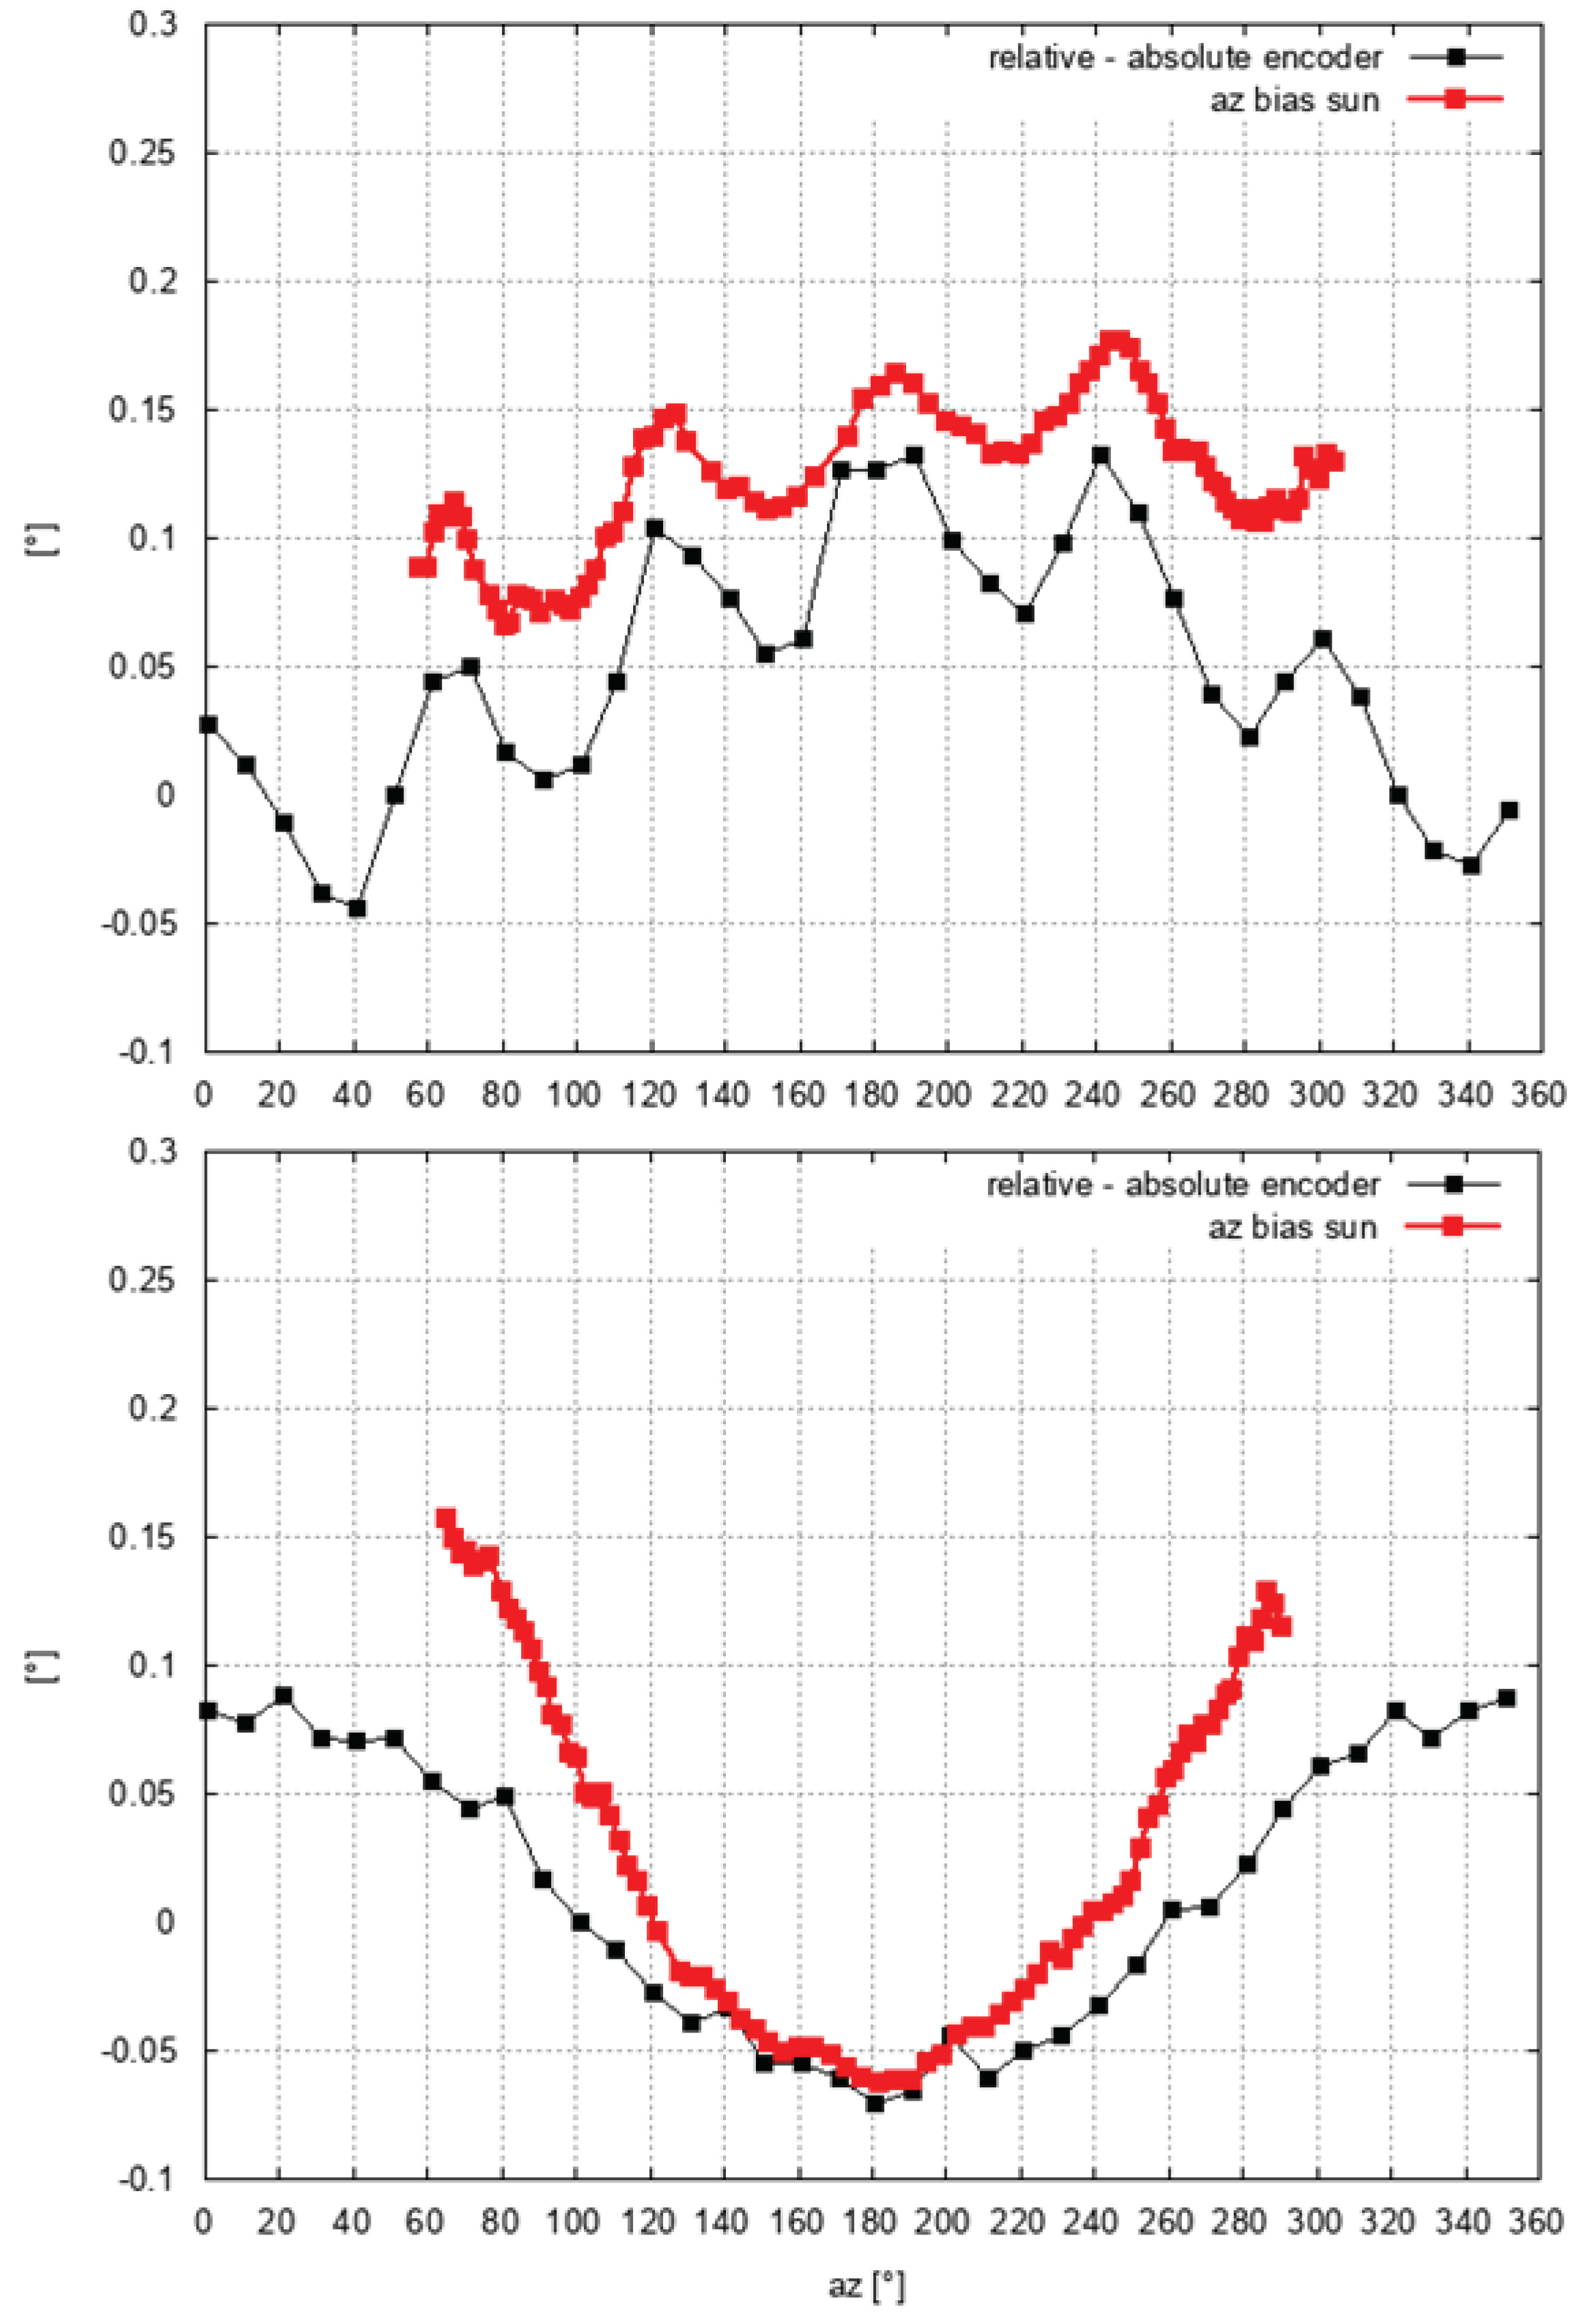
The BOO and HNR results based on the analysis of solar boxscans are compared to the results of the maintenance scan (Figure 14). The azimuthal variation has a striking similarity which is in support of the methodology of using solar boxscans as presented in this note. Note, that an exact agreement between the two data sources is not expected as the azimuthal variation of the pointing bias is compared to an angle difference which does not represent a pointing bias. The difference between the relative encoder (motor angles) and the absolute encoder reflects a non-linearity of the drive train. From Figure 14 we conclude that the azimuthal variation of the azimuth pointing bias can be attributed to the drive train of the radar system and the absolute encoder.
An important aspect is that the azimuthal variation of pointing bias is different for each system. This is attributed to a combination of the mechanical uncertainty of the manufacturing process of bull gears and the mechanical uncertainty of the absolute encoder. If we want to correct for this azimuthal dependence of pointing accuracy, this azimuthal dependence has to be determined for each individual system. So far we do not plan to apply such a correction. As a first step we plan to optimize the angle acquisition with an improved mechanical design of the absolute encoder. The bias in elevation and its elevation dependence in relation to the same angle acquisition that is used in azimuth is not as crucial since only a smaller angle range is required. This relates to the operational data acquisition between 0.5 and 25 elevation.
10. Conclusions
In this work, we have investigated the navigation performance of a weather radar as one of the essential basic performance characteristics. We use the Hohenpeißenberg research radar for this thorough analysis by employing a large number of consecutive solar boxscans. To our knowledge, this is the first study where the position accuracy is assessed at this level of detail. With a solar boxscan, we scan the sun with high angular resolution. The Hohenpeißenberg radar is identical to the 17 other weather radar systems of the DWD weather radar network. By using the sun as a reference, those measurements represent what we call an end-to-end assessment of radar navigation performance of the microwave beam as we consider all relevant elements, such as motor, bull gear, antenna assembly and radome for the quantification of the antenna pointing accuracy. For the Hohenpeißenberg radar, we find that the pointing accuracy varies up to 0.1 depending on the azimuth angle (with this data set we were able to cover an azimuth range from 60 to 300). Most of this variation is attributed to the asymmetry of the bull gear, which is never precisely circular. Manufacturers are aware of this since they evaluate the high and low point of a bull gear in their quality assurance process. The azimuth dependence of the azimuth bias is consistent throughout the whole data sample which covers measurements from over 26 full diurnal cycles of boxscans. The elevation bias as a function azimuth angle indicates a linear trend in the course of the day which is indicative for a tilt of the pedestal. Elevation bias estimates in the morning and in the evening may be biased depending on the true refractive index profile compared to the employed profile based on the assumption of a standard atmosphere. However, it is concluded that the assumption of a standard atmosphere is not critical for the computation of the elevation position of the sun, at least for this data set. If a deviation from a standard atmosphere were significant, this should be reflected by a larger spread of bias estimates in the morning, and less so in the evening, considering a typical diurnal evolution of the atmospheric boundary layer.
The angle acquisition of the DWD radar design is such that the operational angle source through an absolute encoder can be substituted by motor encoder angles in case of a failure. This feature allows for a characterization of the backlash between bull gear and the absolute encoder, and the backlash between bull gear and the motor. It is shown that the backlash between the absolute encoder and the bull gear is smaller 0.01. The backlash between motor and bull gear varies with azimuth angle and has a magnitude up to 0.05. During maintenance latter backlash is quantified and adjusted if the value is larger than 0.04.
We have analyzed results of azimuth and elevation biases from four radar systems of the German weather radar network. The contribution of the absolute encoder to the overall azimuth bias is in particular apparent for the radar Boostedt which is revealed by the modulation of the azimuth bias at a frequency which corresponds to the gear ratio of the absolute encoder. The amplitude of this modulation is about 0.05. For the three other radar systems we find also azimuthal variations of azimuth bias with similar magnitudes except for the Hannover system where the larger variation of azimuth bias (0.2) is attributed to issues with the bull gear.
We have compared the azimuth and elevation bias estimates from solar boxscans with the bias estimates determined based on the analysis of solar hits from the operational scanning. The agreement is considered to be very good. An important aspect to keep in mind is that the bias estimates from the operational scanning are based on solar elevations between 0 and 25. The methodology presented in this paper allows for a dedicated end-to-end verification of the pointing accuracy of a radar system. The quality of radar maintenance or that of a hardware or software modification in relation to the drive train can be assessed and used to verify system specifications.
Author Contributions
M.F. conceived the concept this analysis. M.F. carried out the measurements and did the formal data analysis, writing and review of the article. T.M. contributed to concept and writing, and prepared all the conceptual figures. B.L. contributed to the interpretation of the results and provided important technical insight into the radar system.
Funding
This research received no external funding.
Acknowledgments
We acknowledge the fruitful discussions with the DWD radar team, in particular with Kay Desler, Norbert Engler and Benjamin Rohrdantz.
Conflicts of Interest
The authors declare no conflict of interest.
References
- ISO. Meteorology—Weather Radar—Part 1: System Performance and Operation; ISO 19926-1:2019; International Organization for Standardization: Geneva, Switzerland, 2019; p. 93. [Google Scholar]
- Reimann, J.; Hagen, M. Antenna Pattern Measurements of Weather Radars Using the Sun and a Point Source. J. Atmos. Ocean. Technol. 2016, 33, 891–898. [Google Scholar] [CrossRef]
- Chandrasekar, V.; Baldini, L.; Bharadwaj, N.; Smith, P. Calibration procedures for Global Precipitation-Measurements Ground-Validation Radars. Radio Sci. Bull. 2015, 355, 45–73. [Google Scholar]
- Huuskonen, A.; Holleman, I. Determining weather radar antenna pointing using signals detected from the sun at low elevations. J. Atmos. Ocean. Technol. 2007, 24, 476–483. [Google Scholar] [CrossRef]
- Holleman, I.; Huuskonen, A. Analytical formulas for refraction of radiowaves from exoatmospheric sources. Radio Sci. 2013, 48, 226–231. [Google Scholar] [CrossRef] [Green Version]
- Holleman, I.; Huuskonen, A.; Kurri, M.; Beekhuis, H. Operational monitoring of weather radar receiving chain using the sun. J. Atmos. Ocean. Technol. 2010, 27, 159–166. [Google Scholar] [CrossRef]
- Frech, M. Monitoring the data quality of the new polarimetric weather radar network of the German Meteorological Service. In Proceedings of the 36th AMS Conference on Radar Meteorology, Breckenridge, CO, USA, 16–20 September 2013. [Google Scholar]
- Figueras i Ventura, J.; Boumahmoud, A.A.; Fradon, B.; Dupuy, P.; Tabary, P. Long-term monitoring of French polarimetric radar data quality and evaluation of several polarimetric quantitative precipitation estimators in ideal conditions for operational implementation at C-band. Q. J. R. Meteorol. Soc. 2012, 138, 2212–2228. [Google Scholar] [CrossRef] [Green Version]
- Altube, P.; Bech, J.; Argemí, O.; Rigo, T. Quality Control of Antenna Alignment and Receiver Calibration Using the Sun: Adaptation to Midrange Weather Radar Observations at Low Elevation Angles. J. Atmos. Ocean. Technol. 2015, 32, 927–942. [Google Scholar] [CrossRef] [Green Version]
- Frech, M.; Lange, B.; Mammen, T.; Seltmann, J.; Morehead, C.; Rowan, J. Influence of a Radome on Antenna Performance. J. Atmos. Ocean. Technol. 2013, 30, 313–324. [Google Scholar] [CrossRef]
- Saemundsson, T. Atmospheric Refraction. Sky Telesc. 1986, 72, 70. [Google Scholar]
- Mahrt, L. Nocturnal Boundary-Layer Regimes. Bound.-Layer Meteorol. 1998, 88, 255–278. [Google Scholar] [CrossRef]
Figure 1.
Schematic sketch of the antenna-pedestal assembly on a radar tower. This cartoon provides a simplified view on different reference planes which need to be leveled so that a 360 rotation of the antenna is in an exact horizontal plane, independent from azimuth position.
Figure 1.
Schematic sketch of the antenna-pedestal assembly on a radar tower. This cartoon provides a simplified view on different reference planes which need to be leveled so that a 360 rotation of the antenna is in an exact horizontal plane, independent from azimuth position.

Figure 2.
Schematic picture of the antenna drive system which illustrates two angle sources within the DWSR5001/SDP/CE. There are the motor encoder angles of the motor which steers the bull gear. Position commands are sent to the motor encoder. The actual angles that are used to tag each pulse are from the absolute encoder.

Figure 3.
Principle sketch of the two angle reading sources within the DWD radar system, namely the absolute encoder and the relative encoder of the motor. These are shown together with the respective optional communication paths which are needed to tag a received ray with a time stamp and the corresponding elevation and azimuth angle.

Figure 4.
Operational 2-D surface fit to solar power measurements to determine antenna misalignment and radar measured peak solar power. The red data points represent the sampled solar power at a given time during operational scanning. The 2-D surface is fitted to the solar power sample. The surface fit provides the maximum peak solar power based on radar data and its position relative to the true sun position. This approach is also applied when analyzing data from solar boxscans, where many more samples are available due to the dedicated boxscan.

Figure 5.
Solar beam plot from 15 June 2018, 17:22 UTC. Shown is the normalized SNRh relative to the peak SNRh.
Figure 5.
Solar beam plot from 15 June 2018, 17:22 UTC. Shown is the normalized SNRh relative to the peak SNRh.

Figure 6.
Azimuth pointing bias based on the solar boxscans from 3 and 15 June 2018 (upper panel). The results are shown for both the horizontal and vertical polarization H and V. Boxscans are acquired every 10 min. In addition, we show the corresponding azimuth and elevation of the sun on 3 June 2018. A very similar solar azimuth and elevation readings were present on 15 June (not shown). The corresponding pointing bias in elevation is shown in the lower panel.

Figure 7.
Beams quint based on the elevation and azimuth estimate for 3 and 15 June 2018.

Figure 8.
Azimuth pointing bias (upper panel) and elevation bias (lower panel) based on over 1300 solar boxscans taken between June and August 2018 (upper panel). Also shown are the median bias estimates and associated 1st and 3rd quartile of the distribution from non-overlapping windows of 3 width of sun azimuth angles.

Figure 9.
Azimuth pointing bias based on the solar boxscans from 3 June 2018 (upper panel). The results are shown for the horizontal polarization H only and are compared to the bias estimate based on the collected solar hits from operational scanning (constant red line; there is only one bias estimate per day). In addition a horizontal line is drawn at 25 elevation indicating the maximum elevation of the operational scan. The corresponding pointing bias in elevation is shown in the lower panel.

Figure 10.
Azimuth and elevation pointing bias of the Hohenpeißenberg radar July 2017 until September 2018. The bias estimates are based on the solar hits extracted during operational scanning. The pointing bias is computed once a day.
Figure 10.
Azimuth and elevation pointing bias of the Hohenpeißenberg radar July 2017 until September 2018. The bias estimates are based on the solar hits extracted during operational scanning. The pointing bias is computed once a day.

Figure 11.
Azimuth bias determined from the motor encoder (“udp”, data from 9 July 2018) and the absolute encoder (operational angle source, data from 8 July 2018). Shown is also the difference between the two biases and the difference of the two angle sources based on the backlash maintenance scan.

Figure 12.
Azimuth bias based on re-sampled boxscan data where only data are used if the antenna is moving in clockwise (cw) or in counter-clockwise direction (ccw). The difference between the bias estimate based on data of cw and ccw movement for a given angle source (absolute or relative encoder) defines the backlash between the given encoder and the bull gear. Shown are results of the Hohenpeissenberg radar.

Figure 13.
Mean a zimuth (upper panel) and elevation (lower panel) pointing bias based on full diurnal cycles of solar boxscans at 4 radar sites: Boostedt (BOO, 27 June 2018, Neuheilenbach (NHB, 24 July 2018), Hannover (HNR, 24 July 2018) and Flechtdorf (FLD, 27 June 2018). About 90 bias estimates are available for each radar site.

Figure 14.
Azimuth pointing bias based on the sun in comparison to the difference of the readings from the absolute and relative encoder for BOO (upper panel, data from 27 June 2018) and HNR (lower panel, see also Figure 13, data from 25 July 2018). Those readings were gathered using a dedicated maintenance scan, which was carried out on 8 May 2018 (BOO) and on 5 December 2018 (HNR).

© 2019 by the authors. Licensee MDPI, Basel, Switzerland. This article is an open access article distributed under the terms and conditions of the Creative Commons Attribution (CC BY) license (http://creativecommons.org/licenses/by/4.0/).
Share and Cite
MDPI and ACS Style
Frech, M.; Mammen, T.; Lange, B. Pointing Accuracy of an Operational Polarimetric Weather Radar. Remote Sens. 2019, 11, 1115. https://0-doi-org.brum.beds.ac.uk/10.3390/rs11091115
AMA Style
Frech M, Mammen T, Lange B. Pointing Accuracy of an Operational Polarimetric Weather Radar. Remote Sensing. 2019; 11(9):1115. https://0-doi-org.brum.beds.ac.uk/10.3390/rs11091115
Chicago/Turabian StyleFrech, Michael, Theodor Mammen, and Bertram Lange. 2019. "Pointing Accuracy of an Operational Polarimetric Weather Radar" Remote Sensing 11, no. 9: 1115. https://0-doi-org.brum.beds.ac.uk/10.3390/rs11091115
Note that from the first issue of 2016, this journal uses article numbers instead of page numbers. See further details here.