Article

Present-Day Deformation of the Gyaring Co Fault Zone, Central Qinghai–Tibet Plateau, Determined Using Synthetic Aperture Radar Interferometry

1
School of Geodesy and Geomatics, Wuhan University, Wuhan 430079, China
2
China Earthquake Administration, Beijing 100036, China
3
The Second Monitoring and Application Center, China Earthquake Administration, Xi’an 710054, China
*
Author to whom correspondence should be addressed.
Submission received: 12 April 2019 / Revised: 1 May 2019 / Accepted: 8 May 2019 / Published: 10 May 2019
(This article belongs to the Special Issue Environmental and Geodetic Monitoring of the Tibetan Plateau)

Abstract

:
Because of the constant northward movement of the Indian plate and blockage of the Eurasian continent, the Qinghai–Tibet Plateau has been extruded by north–south compressive stresses since its formation. This has caused the plateau to escape eastward to form a large-scale east–west strike-slip fault and a north–south extensional tectonic system. The Karakorum–Jiali fault, a boundary fault between the Qiangtang and Lhasa terranes, plays an important role in the regional tectonic evolution of the Qinghai–Tibet Plateau. The Gyaring Co fault, in the middle of the Karakoram–Jiali fault zone, is a prominent tectonic component. There have been cases of strong earthquakes of magnitude 7 or greater in this fault, providing a strong earthquake occurrence background. However, current seismic activity is weak. Regional geodetic observation stations are sparsely distributed; thus, the slip rate of the Gyaring Co fault remains unknown. Based on interferometric synthetic aperture radar (InSAR) technology, we acquired current high-spatial resolution crustal deformation characteristics of the Gyaring Co fault zone. The InSAR-derived deformation features were highly consistent with Global Positioning System observational results, and the accuracy of the InSAR deformation fields was within 2 mm/y. According to InSAR results, the Gyaring Co fault controlled the regional crustal deformation pattern, and the difference in far-field deformation on both sides of the fault was 3–5 mm/y (parallel to the fault). The inversion results of the back-slip dislocation model indicated that the slip rate of the Gyaring Co fault was 3–6 mm/y, and the locking depth was ~20 km. A number of v-shaped conjugate strike-slip faults, formed along the Bangong–Nujiang suture zone in the central and southern parts of the -Tibet Plateau, played an important role in regional tectonic evolution. V-shaped conjugate shear fault systems include the Gyaring Co and Doma–Nima faults, and the future seismic risk cannot be ignored.

Graphical Abstract

1. Introduction

The Karakorum–Jiali fault is a large-scale, right-lateral strike-slip fault zone in the central and southern Qinghai–Tibet Plateau with a total length greater than 2000 km. The western section of the fault is the Karakorum fault, and the eastern is the Jiali fault. The Karakorum–Jiali fault in the eastward-extruded southern boundary of the Qinghai–Tibet Plateau [1,2,3] is of great research significance, particularly for scientific issues such as plateau uplift, lateral extrusion, and east–west extension.
The Gyaring Co fault is in the central Karakoram–Jiali fault zone and along the northern margin of the Lhasa terrane, which is closely related to the north–south Shenzha–Dingjie graben (Figure 1). The fault extends from the northwest to the southeast and consists of a series of northwest- and northwest-west-trending en echelon faults. It is connected to the Bangong–Nujiang suture zone northwest of the Gomang Co fault and passes through the Zigu Co, Gyaring Co, Cuoga Co, and Nala Co faults to the southwest. Extending eastward from southeast of Wa’ang Co for greater than 300 km, it is the longest and most linear fault in the central Karakorum–Jiali fault zone [4]. The Gyaring Co fault has had strong seismic activity. In 1934, a Ms 7.0 earthquake occurred along this fault [2]. Based on a field geological survey, researchers speculated that the 1908 M 7.0 earthquake that occurred in this area might have occurred on the north side of the Gyaring Co fault [5]. Therefore, the tectonic distribution and activity of the fault provide an optimal location to study the deformational mechanism and a regional dynamics model of the south-central plateau.
Research on current slip rates of active faults provides important guidance for understanding current tectonic movement and seismic risk assessment. A large number of studies have been conducted regarding the characteristic activity and slip rate of the Karakorum–Jiali fault [2,6,7]. Armijo et al. (1989) believed that the right-lateral strike-slip fault zone of Karakorum–Jiali shifted along the Bangong–Nujiang suture zone in the Qinghai–Tibet Plateau according to the heterogeneity of the relative movements of the northern Tibetan and southern Tibetan terranes. They also provided a general right-lateral slip rate of 20 ± 10 mm/y, which outlined the boundary of the different terranes of an inconsistent internal velocity in the Qinghai–Tibet Plateau [2]. They maintained that the boundary was the southern border of the eastward-extruded Qinghai–Tibet Plateau, basically consistent with the results of seismic geology and Global Positioning System (GPS) observations [2,8,9]. However, Ren et al. (2000) proposed that the average right-lateral slip rate was 4 mm/y [10]. Shen et al. (2003) maintained that the Jiali fault zone had strong early Quaternary activity, and that overall activity has diminished since the Holocene [6]. The northwestern part of the fault has had relatively strong right-lateral strike-slip characteristics at a rate of 6–8 mm/y since the mid-Pleistocene and approximately 10 mm/y since the Late Pleistocene. The right-lateral strike-slip movement of the central and southeastern fault during the Quaternary was not evident [6]. Field surveys during recent years have shown that the southeastern part of the fault has changed to left-lateral strike-slip since the late Pleistocene and has a slip rate of approximately 3.5 mm/y.
The Gyaring Co fault zone is in the central Qinghai–Tibet Plateau. The altitude of the area is relatively high with a harsh climate and low population. Research in the area is relatively limited, making it difficult to implement extensive crustal deformation observational methods such as GPS and leveling that depend on ground observational stations (Figure 1). Interferometric synthetic aperture radar (InSAR) technology can obtain large-scale crustal deformation information without ground control sites, and the synthetic aperture radar (SAR) satellite flight direction is nearly orthogonal to the Gyaring Co fault. Therefore, InSAR technology is among the best observational methods to obtain inter-seismic deformational data of the Gyaring Co fault zone. In 1993, a French scholar, Massonnet, published an article in Nature. He successfully adopted InSAR technology to obtain the co-seismic deformation field of the 1992 Landers Mw 7.3 earthquakes in California, USA, and was the first to apply InSAR technology to fault deformation [11]. At present, the application of InSAR technology in co-seismic deformation has become quite mature (e.g., [12]) with more applications regarding deformation after strong earthquakes (e.g., [13]). During recent years, with the increase in the number of SAR satellites and the shortening of the repeat cycle, along with the development of InSAR data processing, InSAR technology has been successfully applied to the extraction of slow deformation during a period of seismic activity, such as for the Altyn Tagh (e.g., [14]), San Andreas (e.g., [15]), Anatolian (e.g., [16]), Haiyuan (e.g., [17]), Sumatran (e.g., [18]), and Xianshuihe faults (e.g., [19]). These studies demonstrate that InSAR technology can monitor the surface deformation of a fault zone with millimeter precision, providing important evidence for the study of fault kinematics and regional tectonic evolution.
In this study, Envisat advanced synthetic aperture radar (ASAR) data were used with a high-precision InSAR data processing method to effectively determine the large-scale, inter-seismic deformational field of the Gyaring Co fault zone. Constrained by the average crustal deformation velocity field, we inverted the present-day slip rate and locking depth of the fault and discussed current tectonic deformation of the region.

2. Interferometric Synthetic Aperture Radar (InSAR) Observations

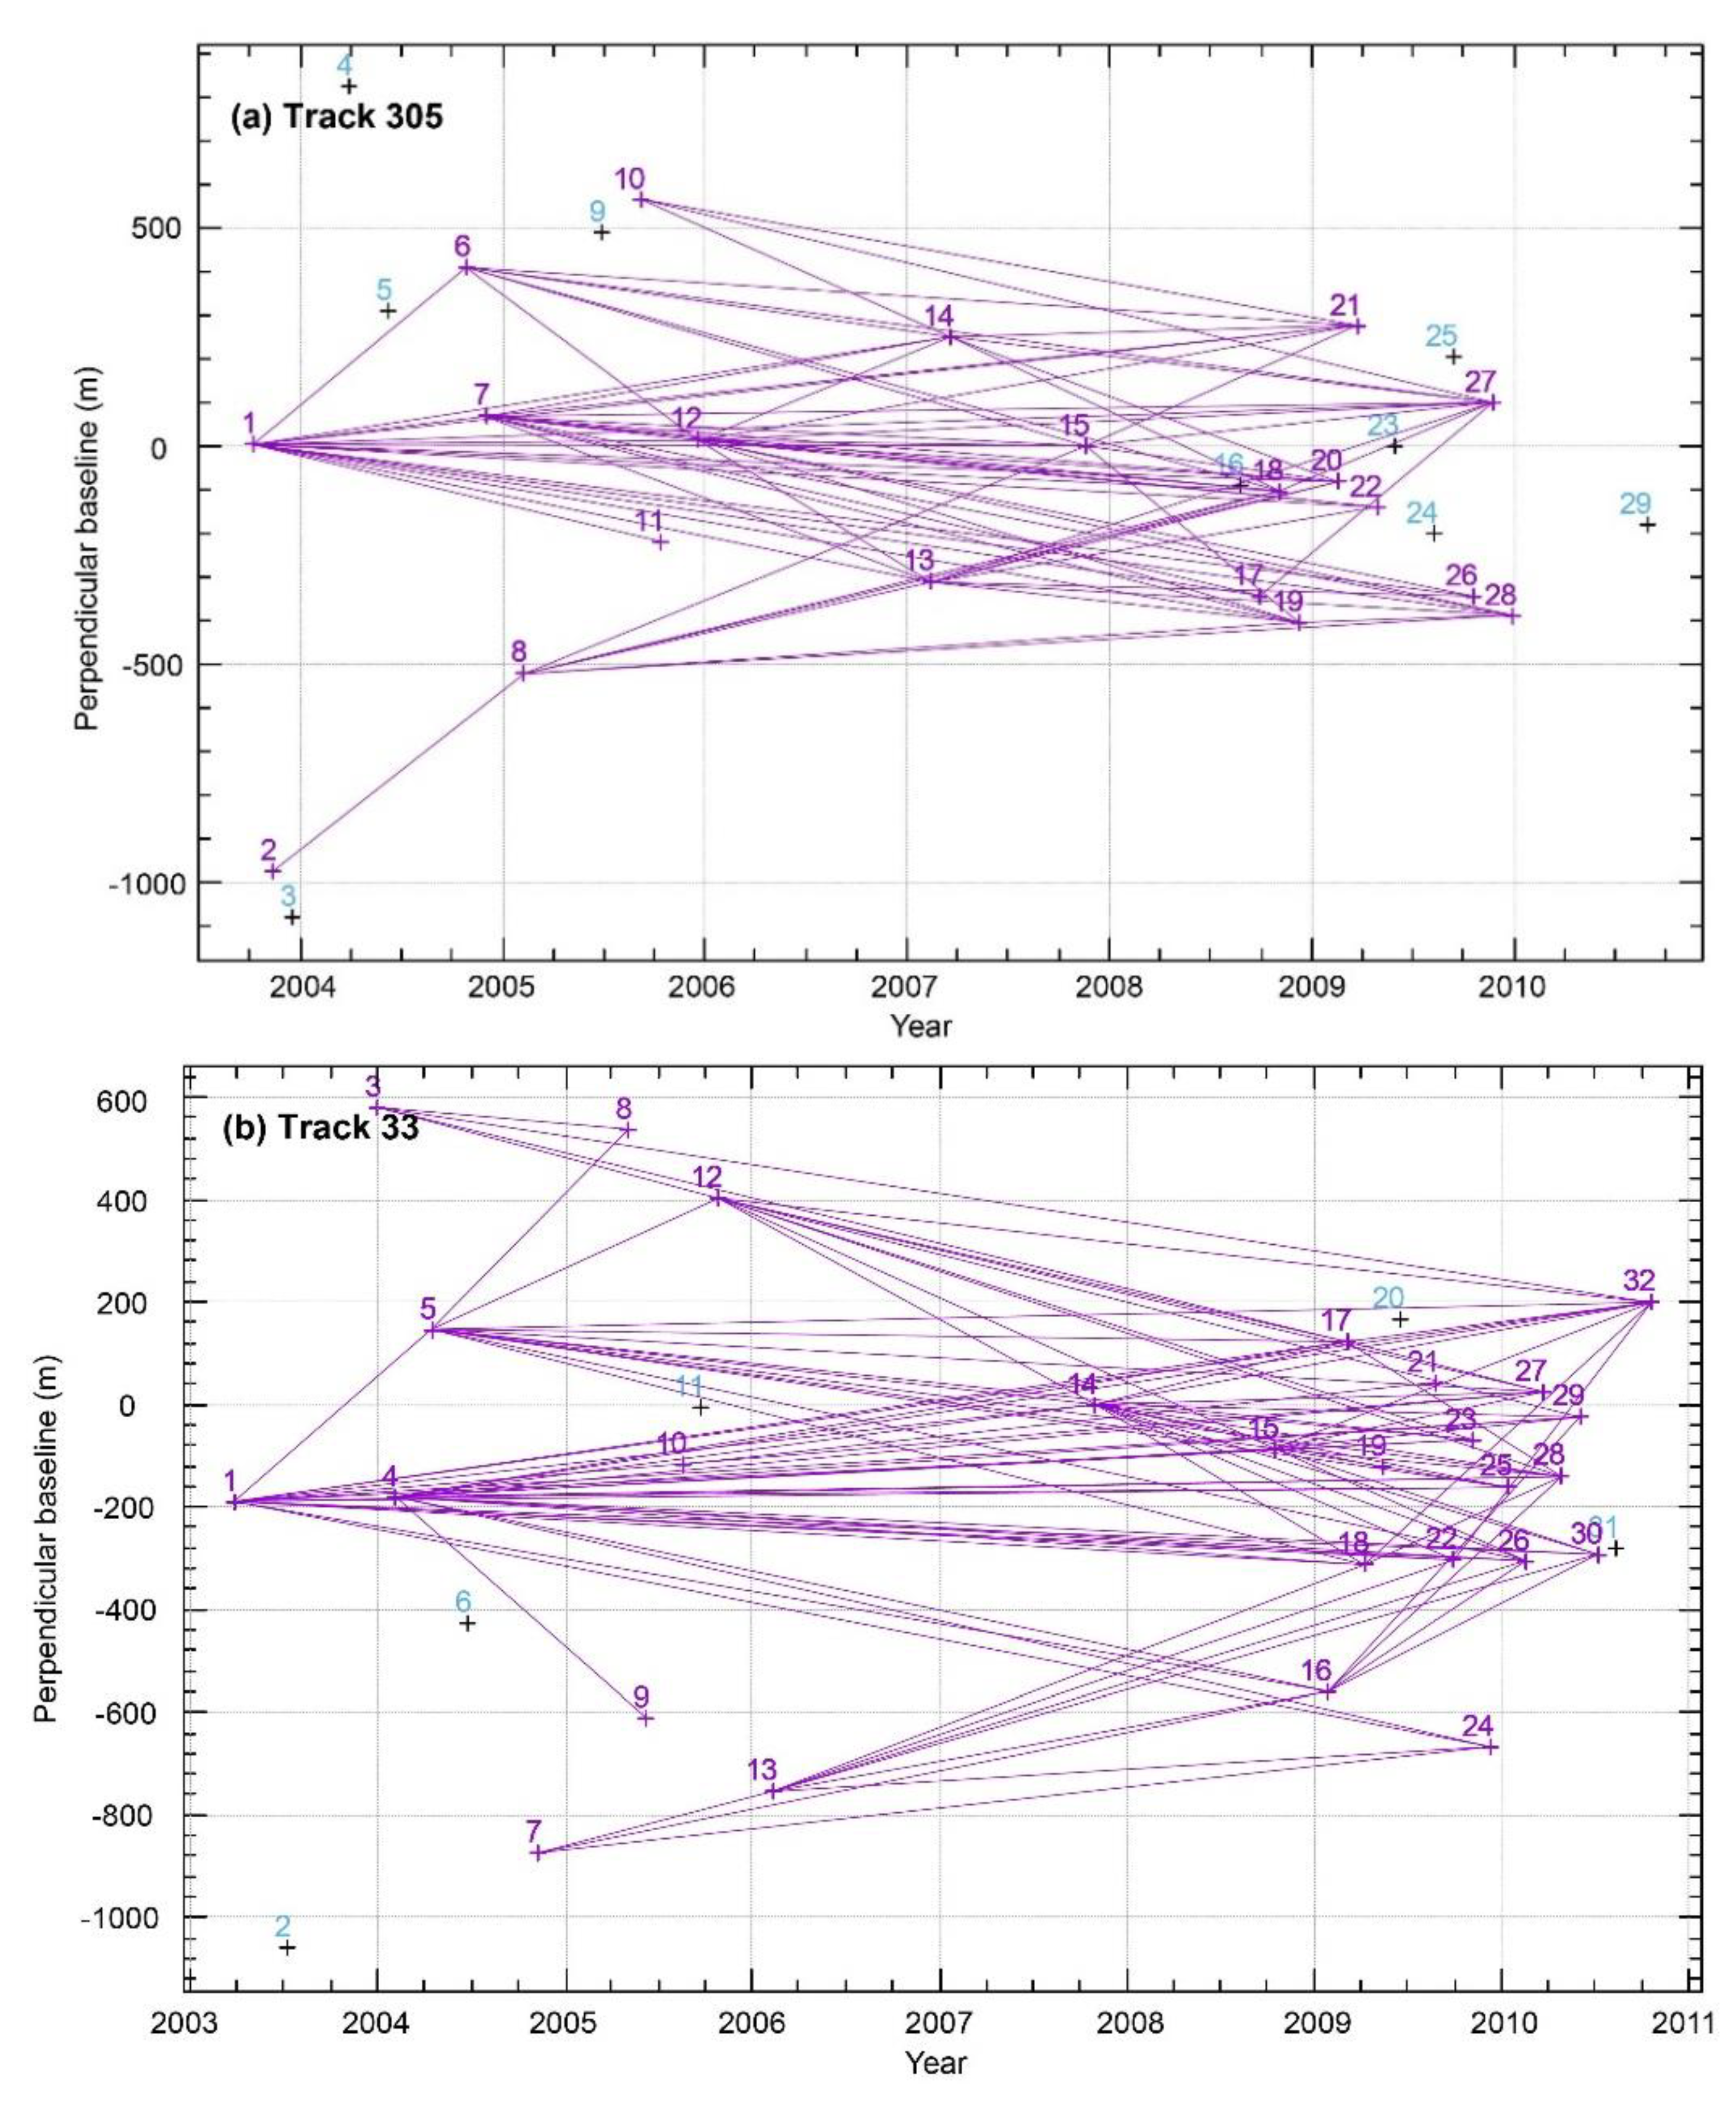
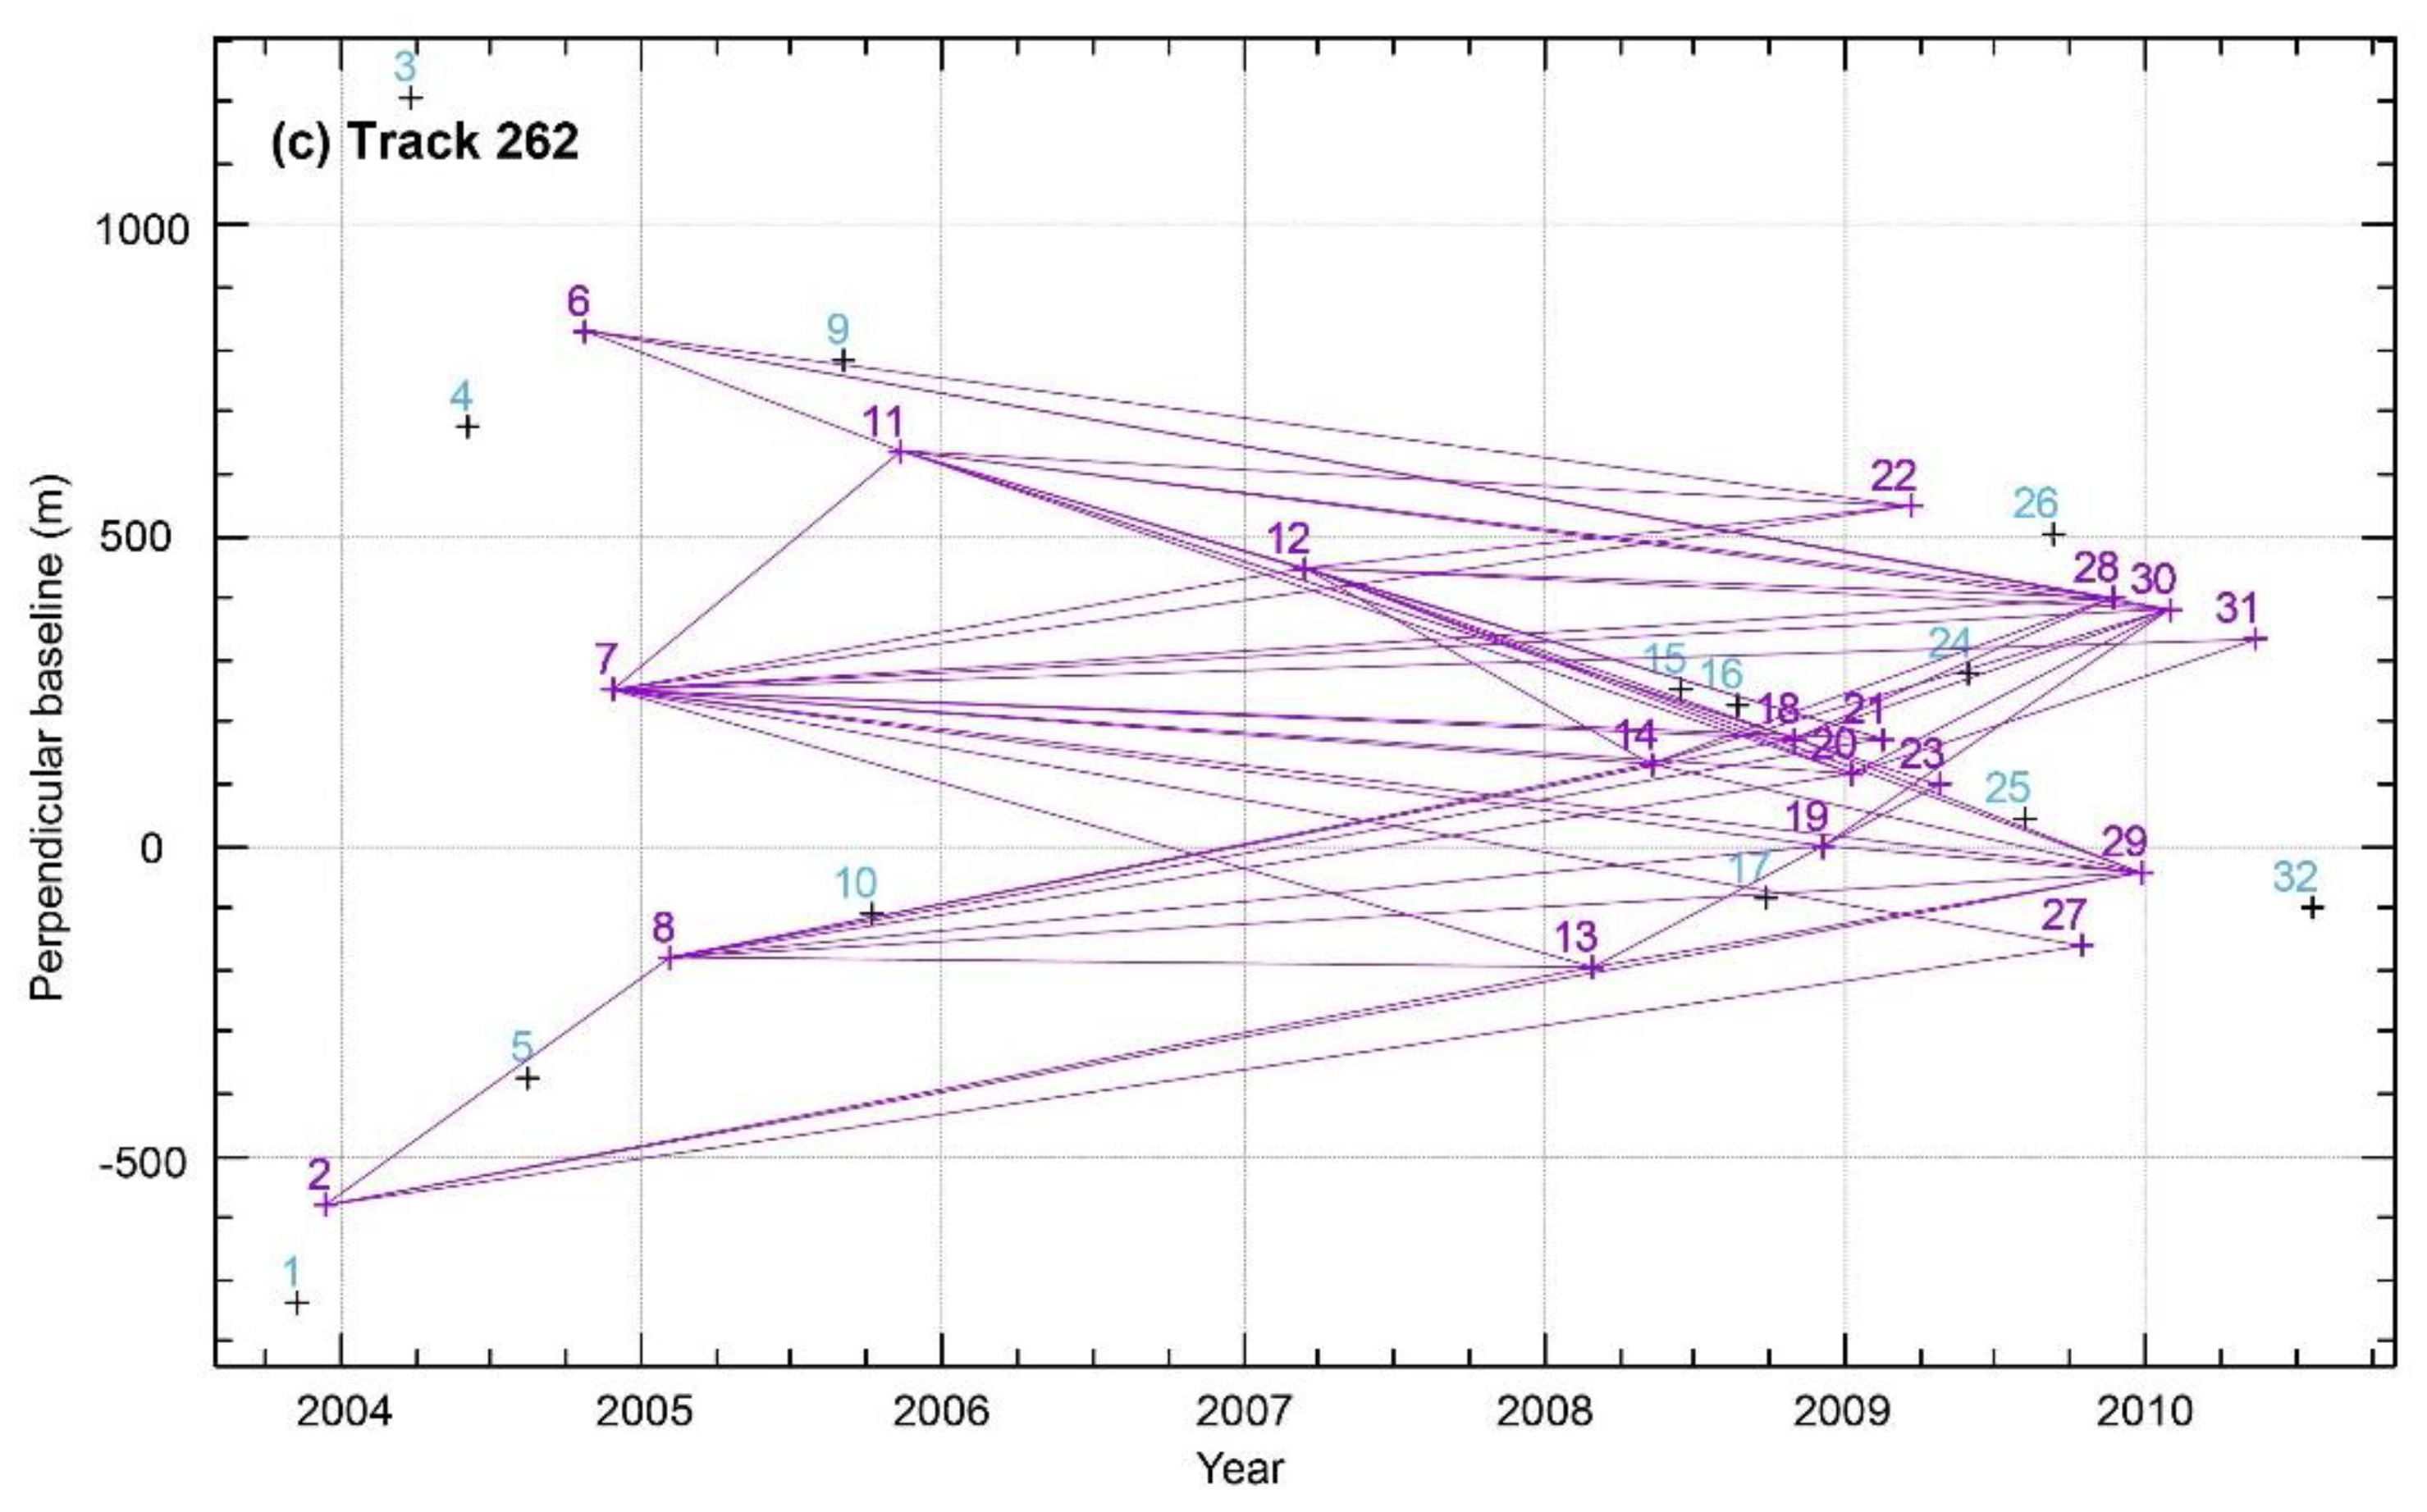
2.1. SAR Images and InSAR Data Processing

The Gyaring Co fault zone is in the hinterland of the Qinghai–Tibet Plateau where vegetation is sparse and the topography is relatively less complex, making it easy for the SAR images to keep coherence. Envisat ASAR images from the European Space Agency (ESA) in 2003 were selected to acquire the current regional crustal deformation field. ASAR images of the Gyaring Co fault and nearby areas are abundant, and they can be obtained for free; thus, they are suitable for monitoring inter-seismic deformation. We downloaded Envisat ASAR image data of three adjacent orbits to analyze inter-seismic deformation of the Gyaring Co fault zone, whose orbital numbers were 305, 33, and 262. The east–west coverage was approximately 300 km, and the north–south coverage was ~240 km from March 2003 to October 2010. The total number of images was 93 (Figure 1; Table 1). It is worth noting that SAR data from different tracks cover different time periods because of the satellite orbit construction (Table 1). This may show a disturbance in deformation results. On the other hand, other events such as earthquakes and landslides may also produce local deformations that were not related to inter-seismic fault movements. However, these signals were shown in local areas, which did not affect the first-order, large-scale inter-seismic fault movements.
For InSAR data processing we used GAMMA commercial software [23] to generate differential interferograms using a two-pass method. The orbital parameters of the Envisat ASAR data were refined with Doppler orbitography and radiopositioning integrated by satellite (DORIS) precision orbit data. Regional topographic information was used to improve the SAR image coregistration accuracy [24]. The shuttle radar topography mission (SRTM) digital elevation model (DEM) with a 30 m spatial resolution released by the National Aeronautics and Space Administration (NASA) was used to stimulate and eliminate the terrain phase. To improve the signal-to-noise ratio, interferograms were down-sampled to 60 looks in range and 12 looks in azimuth, and the pixel resolution was 240 m. To further improve coherence, the interferogram was homogenously filtered [25]. For phase unwrapping, the minimum cost flow algorithm was used based on Delaunay triangulation. Only the pixels with a coherence coefficient greater than 0.2 were unwrapped. The coherence coefficient was chosen through comprehensive consideration of the multilook factor and filter algorithm. We found the number of pixels that were unwrapped successfully was the largest when the coherence coefficient threshold was set as 0.2. Therefore, we chose 0.2 as the optimal coherence coefficient threshold. The initial unwrapping point was selected near the fault trace.
In general, the atmospheric phase delay error in the interferogram included a vertical stratification of atmospheric water vapor and the influences of atmospheric turbulence delay. For the former, based on the correlation between tropospheric delay and local topography, a linear model related to terrain was established to estimate the vertical stratification delay in the tropospheric delay. For the latter, temporal domain high-pass filtering and spatial domain low-pass filtering were used to refine the data.
For InSAR data processing, it is challenging to reduce the long wavelength signals that mimic the inter-seismic deformation signals. In this study, we used the “removal recovery method” [15,26] to reduce the long wavelength errors that were not related to nontectonic signals. Firstly, we subtracted the regional deformation field fitted by the GPS observation from each interferogram. Then, we removed the nontectonic deformation signal in the residual deformation field, such as the orbital error, by quadratic polynomial fitting. And then we re-added the regional deformation field fitted by GPS. By doing so, the interferogram retained an authentic tectonic deformation signal, while the long wavelength error was effectively removed. It was worth noticing that the local GPS sites were distributed unevenly, and this might have affected the a priori GPS model that helped reduce the nontectonic errors. However, the crustal movement in the study region was consistent in the first order. In other words, local movement was infrequent in this area, and this could also be verified by the InSAR deformation field. Therefore, we speculated that the GPS site distribution did not significantly affect the InSAR results.
When the differential interferogram was generated, selection of the interferogram was needed to simultaneously define the spatial and temporal baselines, considering the error of the external DEM and the weak tectonic deformation signal contained in the short-interval interferogram. In this study, the vertical baseline was less than 550 m, and the time interval was less than 350 d with 224 interferograms generated to calculate inter-seismic deformation (Figure 2). In the end, we used the Poly-Interferogram Rate and Time-series Estimator (π-RATE) software package [19,27,28] to calculate the average crustal deformation velocity field of the Gyaring Co fault zone.

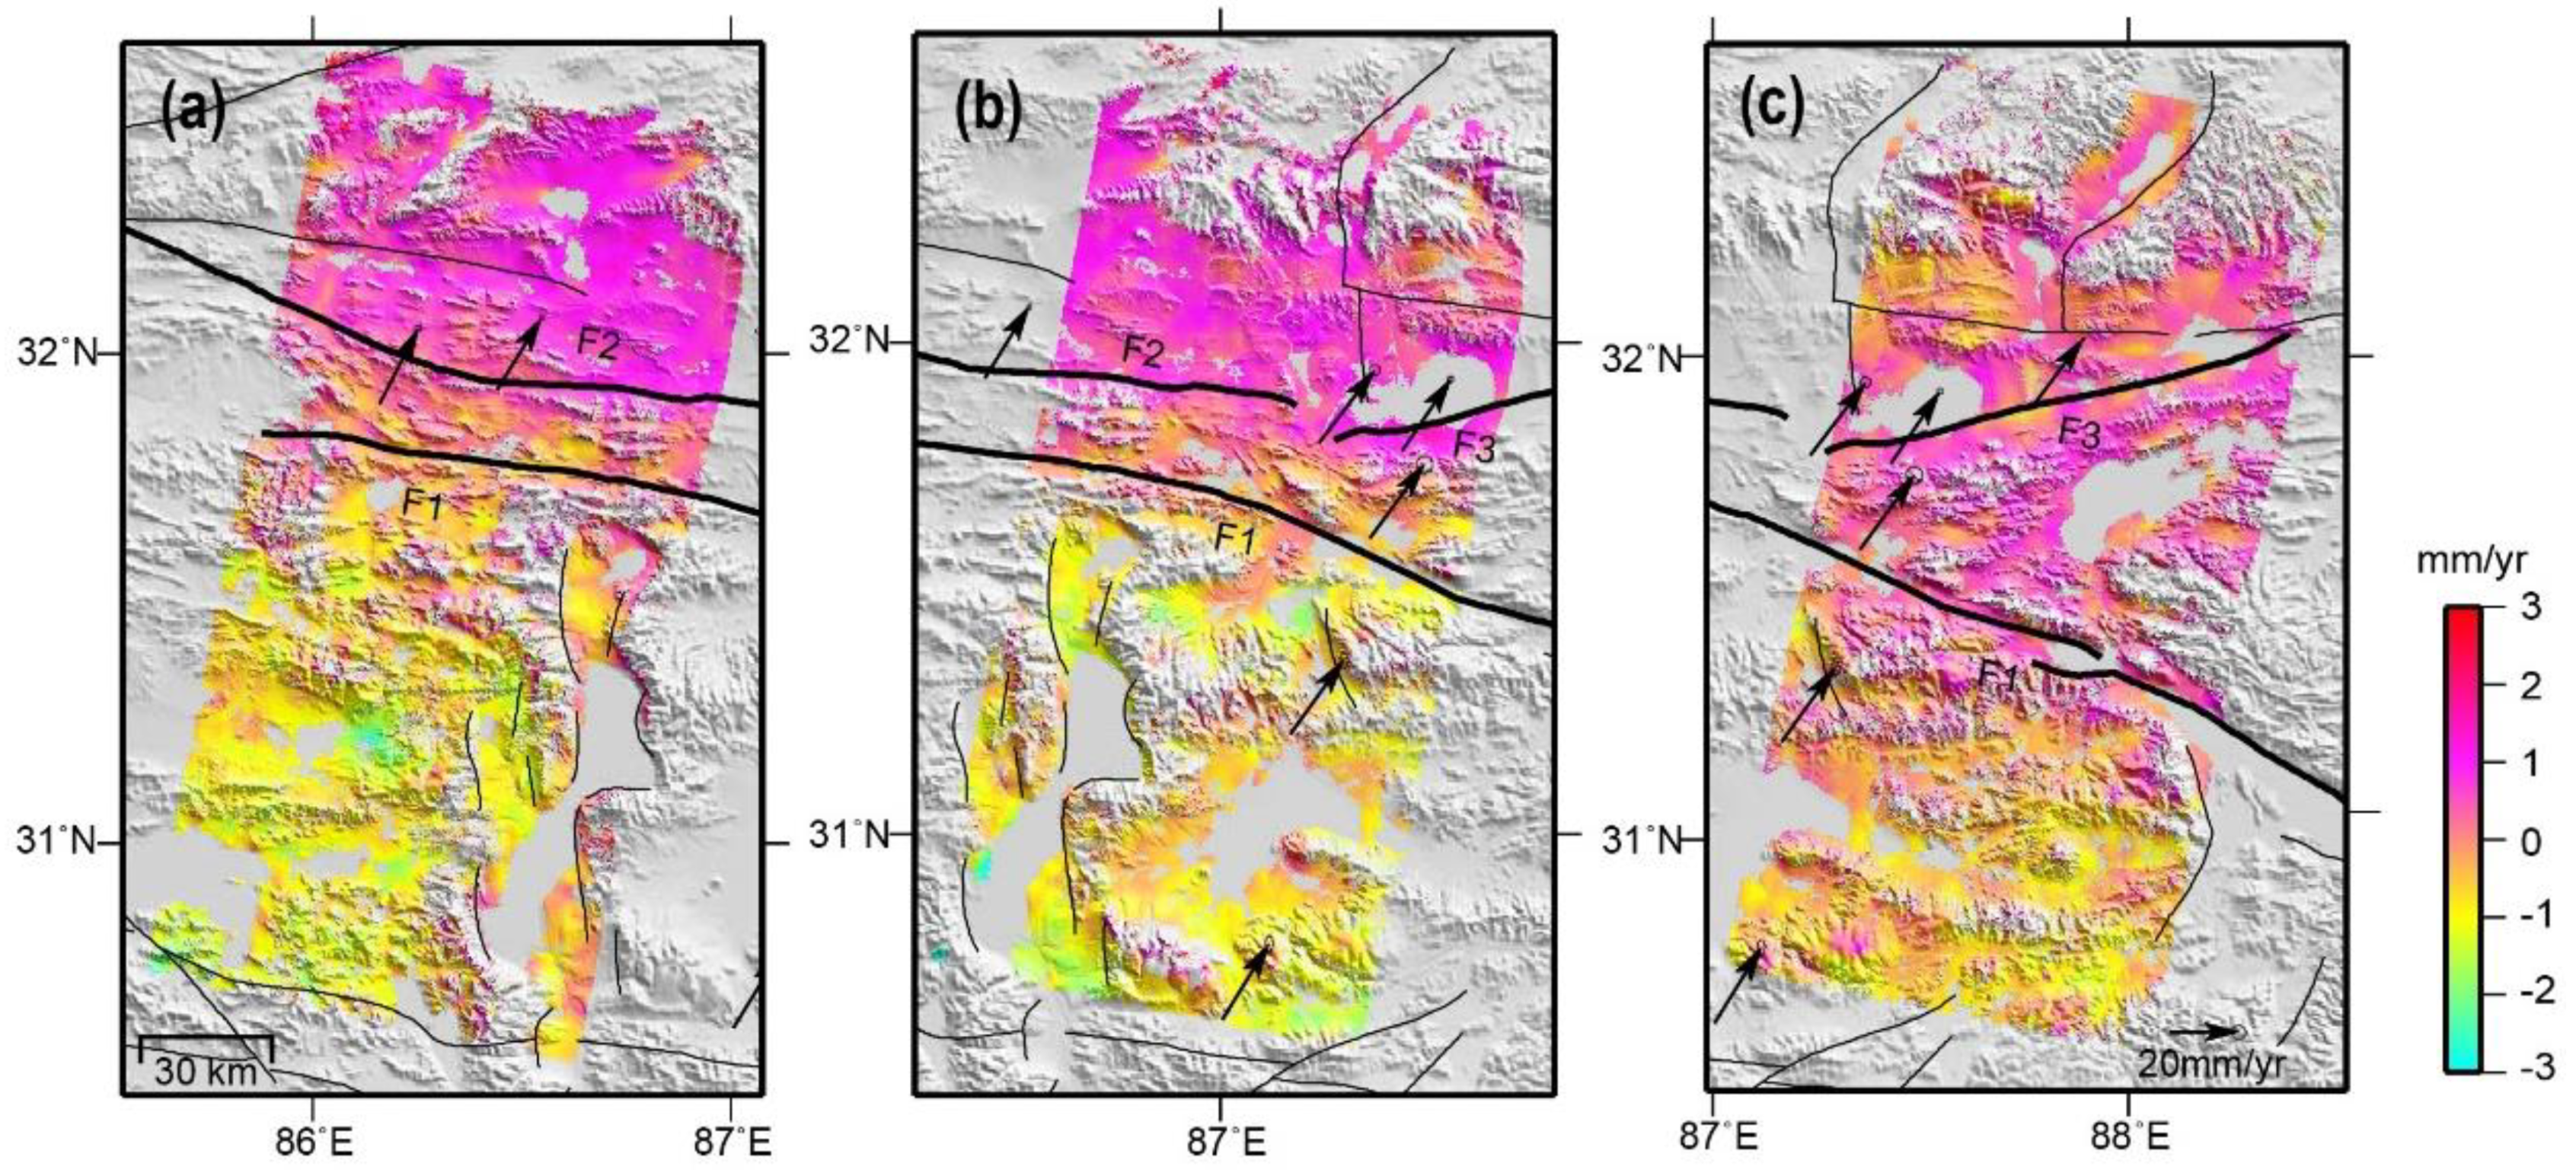
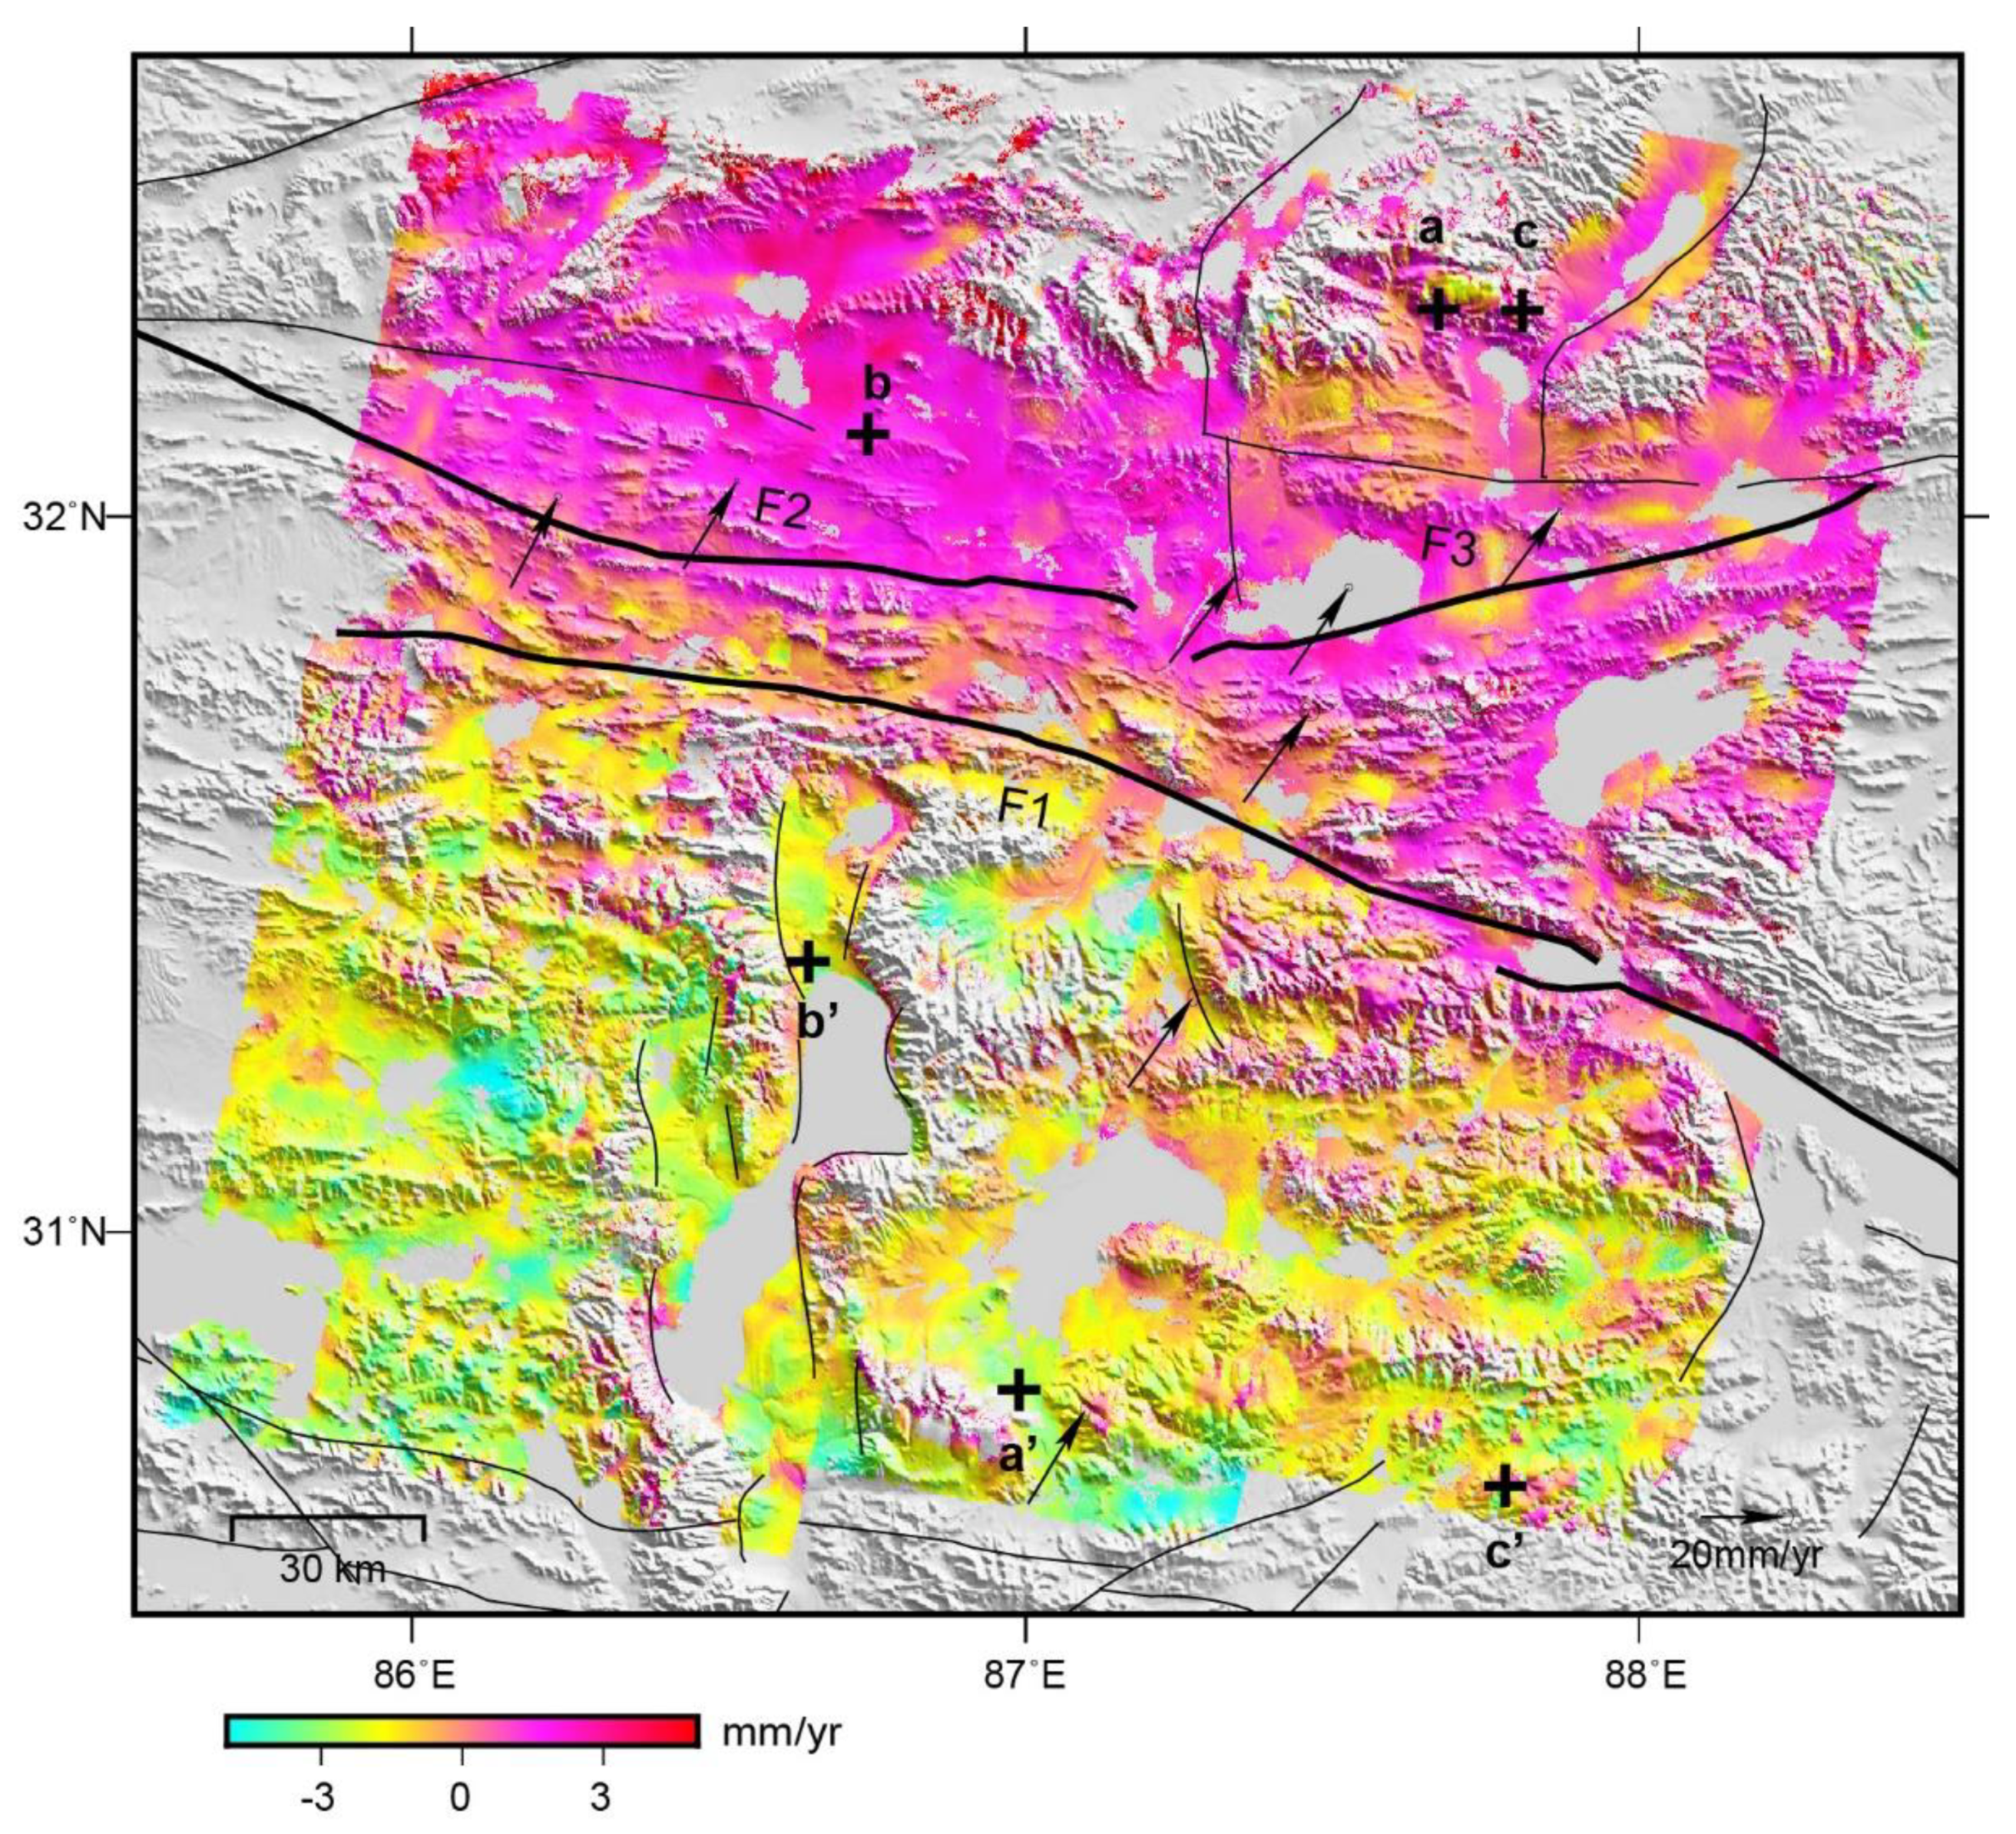
2.2. InSAR Velocity Field

Figure 3 shows the average crustal deformation velocity results (radar line-of-sight (LOS) direction) of three adjacent orbits of the Gyaring Co fault zone as processed through the π-RATE software. In addition to the coherence loss in the water region, the overall coherence was favorable, and the deformation field had good tendency. The Gyaring Co fault zone controlled the long-wavelength regional deformation characteristics with an indication of right-lateral strike-slip movement. The western T305 and central T33 (Figure 3a,b) showed clear far-field differential movement characteristics on both sides of the Gyaring Co fault at a rate of 2–4 mm/y. The eastern T262 (Figure 3c) demonstrated that the far-field differential movement velocities on both sides of the Gyaring Co fault were slightly less than that of the T305 and T33 orbits at a rate of approximately 1–3 mm/y. The Gase fault was in close proximity to the Gyaring Co fault; its deformation characteristics were not clear. The two faults in the deep zone may also have merged into a same fault zone and jointly controlled the overall deformation characteristics of this region. Other faults distributed in this region, such as the Doma–Nima fault, were not obvious in the differential movement on both sides. Figure 3 shows that the Gyaring Co fault should be the most active in this region.

2.3. Accuracy Assessment of InSAR Velocity Field

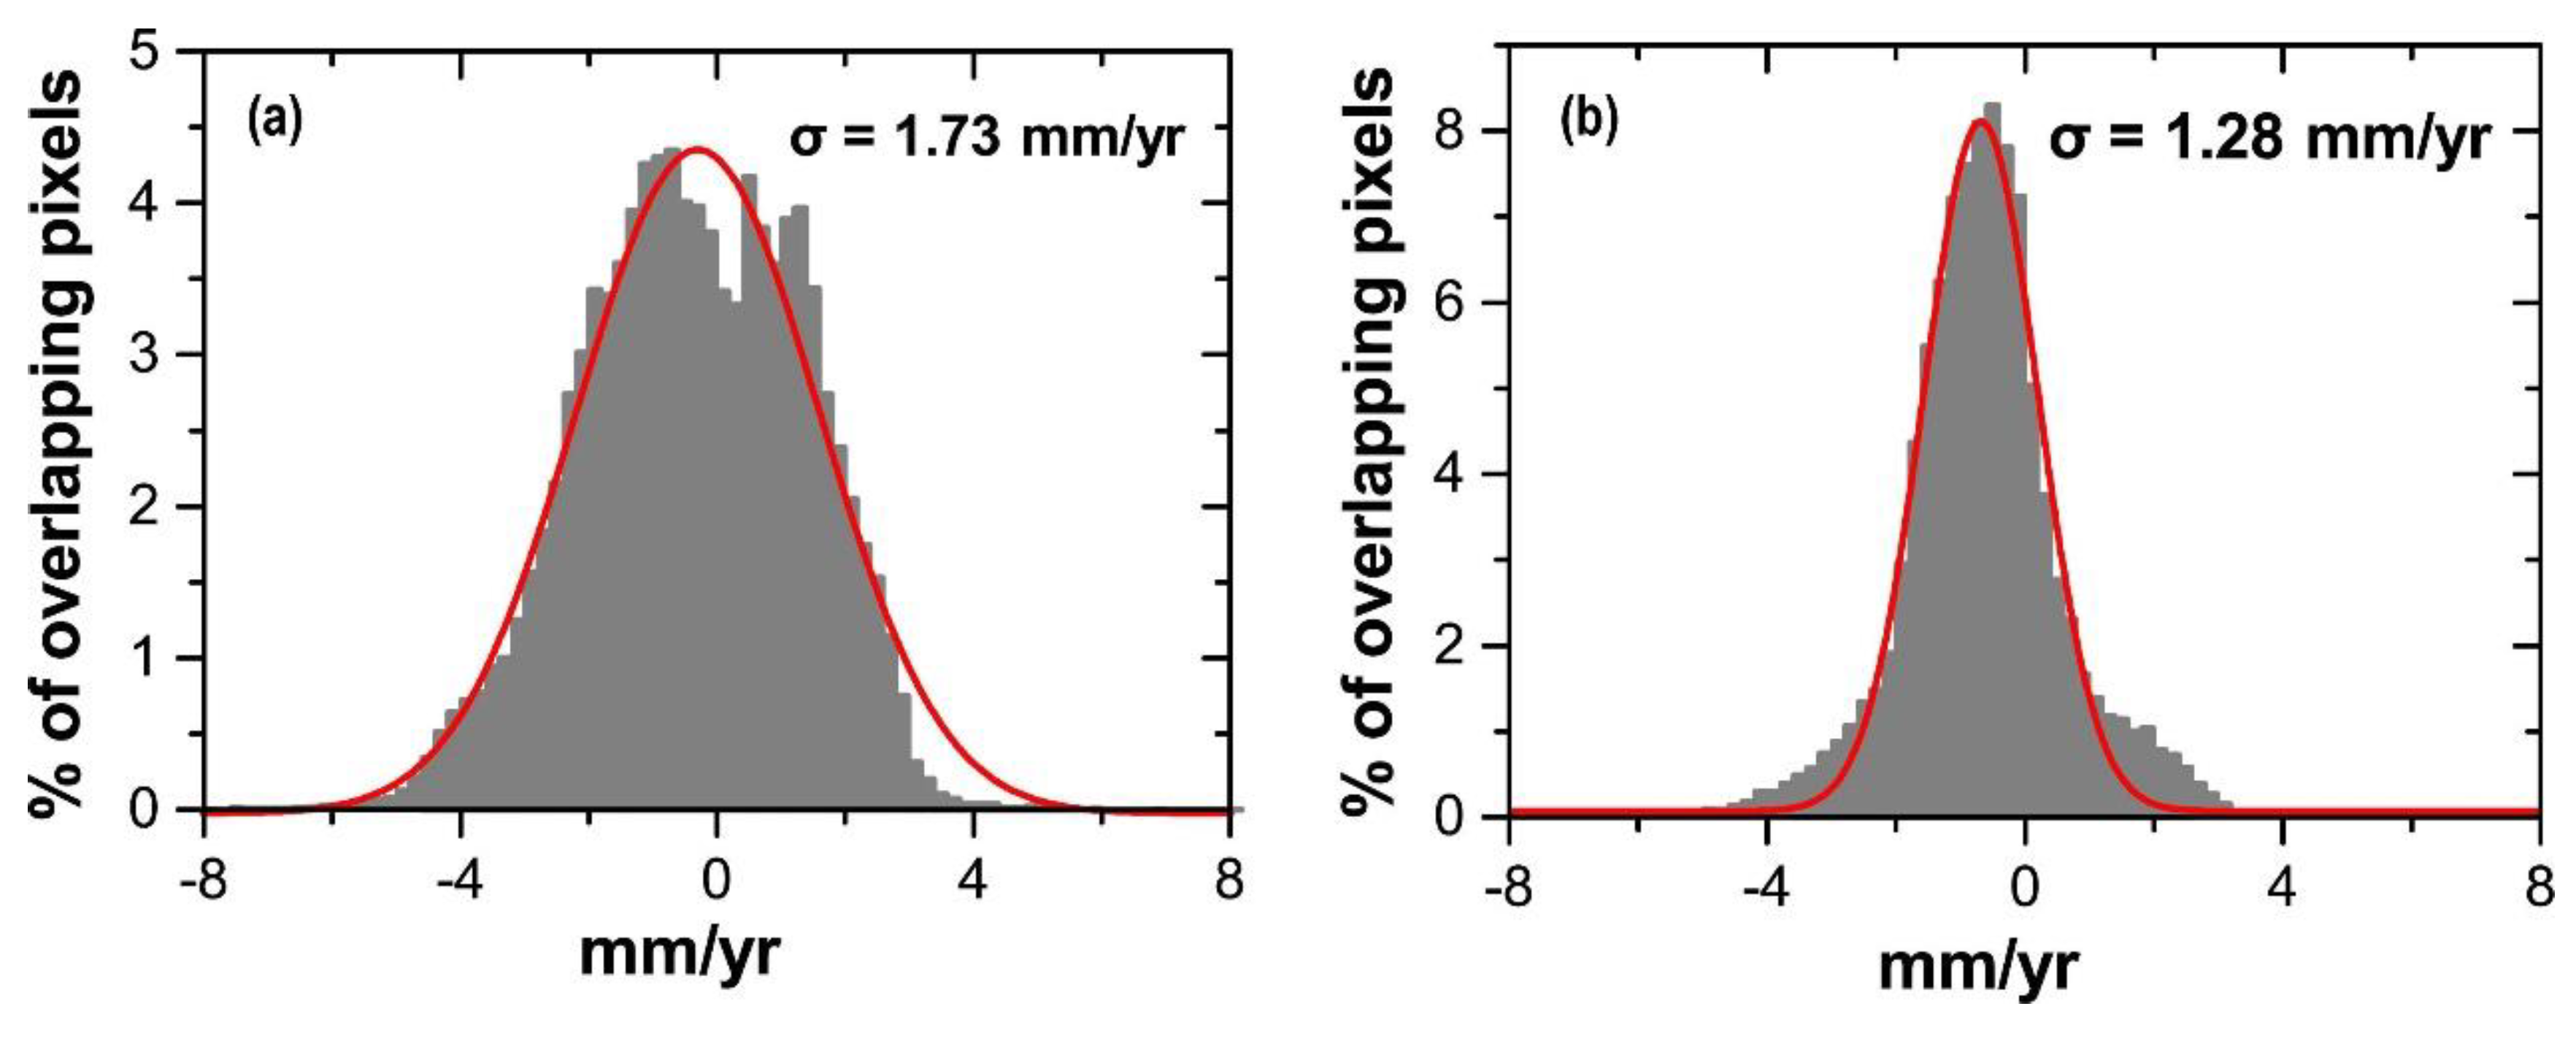
2.3.1. Accuracy Assessment of Overlapping Areas of Adjacent Orbits

By calculating the standard deviation of the difference values in the overlapping areas between three independent tracks, the internal accuracy of the InSAR results can be verified. In this study, the difference value statistics of the overlapping areas of the three track deformation fields, which were parallel to the fault, were determined. Figure 4a,b shows the difference value histograms of the deformation velocity of the overlapping areas between the two adjacent tracks of T305 and T33 and the two adjacent tracks of T33 and T262, respectively. The red solid line represents the optimal Gaussian fitting curve of the histogram, and the value shows the standard deviation of the Gaussian fit. According to the histogram statistics, the velocity difference of the overlapping areas between the two sets of adjacent orbits was in accordance with the normal distribution. The standard deviation of the velocity difference was 1.73 and 1.28 mm/y, respectively, which was considered 20.5 times the accuracy of the single orbital deformational velocity. In other words, the orbital deformational velocity accuracies of T305 and T262 were 1.22 and 0.91 mm/y, respectively. Because the T33, T205, and T262 orbits overlapped, the deformation velocity accuracy of T33 should be the average of the two tracks (i.e., 1.07 mm/y).

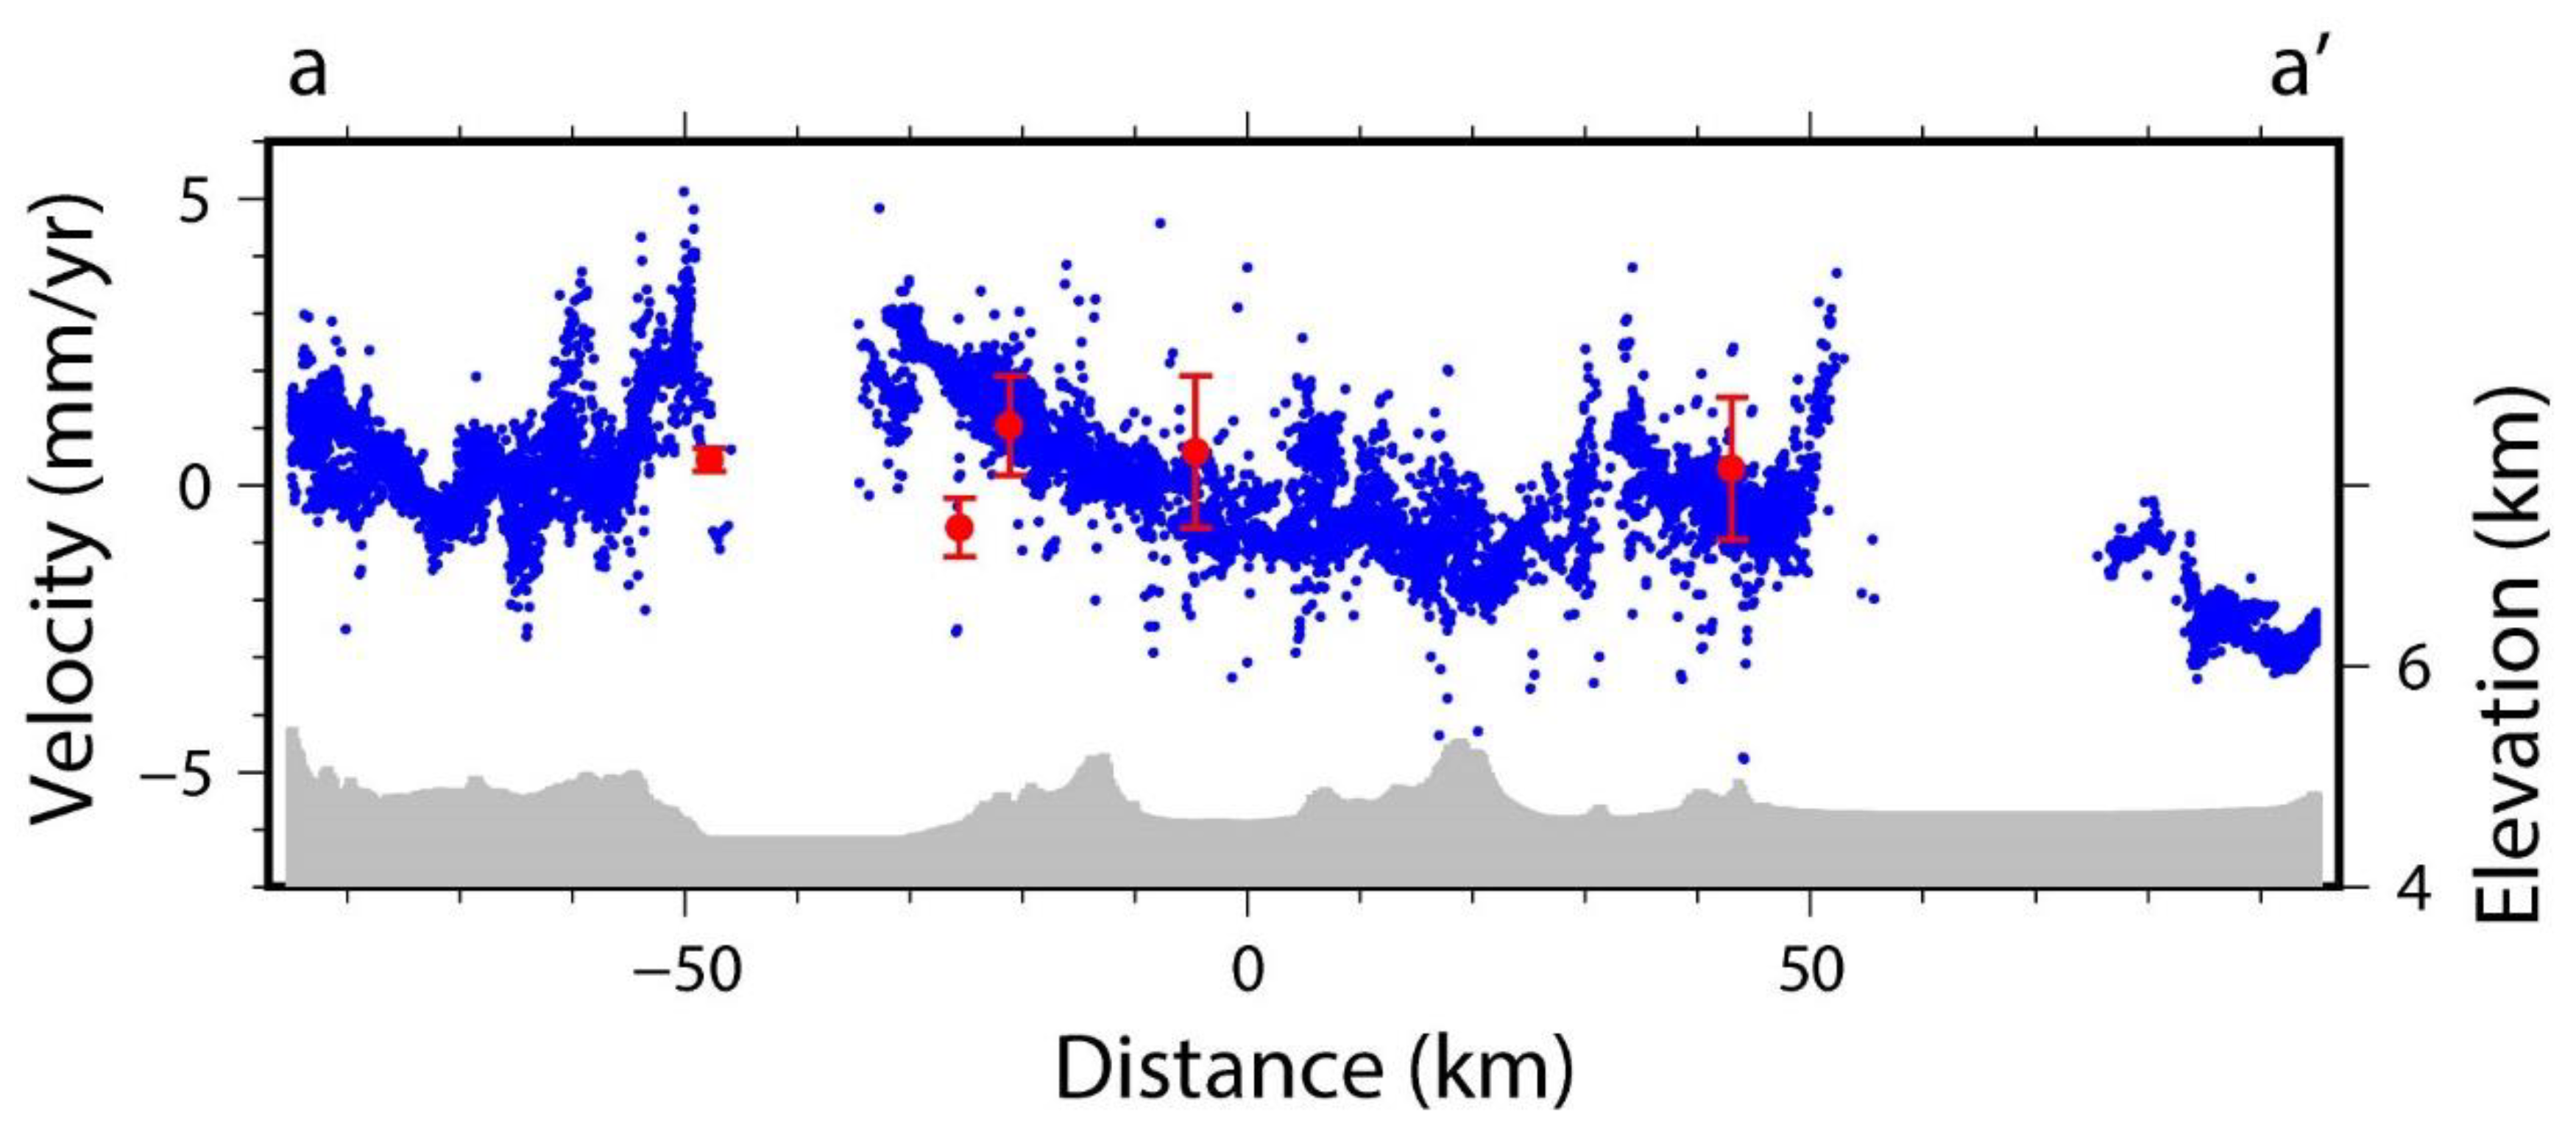
2.3.2. Comparisons between InSAR and Global Position System (GPS) Results

Previous studies have shown that the Gyaring Co fault is a right-lateral strike-slip fault. Thus, ignoring its vertical motion component, the radar line-of-sight (DLOS) deformation rate was converted into the fault parallel velocity (Dfault) [29] through the radar incident angle (θ), DLOS azimuth (α), and fault strike (β).
Dfault = DLOS/sin(θ) · cos(α − β).
Furthermore, the fault parallel deformational fields of the three tracks were spliced to obtain the average inter-seismic crustal deformation rate field along the fault parallel direction of the entire Gyaring Co fault zone from 2003 to 2010 (Figure 5).
To compare the results of the InSAR and GPS deformation rates, we selected a cross-section of aa’, and extracted the InSAR deformation rate within 5 km of the profile line and the velocity results of the GPS stations within 100 km, respectively (Figure 6). The GPS measurements used in this study were provided by Zheng et al. [18]. The GPS data were collected through campaign and continuous modes, with surveying times in 1998, 1999, 2001, 2004, 2007, 2009, 2011, 2013, and 2015. During GPS data processing, nontectonic signals and influences of large earthquakes (e.g., the 2011 M 9.0 Tohoku earthquake) were reduced. The long-term velocity of each station was achieved through the least-squares theory. All GPS velocities were converted to the Eurasian reference frame. In this study, to compare the InSAR and GPS results, we projected the GPS velocities onto the fault-parallel direction, and an offset was removed before plotting the InSAR and GPS results on a same map. Figure 6 shows the comparison results. The two can be seen to be consistent, indicating that the Gyaring Co fault mainly moved horizontally. Since the standard deviation of the difference value between the InSAR and GPS was 1.41 mm/y, along with the single orbital accuracy obtained from the overlapping areas of adjacent orbits described in Section 2.3.1, it was concluded that the accuracy of the InSAR deformation rate was within 2 mm/y. At the same time, it was seen from the profile line of aa’ that the Gyaring Co fault was the main fault section, with a deformation gradient change of 2–3 mm/y on both sides of the fault. Figure 6 shows that only five GPS sites were used to evaluate InSAR deformation, and the sparse distribution of the GPS sites may not have been very convincing. However, Figure 6 shows the first-order tendency was consistent between GPS and InSAR results. Therefore, we believed our InSAR deformation results were reliable and had a high precision.

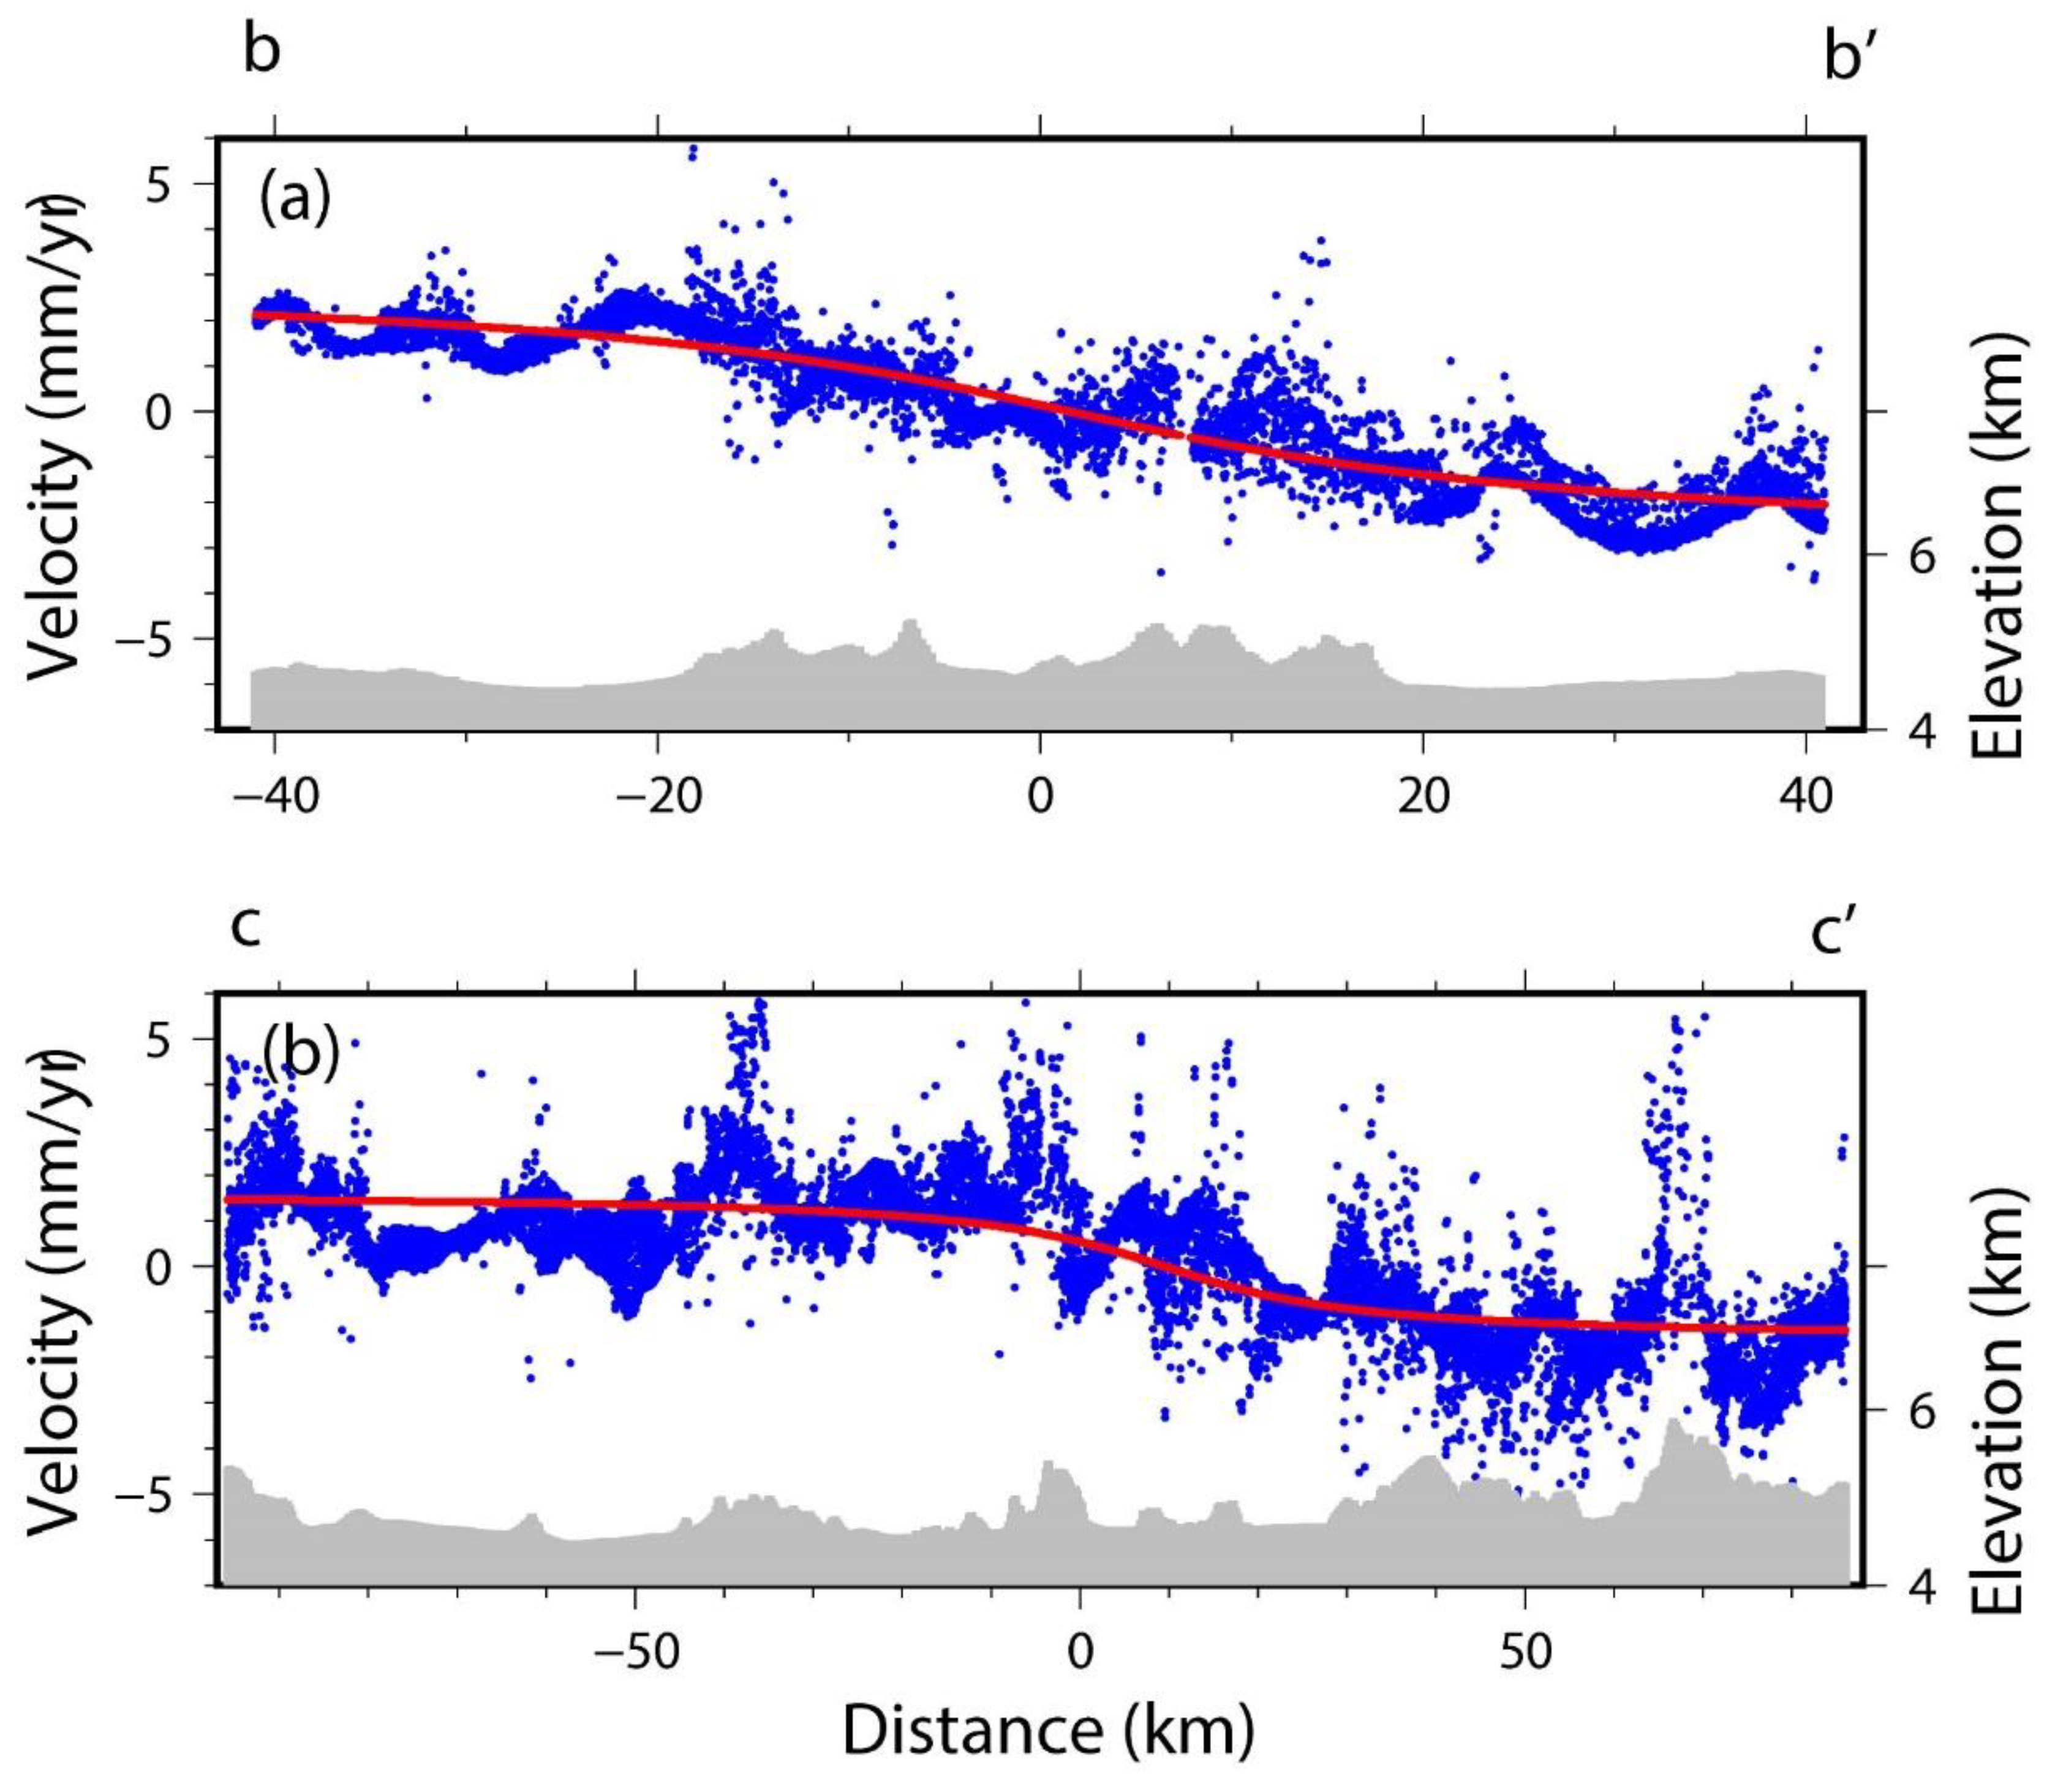
3. Inter-Seismic Slip Rates and Locking Depth of the Gyaring Co Fault Zone

Savage et al. [30] established a one-dimensional inter-seismic dislocation model for a strike-slip fault based on deformation observational data: the arctangent dislocation model (also termed the screw dislocation model). This model assumed that the fault plane infinitely extended from the surface to the ground and divided itself into upper and lower parts at a certain depth. The lower part was free to slide, but the shallow part (the brittle upper crust) could not freely slide. The free slide of the deep fault plane loaded the shallow fault plane, which generated strain accumulation; that is, the shallow fault plane was locked. The locking depth, defined by a deep demarcation, was related to the thickness of the regional seismogenic stratification. The horizontal deformation y at a vertical distance of x from the fault plane was defined as follows, where s was the slip rate, and d was the locking depth:
y = ( s / π ) × arctan ( x / d ) .
To invert the slip rate and the locking depth of the fault, we extracted the InSAR deformation rate within 5 km of the profile line along the three profiles of bb’, cc’, and dd’ (shown in Figure 5). The fault’s slip rate and the locking depth were fitted using Formula (2). Therefore, a section view was generated and shown in Figure 7. The blue dot in the figure represented the InSAR deformation rate, which featured an S-shaped arctangent curve with a minor difference in the movement of the near-field fault and a major difference in movement of the far-field fault. The curve manifested the typical characteristics of strike-slip fault seismic movement. The solid red line was the result of the arctangent fitting, consistent with the results of InSAR. Through inversion, the slip rate of the western section of the Gyaring Co fault was 5.86 mm/y with a locking depth of 20 km, and the slip rate of the eastern section was 3.25 mm/y with a locking depth of 16 km.

4. Discussion

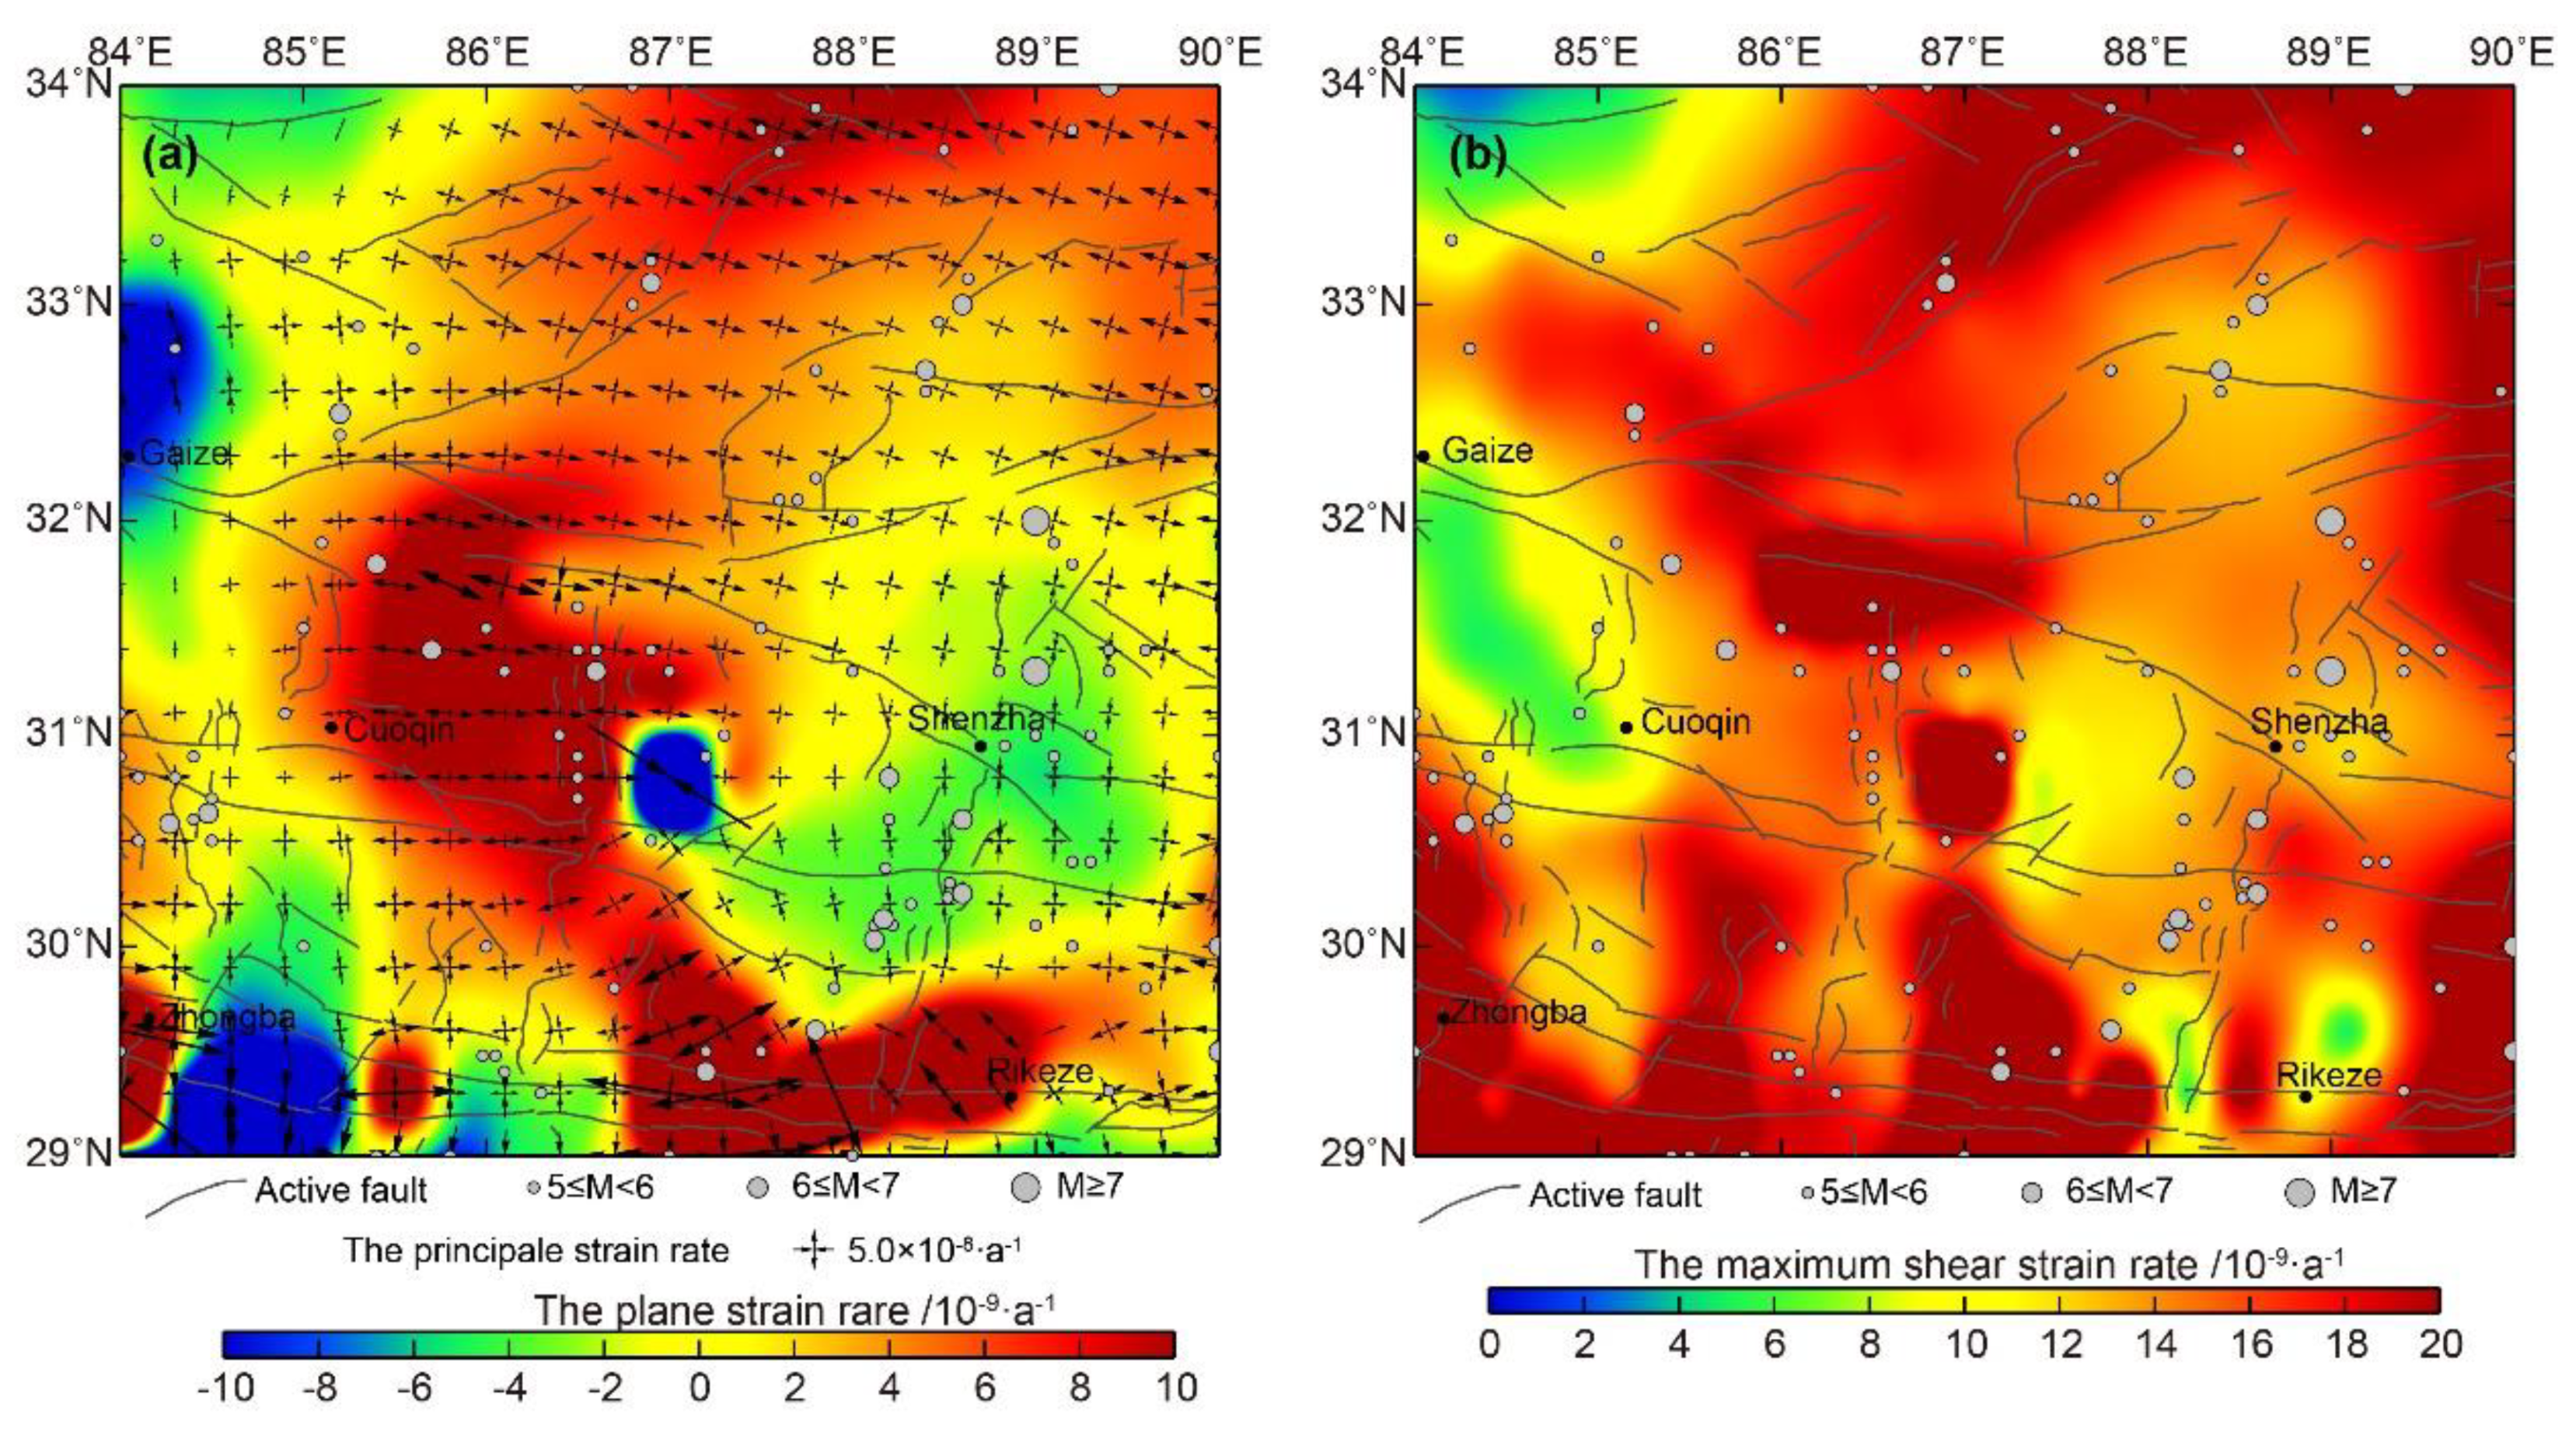
4.1. Analysis of the Current Crustal Strain State of the Gyaring Co Fault and Nearby Areas

As the distribution of actual crustal movement observational sites is often sparse and uneven, along with discontinuous tectonic deformation, it is particularly important to use the observation deformational field to further calculate the continuous deformation and strain field. Shen et al. (2015) [31] proposed an optimal method to interpolate discrete geodetic observational data and applied it to the calculation of the horizontal strain rate field in southern California, USA. Based on a weighted smoothing factor with prior constraints, this method acquired the best fitting of the observational data. For any site, the horizontal displacement field of its nearby interpolation point was calculated using a method of bi-linear function interpolation. The model parameters on the spherical surface included terrain translation, rotation, and strain rate. To estimate the evaluated site model parameters and minimize the fitting residual of the velocity field, the method used the GPS velocity field of an adjacent region weight with the aid of the least minimum squares method. For the selection of the best weight, we used distance-related weights as follows:
L i = exp ( Δ R i 2 D 2 ) ;
W = i L i V i ;
where L i is a Gaussian function, V i depends on the area of the Voronoi unit, Δ R i is the distance between the calculation points and GPS sites, and D is the spatial smoothing distance parameter in which different values are used for different sites [31]. To determine the optimal smoothing distance D , a parameter W t is introduced to represent the weighted coefficient and threshold, and an equation W ( D ) = W t is also set. With the increase in W t , additional GPS data are included, while for a decreasing W t less GPS data are included. Normally, the value of W t is determined from multiples of six. Unlike previous research [31,32], we used a relatively small value W t = 6 for calculations because of the limited research region.
The research area was the middle area between the Qiangtang and Lhasa terranes. The area is mainly composed of east–west strike-slip faults and north–south-striking extensional faults. The surface, main, and maximum shear strain rates, reflected by GPS observations (Figure 8), show that the surface strain of the whole area is mainly an extension, which reflects the typical east–west extensional tectonics of the central and southern parts of the Qinghai–Tibet Plateau. The middle and western sections of the Gyaring Co fault, in the middle of the study area, are characterized by extensions at a rate greater than 1.0 × 10⁻⁸ per year. However, the eastern section is characterized by minor compression. The history of the fault indicates that the seismic activity is weak with the occurrence of several earthquakes of magnitude 5.0 to 6.0. Most of the earthquakes have occurred in the east-central section. From the perspective of the main strain rate, the Gyaring Co fault is a right-lateral strike-slip fault. The slip rate of the western section is significantly higher than that of the eastern section, which is similar to the relevant geological survey results. Between the Gyaring Co and the Yarlung Zangbo river fault zones, a rift along the north–south direction is seen. This rift features a west–east extension, which is also seen from the surface strain rate and the main strain rate. The shear deformation of the entire area is marked with a rate greater than 1.0 × 10⁻⁸/a in most regions. In some areas such as the western section of the Gyaring Co fault, the northern Himalayan fault, and the Yarlung Zangbo fault, the maximum shear strain rate exceeds 2.0 × 10⁻⁸/a. The north–south normal fault demonstrates high-shear deformation that is nearly orthogonal to the east–west fault. Historically, these areas were significantly and seismically active.

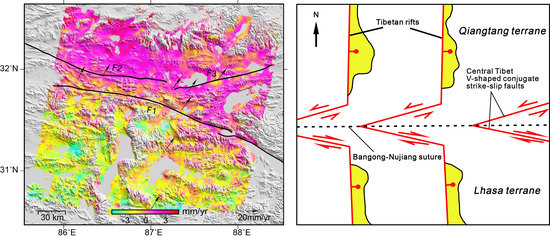
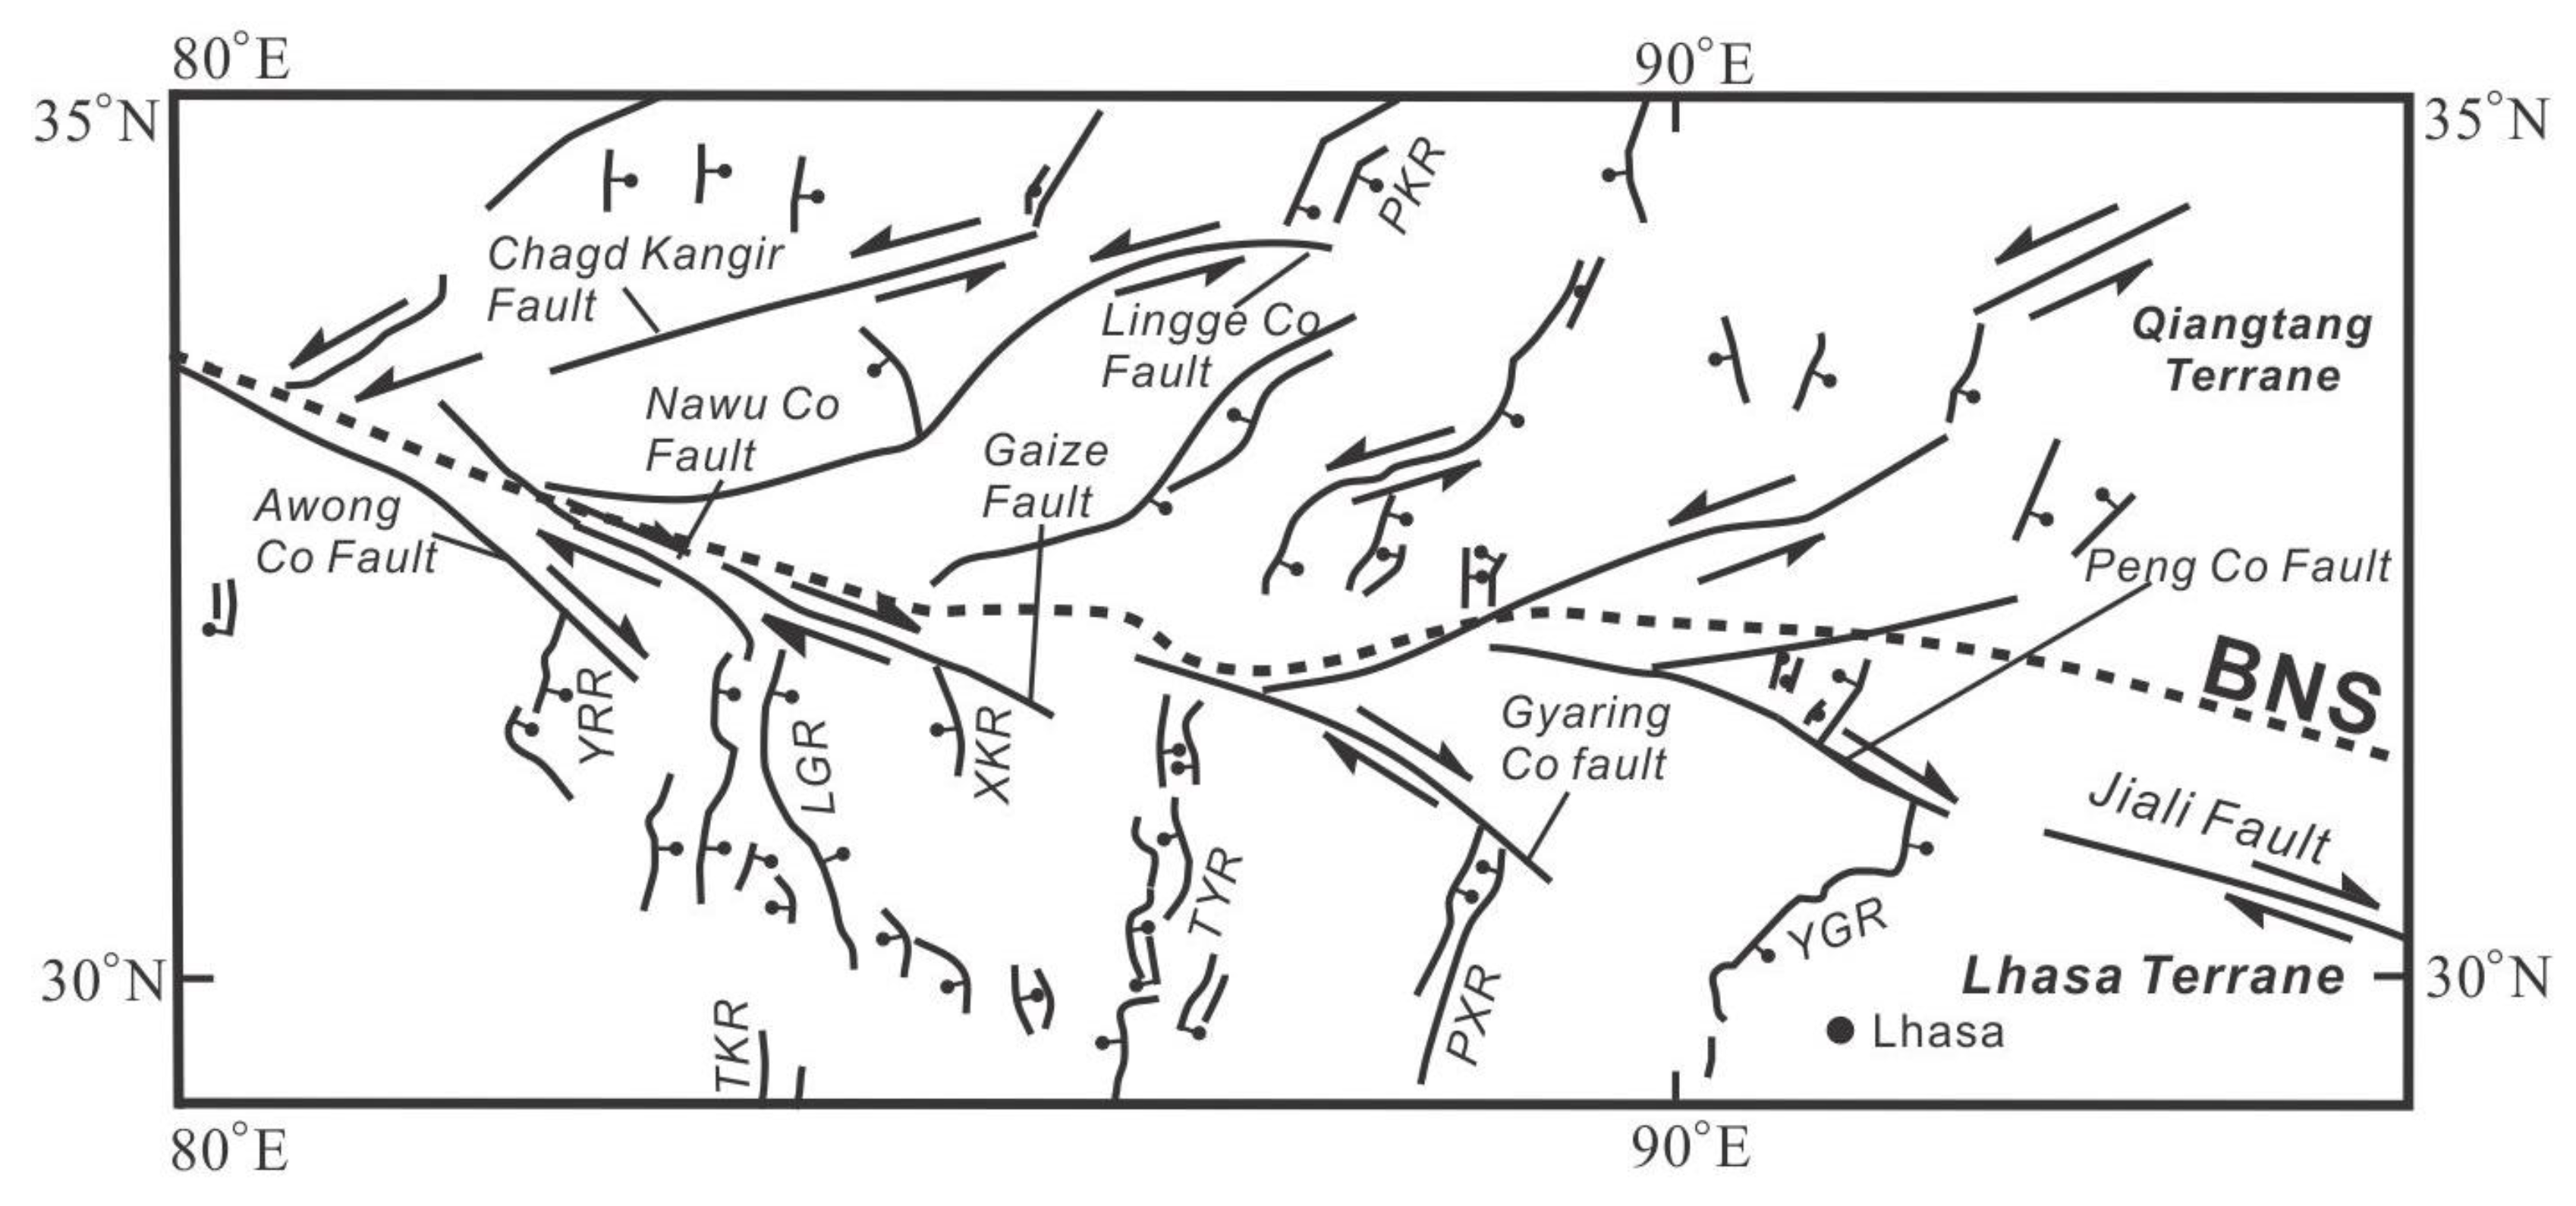
4.2. Regional Fault Movement Indicated by the InSAR Deformation Field

The InSAR deformation field showed that the Gyaring Co fault controlled the long-wavelength deformation signal of the whole research area, and the activities of the other faults were weak. Then, we used a screw dislocation model to inverse the slip rate and locking depth of the Gyaring Co fault on different segments. Four parameters were estimated from fault-normal InSAR profiles: slip rate at depth (mm/y), locking depth (km), location of the fault (km) (i.e., horizontal shift), and a shift in the reference point for velocity (i.e., vertical shift). The inversion of the InSAR deformation section showed that the slip rate of the Gyaring Co fault was approximately 6 mm/y to the west and approximately 3 mm/y to the east, indicating that the fault had segmented differential activity. The locking depths of the east and west portions were relatively similar: approximately 16–20 km. As shown in Figure 7, the cross-fault deformation section showed an inverse S-shaped curve with a minor difference in the near-field and a major difference in the far-field deformation on both sides of the fault, consistent with the theoretical model of strike-slip strain loading during the seismic activity period. Therefore, a certain degree of strain accumulation should be in the Gyaring Co fault. Additionally, the distribution of strong earthquake activities in the region, as shown in Figure 1b, indicated that current seismic activity along the Gyaring Co fault was weak with less released strain accumulation. Comprehensive analysis of the Gyaring Co fault indicated a background of strong earthquakes. The northeast-trending Doma–Nima fault, obliquely intersecting the Gyaring Co fault, had nearly no deformational difference on both its sides. The current strain accumulation is relatively weak with a relatively low risk of earthquakes.

4.3. Analysis of the Kinematic Characteristics of Regional Tectonics

A large-scale, east–west strike-slip fault system developed inside the Qinghai–Tibet Plateau. The Gyaring Co fault, in the south-central part of the plateau, is generally considered as a part of the Karakoram–Jiali fault zone. Based on previous research of faults, the results of remote sensing interpretation of the entire fault and the investigation of Gyaring Co’s central part showed that the fault could be divided into three sections: southeastern, northwestern, and central sections. Geological research [33] showed that the lengths of the southeastern and northwestern sections were approximately 40–50 km, and these were dominated by normal fault movement with minor strike-slip movement. Possible influential factors are the Shenzha–Dingjie fault and Wuru Co left-lateral fault. The central section is the main part of the Gyaring Co fault, and it is approximately 150 km long; the overall activity shows strike-slip with a slight normal component. Most of the displacements occurred together in this area since the late Quaternary, breaking a series of alluvial fans and drainage systems. The central section is the most active and can best reflect the overall activity of the entire Gyaring Co fault. The current regional crustal movement results, based on InSAR technology, showed that the Gyaring Co fault controlled the crustal deformation tendency of the whole area, which agreed with GPS horizontal movement results. The crustal movement results also indicated that the current Gyaring Co fault mainly showed strike-slip movement, which fitted the background of a large-scale right-lateral shearing movement and the Qiangtang and Lhasa terranes bounded by the Bangong–Nujiang suture zone. However, the Gyaring Co fault had a low right-lateral strike-slip rate, far from the rate of the boundary fault, and may only be an adjustment of the east–west extension. The modern activities of other strike-slip faults in the Karakoram–Jiali fault zone in the Qinghai–Tibet Plateau are also relatively weak. It is speculated that the velocities of the strike-slip faults within the Qinghai–Tibet Plateau since the Late Quaternary are not particularly high compared to that of the Gyaring Co fault. Deformation inside the plateau may not be of a rigid terrane mode, as the deformation stress may be scattered within the plateau. The north–south normal fault movement component of the strike-slip fault system inside the Qinghai–Tibet Plateau, as well as the east–west extension of the large rift system, indicate that the collisional deformation of the Indian plate and the Eurasian plate may be adjusted by the diffusive deformation mode within the Qinghai–Tibet Plateau [34].

4.4. Tectonic Style of the Bangong–Nujiang Suture

Figure 9 shows a tectonic map of the Bangong–Nujiang suture zone and surrounding areas in the central Qinghai–Tibet Plateau [35]. It can be seen that a v-shaped conjugate fault formed along the Bangong–Nujiang suture zone, which was possibly caused by two sets of Riedel shears that were formed between parallel and adjacent shear zones with opposite shear directions. Specifically, formation of the eastern left-lateral shear zone in the Qiantang terrane may generate an east–northeast-trending left-lateral strike-slip fault, while the formation of the eastern right-lateral shear zone in the Lhasa terrane may produce a west–northwest-trending right-lateral strike-slip fault. However, the v-shaped conjugate fault did not extend into most areas in the southern Himalayas, the northern Qaidam Basin, and Qilian Mountains. The cold and thick mantle lithospheres in the Qaidam Basin and the Himalayas may hinder flow deformation and, thus, block the development of the Riedel shear zone. In addition, a lack of strike-slip faults in the southern and northern parts of the Qinghai–Tibet Plateau can be attributed to the spatial variation in the stress intensity, which is mainly affected by the current thermal state in the lithosphere and a rapid decrease in the shear strain rate in the northern and southern Himalayan orogenic belts. Nonetheless, a series of north–south- or north–northeast-trending rifts have grown on the north and south sides of the v-shaped conjugate fault.
By studying the regional tectonic dynamics and kinematics, Yin and Taylor (2011) [35] provided a possible model for the formation of regional v-shaped conjugate faults (Figure 10). In the central Qinghai–Tibet Plateau, seismic research has shown that the lithosphere in this area is thin and has a tendency of flow deformation. Meanwhile, the asthenosphere in the central Qinghai–Tibet Plateau exerts base shearing to the east, forcing the thickened lithosphere to expand eastward. The two-way subduction of the Indian and Asian mantle lithospheres may lead to a north–south contraction of the hot asthenospheric channel, causing the asthenospheric channel to flow eastward, resulting in paired Riedel shear deformations in the upper crust of the central Qinghai–Tibet Plateau. There is a transition in the intermediate compressive stress direction. In other words, the compressive stress changes from a vertical direction in the conjugated strike-slip fault zone to a horizontal direction in the south and north rift zones, forming a south–north tension rift in the Qiangtang and southern Lhasa terranes in the northern Qinghai–Tibet Plateau. Thus, a combination of strain state and stress state determines the formation and direction of the fault.

5. Conclusions

Because of the persistent northward movement of the Indian plate and blockage of the Eurasian continent, the Qinghai–Tibet Plateau has been extruded by its north–south compressive stresses since its formation, causing the plateau to escape eastward, forming a large-scale, east–west strike-slip fault. The Karakorum–Jiali fault, a boundary fault between the Qiangtang and Lhasa terranes, plays an important role in the regional tectonic evolution of the Qinghai–Tibet Plateau. The Gyaring Co fault, in the middle of the Karakoram–Jiali fault zone, has seen cases of strong earthquakes, showing a strong earthquake occurrence background. Therefore, present-day deformation of the Gyaring Co fault is very important to understand the regional kinematics. In this study, based on Envisat data, we obtained a high-precision and a high-spatial resolution deformation field of the Gyaring Co fault in the central Qinghai–Tibet Plateau using InSAR technology, and the slip rate and locking depth of the fault were also inverted. Based on the regional GPS horizontal velocity field, the regional strain state was calculated, and a kinematics analysis of the regional tectonics was conducted. The conclusions are as follows:
(1) Based on an elaborate InSAR data processing strategy, high-precision deformation fields are achieved. The InSAR results are consistent with GPS observations with an accuracy of smaller than 2 mm/y. The InSAR deformation field shows that the Gyaring Co fault controls the regional crustal deformation pattern, and the deformation difference in the far-field on both sides of the fault is approximately 3–5 mm/y (parallel to the fault). Our results indicate that it is possible to obtain a high-precision deformation field using the InSAR technique.
(2) Based on the classical screw dislocation model, we inverse the slip rate and locking depth of the Gyaring Co fault by using the InSAR-derived deformation field as a constraint. The results show that the slip rate of the Gyaring Co fault is approximately 3–6 mm/y with a locking depth of approximately 20 km. A strain is probably present at the Gyaring Co fault during the InSAR data span. Therefore, future seismic risk related to the Gyaring Co fault cannot be ignored.
(3) After analysis of the kinematic characteristics and tectonic style of the regional tectonics around the Bangong–Nujiang suture zone, a possible model for the formation of regional v-shaped conjugate faults was put forward by previous researchers. Our InSAR-derived deformation field gives a clear movement pattern around the Gyaring Co fault region. The Gyaring Co and Doma–Nima faults are among several other conjugated v-shaped shear fault systems that have formed along the Bangong–Nujiang suture zone in the central Qinghai–Tibet Plateau.

Author Contributions

Conceptualization, Y.Z. and C.L.; methodology, Y.Z.; software, W.Z.; validation, Y.Z. and F.J.; formal analysis, Y.Z.; writing—original draft preparation, Y.Z. and F.J.; writing—review and editing, Y.Z., C.L. and W.Z..

Funding

This research was supported and funded by the National Natural Science Foundation of China (No. 41774011, 41604015), and the Fundamental Research Funds for the Central Universities, CHD (No. 300102269204).

Acknowledgments

Constructive comments by the Editors and two anonymous reviewers significantly improved the scientific content and clarity of the paper. The Envisat ASAR images are copyrighted by the ESA. Special thanks are extended to Wang Hua of the Guangdong University of Technology for providing the π-RATE software package.

Conflicts of Interest

The authors declare no conflict of interest.

References

  1. Armijo, R.; Tapponnier, P.; Mercier, J.L. Quaternary extension in southern Tibet: Field observations and tectonic implications. J. Geophys. Res. Solid Earth 1986, 91, 13803–13872. [Google Scholar] [CrossRef]
  2. Armijo, R.; Tapponnier, P.; Han, T. Late Cenozoic right-lateral strike-slip faulting across southern Tibet. J. Geophys. Res. 1989, 94, 2787–2838. [Google Scholar] [CrossRef]
  3. Molnar, P. The geologic evolution of the Tibet plateau. Am. Sci. 1589, 77, 350–360. [Google Scholar]
  4. Wu, Z.; Cao, Z.; Shen, B.; Deng, Q. Seismogenic tectonics in the central Tibet. earthquake research in china. Chin. J. Geophys. 1994, 10, 19–27. [Google Scholar]
  5. Yang, P.; Chen, Z.; Zhang, J.; Ren, J. The tension-shear of Gyaring Co Fault and the implication for dynamic model in South-central Tibet. Chin. J. Geophys. 2012, 55, 3285–3295. [Google Scholar]
  6. Shen, J.; Wang, Y.; Ren, J. Quaternary dextral shearing and crustal movement in southeast Tibetan Plateau. Xinjiang Geol. 2003, 21, 120–125. [Google Scholar]
  7. Zhong, D.L.; Ding, L. Research on the uplift process and mechanism of the Tibetan plateau. Sci. China (Ser. D) 1996, 26, 289–295. [Google Scholar]
  8. Wang, Q.; Zhang, P.Z.; Freymueller, J.T. Present-Day crustal deformation in China constrained by global positioning system measurements. Science 2001, 294, 574–577. [Google Scholar] [CrossRef]
  9. He, S.; Ding, L.; Wu, G. Quaternary activity of Ziguicuo Fault in Gayringco area, south Xizang, and its tectonic implications. Chin. J. Geol. 2002, 37, 8–12. [Google Scholar]
  10. Ren, J.; Shen, J.; Cao, Z.; Wang, Y. Quaternary Faulting of Jiali Fault, southeast Tibetan Plateau. Seismol. Geol. 2000, 22, 344–350. [Google Scholar]
  11. Massonnet, D.; Rossi, M.; Carmona, C.; Adragna, F.; Peltzer, G.; Feigl, K. The displacement field of the landers earthquake mapped by radar interferometry. Nature 1993, 364, 138–142. [Google Scholar] [CrossRef]
  12. Ji, L.; Wang, Q.; Xu, J.; Ji, C. The July 11, 1995 Myanmar–China earthquake: A representative event in the bookshelf faulting system of southeastern Asia observed from JERS-1 SAR images. Int. J. Appl. Earth Observ. Geoinf. 2017, 55, 43–51. [Google Scholar] [CrossRef]
  13. Gonzalez-Ortega, A.; Fialko, Y.; Sandwell, D.; Nava-Pichardo, F.A.; Fletcher, J.; Gonzalez-Garcia, J.; Lipovsky, B.; Floyd, M.; Funning, G. Elmayor-Cucapah (Mw 7.2) earthquake: Early near-field postseismicdeformation from InSAR and GPS observations. J. Geophys. Res. 2014, 119, 1482–1497. [Google Scholar] [CrossRef]
  14. Liu, C.J.; Ji, L.Y.; Zhu, L.Y.; Zhao, C.Y. InSAR-Constrained Interseismic Deformation and Potential Seismogenic Asperities on the Altyn Tagh Fault at 91.5–95°E, Northern Tibetan Plateau. Remote Sens. 2018, 10, 943. [Google Scholar] [CrossRef]
  15. Tong, X.; Sandwell, D.T.; Smith-Konter, B. High-resolution interseismic velocity data along the San Andreas fault from GPS and InSAR. J. Geophys. Res. 2013, 118, 369–389. [Google Scholar] [CrossRef]
  16. Hussain, E.; Wright, T.; Walters, R.; Bekaert, D.; Lloyd, R.; Hooper, A. Constant strain accumulation rate between major earthquakes on the north anatolian fault. Nat. Commun. 2018, 9, 1392. [Google Scholar] [CrossRef]
  17. Jolivet, R.; Lasserre, C.; Doin, M.-P.; Guillaso, S.; Peltzer, G.; Dailu, R.; Sun, J.; Shen, Z.-K.; Xu, X. Shallow creep on the Haiyuan Fault (Gansu, China) revealed by SAR Interferometry. J. Geophys. Res. 2012, 117, 06401. [Google Scholar] [CrossRef]
  18. Tong, X.; Sandwell, D.T.; Schmidt, D.A. Surface creep rate and moment accumulation rate along the Aceh segment of the Sumatran fault from L-band ALOS-1/PALSAR-1 observations. Geophys. Res. Lett. 2018, 45, 3404–3412. [Google Scholar] [CrossRef]
  19. Wang, H.; Wright, T.J.; Biggs, J. Interseismic slip rate of the northwestern Xianshuihe fault from InSAR data. Geophys. Res. Lett. 2009, 36, 139–145. [Google Scholar] [CrossRef]
  20. Zhang, P.Z.; Deng, Q.D.; Zhang, G.M.; Ma, J.; Gan, W.; Min, W.; Mao, F.; Wang, Q. Active tectonic blocks and strong earthquakes in the continent of China. Sci. China (Ser. D) 2003, 46, 13–24. [Google Scholar]
  21. Xu, X.W.; Han, Z.J.; Yang, X.P. Seismotectonic Map in China and Its Adjacent Regions; Seismological Press: Beijing, China, 2016. [Google Scholar]
  22. Zheng, G.; Wang, H.; Wright, T.J.; Lou, Y.; Zhang, R.; Zhang, W.; Shi, C.; Huang, J.; Wei, N. Crustal deformation in the India-Eurasia collision zone from 25 years of GPS measurements. J. Geophys. Res. 2017, 122, 9290–9312. [Google Scholar] [CrossRef]
  23. Werner, C.; Wegmüller, U.; Strozzi, T. GAMMA SAR and interferometric processing software. In Proceedings of the ERS-Envisat Symposium, Gothenburg, Swedish, 16–20 October 2000. [Google Scholar]
  24. Lu, Z.; Dzurisin, D. Ground surface deformation patterns, magma supply, and magma storage at Okmok volcano, Alaska, from InSAR analysis: 2. Coeruptive deflation, July–August 2008. J. Geophys. Res. Solid Earth 2010, 115, B00B03. [Google Scholar] [CrossRef]
  25. Jiang, M.; Ding, X.; Hanssen, R.F.; Malhotra, R.; Chang, L. Fast statistically homogeneous pixel selection for covariance matrix estimation for multitemporal insar. IEEE Trans. Geosci. Remote Sens. 2015, 53, 1213–1224. [Google Scholar] [CrossRef]
  26. Garthwaite, M.C.; Wang, H.; Wright, T.J. Broadscale interseismic deformation and fault slip rates in the central Tibetan Plateau observed using InSAR. J. Geophys. Res. Solid Earth 2013, 118, 5071–5083. [Google Scholar] [CrossRef] [Green Version]
  27. Biggs, J.; Wright, T.; Lu, Z. Multi-interferogram method for measuring interseismic deformation: Denali Fault, Alaska. Geophys. J. Int. 2007, 170, 1165–1179. [Google Scholar] [CrossRef] [Green Version]
  28. Elliott, J.R.; Biggs, J.; Parsons, B. InSAR slip rate determination on the Altyn Tagh Fault, northern Tibet, in the presence of topographically correlated atmospheric delays. Geophys. Res. Lett. 2008, 35, 82–90. [Google Scholar] [CrossRef]
  29. Lyons, S.; Sandwell, D. Fault creep along the southern San Andreas from interferometric synthetic aperture radar, permanent scatterers, and stacking. J. Geophys. Res. 2003, 108, 2047. [Google Scholar] [CrossRef]
  30. Savage, J.C.; Burford, R.O. Geodetic determination of relative plate motion in central California. J. Geophys. Res. 1973, 78, 832–845. [Google Scholar] [CrossRef]
  31. Shen, Z.-K.; Wang, M.; Zeng, Y.; Wang, F. Optimal interpolation of spatially discretized geodetic data. Bull. Seismol. Soc. Am. 2015, 105, 2117–2127. [Google Scholar] [CrossRef]
  32. Ge, W.P.; Molnar, P.; Shen, Z.K.; Li, Q. Present-day crustal thinning in the southern and northern Tibetan plateau showed by GPS measurements. Geophys. Res. Lett. 2015, 42, 5227–5235. [Google Scholar] [CrossRef]
  33. Wang, D. Tectonic Geomorphology along the Gyaring Co Fault in Central Tibet; Institue of Geology, China Earthquake Administration: Beijing, China, 2018. [Google Scholar]
  34. Yang, P. Late Quaternary Activity of the Gayring Co Fault and its Implication for Dynamics of the Southern-Central Tibetan Plateau; Institue of Geology, China Earthquake Administration: Beijing, China, 2014. [Google Scholar]
  35. Yin, A.; Taylor, M.H. Mechanics of v-shaped conjugate strike-slip faults and the corresponding continuum mode of continental deformation. Geol. Soc. Am. Bull. 2011, 123, 1798–1821. [Google Scholar] [CrossRef]
Figure 1. Seismo-tectonic background map of the Gyaring Co fault zone. (a) The solid black lines are boundaries of the main terranes [20], the red circles are earthquakes of Ms 7.0 or greater since 1900, and the red square is the range of b. (b) The fine black lines are faults [21], the blue arrows are GPS horizontal velocity fields [22], the red boxes are coverages of InSAR deformational fields, and the black cycles are earthquakes of Ms 4.7 or greater (780 B.C. to 2018 A.D.). F1: Gyaring Co Fault Zone; F2: Gase Fault Zone; and F3: Doma–Nima Fault Zone.
Remotesensing 11 01118 g001
Figure 2. Interferogram time-spatial baseline distribution. (a) Track 305, (b) Track 33, and (c) Track 262. The purple crosses are the images participating in the velocity calculation, the light blue crosses are the images not participating in the velocity calculation, and the purple straight lines are the generated interferograms.
Remotesensing 11 01118 g002aRemotesensing 11 01118 g002b
Figure 3. Average inter-seismic deformation velocity field of the Gyaring Co fault (line-of-sight (LOS) direction). (a) Track 305, (b) Track 33, and (c) Track 262.
Remotesensing 11 01118 g003
Figure 4. Deformation velocity difference value statistics of the orbital overlapping areas (parallel to the fault). (a) Track 305–Track 33 and (b) Track 33–Track 262.
Remotesensing 11 01118 g004
Figure 5. Interferometric synthetic aperture radar (InSAR) inter-seismic deformation rate field of the Gyaring Co fault (parallel to the fault). GPS velocity field and fault are same as that shown in Figure 1. The black crosses represent the location of the three profiles of aa’, bb’, and cc’, in which aa’ is shown in Figure 6, and bb’ and cc’ are shown in Figure 7.
Remotesensing 11 01118 g005
Figure 6. Comparison of InSAR and GPS profiles (parallel to the fault).
Remotesensing 11 01118 g006
Figure 7. Slip rate and locking depth of the Gyaring Co fault inverted via the InSAR deformation profile. (a) Profile bb’ and (b) Profile cc’. Profiles location are shown in Figure 5.
Remotesensing 11 01118 g007
Figure 8. Distribution map of regional strain and seismic activity. (a) Image of main strain rate and surface strain rate; (b) Image of maximum shear strain rate.
Remotesensing 11 01118 g008
Figure 9. Distribution of conjugate strike-slip faults in Central Tibet (modified from Yin and Taylor, 2011 [35]). YGR: Yadong–Gulu rift; PXR: Pumqu–Xianza rift; TYR: Tangra Yum Co rift; XKR: Xiakangjian rift; LGR: Lunggar rift; YRR: Yari rift; PKR: Purong Kangri rift; TKR: Thakkola rift; and BNS: Bangong–Nujiang suture.
Remotesensing 11 01118 g009
Figure 10. Tectonic style model diagram of regional tectonics (modified from Yin and Taylor, 2011 [35]).
Remotesensing 11 01118 g010
Table 1. Envisat advanced synthetic aperture radar (ASAR) image parameters used in this study.
Orbit TypeWavelengthOrbit NumberTime SpanNumber of ImagesNumber of Interferograms
Descending5.6 cm305October 2003–August 20102973
Descending5.6 cm33March 2003–October 20103294
Descending5.6 cm262November 2003–July 20103257

