1. Introduction
As compared to conventional global navigation satellite system (GNSS)-reflectometry (cGNSS-R) [
1], in which the reflected signal is cross-correlated with a locally generated clean replica of the transmitted code, in interferometric GNSS-R (iGNSS-R) the direct signal transmitted by the GNSS satellites is cross-correlated with the same transmitted signal after it has been scattered on the Earth’s surface [
2]. This way, iGNSS-R is able to make use of the private signals, that have a wider bandwidth (such as M-code, with up to 40 MHz), achieving thus a higher accuracy. However, the resulting cross-correlations are noisier than in cGNSS-R, they are more sensitive to radio frequency interferences (RFI), and the cross-correlation peaks of multiple visible satellites may be visible in the correlated data. This last phenomenon is called satellite cross-talk, and affects altimetric and scatterometric retrievals [
3]. In iGNSS-R, the position of the cross-correlation peak depends on the time difference and the Doppler frequency difference between the direct and the reflected signals. The time delay difference depends on the geometry of the reflections [
4]. In ground-based and airborne iGNSS-R, the Doppler difference is essentially non-existent [
3]. Since the time delay between the direct and reflected signals is proportional to the sensor height, as altitude decreases the risk of cross-talk increases [
3]. This is the case in ground-based and airborne reflectometry as compared to spaceborne reflectometry, and thus high-directive arrays are required to spatially filter the contributions of undesired satellites. In spaceborne reflectometry the direct and reflected signals are received with a different Doppler frequency, but the correlations are also spread in the Doppler domain [
5], which in addition to the higher altitude makes cross-talk less frequent but not negligible [
3]. Besides, as more constellations are deployed with shared bands (e.g., GPS L1 and Galileo E1, or GPS L5 and Galileo E5a), the probability of two satellites being close in the sky (from the receiver point of view) increases, and so the efficiency of spatial filtering decreases.
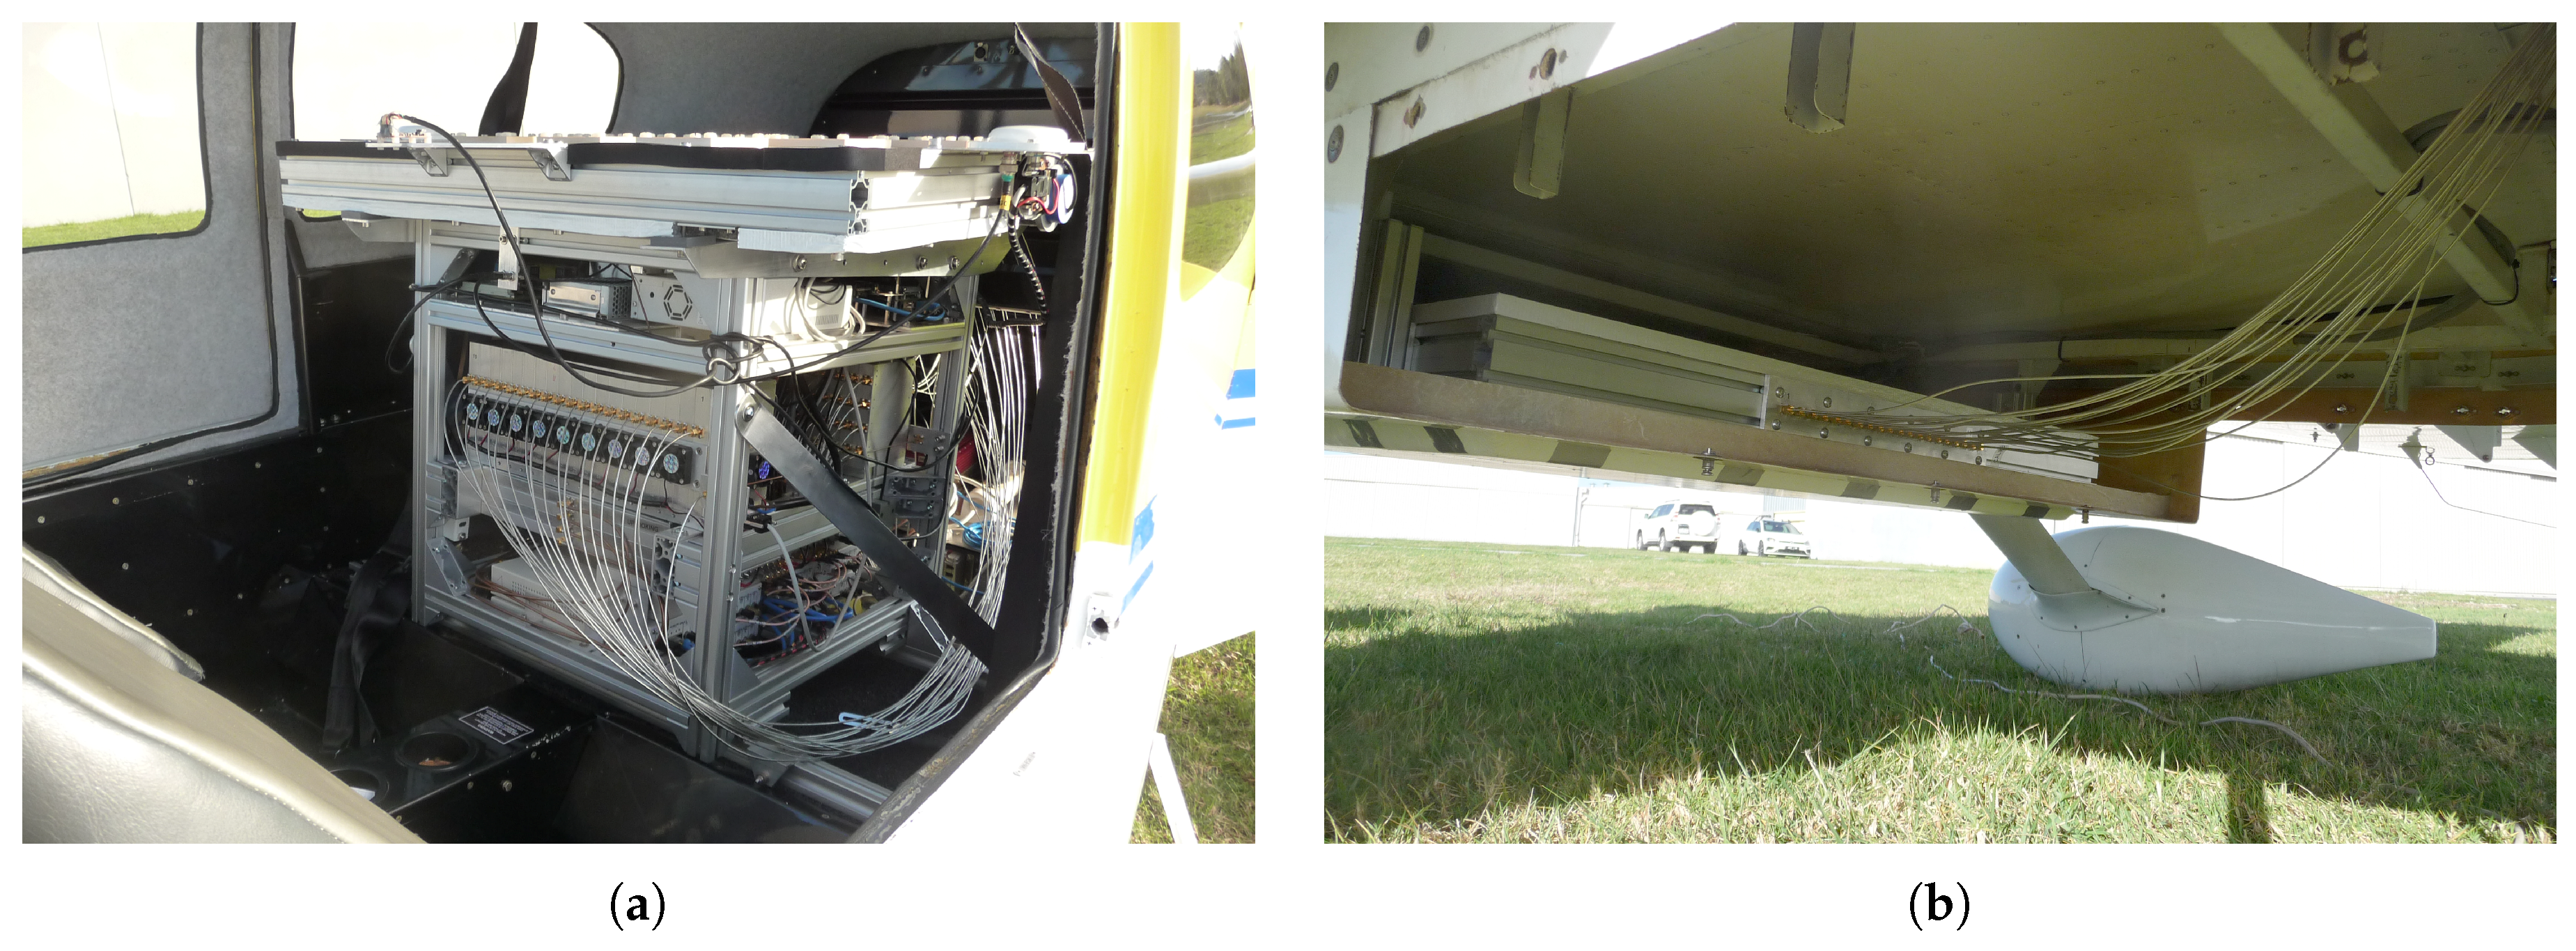
This work analyzes the satellite cross-talk that affected four flights of the microwave interferometric reflectometer (MIR) instrument [
6]. First,
Section 2 briefly describes the MIR instrument and the field campaign. Then,
Section 3 describes the two metrics used to analyze the satellite cross-talk, the angular distance to the closest satellite and the worst received signal-to-interference ratio (SIR), and how the cross-talk induced error is estimated.
Section 4 presents the results of the analysis, before conclusions are drawn in
Section 5.
3. Methodology
During the flights, the position, attitude, tracked satellites, and the pointing angles of the instrument were logged. The tracked satellites were chosen based on their elevation angle (the higher the better) in order to maximize the array directivity and to minimize the side lobes. The MIR instrument attempted to track a GPS and a Galileo satellite in each band whenever possible. In case this was not possible, the two satellites with the highest elevation angle were chosen [
6].
The angular distance between the tracked satellites and the closest ones was computed using the position of the GPS and Galileo satellites derived from the satellite ephemeris [
9]. The expected received power from both the direct and reflected signals from all satellites was simulated using the measured radiation pattern of one of the antenna elements, the array factor according to the array dimensions, and the attitude of the plane. In order to simplify the processing, flat Earth and constant reflectivity was considered for all reflected signals. For each satellite, the delay
between the direct and the reflected signal was approximated using
where
h is the height of the plane over the ellipsoid,
is the elevation angle of the satellite with respect to the receiver, and
c is the speed of light. This delay determines where the centre of the cross-correlation peak should be in the delay domain. The cross-correlation waveforms can be approximated by a two code chips wide triangle in the delay domain in specular reflections [
1], one in the leading edge and one in the trailing edge. When the signal is scattered on a rough surface, the trailing edge is elongated. For instance, wind speeds from 6 m/s to 22 m/s can enlarge the trailing edge of reflections over sea from two to three code chips in airborne GNSS-R [
10]. For simplicity, all cross-talk cross-correlation peaks farther than two code chips and weaker than –10 dB compared to the tracked one are considered non-interfering.
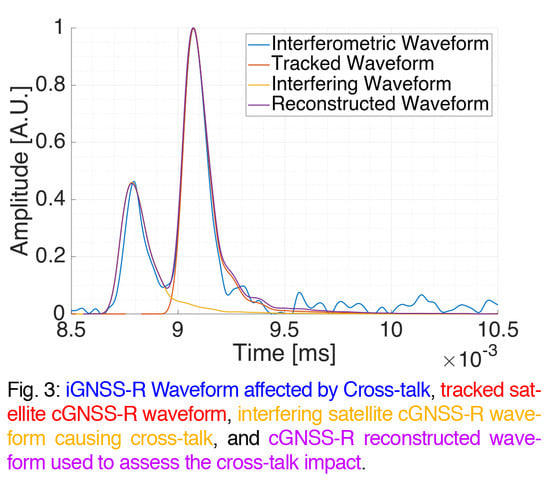
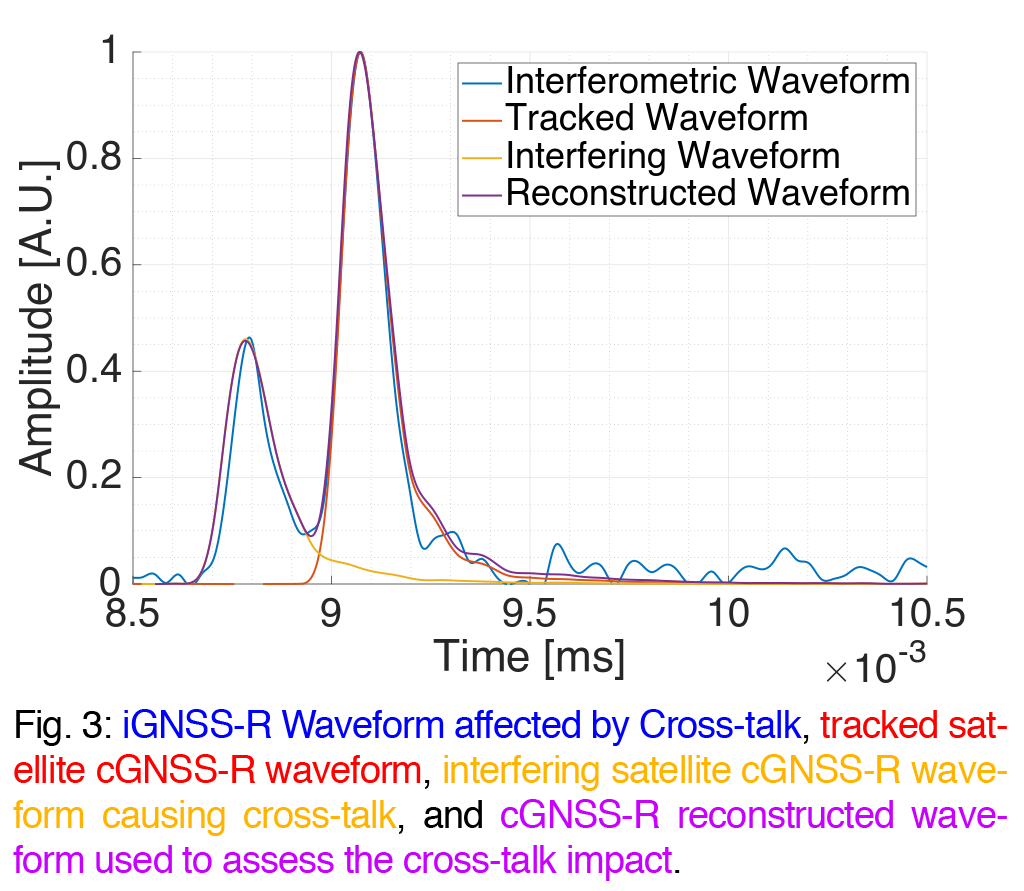
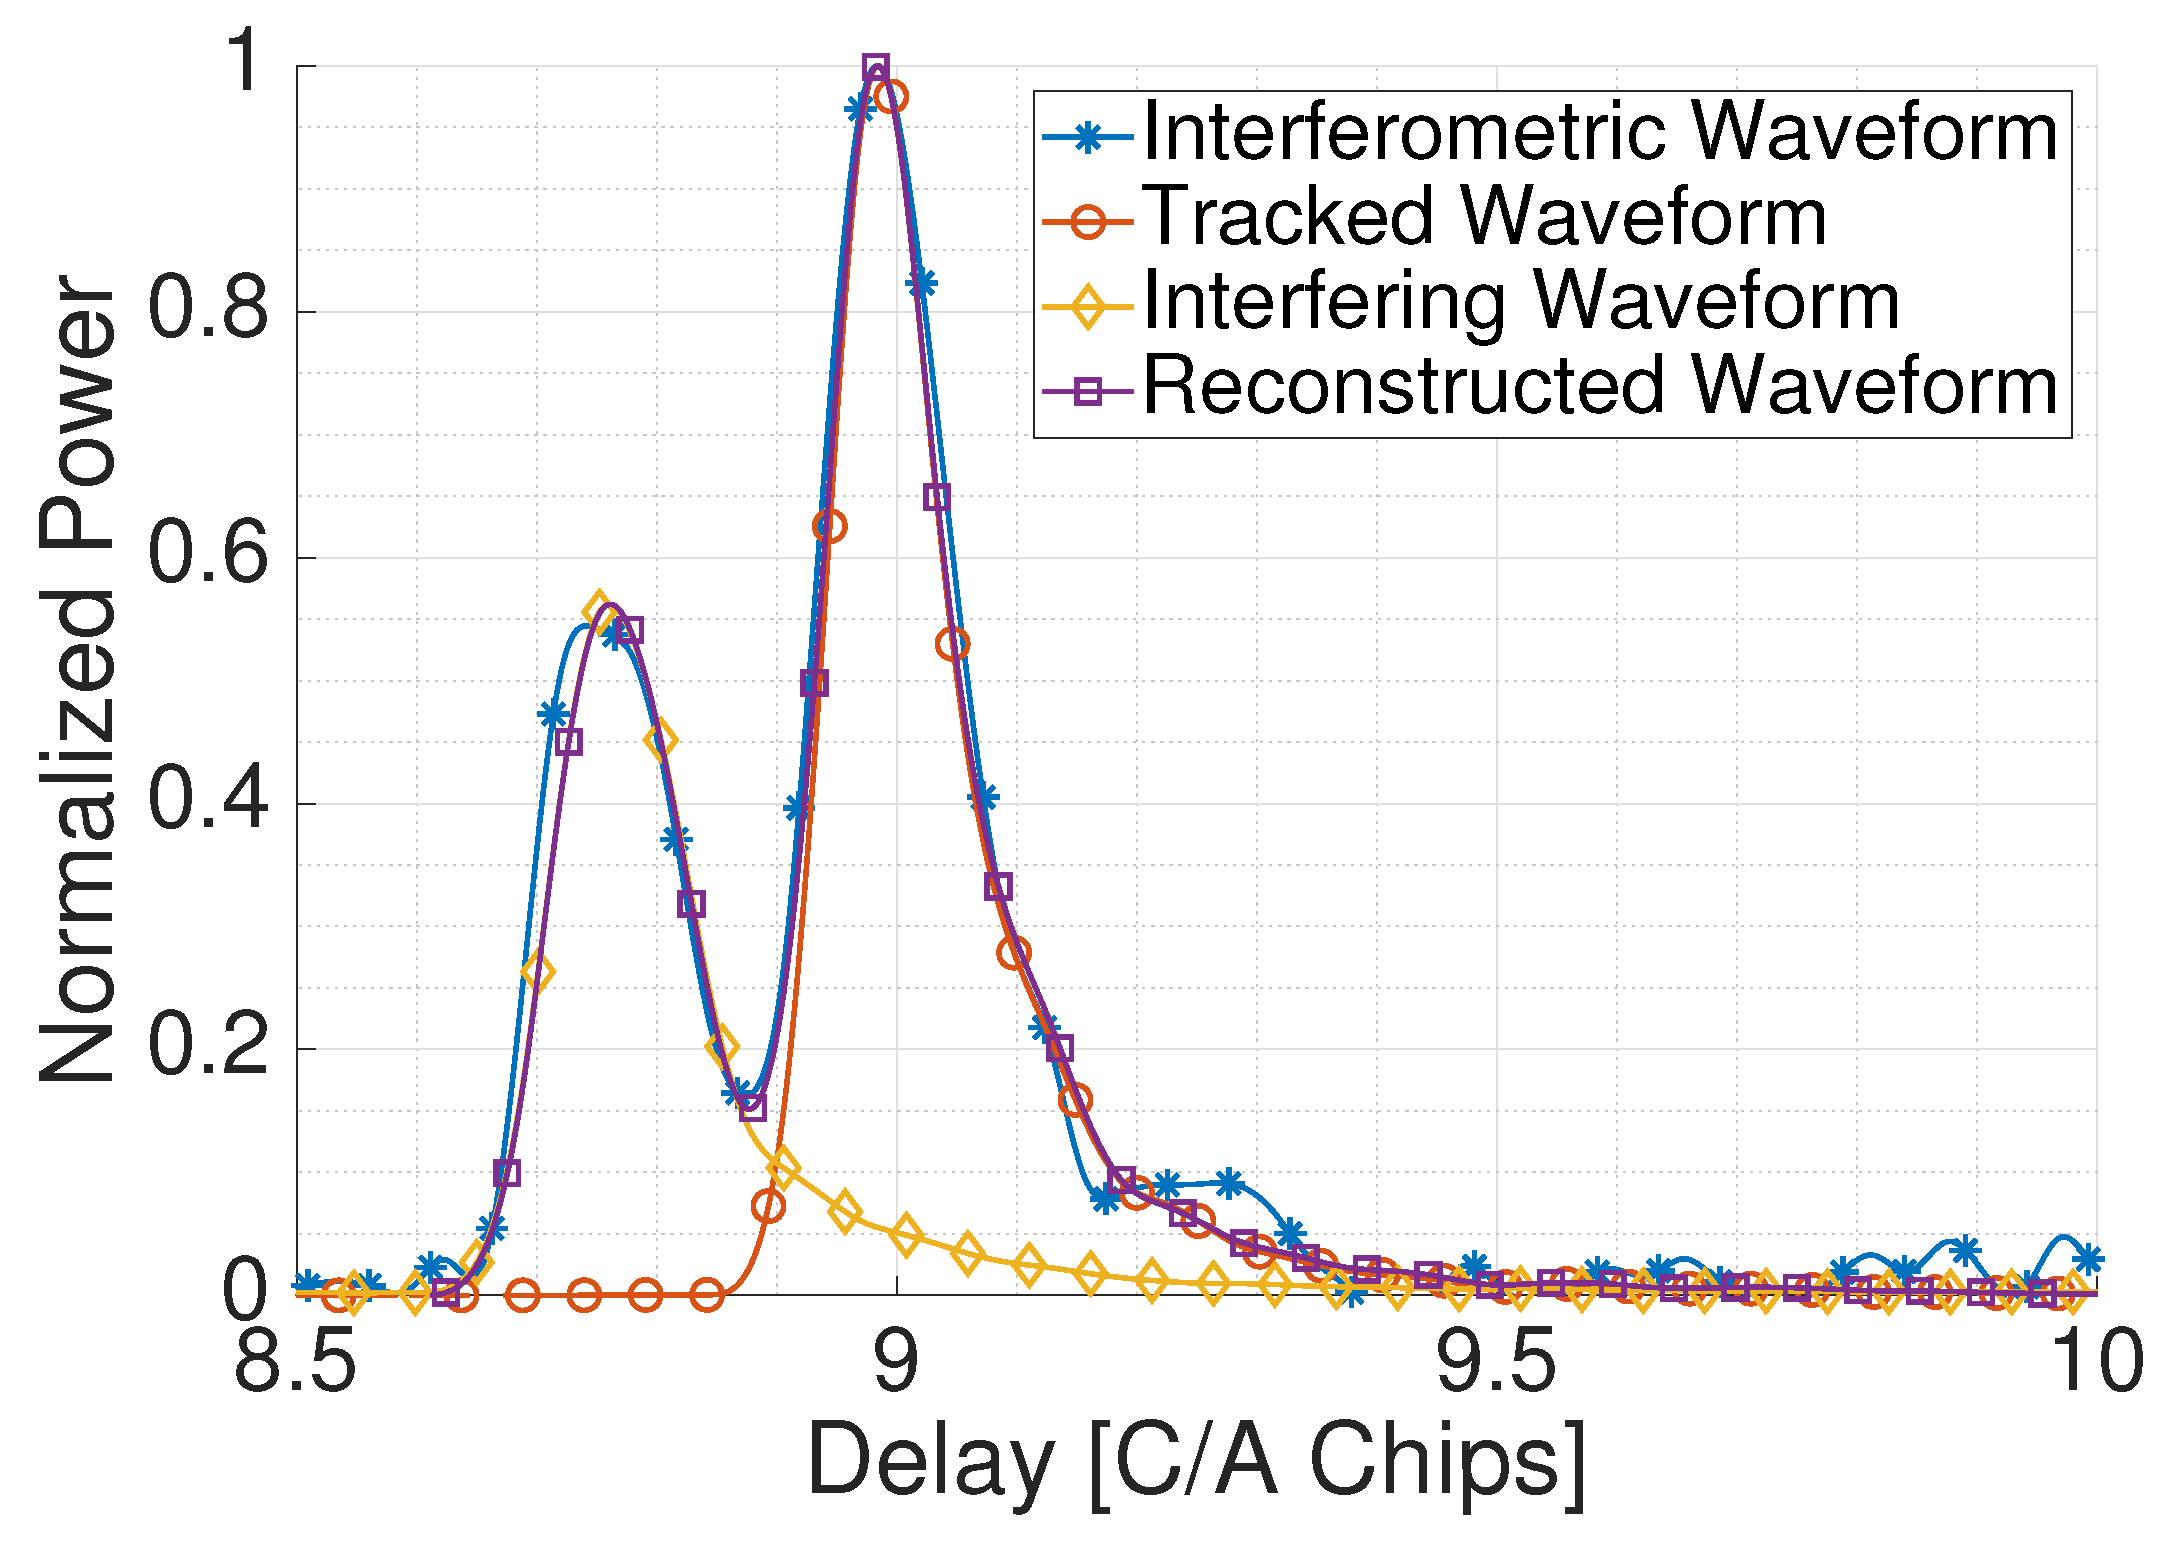
Figure 3 shows an example of an interferometric contaminated waveform in blue retrieved during the Bass Strait flight, the conventional waveform of the tracked satellite in red, and the waveform of the interfering satellite in yellow. A large number of interferometric waveforms were found to be corrupted due to RFI as well, so they had to be discarded for the study the cross-talk impact assessment. Besides, the interferometric waveform is more affected by noise than the conventional ones, which is used as reference for the comparison because they are not affected by satellite cross-talk. For this reason, this work proposes below how to reconstruct the interferometric waveform using the conventional ones as can be seen in purple in
Figure 3.
The coherent waveform between the signals
x and
y as function of the delay
and Doppler frequency
between them is defined in [
5] as
where
is the time at the origin, and
is the coherent integration time. Then, the incoherent average of
M coherent waveforms is defined as
For GNSS signals, the cross-correlation peak is located at a Doppler frequency
that compensates the Doppler frequency difference between
x and
y, and it is located at a delay
that compensates the time difference between
x and
y. In the conventional case, when a signal
s transmitted from a GNSS satellite with a noise
n is cross-correlated with the code
c corresponding to the transmitting satellite, the incoherent waveform becomes
where
stands for the waveform resulting from cross-correlating the received signal
s with the code
c, and
is the noise term resulting from cross-correlating the noise
n with the code
c. In the interferometric case, if the signal
s transmitted from the tracked satellite with noise
n is received in conjunction with a signal
z transmitted from a satellite which causes cross-talk, the incoherent waveform becomes
where the subscripts
D and
R indicate if the signal has been received through the direct or the reflected antenna arrays, respectively,
is the desired satellite term,
is the cross-talk term,
and
are the so called cross-satellite terms, and
,
,
,
, and
are the noise terms. For ground-based and airborne GNSS reflectometry, the Doppler difference between the direct and the reflected GNSS signals can be neglected, so the peak of
and
is located at
. Due to the low power of the GNSS signals, the term
dominates the other noise terms [
11]. If an interference signal
i is present, several cross terms appear and might dominate over the desired
and
terms, which happened during most of the flight over the Bass Strait. The interference terms must be avoided, so the contaminated waveform is reconstructed as
where
is the signal received from the down-looking array,
is the received signal from the tracked satellite,
is the received signal from the satellite causing cross-talk,
is an interfering signal, and
is noise;
and
are the codes of the desired satellite and the satellite causing cross-talk respectively, and
and
are the Doppler frequencies of the satellite being tracked and the satellite causing cross-talk. The transmitted GNSS codes are robust against RFI and noise, which implies that
and
dominate over the other terms, contributing thus as a much lower noise floor compared to the interferometric case. An example of a reconstructed contaminated waveform is shown in
Figure 3. The cross-correlation peaks are not symmetric respect to their maximum—that is, the trailing edge is longer than the leading one. This effect is caused by the scattering of the reflected signal in a rough surface, in this case the sea surface roughness caused by the wind [
5]. For this reason, the “second” cross-correlation peak (the contribution of the satellite that is received later) is more affected by the “first” one (the contribution of the satellite that is received sooner) than vice versa.
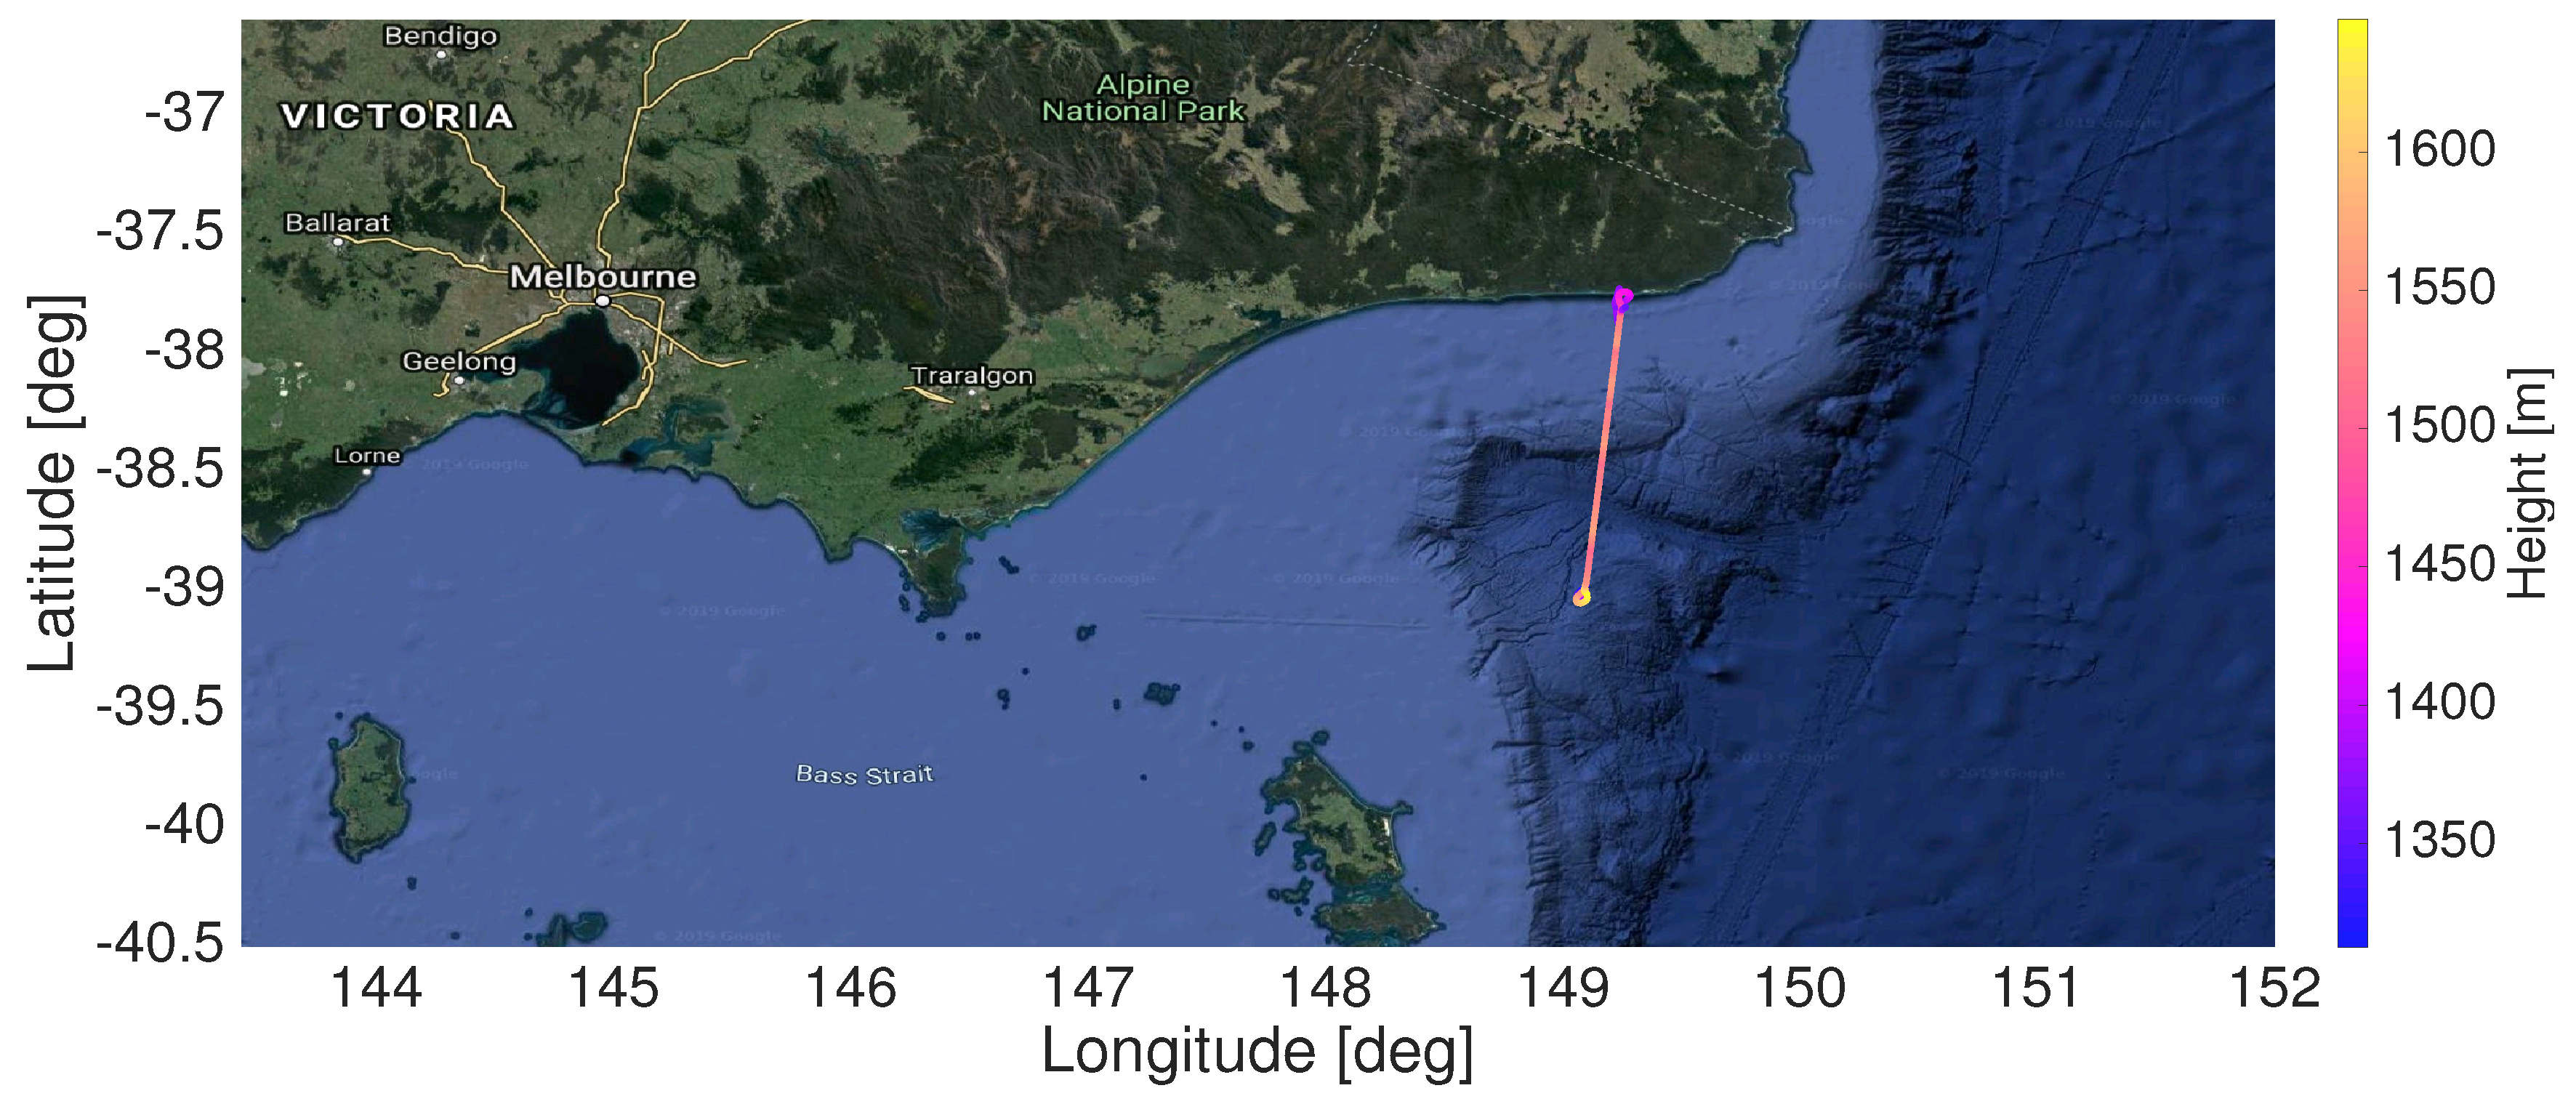
Two datasets are created from the Bass Strait flight data: the XT (cross-talk) dataset with 670 s, and the NOXT (no cross-talk) data set with 470 s. The flights over land were not suitable for this analysis because the soil permittivity would have attenuated some of the tracked and interfering waveforms, affecting the impact analysis statistics. The Port Phillip Bay flight was not suitable because the aeroplane was repeatedly flying over two points of interest, therefore manoeuvring constantly and abruptly, which caused the apparition of even larger side lobes that would had also affected the analysis statistics. In the XT dataset, the two beams of the instrument were pointing at two different satellites that were close enough in the sky to be received by the main lobe of both beams. The signals of both satellites were received in both beams and close enough in time to be overlapped. In one of the beams, the interfering cross-correlation peak was received before the tracked cross-correlation peak, and in the other beam it was received afterwards. In the NOXT dataset, both beams were tracking two different satellites that again were received in both beams, but the cross-correlation peaks were separated enough not to be overlapped, thus not being affected by the cross-talk. In the case of XT dataset, the interfering cross-correlation peak and the noise distort the tracked cross-correlation peak, introducing thus an error in any retrieved parameter such as the peak position or amplitude. In order to assess the impact of the cross-talk alone, the impact of the noise has also to be characterized, using for that purpose the NOXT data set.
In the altimetric case, the analysis focused on the three main delay estimators: the position of the maximum derivative (DER) [
12], the position of the maximum amplitude (MAX) [
12,
13], and the position when the leading edge reached the 75% of the maximum amplitude as proposed by [
14], which is called half-power position (HALF) due to its similarity to the homonym estimator used by the radar community. The delay positions using MAX, DER, and HALF are estimated for the reconstructed and the tracked conventional waveforms. For each estimator, the error between the estimated positions was computed between both waveforms. Then, the results for the XT and NOXT data sets were compared in terms of their probability density function (PDF). In the NOXT dataset, the tracked and the interfering cross-correlation peaks are not overlapping each other. For a given delay estimator, the estimated delay difference between the conventional and the reconstructed waveforms might be only caused by the different noise terms. The PDF of the NOXT term was used as reference. In the XT dataset, the tracked and the interfering cross-correlation peaks were overlapping each other, therefore the PDFs might be different to the NOXT ones. These PDFs were then compared to assess the impact of the cross-talk.
To evaluate the impact in scatterometry, the same analysis is applied to the peak amplitude difference between the reconstructed and the conventional waveforms.
The reconstructed contaminated waveform and the conventional waveforms of both the interfering and the tracked satellites were computed with coherent averaging and incoherent averages, and then interpolated to reach 1 cm resolution around the peaks and in the leading edges.
While the cross-talk occurrence has been analyzed in both frequency bands, the cross-talk impact in altimetry and scatterometry has been analyzed only at the L5/E5a frequency band. This is because the L5/E5a beam is wider than the L1/E1 one, which allows the simultaneous reception of signals from more than one satellite that were not overlapping in time, so it was possible to have both XT and NOXT datasets. Furthermore, GPS L5 signals and Galileo E5a signals were similar in modulation, bandwidth, and chip length, so their correlation peaks are similar. This fact simplified the analysis, since just two cases have to be analyzed: the tracked satellite cross-correlation peak being located before or after the interfering satellite cross-correlation peak.
4. Results
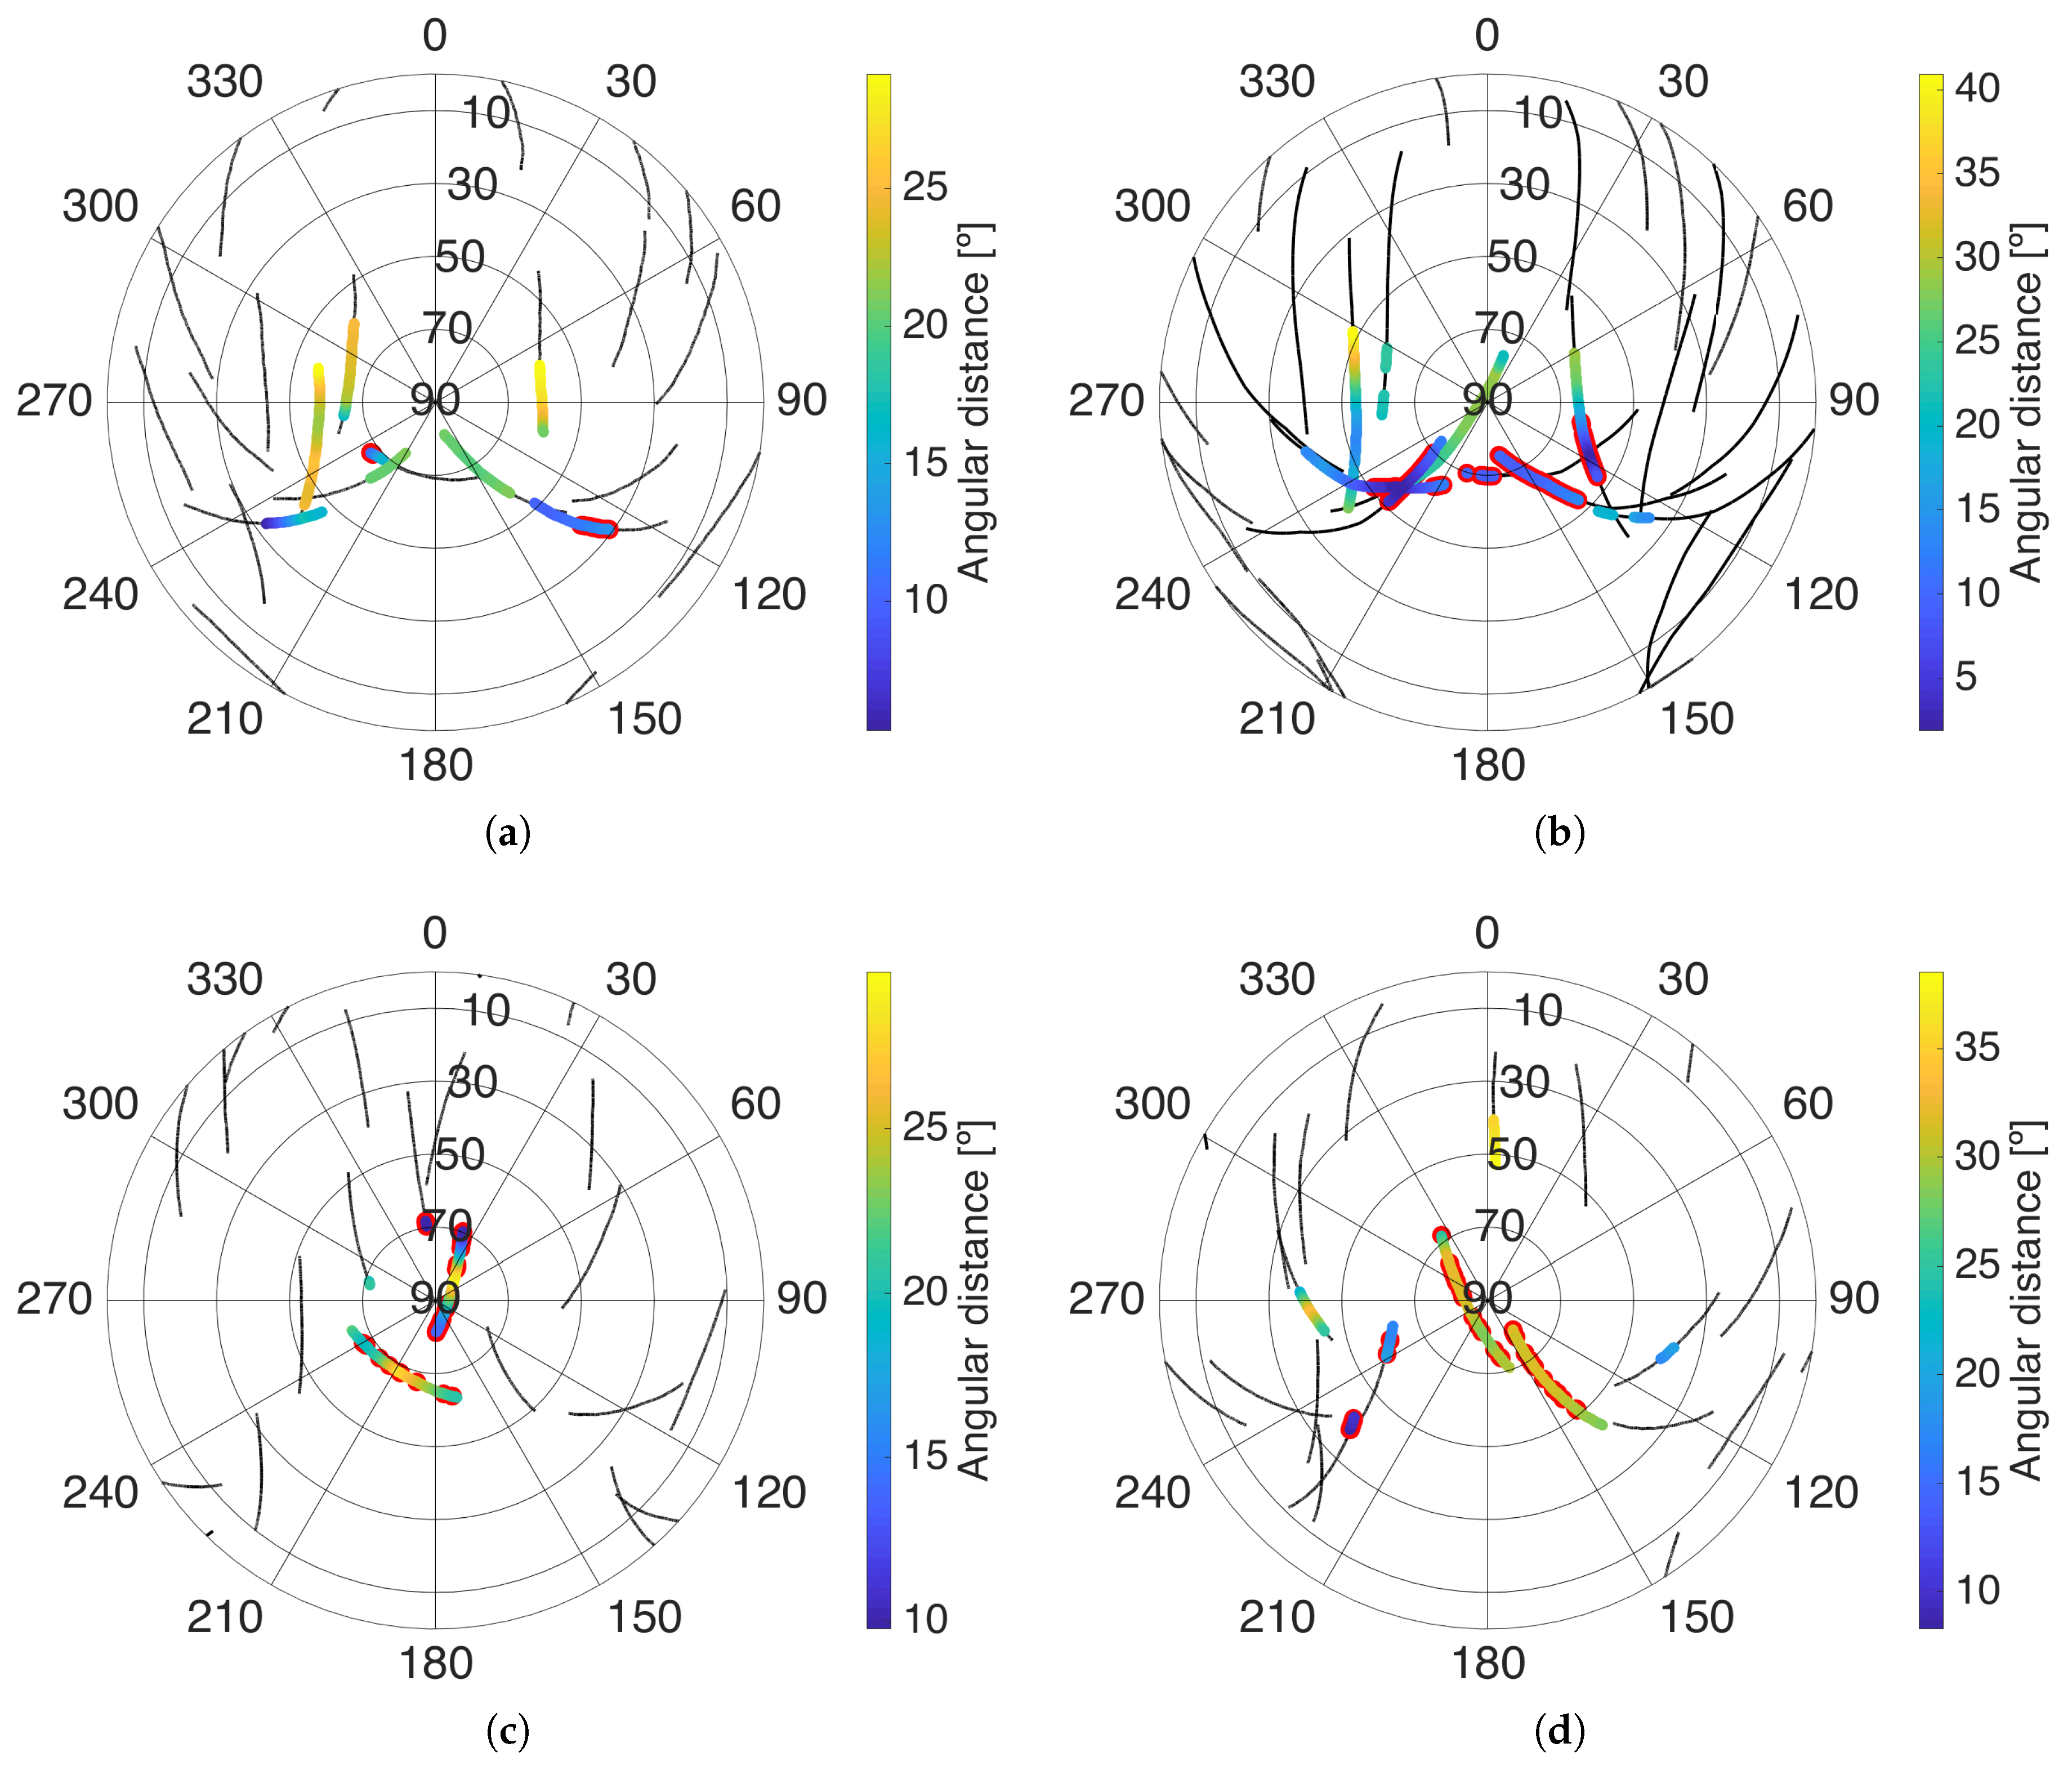
Figure 4 shows skyplots of the satellites in view (black traces). The tracked satellites are represented with coloured dots, where the colour represents the angular distance to the closest satellite. In case the tracked satellite was affected by cross-talk it is also highlighted in red. Note that the four beams are represented in the same plot, and if the same satellite was tracked in both bands their representations are overlapped, which may under-represent the visual cross-talk occurrence.
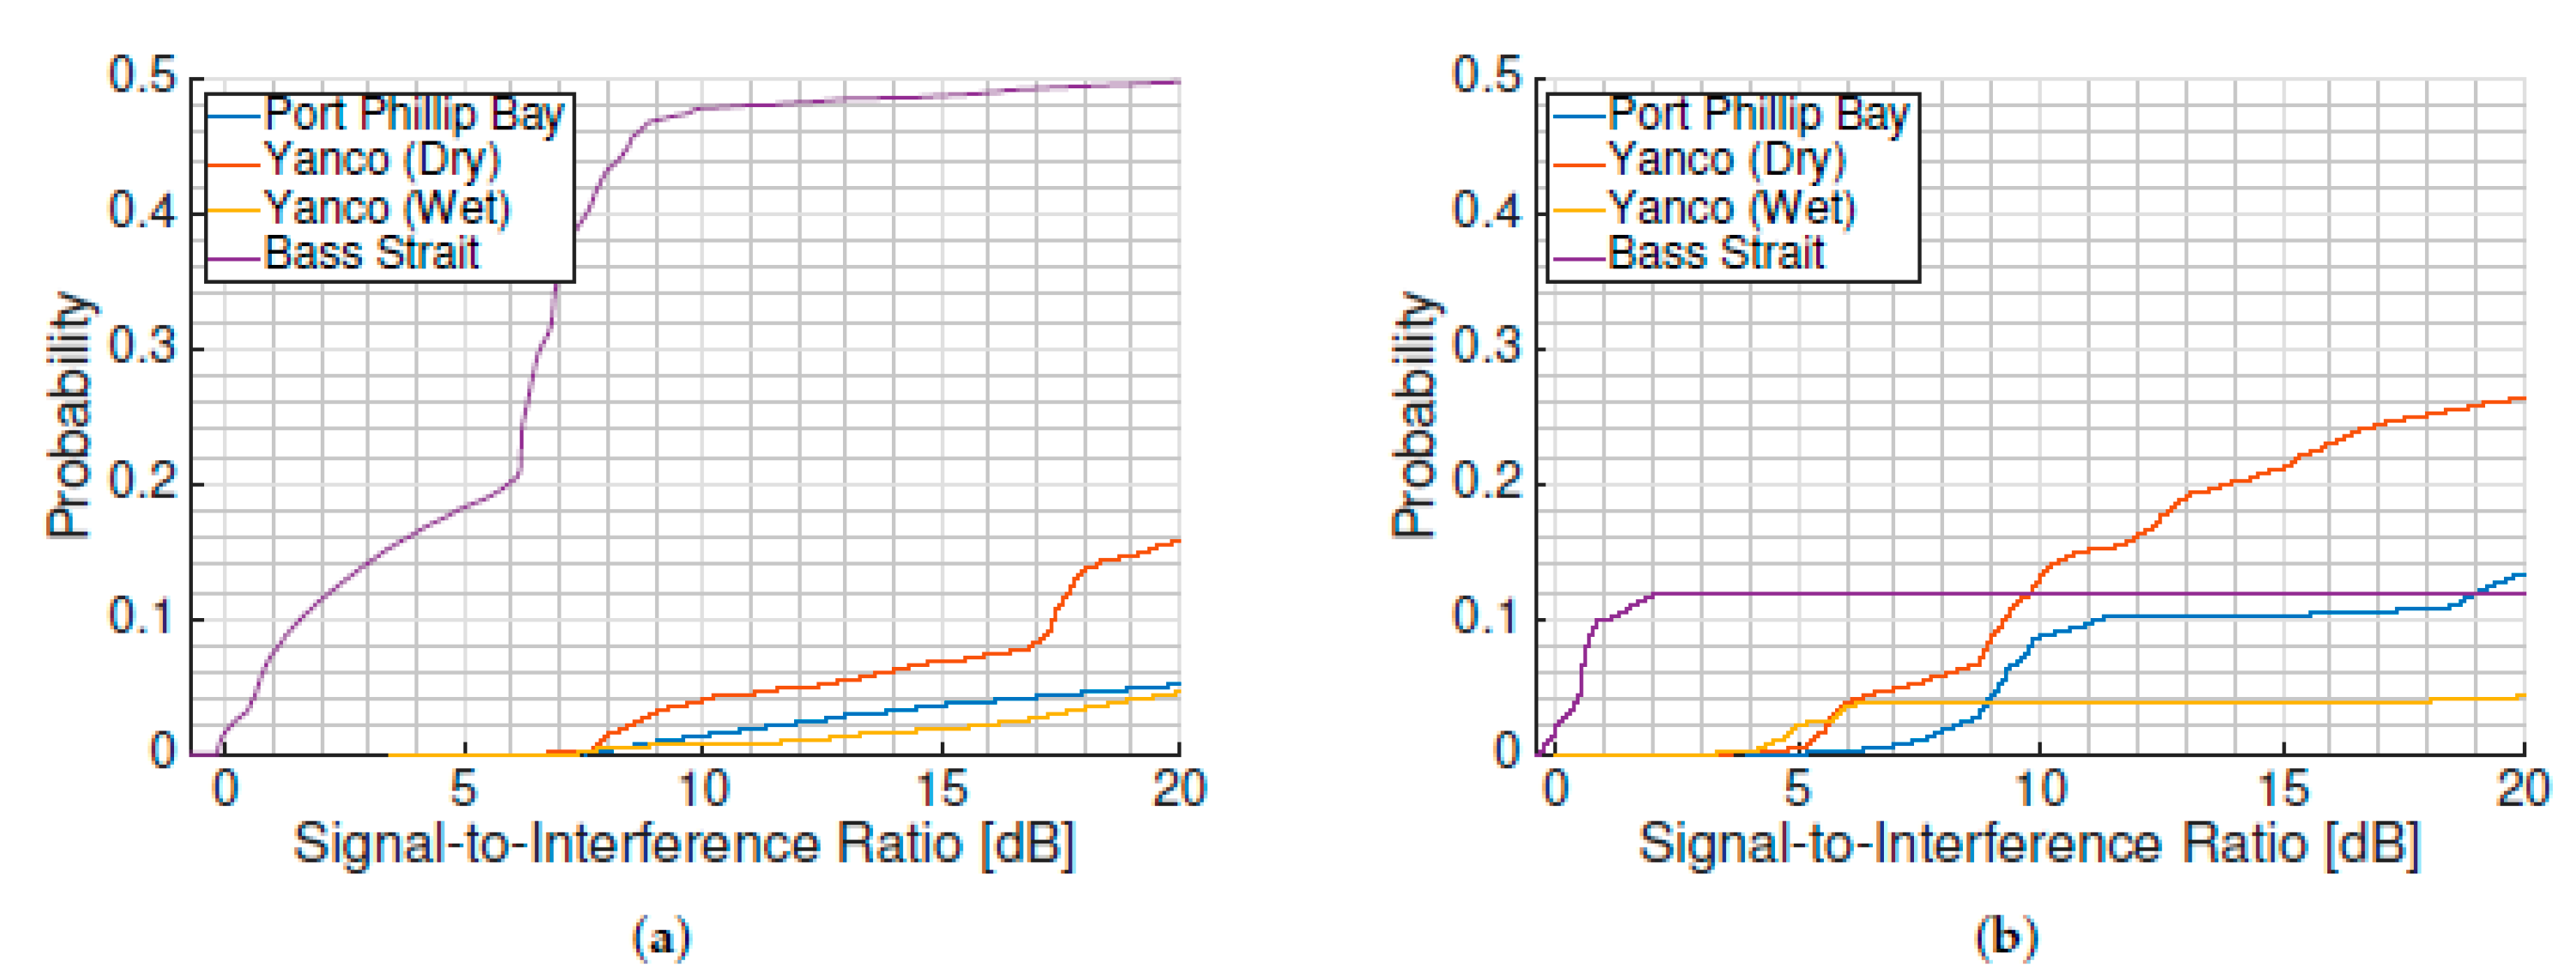
Figure 5 shows the cumulative histogram of the cross-talk probability for a given signal-to-interference ratio (SIR), which is the relationship between the expected power of the tracked satellite over the expected power of the other satellites. The histogram was computed taking into account the lowest SIR from all visible satellites, since satellite cross-talk did not occur from more than one satellite simultaneously. The cross-talk occurrence of the two beams at each frequency band was aggregated if the beams were not pointing to the same satellite - that is, the data from the second beam was considered as if the flight was longer.
Several factors determine the likelihood to be affected by satellite cross-talk. First, the number of GNSS satellites transmitting in-band: L1/E1 seems a priori more likely to be affected because these signals were transmitted by the full GPS constellation (32 satellites) and Galileo constellation (16 satellites at the time of the experiment), while the signals allocated in L5/E5a were only transmitted by the GPS block IIF satellites (12 of the 32 current GPS satellites), plus the Galileo ones (16 satellites). Secondly, the L1/E1 transmitted signals were more susceptible to cross-talk because the chip length was 10 times longer than in L5/E5, which means that the range of elevation angles that might interfere according to Equation (
1) was larger. Finally, the array factor at L1/E1 had a narrower beam as compared to the one at L5/E5a, which was more selective against the undesired signals, but the long separation between antenna elements (0.75
, where
cm) caused diffraction lobes as the instrument pointed far away from the boresight, which happened often when the airplane rotated heavily about the pitch and roll axes. This effect can be clearly seen in the flights over land. In the skyplots in
Figure 4 the cross-talk is intermittent, which was caused by the diffraction lobes generated when the airplane had to manoeuvre abruptly at the end of each transect over the farm fields.
The position of the satellites in the sky during the flights had a strong impact in the probability of having cross-talk because of their short duration. Counterintuitively, L1/E1 signals show much lower likelihood of being affected by cross-talk than the L5/E5a one, except during the second sea flight, which was contaminated almost half of the flight time. In the other flights, the probability of cross-talk was reduced to less than 2%. L5/E5a signals were instead more likely to be affected by cross-talk (5–10%). Since there are fewer satellites transmitting L5/E5a signals, there is a lower chance of finding one of them with a high elevation angle. The MIR instrument was therefore forced to track satellites with lower elevation angles, and therefore the cross-talk probability increases [
3]. It was noteworthy that not even a 19-element array antenna with 18–20 dB directivity has been able to avoid a cross-talk contamination during half of one of the flights, and that it could not reduce the cross-talk at L5/E5a below 10%.
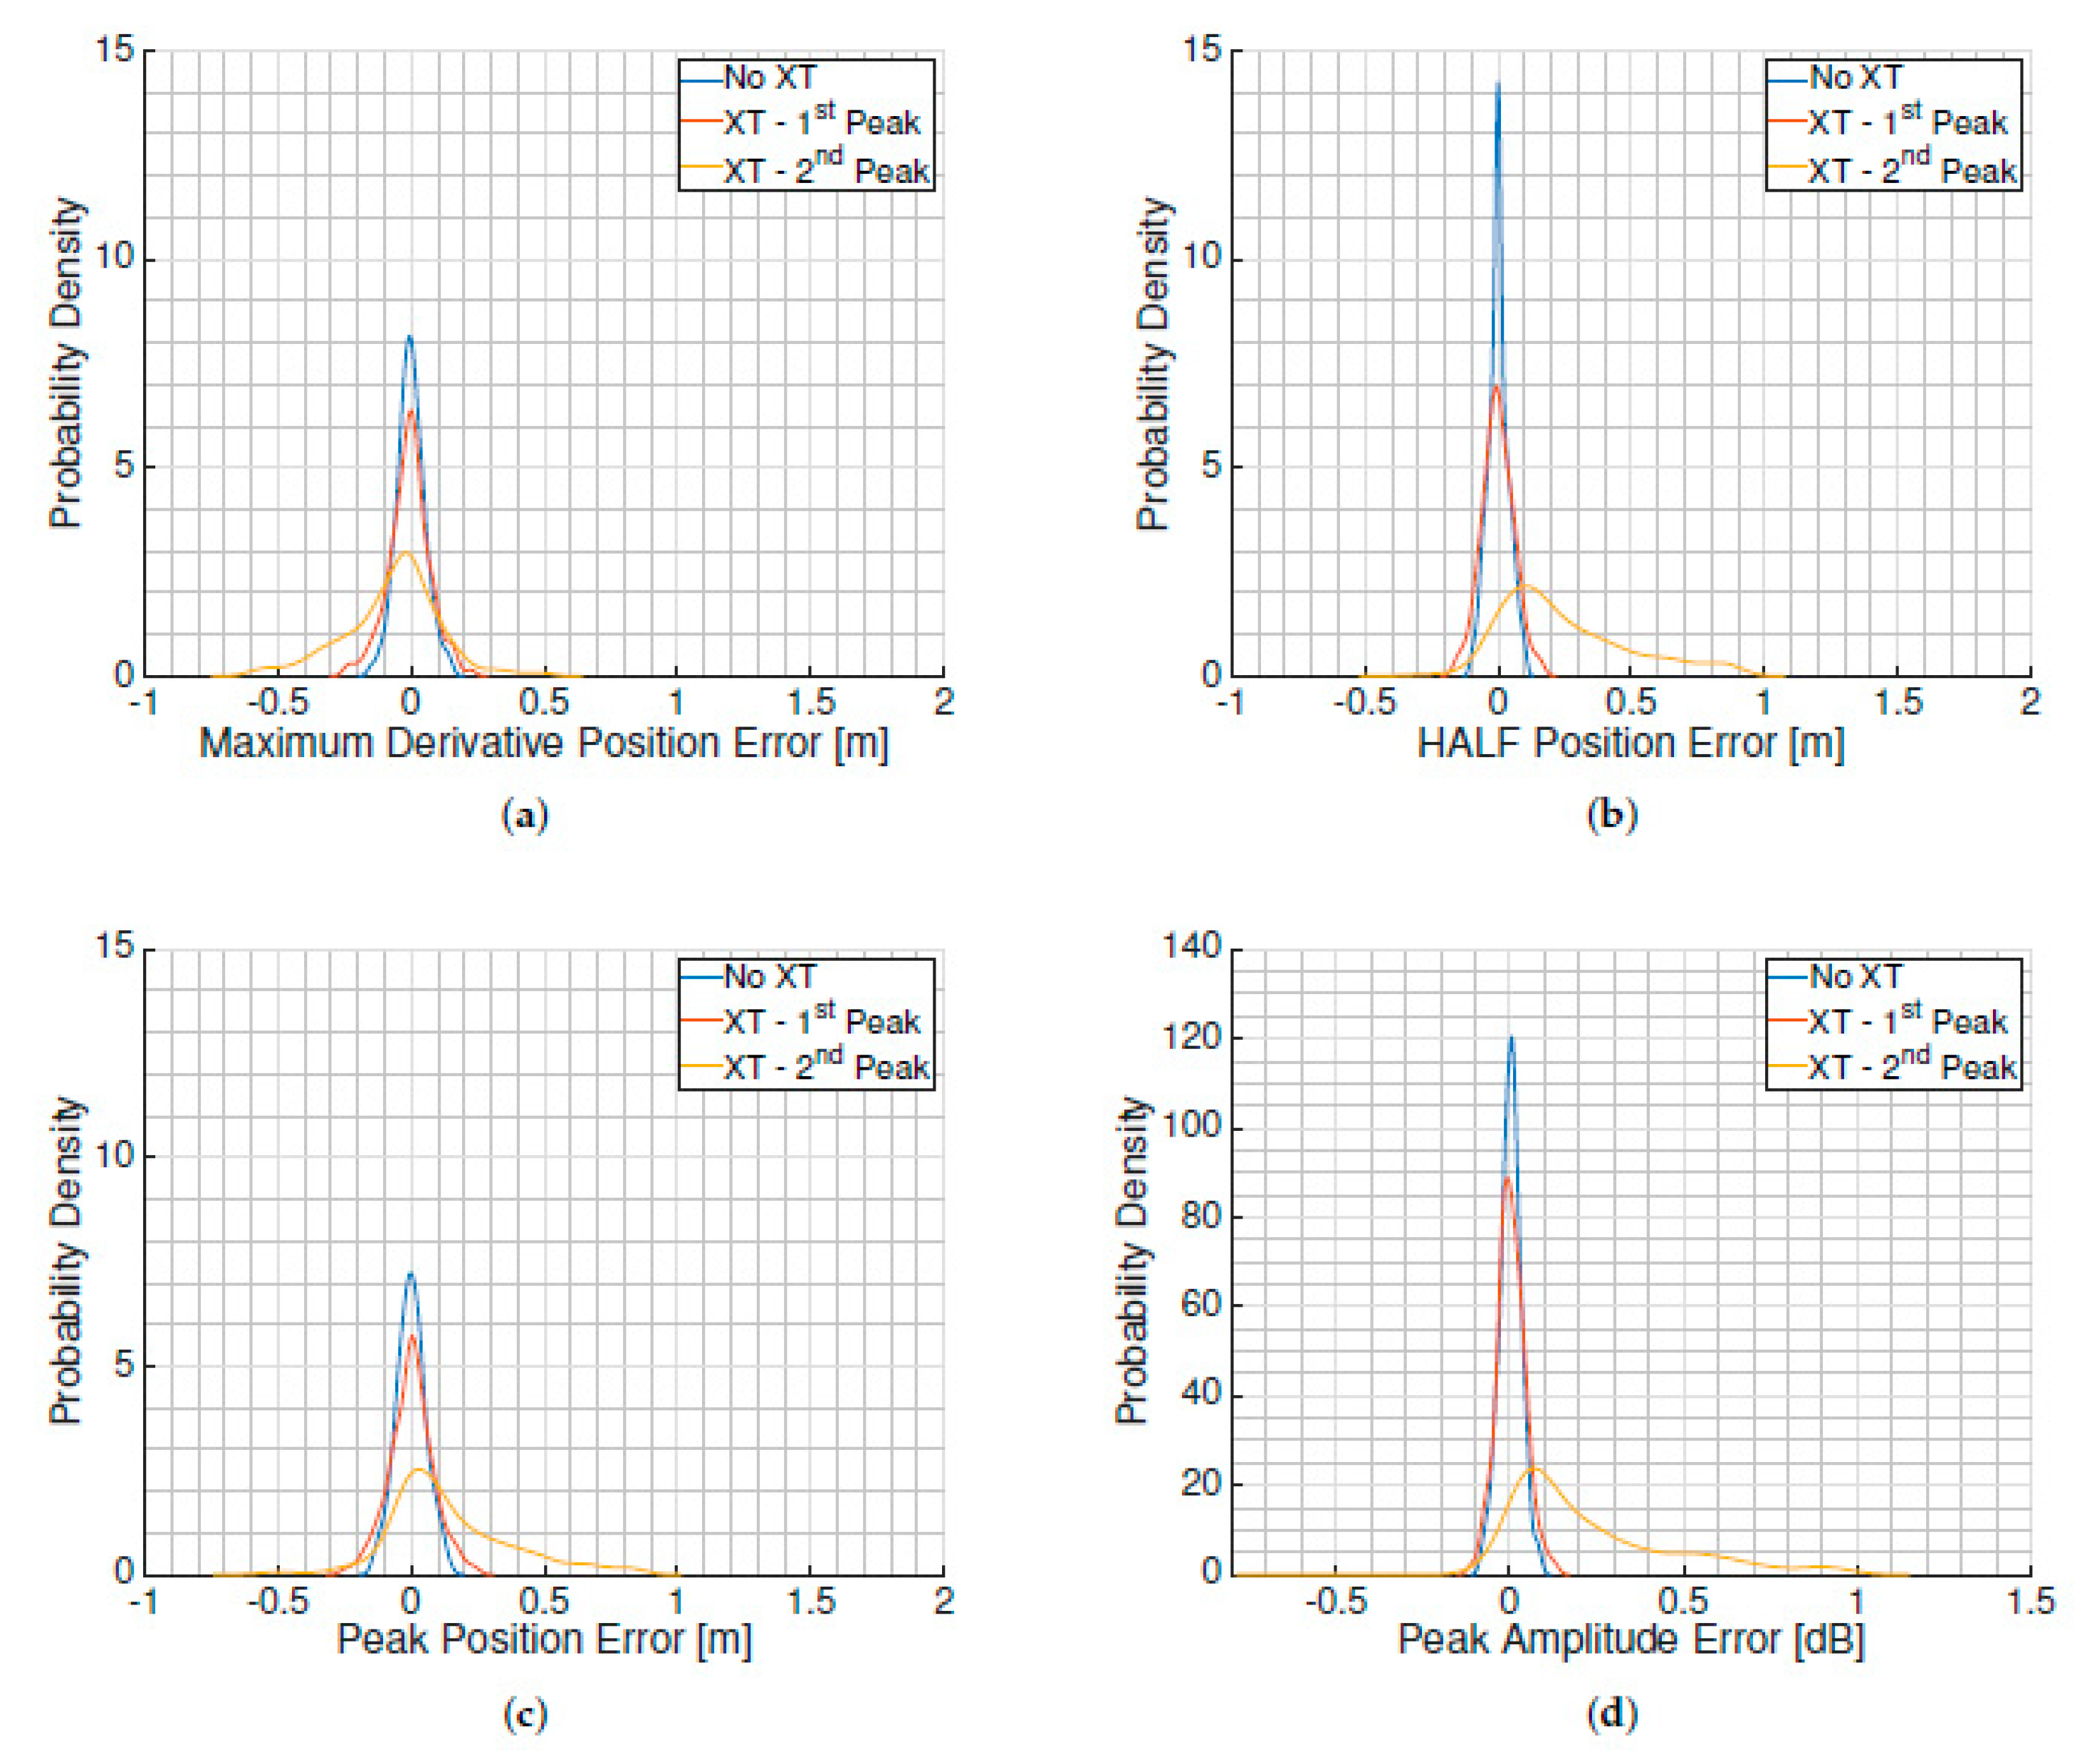
Figure 6 shows the error PDF when estimating (a) the maximum derivative point, (b) the half power point, (c) the peak position, and (d) the peak amplitude. The “NOXT” PDFs show the error estimation caused only by the noise. The “XT” PDFs show the error estimation caused by satellite cross-talk and the noise. The analysis distinguishes between the interfering cross-correlation peak arriving after the tracked satellite cross-correlation peak (“first peak”), or arriving before (“second peak”). The mean and standard deviation of each PDF is shown in
Table 1. In the case of the amplitude, the mean and standard deviation are first estimated as the geometric mean and geometric standard deviation, and then they are converted into decibels. The position error is considered positive if the point position is delayed, and the amplitude error is considered positive if the amplitude increases.
When the interfering cross-correlation peak was received after the tracked satellite one (“first peak”), the standard deviation of the estimations slightly increased with respect to the NOXT case, but the bias was not affected significantly. Since the delay estimators were applied to the leading edge of the first peak, the interfering one has to be really close to affect these estimators—that is, being almost totally overlapping. Furthermore, the symmetry of the PDF and the unchanged bias suggests that the PDF has changed only because the reconstructed waveform (see Equation (
6)) has more noise terms that the conventional one (see Equation (
4)).
On the contrary, when the interfering cross-correlation peak was received before the tracked satellite one (“second peak”), the PDF lost its symmetry, it was biased, and the standard deviation was increased up to 40 cm with respect to the previous case. The PDFs show the DER point moving in the opposite direction than the HALF and the MAX points, as expected. The trailing edge of the interfering cross-correlation peak advanced in time with the MAX and the HALF positions because the trailing edge can be approximated by a decreasing exponential function
, which is a monotonic decreasing function. On the other hand, the DER point was delayed because the derivative of the trailing edge
is a monotonic increasing function. The maximum derivative delay estimator seemed the more robust one, whereas the half estimator was the most affected by cross-talk. All the estimators showed an increase of the standard deviation up to tenths of cm, which prevents the desired centimetric precision in altimetric applications [
4]. The peak value estimation seems to be affected in the same way as the delay estimators; if the interfering cross-correlation peak was received after the tracked satellite cross-correlation peak, the amplitude estimation was not affected, whereas in the opposite case, the PDF was biased and the std increased up to 0.24 dB, which would affect the accuracy of retrieved geophysical parameters, such as soil moisture.

 ,
, 


