Calibration and Impact of BeiDou Satellite-Dependent Timing Group Delay Bias


1
Department of Maritime Systems Engineering, Tokyo University of Marine Science and Technology, Tokyo 1358533, Japan
2
Shanghai Astronomical Observatory, Shanghai 200030, China
3
Chinese Academy of Surveying and Mapping, Beijing 100830, China
4
College of Surveying and Geo-Informatics, Tongji University, Shanghai 200092, China
5
School of Electronic and Information Engineering, Shenyang Aerospace University, Shenyang 110136, China
*
Author to whom correspondence should be addressed.
Remote Sens. 2020, 12(1), 192; https://0-doi-org.brum.beds.ac.uk/10.3390/rs12010192
Submission received: 27 November 2019
/
Revised: 24 December 2019
/
Accepted: 3 January 2020
/
Published: 5 January 2020
Abstract
:The accuracy of the timing group delay (TGD) transmitted in the broadcast ephemeris is an important factor that affects the service performance of a GNSS system. In this contribution, an apparent bias is found by comparing the orbit and clock difference using half-year data of the BeiDou navigation satellite system (BDS) broadcast ephemeris and precise post-processed products. The bias differs at each satellite on each frequency and shows a general systematic difference between BDS-2 and BDS-3. We attribute this to the satellite-dependent TGD bias of the BDS broadcast ephemeris, which is subsequently calibrated. Moreover, to calibrate the bias independently, a network solution strategy is proposed based on 87 globally distributed multi-GNSS experiment (MGEX) stations spanning 25 weeks. The estimated bias shows good agreement with the values observed from the orbit and clock comparison. For the validation of the bias, we compared the signal-in-space range error (SISRE) performance with and without the TGD bias correction. The results show that the SISRE of the BDS improved from 0.71, 0.81, and 1.40 m to 0.64, 0.66, and 0.64 m in the B1I, B3I, and B1I/B3I frequencies. For BDS-3, the SISRE is well within 0.50 m after the bias correction. To further validate the bias, a week’s data were collected at 97 globally distributed MGEX stations. When the TGD bias is corrected, the root mean square (RMS) of single point positioning (SPP) can be improved by 5.6, 8.4, and 21.6% in the B1I, B3I, and B1I/B3I frequencies. Meanwhile, the SISRE and SPP assessment results also indicate that the TGD bias should be corrected by each satellite rather than only corrected between BDS-2 and BDS-3.
1. Introduction
With the continuous launch of new satellites since 2017, the BeiDou navigation satellite system (BDS) was announced to provide global service from the end of 2018. Consisting of 15 BDS-2 and 18 BDS-3 satellites by the end of June 2019, the BDS is able to provide global positioning, navigation, and timing (PNT) services with a positioning accuracy within 10 m (95%) in the horizontal and vertical components [1].
The BDS-2 satellites transmit public signals at frequencies of B1I, B2I, and B3I, while B1I, B1c, B2a, B2b, and B3I signals are transmitted on BDS-3 satellites [2]. The B1I, B2I, and B3I signals are centralized at the frequencies of 1561.098, 1207.140, and 1268.52 MHz, while the B1c and B2a signals share the same frequency with L1(GPS)/E1(Galileo) and L5(GPS)/E5a(Galileo), which enables the compatibility and interoperability among these systems. The detailed frequency of the open signals for GPS, Galileo, and BDS are listed in Table 1.
For BDS, the satellite clock in the broadcast ephemeris is referred to the B3I signal, whereas the post-processed precise clock provided by the International GNSS Service (IGS) is usually based on an ionosphere-free combination. To correct the hardware delay difference on different frequencies or different frequency combinations, the timing group delay (TGD) transmitted in the broadcast ephemeris or the post-processed differential code bias (DCB) is adopted, namely TGD1 and TGD2, which describes the TGD corrections from B3I to B1I and B2I frequencies, respectively. By tracking the regional monitoring stations in China, the BDS provides TGD with a stability of better than 1 ns [3]. Meanwhile, for the post-processed DCB provided by the multi-GNSS experiment (MGEX), it exhibits a precision of 0.36 ns with a monthly stability of 0.17 ns with the contribution of more globally distributed MGEX stations [4].
Although both the BDS DCB and TGD exhibit good stability, there still exists a bias between the BDS TGD and DCB. A notable scatter of ±1.5 ns for TGD1 and ±3 ns for TGD2 was observed by Montenbruck et al. [5], which far exceeds the uncertainty of the TGD estimation. Even for the BDS DCBs generated by different MGEX analysis centers, there also is a bias of 0.3~0.4 ns at different satellites [4]. This may be a result of the different selection of the tracking network and corresponding receivers in TGD/DCB estimation [5]. As pointed out by Hauschild and Montenbruck [6], the inconsistent code bias of different receivers will lead to inconsistency in DCB estimation, even if all receivers are configured to use their standard correlators. According to Tan [7], multiple parallel narrow correlation techniques are adopted at BDS monitoring stations, which is different from the commonly used wide correlators in commercial receivers such as Trimble and Septentrio. This may explain the significant bias between the BDS TGD and DCB. Starting from July 2017, the wide correlated pseudo-range observations were adopted in the BDS TGD estimation [8]. An apparent improvement in the consistency of the TGD and DCB was observed for BDS-2 after TGD update, with a root mean square (RMS) difference of 0.29 ns in TGD1 and 0.25 ns in TGD2, respectively. With the availability of BDS-3 satellites, the corresponding DCB was also generated at the Chinese Academy of Science (CAS) and the German Aerospace Center (DLR). Wang et al. [9] analyzed the accuracy of broadcast group delay of GPS, Galileo, and BDS by comparing with DCB products from the CAS. It was shown that the overall agreement was at the level of 0.05–0.45 ns for GPS, while for Galileo, the agreement of 0.3–0.4 ns was obtained, which is acceptable considering the accuracy of DCB products. However, when comparing the DCB and TGD1 of BDS-3 satellites in January 2019, a datum deviation of 3.8 ns between BDS-2 and BDS-3 was found. Wang et al. [9] inferred that independent receivers are employed at the monitoring stations for BDS-2 and BDS-3. For BDS-3, Lv et al. [10] assessed the broadcast orbit and clock accuracy by comparing with precise orbit and clocks and found a nonzero mean bias of BDS-3 clocks. However, no explanation of how the clock bias comes about was given. Besides, these researches only focused on the overall datum bias between BDS-2 and BDS-3 or assumed that the satellite-dependent bias is from the clock error. Does the bias also disperse on BDS-2 satellites? Is the bias satellite-dependent bias also frequency dependent? A detailed analysis of these issues should be further investigated.
The bias between the DCB and TGD affects the performance of signal-in-space range error (SISRE) and user positioning [11]. Montenbruck et al. [12] evaluated the BDS SISRE using the TGD and DCB. During a 12-month comparison in the period of 2013–2014, the BDS SISRE showed a better consistency with an RMS of 1.1 m after DCB correction as compared to 1.5 m using TGD correction. The accuracy of the TGD also decreases the precision of single point positioning (SPP) compared with the DCB [13]. With the update of the BDS TGD after July 2017, the BDS SISRE was reported to be around 0.81 m after TGD or DCB correction, which indicates a similar accuracy and good agreement between TGD and DCB [8]. For the SISRE performance of BDS-3, Yang et al. [14] first reported an average value of 0.44 m using 4 days’ worth of data from eight BDS-3 satellites by comparing the broadcast ephemeris and precise results from the International GNSS Monitoring and Assessment System (iGMAS). A comprehensive comparison with 2 months’ worth of data from the 18 BDS-3 satellites showed that the SISRE of BDS-3 was 0.71 m after TGD correction and 0.57 m after DCB correction [15]. Therefore, except for the apparent TGD bias between BDS-2 and BDS-3, a dispersion bias of the TGD among BDS-3 satellites was also indicated.
The motivation of this contribution was to investigate and calibrate the satellite-dependent TGD bias with the current BDS constellation. Other than Wang et al. [9] and Lv et al. [10], we calibrate the satellite-dependent bias for BDS-2 and BDS-3 and attribute this bias to a TGD bias, which is frequency dependent and validated by orbit and clock comparison and network solution. The paper is organized as follows. First, the TGD bias is calibrated by comparing the difference between the BDS broadcast ephemeris and MGEX precise products. To further confirm the existence of the bias, raw observation data from 87 MGEX stations are used for the calibration of the bias. The contribution of the calibrated TGD bias is then applied to the SISRE assessment and single point positioning (SPP). Finally, some conclusions and discussions are presented.
2. BeiDou Timing Group Delay Bias from Precise Products
2.1. BeiDou Timing Group Delay
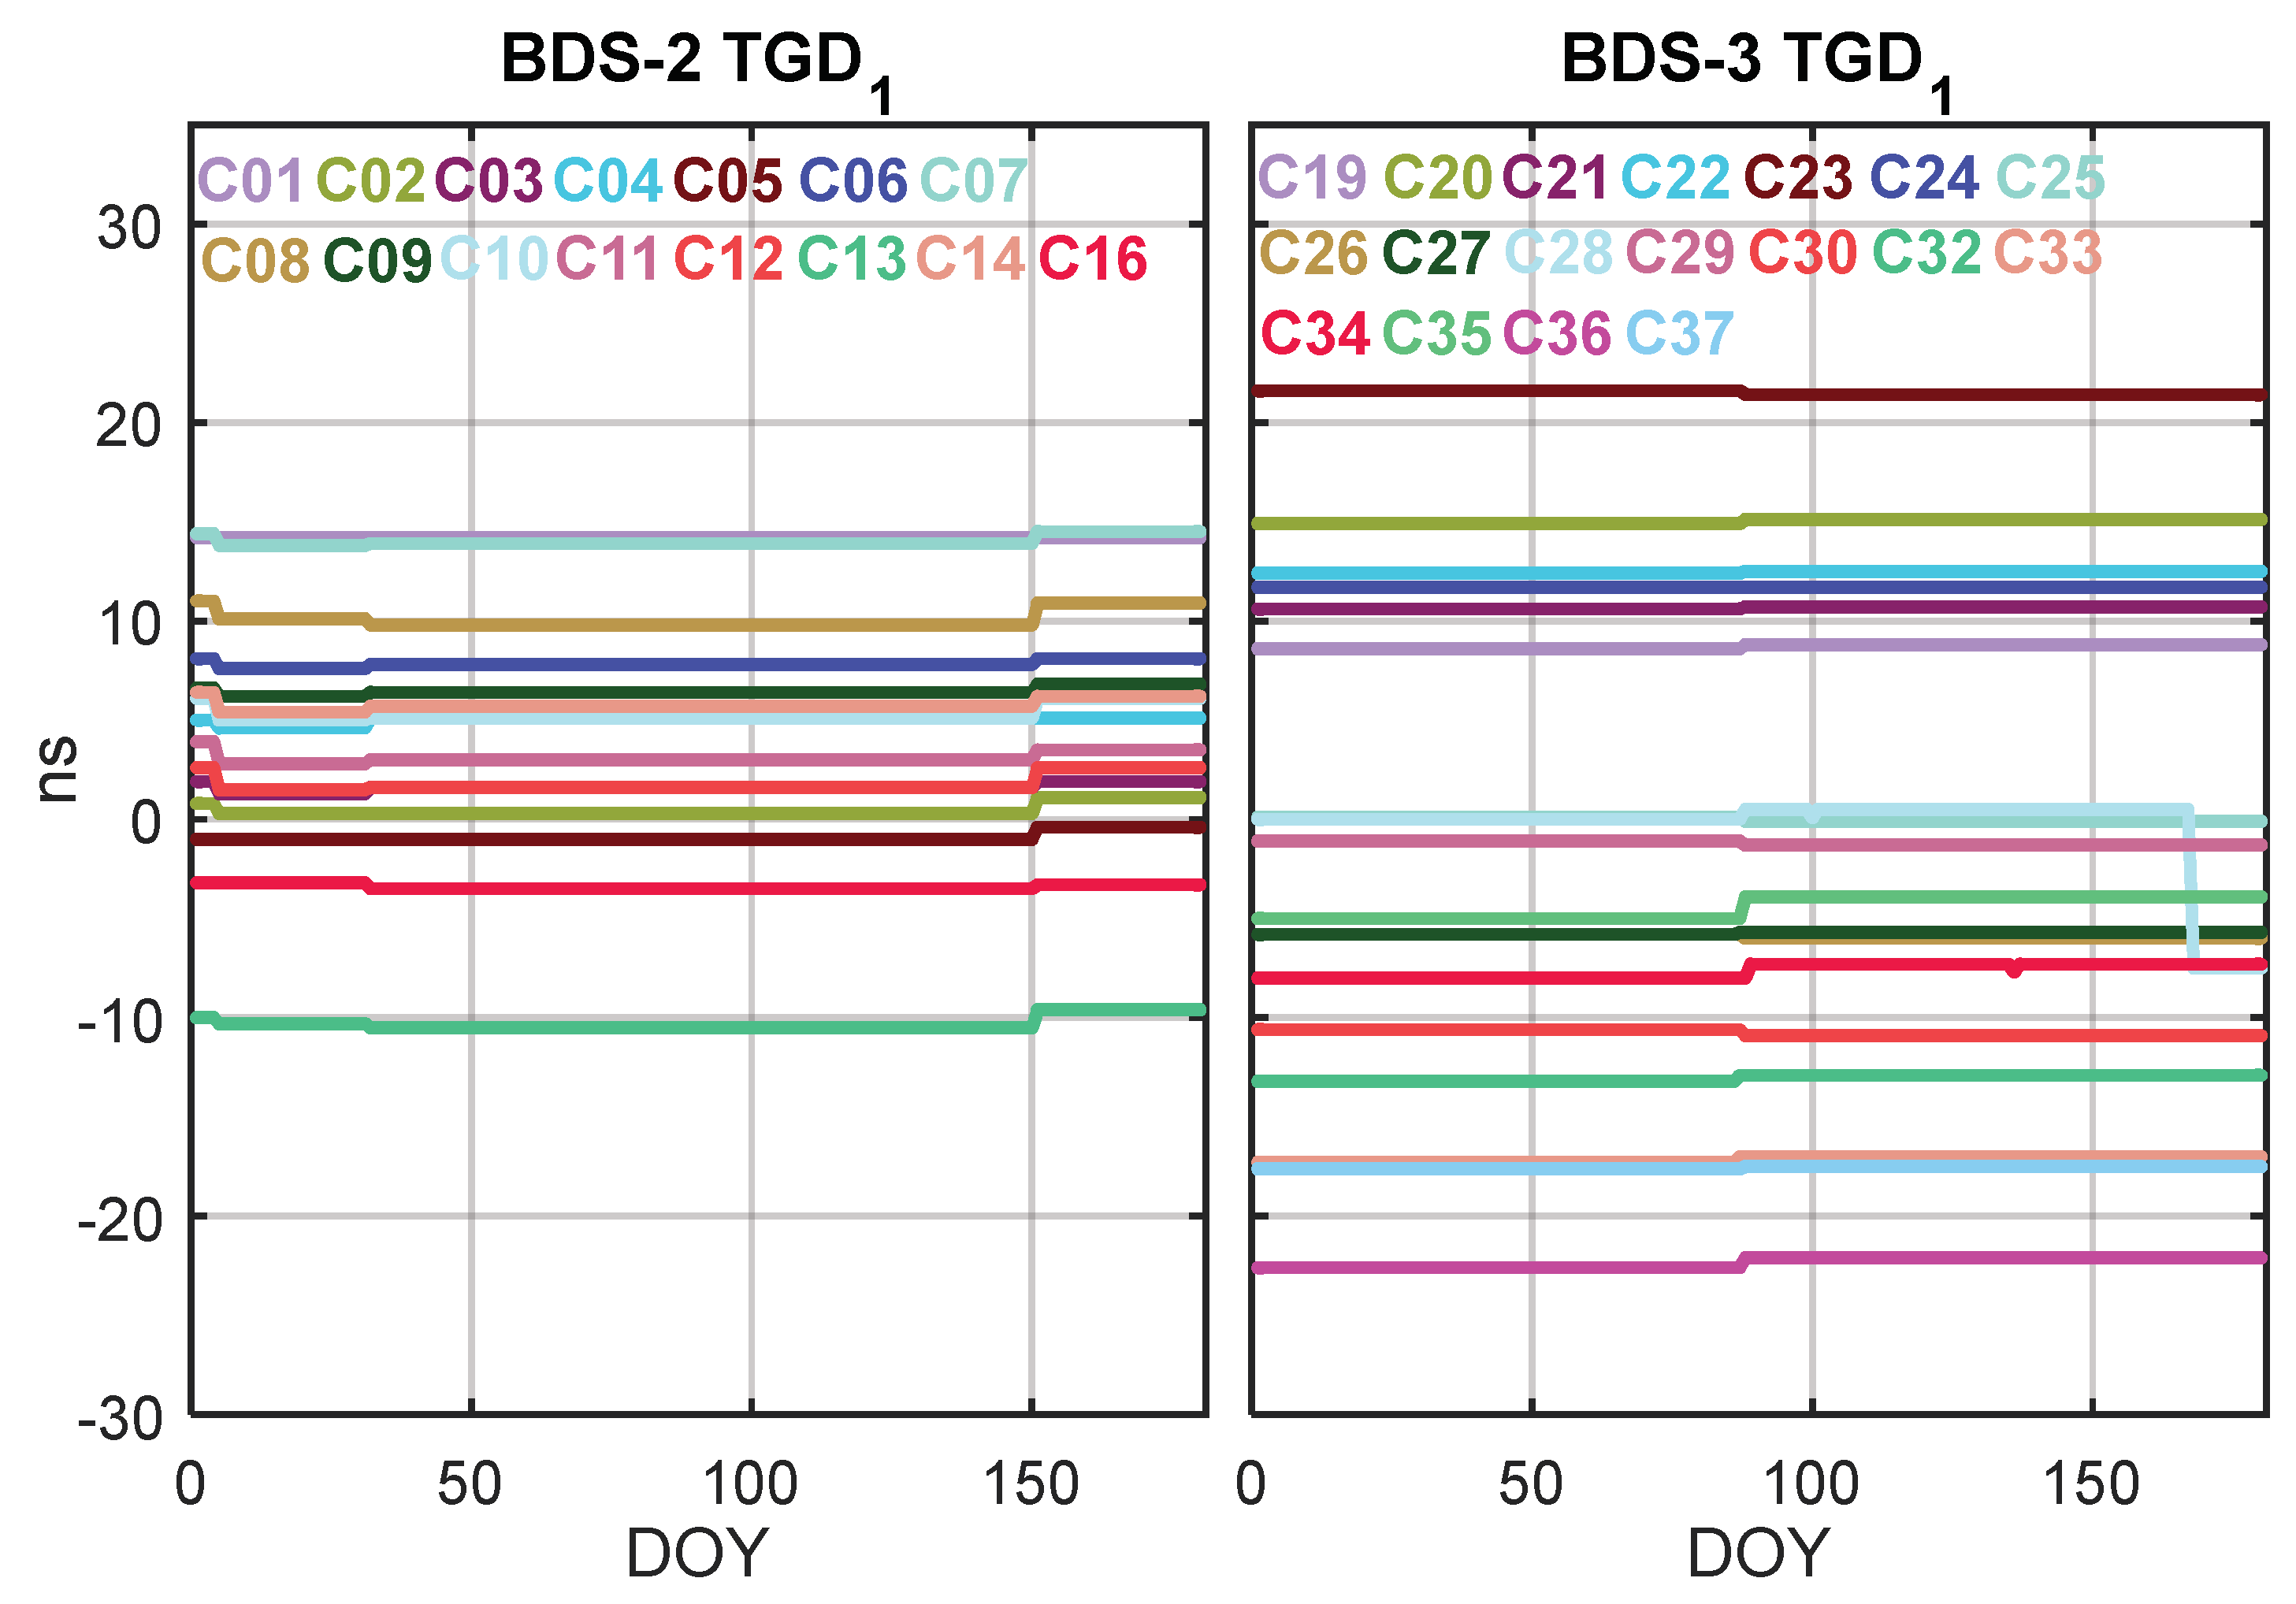
Using the daily TGD values from the broadcast ephemeris from day of year (DOY) 001 to 180 in 2019, Figure 1 plots the TGD1 variations of BDS-2 (C01–C16) and BDS-3 (C19–C37). It can be seen that the absolute TGD value of BDS-3 is much larger than that of BDS-2. However, this does not affect user positioning once it is corrected. Different from the daily updated DCB, the BDS TGD is set as a constant value on each satellite apart for some updating epochs. During the half-year period of 2019, the TGD of BDS-2 was updated on DOY 005, 032, and 151, while the TGD of BDS-3 was updated on DOY 087. For C28, there was a big update on DOY 167 due to the satellite reconfiguration that occurred on this date. Nevertheless, it is interesting to find that the TGDs of BDS-2 and BDS-3 were updated separately. Therefore, it can be inferred that the TGD updates on BDS-2 and BDS-3 on the BDS control segment may be determined independently.
With the more accurate DCB values from the DLR and CAS (ftp://igs.ensg.ign.fr/pub/igs/products/mgex/dcb/), we can assess the precision of the TGD. In this study, the daily DCB products provided by DLR were adopted. While the MGEX DCB products are commonly aligned to a satellite zero-mean condition, the basis of the TGD is usually referred to a calibrated reference receiver [5]. For the comparison of the TGD and DCB, the systematic bias should be removed. In this study, the TGD and DCB are realigned to the zero-mean of the 33 BDS satellites, as they were all available throughout the test period.
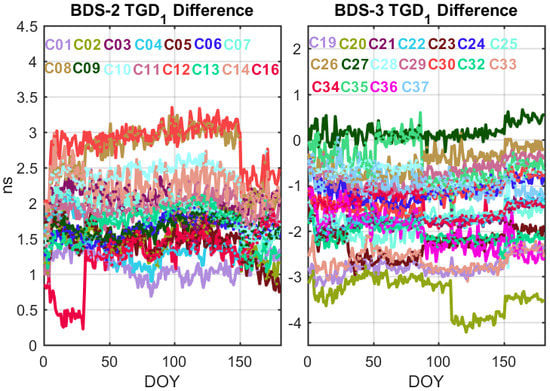
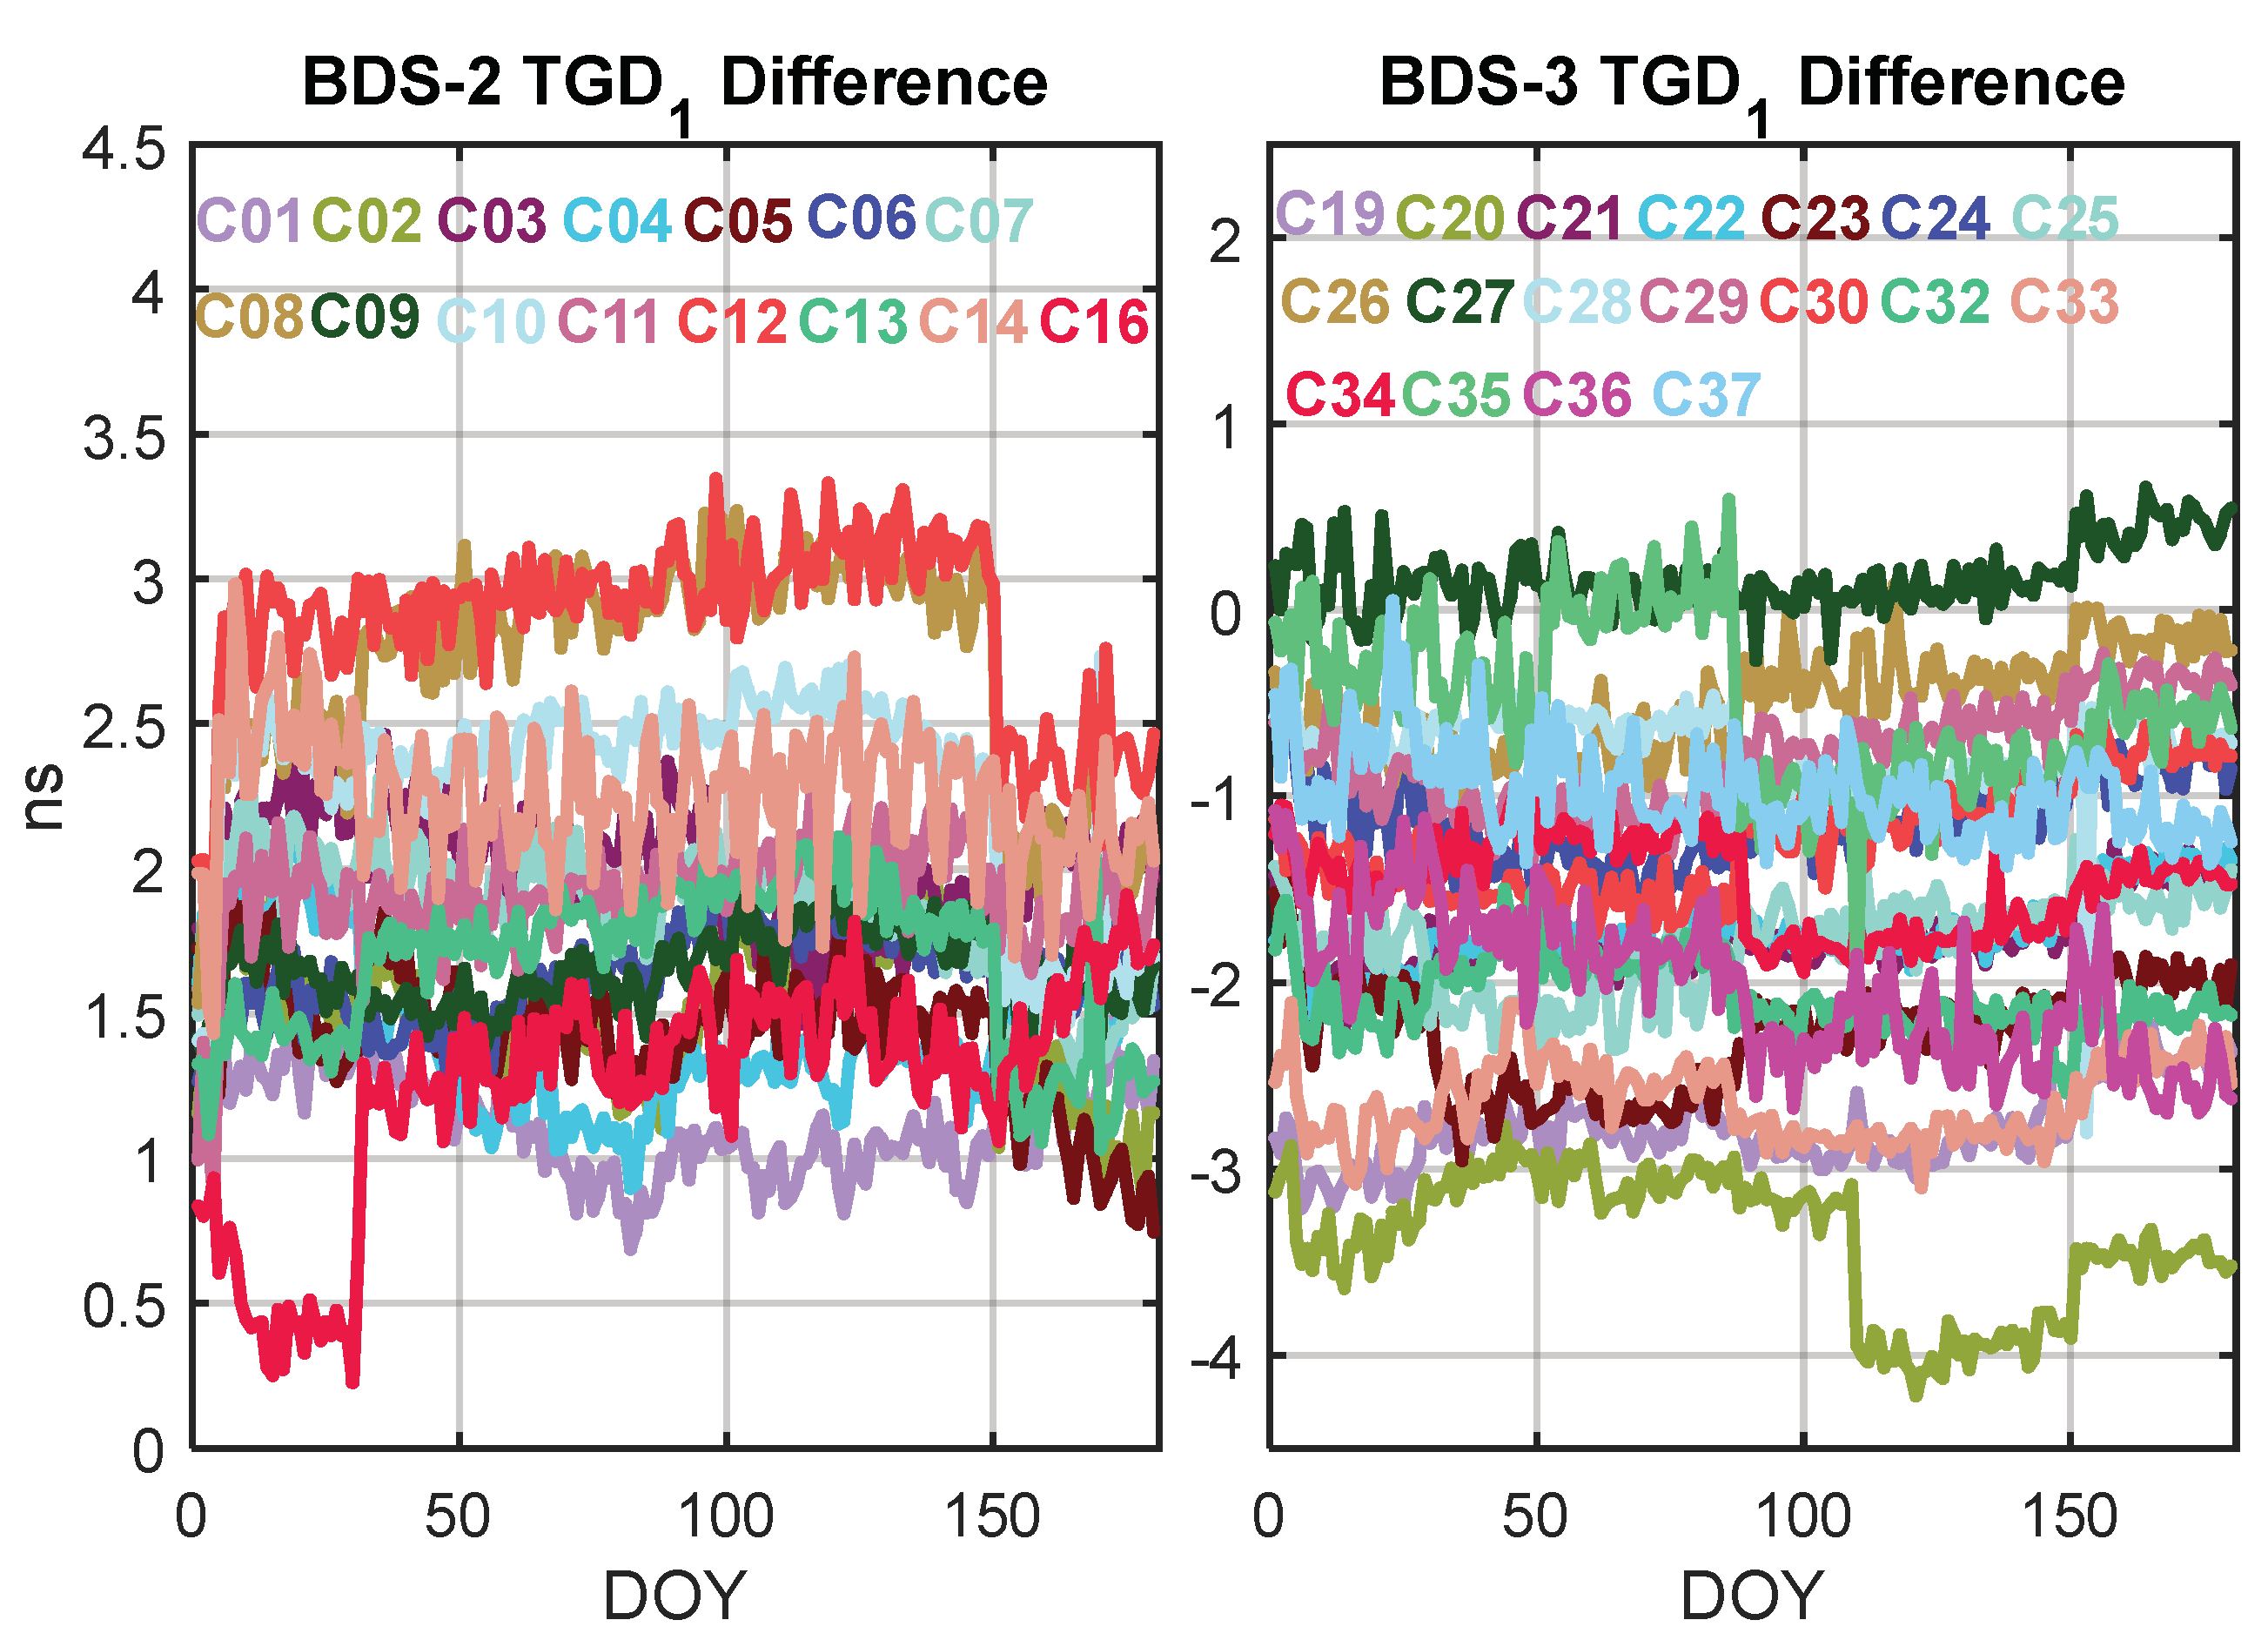
Figure 2 gives the difference between the BDS TGD1 and the DLR DCBB1I/B3I during DOY 001–180 in 2019. The difference is not as stable as the TGD variation in Figure 1, due to the daily jump of the DCB values and the TGD update. Despite that, a considerably constant difference on each satellite can still be observed, which implies that a constant bias of the DCB and TGD does exist on each satellite. What is more, it is clear that there is a more significant bias between BDS-2 and BDS-3. The average bias is approximately 3.24 ns, which is close to the value of 3.8 ns as reported by Wang et al. [9]. This systematic bias may be attributed to the independent receivers employed at the monitoring stations for BDS-2 and BDS-3 [9]. Given that the DCB is determined by commercial receivers at MGEX stations, this TGD bias between BDS-2 and BDS-3 should be corrected when similar receivers are used for positioning.
2.2. BeiDou Broadcast Ephemeris Error
The combined orbit and clock SISRE of the BDS broadcast ephemeris can be expressed as follows [12]:
where GEO (geostationary orbit), IGSO (inclined geosynchronous orbit), and MEO (medium Earth orbit) stand for different satellite constellation of BDS. R, A, and C denote the orbit errors in the radial, along-track, and cross-track directions, while Clk denotes the clock offset error.
For the assessment of SISRE, the post-processed precise products including the orbit, clock, and DCB provided by MGEX analysis centers are commonly used as a reference. As an MGEX analysis center, Wuhan University started to generate precise orbit and clock (WUM) of BDS-3 from 2019 (ftp://igs.ensg.ign.fr/pub/igs/products/mgex/). When comparing the precise products with the BDS broadcast ephemeris, the difference in the time and coordinate reference system, satellite antenna offset correction, and clock offset correction should be considered [15]. It should be pointed out that, different from the traditional B1I/B2I ionosphere-free (IF) combination, the WUM products apply the B1I/B3I IF combination for precise orbit determination, as the B2I signal is not supported by BDS-3 satellites [16].
Considering that the BDS satellite clock transmitted in the broadcast ephemeris is based on B3I frequency, when comparing the satellite clock difference, the TGD or DCB should be applied to correct the clock frequency difference. For instance, as B1I and B3I are the common frequencies adopted in BDS-2 and BDS-3, when aligning the clock to B1I, B3I, and B1I/B3I IF frequencies, the corresponding corrections are as follows [11,17]:
where TGD1 is the TGD correction from B3I to B1I, which can be derived from the broadcast ephemeris. f1 and f3 represent the frequencies of the BDS at B1I and B3I, and DCBB1I/B3I stands for the DCB correction from B3I to B1I.
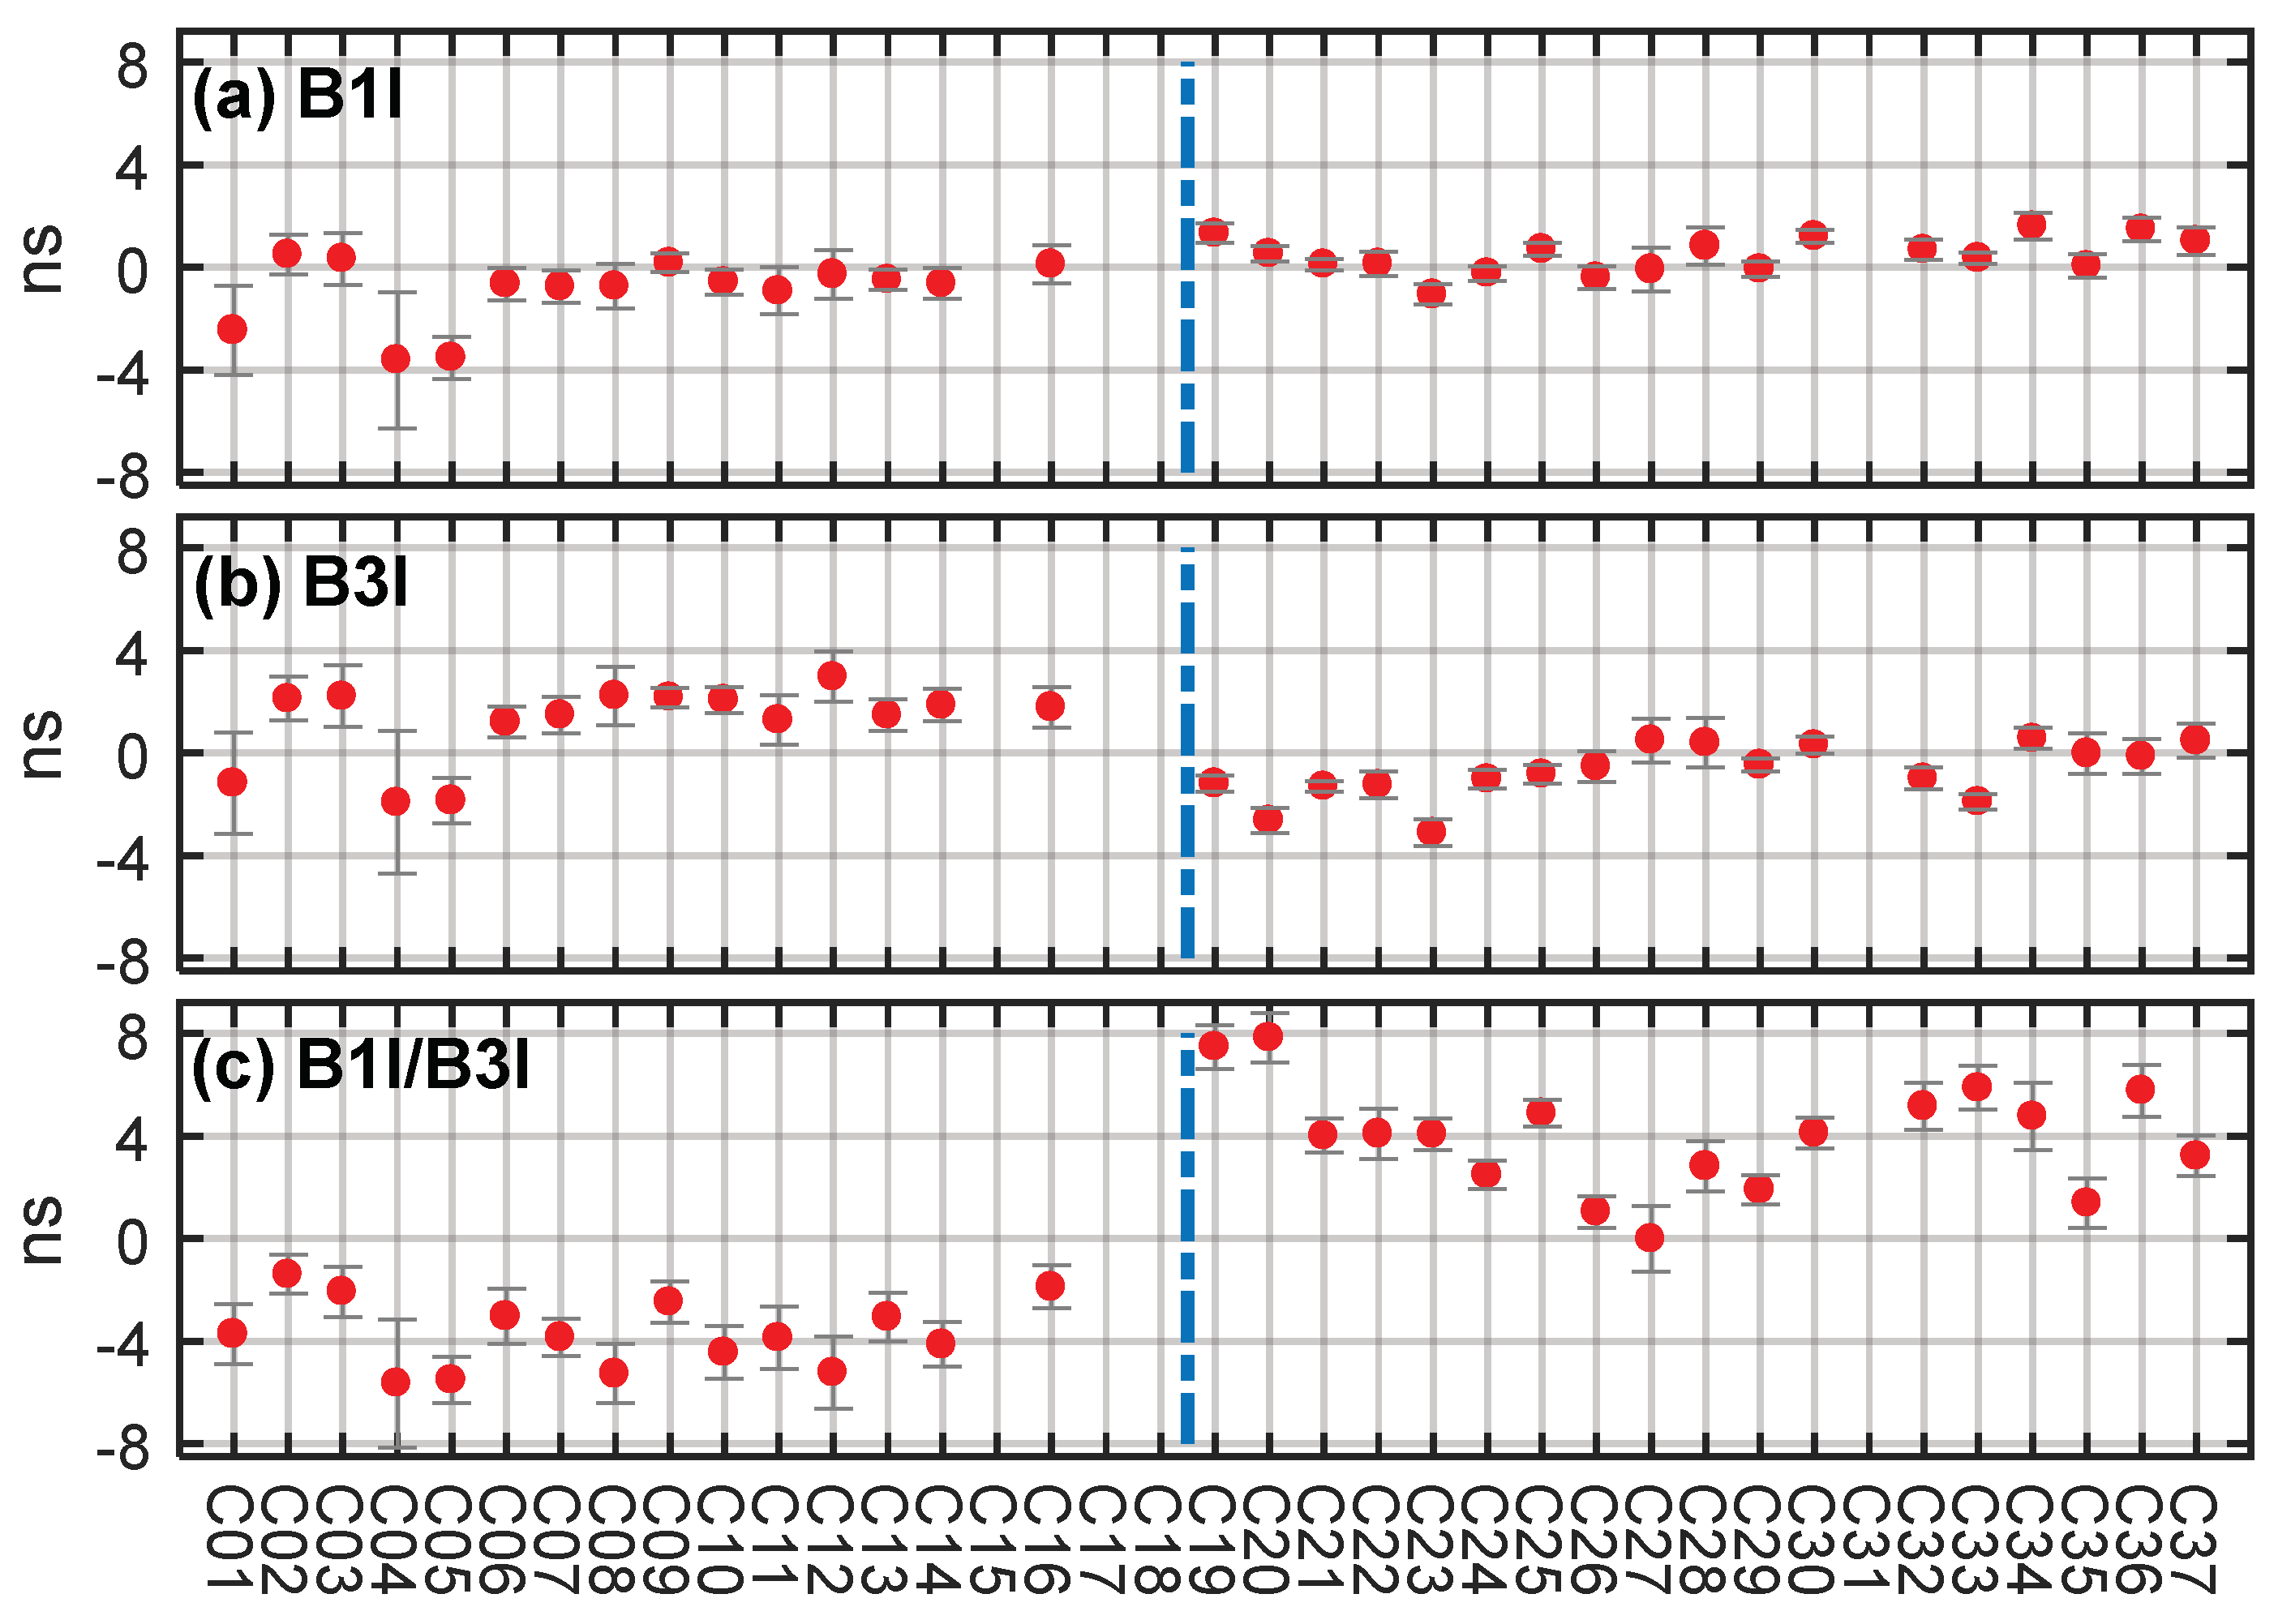
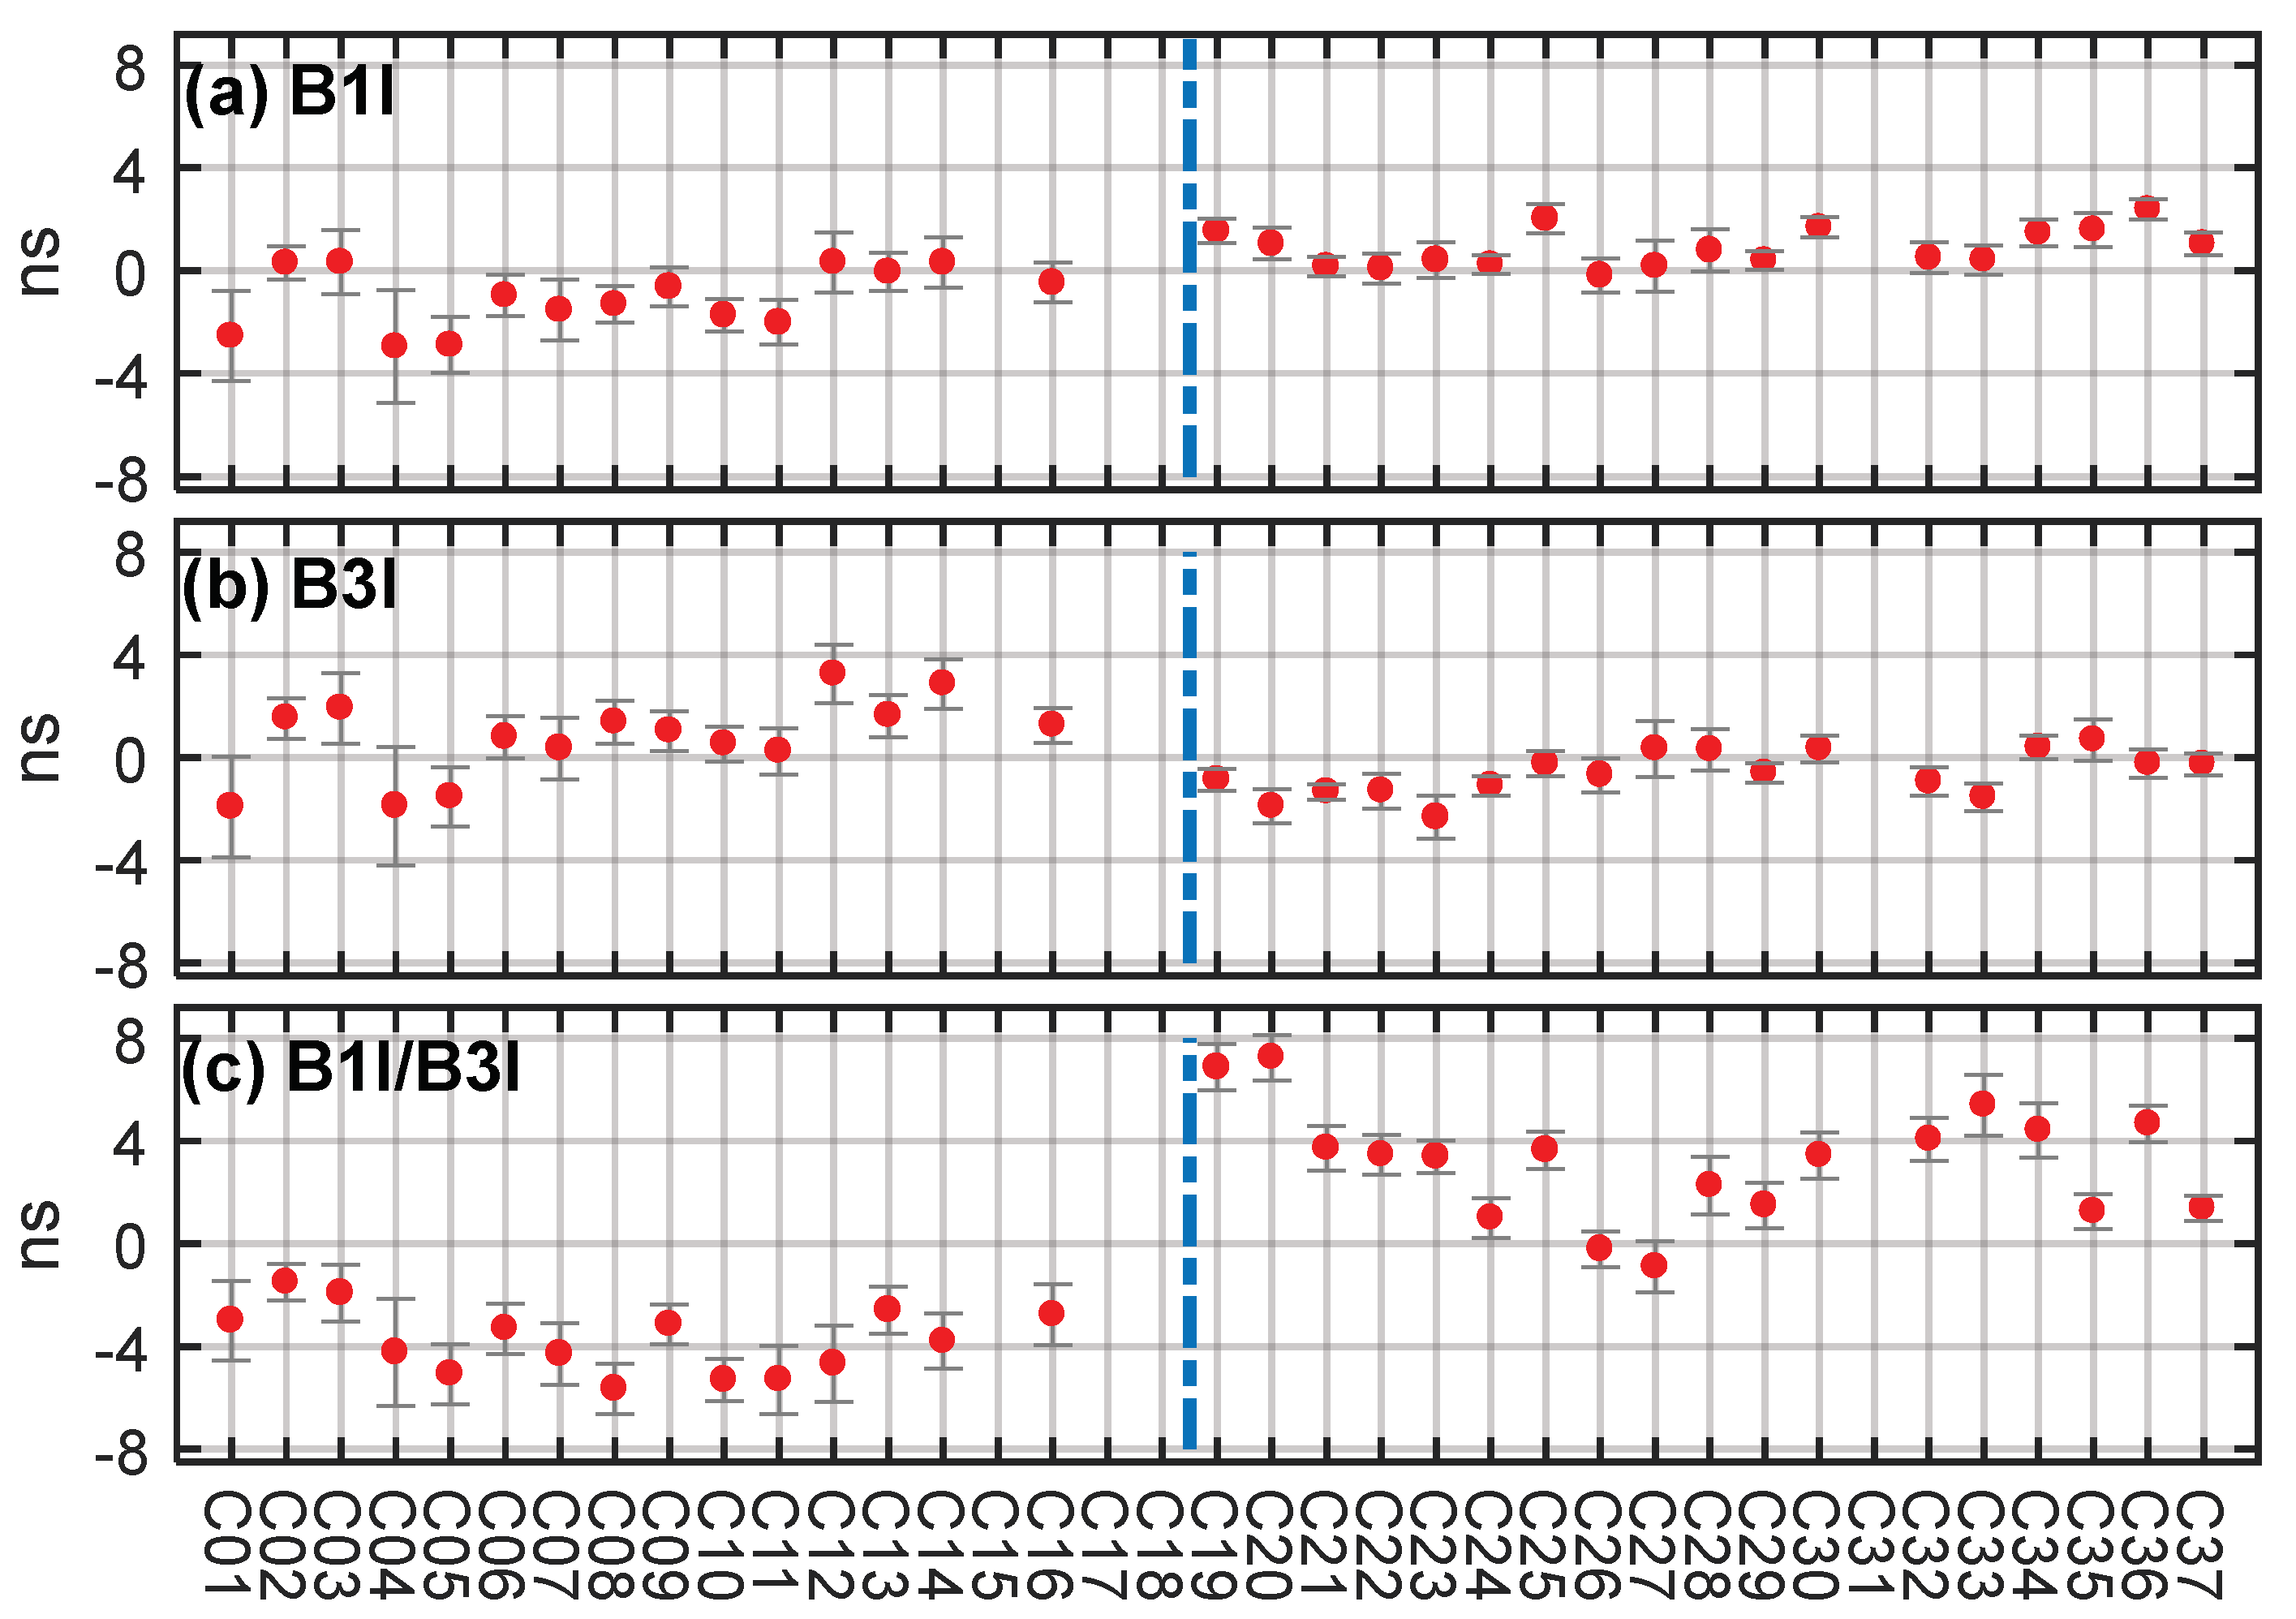
It can be seen from Equation (1) that the integrated satellite clock and radial orbit error, i.e., , contributes the main part of the SISRE. To investigate the BDS broadcast ephemeris error, we computed the weekly of each satellite. According to Equation (2), the can be derived at different frequencies. Using the data from GPS weeks 2035–2059 (DOY 006–180 in 2019), the weekly average with the corresponding standard deviations (STD) for each satellite at B1I, B3I, and B1I/B3I frequencies are illustrated in Figure 3. As can be seen, the values of on B1I and B3I for most of the satellites are within 3 ns. For B1I/B3I, it can reach 8 ns at most, due to the amplification of the TGD error according to Equation (2). This implies that the bias is different for each satellite and each frequency. Therefore, it is not proper to attribute the bias to clock bias as pointed by Lv et al. [10]. Meanwhile, for B3I and B1I/B3I, a noticeable systematic bias between BDS-2 and BDS-3 can be found. If we separate the BDS-2 and BDS-3 satellites into two different groups, the average differences of between BDS-2 and BDS-3, i.e., , can be derived, being 1.36, −1.90, and 7.61 ns at B1I, B3I, and B1I/B3I, respectively. However, it should be noted that except for the significant bias between BDS-2 and BDS-3, the bias also is dispersed by satellite. Moreover, the time variation of the bias on each satellite is rather stable, with average STD values of 0.57, 0.63, and 0.83 ns at B1I, B3I, and B1I/B3I, respectively. This indicates that this bias can be well-calibrated.
2.3. Calibration of the Timing Group Delay Bias
For the pseudo-range measurement of the BDS, the observation equations at B1I, B3I, and B1I/B3I can be written as follows:
where is the raw measurement of the pseudo-range at frequency i and IF denotes the ionosphere-free combination. is the receiver clock including the receiver hardware delay at frequency i; is the satellite clock on B3I; and are the troposphere and ionosphere delays, respectively; is the TGD correction from B3I to B1I; and is the pseudo-range observation noise at frequency i.
Assuming that the DCB is a more accurate product compared with the TGD, it can be inferred that the abovementioned bias may come from the TGD bias according to Equation (2). For the analysis of the B1I and B3I frequencies, let dtgd0 be the TGD bias at B3I frequency, and dtgd1 be the residual TGD bias of the TGD1. If a TGD bias does exist in the broadcast ephemeris, Equation (3) can then be rewritten as:
Therefore, the relationship between and the TGD bias is:
where biasB1I, biasB3I, and biasB1I/B3I are the biases at B1I, B3I, and B1I/B3I frequencies, as discussed in Figure 3.
By applying the least squares method, dtgd0 and dtgd1 can be easily derived for each satellite. The calibrated TGD bias is listed in Table 2. Meanwhile, given that the apparent systematic bias is observed between BDS-2 and BDS-3, we can also compute the TGD bias and the corresponding STD of BDS-2 and BDS-3 accordingly, which is listed in Table 3. It can be seen that dtgd0 and dtgd1 vary within ±4 ns at different satellites and different frequencies. The overall dtgd1 between BDS-2 and BDS-3 is 3.23 ns according to Table 3, which is almost the same as the average TGD bias by direct comparison of the TGD and DCB bias. This is reasonable, as the bias partly results from the bias between the TGD and DCB. Additionally, the STD of dtgd1 of BDS-3 is larger than that of BDS-2, which may be due to the fact that the BDS monitoring stations are limited in China and do not have good coverage of the Medium Earth Orbit (MEO) satellites [9]. For dtgd0, the overall bias between BDS-2 and BDS-3 is 1.89 ns, which also proves that there exists a systematic clock bias between BDS-2 and BDS-3. However, compared to the STD of less than 0.3 ns at each satellite, the STD of dtgd0 and dtgd1 is much larger. This indicates that, despite the distinct TGD bias between BDS-2 and BDS-3, it is better to calibrate this bias by each independent satellite.
3. BeiDou Timing Group Delay Bias from Network Solution
Although the BDS TGD bias was calibrated in the previous section, it is, in fact, a difference relative to the WUM and DLR products. For the confirmation and independent calibration of the bias, a network solution based on BDS raw measurements is proposed in this section.
3.1. Estimation Method and Data Collection
In Equation (4), the station coordinates can be fixed with a known position. The satellite coordinates, satellite clock, and TGD can be derived from the broadcast ephemeris. The troposphere delay can be corrected by the GPT2w and VMF models [18]. The ionosphere delay can be corrected by the Global Ionosphere Maps (GIM) model for single-frequency data [19] or eliminated by ionosphere-free combination for dual-frequency data. Hence, the estimated parameters are the receiver clocks and the TGD bias at each frequency. For a specific frequency, Equation (4) can be simplified as:
where bias is the code bias correction and y is the pre-fit residual of the observation minus the correction. is the observation noise with the stochastic model:
where is the variance of the code observation, while , , , and represent the SISRE of the BDS satellites, the troposphere error after model correction, the ionosphere error after model correction, and the pseudo-range measurement noise, respectively.
For each satellite tracked by a station, the observation model can be formed as shown in Equation (6). Therefore, the network-based observation model can be simplified as:
where G is the design matrix of the observation model, and x is the estimated parameters:
The normal equation of Equation (9) is rank-defected, as no bias basis is chosen. Similar to DCB determination, in this study, we adopted the conventional zero-mean condition of satellite bias for a better comparison.
By applying the least squares method, the bias on each satellite can be estimated together with the receiver clock, in which the satellite bias is estimated as a constant parameter while the receiver clock is different at each epoch and estimated with white noise. Thereafter, the TGD bias can be derived from Equation (5).
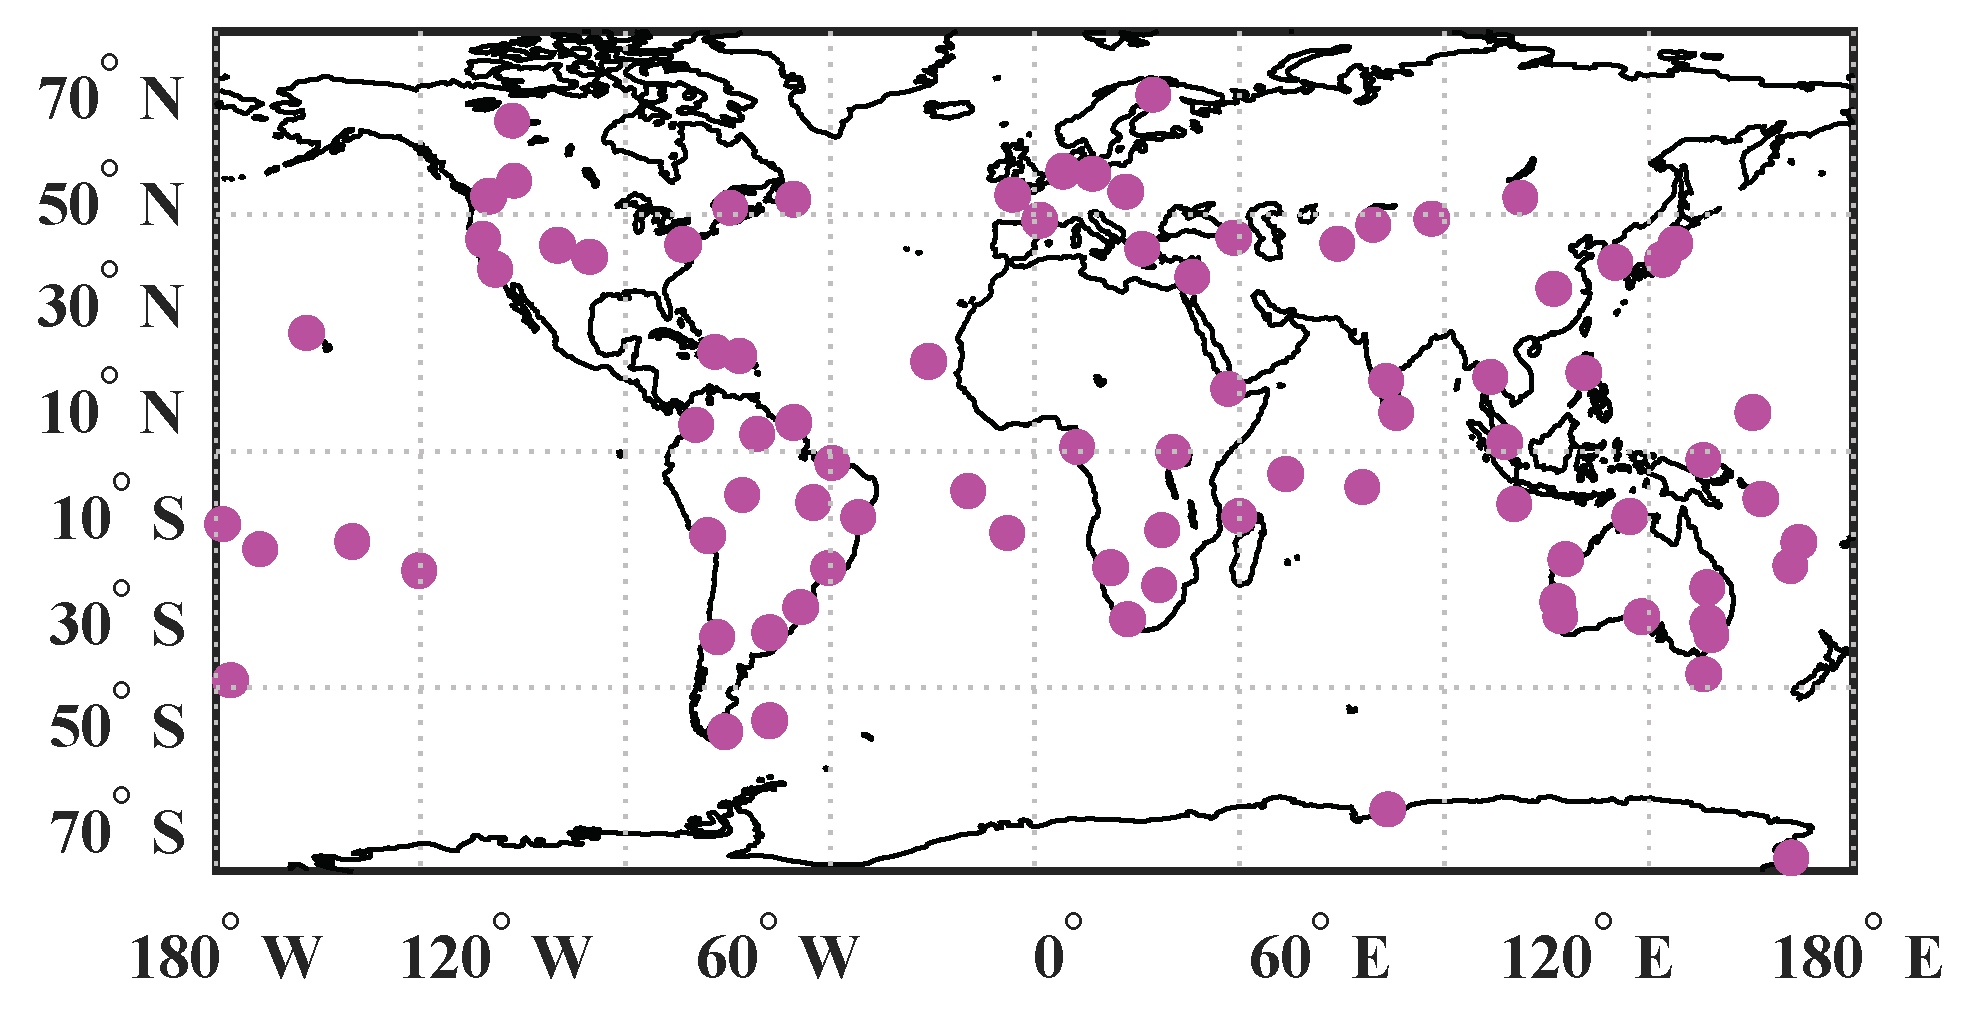
For the estimation of the BDS TGD bias, 87 globally distributed MGEX stations were selected, as shown in Figure 4. The receiver information of these stations is summarized in Table 4. Although all the stations are able to track the B1I and B3I signals of BDS-2 and BDS-3, some BDS-3 satellites or the B3I signal of some satellites cannot be tracked by Trimble and Septentrio, which may due to a firmware problem. For a statistical result, the observation data of each first day in a week from GPS weeks 2035−2059 were collected at these stations.
3.2. Estimated Results
Following the network-based TGD bias estimation method, we derived the weekly bias of each satellite. Figure 5 depicts the estimated bias at B1I, B3I, and B1I/B3I respectively. Compared with the results presented in Figure 3, we can see that the biases from both methods are quite similar. The average STDs of all satellites were 0.80, 0.77, and 1.00 ns at B1I, B3I, and B1I/B3I, which is slightly higher than that obtained from the precise products. This was expected, as carrier phase observations are used in the precise orbit determination, and the DCB products are not affected by errors from the broadcast ephemeris and troposphere [4,5].
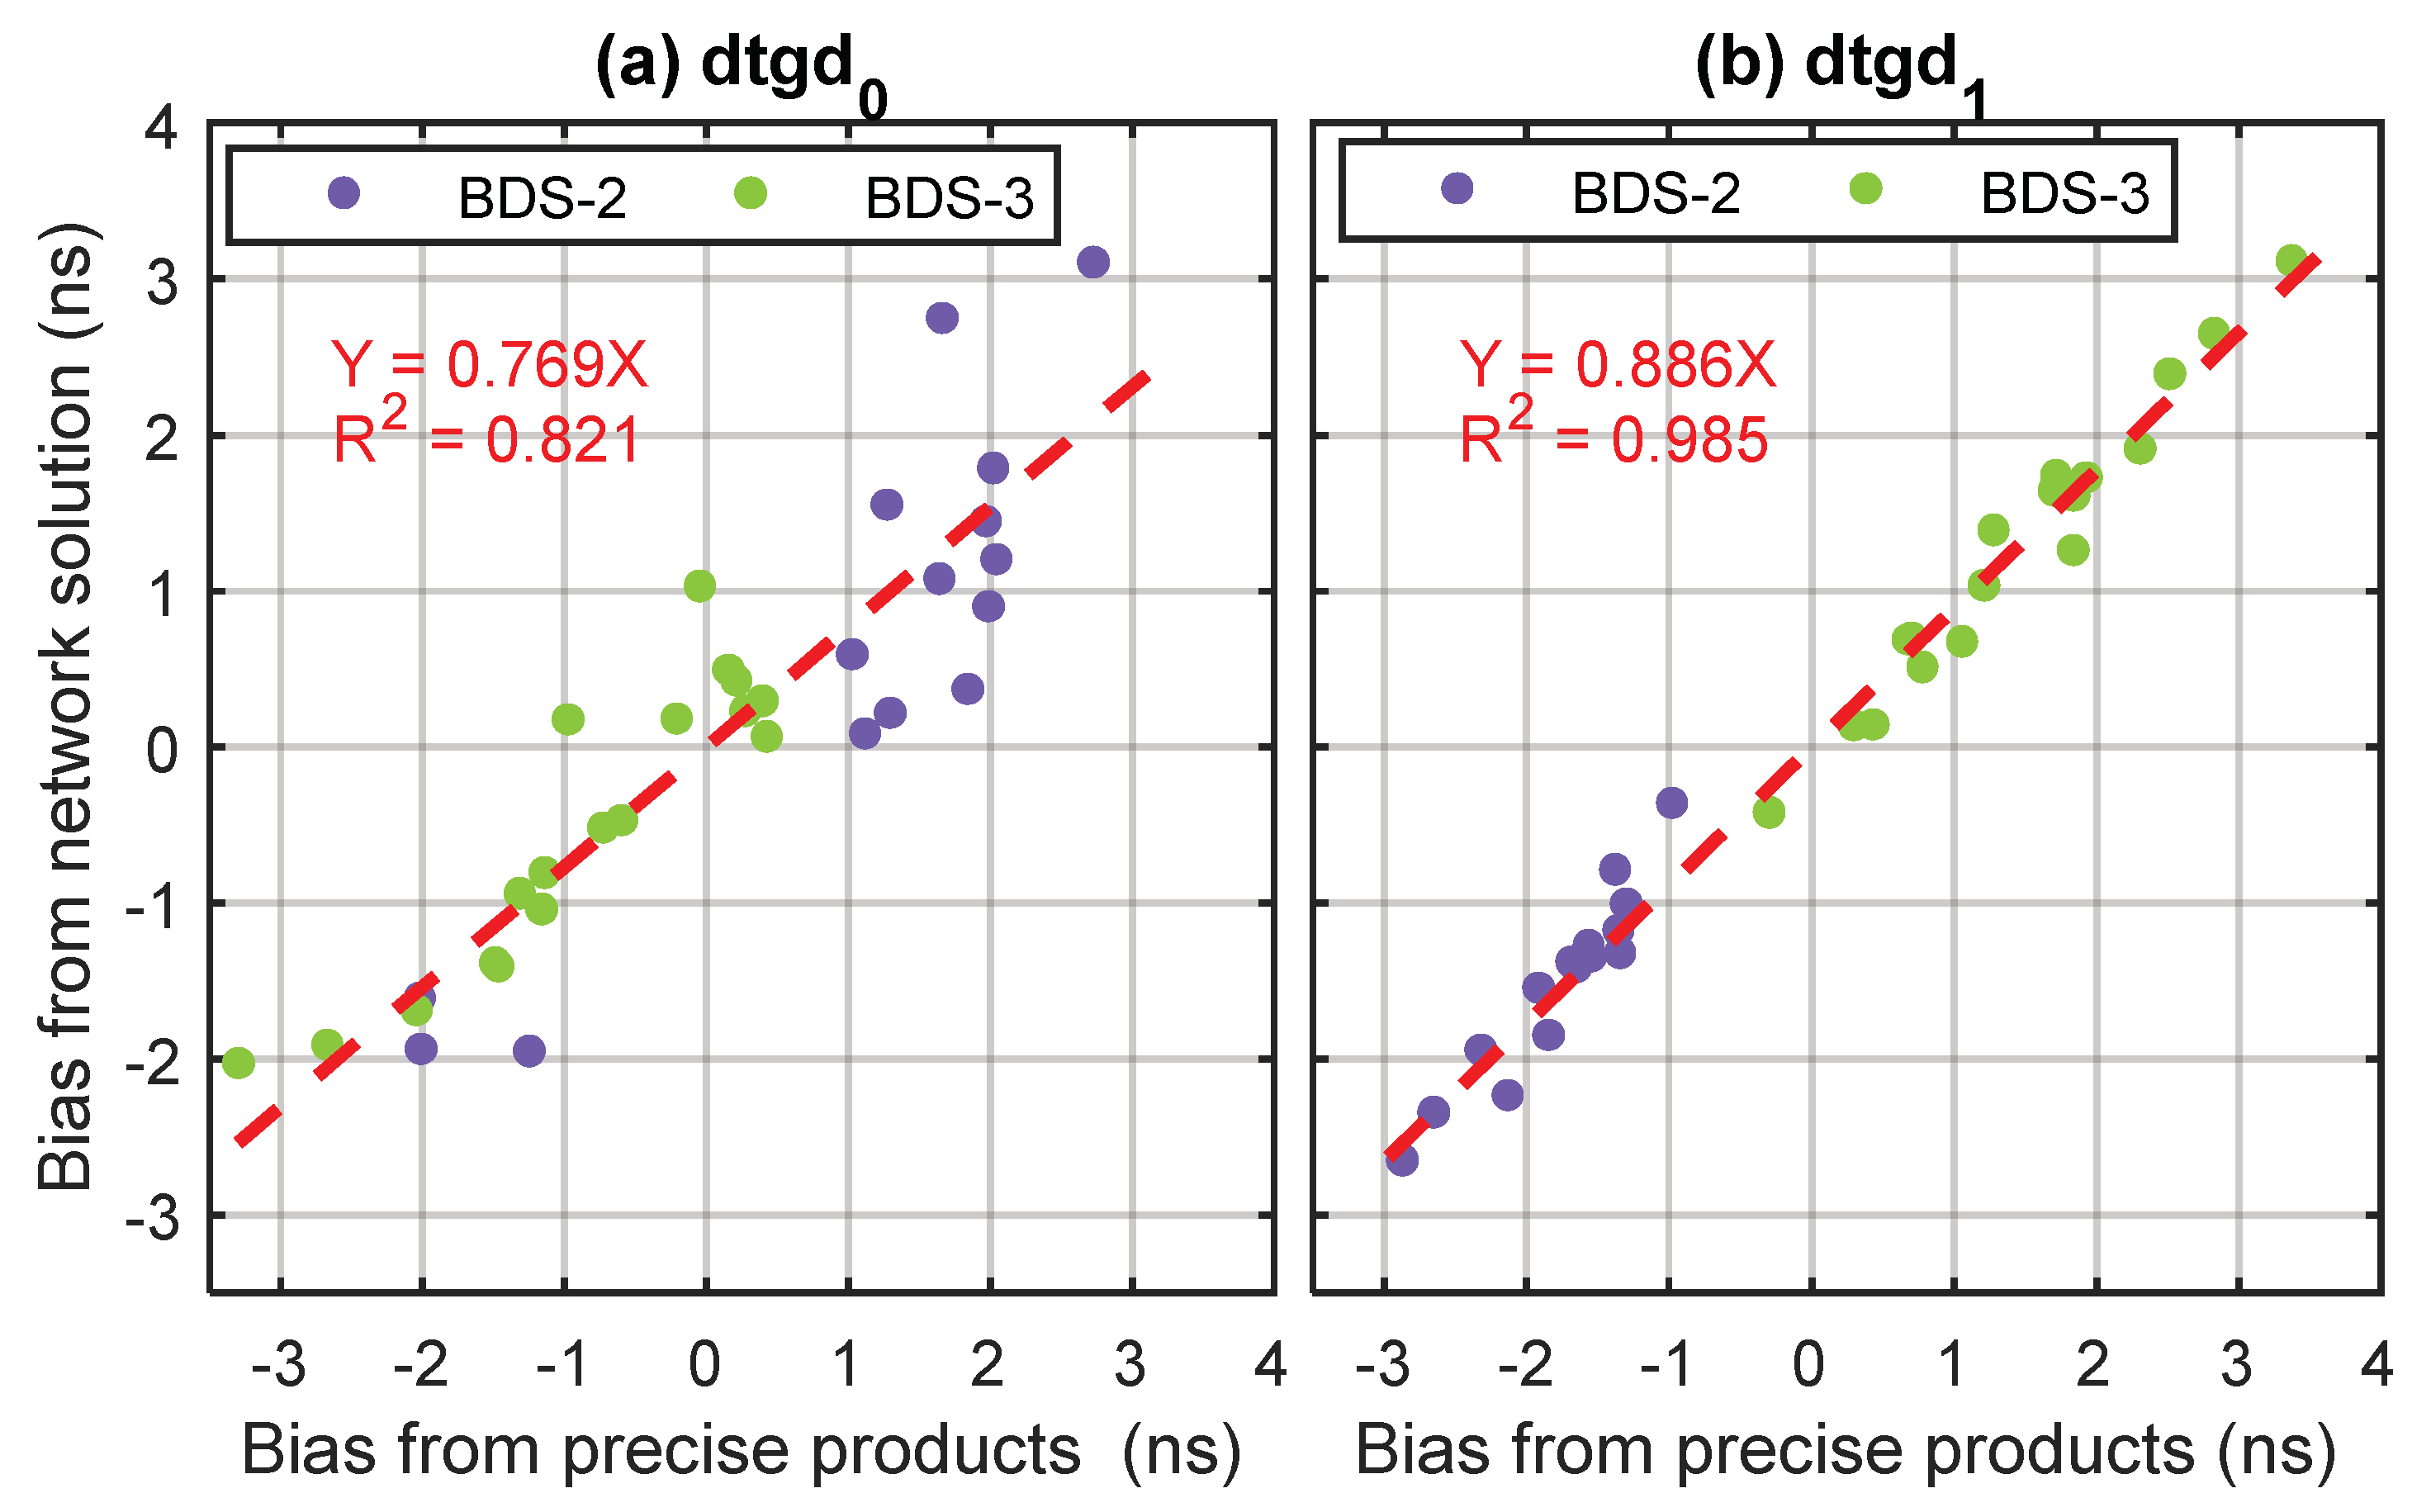
Similarly, dtgd0 and dtgd1 for each satellite can be determined based on Equation (5). The calibrated TGD biases are listed in Table 5, in which we can see that the biases are slightly different from the results obtained from precise products. For a better comparison of the two methods, Table 6 compares the difference and Figure 6 gives the relationship of the TGD bias from precise products and the network solution. It is shown that the two sets of the TGD bias have a linear correlation with the coefficients of 0.821 and 0.985. Most of the absolute values are within 1 ns, especially for dtgd1. However, as the slope of the linear fitting function is not close to 1.0, the absolute values of the two methods do not match perfectly. This may be a result of the difference between the receivers and processing strategy of the two methods. Additionally, it was shown that, compared with dtgd0, the systematic bias of dtgd1 between BDS-2 and BDS-3 is more significant and the dtgd1 of BDS-3 is more scattered compared with that of BDS-2, which was also proven in the method using the precise products.
4. Impact of the Timing Group Delay Bias
The existence of the TGD bias is proven for BDS satellites. In this section, the impact of the TGD bias is assessed from the standpoints of the SISRE and SPP. For a comprehensive assessment, four schemes are applied:
- (1)
- Scheme 1 (S1): Normal satellite TGD correction.
- (2)
- Scheme 2 (S2): Use of the satellite-dependent TGD bias calibrated from precise products.
- (3)
- Scheme 3 (S3): Use of the TGD bias between BDS-2 and BDS-3 calibrated from precise products.
- (4)
- Scheme 4 (S4): Use of the satellite-dependent TGD bias calibrated from network solution.
When correcting the TGD bias, we substitute dtgd0 and dtgd1 into the satellite clock and TGD1 respectively:
where is the new satellite clock after dtgd0 correction for the code observation, and is the new TGD1 after dtgd1 correction.
4.1. Signal-In-Space Range Error Assessment
The algorithm used for SISRE assessment was introduced in Section 2. To assess the SISRE performance with the current BDS constellation, the half-year data from DOY 001−180 in 2019 was used. During the SISRE assessment, the data sampling was set at 15 min, and the threshold of gross outlier rejection was set at 10 m.
Table 7 summarizes the overall SISRE performance from Schemes 1−4 at B1I, B3I, and B1I/B3I. From the comparison, it can be concluded that:
- (1)
- (2)
- Significant SISRE improvement can be observed after the TGD bias correction. Among the three correction schemes, the satellite-dependent TGD bias calibrated from precise products shows the best improvement, with an overall SISRE improvement from 0.71, 0.81, and 1.40 m to 0.64, 0.66, and 0.64 m at B1I, B3I, and B1I/B3I frequencies, whereas the improvement of the TGD bias from the network solution is slightly lower. This is due to the fact that the TGD bias from the precise product directly removes the systematic bias of each satellite during SISRE assessment. For the TGD bias only considering the systematic bias between BDS-2 and BDS-3, although a noticeable improvement can also be observed, it is still not comparable with the satellite-dependent TGD bias correction, especially at the B1I/B3I frequency. This is a result of the amplification of the TGD error after the ionosphere-free combination.
- (3)
- For Scheme 2, the SISRE performance at each frequency is similar, which indicates that after the TGD bias correction, the accuracy of the TGD is close to that of the DCB. It is promising to see that the SISRE of BDS-3 is within 0.5 m, which agrees with the results presented by Yang et al. [14] and fulfills the target of SISRE accuracy standard of the BDS [22].
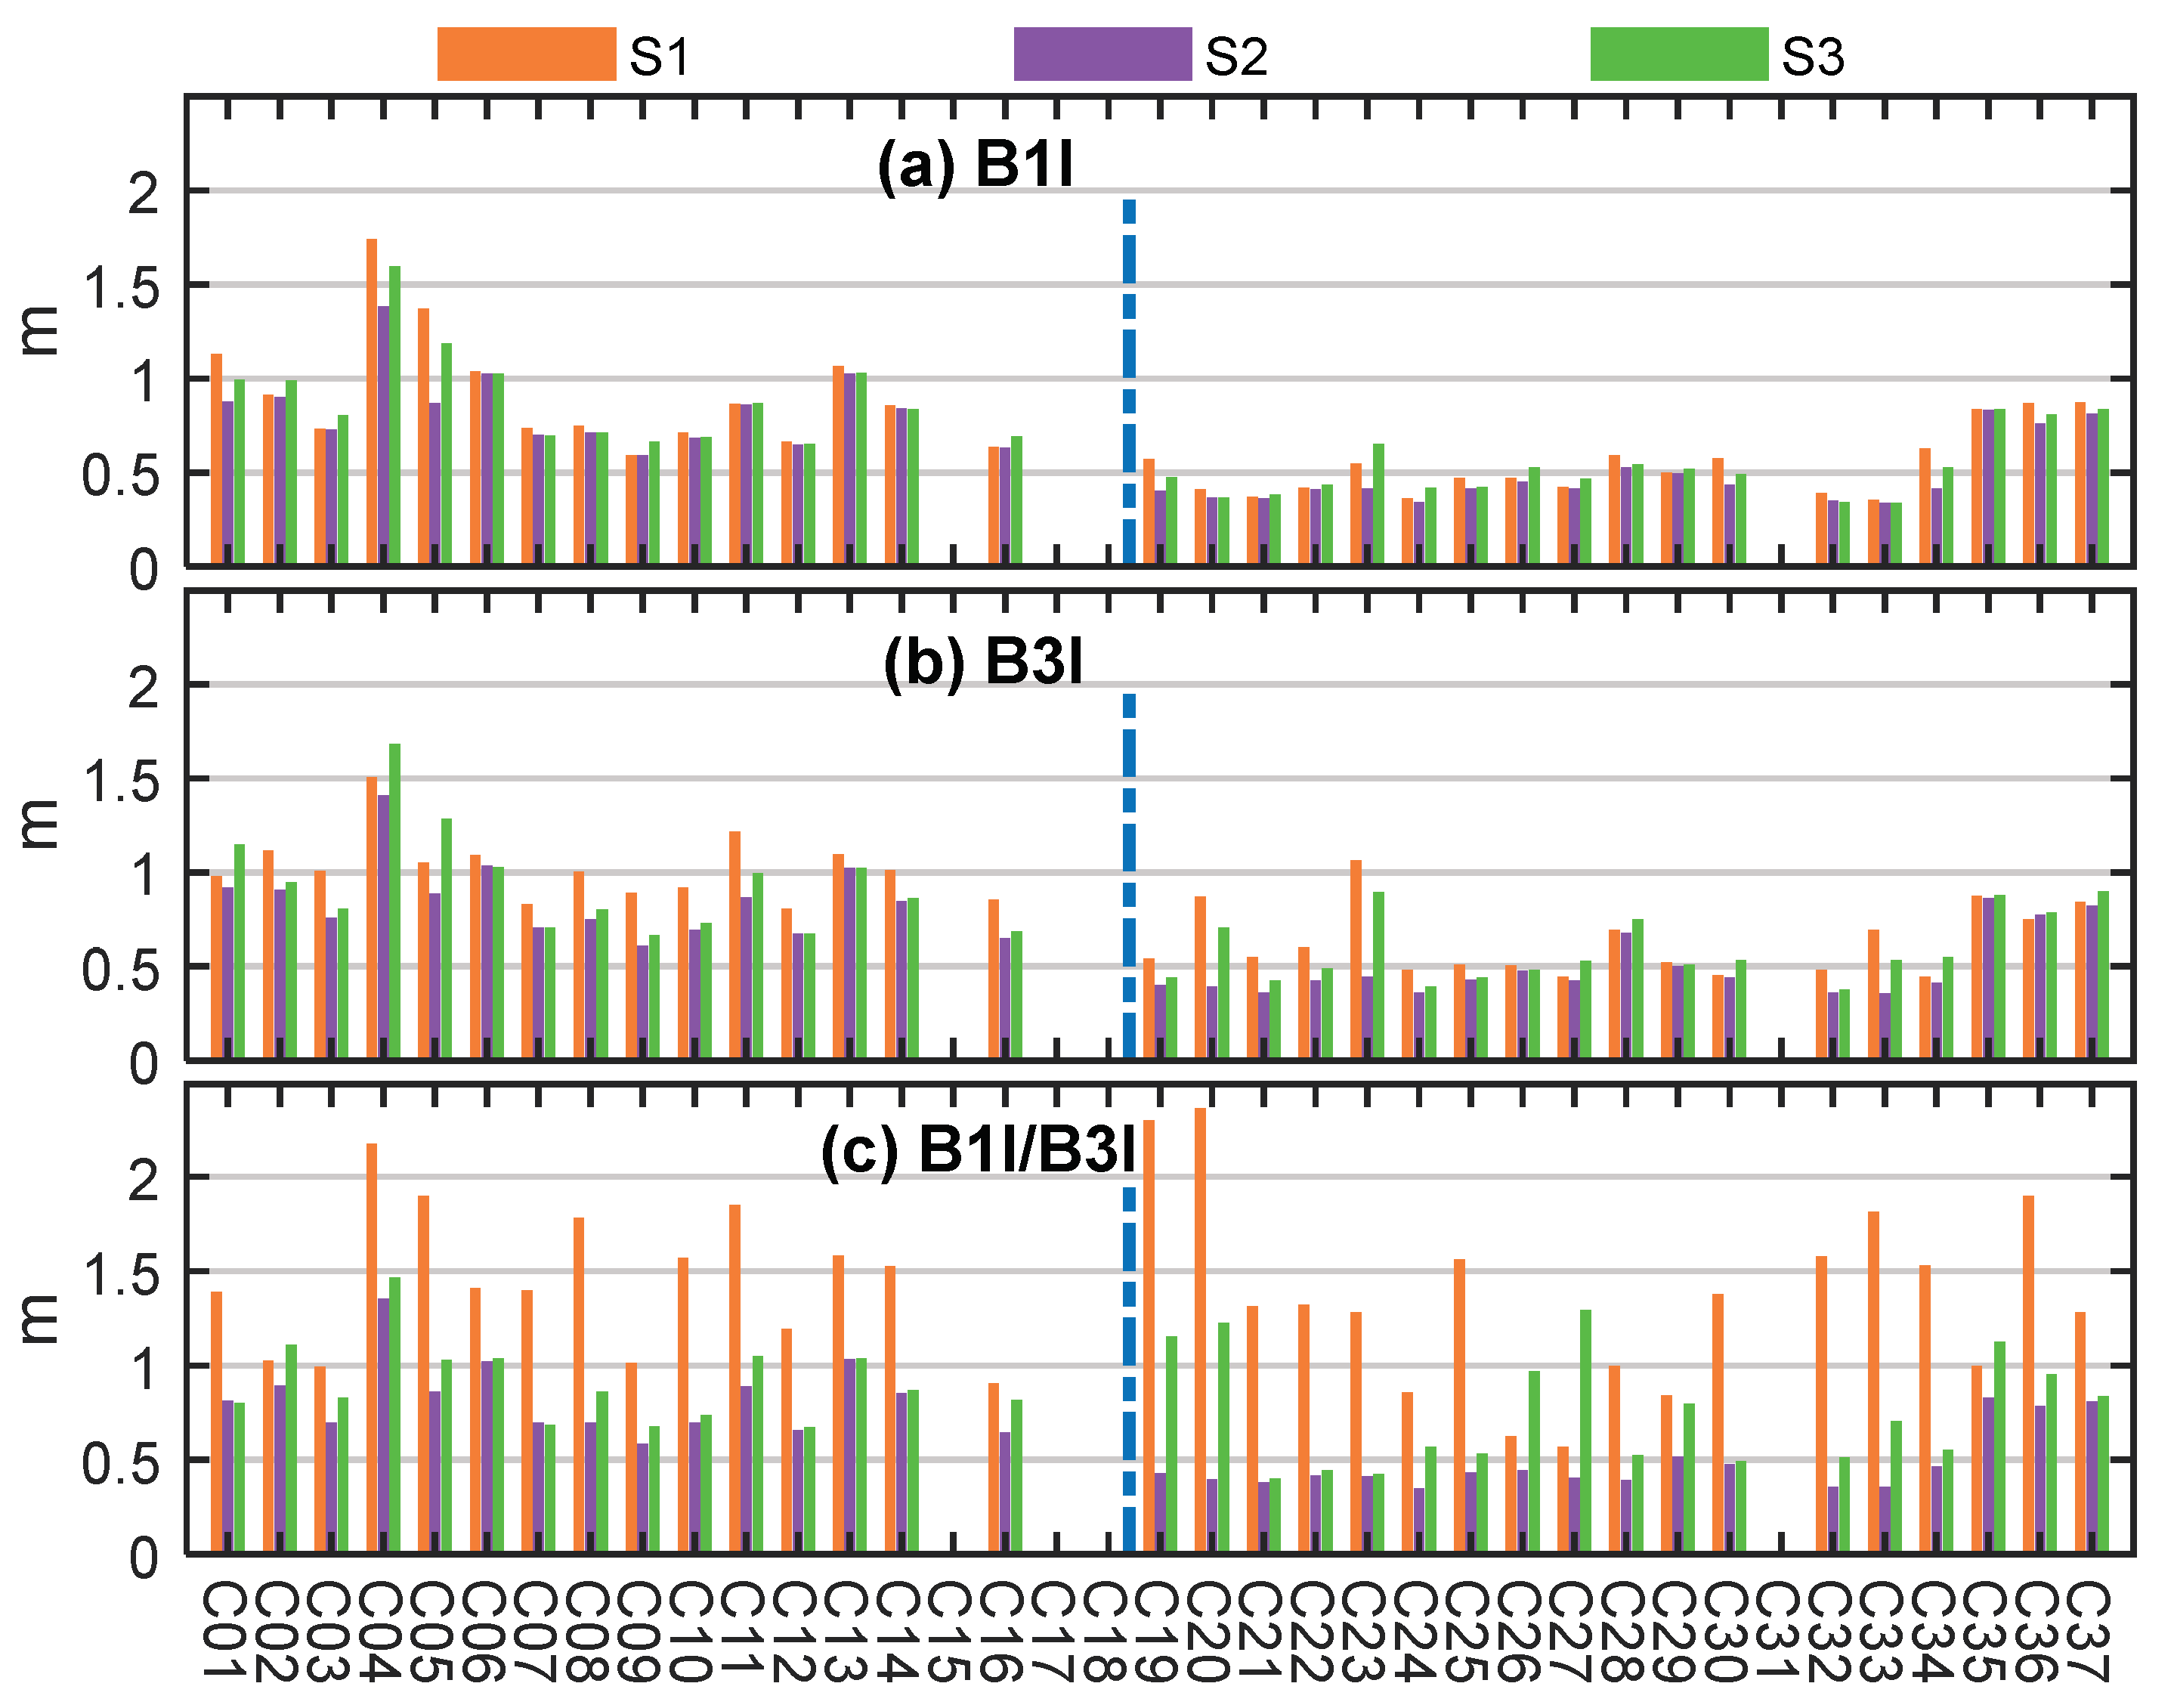
For a detailed observation of the SISRE improvement for each satellite after TGD bias correction, Figure 7 depicts the 6-month SISRE result of each BDS satellite at B1I, B3I, and B1I/B3I from Schemes 1–3 . Note that as the overall performance of Scheme 4 is close to that of Scheme 2, it is not compared in Figure 7. From the comparison, it was found that after the satellite-dependent TGD bias correction, the SISRE for all satellites and all frequencies improved at a different level. If we only consider the TGD bias between BDS-2 and BDS-3, the SISRE for some satellites would become even larger. This proves that it is better to correct the TGD bias by each individual satellite. Meanwhile, we can see that, different from the discordant SISRE values of BDS-2 satellites, the SISRE of BDS-3 after the satellite-dependent TGD bias correction is at a more consistent level, except for that at C35–C37. This may be attributed to the fact that both Trimble and Septentrio receivers cannot track the B3I signal of C35–C37, which may lead to a lower accuracy of the precise product for these satellites.
4.2. Single Point Positioning
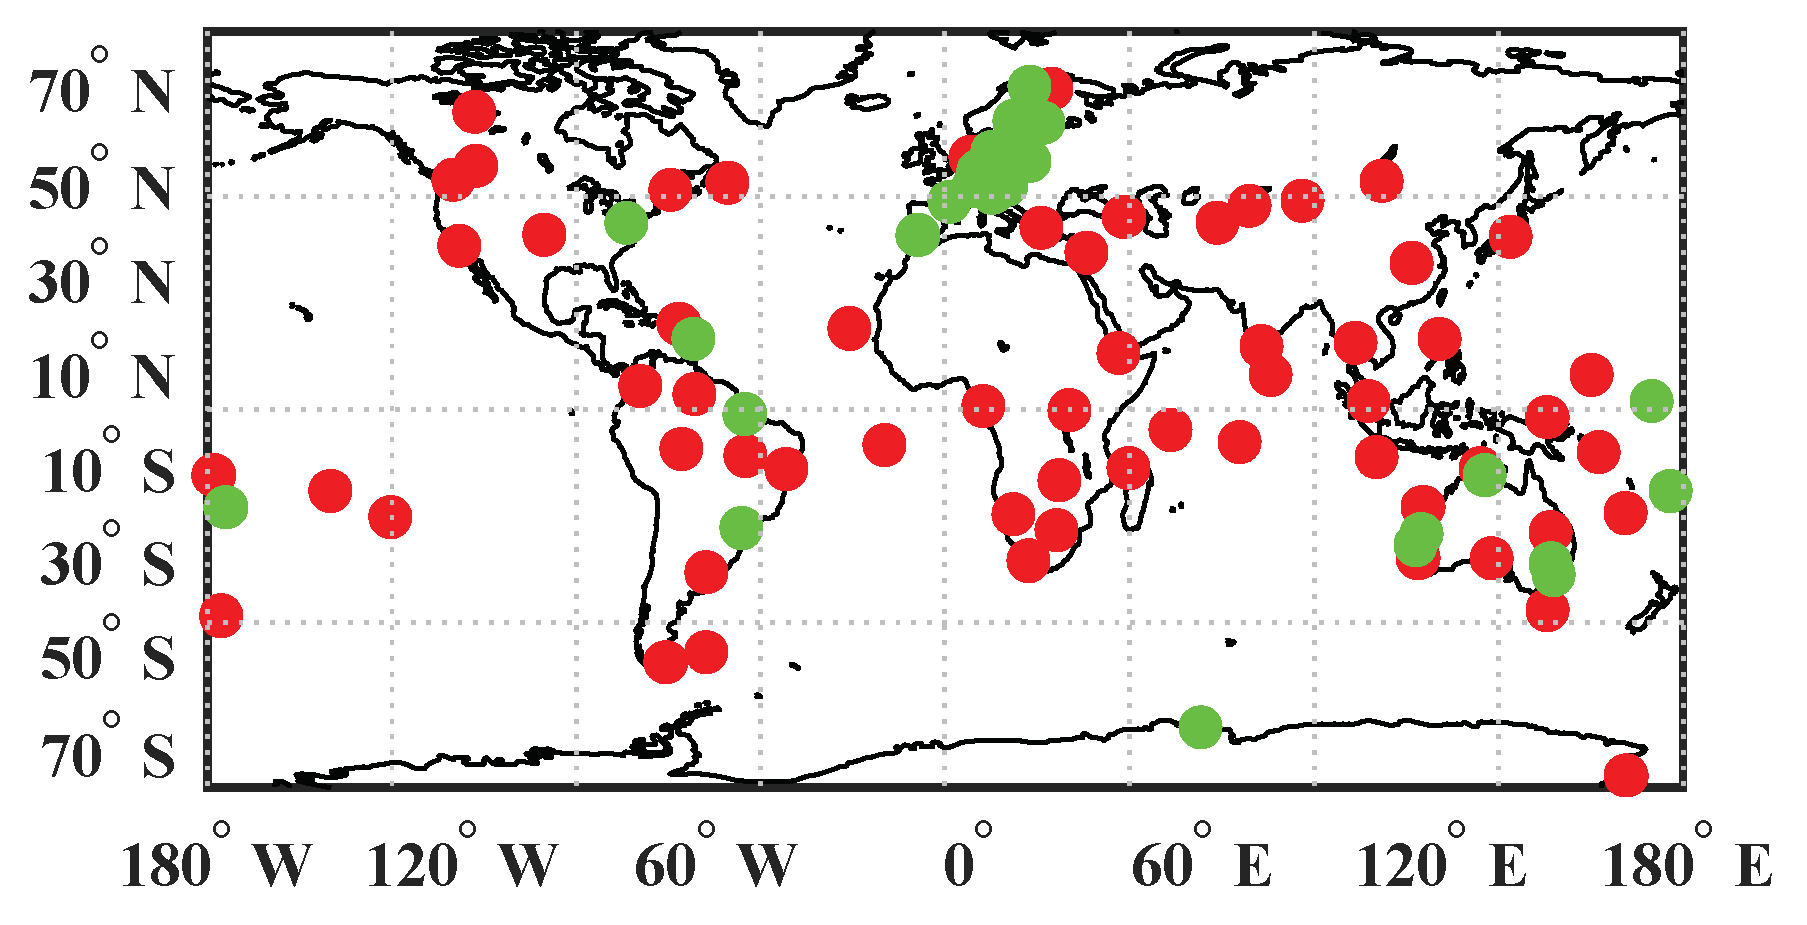
To assess the effect of the TGD bias on SPP, one-week data from DOY 134 to 140 at 97 MGEX stations were selected. In addition, for the independent assessment of the data, among the 97 stations, 33 of them were new stations, different from the stations used in the network solution. The distribution of the stations is depicted in Figure 8.
For the processing of SPP, the broadcast ephemeris was adopted. The troposphere delay is corrected by the GPT2w and VMF models [18]. The ionosphere delay is corrected by the BDS Klobuchar model [1] for single-frequency data or eliminated by the ionosphere-free combination for dual-frequency data. Therefore, the parameters to be estimated are the station coordinates and the receiver clock at each epoch. For the assessment of the SPP performance, the reference station coordinates were obtained from the IGS daily solutions.
Table 8 summarizes the statistical results of the three-dimensional (3D) positioning RMS for the four schemes at B1I, B3I, and B1I/B3I frequencies, along with the corresponding improvement of Schemes 2–4 in comparison with Scheme 1. We can draw the following conclusions from Table 8:
- (1)
- Among the results in the frequencies of B1I, B3I, and B1I/B3I, the SPP result at B1I/B3I exhibits the worst precision, which may due to the amplification of the observation noise and TGD errors after ionosphere-free combination. However, the SPP performance at B1I/B3I also improves to the maximum extent after TGD bias correction. For B1I or B3I frequencies, the improvement is not that significant.
- (2)
- Among the three schemes with TGD bias correction, the satellite-dependent TGD bias from precise products shows the best improvements of 5.6%, 8.4%, and 21.6% at B1I, B3I, and B1I/B3I frequencies. The satellite-dependent TGD bias correction from the network solution is at a similar level. Therefore, it is not recommended to only consider the TGD bias between BDS-2 and BDS-3.
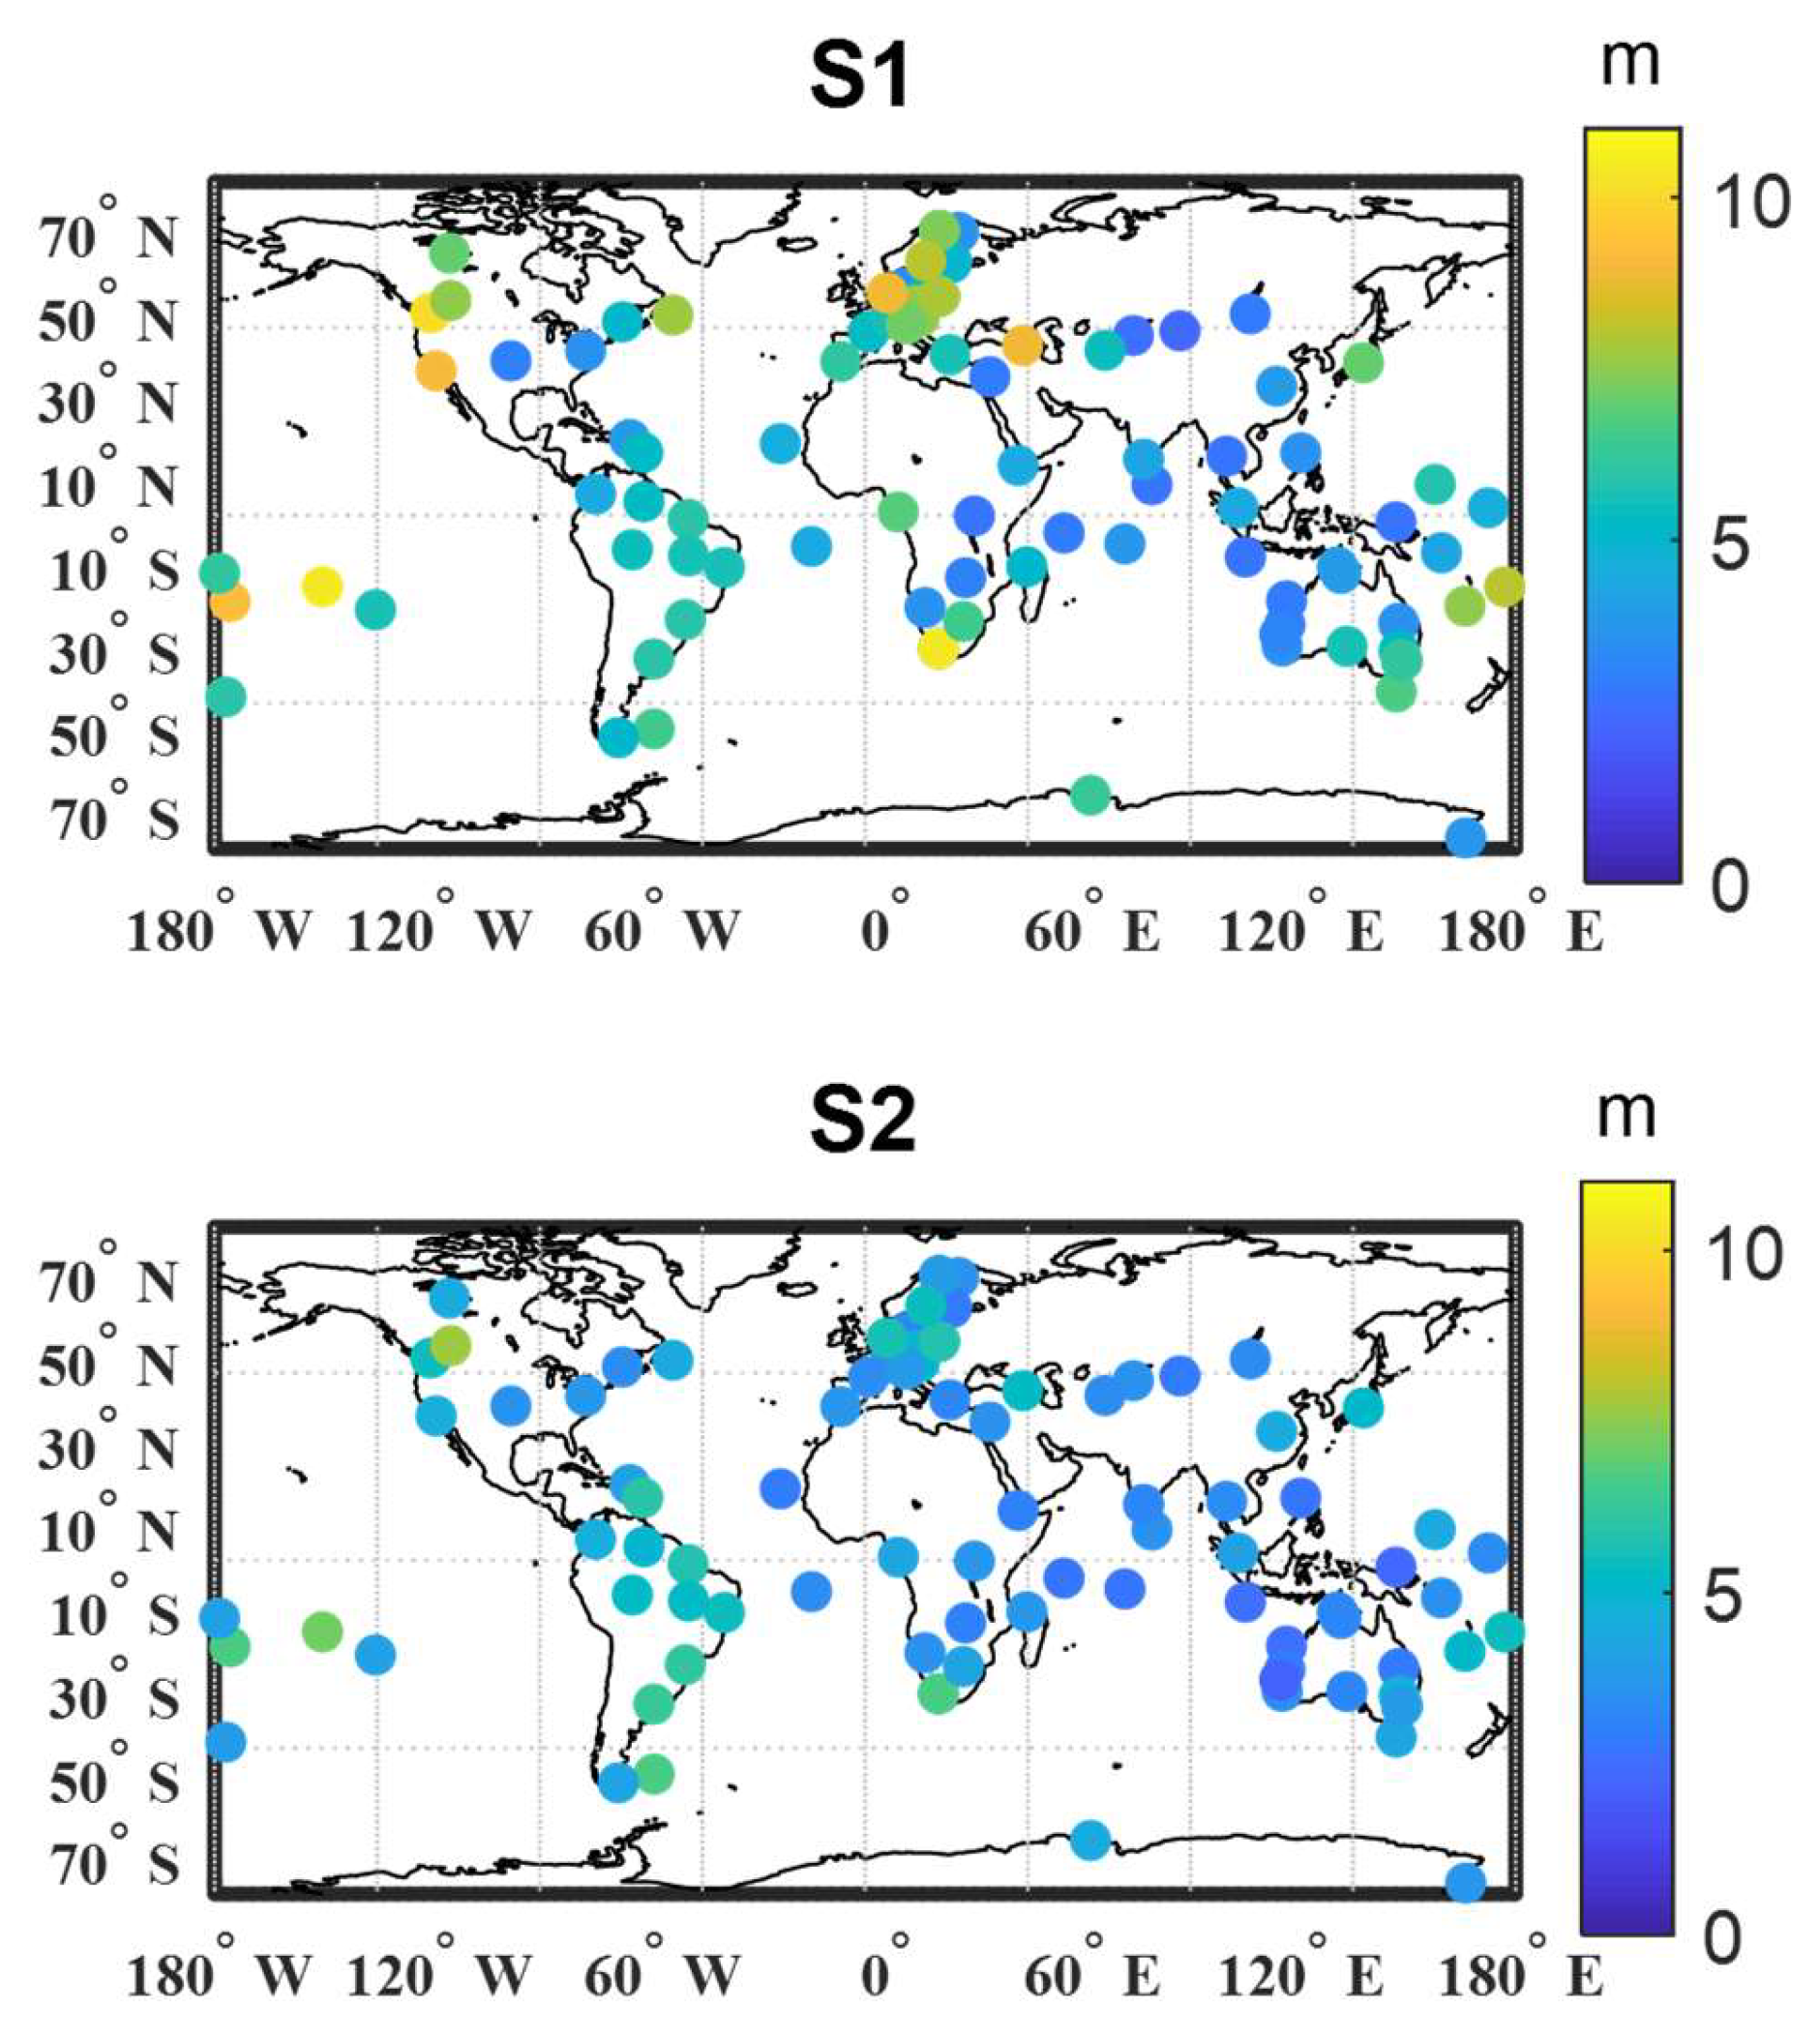
For a spatial observation of the impact of the satellite-dependent TGD bias in SPP, the station-dependent SPP results comparing Schemes 1 and 2 at the B1I/B3I frequency are shown in Figure 9. We can clearly see that positioning improvement outside the East Asia region is more evident. One reason for this phenomenon is that with the decrease of visible satellites [15], the contribution of the TGD bias correction becomes more significant. The other reason may due to the more scattered TGD bias of BDS-3 satellites, as indicated in Figure 6.
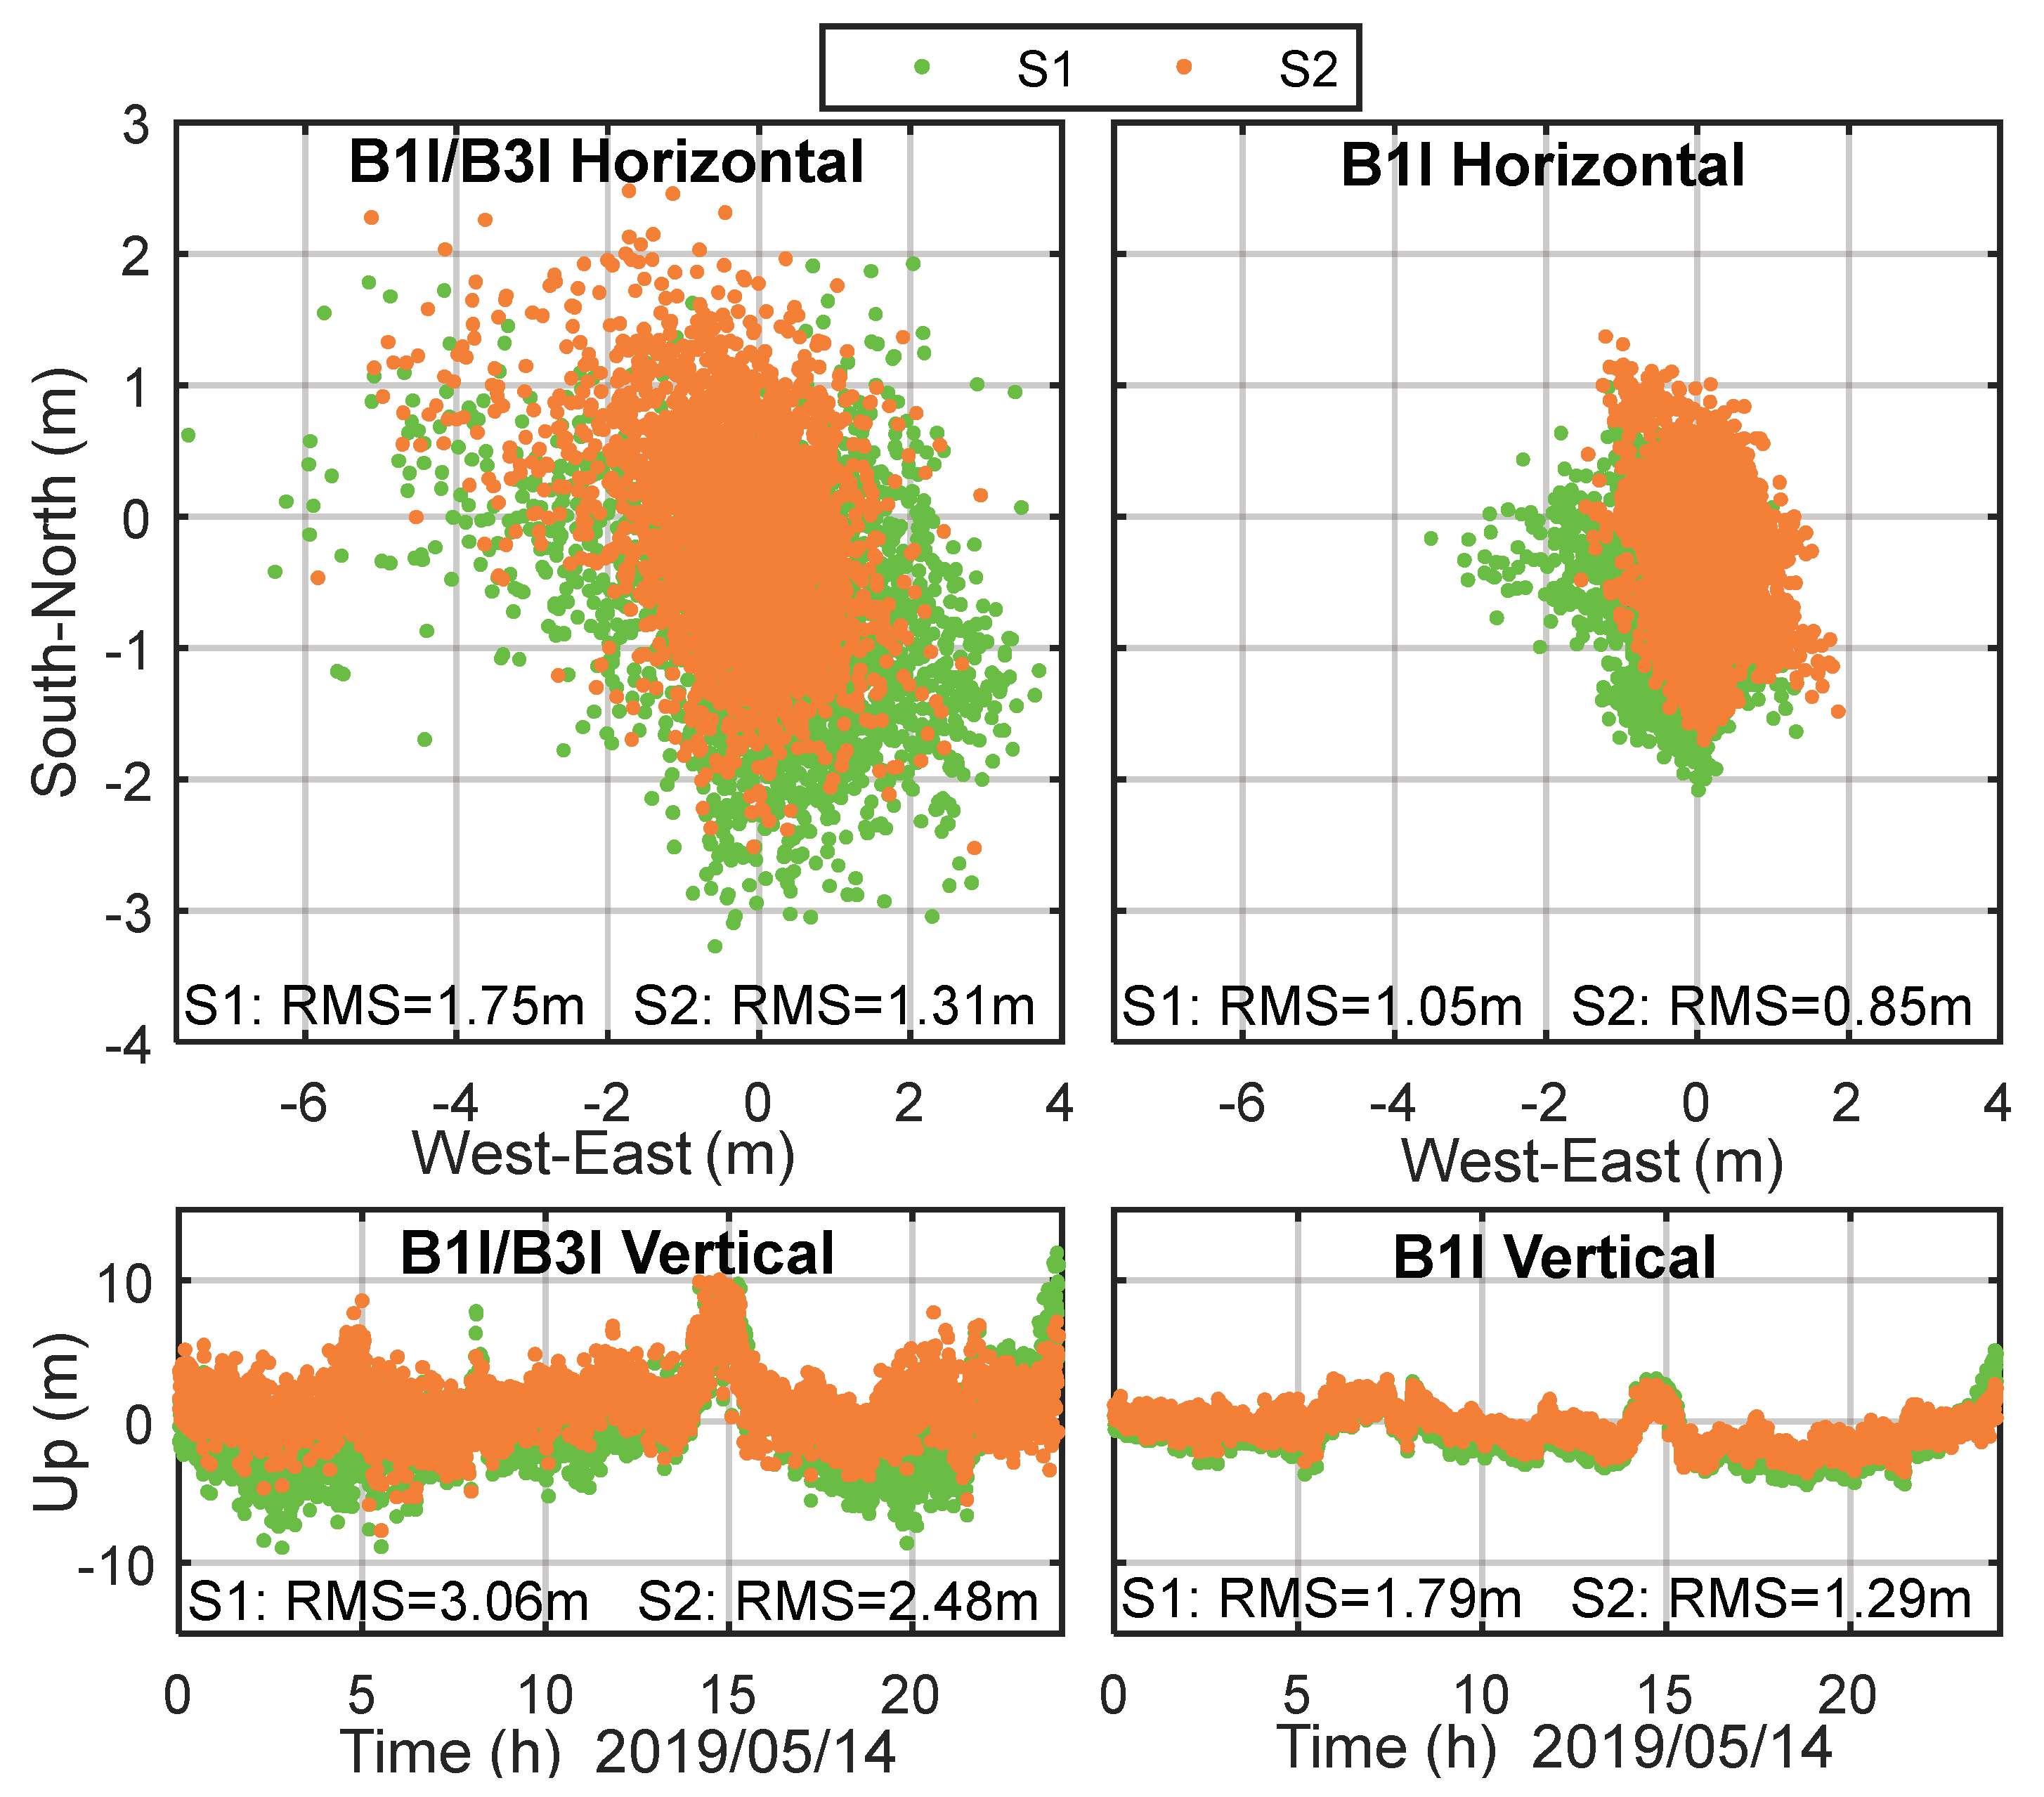
Furthermore, for a more specific observation of the contribution of the satellite-dependent TGD bias correction, we took one of the stations, MCHL (Mitchell, 26.36°S, 148.15°E), as an example. Figure 10 compares the horizontal and vertical positioning error of SPP at B1I and B1I/B3I frequencies, comparing Schemes 1 and 2. As can be seen, the positioning error was less scattered after TGD bias correction, with a decrease from 1.75 to 1.31 m in the horizontal and from 3.06 to 2.48 m in the vertical for B1I/B3I. Similar improvements can also be found for B1I.
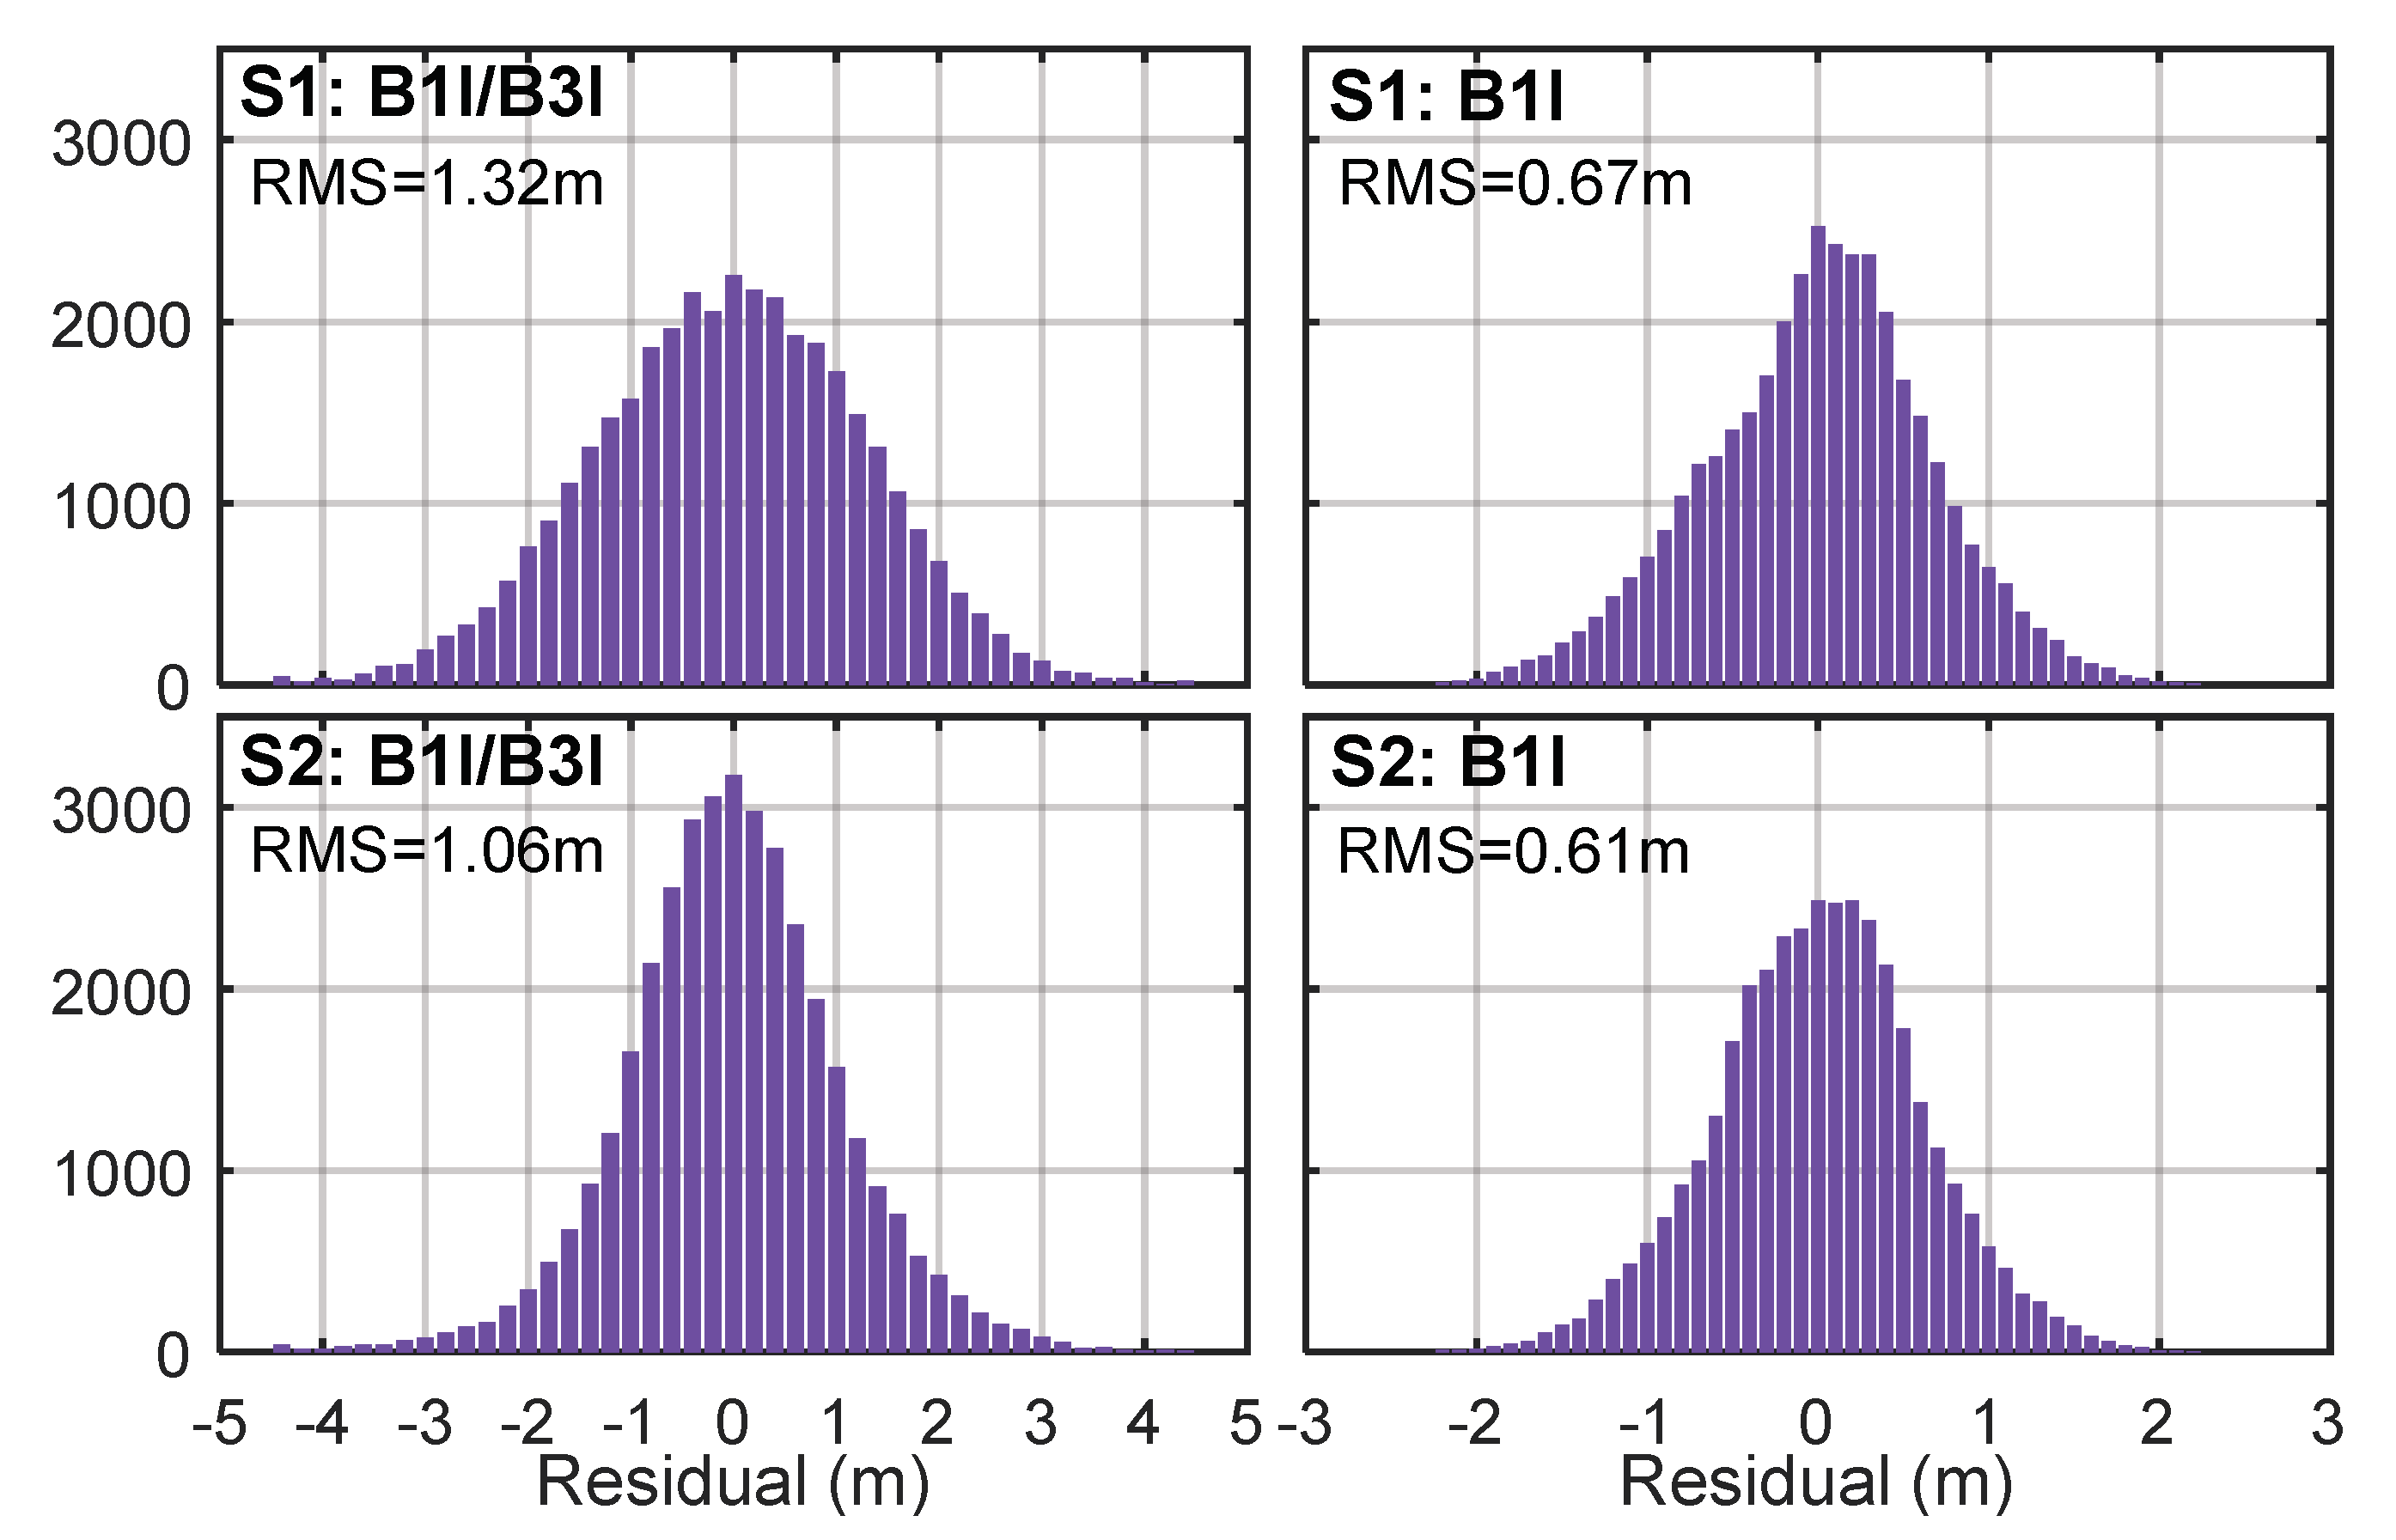
As pointed out by Guo et al. [13] and Chen et al. [23], the unmodeled bias will be absorbed by the other parameters and positioning residuals. The satellite-dependent TGD bias will also affect the clock parameter and post-fit observation residuals in SPP. Figure 11 plots the histogram distribution of the corresponding SPP residuals at MCHL. It is shown that when the TGD bias is corrected, the distribution of the post-fit residuals is more centered at zero and the overall RMS of the residuals decreases from 1.32 and 0.67 m to 1.06 and 0.61 m for B1I/B3I and B1I, respectively.
5. Conclusions and Discussions
Unlike relative positioning, single point positioning needs to take all involved errors into account, among which the timing group delay or differential code bias cannot be ignored. For newly launched satellites such as the BDS, the precision and bias in the timing group delay and differential code bias need to be comprehensively investigated. In this contribution, we found the satellite-dependent timing group delay bias in the BDS broadcast ephemeris by comparing the BDS timing group delay with the differential code bias provided by the DLR. It was shown that the timing group delay bias is not only dispersed by BDS-2 and BDS-3, but also by each individual satellite. Meanwhile, our analysis results show that besides the TGD1 bias, there also exists a bias at the B3I frequency. The bias may come from the receivers adopted at the BDS monitoring stations, which are different from the commercial receivers at multi-GNSS experiment stations. Moreover, the different timing group delay update epoch of BDS-2 and BDS-3 also implies that the timing group delays of BDS-2 and BDS-3 satellites are determined independently in the BDS control segment, which may also result in the systematic timing group delay bias between BDS-2 and BDS-3.
To further calibrate the timing group delay bias, we proposed a network solution strategy based on raw observations from 87 multi-GNSS experiment stations. The results show that the two sets of the timing group delay bias exhibit good agreement with correlation coefficients of 0.821 and 0.985. The calibrated timing group delay bias also indicates that the timing group delay bias of BDS-3 is more dispersed than that of BDS-2.
For the validation of the calibrated timing group delay bias, we corrected the calibrated biases in the timing group delay for signal-in-space range error assessment and SPP. It was shown that the BDS signal-in-space range error improved from 0.71, 0.81, and 1.40 m to 0.64, 0.66, and 0.64 m at B1I, B3I, and B1I/B3I frequencies, and the corresponding SPP performance improved by 5.6%, 8.4%, and 21.6%, respectively. This indicates that after the satellite-dependent timing group delay bias correction, the accuracy of the BDS is comparable with that of the timing group delay. Meanwhile, although a significant systematic bias is observed between BDS-2 and BDS-3, it is recommended to correct the timing group delay bias by individual satellite.
It should be pointed out that as the timing group delay bias results from the different receivers and the strategy employed at the BDS control segment, the timing group delay bias needs to be monitored continuously. Besides, considering the fact that a code bias always exists among different receivers, the timing group delay or differential code bias should be calibrated after receiver classification in the future.
Author Contributions
H.W. conceived the research framework; Y.Z. analyzed the data wrote the manuscript, J.C. and E.W. reviewed and revised the manuscript; J.C. acquires the funding; A.W. and L.M. collected the data and analyzed part of the data. All authors have read and agreed to the published version of the manuscript.
Funding
This work is mainly funded by the National Natural Science Foundation of China (No. 41874042, No. 11673050 and No. 61571309).
Acknowledgments
We thank the GNSS observation data and products provided by MGEX.
Conflicts of Interest
The authors declare no conflict of interest.
References
- China Satellite Navigation Office. BeiDou Navigation Satellite System Signal in Space Interface Control Document Open Service Signal B3I (Version 1.0). Available online: http://www.beidou.gov.cn/xt/gfxz/201805/P020180507527106075323.pdf (accessed on 24 November 2019).
- China Satellite Navigation Office. Development of the BeiDou Navigation Satellite System (Version 3.0). Available online: http://www.beidou.gov.cn/xt/gfxz/201812/P020190117356387956569.pdf (accessed on 24 November 2019).
- Xing, N.; Wu, X.; Hu, X.; Su, R. Secular changes in differential code bias of COMPASS system. In Proceedings of the China Satellite Navigation Conference (CSNC 2012), Guangzhou, China, 15–19 May 2012; Springer: Berlin/Heidelberg, Germany, 2012; pp. 243–251. [Google Scholar]
- Wang, N.; Yuan, Y.; Li, Z.; Montenbruck, O.; Tan, B. Determination of differential code biases with multi-GNSS observations. J. Geod. 2016, 90, 209–228. [Google Scholar] [CrossRef]
- Montenbruck, O.; Hauschild, A.; Steigenberger, P. Differential code bias estimation using multi-GNSS observations and global ionosphere maps. Navigation 2014, 61, 191–201. [Google Scholar] [CrossRef]
- Hauschild, A.; Montenbruck, O. A study on the dependency of GNSS pseudorange biases on correlator spacing. GPS Solut. 2016, 20, 159–171. [Google Scholar] [CrossRef]
- Tan, S. GNSS Systems and Engineering: The Chinese Beidou Navigation and Position Location Satellite; John Wiley & Sons: Hoboken, NJ, USA, 2018; pp. 207–208. [Google Scholar]
- Wang, B.; Chen, J.; Wang, B.; Zhou, J. Signal-in-space Accuracy Analysis for BDS in 2016–2017. In Proceedings of the IGS Workshop 2018, Wuhan, China, 29 October–2 November 2018. [Google Scholar]
- Wang, N.; Li, Z.; Montenbruck, O.; Tang, C. Quality assessment of GPS, Galileo and BeiDou-2/3 satellite broadcast group delays. Adv. Space Res. 2019, 64, 1764–1779. [Google Scholar] [CrossRef]
- Lv, Y.; Geng, T.; Zhao, Q.; Xie, X.; Zhou, R. Initial assessment of BDS-3 preliminary system signal-in-space range error. GPS Solut. 2020, 24, 16. [Google Scholar] [CrossRef]
- Montenbruck, O.; Steigenberger, P.; Hauschild, A. Multi-GNSS signal-in-space range error assessment–Methodology and results. Adv. Space Res. 2018, 61, 3020–3038. [Google Scholar] [CrossRef]
- Montenbruck, O.; Steigenberger, P.; Hauschild, A. Broadcast versus precise ephemerides: A multi-GNSS perspective. GPS Solut. 2015, 19, 321–333. [Google Scholar] [CrossRef]
- Guo, F.; Zhang, X.; Wang, J. Timing group delay and differential code bias corrections for BeiDou positioning. J. Geod. 2015, 89, 427–445. [Google Scholar] [CrossRef]
- Yang, Y.; Gao, W.; Guo, S.; Mao, Y.; Yang, Y. Introduction to BeiDou-3 navigation satellite system. Navigation 2019, 66, 7–18. [Google Scholar] [CrossRef] [Green Version]
- Zhang, Y.; Kubo, N.; Chen, J.; Wang, J.; Wang, H. Initial Positioning Assessment of BDS New Satellites and New Signals. Remote Sens. 2019, 11, 1320. [Google Scholar] [CrossRef] [Green Version]
- Wang, C.; Zhao, Q.; Guo, J.; Liu, J.; Chen, G. The contribution of intersatellite links to BDS-3 orbit determination: Model refinement and comparisons. Navigation 2019, 66, 71–82. [Google Scholar] [CrossRef] [Green Version]
- Ge, Y.; Zhou, F.; Sun, B.; Wang, S.; Shi, B. The Impact of Satellite Time Group Delay and Inter-Frequency Differential Code Bias Corrections on Multi-GNSS Combined Positioning. Sensors 2017, 17, 602. [Google Scholar] [CrossRef] [PubMed]
- Böhm, J.; Möller, G.; Schindelegger, M.; Pain, G.; Weber, R. Development of an improved empirical model for slant delays in the troposphere (GPT2w). GPS Solut. 2015, 19, 433–441. [Google Scholar] [CrossRef] [Green Version]
- Schaer, S.; Gurtner, W.; Feltens, J. IONEX: The Ionosphere Map Exchange Format Version 1. Available online: ftp://igs.org/pub/data/format/ionex1.pdf (accessed on 24 November 2019).
- Wu, Z.; Zhou, S.; Hu, X.; Liu, L.; Shuai, T.; Xie, Y.; Chang, Z. Performance of the BDS3 experimental satellite passive hydrogen maser. GPS Solut. 2018, 22, 43. [Google Scholar] [CrossRef]
- Tang, C.; Hu, X.; Zhou, S.; Liu, L.; Pan, J.; Chen, L.; He, F. Initial results of centralized autonomous orbit determination of the new-generation BDS satellites with inter-satellite link measurements. J. Geod. 2018, 92, 1155–1169. [Google Scholar] [CrossRef]
- China Satellite Navigation Office. BeiDou Navigation Satellite System Open Service Performance Standard (Version 2.0). Available online: http://www.beidou.gov.cn/xt/gfxz/201812/P020181227529449178798.pdf (accessed on 24 November 2019).
- Chen, J.; Zhang, Y.; Wang, J.; Yang, S.; Dong, D.; Wang, J.; Qu, W.; Wu, B. A simplified and unified model of multi-GNSS precise point positioning. Adv. Space Res. 2017, 55, 125–134. [Google Scholar] [CrossRef]
Figure 1.
TGD1 variation of BDS-2 (left), (C01–C16), and BDS-3 (right), (C19–C37), from Day of Year (DOY) 001 to 180 in 2019.
Figure 1.
TGD1 variation of BDS-2 (left), (C01–C16), and BDS-3 (right), (C19–C37), from Day of Year (DOY) 001 to 180 in 2019.

Figure 2.
TGD1 and DCBB1I/B3I difference for BDS-2 (left), (C01–C16), and BDS-3 (right), (C19–C37), from Day of Year (DOY) 001 to 180 in 2019.
Figure 2.
TGD1 and DCBB1I/B3I difference for BDS-2 (left), (C01–C16), and BDS-3 (right), (C19–C37), from Day of Year (DOY) 001 to 180 in 2019.

Figure 3.
Averaged weekly bias at B1I (a), B3I (b), and B1I/B3I (c) frequencies. The error bar stands for the standard deviation of the bias from GPS weeks 2035–2059. The BDS-2 and BDS-3 satellites are separated by the dashed line.
Figure 3.
Averaged weekly bias at B1I (a), B3I (b), and B1I/B3I (c) frequencies. The error bar stands for the standard deviation of the bias from GPS weeks 2035–2059. The BDS-2 and BDS-3 satellites are separated by the dashed line.

Figure 4.
The 87 selected multi-GNSS experiment (MGEX) stations in the network solution.

Figure 5.
Estimated bias at B1I (a), B3I (b), and B1I/B3I (c) frequencies. The error bar stands for the standard deviation at each station. The BDS-2 and BDS-3 satellites are separated by the dashed line.
Figure 5.
Estimated bias at B1I (a), B3I (b), and B1I/B3I (c) frequencies. The error bar stands for the standard deviation at each station. The BDS-2 and BDS-3 satellites are separated by the dashed line.

Figure 6.
Relationship between the TGD bias from precise products and the network solution. The red dashed lines plot their relationship after linear fitting and R2 is the correlation coefficient. dtgd0 means the TGD bias at B3I frequency and dtgd1 is the residual TGD bias of TGD1. The average difference for all satellites was removed.

Figure 7.
The BDS SISRE at B1I (a), B3I (b), and B1I/B3I (c) frequencies for different schemes. The BDS-2 and BDS-3 satellites are separated by the dashed line.
Figure 7.
The BDS SISRE at B1I (a), B3I (b), and B1I/B3I (c) frequencies for different schemes. The BDS-2 and BDS-3 satellites are separated by the dashed line.

Figure 8.
Ninety-seven MGEX stations for single point positioning (SPP), including the same 64 stations (red dots) in the network solution and 33 new stations (green dots).
Figure 8.
Ninety-seven MGEX stations for single point positioning (SPP), including the same 64 stations (red dots) in the network solution and 33 new stations (green dots).

Figure 9.
RMS of 3D positioning error at the B1I/B3I frequency for Scheme 1 (top) and Scheme 2 (bottom).
Figure 9.
RMS of 3D positioning error at the B1I/B3I frequency for Scheme 1 (top) and Scheme 2 (bottom).

Figure 10.
Horizontal and vertical positioning error of B1I/B3I (left) and B1I (right) SPP at station MCHL (Mitchell, 26.36°S, 148.15°E).
Figure 10.
Horizontal and vertical positioning error of B1I/B3I (left) and B1I (right) SPP at station MCHL (Mitchell, 26.36°S, 148.15°E).

Figure 11.
SPP residuals of B1I/B3I (left) and B1I (right) SPP at station MCHL (Mitchell, 26.36°S, 148.15°E).
Figure 11.
SPP residuals of B1I/B3I (left) and B1I (right) SPP at station MCHL (Mitchell, 26.36°S, 148.15°E).


Table 1.
Open signals of GPS, Galileo, and BeiDou navigation satellite system (BDS).
| System | Frequency (MHz) | |||||||
|---|---|---|---|---|---|---|---|---|
| 1575.42 | 1561.098 | 1227.60 | 1176.45 | 1207.14 | 1191.795 | 1268.52 | 1278.75 | |
| GPS | L1 | L2 | L5 | |||||
| Galileo | E1 | E5a | E5b | E5 | E6 | |||
| BDS-2 | B1I | B2I | B3I | |||||
| BDS-3 | B1c | B1I | B2a | B2b | B3I | |||
Table 2.
Calibrated BDS TGD bias from precise products (in ns). dtgd0 means the TGD bias at B3I frequency and dtgd1 is the residual TGD bias of TGD1.
Table 2.
Calibrated BDS TGD bias from precise products (in ns). dtgd0 means the TGD bias at B3I frequency and dtgd1 is the residual TGD bias of TGD1.
| PRN | dtgd0 | dtgd1 | PRN | dtgd0 | dtgd1 | PRN | dtgd0 | dtgd1 |
|---|---|---|---|---|---|---|---|---|
| 1 | −1.24 | −0.97 | 12 | 2.74 | −2.86 | 26 | −0.72 | 0.44 |
| 2 | 1.98 | −1.29 | 13 | 1.28 | −1.64 | 27 | 0.22 | −0.29 |
| 3 | 2.03 | −1.55 | 14 | 1.67 | −2.12 | 28 | 0.28 | 0.69 |
| 4 | −2.00 | −1.37 | 16 | 1.65 | −1.33 | 29 | −0.59 | 0.71 |
| 5 | −2.01 | −1.34 | 19 | −1.30 | 2.84 | 30 | 0.17 | 1.22 |
| 6 | 1.04 | −1.53 | 20 | −2.66 | 3.39 | 32 | −1.15 | 1.94 |
| 7 | 1.30 | −1.90 | 21 | −1.45 | 1.73 | 33 | −2.03 | 2.53 |
| 8 | 2.05 | −2.64 | 22 | −1.48 | 1.71 | 34 | 0.40 | 1.29 |
| 9 | 2.00 | −1.67 | 23 | −3.29 | 2.32 | 35 | −0.04 | 0.31 |
| 10 | 1.85 | −2.31 | 24 | −1.13 | 1.07 | 36 | −0.20 | 1.85 |
| 11 | 1.13 | −1.84 | 25 | −0.96 | 1.85 | 37 | 0.43 | 0.79 |
Table 3.
TGD bias of BDS-2 and BDS-3 (in ns).
| Type | BDS-2 | BDS-3 | ||
|---|---|---|---|---|
| dtgd0 | dtgd1 | dtgd0 | dtgd1 | |
| Average | 1.03 | −1.76 | −0.86 | 1.47 |
| STD | 1.51 | 0.53 | 1.07 | 0.95 |
Table 4.
Receiver information of the selected MGEX stations.
| Receiver | Types or Version | Number | Note |
|---|---|---|---|
| Javad | TRE_3 TRE_3 DELTA | 22 | Track all BDS satellites |
| Trimble | ALLOY NETR9 | 32 | Cannot track C31–C37 |
| Septentrio | POLARX5TR POLARX5 | 33 | Cannot track B3I signal of C16, C23–C27, C29–C30, C35–C37 |
Table 5.
Calibrated BDS TGD bias from network solution (in ns). dtgd0 means the TGD bias at B3I frequency, and dtgd1 is the residual TGD bias of TGD1.
Table 5.
Calibrated BDS TGD bias from network solution (in ns). dtgd0 means the TGD bias at B3I frequency, and dtgd1 is the residual TGD bias of TGD1.
| PRN | dtgd0 | dtgd1 | PRN | dtgd0 | dtgd1 | PRN | dtgd0 | dtgd1 |
|---|---|---|---|---|---|---|---|---|
| 1 | −1.96 | −0.37 | 12 | 3.10 | −2.66 | 26 | −0.53 | 0.13 |
| 2 | 1.44 | −1.01 | 13 | 1.54 | −1.42 | 27 | 0.42 | −0.43 |
| 3 | 1.78 | −1.28 | 14 | 2.74 | −2.24 | 28 | 0.22 | 0.68 |
| 4 | −1.94 | −0.80 | 16 | 1.07 | −1.33 | 29 | −0.48 | 0.69 |
| 5 | −1.62 | −1.18 | 19 | −0.95 | 2.64 | 30 | 0.48 | 1.03 |
| 6 | 0.58 | −1.35 | 20 | −1.92 | 3.11 | 32 | −1.05 | 1.72 |
| 7 | 0.21 | −1.55 | 21 | −1.42 | 1.73 | 33 | −1.70 | 2.38 |
| 8 | 1.19 | −2.35 | 22 | −1.39 | 1.63 | 34 | 0.29 | 1.38 |
| 9 | 0.89 | −1.39 | 23 | −2.04 | 1.90 | 35 | 1.02 | 0.13 |
| 10 | 0.36 | −1.95 | 24 | −0.82 | 0.67 | 36 | 0.17 | 1.60 |
| 11 | 0.08 | −1.86 | 25 | 0.17 | 1.25 | 37 | 0.06 | 0.50 |
Table 6.
Difference of TGD bias from precise products and the network solution (in ns). dtgd0 means the TGD bias at B3I frequency, and dtgd1 is the residual TGD bias of TGD1. The average difference for all satellites was removed.
Table 6.
Difference of TGD bias from precise products and the network solution (in ns). dtgd0 means the TGD bias at B3I frequency, and dtgd1 is the residual TGD bias of TGD1. The average difference for all satellites was removed.
| PRN | dtgd0 | dtgd1 | PRN | dtgd0 | dtgd1 | PRN | dtgd0 | dtgd1 |
|---|---|---|---|---|---|---|---|---|
| 1 | 0.72 | −0.60 | 12 | −0.36 | −0.20 | 26 | −0.19 | 0.31 |
| 2 | 0.54 | −0.27 | 13 | −0.26 | −0.22 | 27 | −0.19 | 0.14 |
| 3 | 0.25 | −0.27 | 14 | −1.07 | 0.12 | 28 | 0.06 | 0.01 |
| 4 | −0.06 | −0.57 | 16 | 0.58 | 0.00 | 29 | −0.11 | 0.02 |
| 5 | −0.39 | −0.16 | 19 | −0.36 | 0.20 | 30 | −0.32 | 0.20 |
| 6 | 0.45 | −0.18 | 20 | −0.74 | 0.28 | 32 | −0.10 | 0.22 |
| 7 | 1.10 | −0.35 | 21 | −0.04 | 0.00 | 33 | −0.33 | 0.14 |
| 8 | 0.86 | −0.29 | 22 | −0.08 | 0.08 | 34 | 0.12 | −0.09 |
| 9 | 1.11 | −0.28 | 23 | −1.25 | 0.42 | 35 | −1.06 | 0.18 |
| 10 | 1.49 | −0.36 | 24 | −0.31 | 0.40 | 36 | −0.37 | 0.25 |
| 11 | 1.05 | 0.02 | 25 | −1.13 | 0.60 | 37 | 0.38 | 0.29 |
Table 7.
BDS signal-in-space range error (SISRE) performance for different schemes (in meters). S1: Normal satellite TGD correction. S2: Use of the satellite-dependent TGD bias calibrated from precise products. S3: Use of the TGD bias between BDS-2 and BDS-3 calibrated from precise products. S4: Use of the satellite-dependent TGD bias calibrated from network solution.
| Scheme | Frequency | BDS-2 | BDS-3 | BDS |
|---|---|---|---|---|
| S1 | B1I | 0.92 | 0.54 | 0.71 |
| B3I | 1.03 | 0.63 | 0.81 | |
| B1I/B3I | 1.45 | 1.36 | 1.40 | |
| S2 | B1I | 0.83 | 0.47 | 0.64 |
| B3I | 0.85 | 0.49 | 0.66 | |
| B1I/B3I | 0.83 | 0.48 | 0.64 | |
| S3 | B1I | 0.90 | 0.52 | 0.69 |
| B3I | 0.94 | 0.59 | 0.75 | |
| B1I/B3I | 0.91 | 0.75 | 0.82 | |
| S4 | B1I | 0.84 | 0.48 | 0.64 |
| B3I | 0.89 | 0.52 | 0.69 | |
| B1I/B3I | 0.86 | 0.50 | 0.66 |
Table 8.
RMS and improvement of the BDS SPP for different schemes. Imprj-i indicates the positioning improvement ().
Table 8.
RMS and improvement of the BDS SPP for different schemes. Imprj-i indicates the positioning improvement ().
| Frequency | S1 (m) | S2 (m) | S3 (m) | S4 (m) | Impr2–1 | Impr3–1 | Impr4–1 |
|---|---|---|---|---|---|---|---|
| B1I | 2.69 | 2.54 | 2.67 | 2.57 | 5.6% | 0.8% | 4.7% |
| B3I | 3.62 | 3.32 | 3.54 | 3.35 | 8.4% | 2.4% | 7.5% |
| B1I/B3I | 5.10 | 4.00 | 4.27 | 4.04 | 21.6% | 16.3% | 20.7% |
© 2020 by the authors. Licensee MDPI, Basel, Switzerland. This article is an open access article distributed under the terms and conditions of the Creative Commons Attribution (CC BY) license (http://creativecommons.org/licenses/by/4.0/).
Share and Cite
MDPI and ACS Style
Zhang, Y.; Wang, H.; Chen, J.; Wang, A.; Meng, L.; Wang, E. Calibration and Impact of BeiDou Satellite-Dependent Timing Group Delay Bias. Remote Sens. 2020, 12, 192. https://0-doi-org.brum.beds.ac.uk/10.3390/rs12010192
AMA Style
Zhang Y, Wang H, Chen J, Wang A, Meng L, Wang E. Calibration and Impact of BeiDou Satellite-Dependent Timing Group Delay Bias. Remote Sensing. 2020; 12(1):192. https://0-doi-org.brum.beds.ac.uk/10.3390/rs12010192
Chicago/Turabian StyleZhang, Yize, Hu Wang, Junping Chen, Ahao Wang, Lingdong Meng, and Ershen Wang. 2020. "Calibration and Impact of BeiDou Satellite-Dependent Timing Group Delay Bias" Remote Sensing 12, no. 1: 192. https://0-doi-org.brum.beds.ac.uk/10.3390/rs12010192
Note that from the first issue of 2016, this journal uses article numbers instead of page numbers. See further details here.